Ohio County, IN
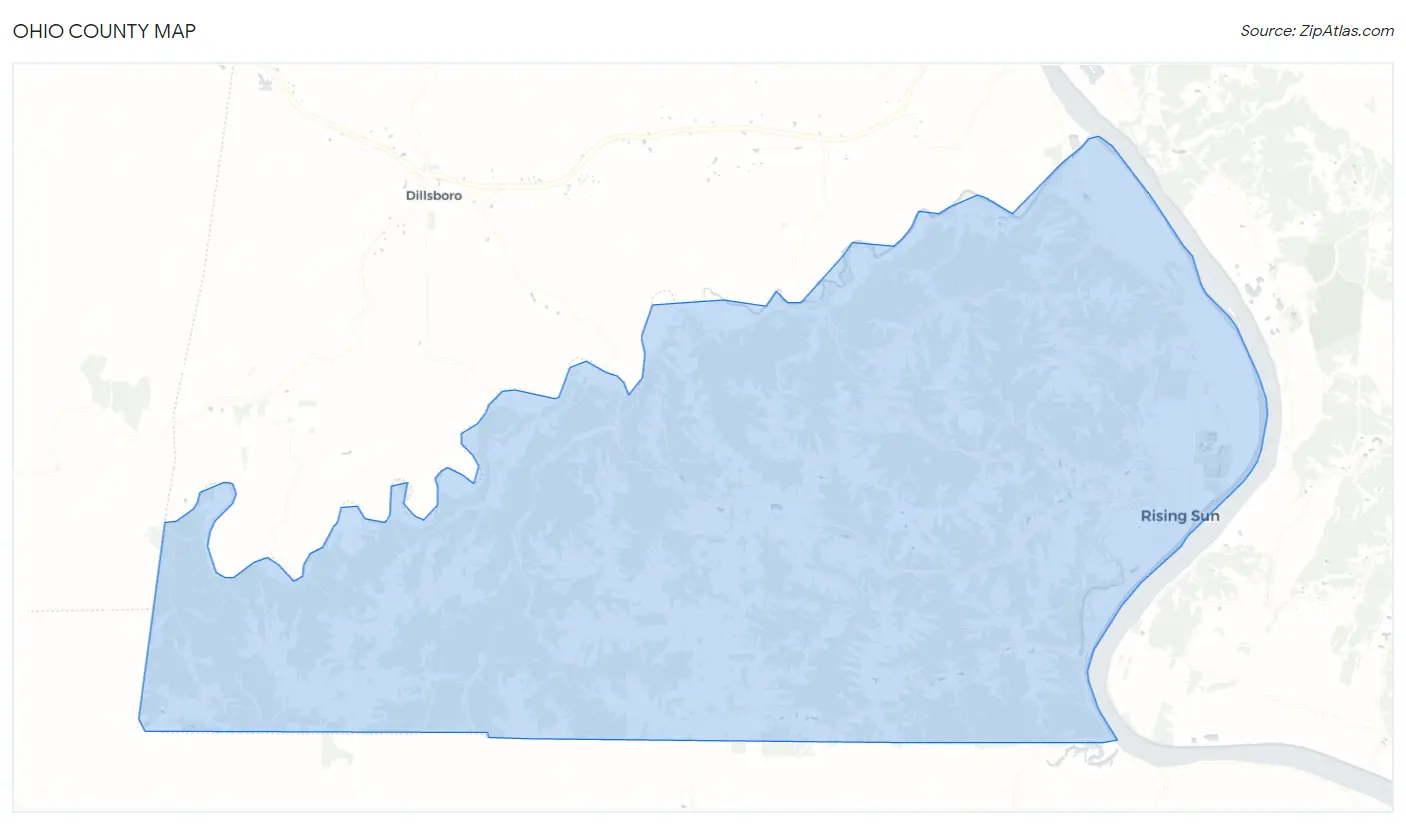
Ohio County Map
Ohio County Overview
5,974
TOTAL POPULATION
2,959
MALE POPULATION
3,015
FEMALE POPULATION
98.14
MALES / 100 FEMALES
101.89
FEMALES / 100 MALES
47.2
MEDIAN AGE
2.8
AVG FAMILY SIZE
2.3
AVG HOUSEHOLD SIZE
$35,310
PER CAPITA INCOME
$81,225
AVG FAMILY INCOME
$66,333
AVG HOUSEHOLD INCOME
40.3%
WAGE / INCOME GAP [ % ]
59.7¢/ $1
WAGE / INCOME GAP [ $ ]
0.42
INEQUALITY / GINI INDEX
2,881
LABOR FORCE [ PEOPLE ]
58.9%
PERCENT IN LABOR FORCE
1.8%
UNEMPLOYMENT RATE
Ohio County Area Codes
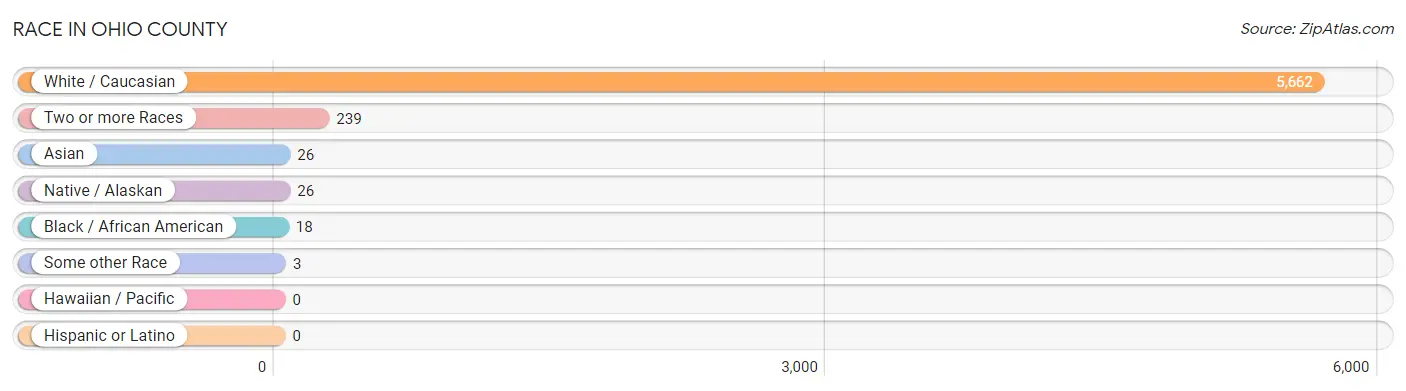
Race in Ohio County
The most populous races in Ohio County are White / Caucasian (5,662 | 94.8%), Two or more Races (239 | 4.0%), and Asian (26 | 0.4%).
| Race | # Population | % Population |
| Asian | 26 | 0.4% |
| Black / African American | 18 | 0.3% |
| Hawaiian / Pacific | 0 | 0.0% |
| Hispanic or Latino | 0 | 0.0% |
| Native / Alaskan | 26 | 0.4% |
| White / Caucasian | 5,662 | 94.8% |
| Two or more Races | 239 | 4.0% |
| Some other Race | 3 | 0.1% |
| Total | 5,974 | 100.0% |
Ancestry in Ohio County
The most populous ancestries reported in Ohio County are German (1,604 | 26.9%), English (979 | 16.4%), Irish (741 | 12.4%), American (398 | 6.7%), and Italian (226 | 3.8%), together accounting for 66.1% of all Ohio County residents.

| Ancestry | # Population | % Population |
| American | 398 | 6.7% |
| Apache | 2 | 0.0% |
| Austrian | 27 | 0.4% |
| Bhutanese | 65 | 1.1% |
| British | 6 | 0.1% |
| Canadian | 3 | 0.1% |
| Cherokee | 26 | 0.4% |
| Chippewa | 8 | 0.1% |
| Delaware | 1 | 0.0% |
| Dutch | 116 | 1.9% |
| English | 979 | 16.4% |
| European | 90 | 1.5% |
| French | 39 | 0.6% |
| German | 1,604 | 26.9% |
| Iranian | 17 | 0.3% |
| Irish | 741 | 12.4% |
| Italian | 226 | 3.8% |
| Northern European | 4 | 0.1% |
| Norwegian | 7 | 0.1% |
| Polish | 21 | 0.4% |
| Scandinavian | 28 | 0.5% |
| Scotch-Irish | 45 | 0.7% |
| Scottish | 81 | 1.4% |
| Sri Lankan | 16 | 0.3% |
| Swedish | 17 | 0.3% |
| Welsh | 1 | 0.0% | View All 26 Rows |
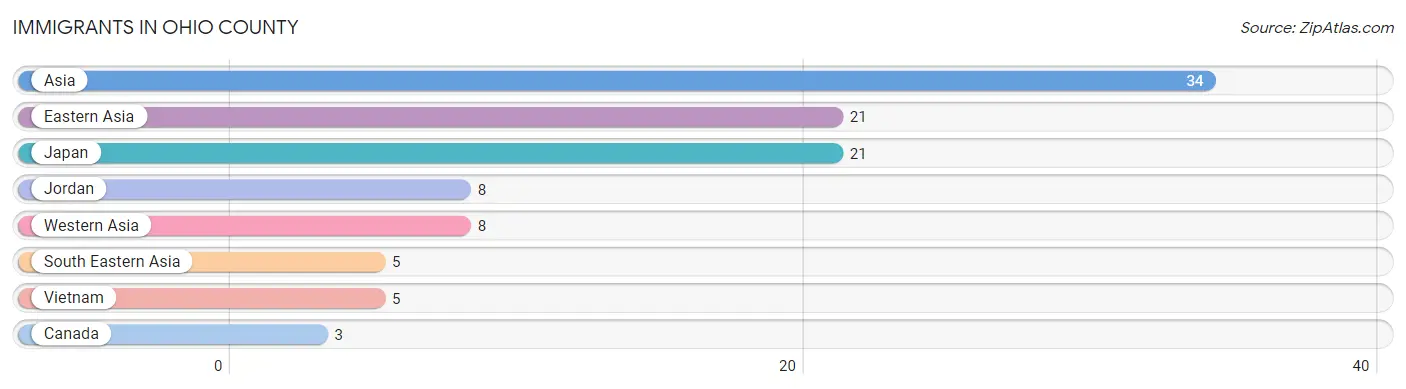
Immigrants in Ohio County
The most numerous immigrant groups reported in Ohio County came from Asia (34 | 0.6%), Eastern Asia (21 | 0.4%), Japan (21 | 0.4%), Jordan (8 | 0.1%), and Western Asia (8 | 0.1%), together accounting for 1.5% of all Ohio County residents.
| Immigration Origin | # Population | % Population |
| Asia | 34 | 0.6% |
| Canada | 3 | 0.1% |
| Eastern Asia | 21 | 0.4% |
| Japan | 21 | 0.4% |
| Jordan | 8 | 0.1% |
| South Eastern Asia | 5 | 0.1% |
| Vietnam | 5 | 0.1% |
| Western Asia | 8 | 0.1% | View All 8 Rows |
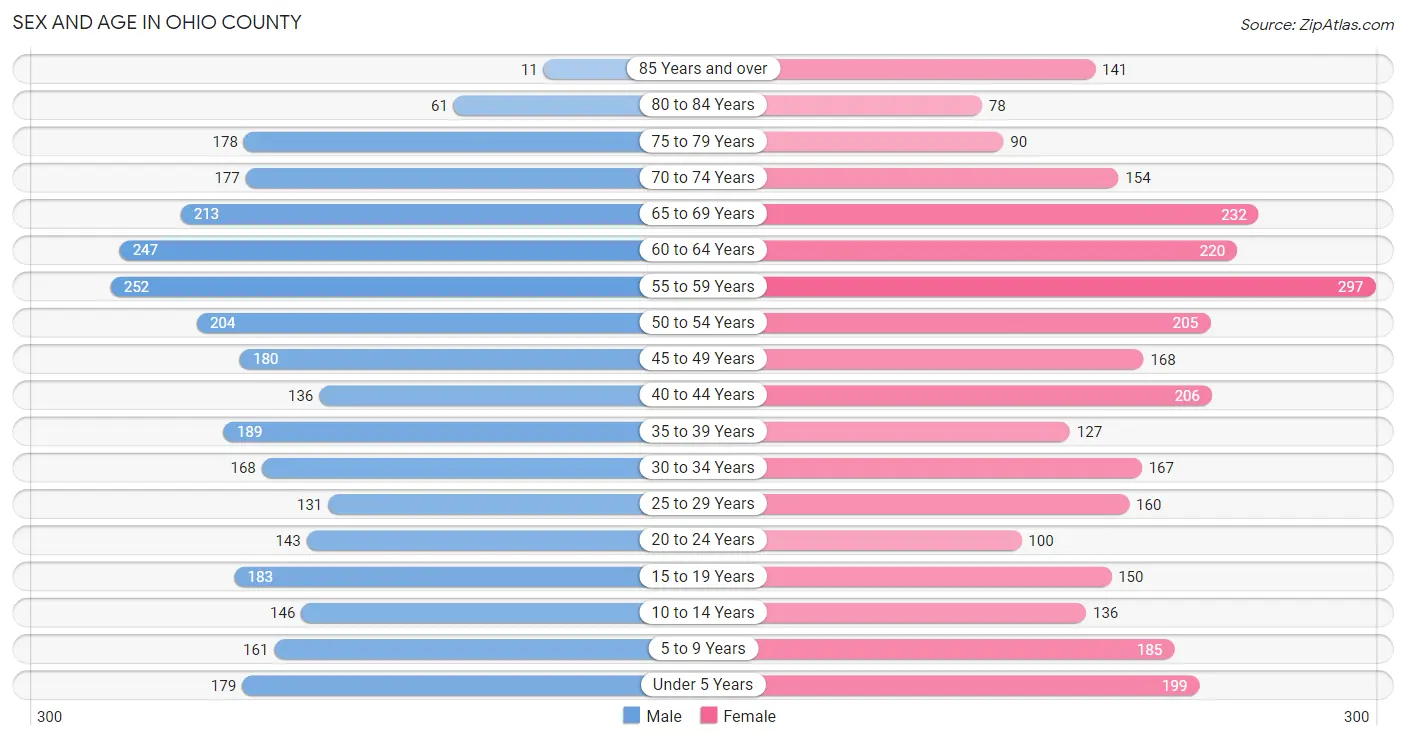
Sex and Age in Ohio County
Sex and Age in Ohio County
The most populous age groups in Ohio County are 55 to 59 Years (252 | 8.5%) for men and 55 to 59 Years (297 | 9.9%) for women.
| Age Bracket | Male | Female |
| Under 5 Years | 179 (6.0%) | 199 (6.6%) |
| 5 to 9 Years | 161 (5.4%) | 185 (6.1%) |
| 10 to 14 Years | 146 (4.9%) | 136 (4.5%) |
| 15 to 19 Years | 183 (6.2%) | 150 (5.0%) |
| 20 to 24 Years | 143 (4.8%) | 100 (3.3%) |
| 25 to 29 Years | 131 (4.4%) | 160 (5.3%) |
| 30 to 34 Years | 168 (5.7%) | 167 (5.5%) |
| 35 to 39 Years | 189 (6.4%) | 127 (4.2%) |
| 40 to 44 Years | 136 (4.6%) | 206 (6.8%) |
| 45 to 49 Years | 180 (6.1%) | 168 (5.6%) |
| 50 to 54 Years | 204 (6.9%) | 205 (6.8%) |
| 55 to 59 Years | 252 (8.5%) | 297 (9.9%) |
| 60 to 64 Years | 247 (8.4%) | 220 (7.3%) |
| 65 to 69 Years | 213 (7.2%) | 232 (7.7%) |
| 70 to 74 Years | 177 (6.0%) | 154 (5.1%) |
| 75 to 79 Years | 178 (6.0%) | 90 (3.0%) |
| 80 to 84 Years | 61 (2.1%) | 78 (2.6%) |
| 85 Years and over | 11 (0.4%) | 141 (4.7%) |
| Total | 2,959 (100.0%) | 3,015 (100.0%) |
Families and Households in Ohio County
Median Family Size in Ohio County
The median family size in Ohio County is 2.78 persons per family, with married-couple families (1,257 | 72.3%) accounting for the largest median family size of 2.86 persons per family. On the other hand, single female/mother families (335 | 19.3%) represent the smallest median family size with 2.58 persons per family.

| Family Type | # Families | Family Size |
| Married-Couple | 1,257 (72.3%) | 2.86 |
| Single Male/Father | 146 (8.4%) | 2.60 |
| Single Female/Mother | 335 (19.3%) | 2.58 |
| Total Families | 1,738 (100.0%) | 2.78 |
Median Household Size in Ohio County
The median household size in Ohio County is 2.32 persons per household, with single female/mother households (335 | 13.1%) accounting for the largest median household size of 2.95 persons per household. non-family households (814 | 31.9%) represent the smallest median household size with 1.13 persons per household.
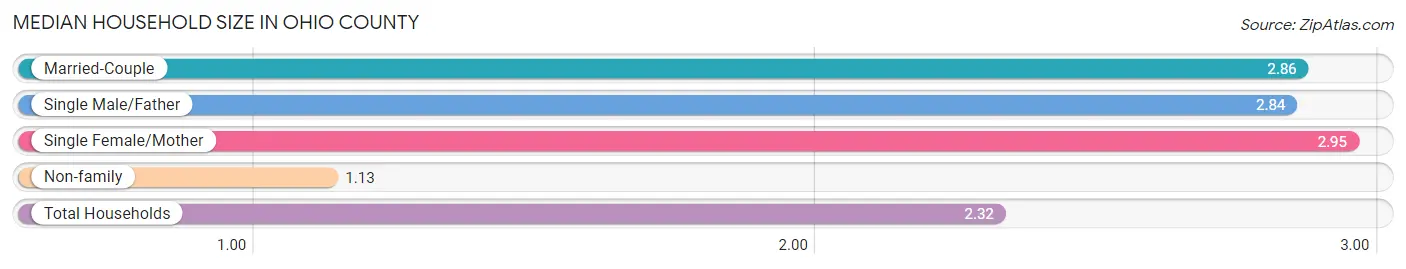
| Household Type | # Households | Household Size |
| Married-Couple | 1,257 (49.3%) | 2.86 |
| Single Male/Father | 146 (5.7%) | 2.84 |
| Single Female/Mother | 335 (13.1%) | 2.95 |
| Non-family | 814 (31.9%) | 1.13 |
| Total Households | 2,552 (100.0%) | 2.32 |
Household Size by Marriage Status in Ohio County
Out of a total of 2,552 households in Ohio County, 1,738 (68.1%) are family households, while 814 (31.9%) are nonfamily households. The most numerous type of family households are 2-person households, comprising 942, and the most common type of nonfamily households are 1-person households, comprising 719.

| Household Size | Family Households | Nonfamily Households |
| 1-Person Households | - | 719 (28.2%) |
| 2-Person Households | 942 (36.9%) | 92 (3.6%) |
| 3-Person Households | 284 (11.1%) | 3 (0.1%) |
| 4-Person Households | 336 (13.2%) | 0 (0.0%) |
| 5-Person Households | 124 (4.9%) | 0 (0.0%) |
| 6-Person Households | 33 (1.3%) | 0 (0.0%) |
| 7+ Person Households | 19 (0.7%) | 0 (0.0%) |
| Total | 1,738 (68.1%) | 814 (31.9%) |
Female Fertility in Ohio County
Fertility by Age in Ohio County
Average fertility rate in Ohio County is 53.0 births per 1,000 women. Women in the age bracket of 20 to 34 years have the highest fertility rate with 91.0 births per 1,000 women. Women in the age bracket of 20 to 34 years acount for 66.1% of all women with births.
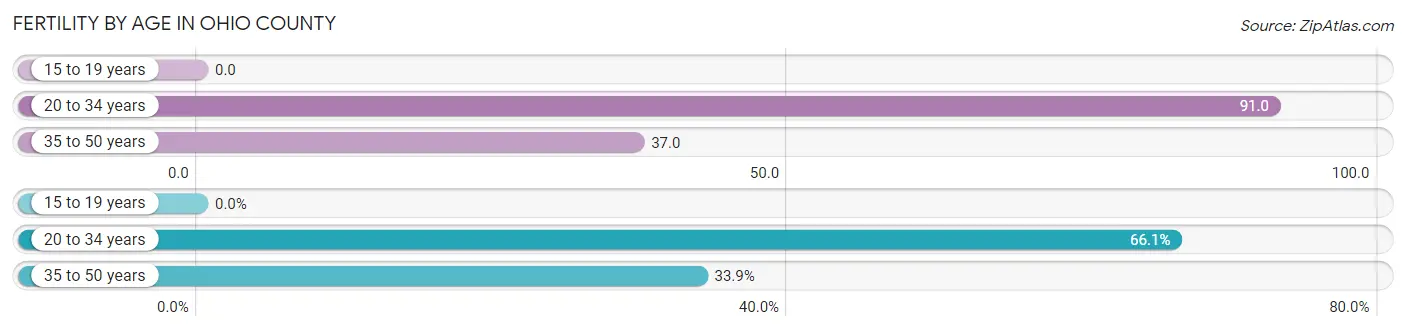
| Age Bracket | Women with Births | Births / 1,000 Women |
| 15 to 19 years | 0 (0.0%) | 0.0 |
| 20 to 34 years | 39 (66.1%) | 91.0 |
| 35 to 50 years | 20 (33.9%) | 37.0 |
| Total | 59 (100.0%) | 53.0 |
Fertility by Age by Marriage Status in Ohio County

| Age Bracket | Married | Unmarried |
| 15 to 19 years | 0 (0.0%) | 0 (0.0%) |
| 20 to 34 years | 39 (100.0%) | 0 (0.0%) |
| 35 to 50 years | 20 (100.0%) | 0 (0.0%) |
| Total | 59 (100.0%) | 0 (0.0%) |
Fertility by Education in Ohio County

| Educational Attainment | Women with Births | Births / 1,000 Women |
| Less than High School | 0 (0.0%) | 0.0 |
| High School Diploma | 19 (32.2%) | 72.0 |
| College or Associate's Degree | 29 (49.1%) | 56.0 |
| Bachelor's Degree | 11 (18.6%) | 61.0 |
| Graduate Degree | 0 (0.0%) | 0.0 |
| Total | 59 (100.0%) | 53.0 |
Fertility by Education by Marriage Status in Ohio County

| Educational Attainment | Married | Unmarried |
| Less than High School | 0 (0.0%) | 0 (0.0%) |
| High School Diploma | 19 (100.0%) | 0 (0.0%) |
| College or Associate's Degree | 29 (100.0%) | 0 (0.0%) |
| Bachelor's Degree | 11 (100.0%) | 0 (0.0%) |
| Graduate Degree | 0 (0.0%) | 0 (0.0%) |
| Total | 59 (100.0%) | 0 (0.0%) |
Income in Ohio County
Income Overview in Ohio County
Per Capita Income in Ohio County is $35,310, while median incomes of families and households are $81,225 and $66,333 respectively.
| Characteristic | Number | Measure |
| Per Capita Income | 5,974 | $35,310 |
| Median Family Income | 1,738 | $81,225 |
| Mean Family Income | 1,738 | $95,263 |
| Median Household Income | 2,552 | $66,333 |
| Mean Household Income | 2,552 | $81,019 |
| Income Deficit | 1,738 | $0 |
| Wage / Income Gap (%) | 5,974 | 40.26% |
| Wage / Income Gap ($) | 5,974 | 59.74¢ per $1 |
| Gini / Inequality Index | 5,974 | 0.42 |
Earnings by Sex in Ohio County
Average Earnings in Ohio County are $39,699, $50,702 for men and $30,288 for women, a difference of 40.3%.

| Sex | Number | Average Earnings |
| Male | 1,624 (52.2%) | $50,702 |
| Female | 1,484 (47.7%) | $30,288 |
| Total | 3,108 (100.0%) | $39,699 |
Earnings by Sex by Income Bracket in Ohio County
The most common earnings brackets in Ohio County are $100,000+ for men (235 | 14.5%) and $2,499 or less for women (128 | 8.6%).

| Income | Male | Female |
| $2,499 or less | 82 (5.1%) | 128 (8.6%) |
| $2,500 to $4,999 | 17 (1.1%) | 67 (4.5%) |
| $5,000 to $7,499 | 63 (3.9%) | 44 (3.0%) |
| $7,500 to $9,999 | 13 (0.8%) | 22 (1.5%) |
| $10,000 to $12,499 | 25 (1.5%) | 61 (4.1%) |
| $12,500 to $14,999 | 23 (1.4%) | 73 (4.9%) |
| $15,000 to $17,499 | 27 (1.7%) | 73 (4.9%) |
| $17,500 to $19,999 | 0 (0.0%) | 48 (3.2%) |
| $20,000 to $22,499 | 23 (1.4%) | 51 (3.4%) |
| $22,500 to $24,999 | 21 (1.3%) | 41 (2.8%) |
| $25,000 to $29,999 | 77 (4.7%) | 128 (8.6%) |
| $30,000 to $34,999 | 147 (9.0%) | 106 (7.1%) |
| $35,000 to $39,999 | 78 (4.8%) | 126 (8.5%) |
| $40,000 to $44,999 | 40 (2.5%) | 115 (7.7%) |
| $45,000 to $49,999 | 160 (9.9%) | 21 (1.4%) |
| $50,000 to $54,999 | 85 (5.2%) | 93 (6.3%) |
| $55,000 to $64,999 | 115 (7.1%) | 76 (5.1%) |
| $65,000 to $74,999 | 195 (12.0%) | 49 (3.3%) |
| $75,000 to $99,999 | 198 (12.2%) | 65 (4.4%) |
| $100,000+ | 235 (14.5%) | 97 (6.5%) |
| Total | 1,624 (100.0%) | 1,484 (100.0%) |
Earnings by Sex by Educational Attainment in Ohio County
Average earnings in Ohio County are $57,660 for men and $34,259 for women, a difference of 40.6%. Men with an educational attainment of bachelor's degree enjoy the highest average annual earnings of $74,450, while those with less than high school education earn the least with $37,917. Women with an educational attainment of graduate degree earn the most with the average annual earnings of $68,889, while those with college or associate's degree education have the smallest earnings of $28,889.
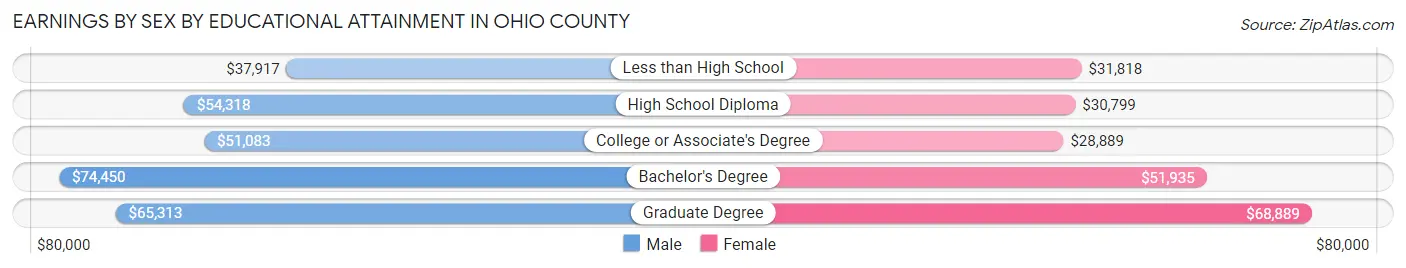
| Educational Attainment | Male Income | Female Income |
| Less than High School | $37,917 | $31,818 |
| High School Diploma | $54,318 | $30,799 |
| College or Associate's Degree | $51,083 | $28,889 |
| Bachelor's Degree | $74,450 | $51,935 |
| Graduate Degree | $65,313 | $68,889 |
| Total | $57,660 | $34,259 |
Family Income in Ohio County
Family Income Brackets in Ohio County
According to the Ohio County family income data, there are 408 families falling into the $100,000 to $149,999 income range, which is the most common income bracket and makes up 23.5% of all families. Conversely, the $10,000 to $14,999 income bracket is the least frequent group with only 10 families (0.6%) belonging to this category.

| Income Bracket | # Families | % Families |
| Less than $10,000 | 89 | 5.1% |
| $10,000 to $14,999 | 10 | 0.6% |
| $15,000 to $24,999 | 52 | 3.0% |
| $25,000 to $34,999 | 73 | 4.2% |
| $35,000 to $49,999 | 261 | 15.0% |
| $50,000 to $74,999 | 304 | 17.5% |
| $75,000 to $99,999 | 337 | 19.4% |
| $100,000 to $149,999 | 408 | 23.5% |
| $150,000 to $199,999 | 111 | 6.4% |
| $200,000+ | 94 | 5.4% |
Family Income by Famaliy Size in Ohio County
7+ person families (19 | 1.1%) account for the highest median family income in Ohio County with $125,125 per family, while 2-person families (1,005 | 57.8%) have the highest median income of $39,008 per family member.

| Income Bracket | # Families | Median Income |
| 2-Person Families | 1,005 (57.8%) | $78,015 |
| 3-Person Families | 286 (16.5%) | $71,719 |
| 4-Person Families | 273 (15.7%) | $119,702 |
| 5-Person Families | 146 (8.4%) | $91,250 |
| 6-Person Families | 9 (0.5%) | $0 |
| 7+ Person Families | 19 (1.1%) | $125,125 |
| Total | 1,738 (100.0%) | $81,225 |
Family Income by Number of Earners in Ohio County
The median family income in Ohio County is $81,225, with families comprising 3+ earners (202) having the highest median family income of $125,451, while families with no earners (310) have the lowest median family income of $49,500, accounting for 11.6% and 17.8% of families, respectively.
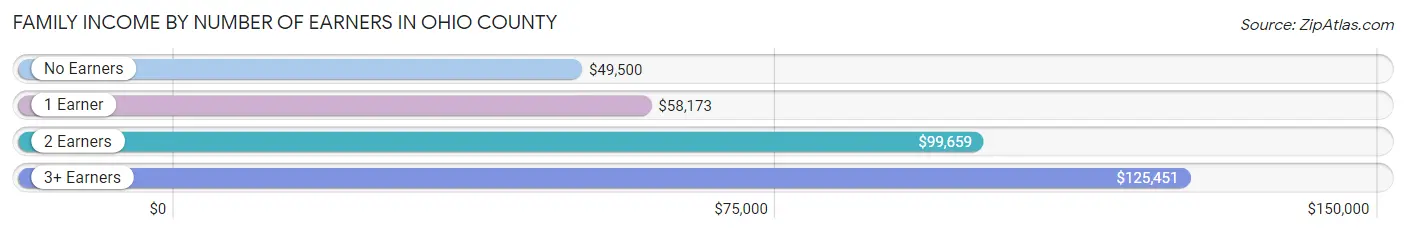
| Number of Earners | # Families | Median Income |
| No Earners | 310 (17.8%) | $49,500 |
| 1 Earner | 567 (32.6%) | $58,173 |
| 2 Earners | 659 (37.9%) | $99,659 |
| 3+ Earners | 202 (11.6%) | $125,451 |
| Total | 1,738 (100.0%) | $81,225 |
Household Income in Ohio County
Household Income Brackets in Ohio County
With 500 households falling in the category, the $100,000 to $149,999 income range is the most frequent in Ohio County, accounting for 19.6% of all households. In contrast, only 41 households (1.6%) fall into the $10,000 to $14,999 income bracket, making it the least populous group.
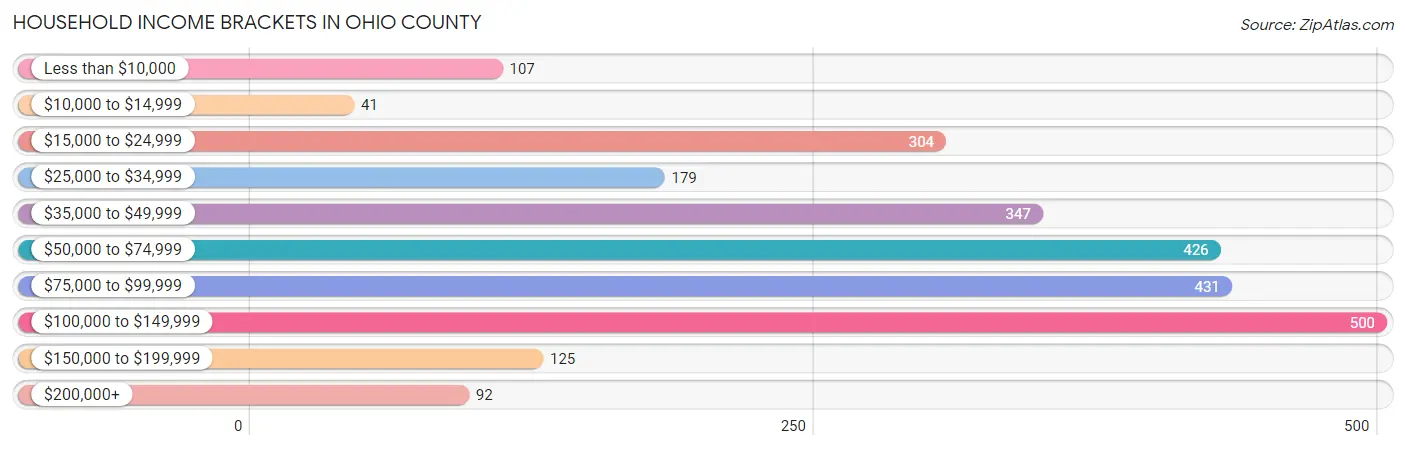
| Income Bracket | # Households | % Households |
| Less than $10,000 | 107 | 4.2% |
| $10,000 to $14,999 | 41 | 1.6% |
| $15,000 to $24,999 | 304 | 11.9% |
| $25,000 to $34,999 | 179 | 7.0% |
| $35,000 to $49,999 | 347 | 13.6% |
| $50,000 to $74,999 | 426 | 16.7% |
| $75,000 to $99,999 | 431 | 16.9% |
| $100,000 to $149,999 | 500 | 19.6% |
| $150,000 to $199,999 | 125 | 4.9% |
| $200,000+ | 92 | 3.6% |
Household Income by Householder Age in Ohio County
The median household income in Ohio County is $66,333, with the highest median household income of $86,042 found in the 45 to 64 years age bracket for the primary householder. A total of 1,029 households (40.3%) fall into this category. Meanwhile, the 65+ years age bracket for the primary householder has the lowest median household income of $45,000, with 800 households (31.4%) in this group.

| Income Bracket | # Households | Median Income |
| 15 to 24 Years | 31 (1.2%) | $61,094 |
| 25 to 44 Years | 692 (27.1%) | $76,579 |
| 45 to 64 Years | 1,029 (40.3%) | $86,042 |
| 65+ Years | 800 (31.4%) | $45,000 |
| Total | 2,552 (100.0%) | $66,333 |
Poverty in Ohio County
Income Below Poverty by Sex and Age in Ohio County
With 6.5% poverty level for males and 13.4% for females among the residents of Ohio County, 12 to 14 year old males and 5 year old females are the most vulnerable to poverty, with 36 males (40.9%) and 27 females (90.0%) in their respective age groups living below the poverty level.
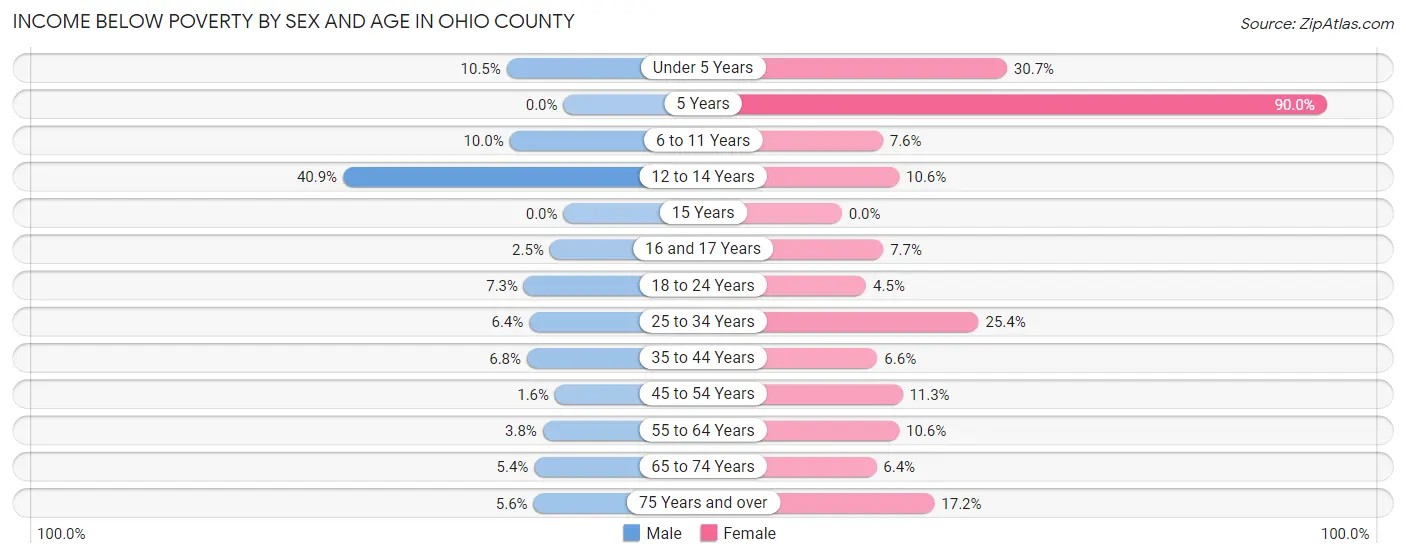
| Age Bracket | Male | Female |
| Under 5 Years | 18 (10.5%) | 61 (30.6%) |
| 5 Years | 0 (0.0%) | 27 (90.0%) |
| 6 to 11 Years | 21 (10.0%) | 15 (7.6%) |
| 12 to 14 Years | 36 (40.9%) | 10 (10.6%) |
| 15 Years | 0 (0.0%) | 0 (0.0%) |
| 16 and 17 Years | 2 (2.5%) | 4 (7.7%) |
| 18 to 24 Years | 14 (7.3%) | 8 (4.5%) |
| 25 to 34 Years | 19 (6.4%) | 83 (25.4%) |
| 35 to 44 Years | 22 (6.8%) | 22 (6.6%) |
| 45 to 54 Years | 6 (1.6%) | 42 (11.3%) |
| 55 to 64 Years | 19 (3.8%) | 55 (10.6%) |
| 65 to 74 Years | 21 (5.4%) | 24 (6.4%) |
| 75 Years and over | 13 (5.6%) | 50 (17.2%) |
| Total | 191 (6.5%) | 401 (13.4%) |
Income Above Poverty by Sex and Age in Ohio County
According to the poverty statistics in Ohio County, males aged 5 years and females aged 15 years are the age groups that are most secure financially, with 100.0% of males and 100.0% of females in these age groups living above the poverty line.
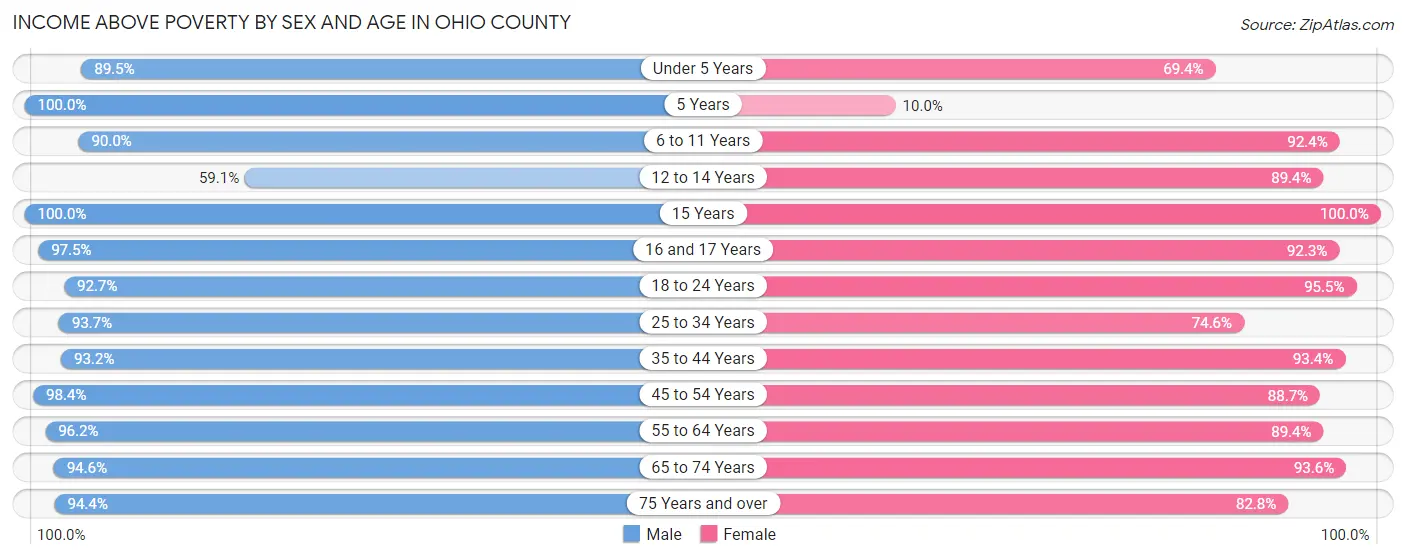
| Age Bracket | Male | Female |
| Under 5 Years | 153 (89.5%) | 138 (69.4%) |
| 5 Years | 9 (100.0%) | 3 (10.0%) |
| 6 to 11 Years | 189 (90.0%) | 182 (92.4%) |
| 12 to 14 Years | 52 (59.1%) | 84 (89.4%) |
| 15 Years | 56 (100.0%) | 21 (100.0%) |
| 16 and 17 Years | 77 (97.5%) | 48 (92.3%) |
| 18 to 24 Years | 177 (92.7%) | 169 (95.5%) |
| 25 to 34 Years | 280 (93.6%) | 244 (74.6%) |
| 35 to 44 Years | 303 (93.2%) | 311 (93.4%) |
| 45 to 54 Years | 373 (98.4%) | 331 (88.7%) |
| 55 to 64 Years | 477 (96.2%) | 462 (89.4%) |
| 65 to 74 Years | 367 (94.6%) | 350 (93.6%) |
| 75 Years and over | 221 (94.4%) | 241 (82.8%) |
| Total | 2,734 (93.5%) | 2,584 (86.6%) |
Income Below Poverty Among Married-Couple Families in Ohio County
The poverty statistics for married-couple families in Ohio County show that 1.7% or 21 of the total 1,257 families live below the poverty line. Families with no children have the highest poverty rate of 2.5%, comprising of 21 families. On the other hand, families with 1 or 2 children have the lowest poverty rate of 0.0%, which includes 0 families.

| Children | Above Poverty | Below Poverty |
| No Children | 822 (97.5%) | 21 (2.5%) |
| 1 or 2 Children | 328 (100.0%) | 0 (0.0%) |
| 3 or 4 Children | 67 (100.0%) | 0 (0.0%) |
| 5 or more Children | 19 (100.0%) | 0 (0.0%) |
| Total | 1,236 (98.3%) | 21 (1.7%) |
Income Below Poverty Among Single-Parent Households in Ohio County
According to the poverty data in Ohio County, 23.3% or 34 single-father households and 29.2% or 98 single-mother households are living below the poverty line. Among single-father households, those with 3 or 4 children have the highest poverty rate, with 15 households (75.0%) experiencing poverty. Likewise, among single-mother households, those with 3 or 4 children have the highest poverty rate, with 11 households (100.0%) falling below the poverty line.
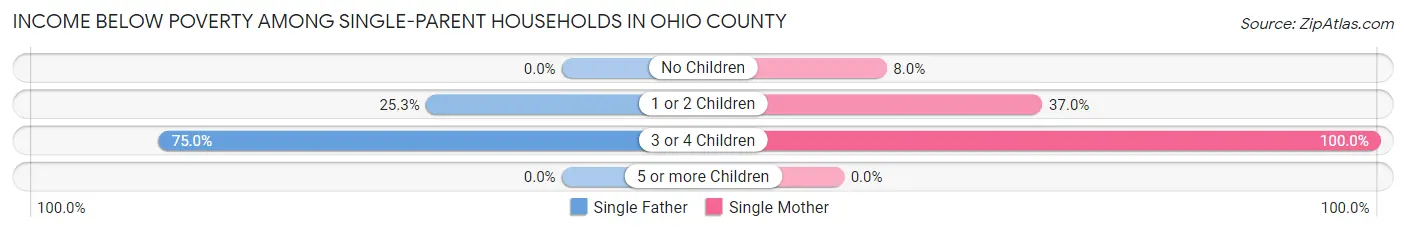
| Children | Single Father | Single Mother |
| No Children | 0 (0.0%) | 9 (8.0%) |
| 1 or 2 Children | 19 (25.3%) | 78 (37.0%) |
| 3 or 4 Children | 15 (75.0%) | 11 (100.0%) |
| 5 or more Children | 0 (0.0%) | 0 (0.0%) |
| Total | 34 (23.3%) | 98 (29.2%) |
Income Below Poverty Among Married-Couple vs Single-Parent Households in Ohio County
The poverty data for Ohio County shows that 21 of the married-couple family households (1.7%) and 132 of the single-parent households (27.4%) are living below the poverty level. Within the married-couple family households, those with no children have the highest poverty rate, with 21 households (2.5%) falling below the poverty line. Among the single-parent households, those with 3 or 4 children have the highest poverty rate, with 26 household (83.9%) living below poverty.

| Children | Married-Couple Families | Single-Parent Households |
| No Children | 21 (2.5%) | 9 (5.5%) |
| 1 or 2 Children | 0 (0.0%) | 97 (33.9%) |
| 3 or 4 Children | 0 (0.0%) | 26 (83.9%) |
| 5 or more Children | 0 (0.0%) | 0 (0.0%) |
| Total | 21 (1.7%) | 132 (27.4%) |
Employment Characteristics in Ohio County
Employment by Class of Employer in Ohio County
Among the 2,741 employed individuals in Ohio County, private company employees (1,777 | 64.8%), not-for-profit organizations (327 | 11.9%), and local government employees (285 | 10.4%) make up the most common classes of employment.

| Employer Class | # Employees | % Employees |
| Private Company Employees | 1,777 | 64.8% |
| Self-Employed (Incorporated) | 115 | 4.2% |
| Self-Employed (Not Incorporated) | 116 | 4.2% |
| Not-for-profit Organizations | 327 | 11.9% |
| Local Government Employees | 285 | 10.4% |
| State Government Employees | 70 | 2.5% |
| Federal Government Employees | 51 | 1.9% |
| Unpaid Family Workers | 0 | 0.0% |
| Total | 2,741 | 100.0% |
Employment Status by Age in Ohio County
According to the labor force statistics for Ohio County, out of the total population over 16 years of age (4,891), 58.9% or 2,881 individuals are in the labor force, with 1.8% or 52 of them unemployed. The age group with the highest labor force participation rate is 35 to 44 years, with 90.4% or 595 individuals in the labor force. Within the labor force, the 60 to 64 years age range has the highest percentage of unemployed individuals, with 4.9% or 14 of them being unemployed.

| Age Bracket | In Labor Force | Unemployed |
| 16 to 19 Years | 105 (41.0%) | 0 (0.0%) |
| 20 to 24 Years | 215 (88.5%) | 0 (0.0%) |
| 25 to 29 Years | 244 (83.8%) | 0 (0.0%) |
| 30 to 34 Years | 221 (66.0%) | 0 (0.0%) |
| 35 to 44 Years | 595 (90.4%) | 0 (0.0%) |
| 45 to 54 Years | 588 (77.7%) | 21 (3.6%) |
| 55 to 59 Years | 469 (85.4%) | 12 (2.6%) |
| 60 to 64 Years | 287 (61.5%) | 14 (4.9%) |
| 65 to 74 Years | 128 (16.5%) | 5 (3.9%) |
| 75 Years and over | 28 (5.0%) | 0 (0.0%) |
| Total | 2,881 (58.9%) | 52 (1.8%) |
Employment Status by Educational Attainment in Ohio County
According to labor force statistics for Ohio County, 78.6% of individuals (2,403) out of the total population between 25 and 64 years of age (3,057) are in the labor force, with 2.0% or 48 of them being unemployed. The group with the highest labor force participation rate are those with the educational attainment of bachelor's degree or higher, with 90.5% or 494 individuals in the labor force. Within the labor force, individuals with less than high school education have the highest percentage of unemployment, with 14.3% or 21 of them being unemployed.

| Educational Attainment | In Labor Force | Unemployed |
| Less than High School | 147 (72.8%) | 29 (14.3%) |
| High School Diploma | 1,023 (79.6%) | 18 (1.4%) |
| College / Associate Degree | 740 (72.3%) | 16 (1.6%) |
| Bachelor's Degree or higher | 494 (90.5%) | 0 (0.0%) |
| Total | 2,403 (78.6%) | 61 (2.0%) |
Employment Occupations by Sex in Ohio County
Management, Business, Science and Arts Occupations
The most common Management, Business, Science and Arts occupations in Ohio County are Management (327 | 11.6%), Community & Social Service (182 | 6.4%), Health Diagnosing & Treating (164 | 5.8%), Business & Financial (142 | 5.0%), and Education Instruction & Library (137 | 4.8%).

Management, Business, Science and Arts Occupations by Sex
Within the Management, Business, Science and Arts occupations in Ohio County, the most male-oriented occupations are Computers & Mathematics (100.0%), Life, Physical & Social Science (100.0%), and Arts, Media & Entertainment (100.0%), while the most female-oriented occupations are Education, Arts & Media (100.0%), Health Diagnosing & Treating (97.0%), and Health Technologists (95.1%).

| Occupation | Male | Female |
| Management | 246 (75.2%) | 81 (24.8%) |
| Business & Financial | 39 (27.5%) | 103 (72.5%) |
| Computers, Engineering & Science | 87 (94.6%) | 5 (5.4%) |
| Computers & Mathematics | 47 (100.0%) | 0 (0.0%) |
| Architecture & Engineering | 22 (81.5%) | 5 (18.5%) |
| Life, Physical & Social Science | 18 (100.0%) | 0 (0.0%) |
| Community & Social Service | 28 (15.4%) | 154 (84.6%) |
| Education, Arts & Media | 0 (0.0%) | 40 (100.0%) |
| Legal Services & Support | 0 (0.0%) | 0 (0.0%) |
| Education Instruction & Library | 23 (16.8%) | 114 (83.2%) |
| Arts, Media & Entertainment | 5 (100.0%) | 0 (0.0%) |
| Health Diagnosing & Treating | 5 (3.0%) | 159 (97.0%) |
| Health Technologists | 5 (4.9%) | 97 (95.1%) |
| Total (Category) | 405 (44.7%) | 502 (55.3%) |
| Total (Overall) | 1,513 (53.5%) | 1,315 (46.5%) |
Services Occupations
The most common Services occupations in Ohio County are Cleaning & Maintenance (131 | 4.6%), Healthcare Support (124 | 4.4%), Food Preparation & Serving (100 | 3.5%), Security & Protection (89 | 3.2%), and Law Enforcement (69 | 2.4%).

Services Occupations by Sex
Within the Services occupations in Ohio County, the most male-oriented occupations are Law Enforcement (79.7%), Security & Protection (70.8%), and Cleaning & Maintenance (54.2%), while the most female-oriented occupations are Healthcare Support (100.0%), Food Preparation & Serving (71.0%), and Firefighting & Prevention (60.0%).
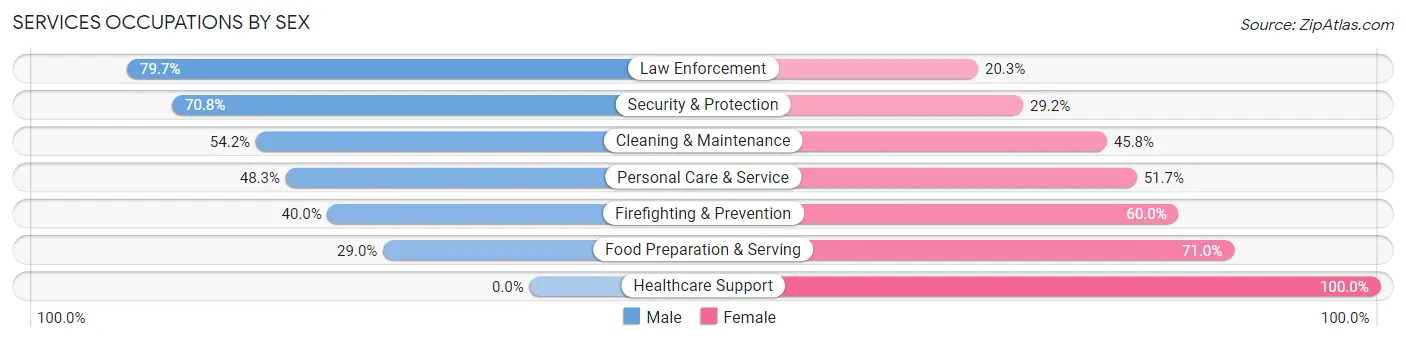
| Occupation | Male | Female |
| Healthcare Support | 0 (0.0%) | 124 (100.0%) |
| Security & Protection | 63 (70.8%) | 26 (29.2%) |
| Firefighting & Prevention | 8 (40.0%) | 12 (60.0%) |
| Law Enforcement | 55 (79.7%) | 14 (20.3%) |
| Food Preparation & Serving | 29 (29.0%) | 71 (71.0%) |
| Cleaning & Maintenance | 71 (54.2%) | 60 (45.8%) |
| Personal Care & Service | 28 (48.3%) | 30 (51.7%) |
| Total (Category) | 191 (38.1%) | 311 (62.0%) |
| Total (Overall) | 1,513 (53.5%) | 1,315 (46.5%) |
Sales and Office Occupations
The most common Sales and Office occupations in Ohio County are Office & Administration (321 | 11.4%), and Sales & Related (141 | 5.0%).
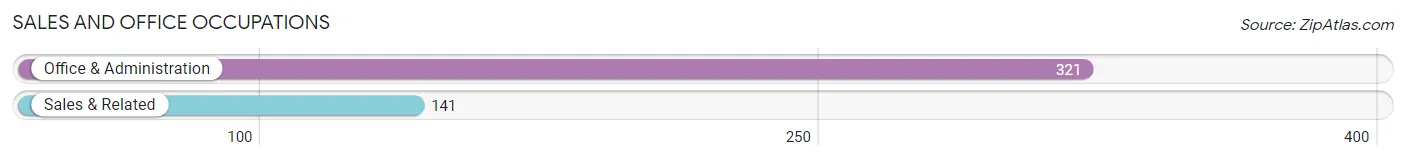
Sales and Office Occupations by Sex

| Occupation | Male | Female |
| Sales & Related | 70 (49.6%) | 71 (50.3%) |
| Office & Administration | 64 (19.9%) | 257 (80.1%) |
| Total (Category) | 134 (29.0%) | 328 (71.0%) |
| Total (Overall) | 1,513 (53.5%) | 1,315 (46.5%) |
Natural Resources, Construction and Maintenance Occupations
The most common Natural Resources, Construction and Maintenance occupations in Ohio County are Construction & Extraction (237 | 8.4%), Installation, Maintenance & Repair (107 | 3.8%), and Farming, Fishing & Forestry (11 | 0.4%).

Natural Resources, Construction and Maintenance Occupations by Sex

| Occupation | Male | Female |
| Farming, Fishing & Forestry | 11 (100.0%) | 0 (0.0%) |
| Construction & Extraction | 237 (100.0%) | 0 (0.0%) |
| Installation, Maintenance & Repair | 103 (96.3%) | 4 (3.7%) |
| Total (Category) | 351 (98.9%) | 4 (1.1%) |
| Total (Overall) | 1,513 (53.5%) | 1,315 (46.5%) |
Production, Transportation and Moving Occupations
The most common Production, Transportation and Moving occupations in Ohio County are Production (367 | 13.0%), Material Moving (149 | 5.3%), and Transportation (86 | 3.0%).

Production, Transportation and Moving Occupations by Sex
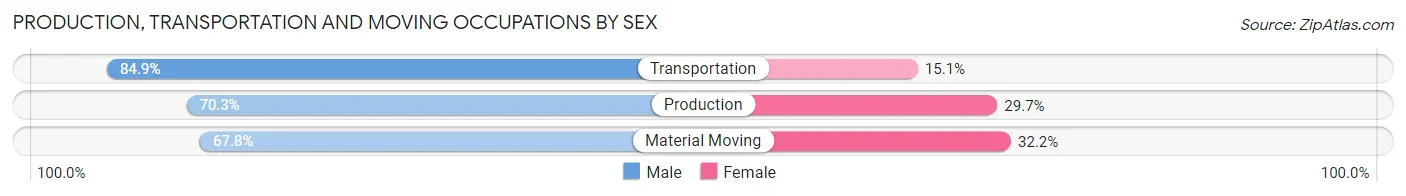
| Occupation | Male | Female |
| Production | 258 (70.3%) | 109 (29.7%) |
| Transportation | 73 (84.9%) | 13 (15.1%) |
| Material Moving | 101 (67.8%) | 48 (32.2%) |
| Total (Category) | 432 (71.8%) | 170 (28.2%) |
| Total (Overall) | 1,513 (53.5%) | 1,315 (46.5%) |
Employment Industries by Sex in Ohio County
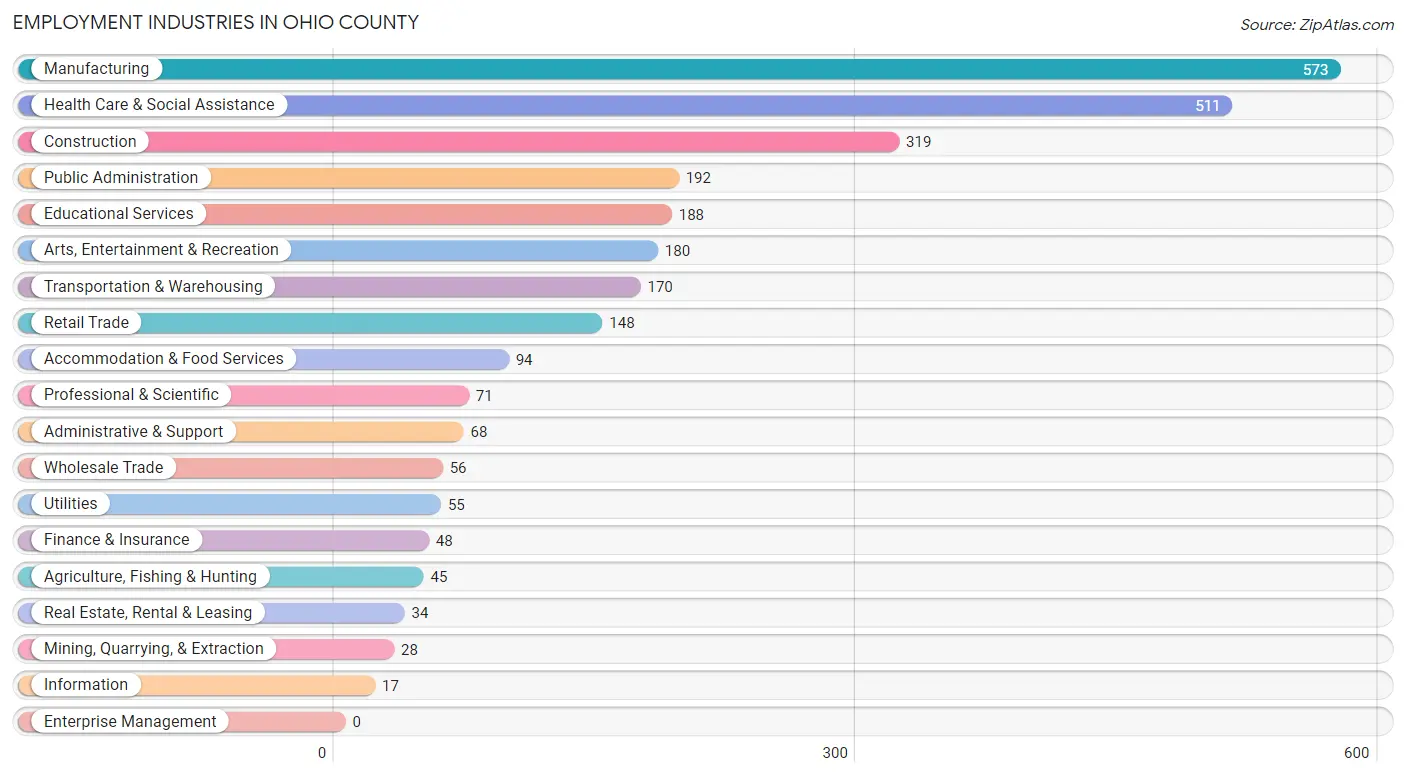
Employment Industries in Ohio County
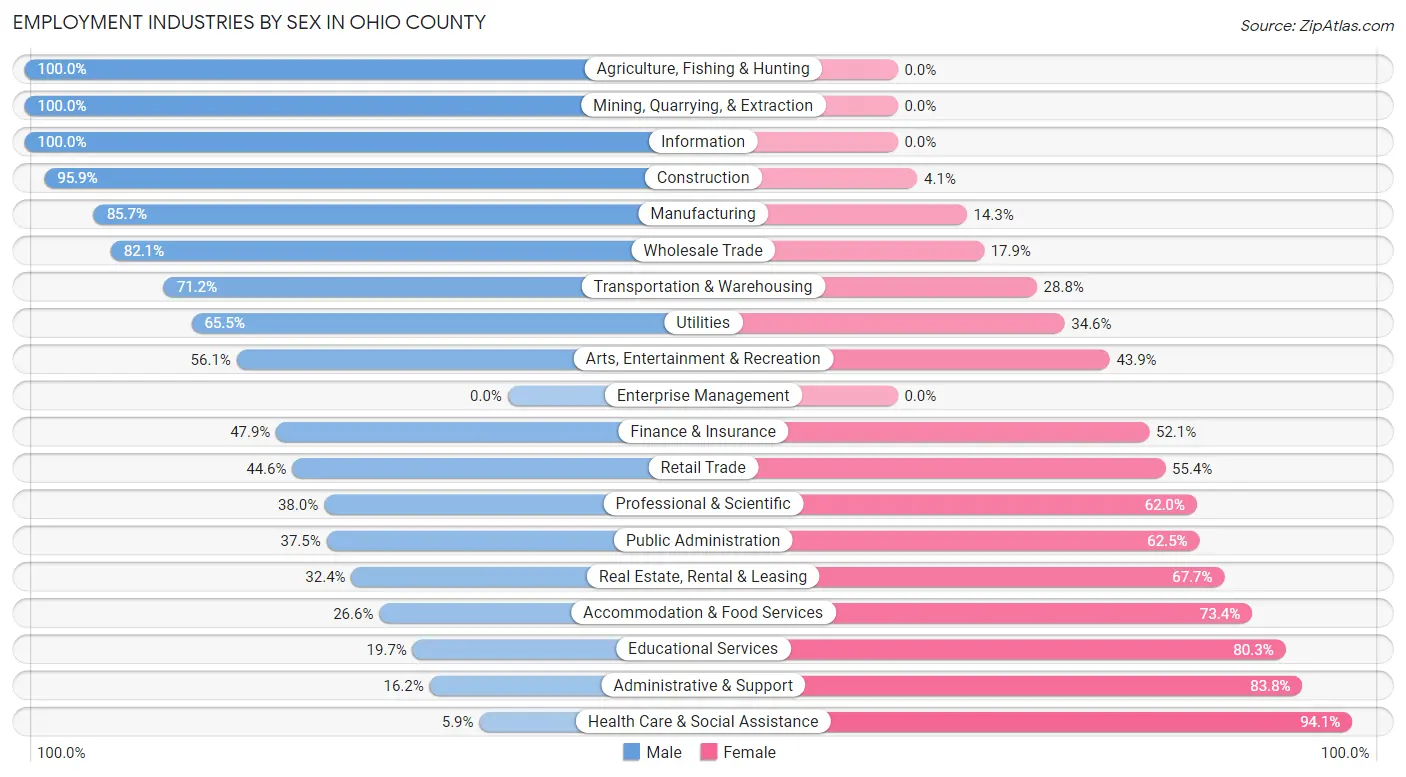
The major employment industries in Ohio County include Manufacturing (573 | 20.3%), Health Care & Social Assistance (511 | 18.1%), Construction (319 | 11.3%), Public Administration (192 | 6.8%), and Educational Services (188 | 6.7%).
Employment Industries by Sex in Ohio County
The Ohio County industries that see more men than women are Agriculture, Fishing & Hunting (100.0%), Mining, Quarrying, & Extraction (100.0%), and Information (100.0%), whereas the industries that tend to have a higher number of women are Health Care & Social Assistance (94.1%), Administrative & Support (83.8%), and Educational Services (80.3%).
| Industry | Male | Female |
| Agriculture, Fishing & Hunting | 45 (100.0%) | 0 (0.0%) |
| Mining, Quarrying, & Extraction | 28 (100.0%) | 0 (0.0%) |
| Construction | 306 (95.9%) | 13 (4.1%) |
| Manufacturing | 491 (85.7%) | 82 (14.3%) |
| Wholesale Trade | 46 (82.1%) | 10 (17.9%) |
| Retail Trade | 66 (44.6%) | 82 (55.4%) |
| Transportation & Warehousing | 121 (71.2%) | 49 (28.8%) |
| Utilities | 36 (65.4%) | 19 (34.5%) |
| Information | 17 (100.0%) | 0 (0.0%) |
| Finance & Insurance | 23 (47.9%) | 25 (52.1%) |
| Real Estate, Rental & Leasing | 11 (32.4%) | 23 (67.6%) |
| Professional & Scientific | 27 (38.0%) | 44 (62.0%) |
| Enterprise Management | 0 (0.0%) | 0 (0.0%) |
| Administrative & Support | 11 (16.2%) | 57 (83.8%) |
| Educational Services | 37 (19.7%) | 151 (80.3%) |
| Health Care & Social Assistance | 30 (5.9%) | 481 (94.1%) |
| Arts, Entertainment & Recreation | 101 (56.1%) | 79 (43.9%) |
| Accommodation & Food Services | 25 (26.6%) | 69 (73.4%) |
| Public Administration | 72 (37.5%) | 120 (62.5%) |
| Total | 1,513 (53.5%) | 1,315 (46.5%) |
Education in Ohio County
School Enrollment in Ohio County
The most common levels of schooling among the 1,168 students in Ohio County are elementary school (309 | 26.5%), high school (291 | 24.9%), and college / undergraduate (263 | 22.5%).

| School Level | # Students | % Students |
| Nursery / Preschool | 10 | 0.9% |
| Kindergarten | 66 | 5.7% |
| Elementary School | 309 | 26.5% |
| Middle School | 217 | 18.6% |
| High School | 291 | 24.9% |
| College / Undergraduate | 263 | 22.5% |
| Graduate / Professional | 12 | 1.0% |
| Total | 1,168 | 100.0% |
School Enrollment by Age by Funding Source in Ohio County
Out of a total of 1,168 students who are enrolled in schools in Ohio County, 46 (3.9%) attend a private institution, while the remaining 1,122 (96.1%) are enrolled in public schools. The age group of 18 to 19 year olds has the highest likelihood of being enrolled in private schools, with 28 (23.1% in the age bracket) enrolled. Conversely, the age group of 5 to 9 year old has the lowest likelihood of being enrolled in a private school, with 346 (100.0% in the age bracket) attending a public institution.

| Age Bracket | Public School | Private School |
| 3 to 4 Year Olds | 0 (0.0%) | 0 (0.0%) |
| 5 to 9 Year Old | 346 (100.0%) | 0 (0.0%) |
| 10 to 14 Year Olds | 263 (97.8%) | 6 (2.2%) |
| 15 to 17 Year Olds | 198 (100.0%) | 0 (0.0%) |
| 18 to 19 Year Olds | 93 (76.9%) | 28 (23.1%) |
| 20 to 24 Year Olds | 39 (78.0%) | 11 (22.0%) |
| 25 to 34 Year Olds | 134 (100.0%) | 0 (0.0%) |
| 35 Years and over | 50 (100.0%) | 0 (0.0%) |
| Total | 1,122 (96.1%) | 46 (3.9%) |
Educational Attainment by Field of Study in Ohio County
Science & technology (170 | 22.7%), business (143 | 19.1%), education (142 | 19.0%), arts & humanities (62 | 8.3%), and literature & languages (58 | 7.7%) are the most common fields of study among 749 individuals in Ohio County who have obtained a bachelor's degree or higher.

| Field of Study | # Graduates | % Graduates |
| Computers & Mathematics | 11 | 1.5% |
| Bio, Nature & Agricultural | 41 | 5.5% |
| Physical & Health Sciences | 12 | 1.6% |
| Psychology | 13 | 1.7% |
| Social Sciences | 6 | 0.8% |
| Engineering | 43 | 5.7% |
| Multidisciplinary Studies | 2 | 0.3% |
| Science & Technology | 170 | 22.7% |
| Business | 143 | 19.1% |
| Education | 142 | 19.0% |
| Literature & Languages | 58 | 7.7% |
| Liberal Arts & History | 7 | 0.9% |
| Visual & Performing Arts | 9 | 1.2% |
| Communications | 30 | 4.0% |
| Arts & Humanities | 62 | 8.3% |
| Total | 749 | 100.0% |
Transportation & Commute in Ohio County
Vehicle Availability by Sex in Ohio County
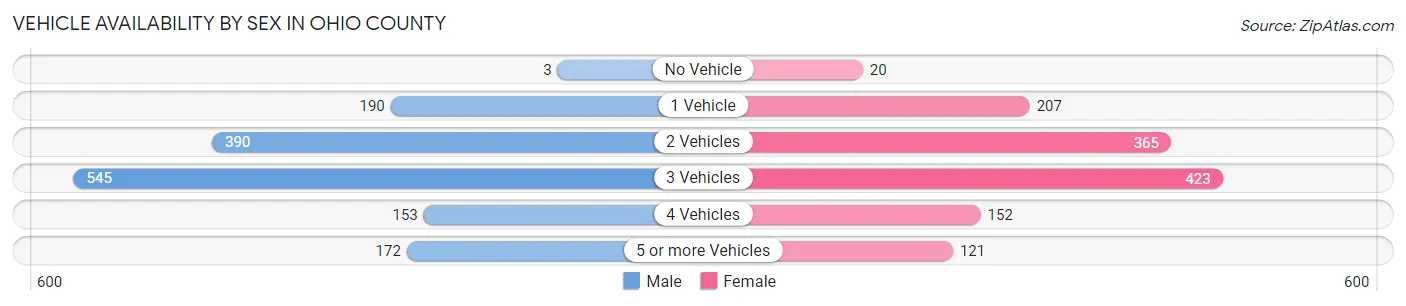
The most prevalent vehicle ownership categories in Ohio County are males with 3 vehicles (545, accounting for 37.5%) and females with 3 vehicles (423, making up 42.3%).
| Vehicles Available | Male | Female |
| No Vehicle | 3 (0.2%) | 20 (1.5%) |
| 1 Vehicle | 190 (13.1%) | 207 (16.1%) |
| 2 Vehicles | 390 (26.8%) | 365 (28.3%) |
| 3 Vehicles | 545 (37.5%) | 423 (32.8%) |
| 4 Vehicles | 153 (10.5%) | 152 (11.8%) |
| 5 or more Vehicles | 172 (11.8%) | 121 (9.4%) |
| Total | 1,453 (100.0%) | 1,288 (100.0%) |
Commute Time in Ohio County
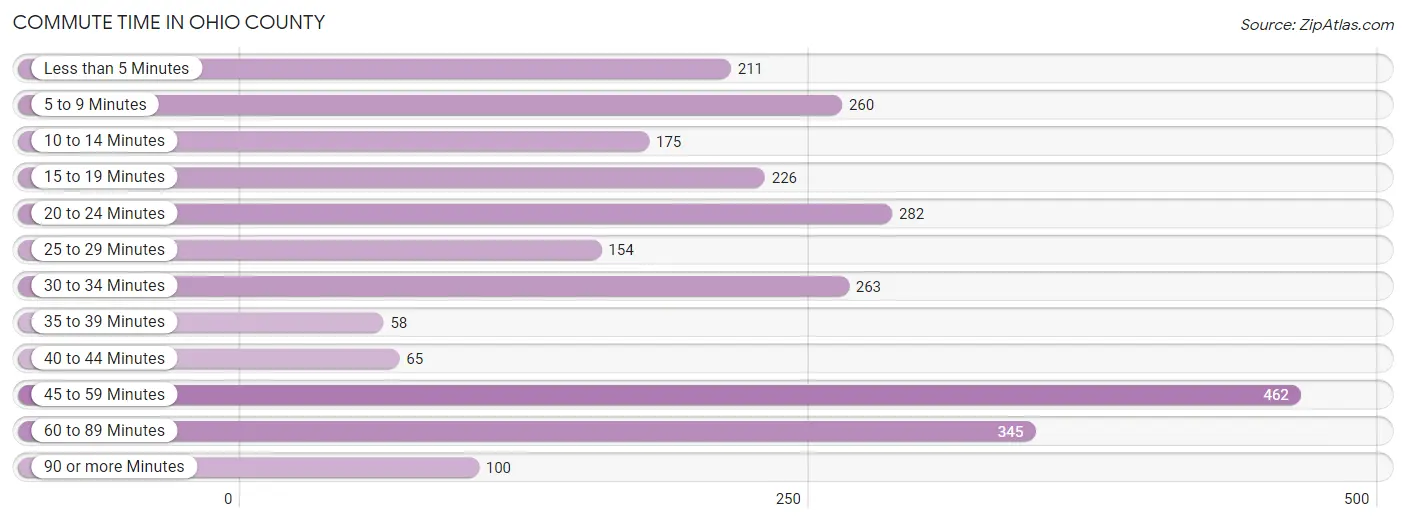
The most frequently occuring commute durations in Ohio County are 45 to 59 minutes (462 commuters, 17.8%), 60 to 89 minutes (345 commuters, 13.3%), and 20 to 24 minutes (282 commuters, 10.8%).
| Commute Time | # Commuters | % Commuters |
| Less than 5 Minutes | 211 | 8.1% |
| 5 to 9 Minutes | 260 | 10.0% |
| 10 to 14 Minutes | 175 | 6.7% |
| 15 to 19 Minutes | 226 | 8.7% |
| 20 to 24 Minutes | 282 | 10.8% |
| 25 to 29 Minutes | 154 | 5.9% |
| 30 to 34 Minutes | 263 | 10.1% |
| 35 to 39 Minutes | 58 | 2.2% |
| 40 to 44 Minutes | 65 | 2.5% |
| 45 to 59 Minutes | 462 | 17.8% |
| 60 to 89 Minutes | 345 | 13.3% |
| 90 or more Minutes | 100 | 3.8% |
Commute Time by Sex in Ohio County
The most common commute times in Ohio County are 45 to 59 minutes (298 commuters, 21.7%) for males and 15 to 19 minutes (190 commuters, 15.5%) for females.

| Commute Time | Male | Female |
| Less than 5 Minutes | 83 (6.0%) | 128 (10.4%) |
| 5 to 9 Minutes | 97 (7.1%) | 163 (13.3%) |
| 10 to 14 Minutes | 86 (6.3%) | 89 (7.2%) |
| 15 to 19 Minutes | 36 (2.6%) | 190 (15.5%) |
| 20 to 24 Minutes | 173 (12.6%) | 109 (8.9%) |
| 25 to 29 Minutes | 85 (6.2%) | 69 (5.6%) |
| 30 to 34 Minutes | 129 (9.4%) | 134 (10.9%) |
| 35 to 39 Minutes | 47 (3.4%) | 11 (0.9%) |
| 40 to 44 Minutes | 65 (4.7%) | 0 (0.0%) |
| 45 to 59 Minutes | 298 (21.7%) | 164 (13.4%) |
| 60 to 89 Minutes | 205 (14.9%) | 140 (11.4%) |
| 90 or more Minutes | 69 (5.0%) | 31 (2.5%) |
Time of Departure to Work by Sex in Ohio County
The most frequent times of departure to work in Ohio County are 6:00 AM to 6:29 AM (337, 24.5%) for males and 7:00 AM to 7:29 AM (206, 16.8%) for females.

| Time of Departure | Male | Female |
| 12:00 AM to 4:59 AM | 198 (14.4%) | 124 (10.1%) |
| 5:00 AM to 5:29 AM | 144 (10.5%) | 25 (2.0%) |
| 5:30 AM to 5:59 AM | 78 (5.7%) | 135 (11.0%) |
| 6:00 AM to 6:29 AM | 337 (24.5%) | 137 (11.2%) |
| 6:30 AM to 6:59 AM | 92 (6.7%) | 124 (10.1%) |
| 7:00 AM to 7:29 AM | 162 (11.8%) | 206 (16.8%) |
| 7:30 AM to 7:59 AM | 138 (10.1%) | 109 (8.9%) |
| 8:00 AM to 8:29 AM | 64 (4.7%) | 68 (5.5%) |
| 8:30 AM to 8:59 AM | 21 (1.5%) | 107 (8.7%) |
| 9:00 AM to 9:59 AM | 27 (2.0%) | 54 (4.4%) |
| 10:00 AM to 10:59 AM | 6 (0.4%) | 8 (0.6%) |
| 11:00 AM to 11:59 AM | 7 (0.5%) | 0 (0.0%) |
| 12:00 PM to 3:59 PM | 39 (2.8%) | 70 (5.7%) |
| 4:00 PM to 11:59 PM | 60 (4.4%) | 61 (5.0%) |
| Total | 1,373 (100.0%) | 1,228 (100.0%) |
Housing Occupancy in Ohio County
Occupancy by Ownership in Ohio County
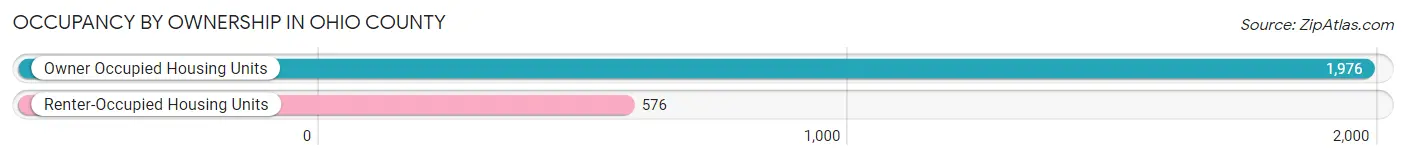
Of the total 2,552 dwellings in Ohio County, owner-occupied units account for 1,976 (77.4%), while renter-occupied units make up 576 (22.6%).
| Occupancy | # Housing Units | % Housing Units |
| Owner Occupied Housing Units | 1,976 | 77.4% |
| Renter-Occupied Housing Units | 576 | 22.6% |
| Total Occupied Housing Units | 2,552 | 100.0% |
Occupancy by Household Size in Ohio County

| Household Size | # Housing Units | % Housing Units |
| 1-Person Household | 719 | 28.2% |
| 2-Person Household | 1,034 | 40.5% |
| 3-Person Household | 287 | 11.3% |
| 4+ Person Household | 512 | 20.1% |
| Total Housing Units | 2,552 | 100.0% |
Occupancy by Ownership by Household Size in Ohio County
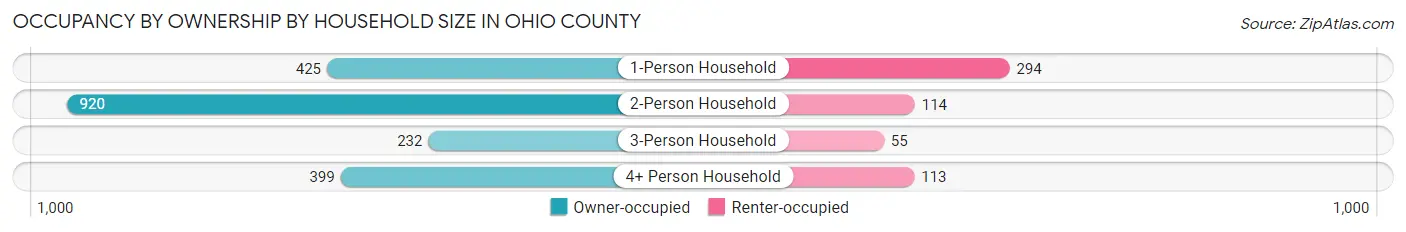
| Household Size | Owner-occupied | Renter-occupied |
| 1-Person Household | 425 (59.1%) | 294 (40.9%) |
| 2-Person Household | 920 (89.0%) | 114 (11.0%) |
| 3-Person Household | 232 (80.8%) | 55 (19.2%) |
| 4+ Person Household | 399 (77.9%) | 113 (22.1%) |
| Total Housing Units | 1,976 (77.4%) | 576 (22.6%) |
Occupancy by Educational Attainment in Ohio County

| Household Size | Owner-occupied | Renter-occupied |
| Less than High School | 150 (78.1%) | 42 (21.9%) |
| High School Diploma | 743 (70.9%) | 305 (29.1%) |
| College/Associate Degree | 712 (77.4%) | 208 (22.6%) |
| Bachelor's Degree or higher | 371 (94.6%) | 21 (5.4%) |
Occupancy by Age of Householder in Ohio County

| Age Bracket | # Households | % Households |
| Under 35 Years | 333 | 13.1% |
| 35 to 44 Years | 390 | 15.3% |
| 45 to 54 Years | 450 | 17.6% |
| 55 to 64 Years | 579 | 22.7% |
| 65 to 74 Years | 419 | 16.4% |
| 75 to 84 Years | 277 | 10.8% |
| 85 Years and Over | 104 | 4.1% |
| Total | 2,552 | 100.0% |
Housing Finances in Ohio County
Median Income by Occupancy in Ohio County

| Occupancy Type | # Households | Median Income |
| Owner-Occupied | 1,976 (77.4%) | $79,877 |
| Renter-Occupied | 576 (22.6%) | $30,625 |
| Average | 2,552 (100.0%) | $66,333 |
Occupancy by Householder Income Bracket in Ohio County
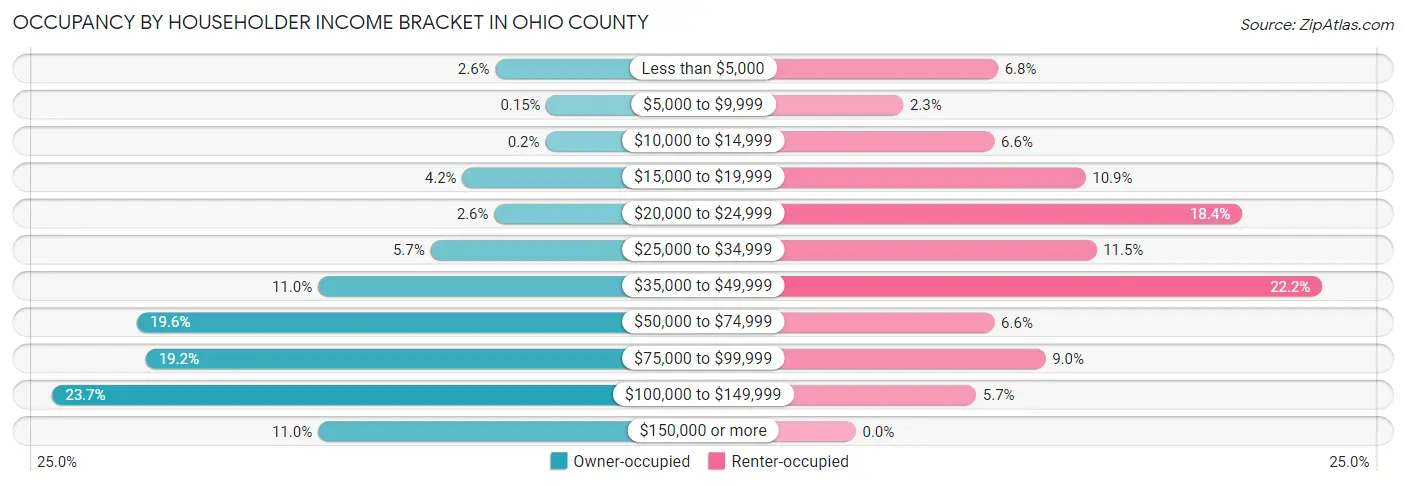
| Income Bracket | Owner-occupied | Renter-occupied |
| Less than $5,000 | 51 (2.6%) | 39 (6.8%) |
| $5,000 to $9,999 | 3 (0.2%) | 13 (2.3%) |
| $10,000 to $14,999 | 4 (0.2%) | 38 (6.6%) |
| $15,000 to $19,999 | 82 (4.2%) | 63 (10.9%) |
| $20,000 to $24,999 | 52 (2.6%) | 106 (18.4%) |
| $25,000 to $34,999 | 112 (5.7%) | 66 (11.5%) |
| $35,000 to $49,999 | 218 (11.0%) | 128 (22.2%) |
| $50,000 to $74,999 | 388 (19.6%) | 38 (6.6%) |
| $75,000 to $99,999 | 380 (19.2%) | 52 (9.0%) |
| $100,000 to $149,999 | 468 (23.7%) | 33 (5.7%) |
| $150,000 or more | 218 (11.0%) | 0 (0.0%) |
| Total | 1,976 (100.0%) | 576 (100.0%) |
Monthly Housing Cost Tiers in Ohio County

| Monthly Cost | Owner-occupied | Renter-occupied |
| Less than $300 | 149 (7.5%) | 22 (3.8%) |
| $300 to $499 | 237 (12.0%) | 71 (12.3%) |
| $500 to $799 | 406 (20.5%) | 121 (21.0%) |
| $800 to $999 | 187 (9.5%) | 163 (28.3%) |
| $1,000 to $1,499 | 547 (27.7%) | 116 (20.1%) |
| $1,500 to $1,999 | 268 (13.6%) | 0 (0.0%) |
| $2,000 to $2,499 | 114 (5.8%) | 0 (0.0%) |
| $2,500 to $2,999 | 15 (0.8%) | 0 (0.0%) |
| $3,000 or more | 53 (2.7%) | 0 (0.0%) |
| Total | 1,976 (100.0%) | 576 (100.0%) |
Physical Housing Characteristics in Ohio County
Housing Structures in Ohio County

| Structure Type | # Housing Units | % Housing Units |
| Single Unit, Detached | 2,013 | 78.9% |
| Single Unit, Attached | 39 | 1.5% |
| 2 Unit Apartments | 43 | 1.7% |
| 3 or 4 Unit Apartments | 68 | 2.7% |
| 5 to 9 Unit Apartments | 35 | 1.4% |
| 10 or more Apartments | 109 | 4.3% |
| Mobile Home / Other | 245 | 9.6% |
| Total | 2,552 | 100.0% |
Housing Structures by Occupancy in Ohio County
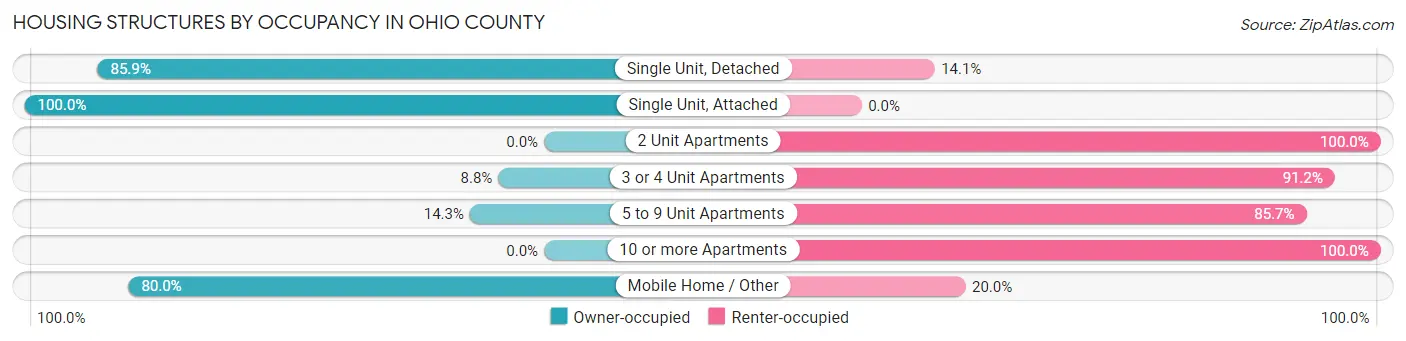
| Structure Type | Owner-occupied | Renter-occupied |
| Single Unit, Detached | 1,730 (85.9%) | 283 (14.1%) |
| Single Unit, Attached | 39 (100.0%) | 0 (0.0%) |
| 2 Unit Apartments | 0 (0.0%) | 43 (100.0%) |
| 3 or 4 Unit Apartments | 6 (8.8%) | 62 (91.2%) |
| 5 to 9 Unit Apartments | 5 (14.3%) | 30 (85.7%) |
| 10 or more Apartments | 0 (0.0%) | 109 (100.0%) |
| Mobile Home / Other | 196 (80.0%) | 49 (20.0%) |
| Total | 1,976 (77.4%) | 576 (22.6%) |
Housing Structures by Number of Rooms in Ohio County

| Number of Rooms | Owner-occupied | Renter-occupied |
| 1 Room | 0 (0.0%) | 8 (1.4%) |
| 2 or 3 Rooms | 60 (3.0%) | 132 (22.9%) |
| 4 or 5 Rooms | 576 (29.1%) | 164 (28.5%) |
| 6 or 7 Rooms | 742 (37.6%) | 213 (37.0%) |
| 8 or more Rooms | 598 (30.3%) | 59 (10.2%) |
| Total | 1,976 (100.0%) | 576 (100.0%) |
Housing Structure by Heating Type in Ohio County

| Heating Type | Owner-occupied | Renter-occupied |
| Utility Gas | 469 (23.7%) | 98 (17.0%) |
| Bottled, Tank, or LP Gas | 414 (20.9%) | 93 (16.2%) |
| Electricity | 840 (42.5%) | 372 (64.6%) |
| Fuel Oil or Kerosene | 80 (4.1%) | 13 (2.3%) |
| Coal or Coke | 5 (0.3%) | 0 (0.0%) |
| All other Fuels | 156 (7.9%) | 0 (0.0%) |
| No Fuel Used | 12 (0.6%) | 0 (0.0%) |
| Total | 1,976 (100.0%) | 576 (100.0%) |
Household Vehicle Usage in Ohio County

| Vehicles per Household | Owner-occupied | Renter-occupied |
| No Vehicle | 44 (2.2%) | 80 (13.9%) |
| 1 Vehicle | 347 (17.6%) | 323 (56.1%) |
| 2 Vehicles | 612 (31.0%) | 135 (23.4%) |
| 3 or more Vehicles | 973 (49.2%) | 38 (6.6%) |
| Total | 1,976 (100.0%) | 576 (100.0%) |
Real Estate & Mortgages in Ohio County
Real Estate and Mortgage Overview in Ohio County
| Characteristic | Without Mortgage | With Mortgage |
| Housing Units | 754 | 1,222 |
| Median Property Value | $189,800 | $189,400 |
| Median Household Income | $59,630 | $148 |
| Monthly Housing Costs | $514 | $53 |
| Real Estate Taxes | $979 | $13 |
Property Value by Mortgage Status in Ohio County

| Property Value | Without Mortgage | With Mortgage |
| Less than $50,000 | 63 (8.4%) | 31 (2.5%) |
| $50,000 to $99,999 | 92 (12.2%) | 102 (8.4%) |
| $100,000 to $299,999 | 442 (58.6%) | 758 (62.0%) |
| $300,000 to $499,999 | 134 (17.8%) | 281 (23.0%) |
| $500,000 to $749,999 | 12 (1.6%) | 38 (3.1%) |
| $750,000 to $999,999 | 0 (0.0%) | 0 (0.0%) |
| $1,000,000 or more | 11 (1.5%) | 12 (1.0%) |
| Total | 754 (100.0%) | 1,222 (100.0%) |
Household Income by Mortgage Status in Ohio County

| Household Income | Without Mortgage | With Mortgage |
| Less than $10,000 | 29 (3.8%) | 45 (3.7%) |
| $10,000 to $24,999 | 80 (10.6%) | 25 (2.1%) |
| $25,000 to $34,999 | 77 (10.2%) | 58 (4.8%) |
| $35,000 to $49,999 | 131 (17.4%) | 35 (2.9%) |
| $50,000 to $74,999 | 142 (18.8%) | 87 (7.1%) |
| $75,000 to $99,999 | 132 (17.5%) | 246 (20.1%) |
| $100,000 to $149,999 | 93 (12.3%) | 248 (20.3%) |
| $150,000 or more | 70 (9.3%) | 375 (30.7%) |
| Total | 754 (100.0%) | 1,222 (100.0%) |
Property Value to Household Income Ratio in Ohio County

| Value-to-Income Ratio | Without Mortgage | With Mortgage |
| Less than 2.0x | 262 (34.7%) | 93,199 (7,626.8%) |
| 2.0x to 2.9x | 111 (14.7%) | 509 (41.6%) |
| 3.0x to 3.9x | 145 (19.2%) | 261 (21.4%) |
| 4.0x or more | 227 (30.1%) | 151 (12.4%) |
| Total | 754 (100.0%) | 1,222 (100.0%) |
Real Estate Taxes by Mortgage Status in Ohio County

| Property Taxes | Without Mortgage | With Mortgage |
| Less than $800 | 280 (37.1%) | 12 (1.0%) |
| $800 to $1,499 | 164 (21.7%) | 319 (26.1%) |
| $800 to $1,499 | 309 (41.0%) | 454 (37.1%) |
| Total | 754 (100.0%) | 1,222 (100.0%) |
Health & Disability in Ohio County
Health Insurance Coverage by Age in Ohio County
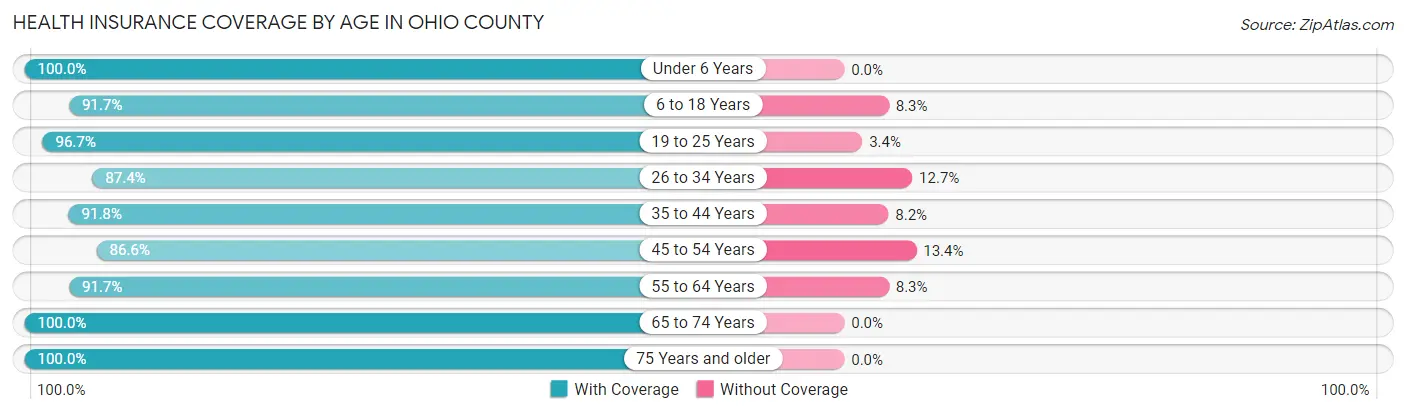
| Age Bracket | With Coverage | Without Coverage |
| Under 6 Years | 417 (100.0%) | 0 (0.0%) |
| 6 to 18 Years | 798 (91.7%) | 72 (8.3%) |
| 19 to 25 Years | 317 (96.7%) | 11 (3.4%) |
| 26 to 34 Years | 518 (87.4%) | 75 (12.7%) |
| 35 to 44 Years | 604 (91.8%) | 54 (8.2%) |
| 45 to 54 Years | 651 (86.6%) | 101 (13.4%) |
| 55 to 64 Years | 929 (91.7%) | 84 (8.3%) |
| 65 to 74 Years | 762 (100.0%) | 0 (0.0%) |
| 75 Years and older | 525 (100.0%) | 0 (0.0%) |
| Total | 5,521 (93.3%) | 397 (6.7%) |
Health Insurance Coverage by Citizenship Status in Ohio County
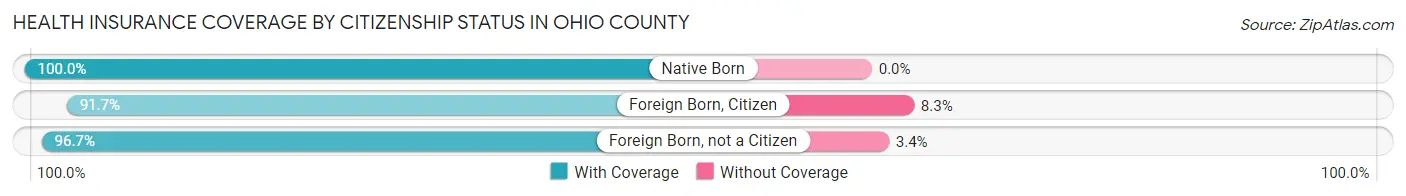
| Citizenship Status | With Coverage | Without Coverage |
| Native Born | 417 (100.0%) | 0 (0.0%) |
| Foreign Born, Citizen | 798 (91.7%) | 72 (8.3%) |
| Foreign Born, not a Citizen | 317 (96.7%) | 11 (3.4%) |
Health Insurance Coverage by Household Income in Ohio County

| Household Income | With Coverage | Without Coverage |
| Under $25,000 | 581 (98.0%) | 12 (2.0%) |
| $25,000 to $49,999 | 970 (94.6%) | 55 (5.4%) |
| $50,000 to $74,999 | 937 (92.9%) | 72 (7.1%) |
| $75,000 to $99,999 | 1,165 (95.8%) | 51 (4.2%) |
| $100,000 and over | 1,868 (90.0%) | 207 (10.0%) |
Public vs Private Health Insurance Coverage by Age in Ohio County

| Age Bracket | Public Insurance | Private Insurance |
| Under 6 | 144 (34.5%) | 298 (71.5%) |
| 6 to 18 Years | 275 (31.6%) | 581 (66.8%) |
| 19 to 25 Years | 55 (16.8%) | 270 (82.3%) |
| 25 to 34 Years | 153 (25.8%) | 395 (66.6%) |
| 35 to 44 Years | 48 (7.3%) | 575 (87.4%) |
| 45 to 54 Years | 206 (27.4%) | 510 (67.8%) |
| 55 to 64 Years | 127 (12.5%) | 838 (82.7%) |
| 65 to 74 Years | 751 (98.6%) | 452 (59.3%) |
| 75 Years and over | 513 (97.7%) | 309 (58.9%) |
| Total | 2,272 (38.4%) | 4,228 (71.4%) |
Disability Status by Sex by Age in Ohio County

| Age Bracket | Male | Female |
| Under 5 Years | 0 (0.0%) | 0 (0.0%) |
| 5 to 17 Years | 21 (4.8%) | 9 (2.3%) |
| 18 to 34 Years | 62 (12.7%) | 92 (18.2%) |
| 35 to 64 Years | 198 (16.5%) | 170 (13.9%) |
| 65 to 74 Years | 106 (27.3%) | 90 (24.1%) |
| 75 Years and over | 113 (48.3%) | 156 (53.6%) |
Disability Class by Sex by Age in Ohio County
Disability Class: Hearing Difficulty

| Age Bracket | Male | Female |
| Under 5 Years | 0 (0.0%) | 0 (0.0%) |
| 5 to 17 Years | 16 (3.6%) | 0 (0.0%) |
| 18 to 34 Years | 24 (4.9%) | 10 (2.0%) |
| 35 to 64 Years | 105 (8.7%) | 26 (2.1%) |
| 65 to 74 Years | 53 (13.7%) | 16 (4.3%) |
| 75 Years and over | 31 (13.3%) | 52 (17.9%) |
Disability Class: Vision Difficulty
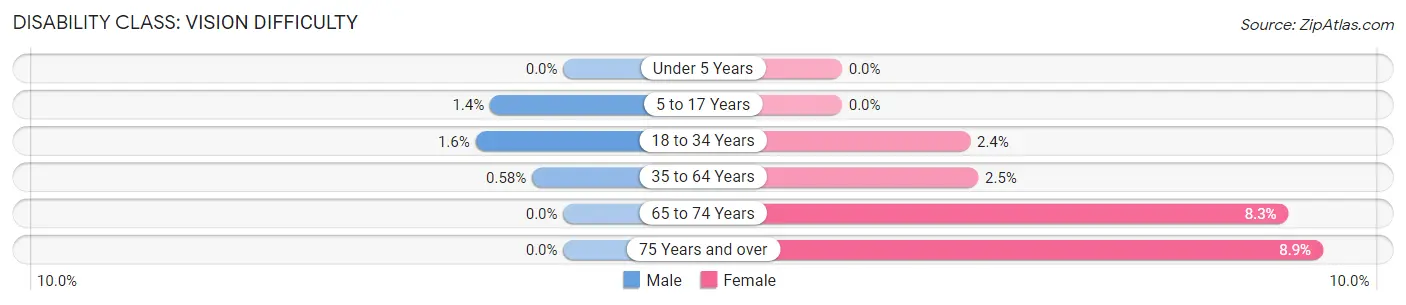
| Age Bracket | Male | Female |
| Under 5 Years | 0 (0.0%) | 0 (0.0%) |
| 5 to 17 Years | 6 (1.4%) | 0 (0.0%) |
| 18 to 34 Years | 8 (1.6%) | 12 (2.4%) |
| 35 to 64 Years | 7 (0.6%) | 31 (2.5%) |
| 65 to 74 Years | 0 (0.0%) | 31 (8.3%) |
| 75 Years and over | 0 (0.0%) | 26 (8.9%) |
Disability Class: Cognitive Difficulty

| Age Bracket | Male | Female |
| 5 to 17 Years | 5 (1.1%) | 9 (2.3%) |
| 18 to 34 Years | 30 (6.1%) | 70 (13.9%) |
| 35 to 64 Years | 28 (2.3%) | 74 (6.0%) |
| 65 to 74 Years | 35 (9.0%) | 29 (7.7%) |
| 75 Years and over | 23 (9.8%) | 22 (7.6%) |
Disability Class: Ambulatory Difficulty

| Age Bracket | Male | Female |
| 5 to 17 Years | 6 (1.4%) | 0 (0.0%) |
| 18 to 34 Years | 0 (0.0%) | 0 (0.0%) |
| 35 to 64 Years | 99 (8.3%) | 151 (12.3%) |
| 65 to 74 Years | 68 (17.5%) | 78 (20.9%) |
| 75 Years and over | 82 (35.0%) | 143 (49.1%) |
Disability Class: Self-Care Difficulty

| Age Bracket | Male | Female |
| 5 to 17 Years | 0 (0.0%) | 0 (0.0%) |
| 18 to 34 Years | 26 (5.3%) | 0 (0.0%) |
| 35 to 64 Years | 14 (1.2%) | 47 (3.8%) |
| 65 to 74 Years | 35 (9.0%) | 9 (2.4%) |
| 75 Years and over | 23 (9.8%) | 76 (26.1%) |
Technology Access in Ohio County
Computing Device Access in Ohio County
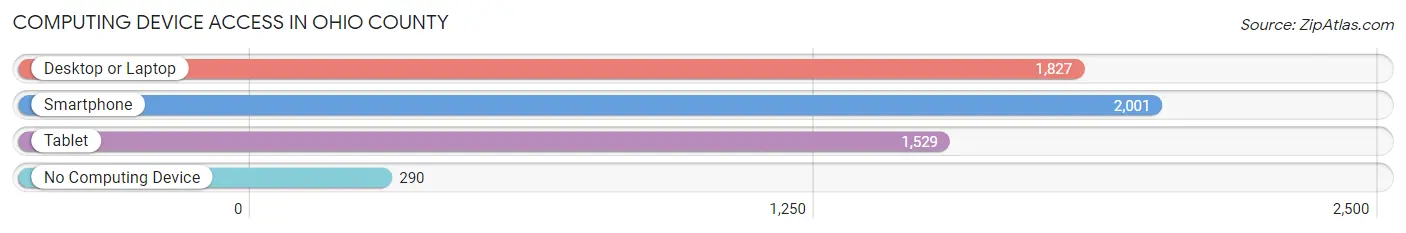
| Device Type | # Households | % Households |
| Desktop or Laptop | 1,827 | 71.6% |
| Smartphone | 2,001 | 78.4% |
| Tablet | 1,529 | 59.9% |
| No Computing Device | 290 | 11.4% |
| Total | 2,552 | 100.0% |
Internet Access in Ohio County

| Internet Type | # Households | % Households |
| Dial-Up Internet | 43 | 1.7% |
| Broadband Home | 1,600 | 62.7% |
| Cellular Data Only | 305 | 11.9% |
| Satellite Internet | 270 | 10.6% |
| No Internet | 416 | 16.3% |
| Total | 2,552 | 100.0% |
Ohio County Summary
History
Ohio County, Indiana is located in the northwest corner of the state and is part of the tri-state area of Indiana, Ohio, and Kentucky. The county was established in 1844 and was named after the Ohio River, which forms its northern border. The county seat is Rising Sun, Indiana.
The first settlers in the area were Native Americans, including the Miami, Shawnee, and Delaware tribes. The first European settlers arrived in the late 1700s and early 1800s. The first county seat was established in 1844 in Rising Sun, Indiana.
The county was an important part of the Underground Railroad, with many of the county’s residents helping to hide and transport escaped slaves. The county was also home to several Civil War battles, including the Battle of Corydon in 1863.
Geography
Ohio County is located in the northwest corner of Indiana and is bordered by the Ohio River to the north, the Wabash River to the east, and the White River to the south. The county covers an area of approximately 437 square miles and is home to several small towns and villages, including Rising Sun, Aurora, and Manchester.
The county is mostly rural, with the majority of the land being used for farming and agriculture. The terrain is mostly flat, with some rolling hills in the northern part of the county. The county is home to several state parks, including the Ohio River Islands National Wildlife Refuge and the Big Oaks National Wildlife Refuge.
Economy
Ohio County’s economy is largely based on agriculture and manufacturing. The county is home to several large farms, which produce corn, soybeans, wheat, and other crops. The county is also home to several manufacturing companies, including automotive parts manufacturers, food processing plants, and metalworking companies.
The county is also home to several tourist attractions, including the Ohio River Scenic Byway, the Big Oaks National Wildlife Refuge, and the Ohio River Islands National Wildlife Refuge. The county is also home to several wineries and distilleries, as well as several golf courses.
Demographics
As of the 2010 census, Ohio County had a population of 28,845. The population is mostly white (94.3%), with small percentages of African American (2.3%), Hispanic (1.2%), and Asian (0.7%) residents. The median household income is $45,845, and the median home value is $125,000.
The county is home to several small towns and villages, including Rising Sun, Aurora, and Manchester. The county is served by several school districts, including the Rising Sun-Ohio County Community School Corporation, the South Dearborn Community School Corporation, and the East Central Community School Corporation.
Conclusion
Ohio County, Indiana is a rural county located in the northwest corner of the state. The county is home to several small towns and villages, and its economy is largely based on agriculture and manufacturing. The county is also home to several tourist attractions, including the Ohio River Scenic Byway, the Big Oaks National Wildlife Refuge, and the Ohio River Islands National Wildlife Refuge. As of the 2010 census, the county had a population of 28,845, with a median household income of $45,845 and a median home value of $125,000.
Common Questions
What is the Total Population of Ohio County?
Total Population of Ohio County is 5,974.
What is the Total Male Population of Ohio County?
Total Male Population of Ohio County is 2,959.
What is the Total Female Population of Ohio County?
Total Female Population of Ohio County is 3,015.
What is the Ratio of Males per 100 Females in Ohio County?
There are 98.14 Males per 100 Females in Ohio County.
What is the Ratio of Females per 100 Males in Ohio County?
There are 101.89 Females per 100 Males in Ohio County.
What is the Median Population Age in Ohio County?
Median Population Age in Ohio County is 47.2 Years.
What is the Average Family Size in Ohio County
Average Family Size in Ohio County is 2.8 People.
What is the Average Household Size in Ohio County
Average Household Size in Ohio County is 2.3 People.
What is Per Capita Income in Ohio County?
Per Capita income in Ohio County is $35,310.
What is the Median Family Income in Ohio County?
Median Family Income in Ohio County is $81,225.
What is the Median Household income in Ohio County?
Median Household Income in Ohio County is $66,333.
What is Income or Wage Gap in Ohio County?
Income or Wage Gap in Ohio County is 40.3%.
Women in Ohio County earn 59.7 cents for every dollar earned by a man.
What is Inequality or Gini Index in Ohio County?
Inequality or Gini Index in Ohio County is 0.42.
How Large is the Labor Force in Ohio County?
There are 2,881 People in the Labor Forcein in Ohio County.
What is the Percentage of People in the Labor Force in Ohio County?
58.9% of People are in the Labor Force in Ohio County.
What is the Unemployment Rate in Ohio County?
Unemployment Rate in Ohio County is 1.8%.