Noble County, IN
Noble County Map
Noble County Overview
47,431
TOTAL POPULATION
23,977
MALE POPULATION
23,454
FEMALE POPULATION
102.23
MALES / 100 FEMALES
97.82
FEMALES / 100 MALES
39.4
MEDIAN AGE
3.2
AVG FAMILY SIZE
2.6
AVG HOUSEHOLD SIZE
$31,953
PER CAPITA INCOME
$82,845
AVG FAMILY INCOME
$70,286
AVG HOUSEHOLD INCOME
32.0%
WAGE / INCOME GAP [ % ]
68.0¢/ $1
WAGE / INCOME GAP [ $ ]
$9,685
FAMILY INCOME DEFICIT
0.38
INEQUALITY / GINI INDEX
23,766
LABOR FORCE [ PEOPLE ]
63.8%
PERCENT IN LABOR FORCE
3.4%
UNEMPLOYMENT RATE
Noble County Area Codes
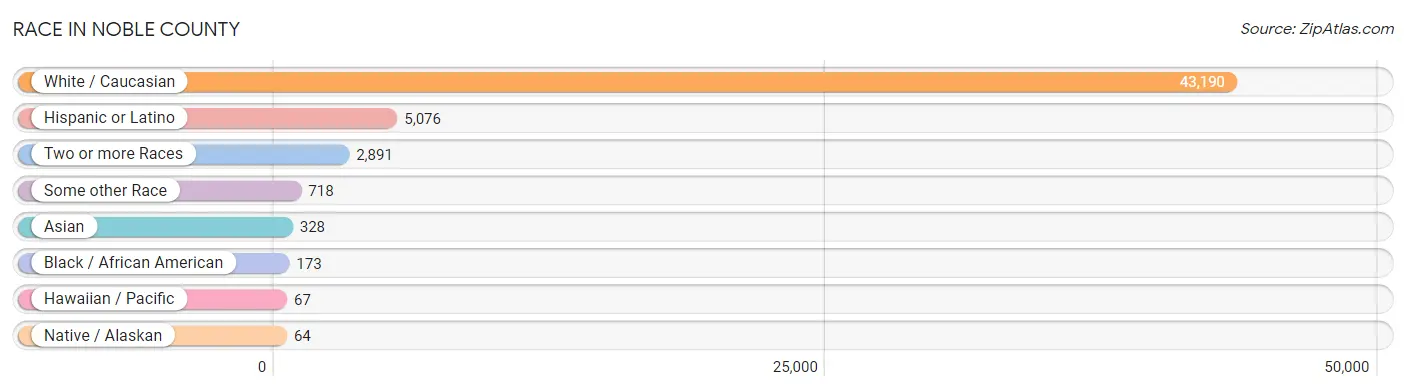
Race in Noble County
The most populous races in Noble County are White / Caucasian (43,190 | 91.1%), Hispanic or Latino (5,076 | 10.7%), and Two or more Races (2,891 | 6.1%).
| Race | # Population | % Population |
| Asian | 328 | 0.7% |
| Black / African American | 173 | 0.4% |
| Hawaiian / Pacific | 67 | 0.1% |
| Hispanic or Latino | 5,076 | 10.7% |
| Native / Alaskan | 64 | 0.1% |
| White / Caucasian | 43,190 | 91.1% |
| Two or more Races | 2,891 | 6.1% |
| Some other Race | 718 | 1.5% |
| Total | 47,431 | 100.0% |
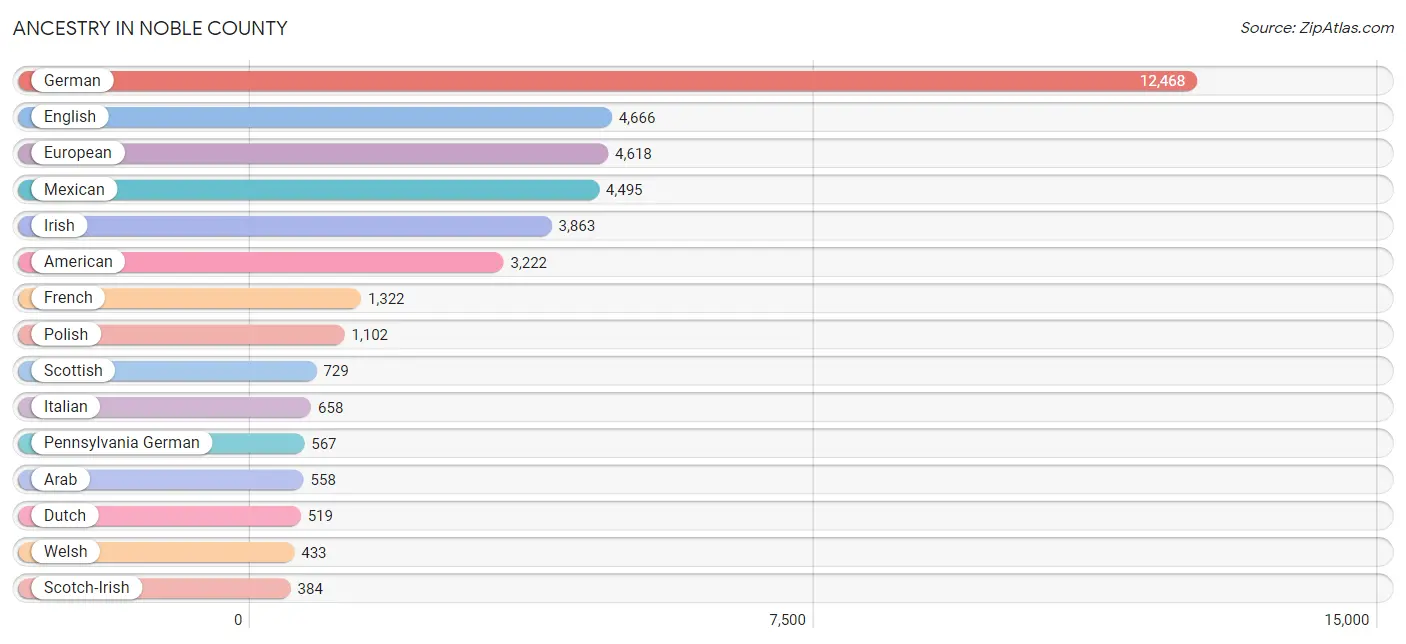
Ancestry in Noble County
The most populous ancestries reported in Noble County are German (12,468 | 26.3%), English (4,666 | 9.8%), European (4,618 | 9.7%), Mexican (4,495 | 9.5%), and Irish (3,863 | 8.1%), together accounting for 63.5% of all Noble County residents.
| Ancestry | # Population | % Population |
| African | 13 | 0.0% |
| American | 3,222 | 6.8% |
| Arab | 558 | 1.2% |
| Argentinean | 4 | 0.0% |
| Austrian | 1 | 0.0% |
| Belgian | 26 | 0.1% |
| Bhutanese | 10 | 0.0% |
| Blackfeet | 11 | 0.0% |
| British | 164 | 0.4% |
| Bulgarian | 18 | 0.0% |
| Burmese | 38 | 0.1% |
| Canadian | 50 | 0.1% |
| Celtic | 12 | 0.0% |
| Central American Indian | 1 | 0.0% |
| Cherokee | 113 | 0.2% |
| Cheyenne | 6 | 0.0% |
| Chippewa | 14 | 0.0% |
| Croatian | 95 | 0.2% |
| Cuban | 52 | 0.1% |
| Czech | 36 | 0.1% |
| Czechoslovakian | 51 | 0.1% |
| Danish | 73 | 0.2% |
| Dutch | 519 | 1.1% |
| Eastern European | 22 | 0.1% |
| Egyptian | 53 | 0.1% |
| English | 4,666 | 9.8% |
| Ethiopian | 4 | 0.0% |
| European | 4,618 | 9.7% |
| Finnish | 6 | 0.0% |
| French | 1,322 | 2.8% |
| French Canadian | 43 | 0.1% |
| German | 12,468 | 26.3% |
| Greek | 53 | 0.1% |
| Guamanian / Chamorro | 93 | 0.2% |
| Hungarian | 165 | 0.4% |
| Indian (Asian) | 42 | 0.1% |
| Indonesian | 18 | 0.0% |
| Iranian | 3 | 0.0% |
| Irish | 3,863 | 8.1% |
| Iroquois | 12 | 0.0% |
| Israeli | 5 | 0.0% |
| Italian | 658 | 1.4% |
| Korean | 77 | 0.2% |
| Lithuanian | 11 | 0.0% |
| Mexican | 4,495 | 9.5% |
| Moroccan | 80 | 0.2% |
| Native Hawaiian | 67 | 0.1% |
| Navajo | 24 | 0.1% |
| Norwegian | 103 | 0.2% |
| Pennsylvania German | 567 | 1.2% |
| Polish | 1,102 | 2.3% |
| Portuguese | 8 | 0.0% |
| Potawatomi | 33 | 0.1% |
| Puerto Rican | 194 | 0.4% |
| Romanian | 85 | 0.2% |
| Russian | 134 | 0.3% |
| Samoan | 42 | 0.1% |
| Scandinavian | 23 | 0.1% |
| Scotch-Irish | 384 | 0.8% |
| Scottish | 729 | 1.5% |
| Sioux | 11 | 0.0% |
| Slavic | 9 | 0.0% |
| Slovak | 55 | 0.1% |
| South American | 5 | 0.0% |
| Spaniard | 4 | 0.0% |
| Spanish | 90 | 0.2% |
| Sri Lankan | 257 | 0.5% |
| Subsaharan African | 17 | 0.0% |
| Swedish | 164 | 0.4% |
| Swiss | 234 | 0.5% |
| Thai | 6 | 0.0% |
| Turkish | 1 | 0.0% |
| Ukrainian | 61 | 0.1% |
| Venezuelan | 1 | 0.0% |
| Welsh | 433 | 0.9% |
| Yugoslavian | 8 | 0.0% | View All 76 Rows |
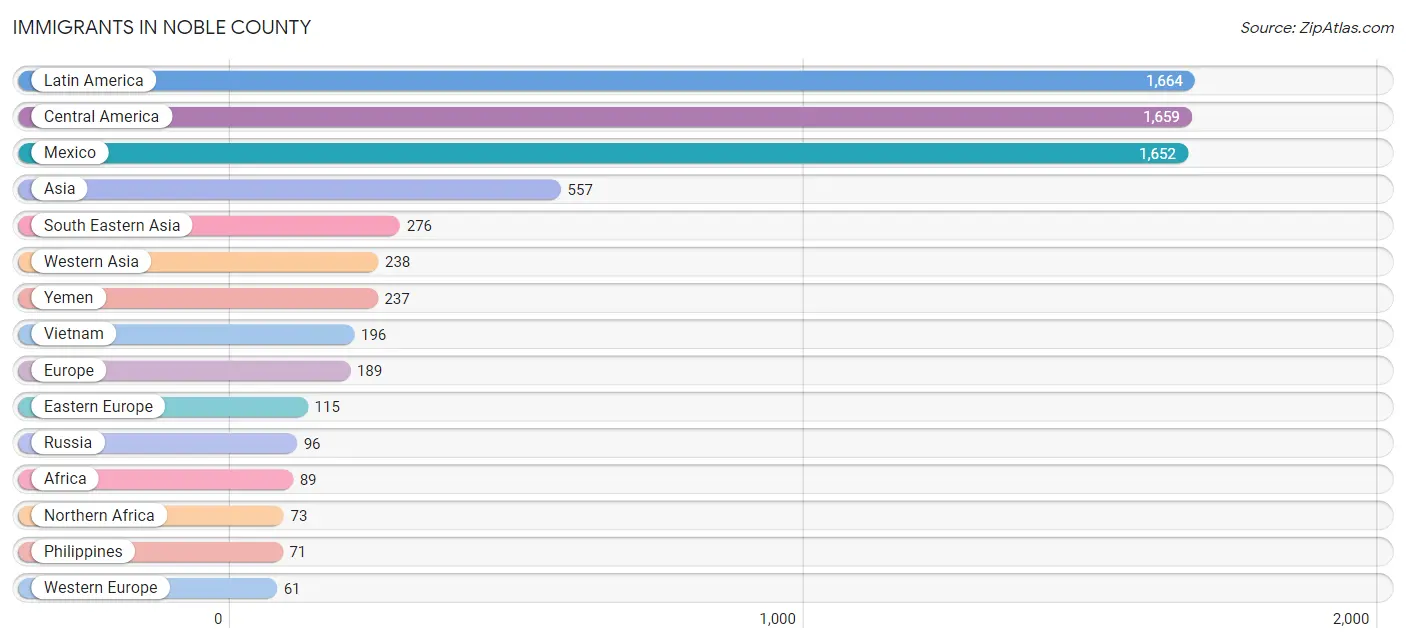
Immigrants in Noble County
The most numerous immigrant groups reported in Noble County came from Latin America (1,664 | 3.5%), Central America (1,659 | 3.5%), Mexico (1,652 | 3.5%), Asia (557 | 1.2%), and South Eastern Asia (276 | 0.6%), together accounting for 12.2% of all Noble County residents.
| Immigration Origin | # Population | % Population |
| Africa | 89 | 0.2% |
| Asia | 557 | 1.2% |
| Brazil | 5 | 0.0% |
| Canada | 14 | 0.0% |
| Central America | 1,659 | 3.5% |
| China | 23 | 0.1% |
| Eastern Africa | 4 | 0.0% |
| Eastern Asia | 43 | 0.1% |
| Eastern Europe | 115 | 0.2% |
| Egypt | 41 | 0.1% |
| El Salvador | 7 | 0.0% |
| England | 7 | 0.0% |
| Ethiopia | 4 | 0.0% |
| Europe | 189 | 0.4% |
| Germany | 56 | 0.1% |
| Korea | 20 | 0.0% |
| Latin America | 1,664 | 3.5% |
| Mexico | 1,652 | 3.5% |
| Middle Africa | 12 | 0.0% |
| Morocco | 32 | 0.1% |
| Netherlands | 5 | 0.0% |
| Northern Africa | 73 | 0.2% |
| Northern Europe | 13 | 0.0% |
| Oceania | 42 | 0.1% |
| Philippines | 71 | 0.2% |
| Romania | 19 | 0.0% |
| Russia | 96 | 0.2% |
| South America | 5 | 0.0% |
| South Eastern Asia | 276 | 0.6% |
| Thailand | 9 | 0.0% |
| Turkey | 1 | 0.0% |
| Vietnam | 196 | 0.4% |
| Western Asia | 238 | 0.5% |
| Western Europe | 61 | 0.1% |
| Yemen | 237 | 0.5% | View All 35 Rows |
Sex and Age in Noble County
Sex and Age in Noble County
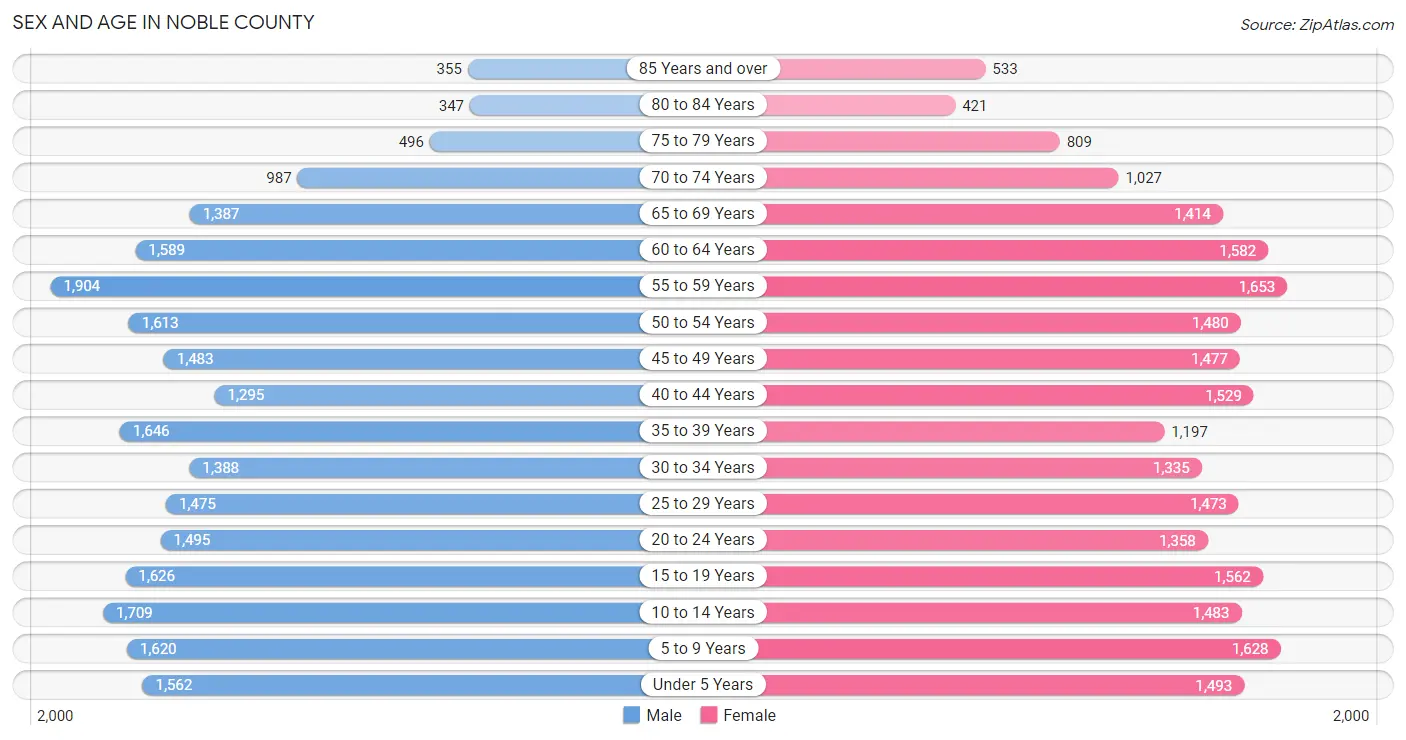
The most populous age groups in Noble County are 55 to 59 Years (1,904 | 7.9%) for men and 55 to 59 Years (1,653 | 7.0%) for women.
| Age Bracket | Male | Female |
| Under 5 Years | 1,562 (6.5%) | 1,493 (6.4%) |
| 5 to 9 Years | 1,620 (6.8%) | 1,628 (6.9%) |
| 10 to 14 Years | 1,709 (7.1%) | 1,483 (6.3%) |
| 15 to 19 Years | 1,626 (6.8%) | 1,562 (6.7%) |
| 20 to 24 Years | 1,495 (6.2%) | 1,358 (5.8%) |
| 25 to 29 Years | 1,475 (6.1%) | 1,473 (6.3%) |
| 30 to 34 Years | 1,388 (5.8%) | 1,335 (5.7%) |
| 35 to 39 Years | 1,646 (6.9%) | 1,197 (5.1%) |
| 40 to 44 Years | 1,295 (5.4%) | 1,529 (6.5%) |
| 45 to 49 Years | 1,483 (6.2%) | 1,477 (6.3%) |
| 50 to 54 Years | 1,613 (6.7%) | 1,480 (6.3%) |
| 55 to 59 Years | 1,904 (7.9%) | 1,653 (7.0%) |
| 60 to 64 Years | 1,589 (6.6%) | 1,582 (6.8%) |
| 65 to 69 Years | 1,387 (5.8%) | 1,414 (6.0%) |
| 70 to 74 Years | 987 (4.1%) | 1,027 (4.4%) |
| 75 to 79 Years | 496 (2.1%) | 809 (3.5%) |
| 80 to 84 Years | 347 (1.5%) | 421 (1.8%) |
| 85 Years and over | 355 (1.5%) | 533 (2.3%) |
| Total | 23,977 (100.0%) | 23,454 (100.0%) |
Families and Households in Noble County
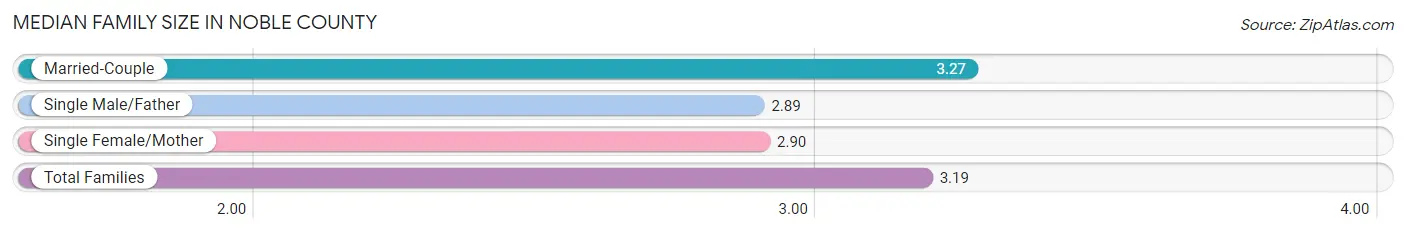
Median Family Size in Noble County
The median family size in Noble County is 3.19 persons per family, with married-couple families (9,514 | 78.2%) accounting for the largest median family size of 3.27 persons per family. On the other hand, single male/father families (885 | 7.3%) represent the smallest median family size with 2.89 persons per family.
| Family Type | # Families | Family Size |
| Married-Couple | 9,514 (78.2%) | 3.27 |
| Single Male/Father | 885 (7.3%) | 2.89 |
| Single Female/Mother | 1,759 (14.5%) | 2.90 |
| Total Families | 12,158 (100.0%) | 3.19 |
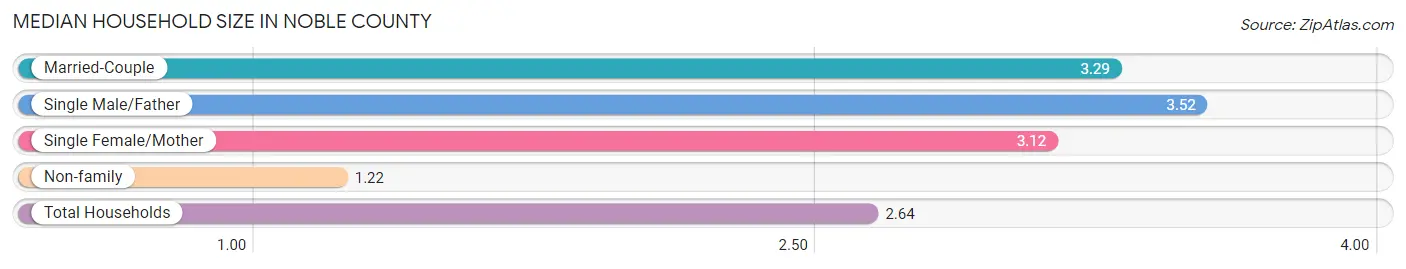
Median Household Size in Noble County
The median household size in Noble County is 2.64 persons per household, with single male/father households (885 | 5.0%) accounting for the largest median household size of 3.52 persons per household. non-family households (5,530 | 31.3%) represent the smallest median household size with 1.22 persons per household.
| Household Type | # Households | Household Size |
| Married-Couple | 9,514 (53.8%) | 3.29 |
| Single Male/Father | 885 (5.0%) | 3.52 |
| Single Female/Mother | 1,759 (9.9%) | 3.12 |
| Non-family | 5,530 (31.3%) | 1.22 |
| Total Households | 17,688 (100.0%) | 2.64 |
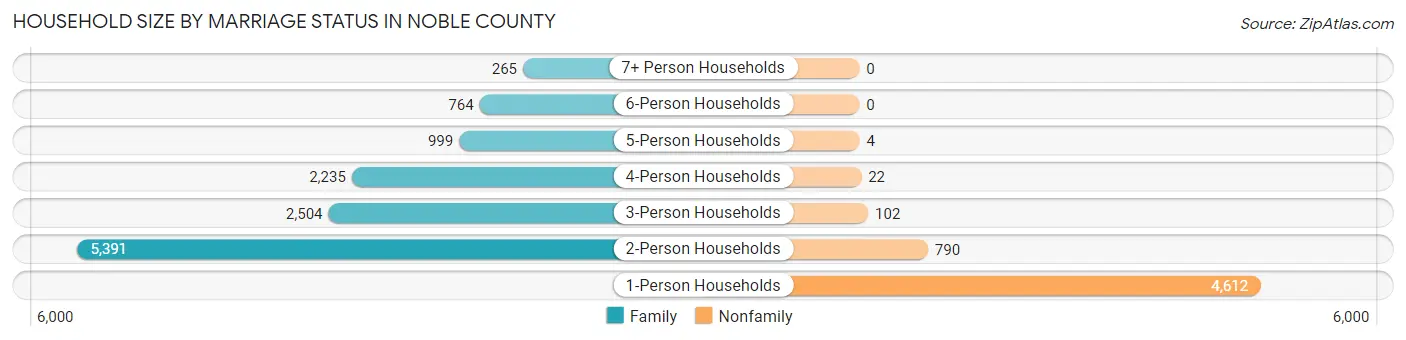
Household Size by Marriage Status in Noble County
Out of a total of 17,688 households in Noble County, 12,158 (68.7%) are family households, while 5,530 (31.3%) are nonfamily households. The most numerous type of family households are 2-person households, comprising 5,391, and the most common type of nonfamily households are 1-person households, comprising 4,612.
| Household Size | Family Households | Nonfamily Households |
| 1-Person Households | - | 4,612 (26.1%) |
| 2-Person Households | 5,391 (30.5%) | 790 (4.5%) |
| 3-Person Households | 2,504 (14.2%) | 102 (0.6%) |
| 4-Person Households | 2,235 (12.6%) | 22 (0.1%) |
| 5-Person Households | 999 (5.7%) | 4 (0.0%) |
| 6-Person Households | 764 (4.3%) | 0 (0.0%) |
| 7+ Person Households | 265 (1.5%) | 0 (0.0%) |
| Total | 12,158 (68.7%) | 5,530 (31.3%) |
Female Fertility in Noble County
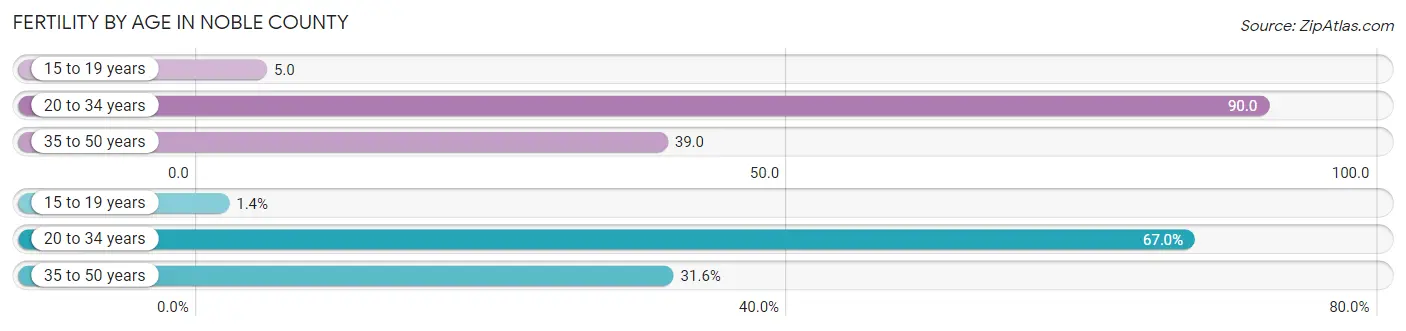
Fertility by Age in Noble County
Average fertility rate in Noble County is 55.0 births per 1,000 women. Women in the age bracket of 20 to 34 years have the highest fertility rate with 90.0 births per 1,000 women. Women in the age bracket of 20 to 34 years acount for 67.0% of all women with births.
| Age Bracket | Women with Births | Births / 1,000 Women |
| 15 to 19 years | 8 (1.4%) | 5.0 |
| 20 to 34 years | 373 (67.0%) | 90.0 |
| 35 to 50 years | 176 (31.6%) | 39.0 |
| Total | 557 (100.0%) | 55.0 |
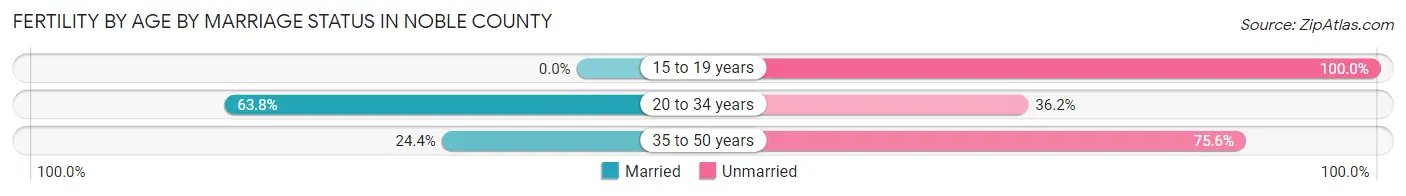
Fertility by Age by Marriage Status in Noble County
50.4% of women with births (557) in Noble County are married. The highest percentage of unmarried women with births falls into 15 to 19 years age bracket with 100.0% of them unmarried at the time of birth, while the lowest percentage of unmarried women with births belong to 20 to 34 years age bracket with 36.2% of them unmarried.
| Age Bracket | Married | Unmarried |
| 15 to 19 years | 0 (0.0%) | 8 (100.0%) |
| 20 to 34 years | 238 (63.8%) | 135 (36.2%) |
| 35 to 50 years | 43 (24.4%) | 133 (75.6%) |
| Total | 281 (50.4%) | 276 (49.5%) |
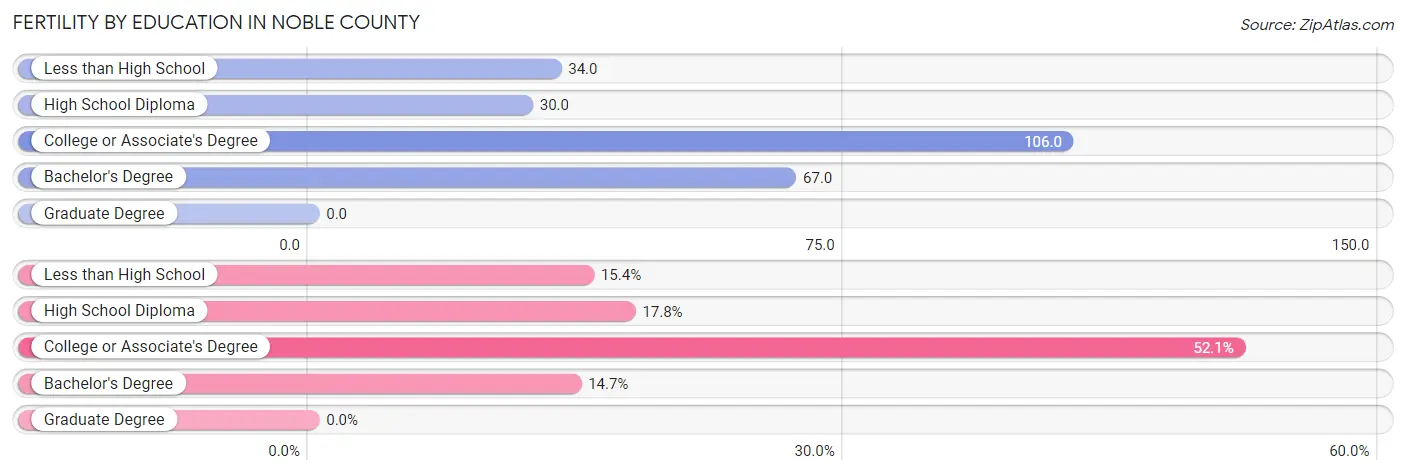
Fertility by Education in Noble County
| Educational Attainment | Women with Births | Births / 1,000 Women |
| Less than High School | 86 (15.4%) | 34.0 |
| High School Diploma | 99 (17.8%) | 30.0 |
| College or Associate's Degree | 290 (52.1%) | 106.0 |
| Bachelor's Degree | 82 (14.7%) | 67.0 |
| Graduate Degree | 0 (0.0%) | 0.0 |
| Total | 557 (100.0%) | 55.0 |
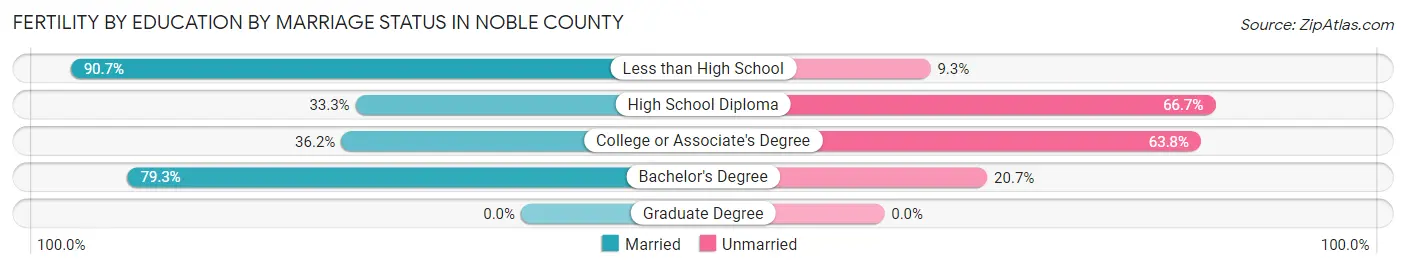
Fertility by Education by Marriage Status in Noble County
49.5% of women with births in Noble County are unmarried. Women with the educational attainment of less than high school are most likely to be married with 90.7% of them married at childbirth, while women with the educational attainment of high school diploma are least likely to be married with 66.7% of them unmarried at childbirth.
| Educational Attainment | Married | Unmarried |
| Less than High School | 78 (90.7%) | 8 (9.3%) |
| High School Diploma | 33 (33.3%) | 66 (66.7%) |
| College or Associate's Degree | 105 (36.2%) | 185 (63.8%) |
| Bachelor's Degree | 65 (79.3%) | 17 (20.7%) |
| Graduate Degree | 0 (0.0%) | 0 (0.0%) |
| Total | 281 (50.4%) | 276 (49.5%) |
Income in Noble County
Income Overview in Noble County
Per Capita Income in Noble County is $31,953, while median incomes of families and households are $82,845 and $70,286 respectively.
| Characteristic | Number | Measure |
| Per Capita Income | 47,431 | $31,953 |
| Median Family Income | 12,158 | $82,845 |
| Mean Family Income | 12,158 | $94,133 |
| Median Household Income | 17,688 | $70,286 |
| Mean Household Income | 17,688 | $82,166 |
| Income Deficit | 12,158 | $9,685 |
| Wage / Income Gap (%) | 47,431 | 32.01% |
| Wage / Income Gap ($) | 47,431 | 67.99¢ per $1 |
| Gini / Inequality Index | 47,431 | 0.38 |
Earnings by Sex in Noble County
Average Earnings in Noble County are $41,624, $50,726 for men and $34,487 for women, a difference of 32.0%.
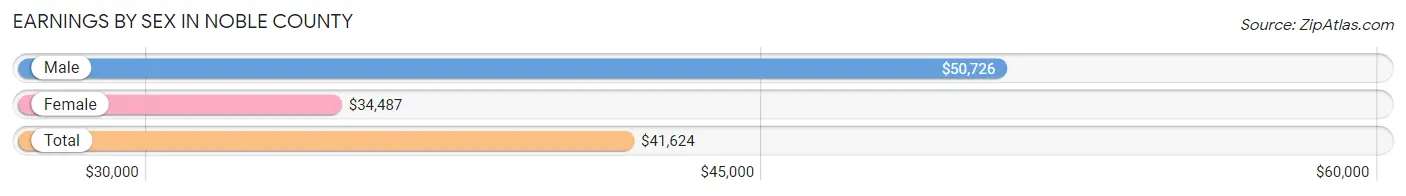
| Sex | Number | Average Earnings |
| Male | 13,923 (55.2%) | $50,726 |
| Female | 11,310 (44.8%) | $34,487 |
| Total | 25,233 (100.0%) | $41,624 |
Earnings by Sex by Income Bracket in Noble County
The most common earnings brackets in Noble County are $75,000 to $99,999 for men (1,850 | 13.3%) and $40,000 to $44,999 for women (973 | 8.6%).
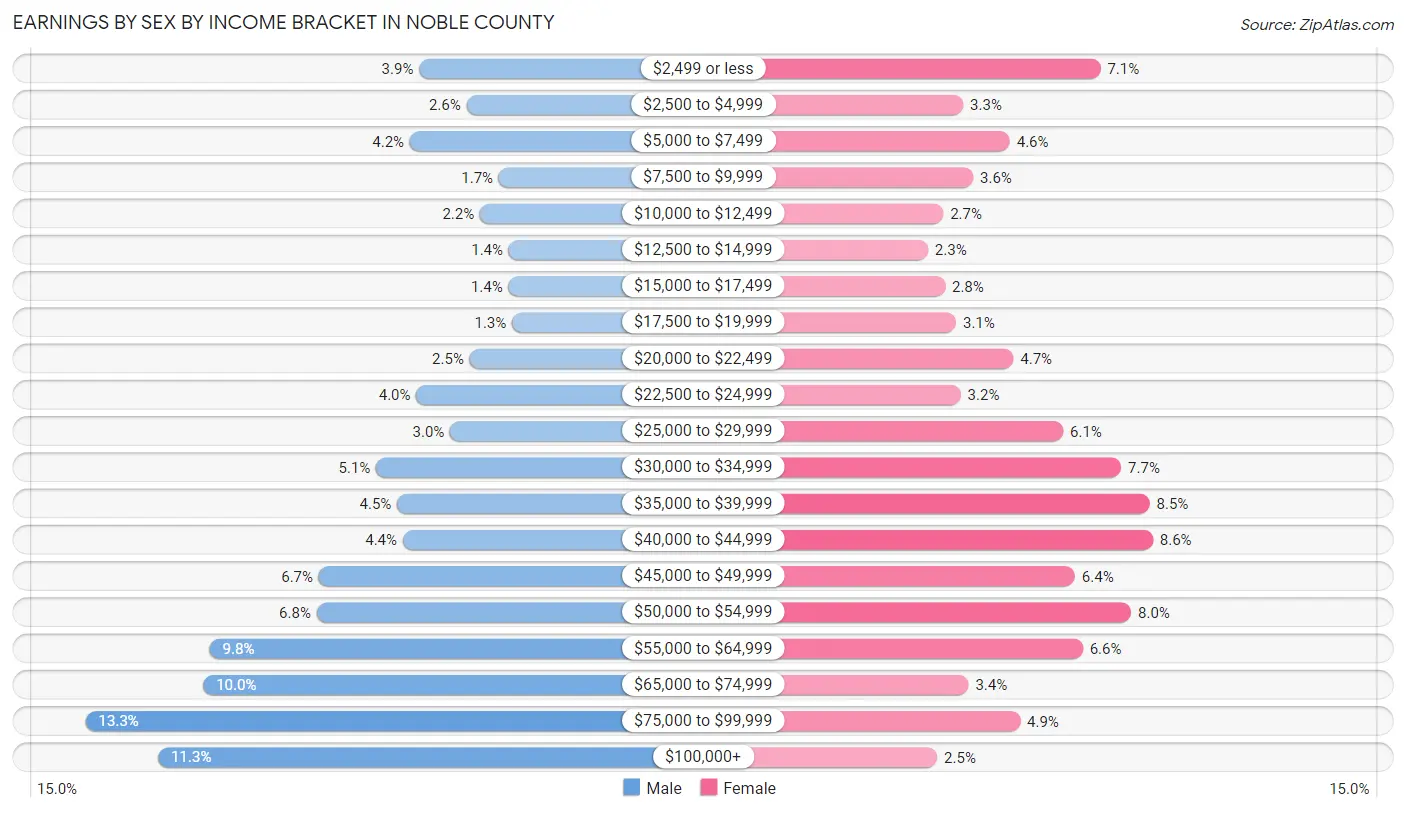
| Income | Male | Female |
| $2,499 or less | 545 (3.9%) | 806 (7.1%) |
| $2,500 to $4,999 | 359 (2.6%) | 370 (3.3%) |
| $5,000 to $7,499 | 580 (4.2%) | 518 (4.6%) |
| $7,500 to $9,999 | 233 (1.7%) | 402 (3.5%) |
| $10,000 to $12,499 | 307 (2.2%) | 307 (2.7%) |
| $12,500 to $14,999 | 194 (1.4%) | 258 (2.3%) |
| $15,000 to $17,499 | 195 (1.4%) | 312 (2.8%) |
| $17,500 to $19,999 | 181 (1.3%) | 347 (3.1%) |
| $20,000 to $22,499 | 346 (2.5%) | 529 (4.7%) |
| $22,500 to $24,999 | 556 (4.0%) | 362 (3.2%) |
| $25,000 to $29,999 | 423 (3.0%) | 688 (6.1%) |
| $30,000 to $34,999 | 713 (5.1%) | 872 (7.7%) |
| $35,000 to $39,999 | 631 (4.5%) | 962 (8.5%) |
| $40,000 to $44,999 | 609 (4.4%) | 973 (8.6%) |
| $45,000 to $49,999 | 937 (6.7%) | 725 (6.4%) |
| $50,000 to $54,999 | 945 (6.8%) | 904 (8.0%) |
| $55,000 to $64,999 | 1,364 (9.8%) | 750 (6.6%) |
| $65,000 to $74,999 | 1,389 (10.0%) | 387 (3.4%) |
| $75,000 to $99,999 | 1,850 (13.3%) | 551 (4.9%) |
| $100,000+ | 1,566 (11.3%) | 287 (2.5%) |
| Total | 13,923 (100.0%) | 11,310 (100.0%) |
Earnings by Sex by Educational Attainment in Noble County
Average earnings in Noble County are $55,266 for men and $37,107 for women, a difference of 32.9%. Men with an educational attainment of graduate degree enjoy the highest average annual earnings of $79,091, while those with high school diploma education earn the least with $48,571. Women with an educational attainment of graduate degree earn the most with the average annual earnings of $52,490, while those with less than high school education have the smallest earnings of $25,208.
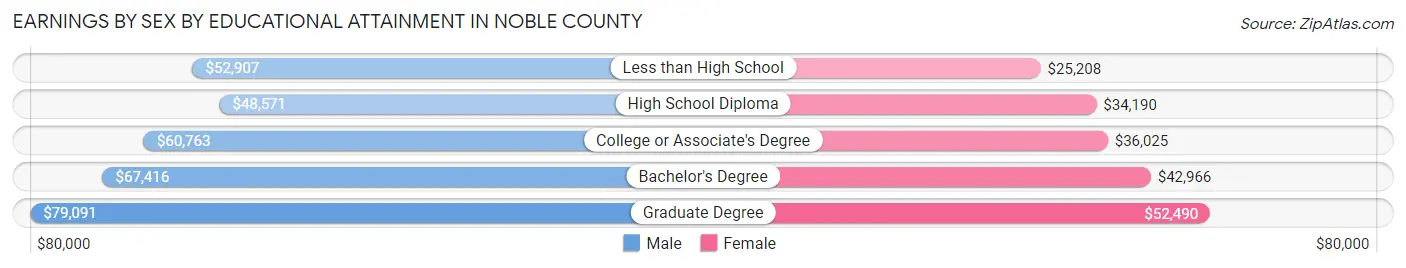
| Educational Attainment | Male Income | Female Income |
| Less than High School | $52,907 | $25,208 |
| High School Diploma | $48,571 | $34,190 |
| College or Associate's Degree | $60,763 | $36,025 |
| Bachelor's Degree | $67,416 | $42,966 |
| Graduate Degree | $79,091 | $52,490 |
| Total | $55,266 | $37,107 |
Family Income in Noble County
Family Income Brackets in Noble County
According to the Noble County family income data, there are 2,796 families falling into the $100,000 to $149,999 income range, which is the most common income bracket and makes up 23.0% of all families. Conversely, the less than $10,000 income bracket is the least frequent group with only 170 families (1.4%) belonging to this category.
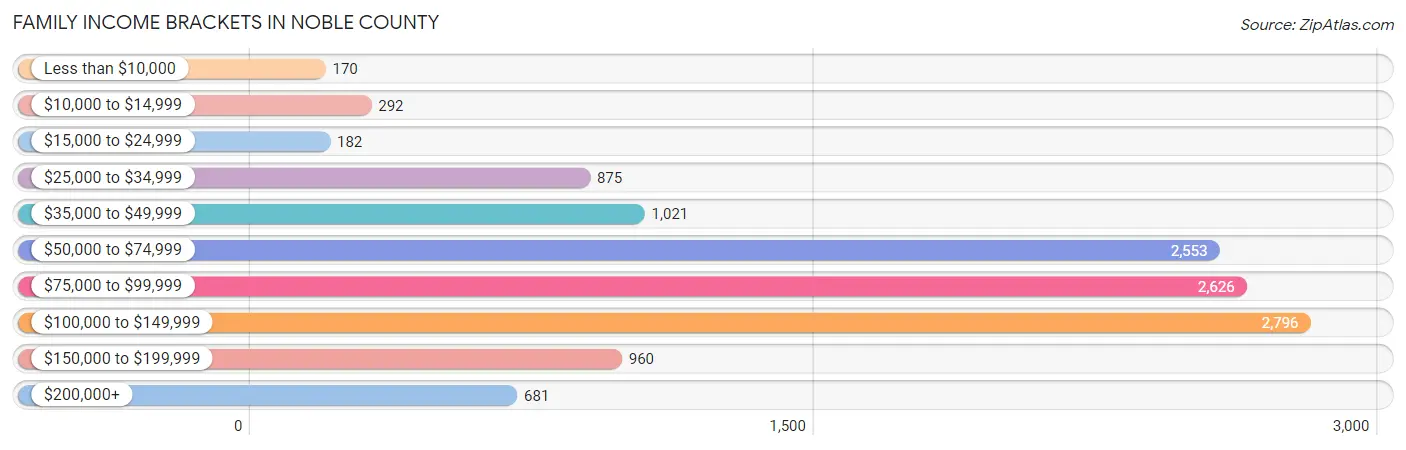
| Income Bracket | # Families | % Families |
| Less than $10,000 | 170 | 1.4% |
| $10,000 to $14,999 | 292 | 2.4% |
| $15,000 to $24,999 | 182 | 1.5% |
| $25,000 to $34,999 | 875 | 7.2% |
| $35,000 to $49,999 | 1,021 | 8.4% |
| $50,000 to $74,999 | 2,553 | 21.0% |
| $75,000 to $99,999 | 2,626 | 21.6% |
| $100,000 to $149,999 | 2,796 | 23.0% |
| $150,000 to $199,999 | 960 | 7.9% |
| $200,000+ | 681 | 5.6% |
Family Income by Famaliy Size in Noble County
6-person families (603 | 5.0%) account for the highest median family income in Noble County with $103,463 per family, while 2-person families (5,676 | 46.7%) have the highest median income of $36,524 per family member.
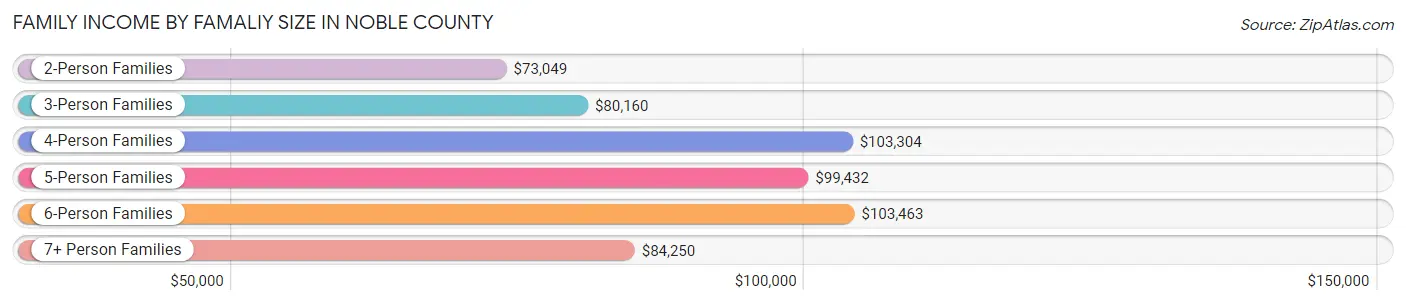
| Income Bracket | # Families | Median Income |
| 2-Person Families | 5,676 (46.7%) | $73,049 |
| 3-Person Families | 2,530 (20.8%) | $80,160 |
| 4-Person Families | 2,118 (17.4%) | $103,304 |
| 5-Person Families | 995 (8.2%) | $99,432 |
| 6-Person Families | 603 (5.0%) | $103,463 |
| 7+ Person Families | 236 (1.9%) | $84,250 |
| Total | 12,158 (100.0%) | $82,845 |
Family Income by Number of Earners in Noble County
The median family income in Noble County is $82,845, with families comprising 3+ earners (1,746) having the highest median family income of $134,167, while families with no earners (1,700) have the lowest median family income of $43,476, accounting for 14.4% and 14.0% of families, respectively.
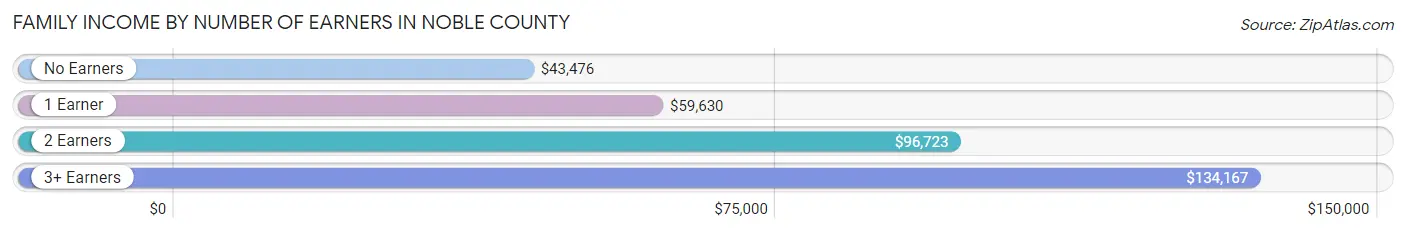
| Number of Earners | # Families | Median Income |
| No Earners | 1,700 (14.0%) | $43,476 |
| 1 Earner | 3,415 (28.1%) | $59,630 |
| 2 Earners | 5,297 (43.6%) | $96,723 |
| 3+ Earners | 1,746 (14.4%) | $134,167 |
| Total | 12,158 (100.0%) | $82,845 |
Household Income in Noble County
Household Income Brackets in Noble County
With 3,661 households falling in the category, the $50,000 to $74,999 income range is the most frequent in Noble County, accounting for 20.7% of all households. In contrast, only 460 households (2.6%) fall into the less than $10,000 income bracket, making it the least populous group.
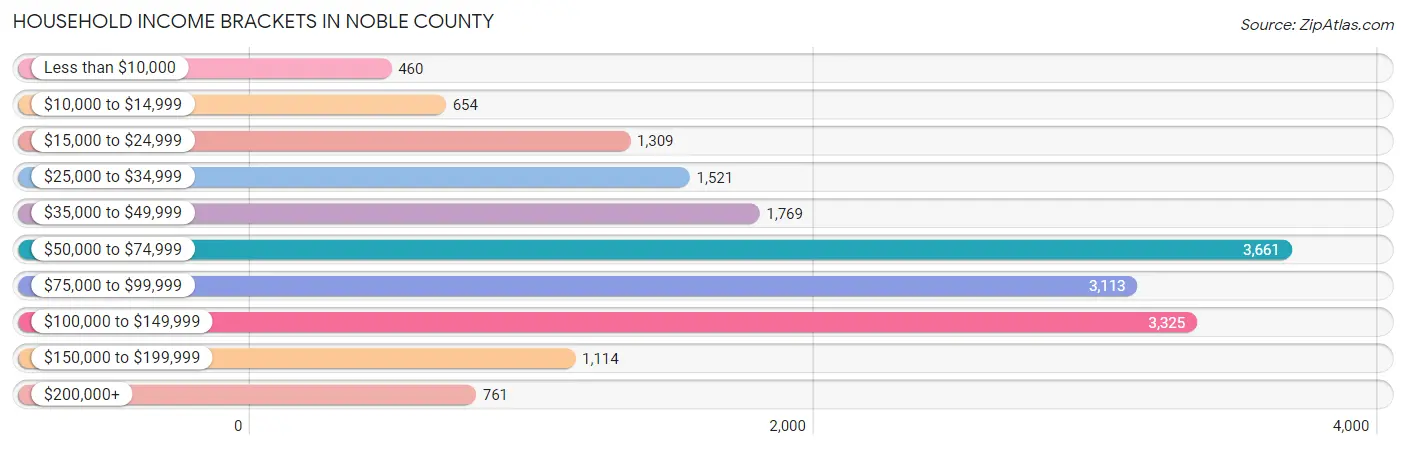
| Income Bracket | # Households | % Households |
| Less than $10,000 | 460 | 2.6% |
| $10,000 to $14,999 | 654 | 3.7% |
| $15,000 to $24,999 | 1,309 | 7.4% |
| $25,000 to $34,999 | 1,521 | 8.6% |
| $35,000 to $49,999 | 1,769 | 10.0% |
| $50,000 to $74,999 | 3,661 | 20.7% |
| $75,000 to $99,999 | 3,113 | 17.6% |
| $100,000 to $149,999 | 3,325 | 18.8% |
| $150,000 to $199,999 | 1,114 | 6.3% |
| $200,000+ | 761 | 4.3% |
Household Income by Householder Age in Noble County
The median household income in Noble County is $70,286, with the highest median household income of $81,642 found in the 45 to 64 years age bracket for the primary householder. A total of 6,987 households (39.5%) fall into this category. Meanwhile, the 65+ years age bracket for the primary householder has the lowest median household income of $50,642, with 4,766 households (26.9%) in this group.
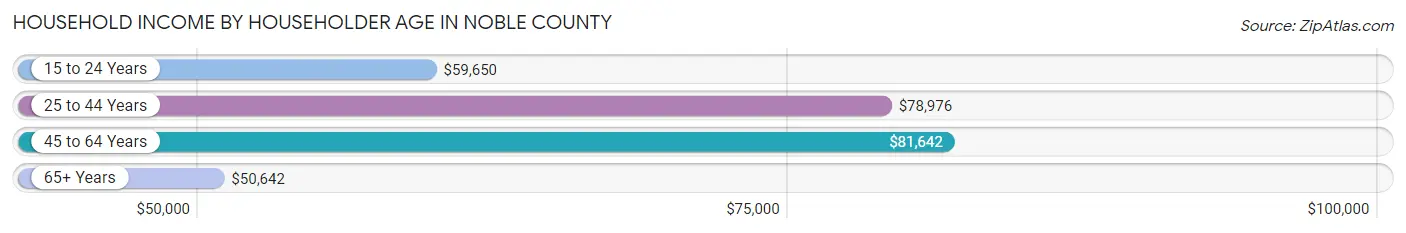
| Income Bracket | # Households | Median Income |
| 15 to 24 Years | 628 (3.5%) | $59,650 |
| 25 to 44 Years | 5,307 (30.0%) | $78,976 |
| 45 to 64 Years | 6,987 (39.5%) | $81,642 |
| 65+ Years | 4,766 (26.9%) | $50,642 |
| Total | 17,688 (100.0%) | $70,286 |
Poverty in Noble County
Income Below Poverty by Sex and Age in Noble County
With 6.2% poverty level for males and 8.3% for females among the residents of Noble County, 15 year old males and under 5 year old females are the most vulnerable to poverty, with 62 males (16.6%) and 179 females (12.5%) in their respective age groups living below the poverty level.
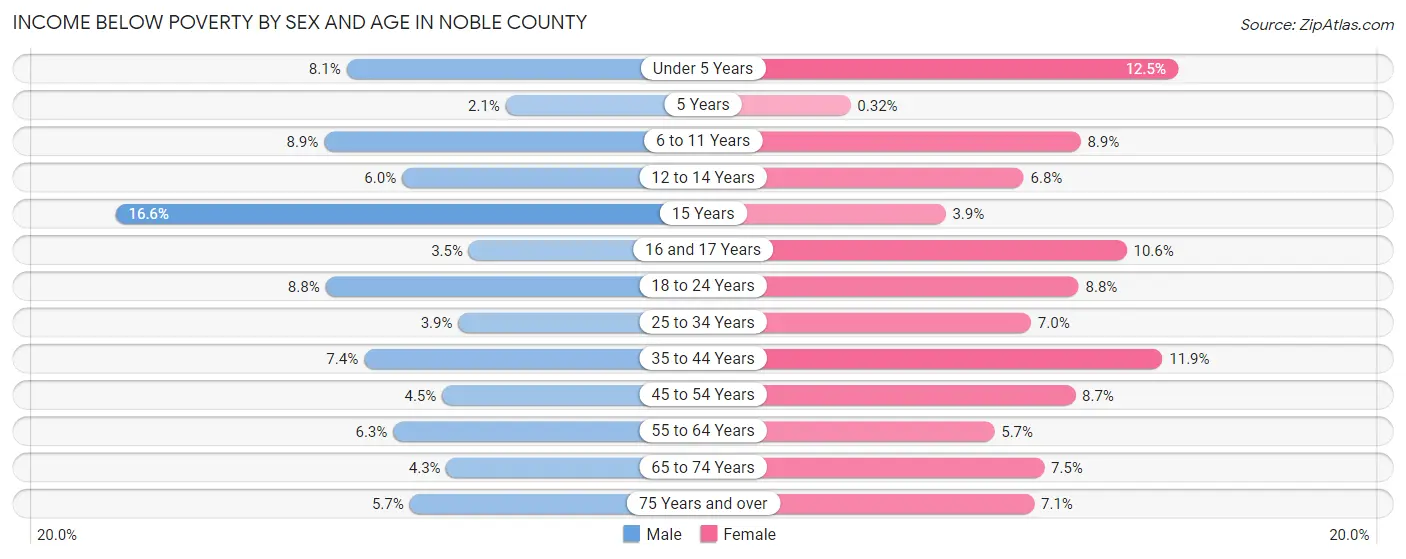
| Age Bracket | Male | Female |
| Under 5 Years | 119 (8.1%) | 179 (12.5%) |
| 5 Years | 6 (2.1%) | 1 (0.3%) |
| 6 to 11 Years | 161 (8.9%) | 175 (8.9%) |
| 12 to 14 Years | 66 (6.0%) | 51 (6.8%) |
| 15 Years | 62 (16.6%) | 12 (3.8%) |
| 16 and 17 Years | 23 (3.5%) | 70 (10.6%) |
| 18 to 24 Years | 181 (8.8%) | 169 (8.8%) |
| 25 to 34 Years | 109 (3.9%) | 197 (7.0%) |
| 35 to 44 Years | 212 (7.4%) | 324 (11.9%) |
| 45 to 54 Years | 138 (4.5%) | 256 (8.7%) |
| 55 to 64 Years | 219 (6.3%) | 182 (5.7%) |
| 65 to 74 Years | 102 (4.3%) | 178 (7.5%) |
| 75 Years and over | 65 (5.7%) | 109 (7.1%) |
| Total | 1,463 (6.2%) | 1,903 (8.3%) |
Income Above Poverty by Sex and Age in Noble County
According to the poverty statistics in Noble County, males aged 5 years and females aged 5 years are the age groups that are most secure financially, with 97.9% of males and 99.7% of females in these age groups living above the poverty line.
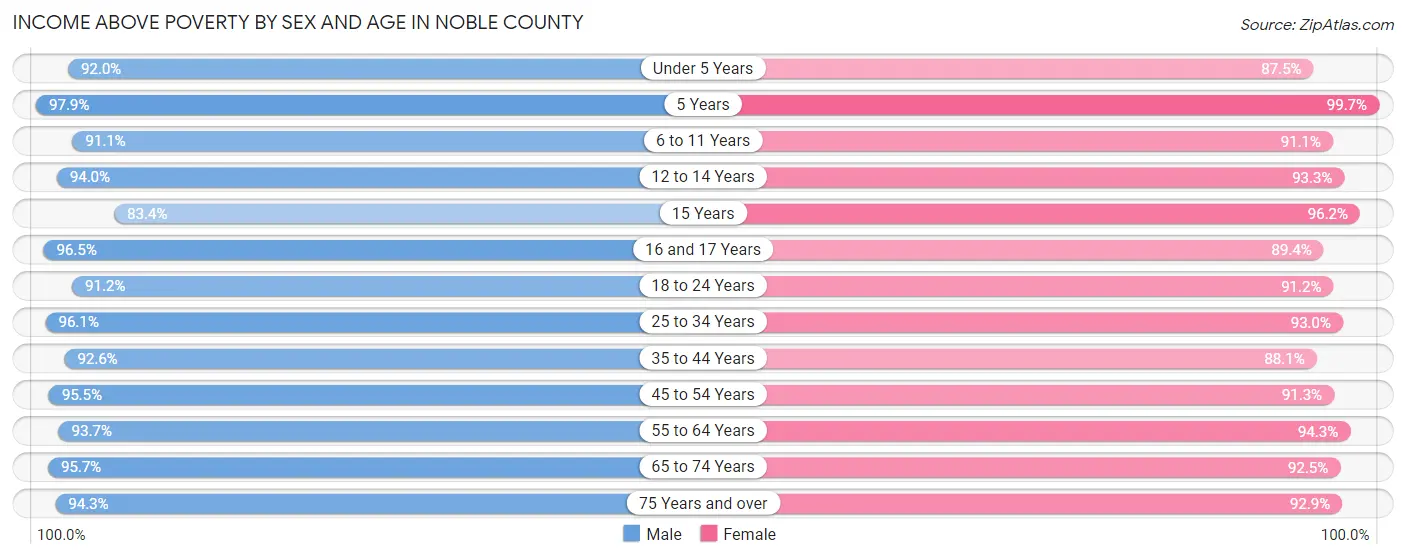
| Age Bracket | Male | Female |
| Under 5 Years | 1,360 (91.9%) | 1,257 (87.5%) |
| 5 Years | 274 (97.9%) | 313 (99.7%) |
| 6 to 11 Years | 1,652 (91.1%) | 1,801 (91.1%) |
| 12 to 14 Years | 1,035 (94.0%) | 704 (93.2%) |
| 15 Years | 311 (83.4%) | 300 (96.2%) |
| 16 and 17 Years | 633 (96.5%) | 592 (89.4%) |
| 18 to 24 Years | 1,869 (91.2%) | 1,753 (91.2%) |
| 25 to 34 Years | 2,686 (96.1%) | 2,611 (93.0%) |
| 35 to 44 Years | 2,652 (92.6%) | 2,399 (88.1%) |
| 45 to 54 Years | 2,932 (95.5%) | 2,701 (91.3%) |
| 55 to 64 Years | 3,244 (93.7%) | 3,033 (94.3%) |
| 65 to 74 Years | 2,249 (95.7%) | 2,191 (92.5%) |
| 75 Years and over | 1,073 (94.3%) | 1,418 (92.9%) |
| Total | 21,970 (93.8%) | 21,073 (91.7%) |
Income Below Poverty Among Married-Couple Families in Noble County
The poverty statistics for married-couple families in Noble County show that 2.9% or 280 of the total 9,514 families live below the poverty line. Families with 5 or more children have the highest poverty rate of 6.1%, comprising of 12 families. On the other hand, families with no children have the lowest poverty rate of 2.1%, which includes 111 families.
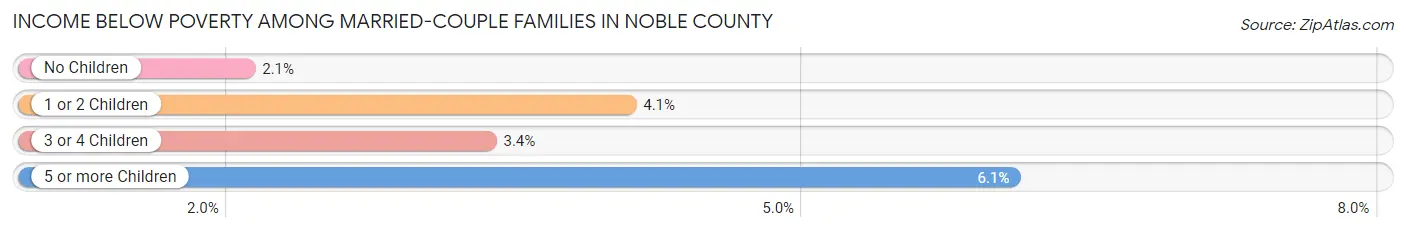
| Children | Above Poverty | Below Poverty |
| No Children | 5,190 (97.9%) | 111 (2.1%) |
| 1 or 2 Children | 2,936 (95.9%) | 125 (4.1%) |
| 3 or 4 Children | 923 (96.7%) | 32 (3.4%) |
| 5 or more Children | 185 (93.9%) | 12 (6.1%) |
| Total | 9,234 (97.1%) | 280 (2.9%) |
Income Below Poverty Among Single-Parent Households in Noble County
According to the poverty data in Noble County, 11.1% or 98 single-father households and 18.0% or 317 single-mother households are living below the poverty line. Among single-father households, those with 5 or more children have the highest poverty rate, with 8 households (100.0%) experiencing poverty. Likewise, among single-mother households, those with 3 or 4 children have the highest poverty rate, with 47 households (29.4%) falling below the poverty line.
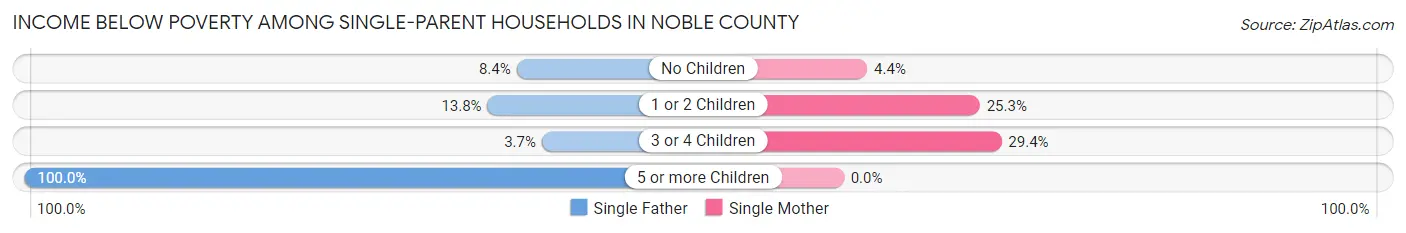
| Children | Single Father | Single Mother |
| No Children | 35 (8.4%) | 28 (4.4%) |
| 1 or 2 Children | 52 (13.8%) | 242 (25.3%) |
| 3 or 4 Children | 3 (3.7%) | 47 (29.4%) |
| 5 or more Children | 8 (100.0%) | 0 (0.0%) |
| Total | 98 (11.1%) | 317 (18.0%) |
Income Below Poverty Among Married-Couple vs Single-Parent Households in Noble County
The poverty data for Noble County shows that 280 of the married-couple family households (2.9%) and 415 of the single-parent households (15.7%) are living below the poverty level. Within the married-couple family households, those with 5 or more children have the highest poverty rate, with 12 households (6.1%) falling below the poverty line. Among the single-parent households, those with 5 or more children have the highest poverty rate, with 8 household (61.5%) living below poverty.
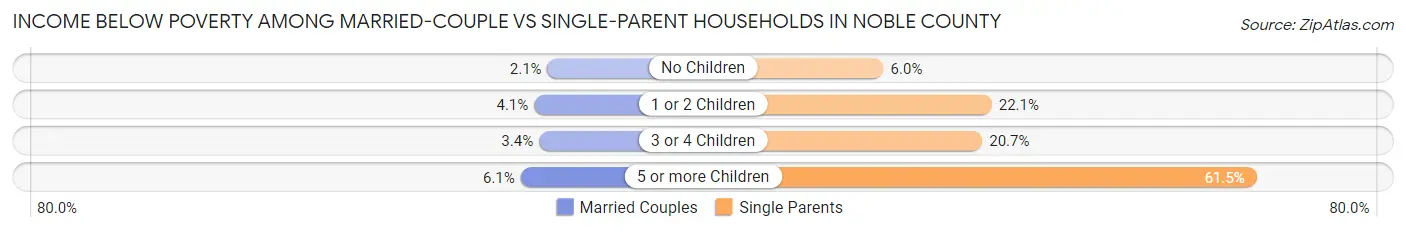
| Children | Married-Couple Families | Single-Parent Households |
| No Children | 111 (2.1%) | 63 (6.0%) |
| 1 or 2 Children | 125 (4.1%) | 294 (22.1%) |
| 3 or 4 Children | 32 (3.4%) | 50 (20.7%) |
| 5 or more Children | 12 (6.1%) | 8 (61.5%) |
| Total | 280 (2.9%) | 415 (15.7%) |
Employment Characteristics in Noble County
Employment by Class of Employer in Noble County
Among the 22,483 employed individuals in Noble County, private company employees (16,673 | 74.2%), local government employees (1,578 | 7.0%), and not-for-profit organizations (1,528 | 6.8%) make up the most common classes of employment.
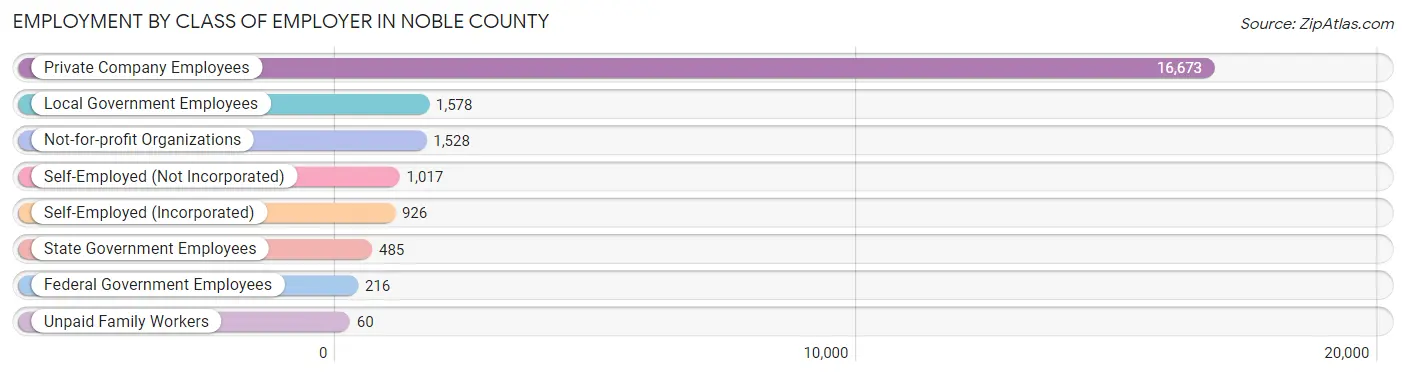
| Employer Class | # Employees | % Employees |
| Private Company Employees | 16,673 | 74.2% |
| Self-Employed (Incorporated) | 926 | 4.1% |
| Self-Employed (Not Incorporated) | 1,017 | 4.5% |
| Not-for-profit Organizations | 1,528 | 6.8% |
| Local Government Employees | 1,578 | 7.0% |
| State Government Employees | 485 | 2.2% |
| Federal Government Employees | 216 | 1.0% |
| Unpaid Family Workers | 60 | 0.3% |
| Total | 22,483 | 100.0% |
Employment Status by Age in Noble County
According to the labor force statistics for Noble County, out of the total population over 16 years of age (37,251), 63.8% or 23,766 individuals are in the labor force, with 3.4% or 808 of them unemployed. The age group with the highest labor force participation rate is 45 to 54 years, with 85.2% or 5,157 individuals in the labor force. Within the labor force, the 75 years and over age range has the highest percentage of unemployed individuals, with 20.8% or 31 of them being unemployed.
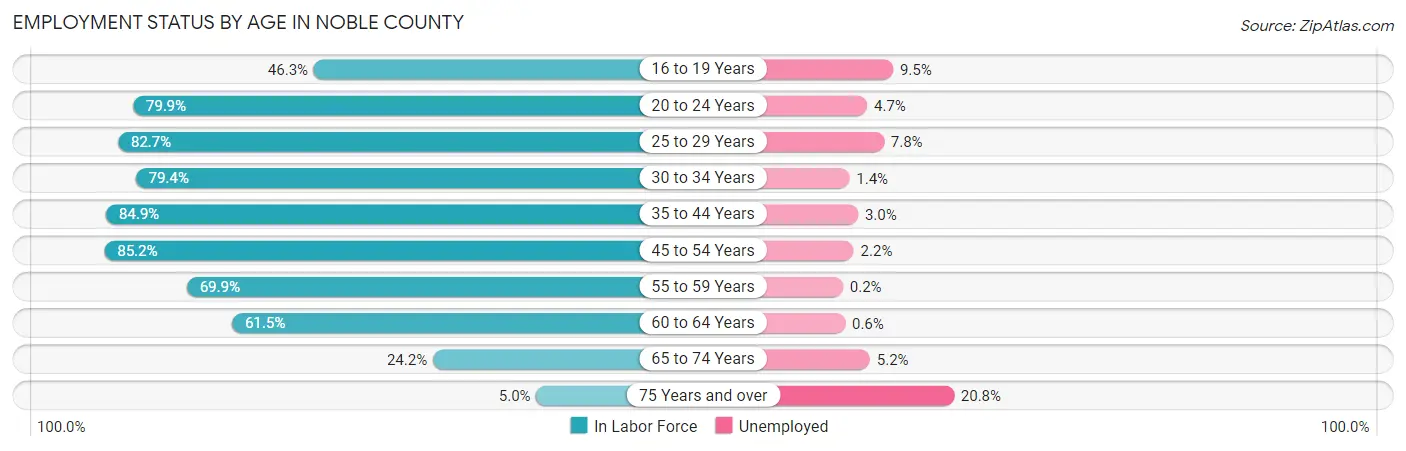
| Age Bracket | In Labor Force | Unemployed |
| 16 to 19 Years | 1,159 (46.3%) | 110 (9.5%) |
| 20 to 24 Years | 2,280 (79.9%) | 107 (4.7%) |
| 25 to 29 Years | 2,438 (82.7%) | 190 (7.8%) |
| 30 to 34 Years | 2,162 (79.4%) | 30 (1.4%) |
| 35 to 44 Years | 4,811 (84.9%) | 144 (3.0%) |
| 45 to 54 Years | 5,157 (85.2%) | 113 (2.2%) |
| 55 to 59 Years | 2,486 (69.9%) | 5 (0.2%) |
| 60 to 64 Years | 1,950 (61.5%) | 12 (0.6%) |
| 65 to 74 Years | 1,165 (24.2%) | 61 (5.2%) |
| 75 Years and over | 148 (5.0%) | 31 (20.8%) |
| Total | 23,766 (63.8%) | 808 (3.4%) |
Employment Status by Educational Attainment in Noble County
According to labor force statistics for Noble County, 78.8% of individuals (19,006) out of the total population between 25 and 64 years of age (24,119) are in the labor force, with 2.6% or 494 of them being unemployed. The group with the highest labor force participation rate are those with the educational attainment of bachelor's degree or higher, with 89.7% or 3,881 individuals in the labor force. Within the labor force, individuals with less than high school education have the highest percentage of unemployment, with 3.8% or 106 of them being unemployed.
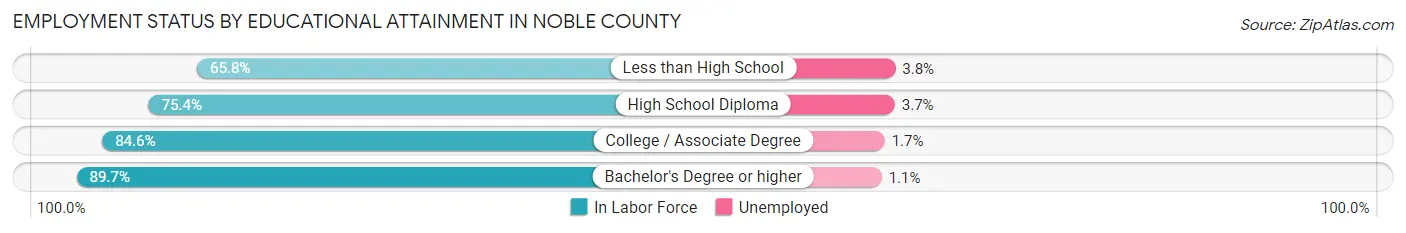
| Educational Attainment | In Labor Force | Unemployed |
| Less than High School | 2,789 (65.8%) | 161 (3.8%) |
| High School Diploma | 6,745 (75.4%) | 331 (3.7%) |
| College / Associate Degree | 5,590 (84.6%) | 112 (1.7%) |
| Bachelor's Degree or higher | 3,881 (89.7%) | 48 (1.1%) |
| Total | 19,006 (78.8%) | 627 (2.6%) |
Employment Occupations by Sex in Noble County
Management, Business, Science and Arts Occupations
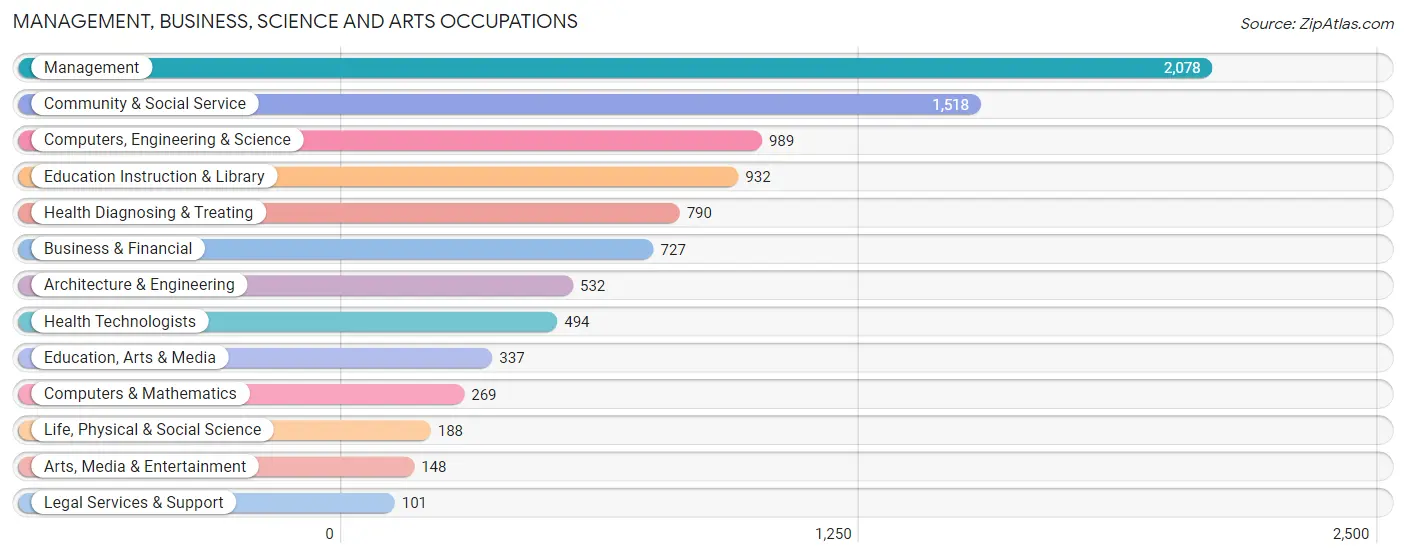
The most common Management, Business, Science and Arts occupations in Noble County are Management (2,078 | 9.0%), Community & Social Service (1,518 | 6.6%), Computers, Engineering & Science (989 | 4.3%), Education Instruction & Library (932 | 4.1%), and Health Diagnosing & Treating (790 | 3.4%).
Management, Business, Science and Arts Occupations by Sex
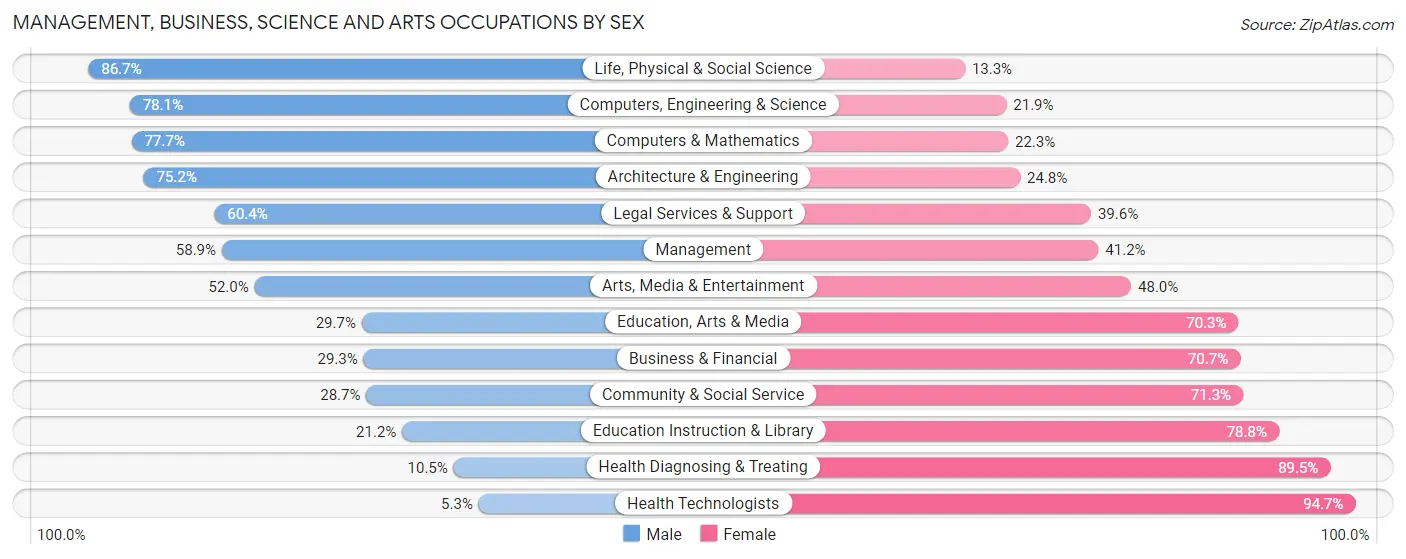
Within the Management, Business, Science and Arts occupations in Noble County, the most male-oriented occupations are Life, Physical & Social Science (86.7%), Computers, Engineering & Science (78.1%), and Computers & Mathematics (77.7%), while the most female-oriented occupations are Health Technologists (94.7%), Health Diagnosing & Treating (89.5%), and Education Instruction & Library (78.8%).
| Occupation | Male | Female |
| Management | 1,223 (58.9%) | 855 (41.1%) |
| Business & Financial | 213 (29.3%) | 514 (70.7%) |
| Computers, Engineering & Science | 772 (78.1%) | 217 (21.9%) |
| Computers & Mathematics | 209 (77.7%) | 60 (22.3%) |
| Architecture & Engineering | 400 (75.2%) | 132 (24.8%) |
| Life, Physical & Social Science | 163 (86.7%) | 25 (13.3%) |
| Community & Social Service | 436 (28.7%) | 1,082 (71.3%) |
| Education, Arts & Media | 100 (29.7%) | 237 (70.3%) |
| Legal Services & Support | 61 (60.4%) | 40 (39.6%) |
| Education Instruction & Library | 198 (21.2%) | 734 (78.8%) |
| Arts, Media & Entertainment | 77 (52.0%) | 71 (48.0%) |
| Health Diagnosing & Treating | 83 (10.5%) | 707 (89.5%) |
| Health Technologists | 26 (5.3%) | 468 (94.7%) |
| Total (Category) | 2,727 (44.7%) | 3,375 (55.3%) |
| Total (Overall) | 12,830 (55.9%) | 10,120 (44.1%) |
Services Occupations
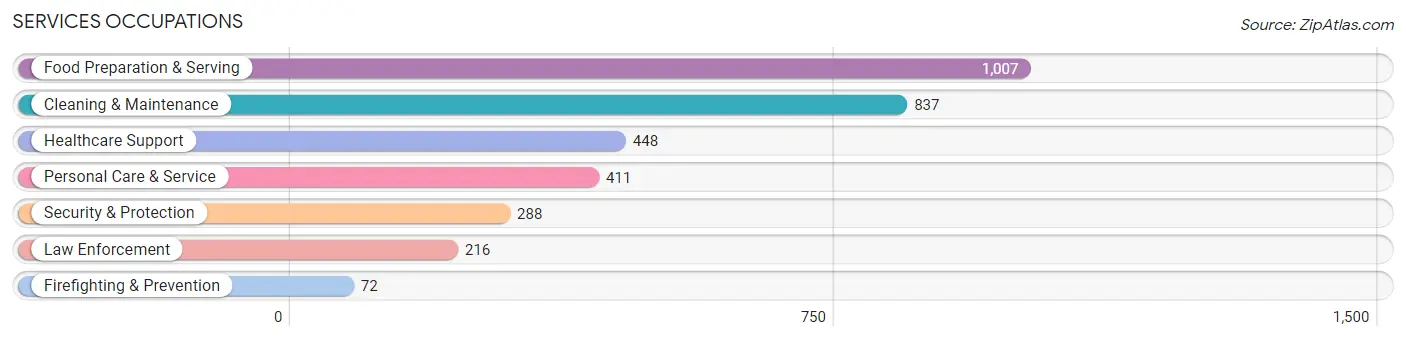
The most common Services occupations in Noble County are Food Preparation & Serving (1,007 | 4.4%), Cleaning & Maintenance (837 | 3.6%), Healthcare Support (448 | 1.9%), Personal Care & Service (411 | 1.8%), and Security & Protection (288 | 1.3%).
Services Occupations by Sex
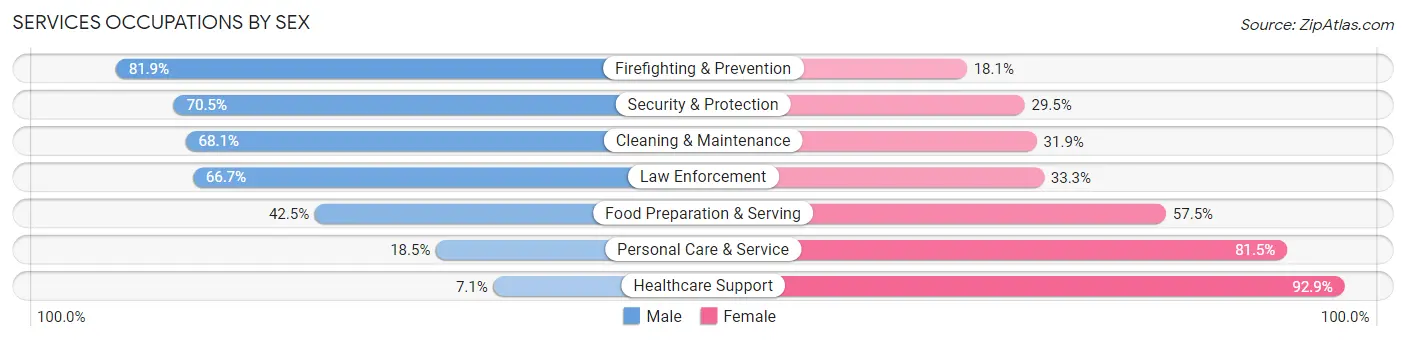
Within the Services occupations in Noble County, the most male-oriented occupations are Firefighting & Prevention (81.9%), Security & Protection (70.5%), and Cleaning & Maintenance (68.1%), while the most female-oriented occupations are Healthcare Support (92.9%), Personal Care & Service (81.5%), and Food Preparation & Serving (57.5%).
| Occupation | Male | Female |
| Healthcare Support | 32 (7.1%) | 416 (92.9%) |
| Security & Protection | 203 (70.5%) | 85 (29.5%) |
| Firefighting & Prevention | 59 (81.9%) | 13 (18.1%) |
| Law Enforcement | 144 (66.7%) | 72 (33.3%) |
| Food Preparation & Serving | 428 (42.5%) | 579 (57.5%) |
| Cleaning & Maintenance | 570 (68.1%) | 267 (31.9%) |
| Personal Care & Service | 76 (18.5%) | 335 (81.5%) |
| Total (Category) | 1,309 (43.8%) | 1,682 (56.2%) |
| Total (Overall) | 12,830 (55.9%) | 10,120 (44.1%) |
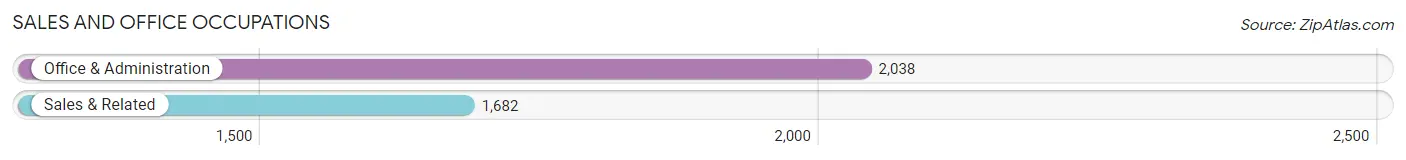
Sales and Office Occupations
The most common Sales and Office occupations in Noble County are Office & Administration (2,038 | 8.9%), and Sales & Related (1,682 | 7.3%).
Sales and Office Occupations by Sex
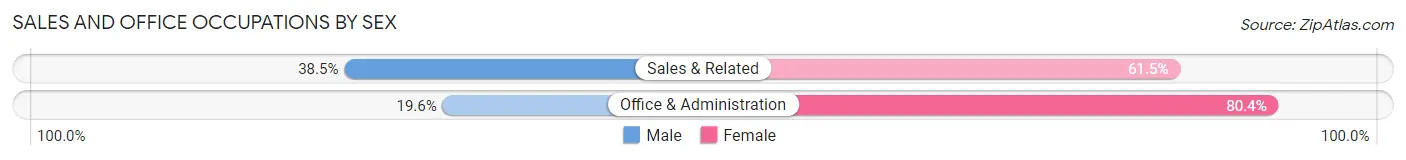
| Occupation | Male | Female |
| Sales & Related | 648 (38.5%) | 1,034 (61.5%) |
| Office & Administration | 400 (19.6%) | 1,638 (80.4%) |
| Total (Category) | 1,048 (28.2%) | 2,672 (71.8%) |
| Total (Overall) | 12,830 (55.9%) | 10,120 (44.1%) |
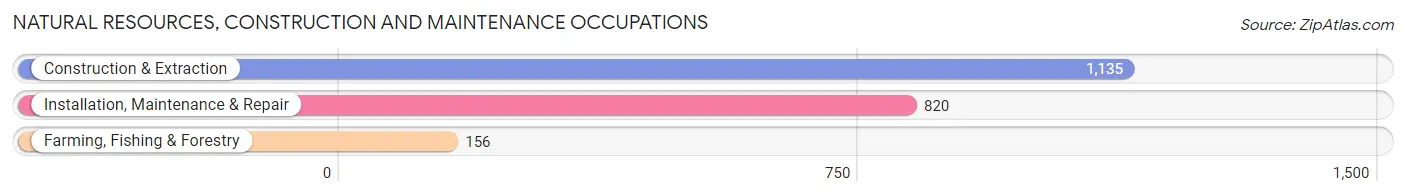
Natural Resources, Construction and Maintenance Occupations
The most common Natural Resources, Construction and Maintenance occupations in Noble County are Construction & Extraction (1,135 | 5.0%), Installation, Maintenance & Repair (820 | 3.6%), and Farming, Fishing & Forestry (156 | 0.7%).
Natural Resources, Construction and Maintenance Occupations by Sex
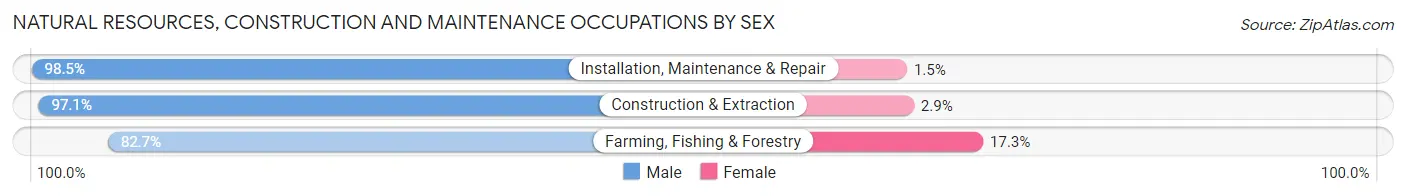
| Occupation | Male | Female |
| Farming, Fishing & Forestry | 129 (82.7%) | 27 (17.3%) |
| Construction & Extraction | 1,102 (97.1%) | 33 (2.9%) |
| Installation, Maintenance & Repair | 808 (98.5%) | 12 (1.5%) |
| Total (Category) | 2,039 (96.6%) | 72 (3.4%) |
| Total (Overall) | 12,830 (55.9%) | 10,120 (44.1%) |
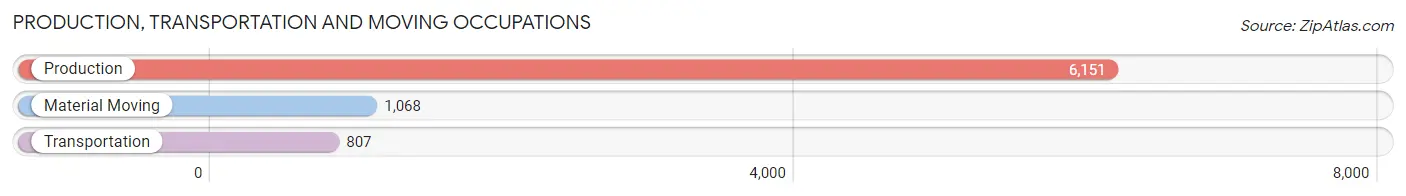
Production, Transportation and Moving Occupations
The most common Production, Transportation and Moving occupations in Noble County are Production (6,151 | 26.8%), Material Moving (1,068 | 4.6%), and Transportation (807 | 3.5%).
Production, Transportation and Moving Occupations by Sex
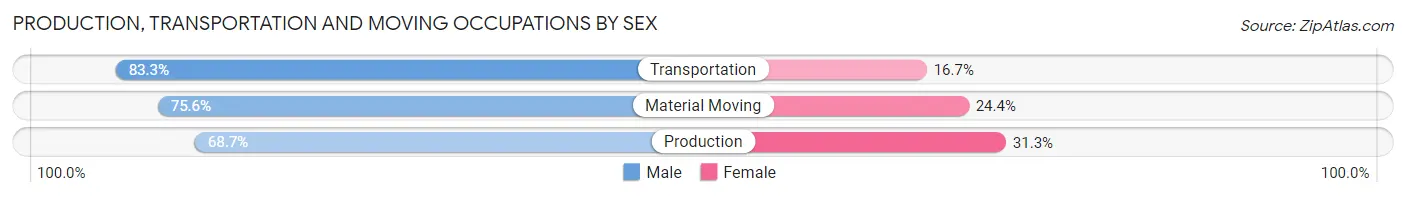
| Occupation | Male | Female |
| Production | 4,228 (68.7%) | 1,923 (31.3%) |
| Transportation | 672 (83.3%) | 135 (16.7%) |
| Material Moving | 807 (75.6%) | 261 (24.4%) |
| Total (Category) | 5,707 (71.1%) | 2,319 (28.9%) |
| Total (Overall) | 12,830 (55.9%) | 10,120 (44.1%) |
Employment Industries by Sex in Noble County
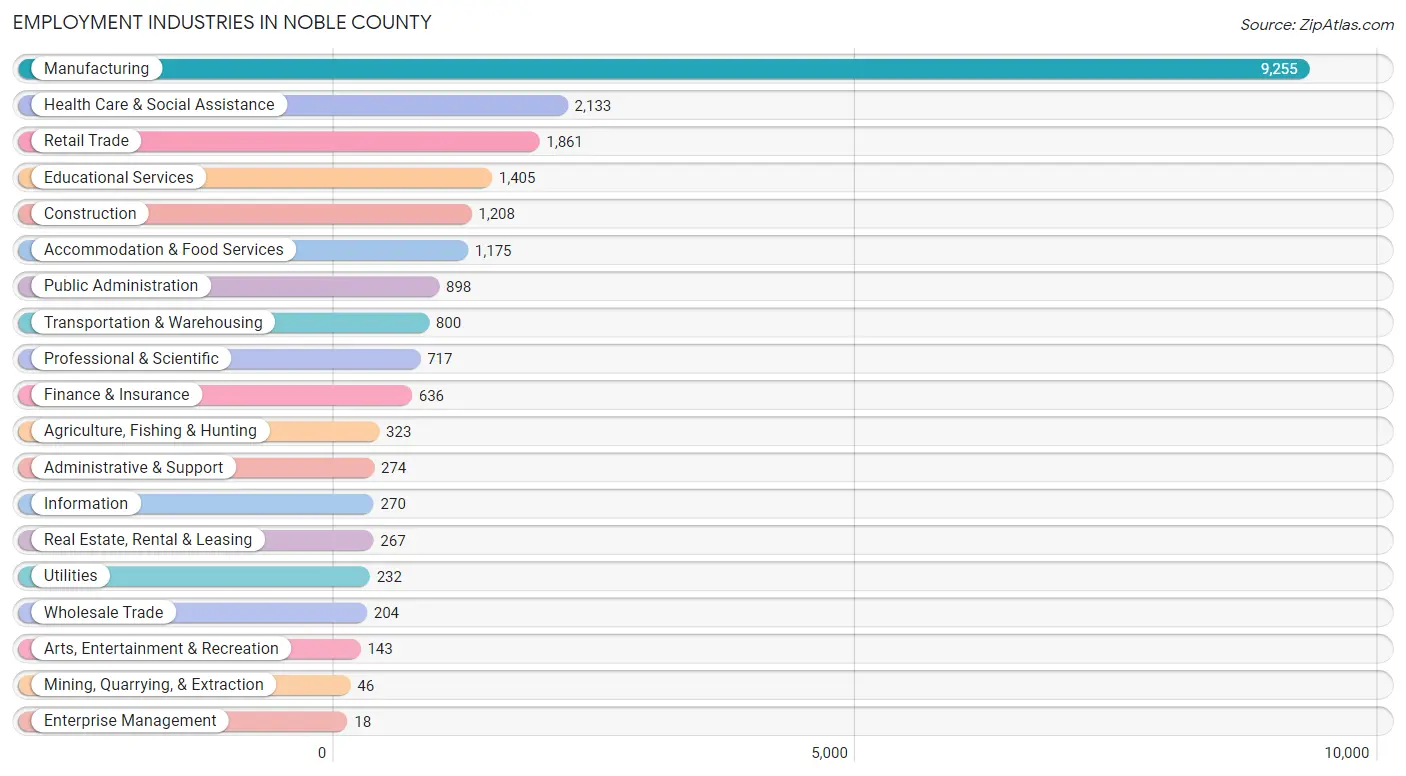
Employment Industries in Noble County
The major employment industries in Noble County include Manufacturing (9,255 | 40.3%), Health Care & Social Assistance (2,133 | 9.3%), Retail Trade (1,861 | 8.1%), Educational Services (1,405 | 6.1%), and Construction (1,208 | 5.3%).
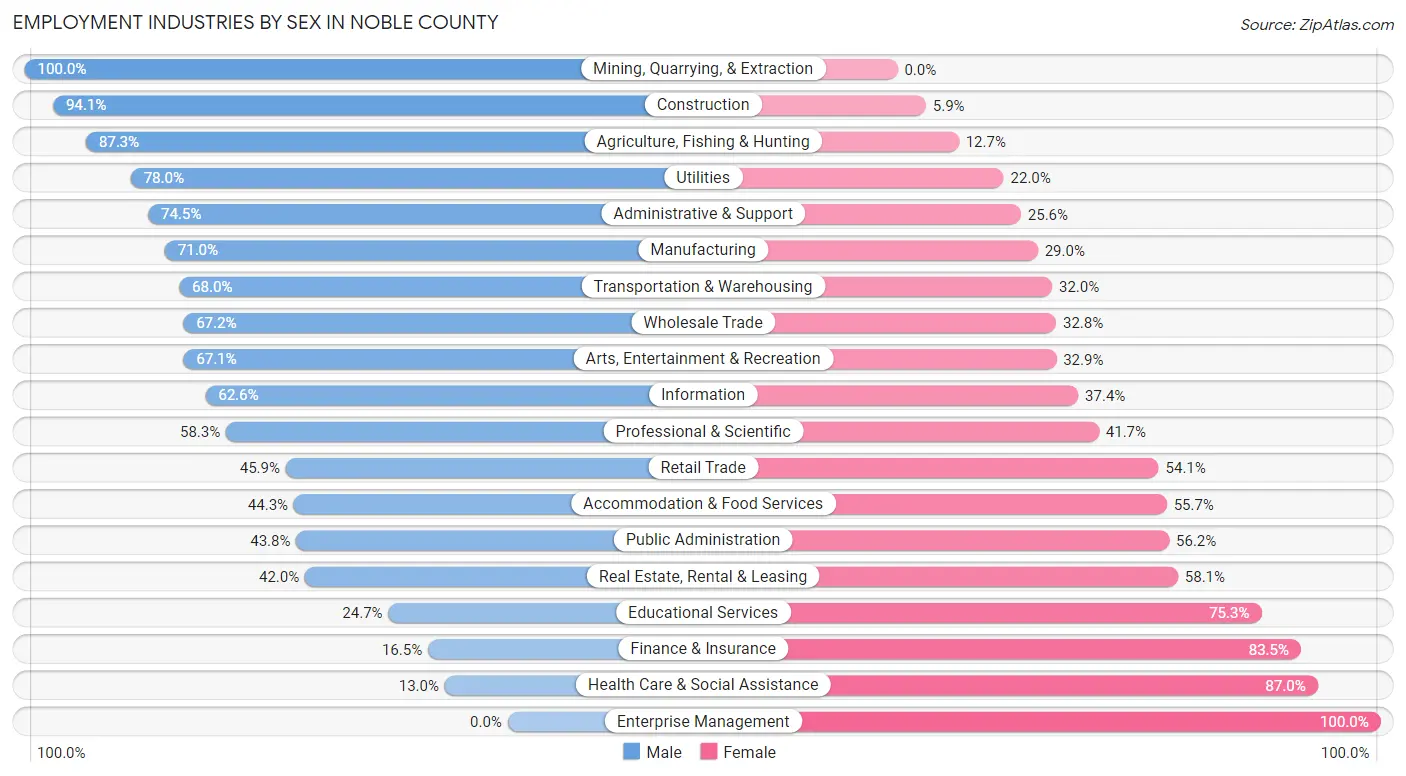
Employment Industries by Sex in Noble County
The Noble County industries that see more men than women are Mining, Quarrying, & Extraction (100.0%), Construction (94.1%), and Agriculture, Fishing & Hunting (87.3%), whereas the industries that tend to have a higher number of women are Enterprise Management (100.0%), Health Care & Social Assistance (87.0%), and Finance & Insurance (83.5%).
| Industry | Male | Female |
| Agriculture, Fishing & Hunting | 282 (87.3%) | 41 (12.7%) |
| Mining, Quarrying, & Extraction | 46 (100.0%) | 0 (0.0%) |
| Construction | 1,137 (94.1%) | 71 (5.9%) |
| Manufacturing | 6,567 (71.0%) | 2,688 (29.0%) |
| Wholesale Trade | 137 (67.2%) | 67 (32.8%) |
| Retail Trade | 855 (45.9%) | 1,006 (54.1%) |
| Transportation & Warehousing | 544 (68.0%) | 256 (32.0%) |
| Utilities | 181 (78.0%) | 51 (22.0%) |
| Information | 169 (62.6%) | 101 (37.4%) |
| Finance & Insurance | 105 (16.5%) | 531 (83.5%) |
| Real Estate, Rental & Leasing | 112 (41.9%) | 155 (58.1%) |
| Professional & Scientific | 418 (58.3%) | 299 (41.7%) |
| Enterprise Management | 0 (0.0%) | 18 (100.0%) |
| Administrative & Support | 204 (74.5%) | 70 (25.6%) |
| Educational Services | 347 (24.7%) | 1,058 (75.3%) |
| Health Care & Social Assistance | 278 (13.0%) | 1,855 (87.0%) |
| Arts, Entertainment & Recreation | 96 (67.1%) | 47 (32.9%) |
| Accommodation & Food Services | 520 (44.3%) | 655 (55.7%) |
| Public Administration | 393 (43.8%) | 505 (56.2%) |
| Total | 12,830 (55.9%) | 10,120 (44.1%) |
Education in Noble County
School Enrollment in Noble County
The most common levels of schooling among the 10,194 students in Noble County are high school (2,661 | 26.1%), elementary school (2,578 | 25.3%), and middle school (2,378 | 23.3%).
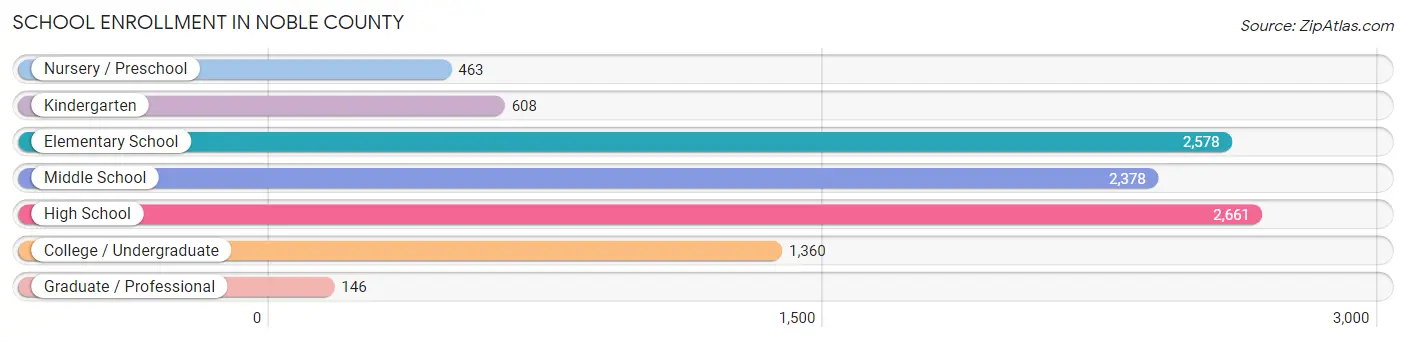
| School Level | # Students | % Students |
| Nursery / Preschool | 463 | 4.5% |
| Kindergarten | 608 | 6.0% |
| Elementary School | 2,578 | 25.3% |
| Middle School | 2,378 | 23.3% |
| High School | 2,661 | 26.1% |
| College / Undergraduate | 1,360 | 13.3% |
| Graduate / Professional | 146 | 1.4% |
| Total | 10,194 | 100.0% |
School Enrollment by Age by Funding Source in Noble County
Out of a total of 10,194 students who are enrolled in schools in Noble County, 1,264 (12.4%) attend a private institution, while the remaining 8,930 (87.6%) are enrolled in public schools. The age group of 3 to 4 year olds has the highest likelihood of being enrolled in private schools, with 84 (26.9% in the age bracket) enrolled. Conversely, the age group of 15 to 17 year olds has the lowest likelihood of being enrolled in a private school, with 1,806 (94.5% in the age bracket) attending a public institution.
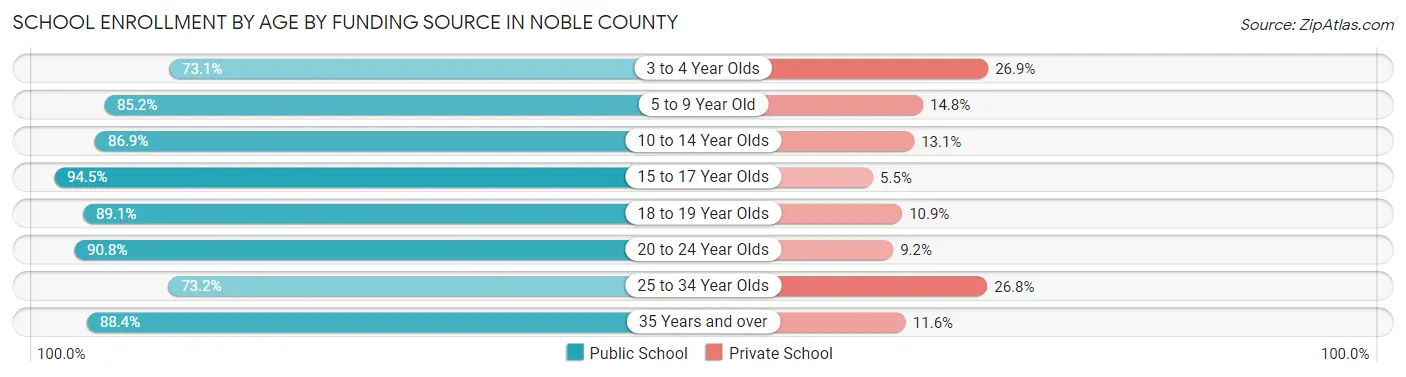
| Age Bracket | Public School | Private School |
| 3 to 4 Year Olds | 228 (73.1%) | 84 (26.9%) |
| 5 to 9 Year Old | 2,419 (85.2%) | 420 (14.8%) |
| 10 to 14 Year Olds | 2,762 (86.9%) | 418 (13.1%) |
| 15 to 17 Year Olds | 1,806 (94.5%) | 105 (5.5%) |
| 18 to 19 Year Olds | 597 (89.1%) | 73 (10.9%) |
| 20 to 24 Year Olds | 610 (90.8%) | 62 (9.2%) |
| 25 to 34 Year Olds | 156 (73.2%) | 57 (26.8%) |
| 35 Years and over | 351 (88.4%) | 46 (11.6%) |
| Total | 8,930 (87.6%) | 1,264 (12.4%) |
Educational Attainment by Field of Study in Noble County
Education (1,402 | 23.4%), business (991 | 16.5%), science & technology (709 | 11.8%), arts & humanities (550 | 9.2%), and bio, nature & agricultural (432 | 7.2%) are the most common fields of study among 6,004 individuals in Noble County who have obtained a bachelor's degree or higher.
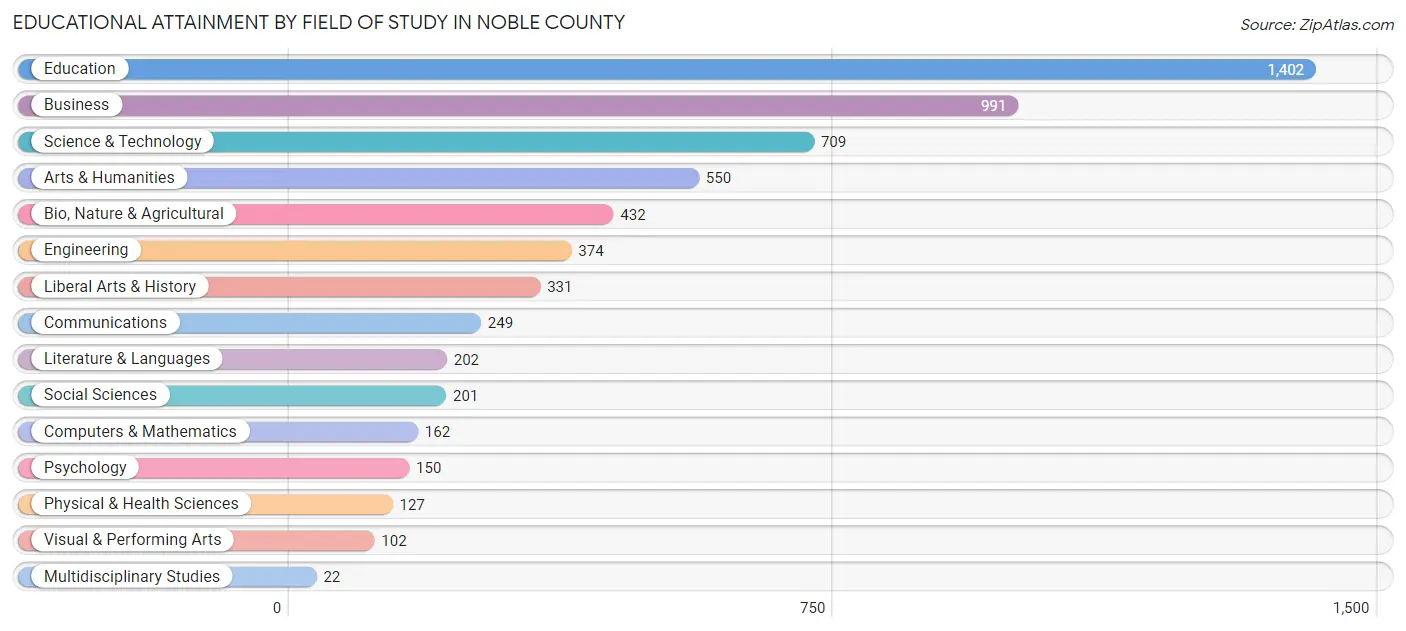
| Field of Study | # Graduates | % Graduates |
| Computers & Mathematics | 162 | 2.7% |
| Bio, Nature & Agricultural | 432 | 7.2% |
| Physical & Health Sciences | 127 | 2.1% |
| Psychology | 150 | 2.5% |
| Social Sciences | 201 | 3.4% |
| Engineering | 374 | 6.2% |
| Multidisciplinary Studies | 22 | 0.4% |
| Science & Technology | 709 | 11.8% |
| Business | 991 | 16.5% |
| Education | 1,402 | 23.4% |
| Literature & Languages | 202 | 3.4% |
| Liberal Arts & History | 331 | 5.5% |
| Visual & Performing Arts | 102 | 1.7% |
| Communications | 249 | 4.2% |
| Arts & Humanities | 550 | 9.2% |
| Total | 6,004 | 100.0% |
Transportation & Commute in Noble County
Vehicle Availability by Sex in Noble County
The most prevalent vehicle ownership categories in Noble County are males with 2 vehicles (4,696, accounting for 37.4%) and females with 2 vehicles (3,586, making up 47.4%).
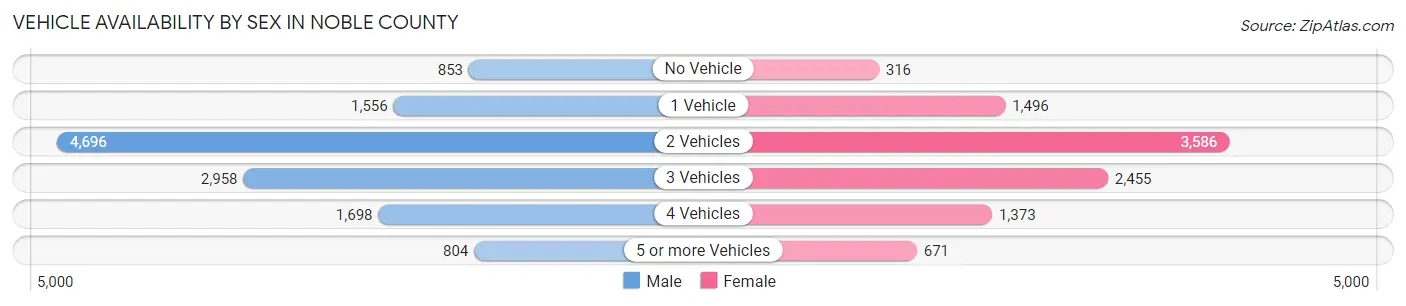
| Vehicles Available | Male | Female |
| No Vehicle | 853 (6.8%) | 316 (3.2%) |
| 1 Vehicle | 1,556 (12.4%) | 1,496 (15.1%) |
| 2 Vehicles | 4,696 (37.4%) | 3,586 (36.2%) |
| 3 Vehicles | 2,958 (23.5%) | 2,455 (24.8%) |
| 4 Vehicles | 1,698 (13.5%) | 1,373 (13.9%) |
| 5 or more Vehicles | 804 (6.4%) | 671 (6.8%) |
| Total | 12,565 (100.0%) | 9,897 (100.0%) |
Commute Time in Noble County
The most frequently occuring commute durations in Noble County are 5 to 9 minutes (3,331 commuters, 15.5%), 15 to 19 minutes (2,871 commuters, 13.4%), and 10 to 14 minutes (2,769 commuters, 12.9%).
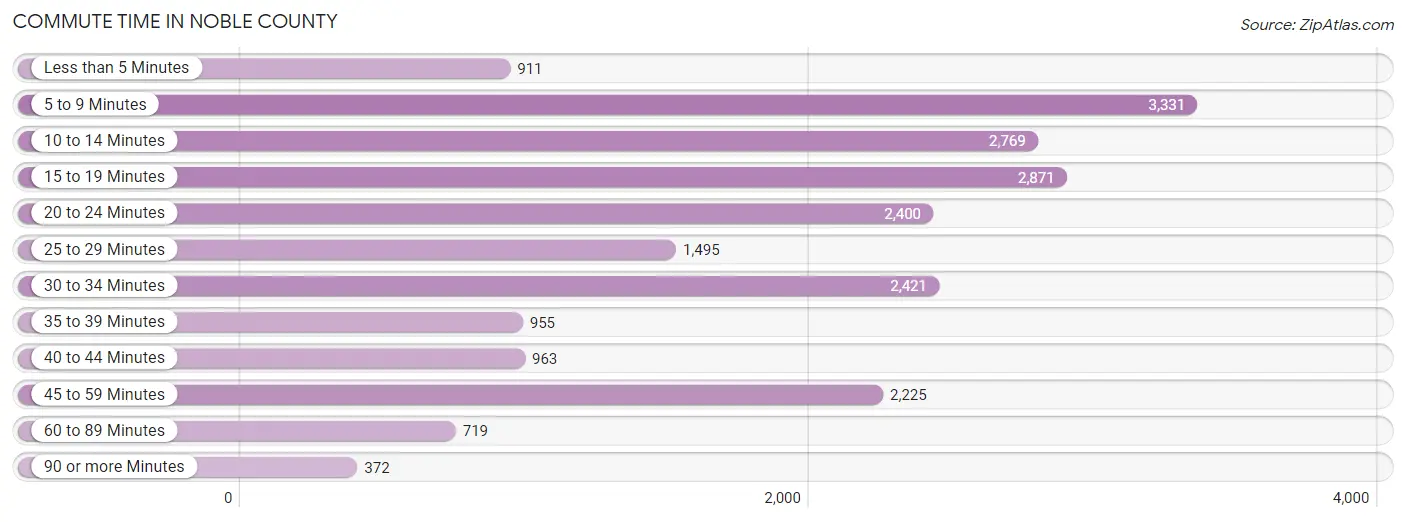
| Commute Time | # Commuters | % Commuters |
| Less than 5 Minutes | 911 | 4.3% |
| 5 to 9 Minutes | 3,331 | 15.5% |
| 10 to 14 Minutes | 2,769 | 12.9% |
| 15 to 19 Minutes | 2,871 | 13.4% |
| 20 to 24 Minutes | 2,400 | 11.2% |
| 25 to 29 Minutes | 1,495 | 7.0% |
| 30 to 34 Minutes | 2,421 | 11.3% |
| 35 to 39 Minutes | 955 | 4.5% |
| 40 to 44 Minutes | 963 | 4.5% |
| 45 to 59 Minutes | 2,225 | 10.4% |
| 60 to 89 Minutes | 719 | 3.4% |
| 90 or more Minutes | 372 | 1.7% |
Commute Time by Sex in Noble County
The most common commute times in Noble County are 5 to 9 minutes (1,871 commuters, 15.5%) for males and 5 to 9 minutes (1,460 commuters, 15.5%) for females.
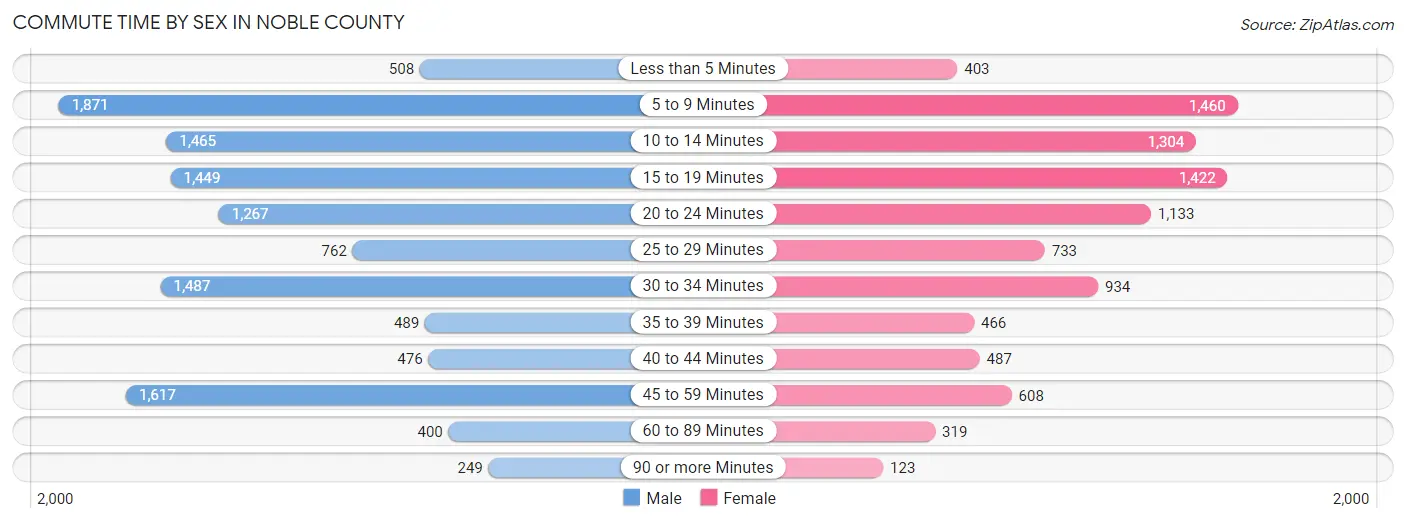
| Commute Time | Male | Female |
| Less than 5 Minutes | 508 (4.2%) | 403 (4.3%) |
| 5 to 9 Minutes | 1,871 (15.5%) | 1,460 (15.5%) |
| 10 to 14 Minutes | 1,465 (12.2%) | 1,304 (13.9%) |
| 15 to 19 Minutes | 1,449 (12.0%) | 1,422 (15.1%) |
| 20 to 24 Minutes | 1,267 (10.5%) | 1,133 (12.1%) |
| 25 to 29 Minutes | 762 (6.3%) | 733 (7.8%) |
| 30 to 34 Minutes | 1,487 (12.3%) | 934 (9.9%) |
| 35 to 39 Minutes | 489 (4.1%) | 466 (5.0%) |
| 40 to 44 Minutes | 476 (4.0%) | 487 (5.2%) |
| 45 to 59 Minutes | 1,617 (13.4%) | 608 (6.5%) |
| 60 to 89 Minutes | 400 (3.3%) | 319 (3.4%) |
| 90 or more Minutes | 249 (2.1%) | 123 (1.3%) |
Time of Departure to Work by Sex in Noble County
The most frequent times of departure to work in Noble County are 12:00 AM to 4:59 AM (2,649, 22.0%) for males and 7:00 AM to 7:29 AM (1,451, 15.4%) for females.
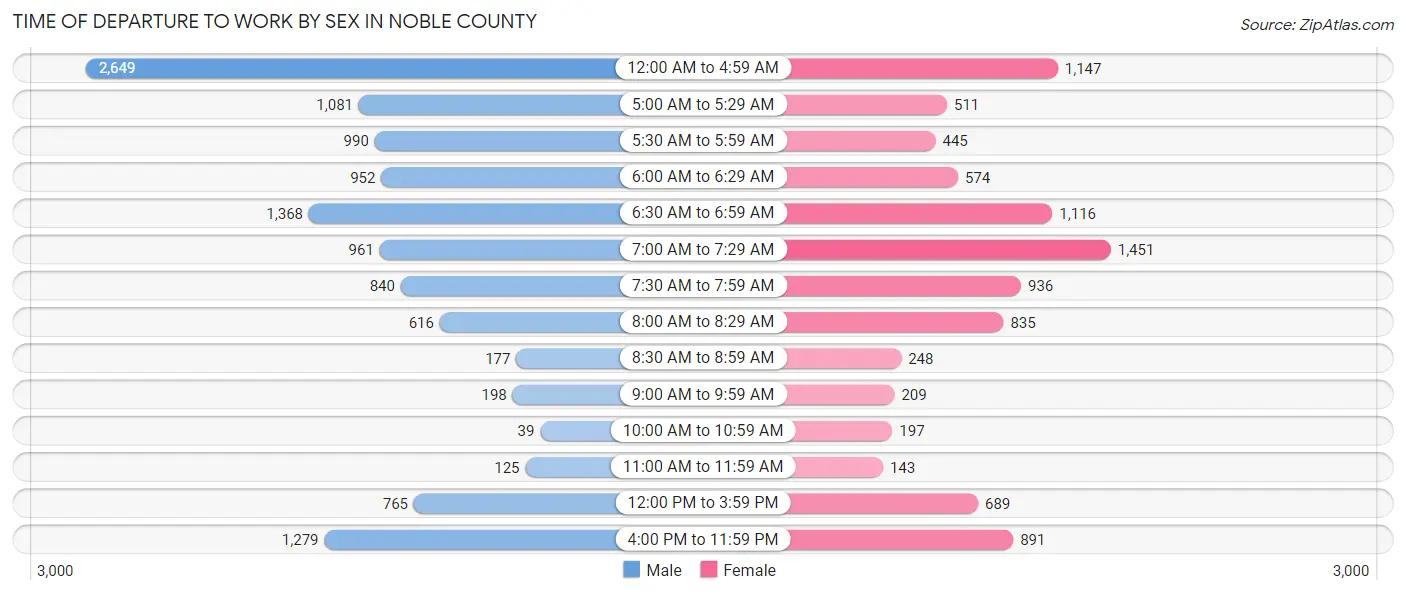
| Time of Departure | Male | Female |
| 12:00 AM to 4:59 AM | 2,649 (22.0%) | 1,147 (12.2%) |
| 5:00 AM to 5:29 AM | 1,081 (9.0%) | 511 (5.4%) |
| 5:30 AM to 5:59 AM | 990 (8.2%) | 445 (4.7%) |
| 6:00 AM to 6:29 AM | 952 (7.9%) | 574 (6.1%) |
| 6:30 AM to 6:59 AM | 1,368 (11.4%) | 1,116 (11.9%) |
| 7:00 AM to 7:29 AM | 961 (8.0%) | 1,451 (15.4%) |
| 7:30 AM to 7:59 AM | 840 (7.0%) | 936 (10.0%) |
| 8:00 AM to 8:29 AM | 616 (5.1%) | 835 (8.9%) |
| 8:30 AM to 8:59 AM | 177 (1.5%) | 248 (2.6%) |
| 9:00 AM to 9:59 AM | 198 (1.6%) | 209 (2.2%) |
| 10:00 AM to 10:59 AM | 39 (0.3%) | 197 (2.1%) |
| 11:00 AM to 11:59 AM | 125 (1.0%) | 143 (1.5%) |
| 12:00 PM to 3:59 PM | 765 (6.4%) | 689 (7.3%) |
| 4:00 PM to 11:59 PM | 1,279 (10.6%) | 891 (9.5%) |
| Total | 12,040 (100.0%) | 9,392 (100.0%) |
Housing Occupancy in Noble County
Occupancy by Ownership in Noble County
Of the total 17,688 dwellings in Noble County, owner-occupied units account for 13,546 (76.6%), while renter-occupied units make up 4,142 (23.4%).
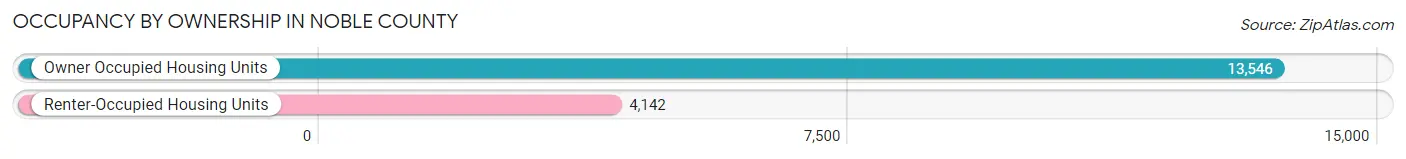
| Occupancy | # Housing Units | % Housing Units |
| Owner Occupied Housing Units | 13,546 | 76.6% |
| Renter-Occupied Housing Units | 4,142 | 23.4% |
| Total Occupied Housing Units | 17,688 | 100.0% |
Occupancy by Household Size in Noble County
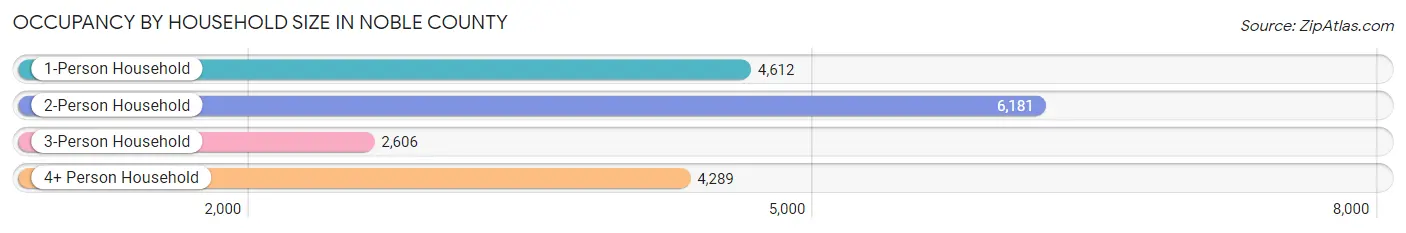
| Household Size | # Housing Units | % Housing Units |
| 1-Person Household | 4,612 | 26.1% |
| 2-Person Household | 6,181 | 34.9% |
| 3-Person Household | 2,606 | 14.7% |
| 4+ Person Household | 4,289 | 24.2% |
| Total Housing Units | 17,688 | 100.0% |
Occupancy by Ownership by Household Size in Noble County
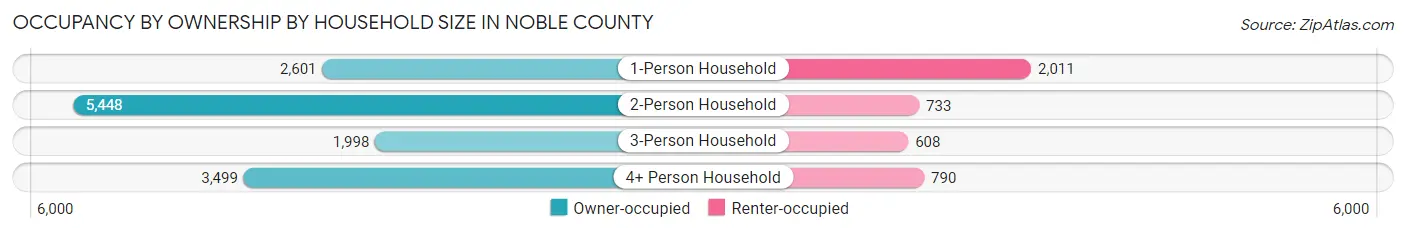
| Household Size | Owner-occupied | Renter-occupied |
| 1-Person Household | 2,601 (56.4%) | 2,011 (43.6%) |
| 2-Person Household | 5,448 (88.1%) | 733 (11.9%) |
| 3-Person Household | 1,998 (76.7%) | 608 (23.3%) |
| 4+ Person Household | 3,499 (81.6%) | 790 (18.4%) |
| Total Housing Units | 13,546 (76.6%) | 4,142 (23.4%) |
Occupancy by Educational Attainment in Noble County
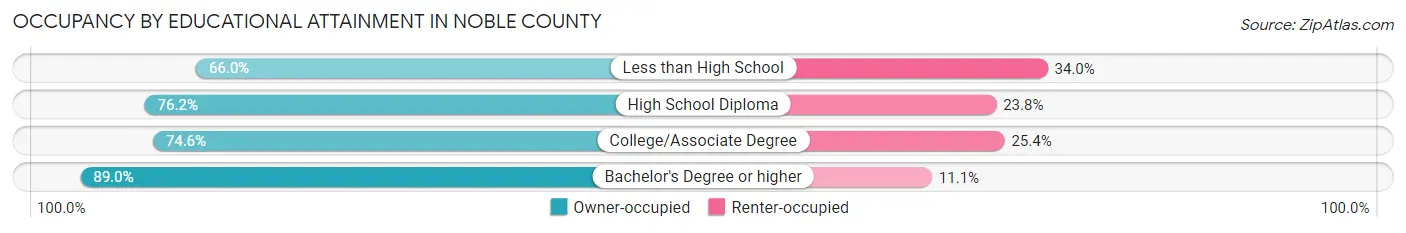
| Household Size | Owner-occupied | Renter-occupied |
| Less than High School | 1,704 (66.0%) | 877 (34.0%) |
| High School Diploma | 5,242 (76.2%) | 1,637 (23.8%) |
| College/Associate Degree | 3,725 (74.6%) | 1,271 (25.4%) |
| Bachelor's Degree or higher | 2,875 (88.9%) | 357 (11.1%) |
Occupancy by Age of Householder in Noble County
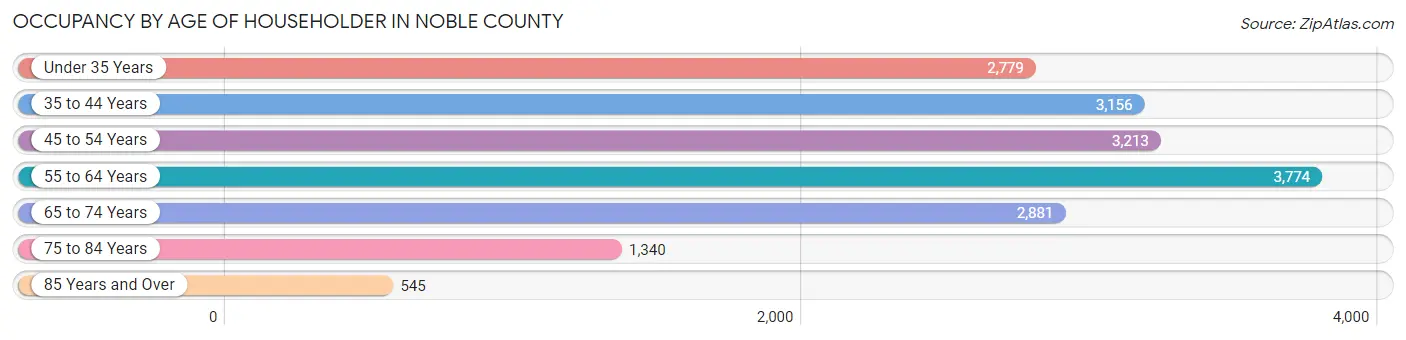
| Age Bracket | # Households | % Households |
| Under 35 Years | 2,779 | 15.7% |
| 35 to 44 Years | 3,156 | 17.8% |
| 45 to 54 Years | 3,213 | 18.2% |
| 55 to 64 Years | 3,774 | 21.3% |
| 65 to 74 Years | 2,881 | 16.3% |
| 75 to 84 Years | 1,340 | 7.6% |
| 85 Years and Over | 545 | 3.1% |
| Total | 17,688 | 100.0% |
Housing Finances in Noble County
Median Income by Occupancy in Noble County
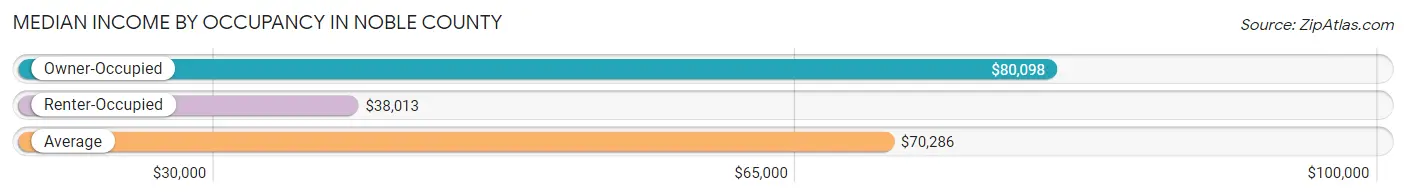
| Occupancy Type | # Households | Median Income |
| Owner-Occupied | 13,546 (76.6%) | $80,098 |
| Renter-Occupied | 4,142 (23.4%) | $38,013 |
| Average | 17,688 (100.0%) | $70,286 |
Occupancy by Householder Income Bracket in Noble County
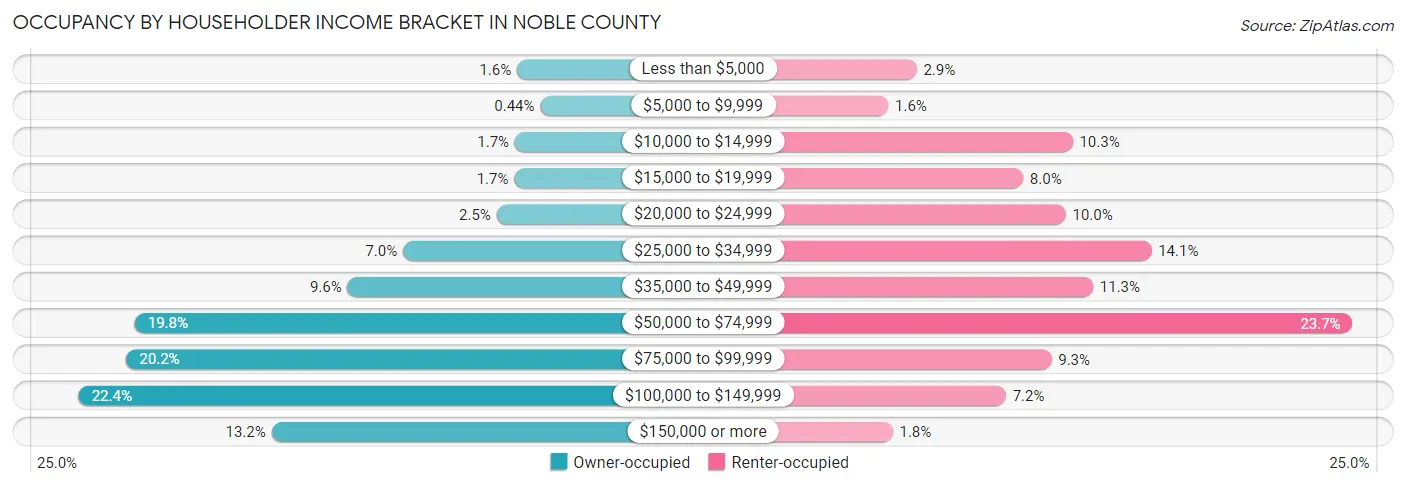
| Income Bracket | Owner-occupied | Renter-occupied |
| Less than $5,000 | 210 (1.5%) | 120 (2.9%) |
| $5,000 to $9,999 | 60 (0.4%) | 64 (1.5%) |
| $10,000 to $14,999 | 223 (1.7%) | 428 (10.3%) |
| $15,000 to $19,999 | 227 (1.7%) | 330 (8.0%) |
| $20,000 to $24,999 | 342 (2.5%) | 414 (10.0%) |
| $25,000 to $34,999 | 945 (7.0%) | 583 (14.1%) |
| $35,000 to $49,999 | 1,303 (9.6%) | 468 (11.3%) |
| $50,000 to $74,999 | 2,676 (19.8%) | 980 (23.7%) |
| $75,000 to $99,999 | 2,729 (20.2%) | 386 (9.3%) |
| $100,000 to $149,999 | 3,037 (22.4%) | 296 (7.1%) |
| $150,000 or more | 1,794 (13.2%) | 73 (1.8%) |
| Total | 13,546 (100.0%) | 4,142 (100.0%) |
Monthly Housing Cost Tiers in Noble County
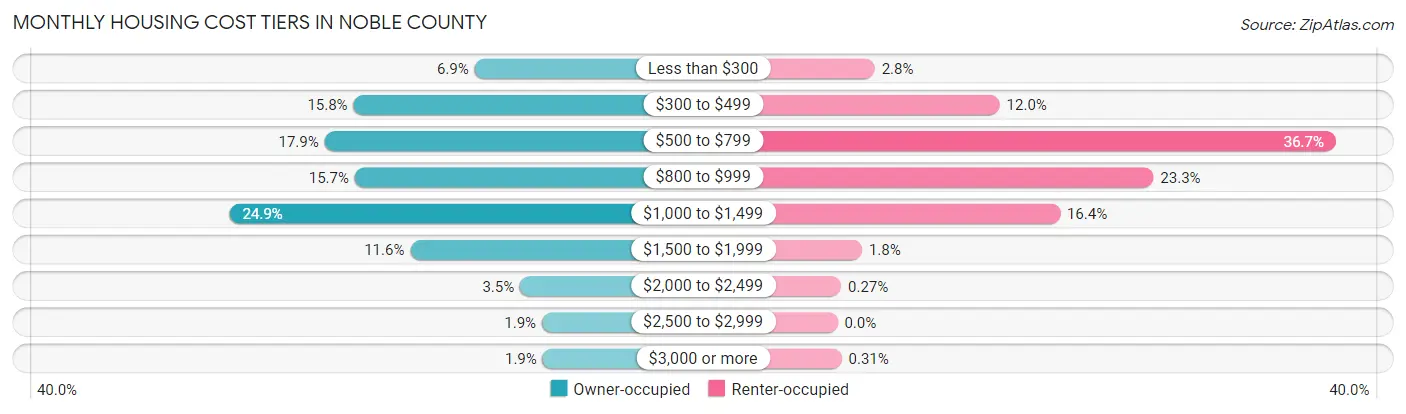
| Monthly Cost | Owner-occupied | Renter-occupied |
| Less than $300 | 929 (6.9%) | 114 (2.8%) |
| $300 to $499 | 2,138 (15.8%) | 495 (11.9%) |
| $500 to $799 | 2,426 (17.9%) | 1,520 (36.7%) |
| $800 to $999 | 2,124 (15.7%) | 964 (23.3%) |
| $1,000 to $1,499 | 3,374 (24.9%) | 679 (16.4%) |
| $1,500 to $1,999 | 1,572 (11.6%) | 75 (1.8%) |
| $2,000 to $2,499 | 476 (3.5%) | 11 (0.3%) |
| $2,500 to $2,999 | 257 (1.9%) | 0 (0.0%) |
| $3,000 or more | 250 (1.8%) | 13 (0.3%) |
| Total | 13,546 (100.0%) | 4,142 (100.0%) |
Physical Housing Characteristics in Noble County
Housing Structures in Noble County
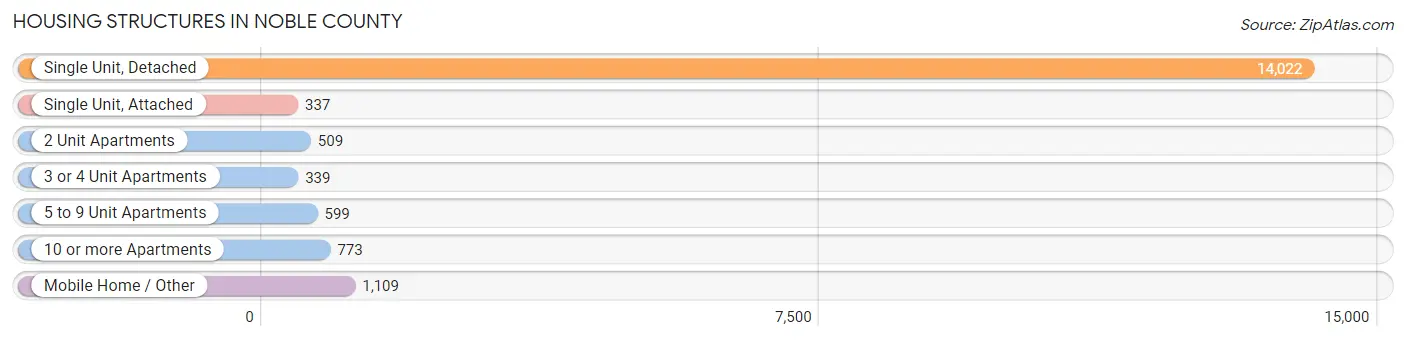
| Structure Type | # Housing Units | % Housing Units |
| Single Unit, Detached | 14,022 | 79.3% |
| Single Unit, Attached | 337 | 1.9% |
| 2 Unit Apartments | 509 | 2.9% |
| 3 or 4 Unit Apartments | 339 | 1.9% |
| 5 to 9 Unit Apartments | 599 | 3.4% |
| 10 or more Apartments | 773 | 4.4% |
| Mobile Home / Other | 1,109 | 6.3% |
| Total | 17,688 | 100.0% |
Housing Structures by Occupancy in Noble County
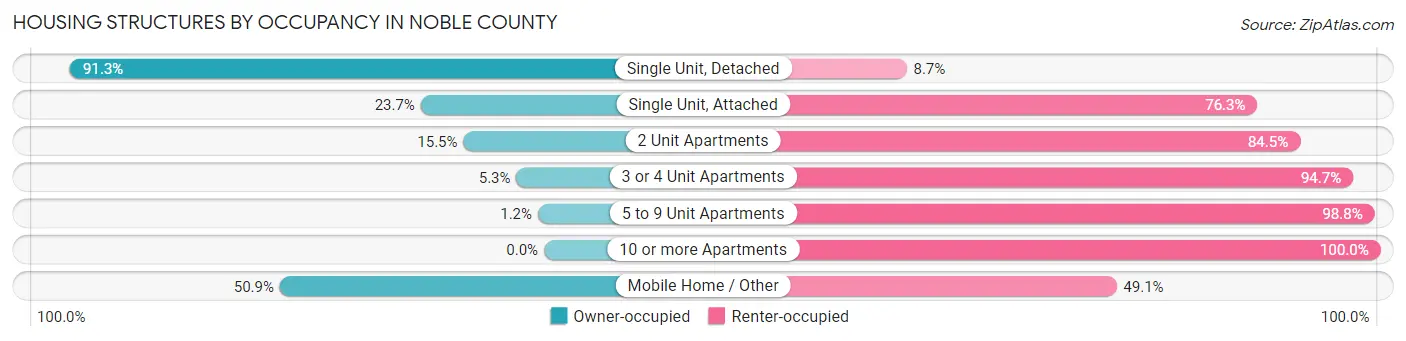
| Structure Type | Owner-occupied | Renter-occupied |
| Single Unit, Detached | 12,798 (91.3%) | 1,224 (8.7%) |
| Single Unit, Attached | 80 (23.7%) | 257 (76.3%) |
| 2 Unit Apartments | 79 (15.5%) | 430 (84.5%) |
| 3 or 4 Unit Apartments | 18 (5.3%) | 321 (94.7%) |
| 5 to 9 Unit Apartments | 7 (1.2%) | 592 (98.8%) |
| 10 or more Apartments | 0 (0.0%) | 773 (100.0%) |
| Mobile Home / Other | 564 (50.9%) | 545 (49.1%) |
| Total | 13,546 (76.6%) | 4,142 (23.4%) |
Housing Structures by Number of Rooms in Noble County
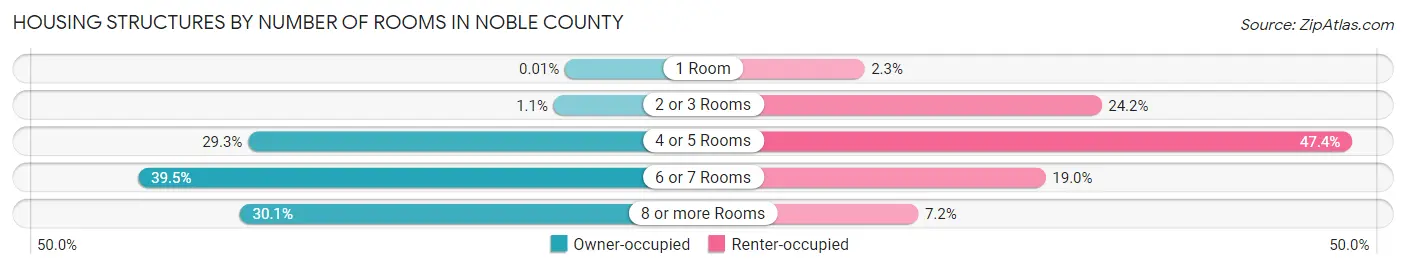
| Number of Rooms | Owner-occupied | Renter-occupied |
| 1 Room | 1 (0.0%) | 93 (2.2%) |
| 2 or 3 Rooms | 143 (1.1%) | 1,001 (24.2%) |
| 4 or 5 Rooms | 3,972 (29.3%) | 1,962 (47.4%) |
| 6 or 7 Rooms | 5,351 (39.5%) | 787 (19.0%) |
| 8 or more Rooms | 4,079 (30.1%) | 299 (7.2%) |
| Total | 13,546 (100.0%) | 4,142 (100.0%) |
Housing Structure by Heating Type in Noble County
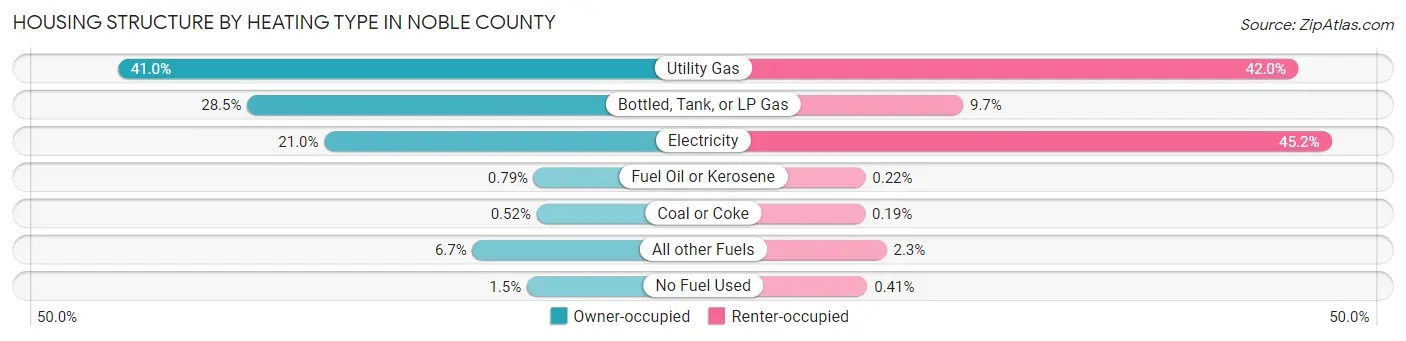
| Heating Type | Owner-occupied | Renter-occupied |
| Utility Gas | 5,553 (41.0%) | 1,740 (42.0%) |
| Bottled, Tank, or LP Gas | 3,858 (28.5%) | 400 (9.7%) |
| Electricity | 2,850 (21.0%) | 1,874 (45.2%) |
| Fuel Oil or Kerosene | 107 (0.8%) | 9 (0.2%) |
| Coal or Coke | 70 (0.5%) | 8 (0.2%) |
| All other Fuels | 910 (6.7%) | 94 (2.3%) |
| No Fuel Used | 198 (1.5%) | 17 (0.4%) |
| Total | 13,546 (100.0%) | 4,142 (100.0%) |
Household Vehicle Usage in Noble County
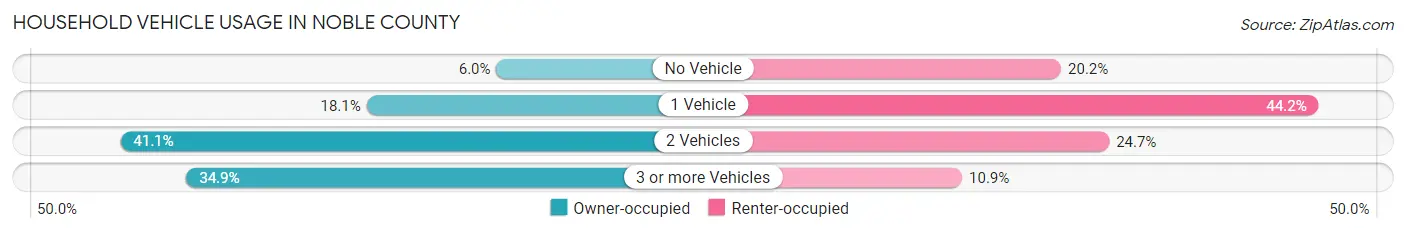
| Vehicles per Household | Owner-occupied | Renter-occupied |
| No Vehicle | 808 (6.0%) | 836 (20.2%) |
| 1 Vehicle | 2,449 (18.1%) | 1,831 (44.2%) |
| 2 Vehicles | 5,562 (41.1%) | 1,022 (24.7%) |
| 3 or more Vehicles | 4,727 (34.9%) | 453 (10.9%) |
| Total | 13,546 (100.0%) | 4,142 (100.0%) |
Real Estate & Mortgages in Noble County
Real Estate and Mortgage Overview in Noble County
| Characteristic | Without Mortgage | With Mortgage |
| Housing Units | 4,913 | 8,633 |
| Median Property Value | $160,900 | $169,700 |
| Median Household Income | $68,647 | $1,315 |
| Monthly Housing Costs | $458 | $227 |
| Real Estate Taxes | $1,135 | $296 |
Property Value by Mortgage Status in Noble County
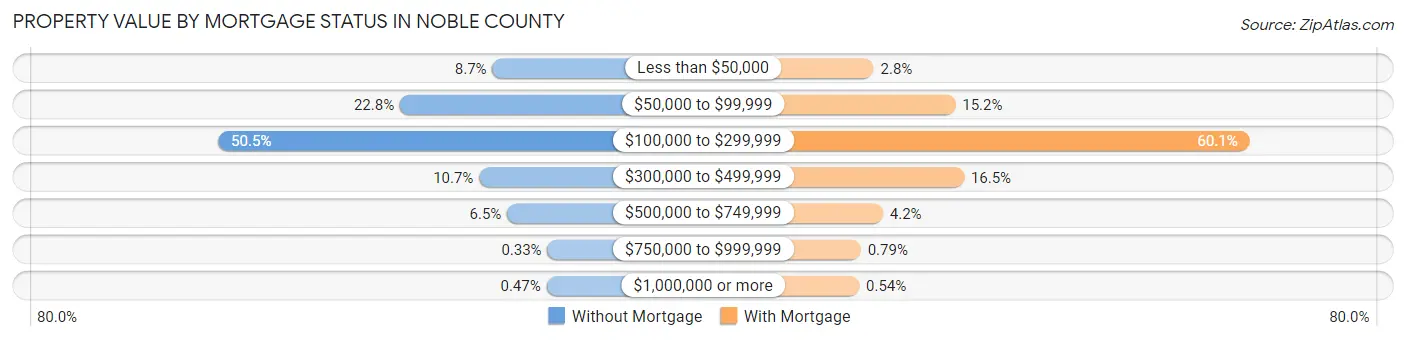
| Property Value | Without Mortgage | With Mortgage |
| Less than $50,000 | 428 (8.7%) | 237 (2.8%) |
| $50,000 to $99,999 | 1,120 (22.8%) | 1,312 (15.2%) |
| $100,000 to $299,999 | 2,481 (50.5%) | 5,184 (60.1%) |
| $300,000 to $499,999 | 527 (10.7%) | 1,426 (16.5%) |
| $500,000 to $749,999 | 318 (6.5%) | 359 (4.2%) |
| $750,000 to $999,999 | 16 (0.3%) | 68 (0.8%) |
| $1,000,000 or more | 23 (0.5%) | 47 (0.5%) |
| Total | 4,913 (100.0%) | 8,633 (100.0%) |
Household Income by Mortgage Status in Noble County
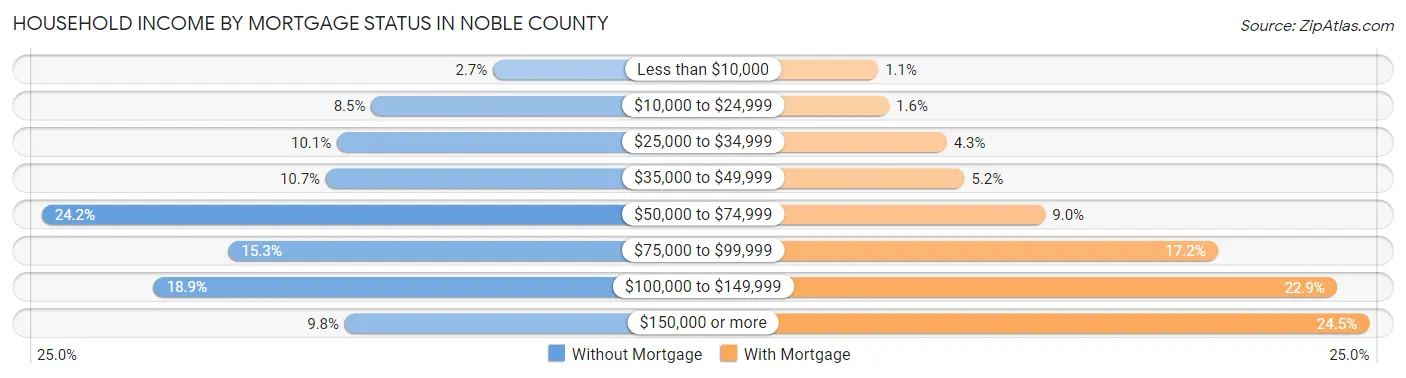
| Household Income | Without Mortgage | With Mortgage |
| Less than $10,000 | 132 (2.7%) | 93 (1.1%) |
| $10,000 to $24,999 | 417 (8.5%) | 138 (1.6%) |
| $25,000 to $34,999 | 497 (10.1%) | 375 (4.3%) |
| $35,000 to $49,999 | 523 (10.6%) | 448 (5.2%) |
| $50,000 to $74,999 | 1,188 (24.2%) | 780 (9.0%) |
| $75,000 to $99,999 | 751 (15.3%) | 1,488 (17.2%) |
| $100,000 to $149,999 | 926 (18.9%) | 1,978 (22.9%) |
| $150,000 or more | 479 (9.8%) | 2,111 (24.4%) |
| Total | 4,913 (100.0%) | 8,633 (100.0%) |
Property Value to Household Income Ratio in Noble County
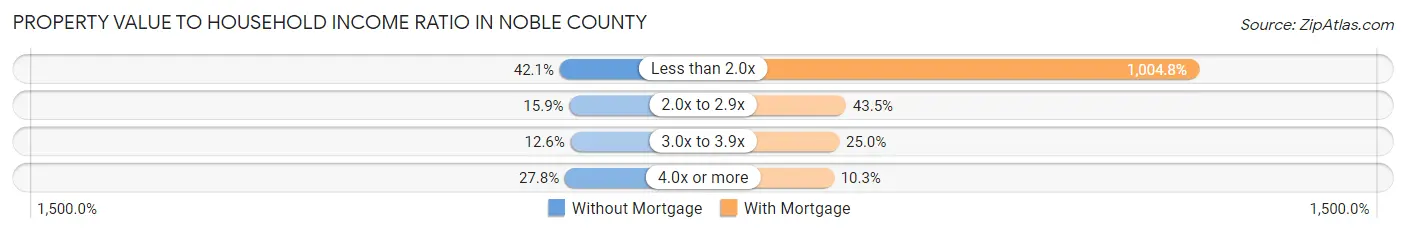
| Value-to-Income Ratio | Without Mortgage | With Mortgage |
| Less than 2.0x | 2,070 (42.1%) | 86,744 (1,004.8%) |
| 2.0x to 2.9x | 781 (15.9%) | 3,754 (43.5%) |
| 3.0x to 3.9x | 620 (12.6%) | 2,156 (25.0%) |
| 4.0x or more | 1,364 (27.8%) | 887 (10.3%) |
| Total | 4,913 (100.0%) | 8,633 (100.0%) |
Real Estate Taxes by Mortgage Status in Noble County
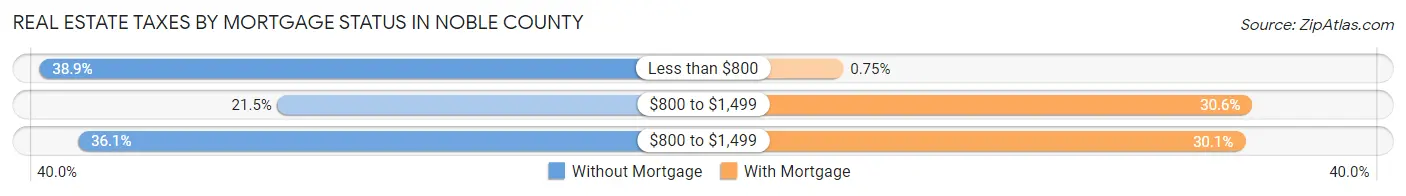
| Property Taxes | Without Mortgage | With Mortgage |
| Less than $800 | 1,912 (38.9%) | 65 (0.7%) |
| $800 to $1,499 | 1,057 (21.5%) | 2,644 (30.6%) |
| $800 to $1,499 | 1,773 (36.1%) | 2,599 (30.1%) |
| Total | 4,913 (100.0%) | 8,633 (100.0%) |
Health & Disability in Noble County
Health Insurance Coverage by Age in Noble County
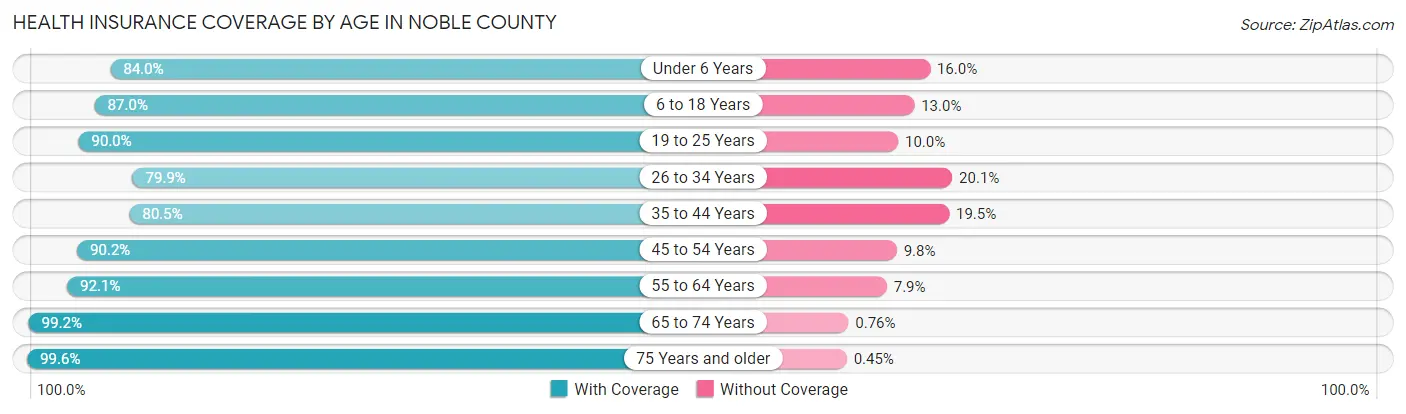
| Age Bracket | With Coverage | Without Coverage |
| Under 6 Years | 3,087 (84.0%) | 587 (16.0%) |
| 6 to 18 Years | 7,334 (87.0%) | 1,100 (13.0%) |
| 19 to 25 Years | 3,652 (90.0%) | 407 (10.0%) |
| 26 to 34 Years | 3,930 (79.9%) | 989 (20.1%) |
| 35 to 44 Years | 4,496 (80.5%) | 1,091 (19.5%) |
| 45 to 54 Years | 5,438 (90.2%) | 589 (9.8%) |
| 55 to 64 Years | 6,149 (92.1%) | 529 (7.9%) |
| 65 to 74 Years | 4,684 (99.2%) | 36 (0.8%) |
| 75 Years and older | 2,653 (99.6%) | 12 (0.4%) |
| Total | 41,423 (88.6%) | 5,340 (11.4%) |
Health Insurance Coverage by Citizenship Status in Noble County
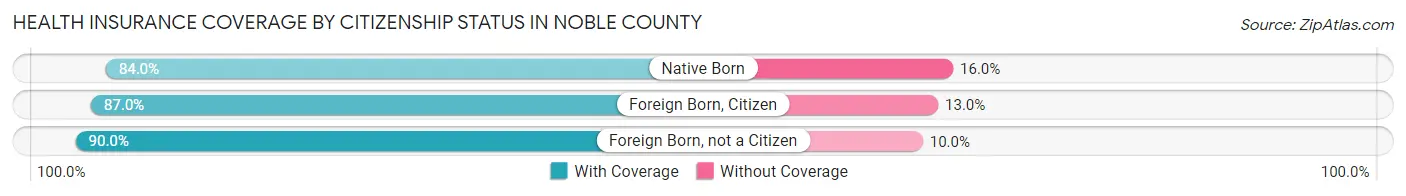
| Citizenship Status | With Coverage | Without Coverage |
| Native Born | 3,087 (84.0%) | 587 (16.0%) |
| Foreign Born, Citizen | 7,334 (87.0%) | 1,100 (13.0%) |
| Foreign Born, not a Citizen | 3,652 (90.0%) | 407 (10.0%) |
Health Insurance Coverage by Household Income in Noble County
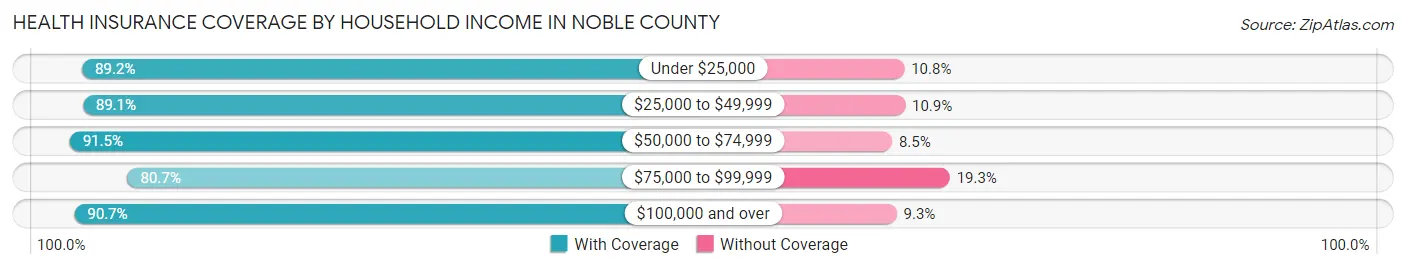
| Household Income | With Coverage | Without Coverage |
| Under $25,000 | 3,085 (89.2%) | 372 (10.8%) |
| $25,000 to $49,999 | 6,155 (89.1%) | 754 (10.9%) |
| $50,000 to $74,999 | 8,394 (91.5%) | 776 (8.5%) |
| $75,000 to $99,999 | 7,340 (80.7%) | 1,753 (19.3%) |
| $100,000 and over | 16,382 (90.7%) | 1,685 (9.3%) |
Public vs Private Health Insurance Coverage by Age in Noble County
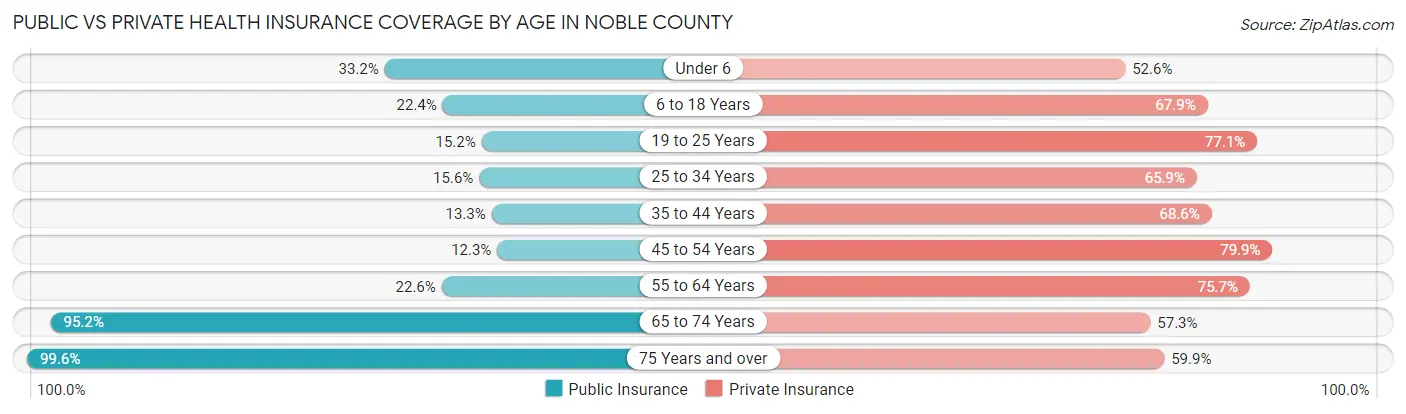
| Age Bracket | Public Insurance | Private Insurance |
| Under 6 | 1,219 (33.2%) | 1,933 (52.6%) |
| 6 to 18 Years | 1,890 (22.4%) | 5,724 (67.9%) |
| 19 to 25 Years | 616 (15.2%) | 3,129 (77.1%) |
| 25 to 34 Years | 769 (15.6%) | 3,241 (65.9%) |
| 35 to 44 Years | 744 (13.3%) | 3,835 (68.6%) |
| 45 to 54 Years | 740 (12.3%) | 4,816 (79.9%) |
| 55 to 64 Years | 1,509 (22.6%) | 5,057 (75.7%) |
| 65 to 74 Years | 4,492 (95.2%) | 2,703 (57.3%) |
| 75 Years and over | 2,653 (99.6%) | 1,595 (59.9%) |
| Total | 14,632 (31.3%) | 32,033 (68.5%) |
Disability Status by Sex by Age in Noble County
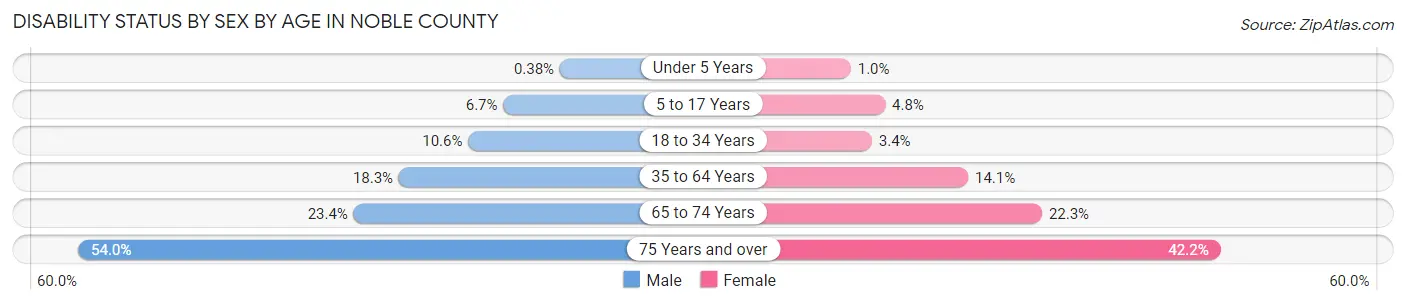
| Age Bracket | Male | Female |
| Under 5 Years | 6 (0.4%) | 15 (1.0%) |
| 5 to 17 Years | 291 (6.7%) | 197 (4.8%) |
| 18 to 34 Years | 513 (10.6%) | 159 (3.4%) |
| 35 to 64 Years | 1,721 (18.3%) | 1,251 (14.1%) |
| 65 to 74 Years | 549 (23.4%) | 528 (22.3%) |
| 75 Years and over | 615 (54.0%) | 644 (42.2%) |
Disability Class by Sex by Age in Noble County
Disability Class: Hearing Difficulty
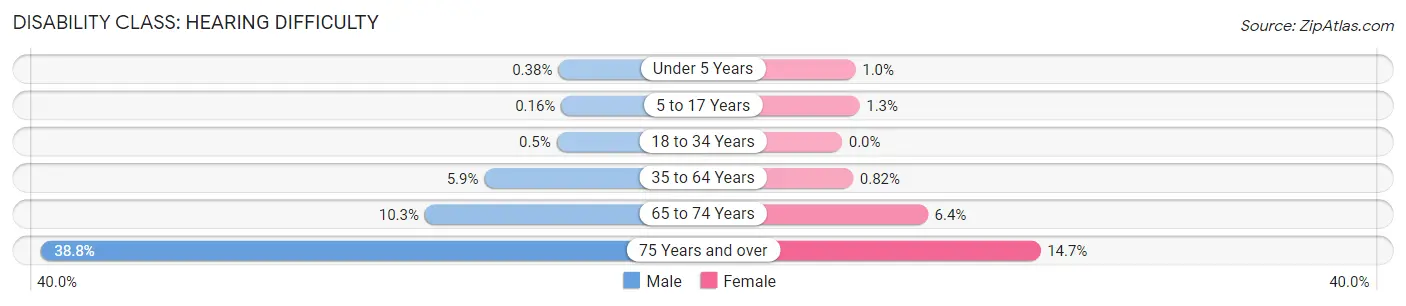
| Age Bracket | Male | Female |
| Under 5 Years | 6 (0.4%) | 15 (1.0%) |
| 5 to 17 Years | 7 (0.2%) | 53 (1.3%) |
| 18 to 34 Years | 24 (0.5%) | 0 (0.0%) |
| 35 to 64 Years | 552 (5.9%) | 73 (0.8%) |
| 65 to 74 Years | 242 (10.3%) | 151 (6.4%) |
| 75 Years and over | 441 (38.8%) | 225 (14.7%) |
Disability Class: Vision Difficulty
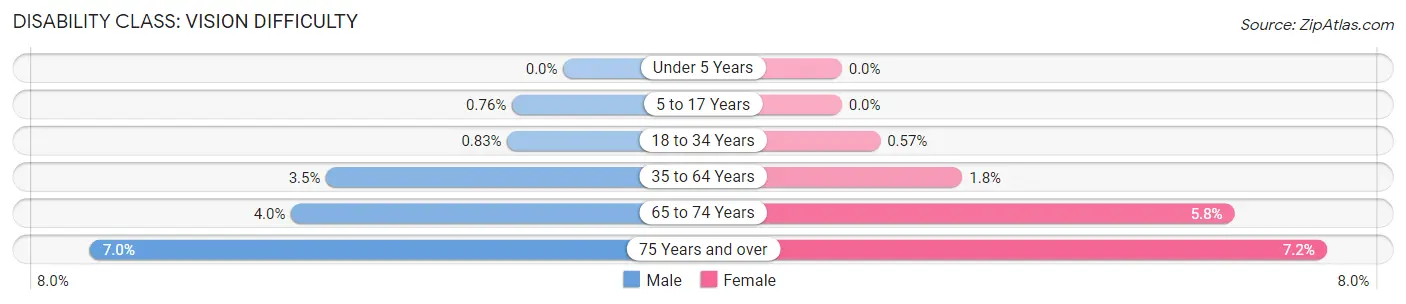
| Age Bracket | Male | Female |
| Under 5 Years | 0 (0.0%) | 0 (0.0%) |
| 5 to 17 Years | 33 (0.8%) | 0 (0.0%) |
| 18 to 34 Years | 40 (0.8%) | 27 (0.6%) |
| 35 to 64 Years | 331 (3.5%) | 159 (1.8%) |
| 65 to 74 Years | 95 (4.0%) | 138 (5.8%) |
| 75 Years and over | 80 (7.0%) | 110 (7.2%) |
Disability Class: Cognitive Difficulty
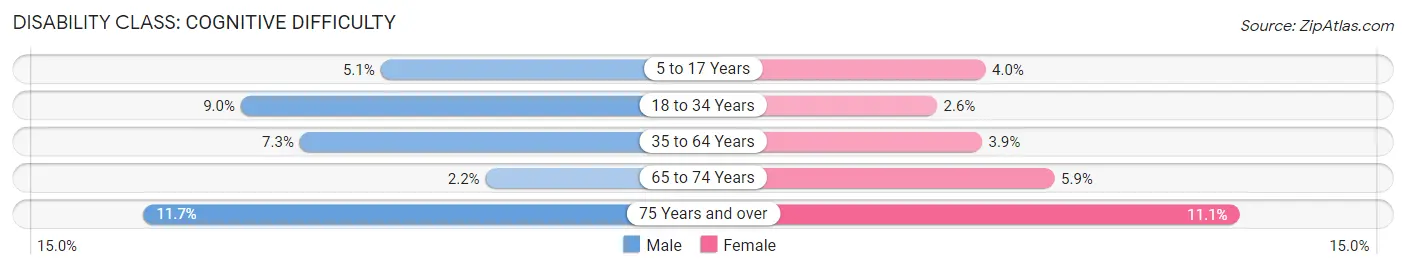
| Age Bracket | Male | Female |
| 5 to 17 Years | 222 (5.1%) | 163 (4.0%) |
| 18 to 34 Years | 435 (9.0%) | 125 (2.6%) |
| 35 to 64 Years | 690 (7.3%) | 346 (3.9%) |
| 65 to 74 Years | 51 (2.2%) | 140 (5.9%) |
| 75 Years and over | 133 (11.7%) | 169 (11.1%) |
Disability Class: Ambulatory Difficulty
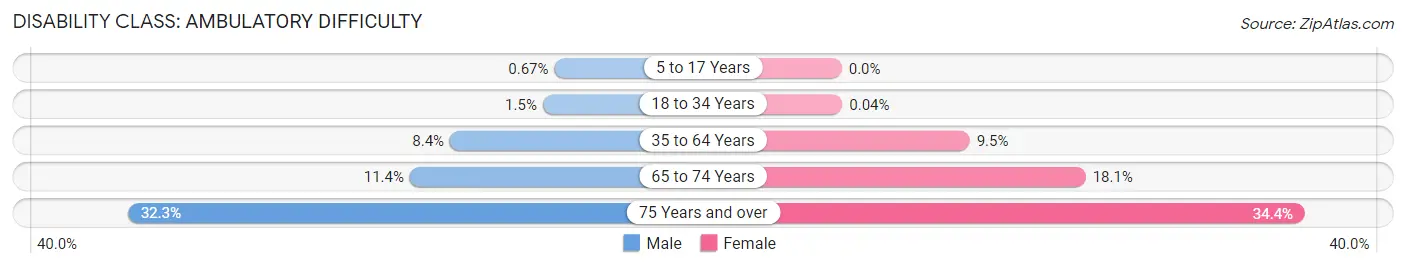
| Age Bracket | Male | Female |
| 5 to 17 Years | 29 (0.7%) | 0 (0.0%) |
| 18 to 34 Years | 74 (1.5%) | 2 (0.0%) |
| 35 to 64 Years | 791 (8.4%) | 845 (9.5%) |
| 65 to 74 Years | 268 (11.4%) | 429 (18.1%) |
| 75 Years and over | 368 (32.3%) | 525 (34.4%) |
Disability Class: Self-Care Difficulty
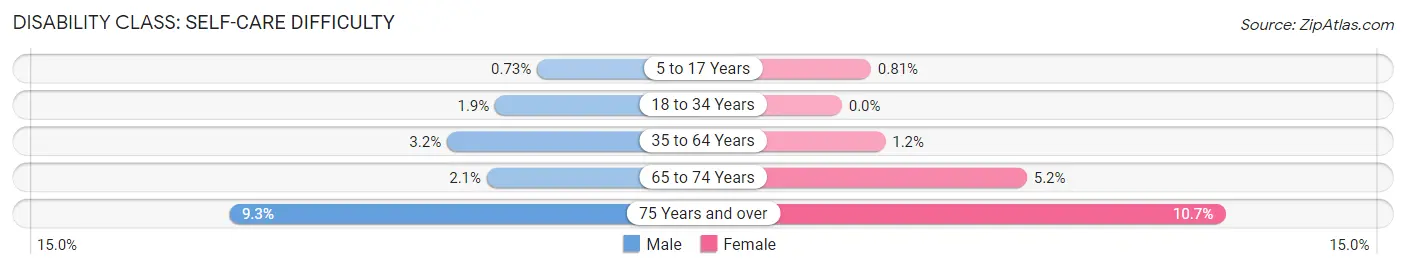
| Age Bracket | Male | Female |
| 5 to 17 Years | 32 (0.7%) | 33 (0.8%) |
| 18 to 34 Years | 92 (1.9%) | 0 (0.0%) |
| 35 to 64 Years | 304 (3.2%) | 108 (1.2%) |
| 65 to 74 Years | 50 (2.1%) | 122 (5.1%) |
| 75 Years and over | 106 (9.3%) | 163 (10.7%) |
Technology Access in Noble County
Computing Device Access in Noble County
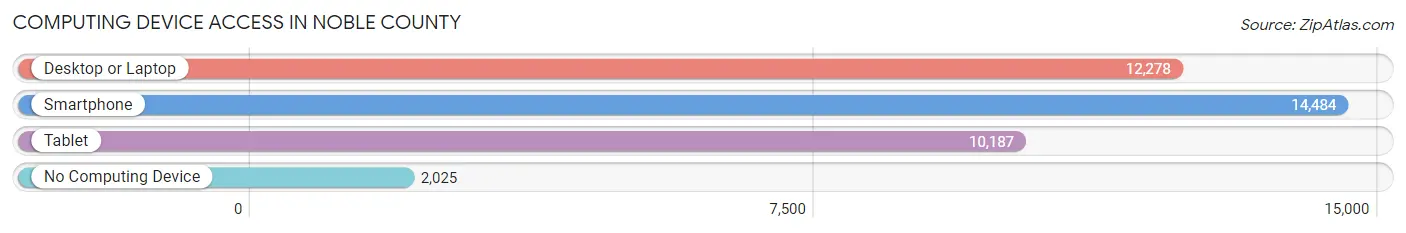
| Device Type | # Households | % Households |
| Desktop or Laptop | 12,278 | 69.4% |
| Smartphone | 14,484 | 81.9% |
| Tablet | 10,187 | 57.6% |
| No Computing Device | 2,025 | 11.5% |
| Total | 17,688 | 100.0% |
Internet Access in Noble County
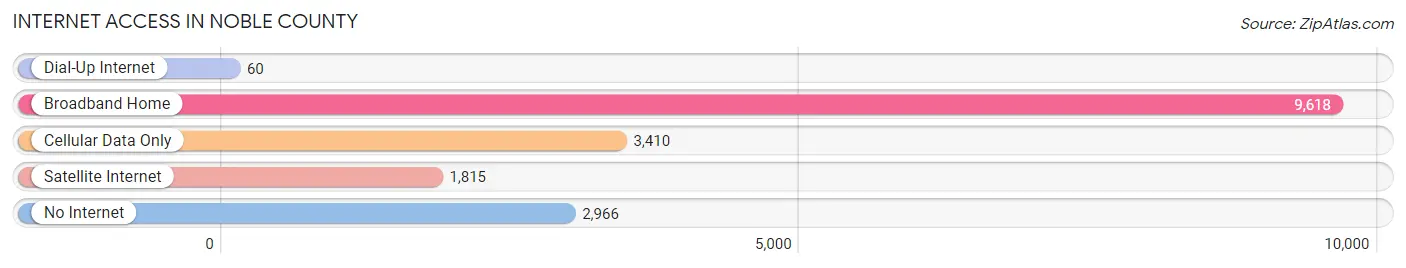
| Internet Type | # Households | % Households |
| Dial-Up Internet | 60 | 0.3% |
| Broadband Home | 9,618 | 54.4% |
| Cellular Data Only | 3,410 | 19.3% |
| Satellite Internet | 1,815 | 10.3% |
| No Internet | 2,966 | 16.8% |
| Total | 17,688 | 100.0% |
Noble County Summary
Noble County, Indiana is located in the northeastern part of the state, and is part of the Fort Wayne metropolitan area. It is bordered by Allen County to the north, Whitley County to the east, DeKalb County to the south, and LaGrange and Steuben Counties to the west. The county seat is Albion, and the county is named for James Noble, a signer of the state constitution.
Geography
Noble County covers an area of 437 square miles, and is mostly flat, with some rolling hills in the northern part of the county. The land is mostly used for agriculture, with some wooded areas in the northern part of the county. The county is drained by the Elkhart River, which flows through the center of the county, and by several smaller creeks and streams. The highest point in the county is located in the northern part of the county, and is 890 feet above sea level.
Climate
Noble County has a humid continental climate, with cold winters and hot, humid summers. The average annual temperature is around 50 degrees Fahrenheit, and the average annual precipitation is around 40 inches.
Demographics
As of the 2010 census, Noble County had a population of 47,536. The population was spread out, with 24.3% under the age of 18, 8.2% from 18 to 24, 28.2% from 25 to 44, 24.3% from 45 to 64, and 14.9% who were 65 years of age or older. The median age was 37.4 years. The gender makeup of the county was 49.3% male and 50.7% female.
The racial makeup of the county was 95.2% White, 0.7% African American, 0.3% Native American, 0.7% Asian, 0.1% Pacific Islander, 1.7% from other races, and 1.2% from two or more races. Hispanic or Latino of any race were 3.7% of the population.
Economy
Agriculture is the main economic activity in Noble County, with corn, soybeans, and wheat being the main crops. Livestock production is also important, with beef cattle, dairy cattle, and hogs being the main animals raised. Manufacturing is also an important part of the economy, with companies such as Bendix Corporation, General Electric, and Whirlpool Corporation having plants in the county.
The median household income in Noble County was $48,945 in 2017, and the median family income was $58,945. The per capita income was $24,845. About 8.7% of families and 11.3% of the population were below the poverty line, including 15.2% of those under age 18 and 6.2% of those age 65 or over.
Conclusion
Noble County, Indiana is a rural county located in the northeastern part of the state. It is mostly flat, with some rolling hills in the northern part of the county. Agriculture is the main economic activity in the county, with manufacturing also playing an important role. The population of the county is mostly white, with a small percentage of other races. The median household income in the county is slightly above the state average, and the poverty rate is slightly below the state average.
Common Questions
What is the Total Population of Noble County?
Total Population of Noble County is 47,431.
What is the Total Male Population of Noble County?
Total Male Population of Noble County is 23,977.
What is the Total Female Population of Noble County?
Total Female Population of Noble County is 23,454.
What is the Ratio of Males per 100 Females in Noble County?
There are 102.23 Males per 100 Females in Noble County.
What is the Ratio of Females per 100 Males in Noble County?
There are 97.82 Females per 100 Males in Noble County.
What is the Median Population Age in Noble County?
Median Population Age in Noble County is 39.4 Years.
What is the Average Family Size in Noble County
Average Family Size in Noble County is 3.2 People.
What is the Average Household Size in Noble County
Average Household Size in Noble County is 2.6 People.
What is Per Capita Income in Noble County?
Per Capita income in Noble County is $31,953.
What is the Median Family Income in Noble County?
Median Family Income in Noble County is $82,845.
What is the Median Household income in Noble County?
Median Household Income in Noble County is $70,286.
What is Income or Wage Gap in Noble County?
Income or Wage Gap in Noble County is 32.0%.
Women in Noble County earn 68.0 cents for every dollar earned by a man.
What is Family Income Deficit in Noble County?
Family Income Deficit in Noble County is $9,685.
Families that are below poverty line in Noble County earn $9,685 less on average than the poverty threshold level.
What is Inequality or Gini Index in Noble County?
Inequality or Gini Index in Noble County is 0.38.
How Large is the Labor Force in Noble County?
There are 23,766 People in the Labor Forcein in Noble County.
What is the Percentage of People in the Labor Force in Noble County?
63.8% of People are in the Labor Force in Noble County.
What is the Unemployment Rate in Noble County?
Unemployment Rate in Noble County is 3.4%.