Newton County, IN
Newton County Map
Newton County Overview
13,829
TOTAL POPULATION
7,123
MALE POPULATION
6,706
FEMALE POPULATION
106.22
MALES / 100 FEMALES
94.15
FEMALES / 100 MALES
42.7
MEDIAN AGE
3.0
AVG FAMILY SIZE
2.5
AVG HOUSEHOLD SIZE
$30,168
PER CAPITA INCOME
$75,704
AVG FAMILY INCOME
$63,673
AVG HOUSEHOLD INCOME
36.1%
WAGE / INCOME GAP [ % ]
63.9¢/ $1
WAGE / INCOME GAP [ $ ]
$12,112
FAMILY INCOME DEFICIT
0.39
INEQUALITY / GINI INDEX
6,733
LABOR FORCE [ PEOPLE ]
59.5%
PERCENT IN LABOR FORCE
9.6%
UNEMPLOYMENT RATE
Newton County Area Codes
Race in Newton County
The most populous races in Newton County are White / Caucasian (12,651 | 91.5%), Hispanic or Latino (1,017 | 7.3%), and Two or more Races (693 | 5.0%).

| Race | # Population | % Population |
| Asian | 33 | 0.2% |
| Black / African American | 157 | 1.1% |
| Hawaiian / Pacific | 0 | 0.0% |
| Hispanic or Latino | 1,017 | 7.3% |
| Native / Alaskan | 10 | 0.1% |
| White / Caucasian | 12,651 | 91.5% |
| Two or more Races | 693 | 5.0% |
| Some other Race | 285 | 2.1% |
| Total | 13,829 | 100.0% |
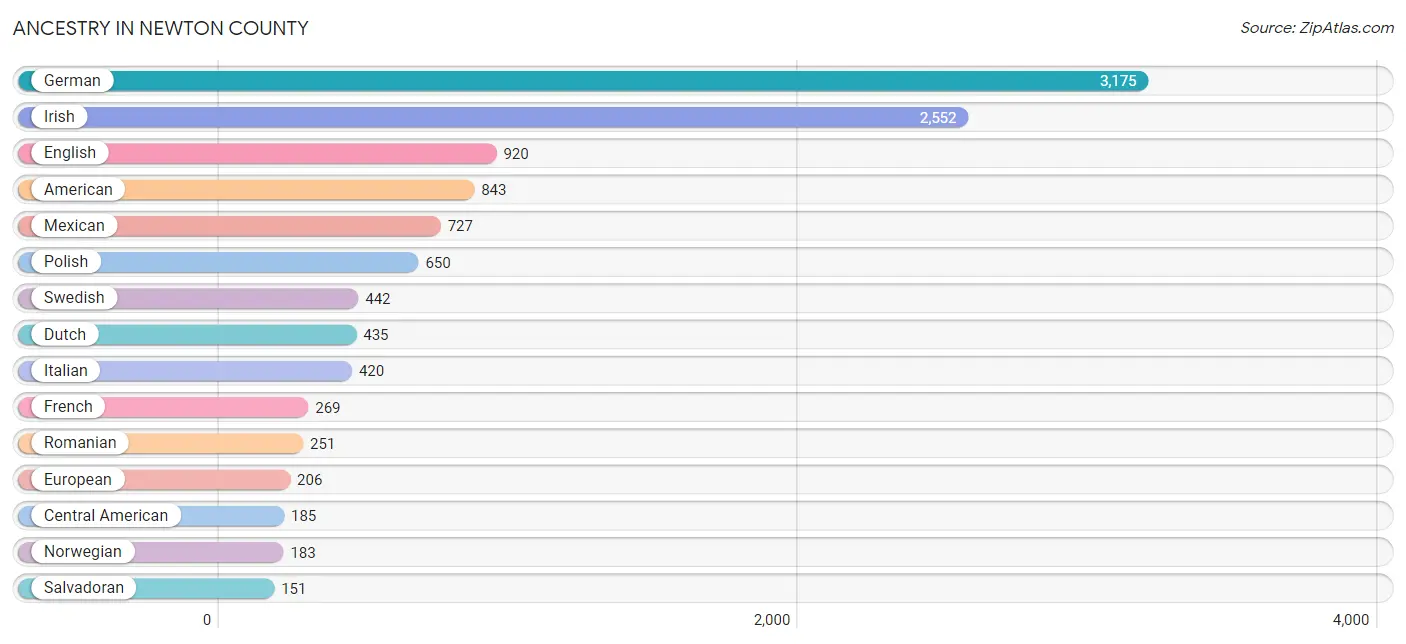
Ancestry in Newton County
The most populous ancestries reported in Newton County are German (3,175 | 23.0%), Irish (2,552 | 18.4%), English (920 | 6.7%), American (843 | 6.1%), and Mexican (727 | 5.3%), together accounting for 59.4% of all Newton County residents.
| Ancestry | # Population | % Population |
| American | 843 | 6.1% |
| Arab | 110 | 0.8% |
| Austrian | 26 | 0.2% |
| Bahamian | 18 | 0.1% |
| Belgian | 2 | 0.0% |
| Blackfeet | 35 | 0.3% |
| British | 19 | 0.1% |
| Burmese | 33 | 0.2% |
| Canadian | 53 | 0.4% |
| Central American | 185 | 1.3% |
| Central American Indian | 2 | 0.0% |
| Cherokee | 80 | 0.6% |
| Chippewa | 5 | 0.0% |
| Costa Rican | 4 | 0.0% |
| Croatian | 45 | 0.3% |
| Cuban | 9 | 0.1% |
| Czech | 8 | 0.1% |
| Danish | 59 | 0.4% |
| Dutch | 435 | 3.2% |
| Eastern European | 37 | 0.3% |
| English | 920 | 6.7% |
| European | 206 | 1.5% |
| Finnish | 2 | 0.0% |
| French | 269 | 1.9% |
| French Canadian | 99 | 0.7% |
| German | 3,175 | 23.0% |
| Greek | 3 | 0.0% |
| Guatemalan | 10 | 0.1% |
| Honduran | 2 | 0.0% |
| Hungarian | 41 | 0.3% |
| Indian (Asian) | 7 | 0.1% |
| Irish | 2,552 | 18.4% |
| Italian | 420 | 3.0% |
| Lebanese | 110 | 0.8% |
| Lithuanian | 15 | 0.1% |
| Mexican | 727 | 5.3% |
| Mexican American Indian | 5 | 0.0% |
| Native Hawaiian | 7 | 0.1% |
| Navajo | 35 | 0.3% |
| Norwegian | 183 | 1.3% |
| Panamanian | 18 | 0.1% |
| Polish | 650 | 4.7% |
| Portuguese | 17 | 0.1% |
| Potawatomi | 3 | 0.0% |
| Puerto Rican | 49 | 0.4% |
| Romanian | 251 | 1.8% |
| Russian | 24 | 0.2% |
| Salvadoran | 151 | 1.1% |
| Scandinavian | 24 | 0.2% |
| Scotch-Irish | 44 | 0.3% |
| Scottish | 147 | 1.1% |
| Serbian | 27 | 0.2% |
| Sioux | 2 | 0.0% |
| Slavic | 5 | 0.0% |
| Slovak | 15 | 0.1% |
| South African | 8 | 0.1% |
| Spanish | 7 | 0.1% |
| Subsaharan African | 8 | 0.1% |
| Swedish | 442 | 3.2% |
| Swiss | 19 | 0.1% |
| Ukrainian | 115 | 0.8% |
| Welsh | 70 | 0.5% |
| Yugoslavian | 33 | 0.2% | View All 63 Rows |
Immigrants in Newton County
The most numerous immigrant groups reported in Newton County came from Latin America (342 | 2.5%), Central America (314 | 2.3%), Mexico (198 | 1.4%), El Salvador (114 | 0.8%), and Europe (61 | 0.4%), together accounting for 7.4% of all Newton County residents.

| Immigration Origin | # Population | % Population |
| Argentina | 5 | 0.0% |
| Asia | 33 | 0.2% |
| Bahamas | 18 | 0.1% |
| Caribbean | 18 | 0.1% |
| Central America | 314 | 2.3% |
| Eastern Asia | 33 | 0.2% |
| Eastern Europe | 55 | 0.4% |
| El Salvador | 114 | 0.8% |
| Europe | 61 | 0.4% |
| Honduras | 2 | 0.0% |
| Italy | 4 | 0.0% |
| Korea | 33 | 0.2% |
| Latin America | 342 | 2.5% |
| Mexico | 198 | 1.4% |
| Netherlands | 2 | 0.0% |
| Poland | 4 | 0.0% |
| Romania | 51 | 0.4% |
| South America | 10 | 0.1% |
| Southern Europe | 4 | 0.0% |
| Uruguay | 5 | 0.0% |
| Western Europe | 2 | 0.0% | View All 21 Rows |
Sex and Age in Newton County
Sex and Age in Newton County
The most populous age groups in Newton County are 55 to 59 Years (601 | 8.4%) for men and 55 to 59 Years (546 | 8.1%) for women.

| Age Bracket | Male | Female |
| Under 5 Years | 390 (5.5%) | 360 (5.4%) |
| 5 to 9 Years | 253 (3.5%) | 434 (6.5%) |
| 10 to 14 Years | 555 (7.8%) | 368 (5.5%) |
| 15 to 19 Years | 477 (6.7%) | 381 (5.7%) |
| 20 to 24 Years | 410 (5.8%) | 315 (4.7%) |
| 25 to 29 Years | 424 (5.9%) | 344 (5.1%) |
| 30 to 34 Years | 397 (5.6%) | 418 (6.2%) |
| 35 to 39 Years | 417 (5.9%) | 486 (7.2%) |
| 40 to 44 Years | 406 (5.7%) | 356 (5.3%) |
| 45 to 49 Years | 415 (5.8%) | 358 (5.3%) |
| 50 to 54 Years | 512 (7.2%) | 460 (6.9%) |
| 55 to 59 Years | 601 (8.4%) | 546 (8.1%) |
| 60 to 64 Years | 593 (8.3%) | 450 (6.7%) |
| 65 to 69 Years | 489 (6.9%) | 486 (7.2%) |
| 70 to 74 Years | 270 (3.8%) | 303 (4.5%) |
| 75 to 79 Years | 275 (3.9%) | 294 (4.4%) |
| 80 to 84 Years | 115 (1.6%) | 217 (3.2%) |
| 85 Years and over | 124 (1.7%) | 130 (1.9%) |
| Total | 7,123 (100.0%) | 6,706 (100.0%) |
Families and Households in Newton County
Median Family Size in Newton County
The median family size in Newton County is 3.00 persons per family, with married-couple families (2,748 | 73.7%) accounting for the largest median family size of 3.04 persons per family. On the other hand, single female/mother families (627 | 16.8%) represent the smallest median family size with 2.86 persons per family.

| Family Type | # Families | Family Size |
| Married-Couple | 2,748 (73.7%) | 3.04 |
| Single Male/Father | 356 (9.5%) | 2.95 |
| Single Female/Mother | 627 (16.8%) | 2.86 |
| Total Families | 3,731 (100.0%) | 3.00 |
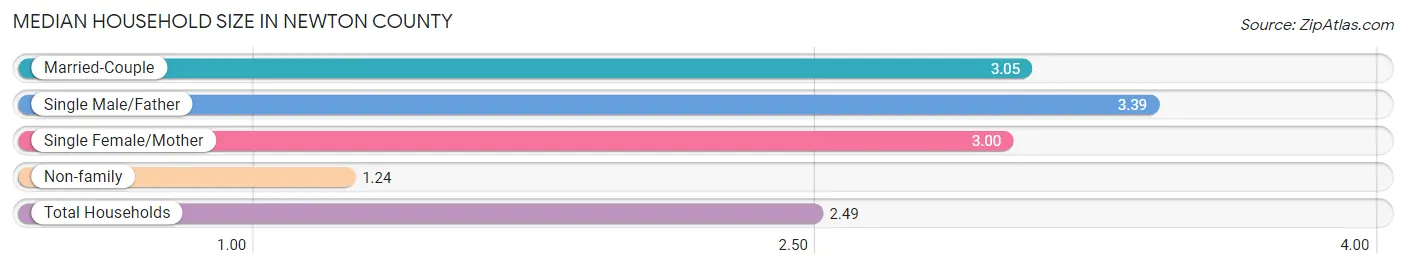
Median Household Size in Newton County
The median household size in Newton County is 2.49 persons per household, with single male/father households (356 | 6.5%) accounting for the largest median household size of 3.39 persons per household. non-family households (1,738 | 31.8%) represent the smallest median household size with 1.24 persons per household.
| Household Type | # Households | Household Size |
| Married-Couple | 2,748 (50.2%) | 3.05 |
| Single Male/Father | 356 (6.5%) | 3.39 |
| Single Female/Mother | 627 (11.5%) | 3.00 |
| Non-family | 1,738 (31.8%) | 1.24 |
| Total Households | 5,469 (100.0%) | 2.49 |
Household Size by Marriage Status in Newton County
Out of a total of 5,469 households in Newton County, 3,731 (68.2%) are family households, while 1,738 (31.8%) are nonfamily households. The most numerous type of family households are 2-person households, comprising 1,815, and the most common type of nonfamily households are 1-person households, comprising 1,422.

| Household Size | Family Households | Nonfamily Households |
| 1-Person Households | - | 1,422 (26.0%) |
| 2-Person Households | 1,815 (33.2%) | 281 (5.1%) |
| 3-Person Households | 734 (13.4%) | 7 (0.1%) |
| 4-Person Households | 581 (10.6%) | 26 (0.5%) |
| 5-Person Households | 377 (6.9%) | 0 (0.0%) |
| 6-Person Households | 116 (2.1%) | 2 (0.0%) |
| 7+ Person Households | 108 (2.0%) | 0 (0.0%) |
| Total | 3,731 (68.2%) | 1,738 (31.8%) |
Female Fertility in Newton County
Fertility by Age in Newton County
Average fertility rate in Newton County is 72.0 births per 1,000 women. Women in the age bracket of 20 to 34 years have the highest fertility rate with 149.0 births per 1,000 women. Women in the age bracket of 20 to 34 years acount for 80.9% of all women with births.

| Age Bracket | Women with Births | Births / 1,000 Women |
| 15 to 19 years | 0 (0.0%) | 0.0 |
| 20 to 34 years | 161 (80.9%) | 149.0 |
| 35 to 50 years | 38 (19.1%) | 29.0 |
| Total | 199 (100.0%) | 72.0 |
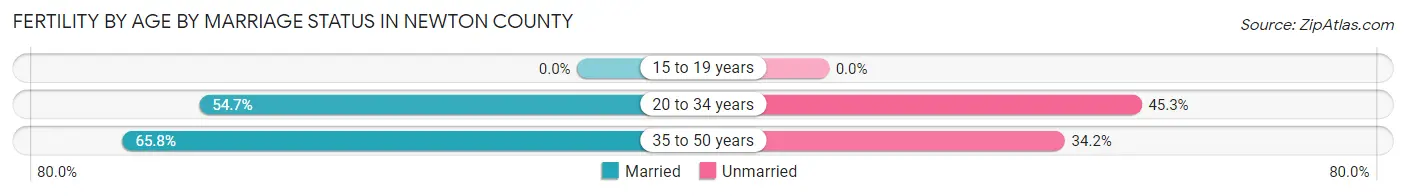
Fertility by Age by Marriage Status in Newton County
56.8% of women with births (199) in Newton County are married. The highest percentage of unmarried women with births falls into 20 to 34 years age bracket with 45.3% of them unmarried at the time of birth, while the lowest percentage of unmarried women with births belong to 35 to 50 years age bracket with 34.2% of them unmarried.
| Age Bracket | Married | Unmarried |
| 15 to 19 years | 0 (0.0%) | 0 (0.0%) |
| 20 to 34 years | 88 (54.7%) | 73 (45.3%) |
| 35 to 50 years | 25 (65.8%) | 13 (34.2%) |
| Total | 113 (56.8%) | 86 (43.2%) |
Fertility by Education in Newton County
Average fertility rate in Newton County is 72.0 births per 1,000 women. Women with the education attainment of bachelor's degree have the highest fertility rate of 143.0 births per 1,000 women, while women with the education attainment of less than high school have the lowest fertility at 26.0 births per 1,000 women. Women with the education attainment of high school diploma represent 39.7% of all women with births.

| Educational Attainment | Women with Births | Births / 1,000 Women |
| Less than High School | 13 (6.5%) | 26.0 |
| High School Diploma | 79 (39.7%) | 82.0 |
| College or Associate's Degree | 35 (17.6%) | 44.0 |
| Bachelor's Degree | 61 (30.6%) | 143.0 |
| Graduate Degree | 11 (5.5%) | 126.0 |
| Total | 199 (100.0%) | 72.0 |
Fertility by Education by Marriage Status in Newton County
43.2% of women with births in Newton County are unmarried. Women with the educational attainment of less than high school are most likely to be married with 100.0% of them married at childbirth, while women with the educational attainment of college or associate's degree are least likely to be married with 91.4% of them unmarried at childbirth.
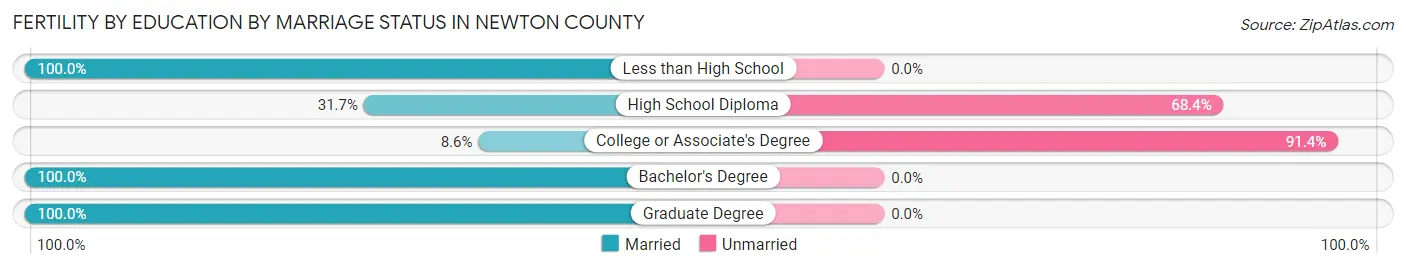
| Educational Attainment | Married | Unmarried |
| Less than High School | 13 (100.0%) | 0 (0.0%) |
| High School Diploma | 25 (31.7%) | 54 (68.3%) |
| College or Associate's Degree | 3 (8.6%) | 32 (91.4%) |
| Bachelor's Degree | 61 (100.0%) | 0 (0.0%) |
| Graduate Degree | 11 (100.0%) | 0 (0.0%) |
| Total | 113 (56.8%) | 86 (43.2%) |
Income in Newton County
Income Overview in Newton County
Per Capita Income in Newton County is $30,168, while median incomes of families and households are $75,704 and $63,673 respectively.
| Characteristic | Number | Measure |
| Per Capita Income | 13,829 | $30,168 |
| Median Family Income | 3,731 | $75,704 |
| Mean Family Income | 3,731 | $85,176 |
| Median Household Income | 5,469 | $63,673 |
| Mean Household Income | 5,469 | $73,581 |
| Income Deficit | 3,731 | $12,112 |
| Wage / Income Gap (%) | 13,829 | 36.11% |
| Wage / Income Gap ($) | 13,829 | 63.89¢ per $1 |
| Gini / Inequality Index | 13,829 | 0.39 |
Earnings by Sex in Newton County
Average Earnings in Newton County are $39,380, $46,205 for men and $29,519 for women, a difference of 36.1%.

| Sex | Number | Average Earnings |
| Male | 3,963 (56.7%) | $46,205 |
| Female | 3,028 (43.3%) | $29,519 |
| Total | 6,991 (100.0%) | $39,380 |
Earnings by Sex by Income Bracket in Newton County
The most common earnings brackets in Newton County are $75,000 to $99,999 for men (629 | 15.9%) and $25,000 to $29,999 for women (428 | 14.1%).

| Income | Male | Female |
| $2,499 or less | 262 (6.6%) | 217 (7.2%) |
| $2,500 to $4,999 | 65 (1.6%) | 56 (1.8%) |
| $5,000 to $7,499 | 96 (2.4%) | 88 (2.9%) |
| $7,500 to $9,999 | 144 (3.6%) | 111 (3.7%) |
| $10,000 to $12,499 | 92 (2.3%) | 43 (1.4%) |
| $12,500 to $14,999 | 45 (1.1%) | 127 (4.2%) |
| $15,000 to $17,499 | 67 (1.7%) | 113 (3.7%) |
| $17,500 to $19,999 | 41 (1.0%) | 118 (3.9%) |
| $20,000 to $22,499 | 39 (1.0%) | 89 (2.9%) |
| $22,500 to $24,999 | 158 (4.0%) | 159 (5.2%) |
| $25,000 to $29,999 | 219 (5.5%) | 428 (14.1%) |
| $30,000 to $34,999 | 90 (2.3%) | 196 (6.5%) |
| $35,000 to $39,999 | 157 (4.0%) | 338 (11.2%) |
| $40,000 to $44,999 | 440 (11.1%) | 176 (5.8%) |
| $45,000 to $49,999 | 279 (7.0%) | 90 (3.0%) |
| $50,000 to $54,999 | 297 (7.5%) | 156 (5.1%) |
| $55,000 to $64,999 | 339 (8.6%) | 261 (8.6%) |
| $65,000 to $74,999 | 188 (4.7%) | 126 (4.2%) |
| $75,000 to $99,999 | 629 (15.9%) | 71 (2.3%) |
| $100,000+ | 316 (8.0%) | 65 (2.1%) |
| Total | 3,963 (100.0%) | 3,028 (100.0%) |
Earnings by Sex by Educational Attainment in Newton County
Average earnings in Newton County are $49,512 for men and $33,382 for women, a difference of 32.6%. Men with an educational attainment of bachelor's degree enjoy the highest average annual earnings of $80,075, while those with less than high school education earn the least with $40,710. Women with an educational attainment of college or associate's degree earn the most with the average annual earnings of $37,300, while those with less than high school education have the smallest earnings of $27,532.
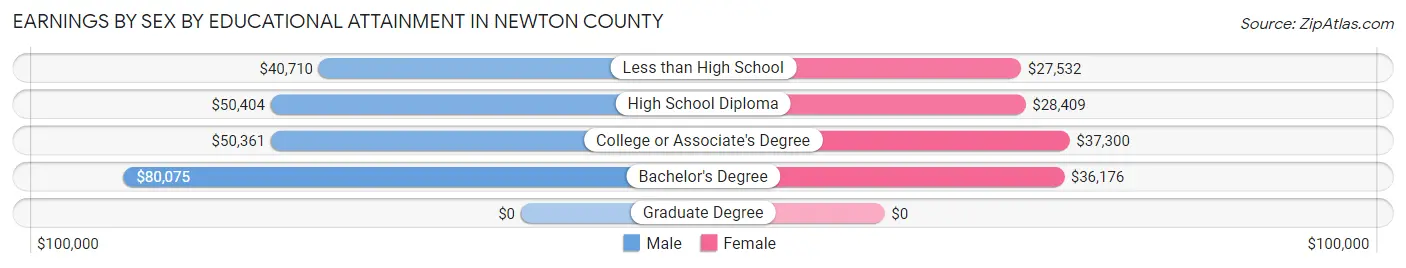
| Educational Attainment | Male Income | Female Income |
| Less than High School | $40,710 | $27,532 |
| High School Diploma | $50,404 | $28,409 |
| College or Associate's Degree | $50,361 | $37,300 |
| Bachelor's Degree | $80,075 | $36,176 |
| Graduate Degree | - | - |
| Total | $49,512 | $33,382 |
Family Income in Newton County
Family Income Brackets in Newton County
According to the Newton County family income data, there are 821 families falling into the $50,000 to $74,999 income range, which is the most common income bracket and makes up 22.0% of all families. Conversely, the $200,000+ income bracket is the least frequent group with only 119 families (3.2%) belonging to this category.

| Income Bracket | # Families | % Families |
| Less than $10,000 | 160 | 4.3% |
| $10,000 to $14,999 | 142 | 3.8% |
| $15,000 to $24,999 | 131 | 3.5% |
| $25,000 to $34,999 | 205 | 5.5% |
| $35,000 to $49,999 | 362 | 9.7% |
| $50,000 to $74,999 | 821 | 22.0% |
| $75,000 to $99,999 | 798 | 21.4% |
| $100,000 to $149,999 | 765 | 20.5% |
| $150,000 to $199,999 | 228 | 6.1% |
| $200,000+ | 119 | 3.2% |
Family Income by Famaliy Size in Newton County
5-person families (327 | 8.8%) account for the highest median family income in Newton County with $94,206 per family, while 2-person families (1,902 | 51.0%) have the highest median income of $36,852 per family member.

| Income Bracket | # Families | Median Income |
| 2-Person Families | 1,902 (51.0%) | $73,704 |
| 3-Person Families | 724 (19.4%) | $61,569 |
| 4-Person Families | 565 (15.1%) | $94,188 |
| 5-Person Families | 327 (8.8%) | $94,206 |
| 6-Person Families | 105 (2.8%) | $71,875 |
| 7+ Person Families | 108 (2.9%) | $76,029 |
| Total | 3,731 (100.0%) | $75,704 |
Family Income by Number of Earners in Newton County
The median family income in Newton County is $75,704, with families comprising 2 earners (1,436) having the highest median family income of $96,912, while families with no earners (603) have the lowest median family income of $34,940, accounting for 38.5% and 16.2% of families, respectively.

| Number of Earners | # Families | Median Income |
| No Earners | 603 (16.2%) | $34,940 |
| 1 Earner | 1,339 (35.9%) | $61,059 |
| 2 Earners | 1,436 (38.5%) | $96,912 |
| 3+ Earners | 353 (9.5%) | $96,875 |
| Total | 3,731 (100.0%) | $75,704 |
Household Income in Newton County
Household Income Brackets in Newton County
With 1,154 households falling in the category, the $50,000 to $74,999 income range is the most frequent in Newton County, accounting for 21.1% of all households. In contrast, only 131 households (2.4%) fall into the $200,000+ income bracket, making it the least populous group.

| Income Bracket | # Households | % Households |
| Less than $10,000 | 328 | 6.0% |
| $10,000 to $14,999 | 268 | 4.9% |
| $15,000 to $24,999 | 355 | 6.5% |
| $25,000 to $34,999 | 465 | 8.5% |
| $35,000 to $49,999 | 667 | 12.2% |
| $50,000 to $74,999 | 1,154 | 21.1% |
| $75,000 to $99,999 | 908 | 16.6% |
| $100,000 to $149,999 | 935 | 17.1% |
| $150,000 to $199,999 | 263 | 4.8% |
| $200,000+ | 131 | 2.4% |
Household Income by Householder Age in Newton County
The median household income in Newton County is $63,673, with the highest median household income of $75,197 found in the 25 to 44 years age bracket for the primary householder. A total of 1,464 households (26.8%) fall into this category. Meanwhile, the 65+ years age bracket for the primary householder has the lowest median household income of $44,630, with 1,704 households (31.2%) in this group.

| Income Bracket | # Households | Median Income |
| 15 to 24 Years | 233 (4.3%) | $59,688 |
| 25 to 44 Years | 1,464 (26.8%) | $75,197 |
| 45 to 64 Years | 2,068 (37.8%) | $71,023 |
| 65+ Years | 1,704 (31.2%) | $44,630 |
| Total | 5,469 (100.0%) | $63,673 |
Poverty in Newton County
Income Below Poverty by Sex and Age in Newton County
With 12.6% poverty level for males and 12.7% for females among the residents of Newton County, 5 year old males and 12 to 14 year old females are the most vulnerable to poverty, with 34 males (34.0%) and 59 females (38.1%) in their respective age groups living below the poverty level.
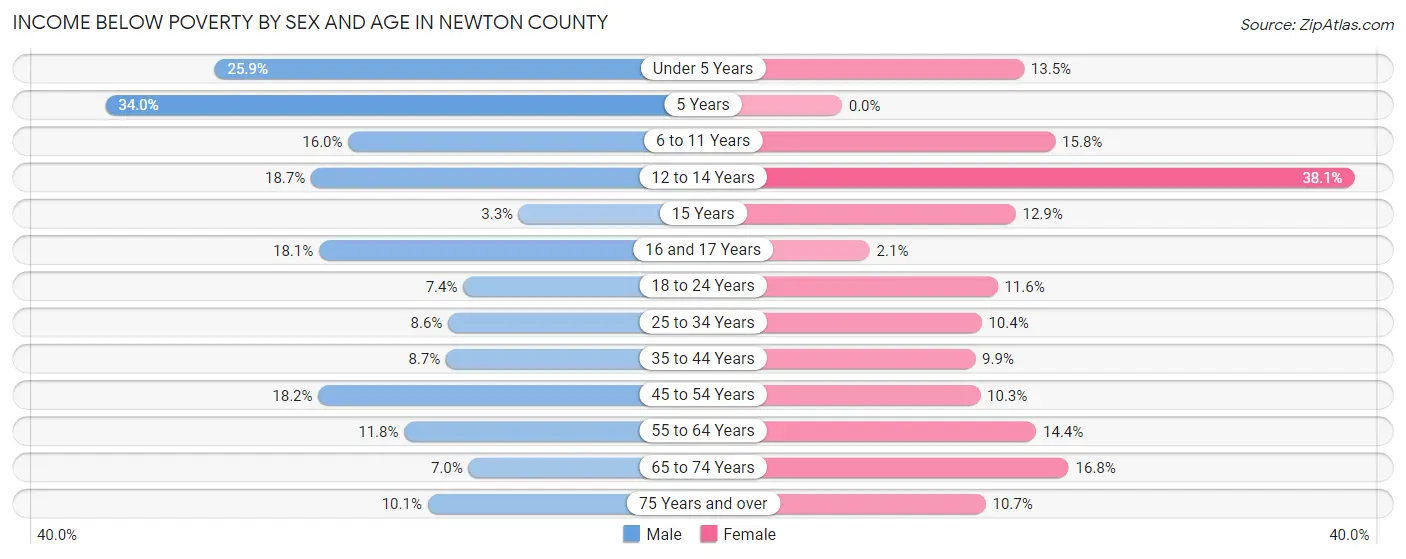
| Age Bracket | Male | Female |
| Under 5 Years | 101 (25.9%) | 48 (13.5%) |
| 5 Years | 34 (34.0%) | 0 (0.0%) |
| 6 to 11 Years | 64 (16.0%) | 83 (15.8%) |
| 12 to 14 Years | 56 (18.7%) | 59 (38.1%) |
| 15 Years | 3 (3.3%) | 8 (12.9%) |
| 16 and 17 Years | 37 (18.1%) | 4 (2.1%) |
| 18 to 24 Years | 44 (7.4%) | 51 (11.6%) |
| 25 to 34 Years | 68 (8.6%) | 79 (10.4%) |
| 35 to 44 Years | 71 (8.7%) | 83 (9.9%) |
| 45 to 54 Years | 167 (18.2%) | 84 (10.3%) |
| 55 to 64 Years | 141 (11.8%) | 142 (14.4%) |
| 65 to 74 Years | 53 (7.0%) | 131 (16.8%) |
| 75 Years and over | 45 (10.1%) | 62 (10.7%) |
| Total | 884 (12.6%) | 834 (12.7%) |
Income Above Poverty by Sex and Age in Newton County
According to the poverty statistics in Newton County, males aged 15 years and females aged 5 years are the age groups that are most secure financially, with 96.7% of males and 100.0% of females in these age groups living above the poverty line.

| Age Bracket | Male | Female |
| Under 5 Years | 289 (74.1%) | 307 (86.5%) |
| 5 Years | 66 (66.0%) | 94 (100.0%) |
| 6 to 11 Years | 337 (84.0%) | 441 (84.2%) |
| 12 to 14 Years | 243 (81.3%) | 96 (61.9%) |
| 15 Years | 88 (96.7%) | 54 (87.1%) |
| 16 and 17 Years | 167 (81.9%) | 189 (97.9%) |
| 18 to 24 Years | 548 (92.6%) | 390 (88.4%) |
| 25 to 34 Years | 727 (91.4%) | 683 (89.6%) |
| 35 to 44 Years | 744 (91.3%) | 755 (90.1%) |
| 45 to 54 Years | 751 (81.8%) | 734 (89.7%) |
| 55 to 64 Years | 1,053 (88.2%) | 843 (85.6%) |
| 65 to 74 Years | 700 (93.0%) | 647 (83.2%) |
| 75 Years and over | 402 (89.9%) | 519 (89.3%) |
| Total | 6,115 (87.4%) | 5,752 (87.3%) |
Income Below Poverty Among Married-Couple Families in Newton County
The poverty statistics for married-couple families in Newton County show that 6.8% or 188 of the total 2,748 families live below the poverty line. Families with 5 or more children have the highest poverty rate of 19.4%, comprising of 21 families. On the other hand, families with no children have the lowest poverty rate of 5.2%, which includes 89 families.

| Children | Above Poverty | Below Poverty |
| No Children | 1,619 (94.8%) | 89 (5.2%) |
| 1 or 2 Children | 668 (90.9%) | 67 (9.1%) |
| 3 or 4 Children | 186 (94.4%) | 11 (5.6%) |
| 5 or more Children | 87 (80.6%) | 21 (19.4%) |
| Total | 2,560 (93.2%) | 188 (6.8%) |
Income Below Poverty Among Single-Parent Households in Newton County
According to the poverty data in Newton County, 14.9% or 53 single-father households and 24.6% or 154 single-mother households are living below the poverty line. Among single-father households, those with 3 or 4 children have the highest poverty rate, with 26 households (74.3%) experiencing poverty. Likewise, among single-mother households, those with 3 or 4 children have the highest poverty rate, with 53 households (70.7%) falling below the poverty line.

| Children | Single Father | Single Mother |
| No Children | 2 (3.8%) | 47 (13.6%) |
| 1 or 2 Children | 25 (9.3%) | 54 (26.2%) |
| 3 or 4 Children | 26 (74.3%) | 53 (70.7%) |
| 5 or more Children | 0 (0.0%) | 0 (0.0%) |
| Total | 53 (14.9%) | 154 (24.6%) |
Income Below Poverty Among Married-Couple vs Single-Parent Households in Newton County
The poverty data for Newton County shows that 188 of the married-couple family households (6.8%) and 207 of the single-parent households (21.1%) are living below the poverty level. Within the married-couple family households, those with 5 or more children have the highest poverty rate, with 21 households (19.4%) falling below the poverty line. Among the single-parent households, those with 3 or 4 children have the highest poverty rate, with 79 household (71.8%) living below poverty.
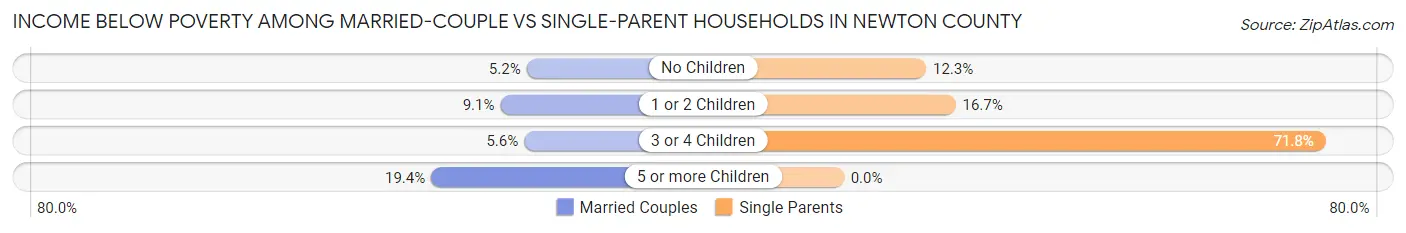
| Children | Married-Couple Families | Single-Parent Households |
| No Children | 89 (5.2%) | 49 (12.3%) |
| 1 or 2 Children | 67 (9.1%) | 79 (16.7%) |
| 3 or 4 Children | 11 (5.6%) | 79 (71.8%) |
| 5 or more Children | 21 (19.4%) | 0 (0.0%) |
| Total | 188 (6.8%) | 207 (21.1%) |
Employment Characteristics in Newton County
Employment by Class of Employer in Newton County
Among the 5,738 employed individuals in Newton County, private company employees (4,154 | 72.4%), self-employed (not incorporated) (404 | 7.0%), and local government employees (354 | 6.2%) make up the most common classes of employment.
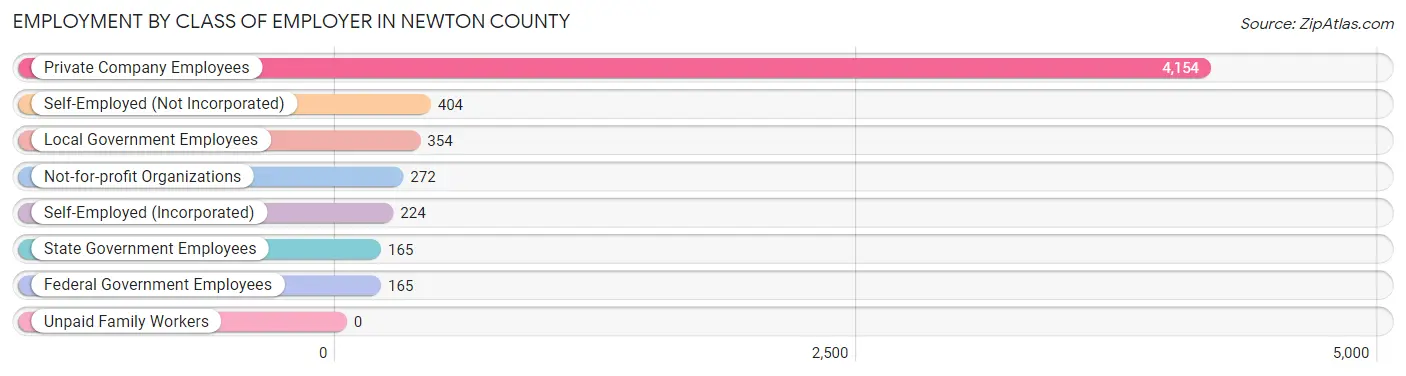
| Employer Class | # Employees | % Employees |
| Private Company Employees | 4,154 | 72.4% |
| Self-Employed (Incorporated) | 224 | 3.9% |
| Self-Employed (Not Incorporated) | 404 | 7.0% |
| Not-for-profit Organizations | 272 | 4.7% |
| Local Government Employees | 354 | 6.2% |
| State Government Employees | 165 | 2.9% |
| Federal Government Employees | 165 | 2.9% |
| Unpaid Family Workers | 0 | 0.0% |
| Total | 5,738 | 100.0% |
Employment Status by Age in Newton County
According to the labor force statistics for Newton County, out of the total population over 16 years of age (11,316), 59.5% or 6,733 individuals are in the labor force, with 9.6% or 646 of them unemployed. The age group with the highest labor force participation rate is 20 to 24 years, with 81.1% or 588 individuals in the labor force. Within the labor force, the 20 to 24 years age range has the highest percentage of unemployed individuals, with 32.1% or 189 of them being unemployed.

| Age Bracket | In Labor Force | Unemployed |
| 16 to 19 Years | 423 (60.0%) | 74 (17.5%) |
| 20 to 24 Years | 588 (81.1%) | 189 (32.1%) |
| 25 to 29 Years | 616 (80.2%) | 8 (1.3%) |
| 30 to 34 Years | 606 (74.4%) | 45 (7.4%) |
| 35 to 44 Years | 1,335 (80.2%) | 75 (5.6%) |
| 45 to 54 Years | 1,298 (74.4%) | 74 (5.7%) |
| 55 to 59 Years | 794 (69.2%) | 171 (21.5%) |
| 60 to 64 Years | 556 (53.3%) | 14 (2.5%) |
| 65 to 74 Years | 455 (29.4%) | 0 (0.0%) |
| 75 Years and over | 64 (5.5%) | 0 (0.0%) |
| Total | 6,733 (59.5%) | 646 (9.6%) |
Employment Status by Educational Attainment in Newton County
According to labor force statistics for Newton County, 72.5% of individuals (5,208) out of the total population between 25 and 64 years of age (7,183) are in the labor force, with 7.4% or 385 of them being unemployed. The group with the highest labor force participation rate are those with the educational attainment of bachelor's degree or higher, with 89.6% or 947 individuals in the labor force. Within the labor force, individuals with less than high school education have the highest percentage of unemployment, with 38.8% or 243 of them being unemployed.
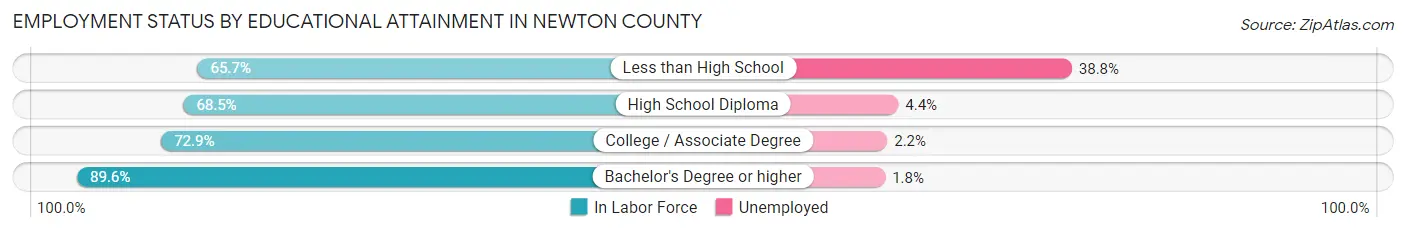
| Educational Attainment | In Labor Force | Unemployed |
| Less than High School | 627 (65.7%) | 370 (38.8%) |
| High School Diploma | 2,153 (68.5%) | 138 (4.4%) |
| College / Associate Degree | 1,479 (72.9%) | 45 (2.2%) |
| Bachelor's Degree or higher | 947 (89.6%) | 19 (1.8%) |
| Total | 5,208 (72.5%) | 532 (7.4%) |
Employment Occupations by Sex in Newton County
Management, Business, Science and Arts Occupations
The most common Management, Business, Science and Arts occupations in Newton County are Management (477 | 7.8%), Community & Social Service (388 | 6.4%), Education Instruction & Library (230 | 3.8%), Health Diagnosing & Treating (226 | 3.7%), and Computers, Engineering & Science (198 | 3.3%).

Management, Business, Science and Arts Occupations by Sex
Within the Management, Business, Science and Arts occupations in Newton County, the most male-oriented occupations are Architecture & Engineering (100.0%), Legal Services & Support (85.7%), and Computers, Engineering & Science (72.2%), while the most female-oriented occupations are Life, Physical & Social Science (100.0%), Health Technologists (97.5%), and Health Diagnosing & Treating (91.1%).
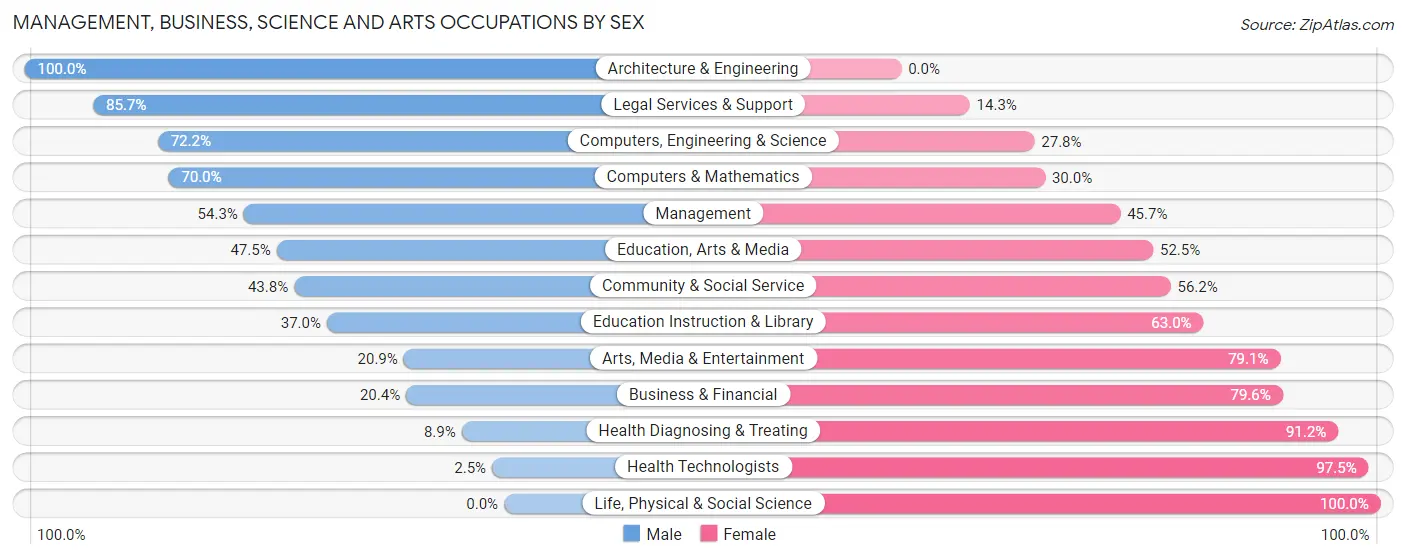
| Occupation | Male | Female |
| Management | 259 (54.3%) | 218 (45.7%) |
| Business & Financial | 28 (20.4%) | 109 (79.6%) |
| Computers, Engineering & Science | 143 (72.2%) | 55 (27.8%) |
| Computers & Mathematics | 42 (70.0%) | 18 (30.0%) |
| Architecture & Engineering | 101 (100.0%) | 0 (0.0%) |
| Life, Physical & Social Science | 0 (0.0%) | 37 (100.0%) |
| Community & Social Service | 170 (43.8%) | 218 (56.2%) |
| Education, Arts & Media | 28 (47.5%) | 31 (52.5%) |
| Legal Services & Support | 48 (85.7%) | 8 (14.3%) |
| Education Instruction & Library | 85 (37.0%) | 145 (63.0%) |
| Arts, Media & Entertainment | 9 (20.9%) | 34 (79.1%) |
| Health Diagnosing & Treating | 20 (8.8%) | 206 (91.1%) |
| Health Technologists | 3 (2.5%) | 116 (97.5%) |
| Total (Category) | 620 (43.5%) | 806 (56.5%) |
| Total (Overall) | 3,331 (54.7%) | 2,755 (45.3%) |
Services Occupations
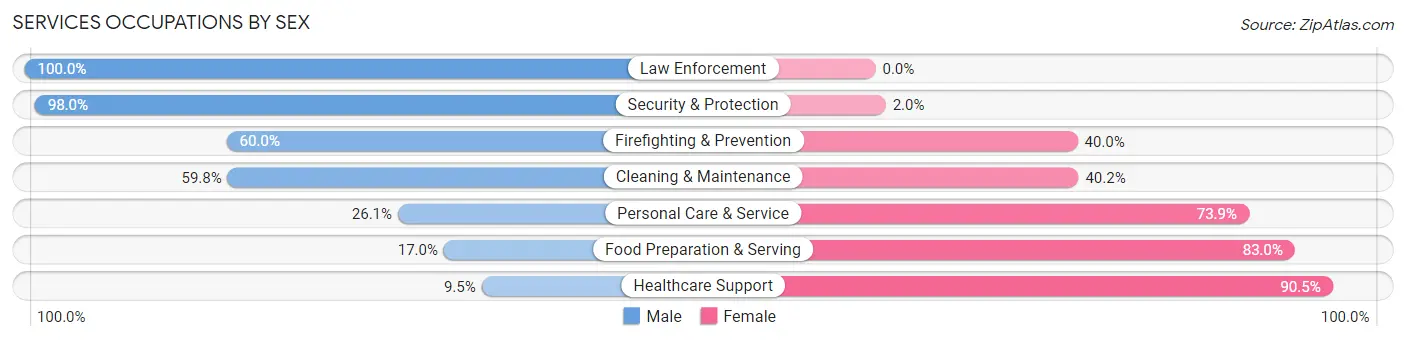
The most common Services occupations in Newton County are Food Preparation & Serving (306 | 5.0%), Cleaning & Maintenance (214 | 3.5%), Healthcare Support (189 | 3.1%), Security & Protection (99 | 1.6%), and Law Enforcement (94 | 1.5%).
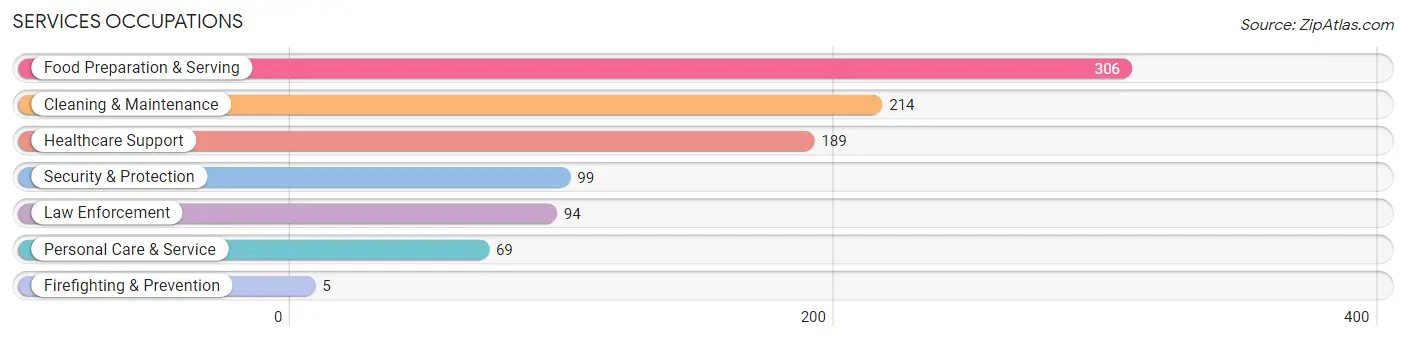
Services Occupations by Sex
Within the Services occupations in Newton County, the most male-oriented occupations are Law Enforcement (100.0%), Security & Protection (98.0%), and Firefighting & Prevention (60.0%), while the most female-oriented occupations are Healthcare Support (90.5%), Food Preparation & Serving (83.0%), and Personal Care & Service (73.9%).
| Occupation | Male | Female |
| Healthcare Support | 18 (9.5%) | 171 (90.5%) |
| Security & Protection | 97 (98.0%) | 2 (2.0%) |
| Firefighting & Prevention | 3 (60.0%) | 2 (40.0%) |
| Law Enforcement | 94 (100.0%) | 0 (0.0%) |
| Food Preparation & Serving | 52 (17.0%) | 254 (83.0%) |
| Cleaning & Maintenance | 128 (59.8%) | 86 (40.2%) |
| Personal Care & Service | 18 (26.1%) | 51 (73.9%) |
| Total (Category) | 313 (35.7%) | 564 (64.3%) |
| Total (Overall) | 3,331 (54.7%) | 2,755 (45.3%) |
Sales and Office Occupations
The most common Sales and Office occupations in Newton County are Office & Administration (615 | 10.1%), and Sales & Related (527 | 8.7%).

Sales and Office Occupations by Sex

| Occupation | Male | Female |
| Sales & Related | 254 (48.2%) | 273 (51.8%) |
| Office & Administration | 68 (11.1%) | 547 (88.9%) |
| Total (Category) | 322 (28.2%) | 820 (71.8%) |
| Total (Overall) | 3,331 (54.7%) | 2,755 (45.3%) |
Natural Resources, Construction and Maintenance Occupations
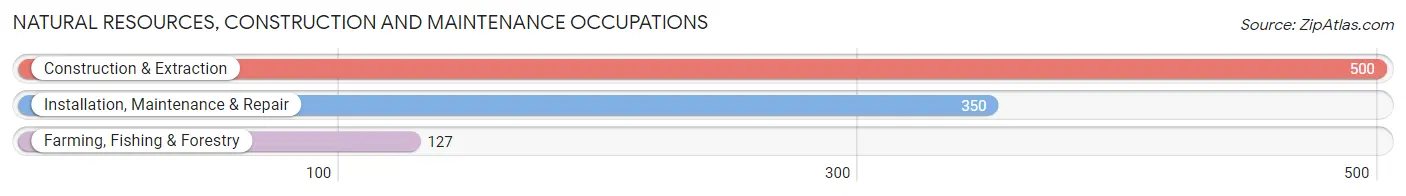
The most common Natural Resources, Construction and Maintenance occupations in Newton County are Construction & Extraction (500 | 8.2%), Installation, Maintenance & Repair (350 | 5.8%), and Farming, Fishing & Forestry (127 | 2.1%).
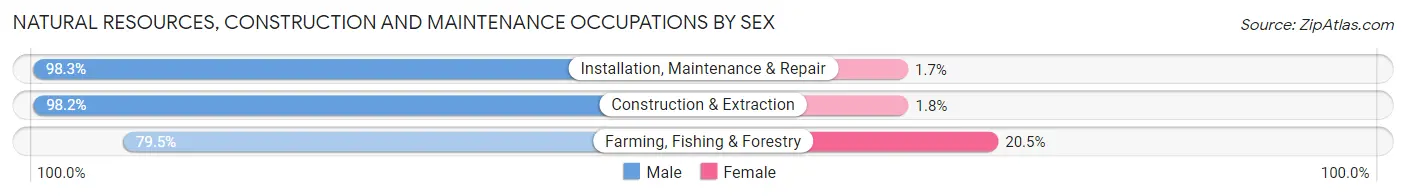
Natural Resources, Construction and Maintenance Occupations by Sex
| Occupation | Male | Female |
| Farming, Fishing & Forestry | 101 (79.5%) | 26 (20.5%) |
| Construction & Extraction | 491 (98.2%) | 9 (1.8%) |
| Installation, Maintenance & Repair | 344 (98.3%) | 6 (1.7%) |
| Total (Category) | 936 (95.8%) | 41 (4.2%) |
| Total (Overall) | 3,331 (54.7%) | 2,755 (45.3%) |
Production, Transportation and Moving Occupations
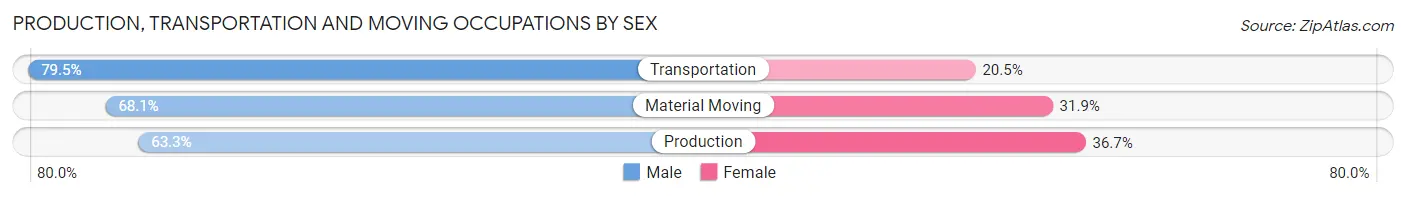
The most common Production, Transportation and Moving occupations in Newton County are Production (1,000 | 16.4%), Transportation (482 | 7.9%), and Material Moving (182 | 3.0%).

Production, Transportation and Moving Occupations by Sex
| Occupation | Male | Female |
| Production | 633 (63.3%) | 367 (36.7%) |
| Transportation | 383 (79.5%) | 99 (20.5%) |
| Material Moving | 124 (68.1%) | 58 (31.9%) |
| Total (Category) | 1,140 (68.5%) | 524 (31.5%) |
| Total (Overall) | 3,331 (54.7%) | 2,755 (45.3%) |
Employment Industries by Sex in Newton County
Employment Industries in Newton County
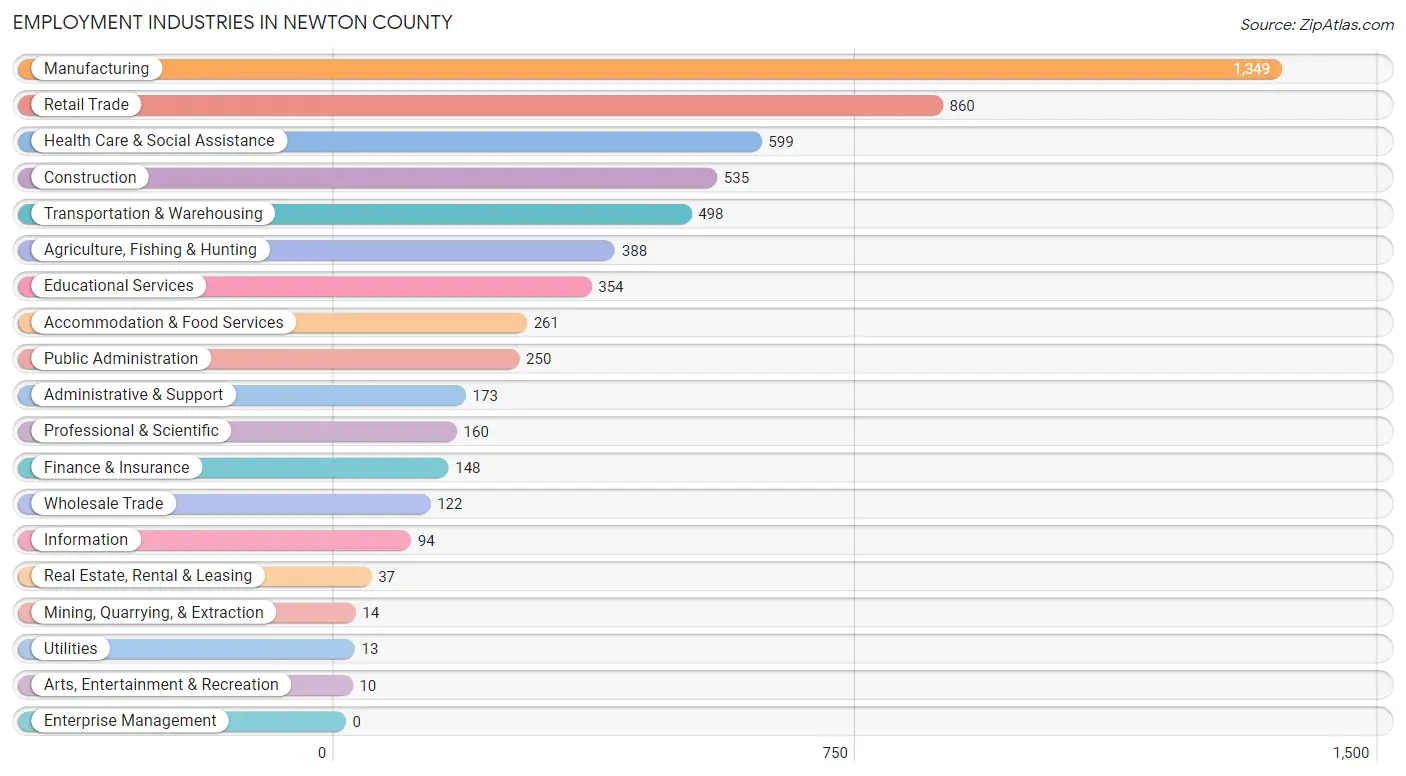
The major employment industries in Newton County include Manufacturing (1,349 | 22.2%), Retail Trade (860 | 14.1%), Health Care & Social Assistance (599 | 9.8%), Construction (535 | 8.8%), and Transportation & Warehousing (498 | 8.2%).
Employment Industries by Sex in Newton County
The Newton County industries that see more men than women are Utilities (100.0%), Construction (97.6%), and Arts, Entertainment & Recreation (80.0%), whereas the industries that tend to have a higher number of women are Health Care & Social Assistance (92.6%), Information (87.2%), and Accommodation & Food Services (85.1%).

| Industry | Male | Female |
| Agriculture, Fishing & Hunting | 305 (78.6%) | 83 (21.4%) |
| Mining, Quarrying, & Extraction | 11 (78.6%) | 3 (21.4%) |
| Construction | 522 (97.6%) | 13 (2.4%) |
| Manufacturing | 929 (68.9%) | 420 (31.1%) |
| Wholesale Trade | 54 (44.3%) | 68 (55.7%) |
| Retail Trade | 363 (42.2%) | 497 (57.8%) |
| Transportation & Warehousing | 361 (72.5%) | 137 (27.5%) |
| Utilities | 13 (100.0%) | 0 (0.0%) |
| Information | 12 (12.8%) | 82 (87.2%) |
| Finance & Insurance | 41 (27.7%) | 107 (72.3%) |
| Real Estate, Rental & Leasing | 9 (24.3%) | 28 (75.7%) |
| Professional & Scientific | 99 (61.9%) | 61 (38.1%) |
| Enterprise Management | 0 (0.0%) | 0 (0.0%) |
| Administrative & Support | 107 (61.9%) | 66 (38.2%) |
| Educational Services | 107 (30.2%) | 247 (69.8%) |
| Health Care & Social Assistance | 44 (7.3%) | 555 (92.6%) |
| Arts, Entertainment & Recreation | 8 (80.0%) | 2 (20.0%) |
| Accommodation & Food Services | 39 (14.9%) | 222 (85.1%) |
| Public Administration | 153 (61.2%) | 97 (38.8%) |
| Total | 3,331 (54.7%) | 2,755 (45.3%) |
Education in Newton County
School Enrollment in Newton County
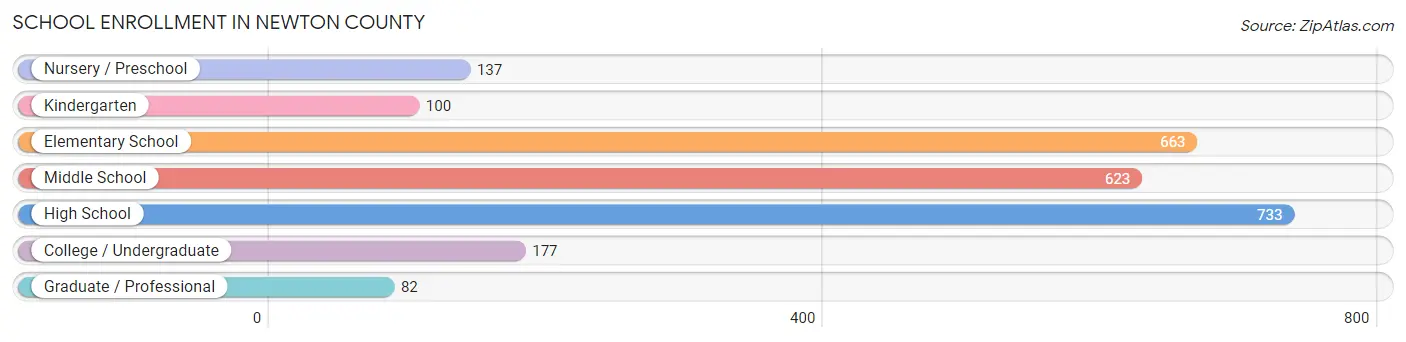
The most common levels of schooling among the 2,515 students in Newton County are high school (733 | 29.1%), elementary school (663 | 26.4%), and middle school (623 | 24.8%).
| School Level | # Students | % Students |
| Nursery / Preschool | 137 | 5.4% |
| Kindergarten | 100 | 4.0% |
| Elementary School | 663 | 26.4% |
| Middle School | 623 | 24.8% |
| High School | 733 | 29.1% |
| College / Undergraduate | 177 | 7.0% |
| Graduate / Professional | 82 | 3.3% |
| Total | 2,515 | 100.0% |
School Enrollment by Age by Funding Source in Newton County
Out of a total of 2,515 students who are enrolled in schools in Newton County, 312 (12.4%) attend a private institution, while the remaining 2,203 (87.6%) are enrolled in public schools. The age group of 3 to 4 year olds has the highest likelihood of being enrolled in private schools, with 23 (28.7% in the age bracket) enrolled. Conversely, the age group of 35 years and over has the lowest likelihood of being enrolled in a private school, with 46 (100.0% in the age bracket) attending a public institution.

| Age Bracket | Public School | Private School |
| 3 to 4 Year Olds | 57 (71.3%) | 23 (28.7%) |
| 5 to 9 Year Old | 551 (91.8%) | 49 (8.2%) |
| 10 to 14 Year Olds | 818 (88.6%) | 105 (11.4%) |
| 15 to 17 Year Olds | 423 (81.0%) | 99 (19.0%) |
| 18 to 19 Year Olds | 182 (90.1%) | 20 (9.9%) |
| 20 to 24 Year Olds | 68 (95.8%) | 3 (4.2%) |
| 25 to 34 Year Olds | 58 (81.7%) | 13 (18.3%) |
| 35 Years and over | 46 (100.0%) | 0 (0.0%) |
| Total | 2,203 (87.6%) | 312 (12.4%) |
Educational Attainment by Field of Study in Newton County
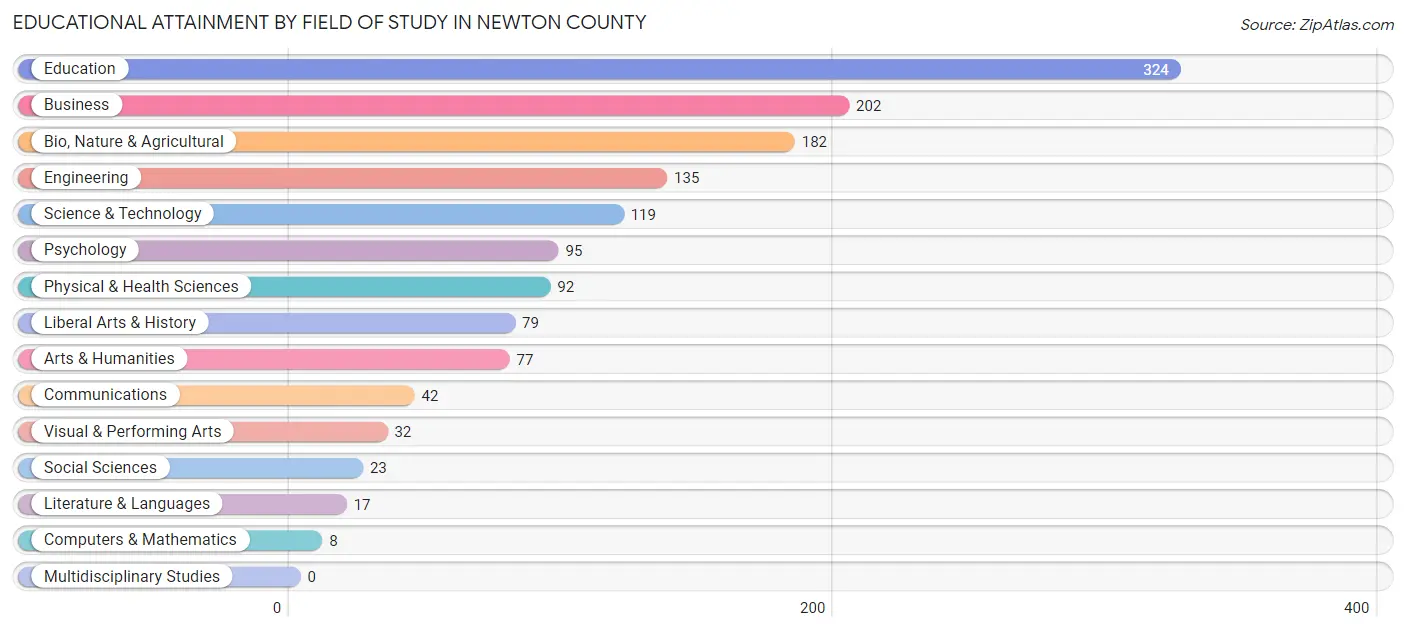
Education (324 | 22.7%), business (202 | 14.2%), bio, nature & agricultural (182 | 12.8%), engineering (135 | 9.5%), and science & technology (119 | 8.3%) are the most common fields of study among 1,427 individuals in Newton County who have obtained a bachelor's degree or higher.
| Field of Study | # Graduates | % Graduates |
| Computers & Mathematics | 8 | 0.6% |
| Bio, Nature & Agricultural | 182 | 12.8% |
| Physical & Health Sciences | 92 | 6.5% |
| Psychology | 95 | 6.7% |
| Social Sciences | 23 | 1.6% |
| Engineering | 135 | 9.5% |
| Multidisciplinary Studies | 0 | 0.0% |
| Science & Technology | 119 | 8.3% |
| Business | 202 | 14.2% |
| Education | 324 | 22.7% |
| Literature & Languages | 17 | 1.2% |
| Liberal Arts & History | 79 | 5.5% |
| Visual & Performing Arts | 32 | 2.2% |
| Communications | 42 | 2.9% |
| Arts & Humanities | 77 | 5.4% |
| Total | 1,427 | 100.0% |
Transportation & Commute in Newton County
Vehicle Availability by Sex in Newton County
The most prevalent vehicle ownership categories in Newton County are males with 2 vehicles (1,204, accounting for 39.0%) and females with 2 vehicles (905, making up 45.4%).

| Vehicles Available | Male | Female |
| No Vehicle | 41 (1.3%) | 47 (1.8%) |
| 1 Vehicle | 481 (15.6%) | 438 (16.5%) |
| 2 Vehicles | 1,204 (39.0%) | 905 (34.2%) |
| 3 Vehicles | 745 (24.1%) | 808 (30.5%) |
| 4 Vehicles | 342 (11.1%) | 260 (9.8%) |
| 5 or more Vehicles | 275 (8.9%) | 192 (7.2%) |
| Total | 3,088 (100.0%) | 2,650 (100.0%) |
Commute Time in Newton County
The most frequently occuring commute durations in Newton County are 30 to 34 minutes (798 commuters, 14.8%), 20 to 24 minutes (709 commuters, 13.1%), and 45 to 59 minutes (596 commuters, 11.1%).

| Commute Time | # Commuters | % Commuters |
| Less than 5 Minutes | 304 | 5.6% |
| 5 to 9 Minutes | 519 | 9.6% |
| 10 to 14 Minutes | 524 | 9.7% |
| 15 to 19 Minutes | 550 | 10.2% |
| 20 to 24 Minutes | 709 | 13.1% |
| 25 to 29 Minutes | 396 | 7.3% |
| 30 to 34 Minutes | 798 | 14.8% |
| 35 to 39 Minutes | 140 | 2.6% |
| 40 to 44 Minutes | 282 | 5.2% |
| 45 to 59 Minutes | 596 | 11.1% |
| 60 to 89 Minutes | 431 | 8.0% |
| 90 or more Minutes | 146 | 2.7% |
Commute Time by Sex in Newton County
The most common commute times in Newton County are 30 to 34 minutes (494 commuters, 16.6%) for males and 20 to 24 minutes (411 commuters, 17.0%) for females.

| Commute Time | Male | Female |
| Less than 5 Minutes | 177 (5.9%) | 127 (5.3%) |
| 5 to 9 Minutes | 235 (7.9%) | 284 (11.8%) |
| 10 to 14 Minutes | 336 (11.3%) | 188 (7.8%) |
| 15 to 19 Minutes | 245 (8.2%) | 305 (12.6%) |
| 20 to 24 Minutes | 298 (10.0%) | 411 (17.0%) |
| 25 to 29 Minutes | 182 (6.1%) | 214 (8.9%) |
| 30 to 34 Minutes | 494 (16.6%) | 304 (12.6%) |
| 35 to 39 Minutes | 60 (2.0%) | 80 (3.3%) |
| 40 to 44 Minutes | 188 (6.3%) | 94 (3.9%) |
| 45 to 59 Minutes | 363 (12.2%) | 233 (9.7%) |
| 60 to 89 Minutes | 278 (9.3%) | 153 (6.3%) |
| 90 or more Minutes | 125 (4.2%) | 21 (0.9%) |
Time of Departure to Work by Sex in Newton County
The most frequent times of departure to work in Newton County are 12:00 AM to 4:59 AM (478, 16.0%) for males and 6:00 AM to 6:29 AM (301, 12.5%) for females.

| Time of Departure | Male | Female |
| 12:00 AM to 4:59 AM | 478 (16.0%) | 149 (6.2%) |
| 5:00 AM to 5:29 AM | 384 (12.9%) | 94 (3.9%) |
| 5:30 AM to 5:59 AM | 397 (13.3%) | 222 (9.2%) |
| 6:00 AM to 6:29 AM | 361 (12.1%) | 301 (12.5%) |
| 6:30 AM to 6:59 AM | 324 (10.9%) | 300 (12.4%) |
| 7:00 AM to 7:29 AM | 419 (14.1%) | 295 (12.2%) |
| 7:30 AM to 7:59 AM | 214 (7.2%) | 201 (8.3%) |
| 8:00 AM to 8:29 AM | 82 (2.8%) | 154 (6.4%) |
| 8:30 AM to 8:59 AM | 24 (0.8%) | 60 (2.5%) |
| 9:00 AM to 9:59 AM | 27 (0.9%) | 239 (9.9%) |
| 10:00 AM to 10:59 AM | 26 (0.9%) | 52 (2.1%) |
| 11:00 AM to 11:59 AM | 40 (1.3%) | 3 (0.1%) |
| 12:00 PM to 3:59 PM | 117 (3.9%) | 211 (8.7%) |
| 4:00 PM to 11:59 PM | 88 (2.9%) | 133 (5.5%) |
| Total | 2,981 (100.0%) | 2,414 (100.0%) |
Housing Occupancy in Newton County
Occupancy by Ownership in Newton County
Of the total 5,469 dwellings in Newton County, owner-occupied units account for 4,512 (82.5%), while renter-occupied units make up 957 (17.5%).

| Occupancy | # Housing Units | % Housing Units |
| Owner Occupied Housing Units | 4,512 | 82.5% |
| Renter-Occupied Housing Units | 957 | 17.5% |
| Total Occupied Housing Units | 5,469 | 100.0% |
Occupancy by Household Size in Newton County

| Household Size | # Housing Units | % Housing Units |
| 1-Person Household | 1,422 | 26.0% |
| 2-Person Household | 2,096 | 38.3% |
| 3-Person Household | 741 | 13.6% |
| 4+ Person Household | 1,210 | 22.1% |
| Total Housing Units | 5,469 | 100.0% |
Occupancy by Ownership by Household Size in Newton County
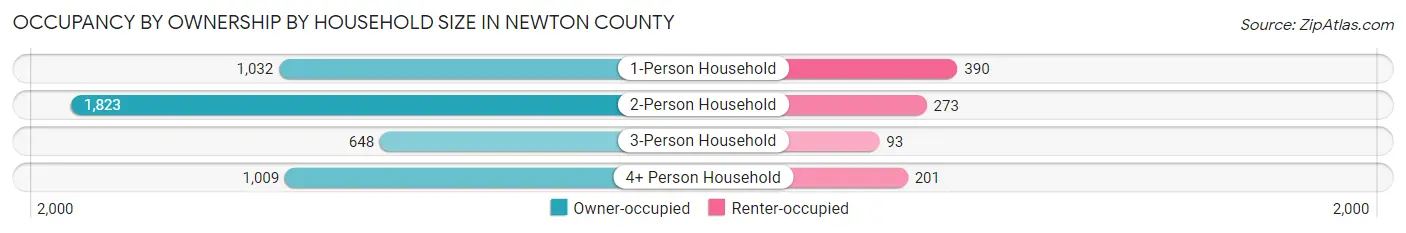
| Household Size | Owner-occupied | Renter-occupied |
| 1-Person Household | 1,032 (72.6%) | 390 (27.4%) |
| 2-Person Household | 1,823 (87.0%) | 273 (13.0%) |
| 3-Person Household | 648 (87.5%) | 93 (12.6%) |
| 4+ Person Household | 1,009 (83.4%) | 201 (16.6%) |
| Total Housing Units | 4,512 (82.5%) | 957 (17.5%) |
Occupancy by Educational Attainment in Newton County
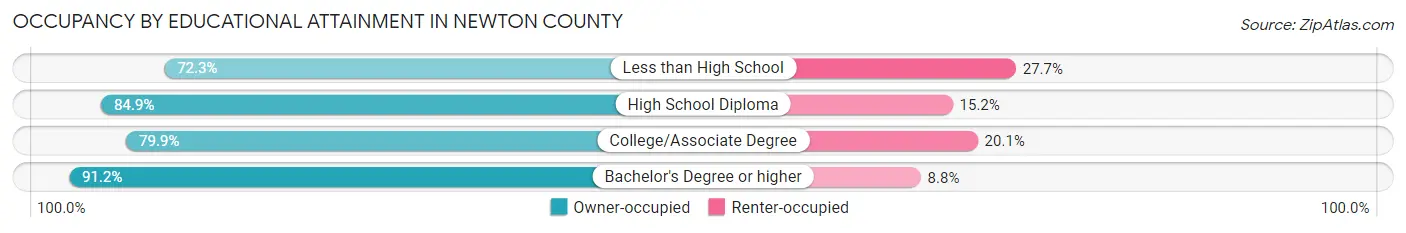
| Household Size | Owner-occupied | Renter-occupied |
| Less than High School | 546 (72.3%) | 209 (27.7%) |
| High School Diploma | 1,955 (84.9%) | 349 (15.1%) |
| College/Associate Degree | 1,318 (79.9%) | 332 (20.1%) |
| Bachelor's Degree or higher | 693 (91.2%) | 67 (8.8%) |
Occupancy by Age of Householder in Newton County

| Age Bracket | # Households | % Households |
| Under 35 Years | 890 | 16.3% |
| 35 to 44 Years | 807 | 14.8% |
| 45 to 54 Years | 870 | 15.9% |
| 55 to 64 Years | 1,198 | 21.9% |
| 65 to 74 Years | 1,011 | 18.5% |
| 75 to 84 Years | 544 | 10.0% |
| 85 Years and Over | 149 | 2.7% |
| Total | 5,469 | 100.0% |
Housing Finances in Newton County
Median Income by Occupancy in Newton County
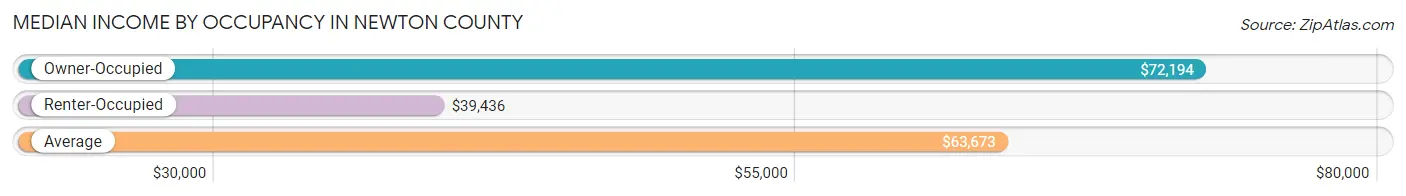
| Occupancy Type | # Households | Median Income |
| Owner-Occupied | 4,512 (82.5%) | $72,194 |
| Renter-Occupied | 957 (17.5%) | $39,436 |
| Average | 5,469 (100.0%) | $63,673 |
Occupancy by Householder Income Bracket in Newton County

| Income Bracket | Owner-occupied | Renter-occupied |
| Less than $5,000 | 149 (3.3%) | 80 (8.4%) |
| $5,000 to $9,999 | 65 (1.4%) | 32 (3.3%) |
| $10,000 to $14,999 | 159 (3.5%) | 109 (11.4%) |
| $15,000 to $19,999 | 122 (2.7%) | 57 (6.0%) |
| $20,000 to $24,999 | 120 (2.7%) | 55 (5.8%) |
| $25,000 to $34,999 | 379 (8.4%) | 84 (8.8%) |
| $35,000 to $49,999 | 508 (11.3%) | 158 (16.5%) |
| $50,000 to $74,999 | 979 (21.7%) | 177 (18.5%) |
| $75,000 to $99,999 | 805 (17.8%) | 104 (10.9%) |
| $100,000 to $149,999 | 843 (18.7%) | 92 (9.6%) |
| $150,000 or more | 383 (8.5%) | 9 (0.9%) |
| Total | 4,512 (100.0%) | 957 (100.0%) |
Monthly Housing Cost Tiers in Newton County
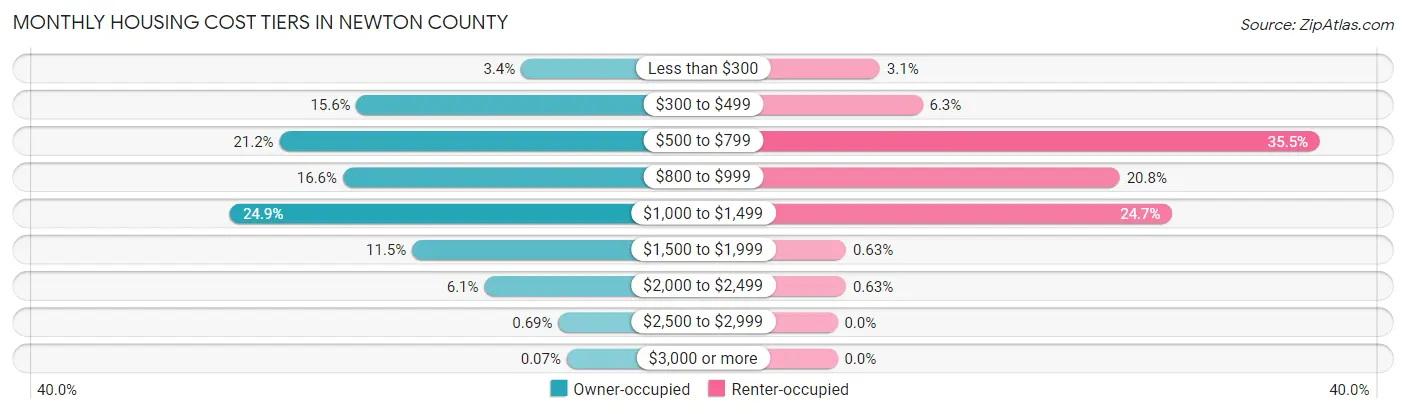
| Monthly Cost | Owner-occupied | Renter-occupied |
| Less than $300 | 155 (3.4%) | 30 (3.1%) |
| $300 to $499 | 702 (15.6%) | 60 (6.3%) |
| $500 to $799 | 958 (21.2%) | 340 (35.5%) |
| $800 to $999 | 747 (16.6%) | 199 (20.8%) |
| $1,000 to $1,499 | 1,122 (24.9%) | 236 (24.7%) |
| $1,500 to $1,999 | 517 (11.5%) | 6 (0.6%) |
| $2,000 to $2,499 | 277 (6.1%) | 6 (0.6%) |
| $2,500 to $2,999 | 31 (0.7%) | 0 (0.0%) |
| $3,000 or more | 3 (0.1%) | 0 (0.0%) |
| Total | 4,512 (100.0%) | 957 (100.0%) |
Physical Housing Characteristics in Newton County
Housing Structures in Newton County
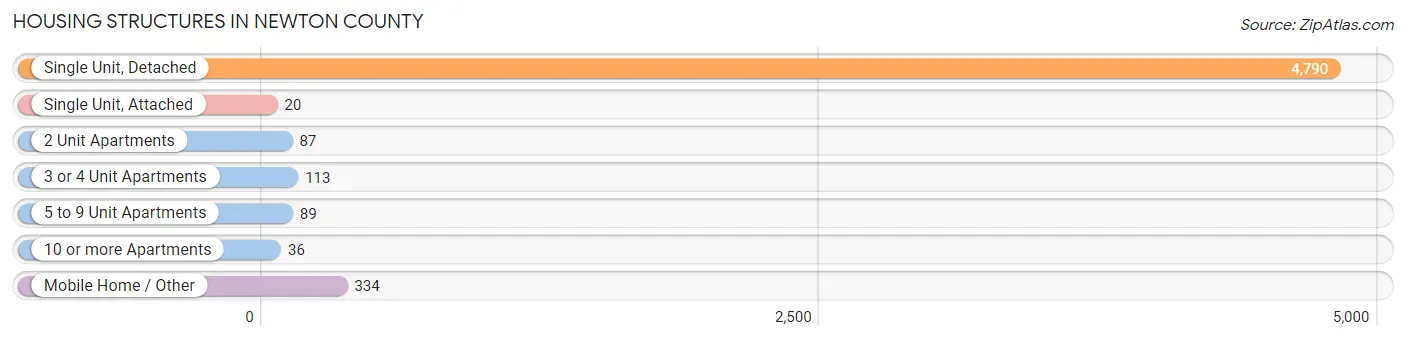
| Structure Type | # Housing Units | % Housing Units |
| Single Unit, Detached | 4,790 | 87.6% |
| Single Unit, Attached | 20 | 0.4% |
| 2 Unit Apartments | 87 | 1.6% |
| 3 or 4 Unit Apartments | 113 | 2.1% |
| 5 to 9 Unit Apartments | 89 | 1.6% |
| 10 or more Apartments | 36 | 0.7% |
| Mobile Home / Other | 334 | 6.1% |
| Total | 5,469 | 100.0% |
Housing Structures by Occupancy in Newton County
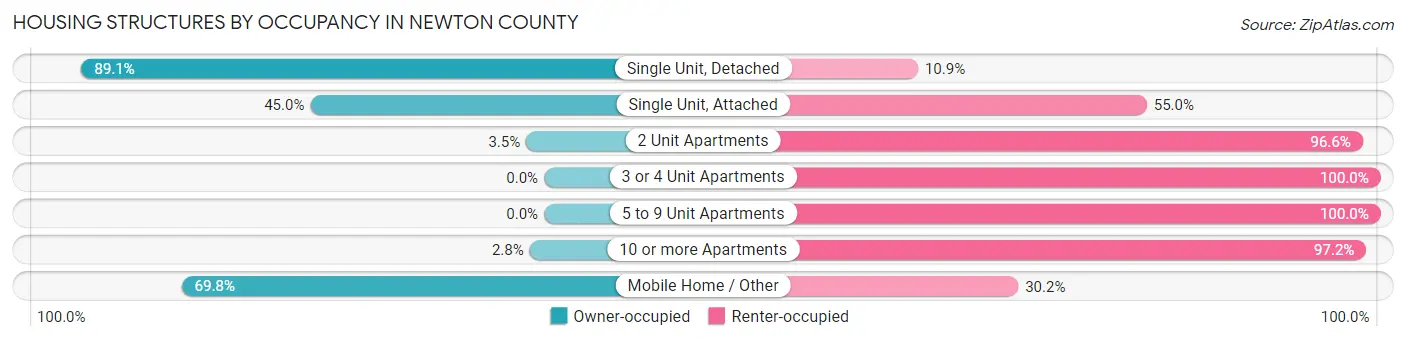
| Structure Type | Owner-occupied | Renter-occupied |
| Single Unit, Detached | 4,266 (89.1%) | 524 (10.9%) |
| Single Unit, Attached | 9 (45.0%) | 11 (55.0%) |
| 2 Unit Apartments | 3 (3.5%) | 84 (96.6%) |
| 3 or 4 Unit Apartments | 0 (0.0%) | 113 (100.0%) |
| 5 to 9 Unit Apartments | 0 (0.0%) | 89 (100.0%) |
| 10 or more Apartments | 1 (2.8%) | 35 (97.2%) |
| Mobile Home / Other | 233 (69.8%) | 101 (30.2%) |
| Total | 4,512 (82.5%) | 957 (17.5%) |
Housing Structures by Number of Rooms in Newton County

| Number of Rooms | Owner-occupied | Renter-occupied |
| 1 Room | 0 (0.0%) | 13 (1.4%) |
| 2 or 3 Rooms | 54 (1.2%) | 135 (14.1%) |
| 4 or 5 Rooms | 1,440 (31.9%) | 448 (46.8%) |
| 6 or 7 Rooms | 1,489 (33.0%) | 257 (26.9%) |
| 8 or more Rooms | 1,529 (33.9%) | 104 (10.9%) |
| Total | 4,512 (100.0%) | 957 (100.0%) |
Housing Structure by Heating Type in Newton County

| Heating Type | Owner-occupied | Renter-occupied |
| Utility Gas | 2,587 (57.3%) | 533 (55.7%) |
| Bottled, Tank, or LP Gas | 1,237 (27.4%) | 209 (21.8%) |
| Electricity | 366 (8.1%) | 185 (19.3%) |
| Fuel Oil or Kerosene | 56 (1.2%) | 13 (1.4%) |
| Coal or Coke | 0 (0.0%) | 0 (0.0%) |
| All other Fuels | 262 (5.8%) | 15 (1.6%) |
| No Fuel Used | 4 (0.1%) | 2 (0.2%) |
| Total | 4,512 (100.0%) | 957 (100.0%) |
Household Vehicle Usage in Newton County
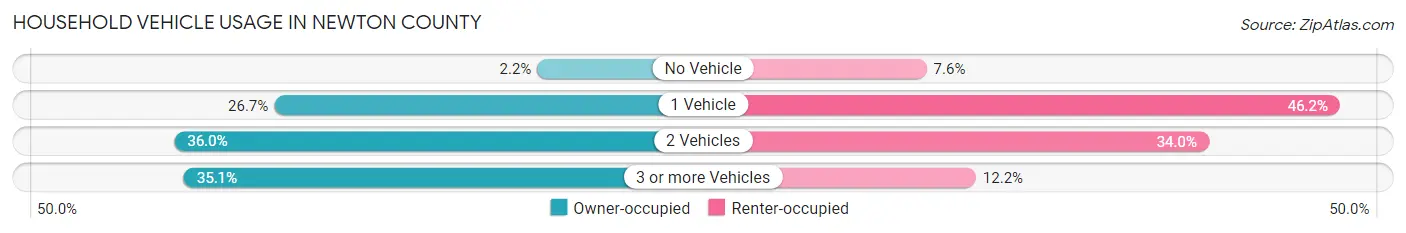
| Vehicles per Household | Owner-occupied | Renter-occupied |
| No Vehicle | 97 (2.1%) | 73 (7.6%) |
| 1 Vehicle | 1,205 (26.7%) | 442 (46.2%) |
| 2 Vehicles | 1,625 (36.0%) | 325 (34.0%) |
| 3 or more Vehicles | 1,585 (35.1%) | 117 (12.2%) |
| Total | 4,512 (100.0%) | 957 (100.0%) |
Real Estate & Mortgages in Newton County
Real Estate and Mortgage Overview in Newton County
| Characteristic | Without Mortgage | With Mortgage |
| Housing Units | 1,755 | 2,757 |
| Median Property Value | $136,500 | $158,200 |
| Median Household Income | $56,920 | $310 |
| Monthly Housing Costs | $513 | $3 |
| Real Estate Taxes | $1,237 | $30 |
Property Value by Mortgage Status in Newton County

| Property Value | Without Mortgage | With Mortgage |
| Less than $50,000 | 247 (14.1%) | 37 (1.3%) |
| $50,000 to $99,999 | 348 (19.8%) | 630 (22.9%) |
| $100,000 to $299,999 | 1,014 (57.8%) | 1,770 (64.2%) |
| $300,000 to $499,999 | 132 (7.5%) | 307 (11.1%) |
| $500,000 to $749,999 | 0 (0.0%) | 13 (0.5%) |
| $750,000 to $999,999 | 0 (0.0%) | 0 (0.0%) |
| $1,000,000 or more | 14 (0.8%) | 0 (0.0%) |
| Total | 1,755 (100.0%) | 2,757 (100.0%) |
Household Income by Mortgage Status in Newton County
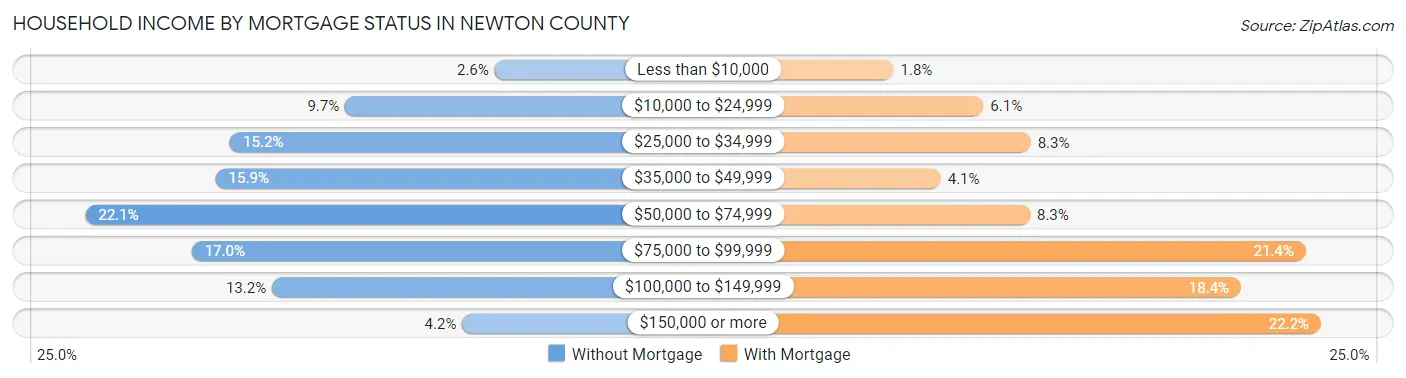
| Household Income | Without Mortgage | With Mortgage |
| Less than $10,000 | 46 (2.6%) | 50 (1.8%) |
| $10,000 to $24,999 | 171 (9.7%) | 168 (6.1%) |
| $25,000 to $34,999 | 267 (15.2%) | 230 (8.3%) |
| $35,000 to $49,999 | 279 (15.9%) | 112 (4.1%) |
| $50,000 to $74,999 | 388 (22.1%) | 229 (8.3%) |
| $75,000 to $99,999 | 299 (17.0%) | 591 (21.4%) |
| $100,000 to $149,999 | 232 (13.2%) | 506 (18.3%) |
| $150,000 or more | 73 (4.2%) | 611 (22.2%) |
| Total | 1,755 (100.0%) | 2,757 (100.0%) |
Property Value to Household Income Ratio in Newton County
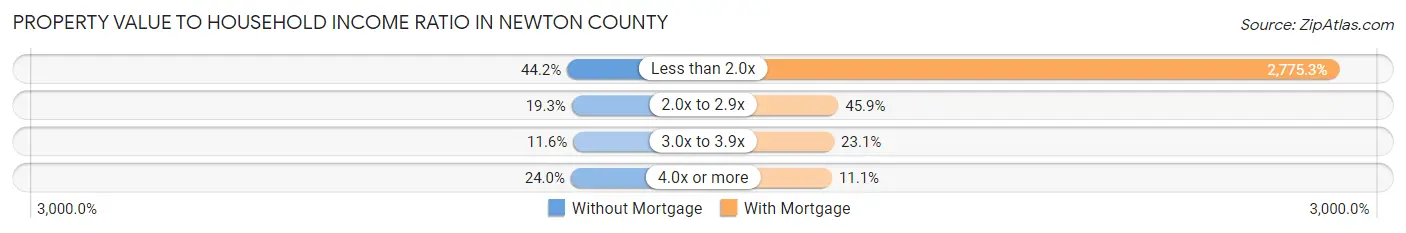
| Value-to-Income Ratio | Without Mortgage | With Mortgage |
| Less than 2.0x | 776 (44.2%) | 76,516 (2,775.3%) |
| 2.0x to 2.9x | 339 (19.3%) | 1,264 (45.9%) |
| 3.0x to 3.9x | 203 (11.6%) | 637 (23.1%) |
| 4.0x or more | 421 (24.0%) | 307 (11.1%) |
| Total | 1,755 (100.0%) | 2,757 (100.0%) |
Real Estate Taxes by Mortgage Status in Newton County
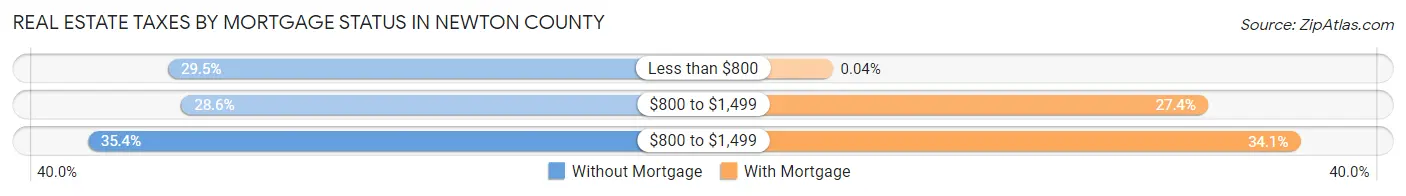
| Property Taxes | Without Mortgage | With Mortgage |
| Less than $800 | 518 (29.5%) | 1 (0.0%) |
| $800 to $1,499 | 501 (28.5%) | 755 (27.4%) |
| $800 to $1,499 | 621 (35.4%) | 941 (34.1%) |
| Total | 1,755 (100.0%) | 2,757 (100.0%) |
Health & Disability in Newton County
Health Insurance Coverage by Age in Newton County
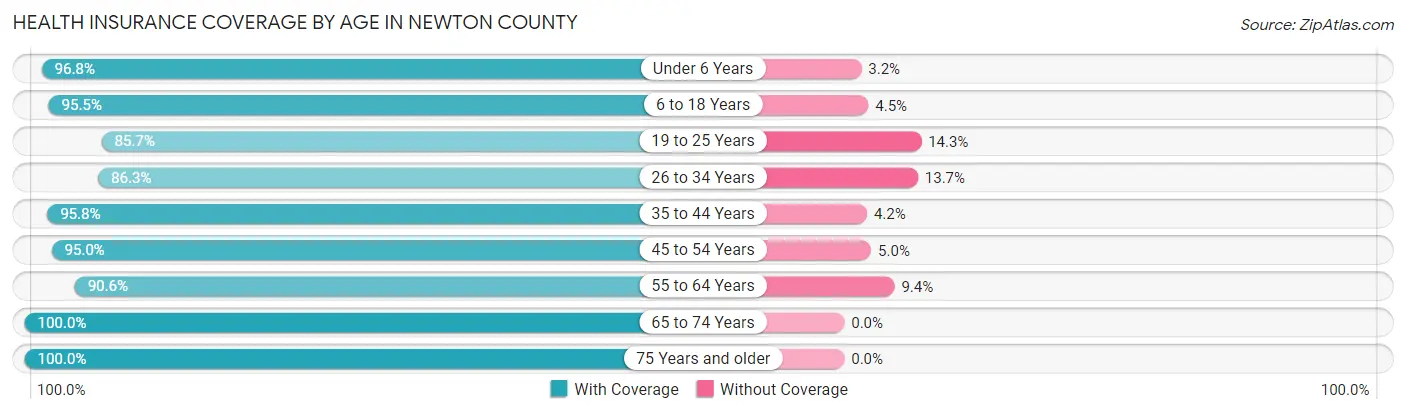
| Age Bracket | With Coverage | Without Coverage |
| Under 6 Years | 914 (96.8%) | 30 (3.2%) |
| 6 to 18 Years | 2,049 (95.5%) | 96 (4.5%) |
| 19 to 25 Years | 860 (85.7%) | 144 (14.3%) |
| 26 to 34 Years | 1,214 (86.3%) | 193 (13.7%) |
| 35 to 44 Years | 1,583 (95.8%) | 70 (4.2%) |
| 45 to 54 Years | 1,649 (95.0%) | 87 (5.0%) |
| 55 to 64 Years | 1,975 (90.6%) | 204 (9.4%) |
| 65 to 74 Years | 1,531 (100.0%) | 0 (0.0%) |
| 75 Years and older | 1,028 (100.0%) | 0 (0.0%) |
| Total | 12,803 (94.0%) | 824 (6.0%) |
Health Insurance Coverage by Citizenship Status in Newton County
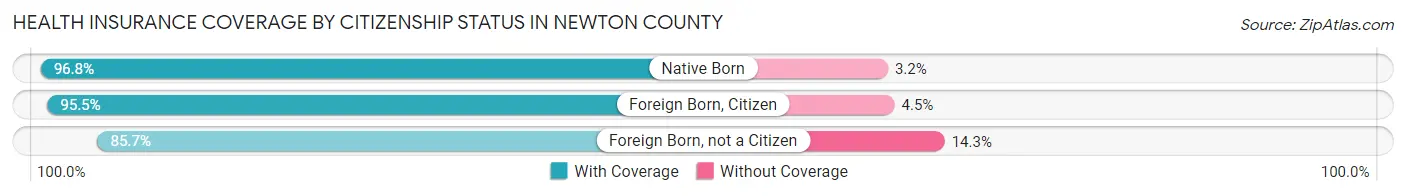
| Citizenship Status | With Coverage | Without Coverage |
| Native Born | 914 (96.8%) | 30 (3.2%) |
| Foreign Born, Citizen | 2,049 (95.5%) | 96 (4.5%) |
| Foreign Born, not a Citizen | 860 (85.7%) | 144 (14.3%) |
Health Insurance Coverage by Household Income in Newton County
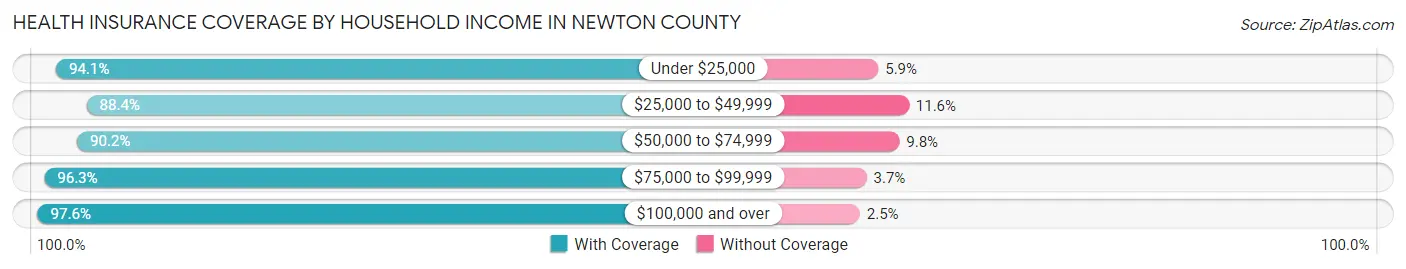
| Household Income | With Coverage | Without Coverage |
| Under $25,000 | 1,595 (94.1%) | 100 (5.9%) |
| $25,000 to $49,999 | 2,006 (88.4%) | 264 (11.6%) |
| $50,000 to $74,999 | 2,281 (90.2%) | 249 (9.8%) |
| $75,000 to $99,999 | 2,776 (96.3%) | 107 (3.7%) |
| $100,000 and over | 4,141 (97.6%) | 104 (2.5%) |
Public vs Private Health Insurance Coverage by Age in Newton County

| Age Bracket | Public Insurance | Private Insurance |
| Under 6 | 503 (53.3%) | 510 (54.0%) |
| 6 to 18 Years | 648 (30.2%) | 1,460 (68.1%) |
| 19 to 25 Years | 217 (21.6%) | 653 (65.0%) |
| 25 to 34 Years | 193 (13.7%) | 1,050 (74.6%) |
| 35 to 44 Years | 362 (21.9%) | 1,252 (75.7%) |
| 45 to 54 Years | 541 (31.2%) | 1,152 (66.4%) |
| 55 to 64 Years | 551 (25.3%) | 1,669 (76.6%) |
| 65 to 74 Years | 1,491 (97.4%) | 970 (63.4%) |
| 75 Years and over | 1,027 (99.9%) | 705 (68.6%) |
| Total | 5,533 (40.6%) | 9,421 (69.1%) |
Disability Status by Sex by Age in Newton County

| Age Bracket | Male | Female |
| Under 5 Years | 0 (0.0%) | 0 (0.0%) |
| 5 to 17 Years | 171 (15.5%) | 41 (3.9%) |
| 18 to 34 Years | 222 (16.0%) | 82 (6.8%) |
| 35 to 64 Years | 509 (17.4%) | 495 (18.7%) |
| 65 to 74 Years | 244 (32.4%) | 237 (30.5%) |
| 75 Years and over | 229 (51.2%) | 196 (33.7%) |
Disability Class by Sex by Age in Newton County
Disability Class: Hearing Difficulty

| Age Bracket | Male | Female |
| Under 5 Years | 0 (0.0%) | 0 (0.0%) |
| 5 to 17 Years | 54 (4.9%) | 0 (0.0%) |
| 18 to 34 Years | 3 (0.2%) | 13 (1.1%) |
| 35 to 64 Years | 59 (2.0%) | 35 (1.3%) |
| 65 to 74 Years | 71 (9.4%) | 31 (4.0%) |
| 75 Years and over | 172 (38.5%) | 96 (16.5%) |
Disability Class: Vision Difficulty

| Age Bracket | Male | Female |
| Under 5 Years | 0 (0.0%) | 0 (0.0%) |
| 5 to 17 Years | 19 (1.7%) | 17 (1.6%) |
| 18 to 34 Years | 12 (0.9%) | 45 (3.7%) |
| 35 to 64 Years | 78 (2.7%) | 123 (4.7%) |
| 65 to 74 Years | 16 (2.1%) | 50 (6.4%) |
| 75 Years and over | 82 (18.3%) | 48 (8.3%) |
Disability Class: Cognitive Difficulty

| Age Bracket | Male | Female |
| 5 to 17 Years | 98 (8.9%) | 24 (2.3%) |
| 18 to 34 Years | 185 (13.3%) | 47 (3.9%) |
| 35 to 64 Years | 187 (6.4%) | 172 (6.5%) |
| 65 to 74 Years | 178 (23.6%) | 90 (11.6%) |
| 75 Years and over | 76 (17.0%) | 68 (11.7%) |
Disability Class: Ambulatory Difficulty

| Age Bracket | Male | Female |
| 5 to 17 Years | 4 (0.4%) | 0 (0.0%) |
| 18 to 34 Years | 22 (1.6%) | 17 (1.4%) |
| 35 to 64 Years | 386 (13.2%) | 371 (14.1%) |
| 65 to 74 Years | 173 (23.0%) | 187 (24.0%) |
| 75 Years and over | 81 (18.1%) | 161 (27.7%) |
Disability Class: Self-Care Difficulty

| Age Bracket | Male | Female |
| 5 to 17 Years | 0 (0.0%) | 0 (0.0%) |
| 18 to 34 Years | 0 (0.0%) | 8 (0.7%) |
| 35 to 64 Years | 154 (5.3%) | 121 (4.6%) |
| 65 to 74 Years | 28 (3.7%) | 89 (11.4%) |
| 75 Years and over | 45 (10.1%) | 60 (10.3%) |
Technology Access in Newton County
Computing Device Access in Newton County
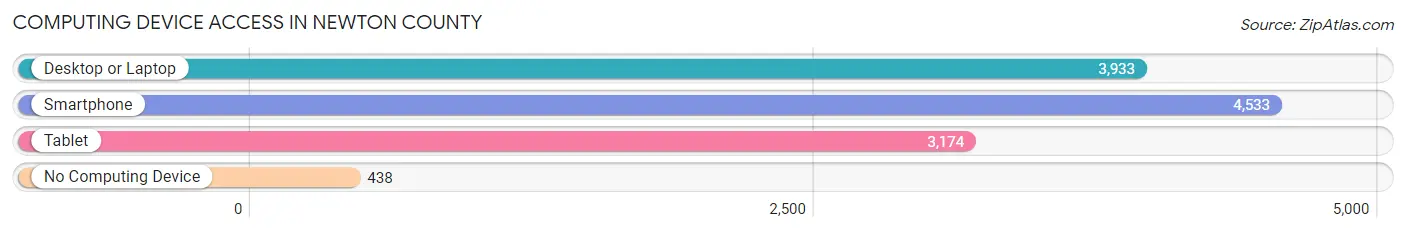
| Device Type | # Households | % Households |
| Desktop or Laptop | 3,933 | 71.9% |
| Smartphone | 4,533 | 82.9% |
| Tablet | 3,174 | 58.0% |
| No Computing Device | 438 | 8.0% |
| Total | 5,469 | 100.0% |
Internet Access in Newton County

| Internet Type | # Households | % Households |
| Dial-Up Internet | 47 | 0.9% |
| Broadband Home | 3,538 | 64.7% |
| Cellular Data Only | 791 | 14.5% |
| Satellite Internet | 583 | 10.7% |
| No Internet | 610 | 11.2% |
| Total | 5,469 | 100.0% |
Newton County Summary
Newton County is located in the northwest corner of Indiana, and is part of the Chicago metropolitan area. It is bordered by Lake Michigan to the north, Jasper County to the east, Porter County to the south, and LaPorte County to the west. The county seat is Kentland, and the largest city is Morocco. The county was established in 1836 and named after Sgt. John Newton, a Revolutionary War hero.
Geography
Newton County is located in the Northwestern Lowlands region of Indiana. The county is mostly flat, with some rolling hills in the northern and western parts. The Kankakee River flows through the county, and there are several small lakes and ponds scattered throughout. The county is mostly rural, with some small towns and villages. The largest city is Morocco, with a population of about 1,500.
The climate of Newton County is humid continental, with hot summers and cold winters. The average annual temperature is around 50°F, and the average annual precipitation is around 40 inches.
Economy
The economy of Newton County is largely agricultural. The county is home to several large farms, and the main crops are corn, soybeans, and wheat. There are also several small businesses in the county, including manufacturing, retail, and service industries.
The unemployment rate in Newton County is slightly higher than the state average, but the median household income is slightly lower than the state average. The poverty rate is also slightly higher than the state average.
Demographics
As of the 2010 census, the population of Newton County was 14,244. The racial makeup of the county was 95.3% White, 0.7% African American, 0.3% Native American, 0.3% Asian, 0.1% Pacific Islander, 1.7% from other races, and 1.5% from two or more races. Hispanic or Latino of any race were 3.2% of the population.
The median age in Newton County was 38.7 years, and the median household income was $45,845. The per capita income was $20,945. About 11.2% of the population was below the poverty line.
Conclusion
Newton County is a rural county located in the northwest corner of Indiana. It is mostly agricultural, with some small businesses and manufacturing. The population is mostly white, with a small percentage of other races. The median household income is slightly lower than the state average, and the poverty rate is slightly higher.
Common Questions
What is the Total Population of Newton County?
Total Population of Newton County is 13,829.
What is the Total Male Population of Newton County?
Total Male Population of Newton County is 7,123.
What is the Total Female Population of Newton County?
Total Female Population of Newton County is 6,706.
What is the Ratio of Males per 100 Females in Newton County?
There are 106.22 Males per 100 Females in Newton County.
What is the Ratio of Females per 100 Males in Newton County?
There are 94.15 Females per 100 Males in Newton County.
What is the Median Population Age in Newton County?
Median Population Age in Newton County is 42.7 Years.
What is the Average Family Size in Newton County
Average Family Size in Newton County is 3.0 People.
What is the Average Household Size in Newton County
Average Household Size in Newton County is 2.5 People.
What is Per Capita Income in Newton County?
Per Capita income in Newton County is $30,168.
What is the Median Family Income in Newton County?
Median Family Income in Newton County is $75,704.
What is the Median Household income in Newton County?
Median Household Income in Newton County is $63,673.
What is Income or Wage Gap in Newton County?
Income or Wage Gap in Newton County is 36.1%.
Women in Newton County earn 63.9 cents for every dollar earned by a man.
What is Family Income Deficit in Newton County?
Family Income Deficit in Newton County is $12,112.
Families that are below poverty line in Newton County earn $12,112 less on average than the poverty threshold level.
What is Inequality or Gini Index in Newton County?
Inequality or Gini Index in Newton County is 0.39.
How Large is the Labor Force in Newton County?
There are 6,733 People in the Labor Forcein in Newton County.
What is the Percentage of People in the Labor Force in Newton County?
59.5% of People are in the Labor Force in Newton County.
What is the Unemployment Rate in Newton County?
Unemployment Rate in Newton County is 9.6%.