Morgan County, IN
Morgan County Map
Morgan County Overview
71,757
TOTAL POPULATION
35,959
MALE POPULATION
35,798
FEMALE POPULATION
100.45
MALES / 100 FEMALES
99.55
FEMALES / 100 MALES
41.5
MEDIAN AGE
3.0
AVG FAMILY SIZE
2.6
AVG HOUSEHOLD SIZE
$37,861
PER CAPITA INCOME
$91,142
AVG FAMILY INCOME
$79,134
AVG HOUSEHOLD INCOME
32.3%
WAGE / INCOME GAP [ % ]
67.7¢/ $1
WAGE / INCOME GAP [ $ ]
$11,323
FAMILY INCOME DEFICIT
0.42
INEQUALITY / GINI INDEX
36,388
LABOR FORCE [ PEOPLE ]
62.8%
PERCENT IN LABOR FORCE
4.0%
UNEMPLOYMENT RATE
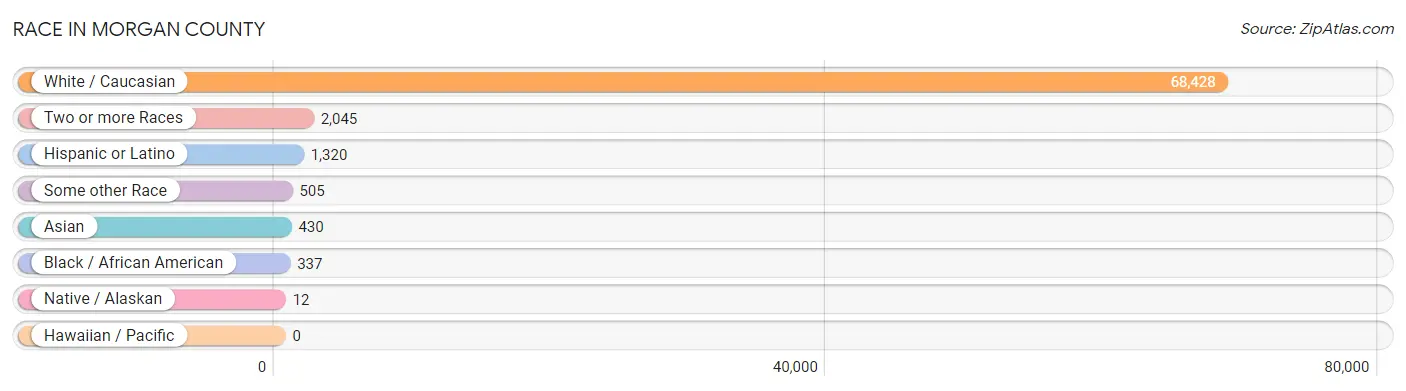
Race in Morgan County
The most populous races in Morgan County are White / Caucasian (68,428 | 95.4%), Two or more Races (2,045 | 2.9%), and Hispanic or Latino (1,320 | 1.8%).
| Race | # Population | % Population |
| Asian | 430 | 0.6% |
| Black / African American | 337 | 0.5% |
| Hawaiian / Pacific | 0 | 0.0% |
| Hispanic or Latino | 1,320 | 1.8% |
| Native / Alaskan | 12 | 0.0% |
| White / Caucasian | 68,428 | 95.4% |
| Two or more Races | 2,045 | 2.9% |
| Some other Race | 505 | 0.7% |
| Total | 71,757 | 100.0% |
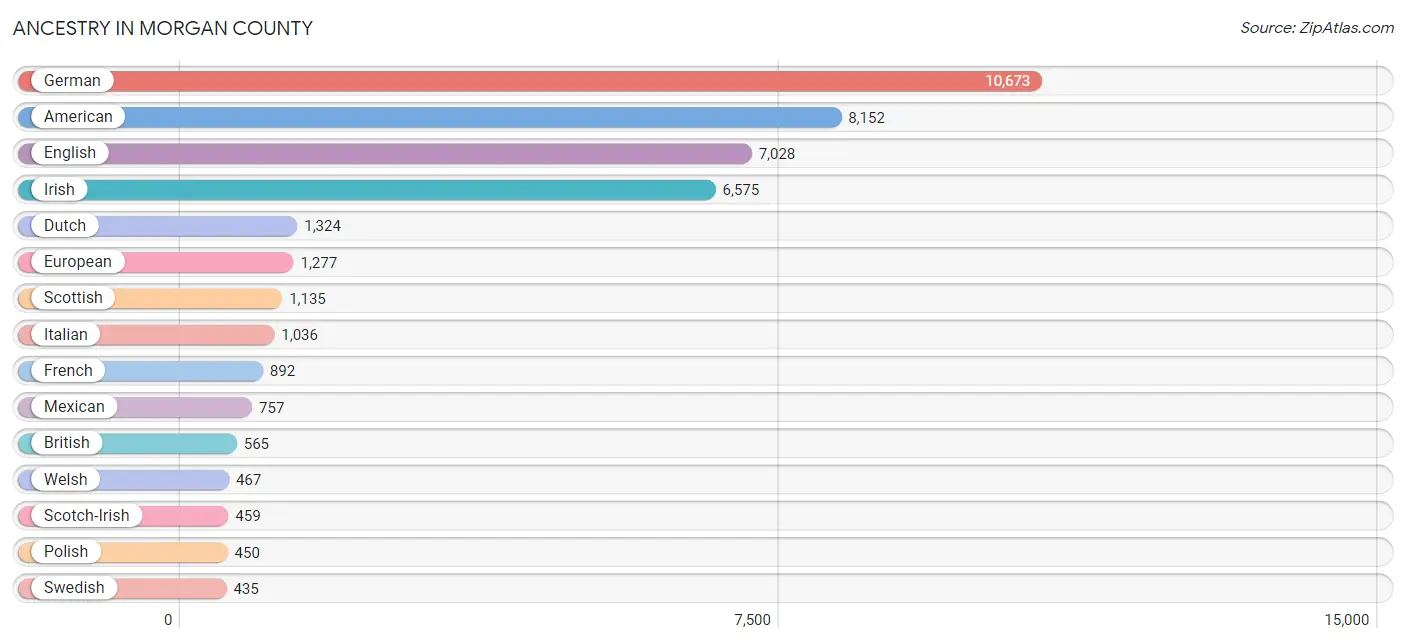
Ancestry in Morgan County
The most populous ancestries reported in Morgan County are German (10,673 | 14.9%), American (8,152 | 11.4%), English (7,028 | 9.8%), Irish (6,575 | 9.2%), and Dutch (1,324 | 1.8%), together accounting for 47.0% of all Morgan County residents.
| Ancestry | # Population | % Population |
| American | 8,152 | 11.4% |
| Apache | 2 | 0.0% |
| Arab | 10 | 0.0% |
| Australian | 9 | 0.0% |
| Austrian | 37 | 0.1% |
| Belgian | 28 | 0.0% |
| Bhutanese | 78 | 0.1% |
| Blackfeet | 49 | 0.1% |
| Brazilian | 27 | 0.0% |
| British | 565 | 0.8% |
| Burmese | 62 | 0.1% |
| Canadian | 59 | 0.1% |
| Central American | 80 | 0.1% |
| Cherokee | 351 | 0.5% |
| Choctaw | 26 | 0.0% |
| Colombian | 1 | 0.0% |
| Creek | 10 | 0.0% |
| Croatian | 11 | 0.0% |
| Cuban | 80 | 0.1% |
| Czech | 96 | 0.1% |
| Czechoslovakian | 28 | 0.0% |
| Danish | 99 | 0.1% |
| Dutch | 1,324 | 1.8% |
| Dutch West Indian | 9 | 0.0% |
| Eastern European | 89 | 0.1% |
| Egyptian | 10 | 0.0% |
| English | 7,028 | 9.8% |
| European | 1,277 | 1.8% |
| Finnish | 31 | 0.0% |
| French | 892 | 1.2% |
| French American Indian | 7 | 0.0% |
| French Canadian | 152 | 0.2% |
| German | 10,673 | 14.9% |
| Greek | 66 | 0.1% |
| Guatemalan | 3 | 0.0% |
| Honduran | 19 | 0.0% |
| Hungarian | 103 | 0.1% |
| Indian (Asian) | 183 | 0.3% |
| Indonesian | 2 | 0.0% |
| Irish | 6,575 | 9.2% |
| Italian | 1,036 | 1.4% |
| Korean | 228 | 0.3% |
| Latvian | 16 | 0.0% |
| Malaysian | 9 | 0.0% |
| Mexican | 757 | 1.1% |
| Mexican American Indian | 12 | 0.0% |
| Mongolian | 38 | 0.1% |
| Native Hawaiian | 64 | 0.1% |
| Nigerian | 16 | 0.0% |
| Northern European | 101 | 0.1% |
| Norwegian | 248 | 0.4% |
| Pakistani | 94 | 0.1% |
| Pennsylvania German | 50 | 0.1% |
| Peruvian | 18 | 0.0% |
| Polish | 450 | 0.6% |
| Portuguese | 1 | 0.0% |
| Puerto Rican | 332 | 0.5% |
| Romanian | 10 | 0.0% |
| Russian | 40 | 0.1% |
| Salvadoran | 58 | 0.1% |
| Scandinavian | 113 | 0.2% |
| Scotch-Irish | 459 | 0.6% |
| Scottish | 1,135 | 1.6% |
| Seminole | 8 | 0.0% |
| Serbian | 9 | 0.0% |
| Sioux | 26 | 0.0% |
| Slavic | 7 | 0.0% |
| Slovak | 74 | 0.1% |
| Slovene | 6 | 0.0% |
| South American | 19 | 0.0% |
| Spanish | 30 | 0.0% |
| Subsaharan African | 122 | 0.2% |
| Swedish | 435 | 0.6% |
| Swiss | 205 | 0.3% |
| Turkish | 17 | 0.0% |
| Ukrainian | 10 | 0.0% |
| Welsh | 467 | 0.6% |
| Yugoslavian | 14 | 0.0% | View All 78 Rows |
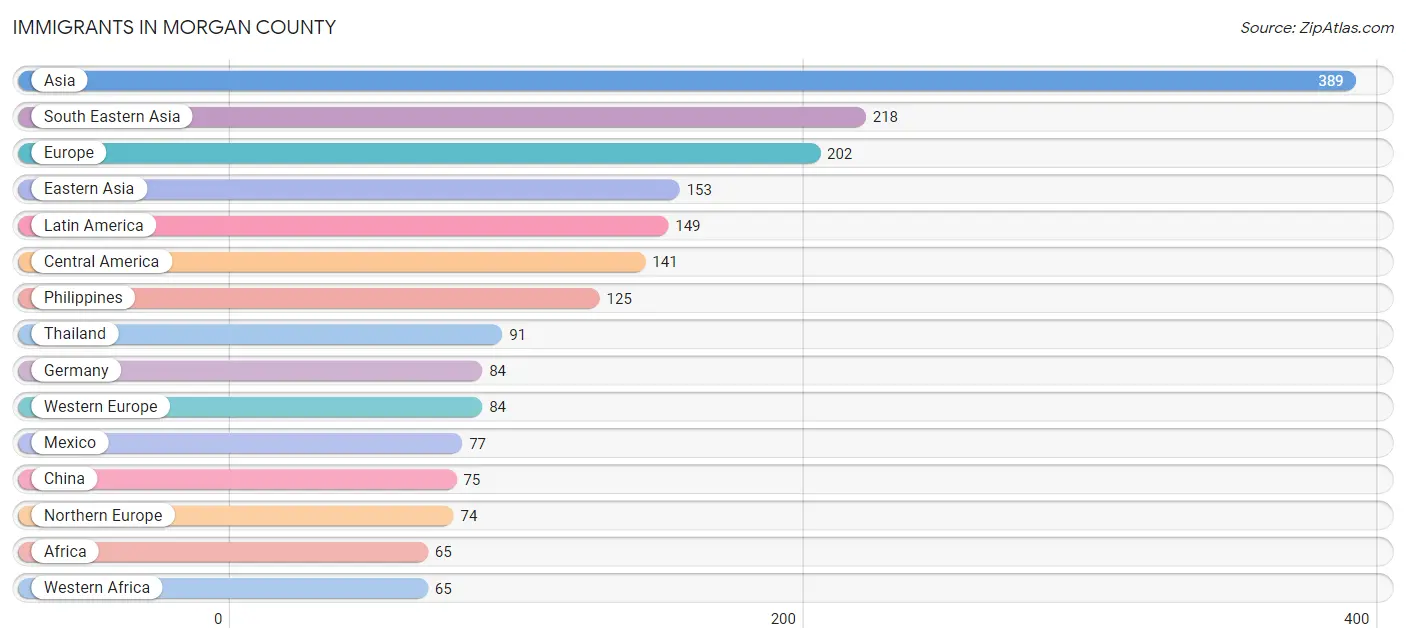
Immigrants in Morgan County
The most numerous immigrant groups reported in Morgan County came from Asia (389 | 0.5%), South Eastern Asia (218 | 0.3%), Europe (202 | 0.3%), Eastern Asia (153 | 0.2%), and Latin America (149 | 0.2%), together accounting for 1.5% of all Morgan County residents.
| Immigration Origin | # Population | % Population |
| Africa | 65 | 0.1% |
| Asia | 389 | 0.5% |
| Brazil | 7 | 0.0% |
| Canada | 16 | 0.0% |
| Central America | 141 | 0.2% |
| China | 75 | 0.1% |
| Colombia | 1 | 0.0% |
| Eastern Asia | 153 | 0.2% |
| Eastern Europe | 37 | 0.1% |
| El Salvador | 53 | 0.1% |
| England | 37 | 0.1% |
| Europe | 202 | 0.3% |
| Germany | 84 | 0.1% |
| Guatemala | 3 | 0.0% |
| Hungary | 6 | 0.0% |
| Ireland | 29 | 0.0% |
| Italy | 7 | 0.0% |
| Japan | 44 | 0.1% |
| Korea | 34 | 0.1% |
| Latin America | 149 | 0.2% |
| Mexico | 77 | 0.1% |
| Nepal | 1 | 0.0% |
| Northern Europe | 74 | 0.1% |
| Norway | 3 | 0.0% |
| Panama | 8 | 0.0% |
| Philippines | 125 | 0.2% |
| Romania | 31 | 0.0% |
| South America | 8 | 0.0% |
| South Central Asia | 1 | 0.0% |
| South Eastern Asia | 218 | 0.3% |
| Southern Europe | 7 | 0.0% |
| Thailand | 91 | 0.1% |
| Turkey | 17 | 0.0% |
| Western Africa | 65 | 0.1% |
| Western Asia | 17 | 0.0% |
| Western Europe | 84 | 0.1% | View All 36 Rows |
Sex and Age in Morgan County
Sex and Age in Morgan County
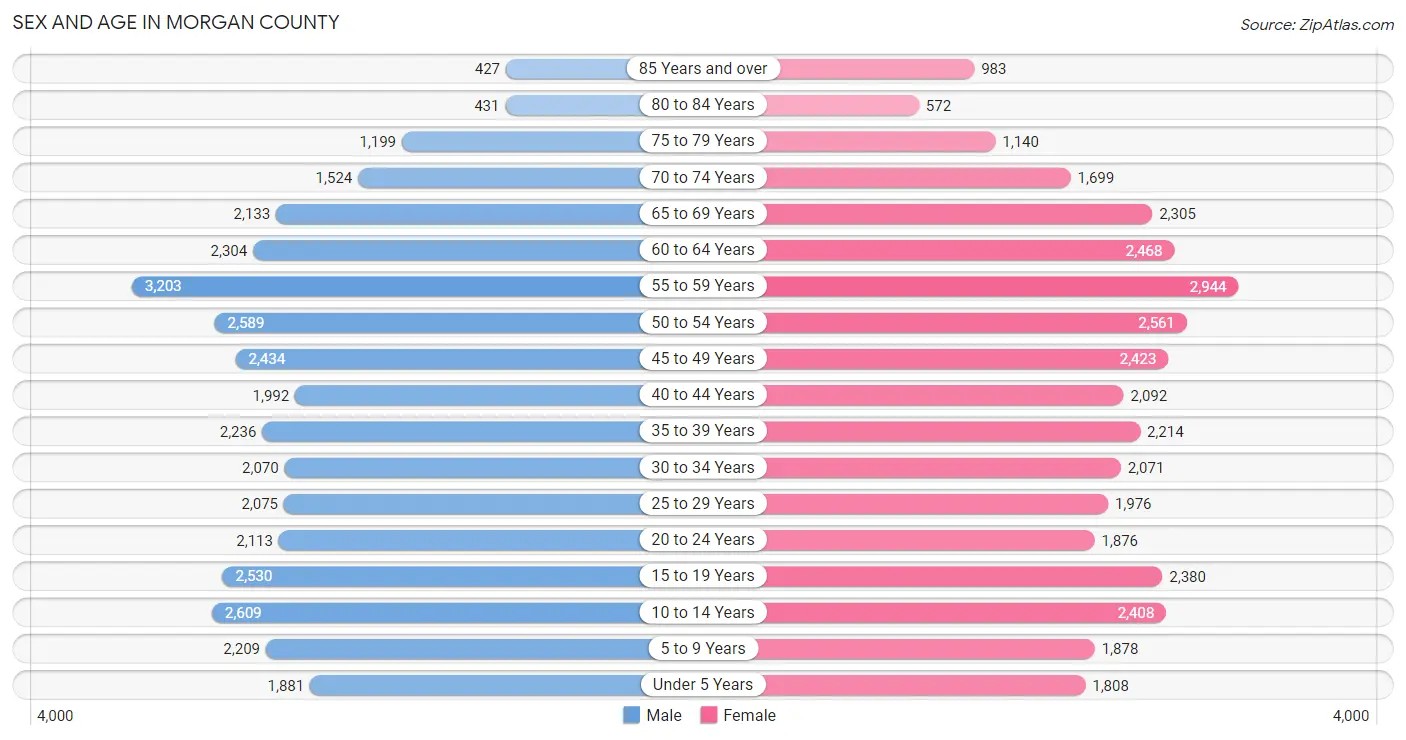
The most populous age groups in Morgan County are 55 to 59 Years (3,203 | 8.9%) for men and 55 to 59 Years (2,944 | 8.2%) for women.
| Age Bracket | Male | Female |
| Under 5 Years | 1,881 (5.2%) | 1,808 (5.1%) |
| 5 to 9 Years | 2,209 (6.1%) | 1,878 (5.2%) |
| 10 to 14 Years | 2,609 (7.3%) | 2,408 (6.7%) |
| 15 to 19 Years | 2,530 (7.0%) | 2,380 (6.7%) |
| 20 to 24 Years | 2,113 (5.9%) | 1,876 (5.2%) |
| 25 to 29 Years | 2,075 (5.8%) | 1,976 (5.5%) |
| 30 to 34 Years | 2,070 (5.8%) | 2,071 (5.8%) |
| 35 to 39 Years | 2,236 (6.2%) | 2,214 (6.2%) |
| 40 to 44 Years | 1,992 (5.5%) | 2,092 (5.8%) |
| 45 to 49 Years | 2,434 (6.8%) | 2,423 (6.8%) |
| 50 to 54 Years | 2,589 (7.2%) | 2,561 (7.1%) |
| 55 to 59 Years | 3,203 (8.9%) | 2,944 (8.2%) |
| 60 to 64 Years | 2,304 (6.4%) | 2,468 (6.9%) |
| 65 to 69 Years | 2,133 (5.9%) | 2,305 (6.4%) |
| 70 to 74 Years | 1,524 (4.2%) | 1,699 (4.8%) |
| 75 to 79 Years | 1,199 (3.3%) | 1,140 (3.2%) |
| 80 to 84 Years | 431 (1.2%) | 572 (1.6%) |
| 85 Years and over | 427 (1.2%) | 983 (2.8%) |
| Total | 35,959 (100.0%) | 35,798 (100.0%) |
Families and Households in Morgan County
Median Family Size in Morgan County
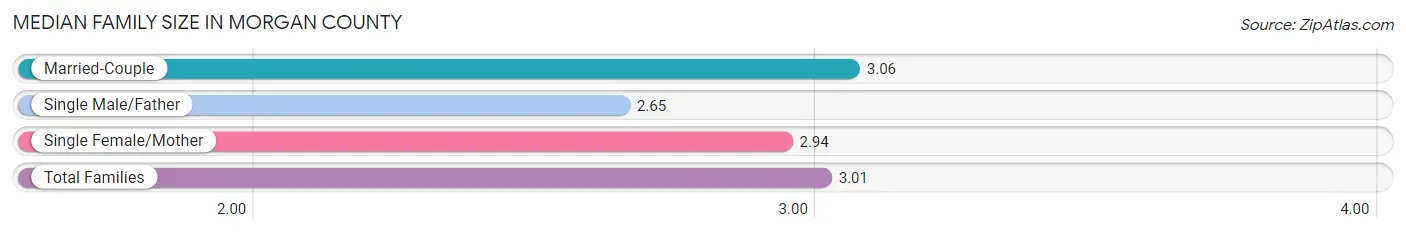
The median family size in Morgan County is 3.01 persons per family, with married-couple families (15,542 | 78.2%) accounting for the largest median family size of 3.06 persons per family. On the other hand, single male/father families (1,460 | 7.3%) represent the smallest median family size with 2.65 persons per family.
| Family Type | # Families | Family Size |
| Married-Couple | 15,542 (78.2%) | 3.06 |
| Single Male/Father | 1,460 (7.3%) | 2.65 |
| Single Female/Mother | 2,868 (14.4%) | 2.94 |
| Total Families | 19,870 (100.0%) | 3.01 |
Median Household Size in Morgan County
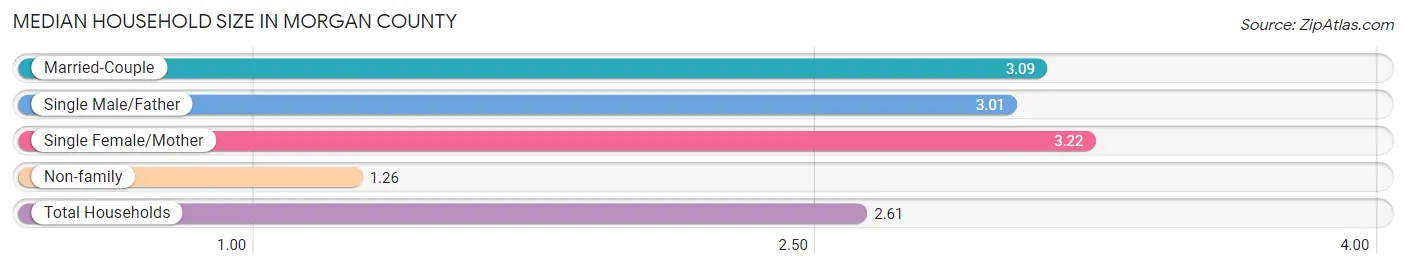
The median household size in Morgan County is 2.61 persons per household, with single female/mother households (2,868 | 10.6%) accounting for the largest median household size of 3.22 persons per household. non-family households (7,268 | 26.8%) represent the smallest median household size with 1.26 persons per household.
| Household Type | # Households | Household Size |
| Married-Couple | 15,542 (57.3%) | 3.09 |
| Single Male/Father | 1,460 (5.4%) | 3.01 |
| Single Female/Mother | 2,868 (10.6%) | 3.22 |
| Non-family | 7,268 (26.8%) | 1.26 |
| Total Households | 27,138 (100.0%) | 2.61 |
Household Size by Marriage Status in Morgan County
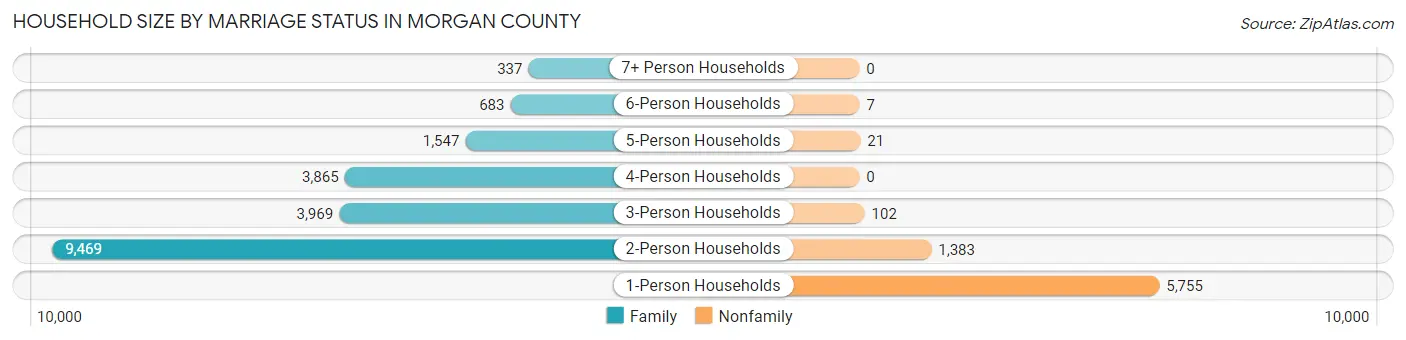
Out of a total of 27,138 households in Morgan County, 19,870 (73.2%) are family households, while 7,268 (26.8%) are nonfamily households. The most numerous type of family households are 2-person households, comprising 9,469, and the most common type of nonfamily households are 1-person households, comprising 5,755.
| Household Size | Family Households | Nonfamily Households |
| 1-Person Households | - | 5,755 (21.2%) |
| 2-Person Households | 9,469 (34.9%) | 1,383 (5.1%) |
| 3-Person Households | 3,969 (14.6%) | 102 (0.4%) |
| 4-Person Households | 3,865 (14.2%) | 0 (0.0%) |
| 5-Person Households | 1,547 (5.7%) | 21 (0.1%) |
| 6-Person Households | 683 (2.5%) | 7 (0.0%) |
| 7+ Person Households | 337 (1.2%) | 0 (0.0%) |
| Total | 19,870 (73.2%) | 7,268 (26.8%) |
Female Fertility in Morgan County
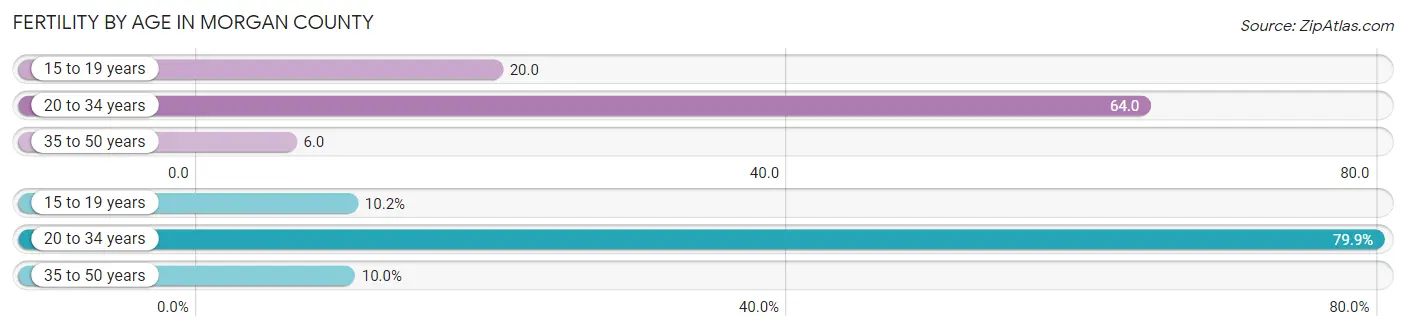
Fertility by Age in Morgan County
Average fertility rate in Morgan County is 30.0 births per 1,000 women. Women in the age bracket of 20 to 34 years have the highest fertility rate with 64.0 births per 1,000 women. Women in the age bracket of 20 to 34 years acount for 79.9% of all women with births.
| Age Bracket | Women with Births | Births / 1,000 Women |
| 15 to 19 years | 48 (10.2%) | 20.0 |
| 20 to 34 years | 377 (79.9%) | 64.0 |
| 35 to 50 years | 47 (10.0%) | 6.0 |
| Total | 472 (100.0%) | 30.0 |
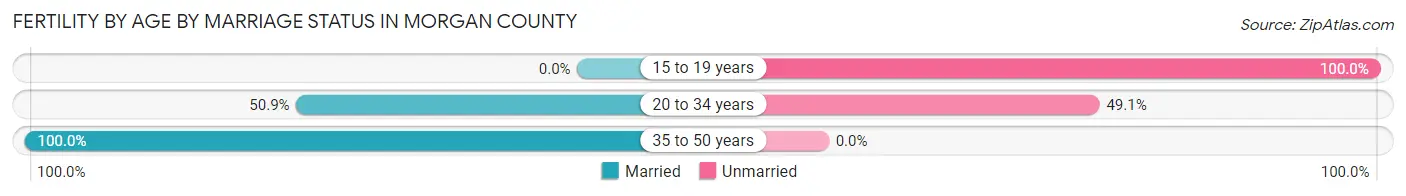
Fertility by Age by Marriage Status in Morgan County
50.6% of women with births (472) in Morgan County are married. The highest percentage of unmarried women with births falls into 15 to 19 years age bracket with 100.0% of them unmarried at the time of birth, while the lowest percentage of unmarried women with births belong to 35 to 50 years age bracket with 0.0% of them unmarried.
| Age Bracket | Married | Unmarried |
| 15 to 19 years | 0 (0.0%) | 48 (100.0%) |
| 20 to 34 years | 192 (50.9%) | 185 (49.1%) |
| 35 to 50 years | 47 (100.0%) | 0 (0.0%) |
| Total | 239 (50.6%) | 233 (49.4%) |
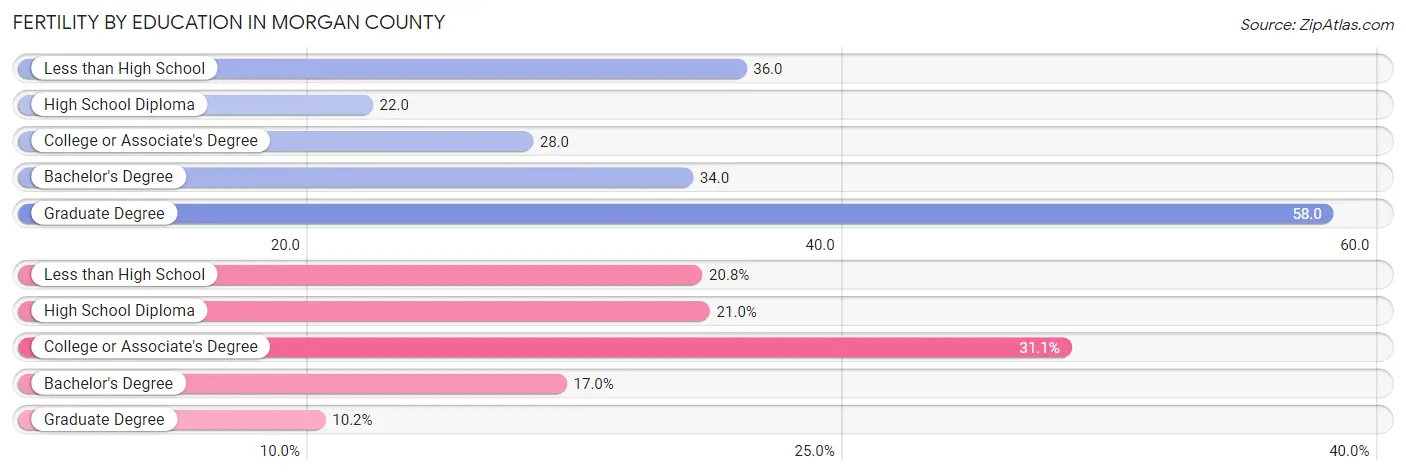
Fertility by Education in Morgan County
Average fertility rate in Morgan County is 30.0 births per 1,000 women. Women with the education attainment of graduate degree have the highest fertility rate of 58.0 births per 1,000 women, while women with the education attainment of high school diploma have the lowest fertility at 22.0 births per 1,000 women. Women with the education attainment of college or associate's degree represent 31.1% of all women with births.
| Educational Attainment | Women with Births | Births / 1,000 Women |
| Less than High School | 98 (20.8%) | 36.0 |
| High School Diploma | 99 (21.0%) | 22.0 |
| College or Associate's Degree | 147 (31.1%) | 28.0 |
| Bachelor's Degree | 80 (17.0%) | 34.0 |
| Graduate Degree | 48 (10.2%) | 58.0 |
| Total | 472 (100.0%) | 30.0 |
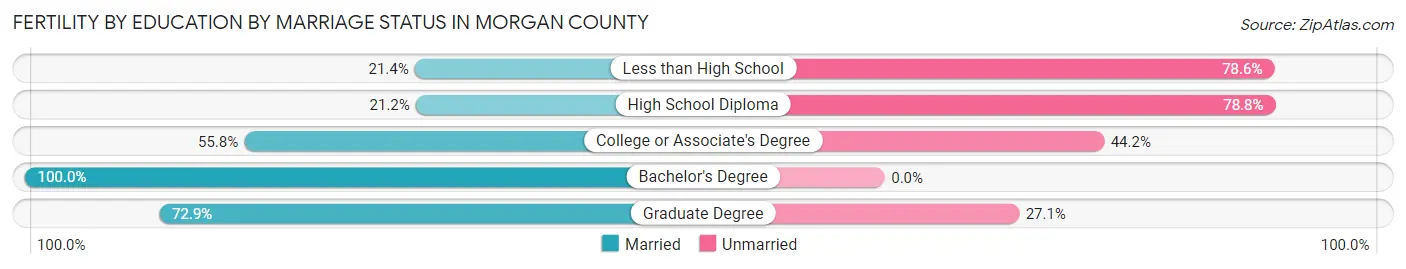
Fertility by Education by Marriage Status in Morgan County
49.4% of women with births in Morgan County are unmarried. Women with the educational attainment of bachelor's degree are most likely to be married with 100.0% of them married at childbirth, while women with the educational attainment of high school diploma are least likely to be married with 78.8% of them unmarried at childbirth.
| Educational Attainment | Married | Unmarried |
| Less than High School | 21 (21.4%) | 77 (78.6%) |
| High School Diploma | 21 (21.2%) | 78 (78.8%) |
| College or Associate's Degree | 82 (55.8%) | 65 (44.2%) |
| Bachelor's Degree | 80 (100.0%) | 0 (0.0%) |
| Graduate Degree | 35 (72.9%) | 13 (27.1%) |
| Total | 239 (50.6%) | 233 (49.4%) |
Income in Morgan County
Income Overview in Morgan County
Per Capita Income in Morgan County is $37,861, while median incomes of families and households are $91,142 and $79,134 respectively.
| Characteristic | Number | Measure |
| Per Capita Income | 71,757 | $37,861 |
| Median Family Income | 19,870 | $91,142 |
| Mean Family Income | 19,870 | $110,224 |
| Median Household Income | 27,138 | $79,134 |
| Mean Household Income | 27,138 | $97,771 |
| Income Deficit | 19,870 | $11,323 |
| Wage / Income Gap (%) | 71,757 | 32.34% |
| Wage / Income Gap ($) | 71,757 | 67.66¢ per $1 |
| Gini / Inequality Index | 71,757 | 0.42 |
Earnings by Sex in Morgan County
Average Earnings in Morgan County are $44,261, $53,085 for men and $35,918 for women, a difference of 32.3%.
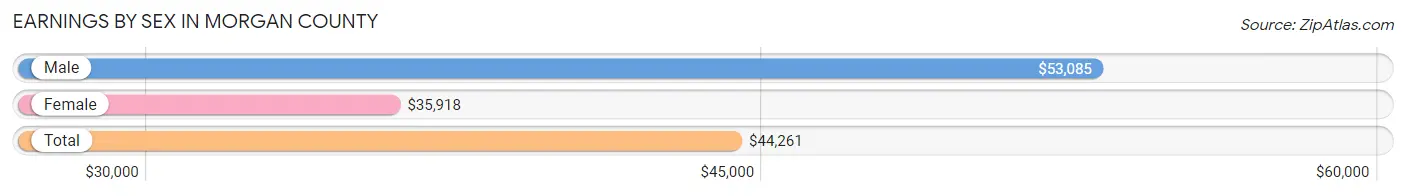
| Sex | Number | Average Earnings |
| Male | 20,478 (53.7%) | $53,085 |
| Female | 17,644 (46.3%) | $35,918 |
| Total | 38,122 (100.0%) | $44,261 |
Earnings by Sex by Income Bracket in Morgan County
The most common earnings brackets in Morgan County are $100,000+ for men (3,671 | 17.9%) and $35,000 to $39,999 for women (1,443 | 8.2%).
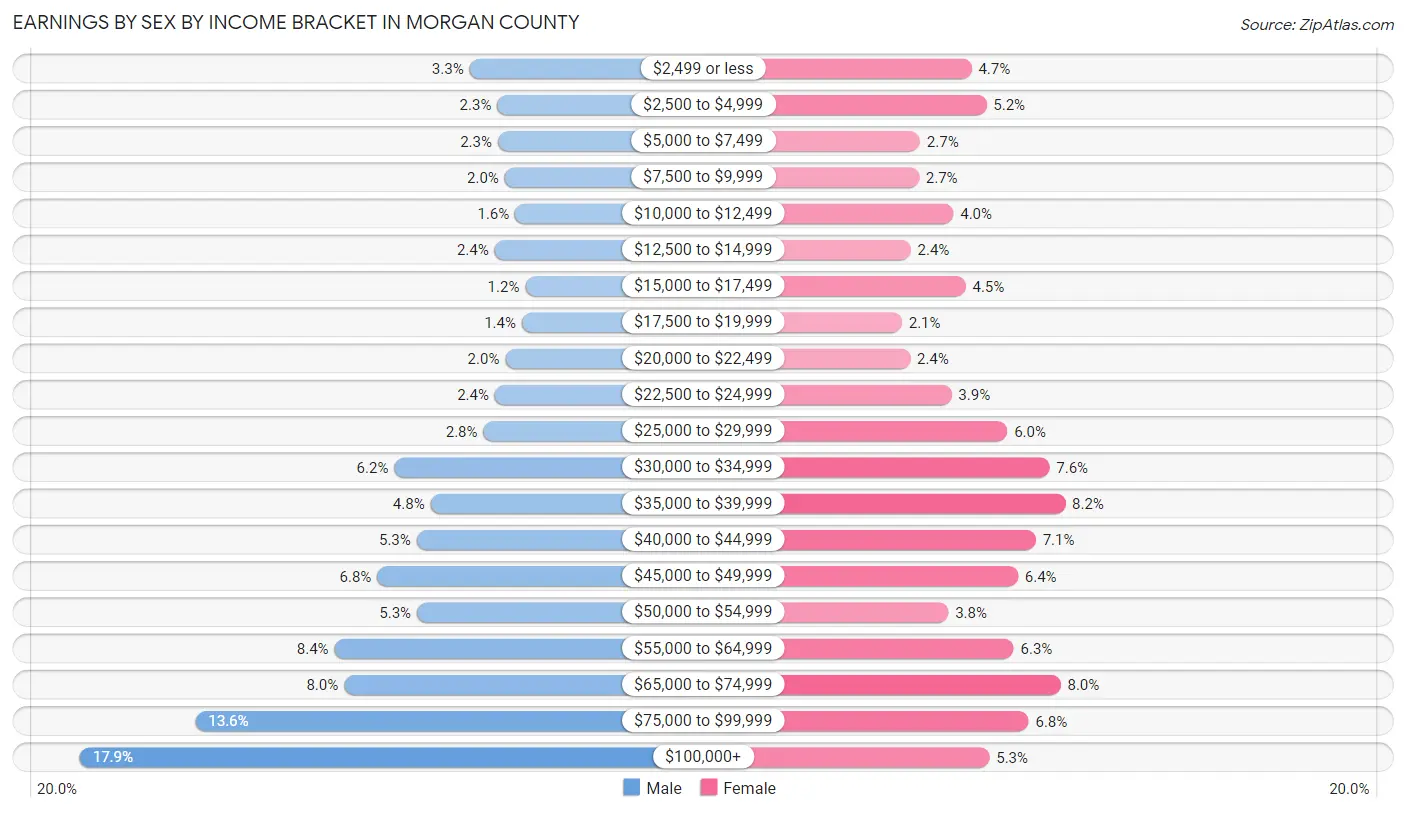
| Income | Male | Female |
| $2,499 or less | 682 (3.3%) | 824 (4.7%) |
| $2,500 to $4,999 | 468 (2.3%) | 922 (5.2%) |
| $5,000 to $7,499 | 465 (2.3%) | 483 (2.7%) |
| $7,500 to $9,999 | 412 (2.0%) | 476 (2.7%) |
| $10,000 to $12,499 | 331 (1.6%) | 704 (4.0%) |
| $12,500 to $14,999 | 490 (2.4%) | 422 (2.4%) |
| $15,000 to $17,499 | 254 (1.2%) | 785 (4.4%) |
| $17,500 to $19,999 | 281 (1.4%) | 364 (2.1%) |
| $20,000 to $22,499 | 408 (2.0%) | 418 (2.4%) |
| $22,500 to $24,999 | 488 (2.4%) | 691 (3.9%) |
| $25,000 to $29,999 | 575 (2.8%) | 1,061 (6.0%) |
| $30,000 to $34,999 | 1,259 (6.1%) | 1,339 (7.6%) |
| $35,000 to $39,999 | 981 (4.8%) | 1,443 (8.2%) |
| $40,000 to $44,999 | 1,087 (5.3%) | 1,250 (7.1%) |
| $45,000 to $49,999 | 1,391 (6.8%) | 1,131 (6.4%) |
| $50,000 to $54,999 | 1,086 (5.3%) | 671 (3.8%) |
| $55,000 to $64,999 | 1,719 (8.4%) | 1,103 (6.2%) |
| $65,000 to $74,999 | 1,645 (8.0%) | 1,413 (8.0%) |
| $75,000 to $99,999 | 2,785 (13.6%) | 1,201 (6.8%) |
| $100,000+ | 3,671 (17.9%) | 943 (5.3%) |
| Total | 20,478 (100.0%) | 17,644 (100.0%) |
Earnings by Sex by Educational Attainment in Morgan County
Average earnings in Morgan County are $59,663 for men and $39,040 for women, a difference of 34.6%. Men with an educational attainment of graduate degree enjoy the highest average annual earnings of $116,364, while those with less than high school education earn the least with $39,507. Women with an educational attainment of graduate degree earn the most with the average annual earnings of $63,750, while those with less than high school education have the smallest earnings of $20,276.
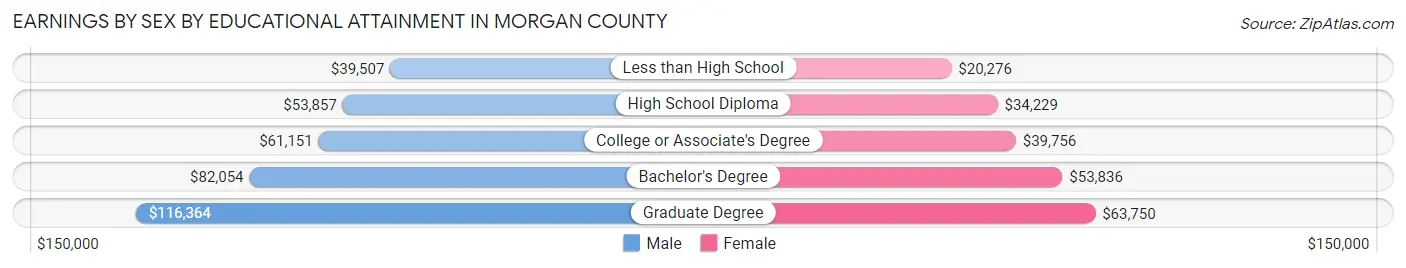
| Educational Attainment | Male Income | Female Income |
| Less than High School | $39,507 | $20,276 |
| High School Diploma | $53,857 | $34,229 |
| College or Associate's Degree | $61,151 | $39,756 |
| Bachelor's Degree | $82,054 | $53,836 |
| Graduate Degree | $116,364 | $63,750 |
| Total | $59,663 | $39,040 |
Family Income in Morgan County
Family Income Brackets in Morgan County
According to the Morgan County family income data, there are 4,550 families falling into the $100,000 to $149,999 income range, which is the most common income bracket and makes up 22.9% of all families. Conversely, the $10,000 to $14,999 income bracket is the least frequent group with only 417 families (2.1%) belonging to this category.
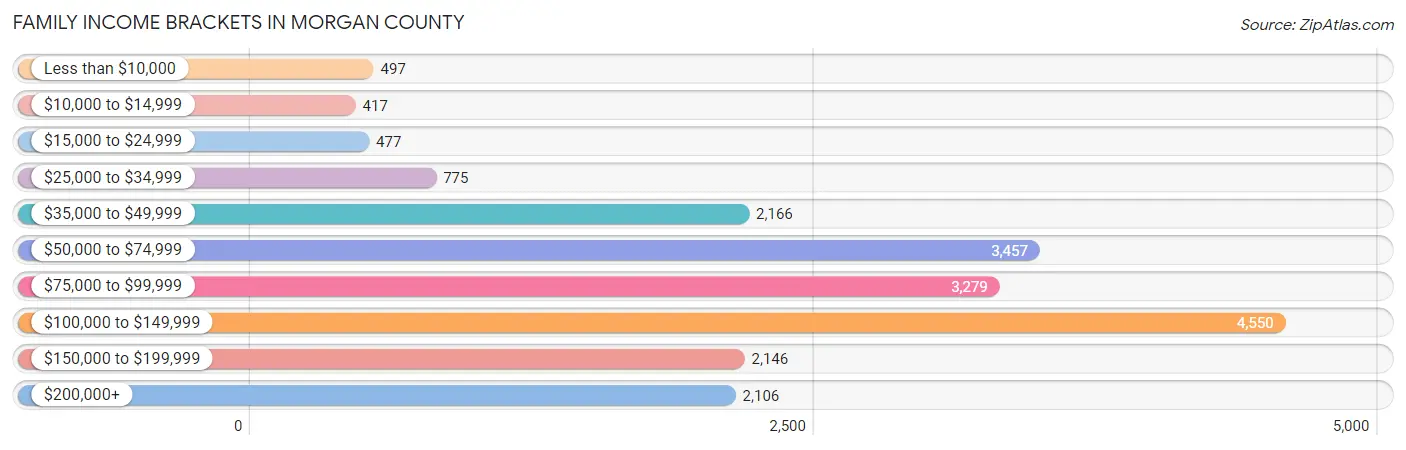
| Income Bracket | # Families | % Families |
| Less than $10,000 | 497 | 2.5% |
| $10,000 to $14,999 | 417 | 2.1% |
| $15,000 to $24,999 | 477 | 2.4% |
| $25,000 to $34,999 | 775 | 3.9% |
| $35,000 to $49,999 | 2,166 | 10.9% |
| $50,000 to $74,999 | 3,457 | 17.4% |
| $75,000 to $99,999 | 3,279 | 16.5% |
| $100,000 to $149,999 | 4,550 | 22.9% |
| $150,000 to $199,999 | 2,146 | 10.8% |
| $200,000+ | 2,106 | 10.6% |
Family Income by Famaliy Size in Morgan County
6-person families (553 | 2.8%) account for the highest median family income in Morgan County with $134,598 per family, while 2-person families (9,914 | 49.9%) have the highest median income of $40,182 per family member.
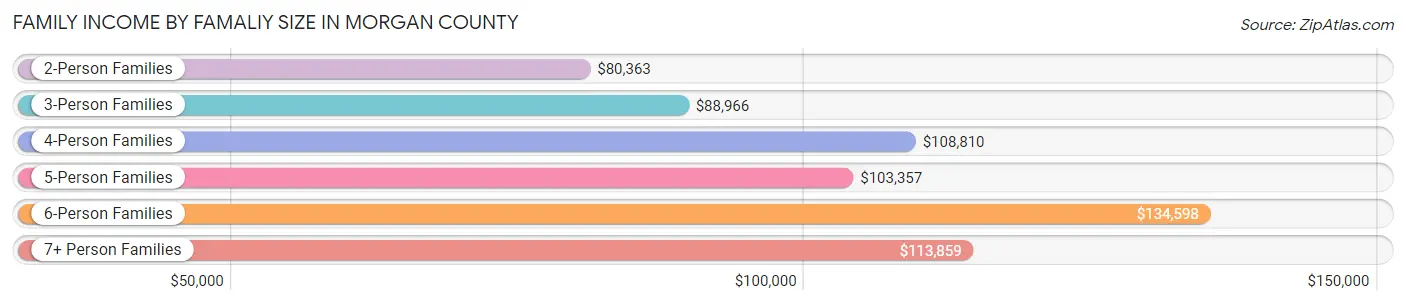
| Income Bracket | # Families | Median Income |
| 2-Person Families | 9,914 (49.9%) | $80,363 |
| 3-Person Families | 4,150 (20.9%) | $88,966 |
| 4-Person Families | 3,518 (17.7%) | $108,810 |
| 5-Person Families | 1,430 (7.2%) | $103,357 |
| 6-Person Families | 553 (2.8%) | $134,598 |
| 7+ Person Families | 305 (1.5%) | $113,859 |
| Total | 19,870 (100.0%) | $91,142 |
Family Income by Number of Earners in Morgan County
The median family income in Morgan County is $91,142, with families comprising 3+ earners (2,305) having the highest median family income of $153,341, while families with no earners (3,030) have the lowest median family income of $49,944, accounting for 11.6% and 15.2% of families, respectively.
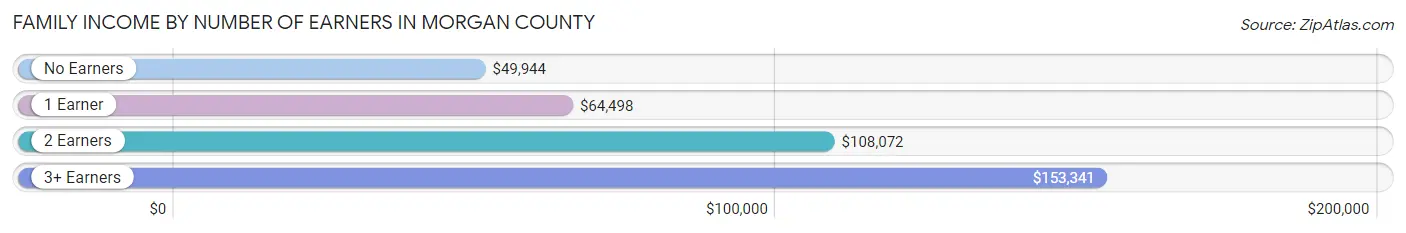
| Number of Earners | # Families | Median Income |
| No Earners | 3,030 (15.2%) | $49,944 |
| 1 Earner | 5,753 (28.9%) | $64,498 |
| 2 Earners | 8,782 (44.2%) | $108,072 |
| 3+ Earners | 2,305 (11.6%) | $153,341 |
| Total | 19,870 (100.0%) | $91,142 |
Household Income in Morgan County
Household Income Brackets in Morgan County
With 5,428 households falling in the category, the $100,000 to $149,999 income range is the most frequent in Morgan County, accounting for 20.0% of all households. In contrast, only 841 households (3.1%) fall into the $10,000 to $14,999 income bracket, making it the least populous group.
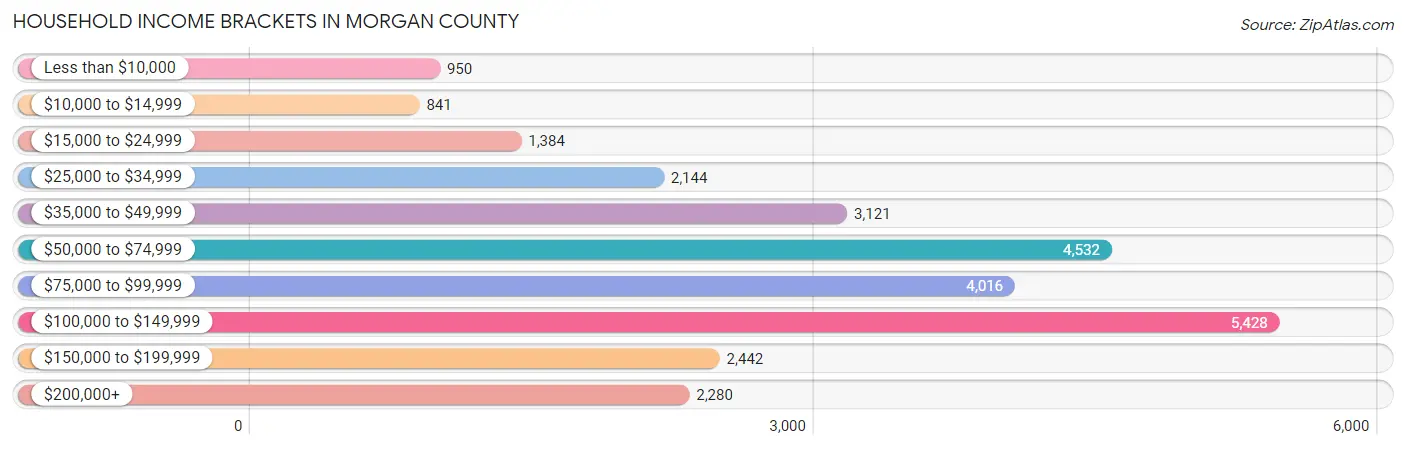
| Income Bracket | # Households | % Households |
| Less than $10,000 | 950 | 3.5% |
| $10,000 to $14,999 | 841 | 3.1% |
| $15,000 to $24,999 | 1,384 | 5.1% |
| $25,000 to $34,999 | 2,144 | 7.9% |
| $35,000 to $49,999 | 3,121 | 11.5% |
| $50,000 to $74,999 | 4,532 | 16.7% |
| $75,000 to $99,999 | 4,016 | 14.8% |
| $100,000 to $149,999 | 5,428 | 20.0% |
| $150,000 to $199,999 | 2,442 | 9.0% |
| $200,000+ | 2,280 | 8.4% |
Household Income by Householder Age in Morgan County
The median household income in Morgan County is $79,134, with the highest median household income of $98,502 found in the 45 to 64 years age bracket for the primary householder. A total of 11,283 households (41.6%) fall into this category. Meanwhile, the 65+ years age bracket for the primary householder has the lowest median household income of $49,518, with 7,667 households (28.2%) in this group.
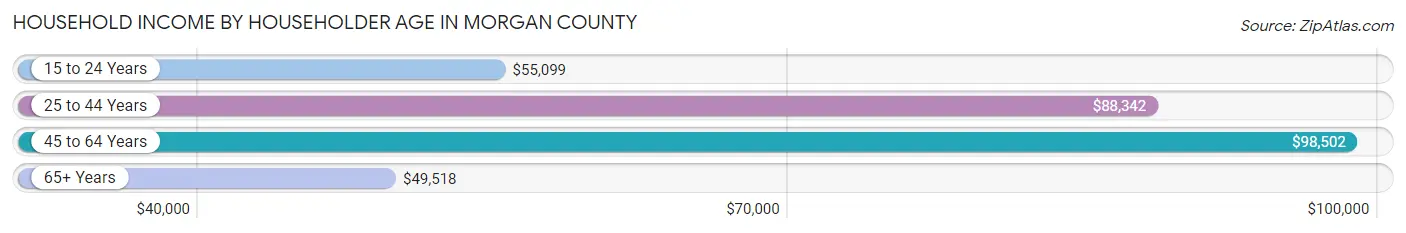
| Income Bracket | # Households | Median Income |
| 15 to 24 Years | 579 (2.1%) | $55,099 |
| 25 to 44 Years | 7,609 (28.0%) | $88,342 |
| 45 to 64 Years | 11,283 (41.6%) | $98,502 |
| 65+ Years | 7,667 (28.2%) | $49,518 |
| Total | 27,138 (100.0%) | $79,134 |
Poverty in Morgan County
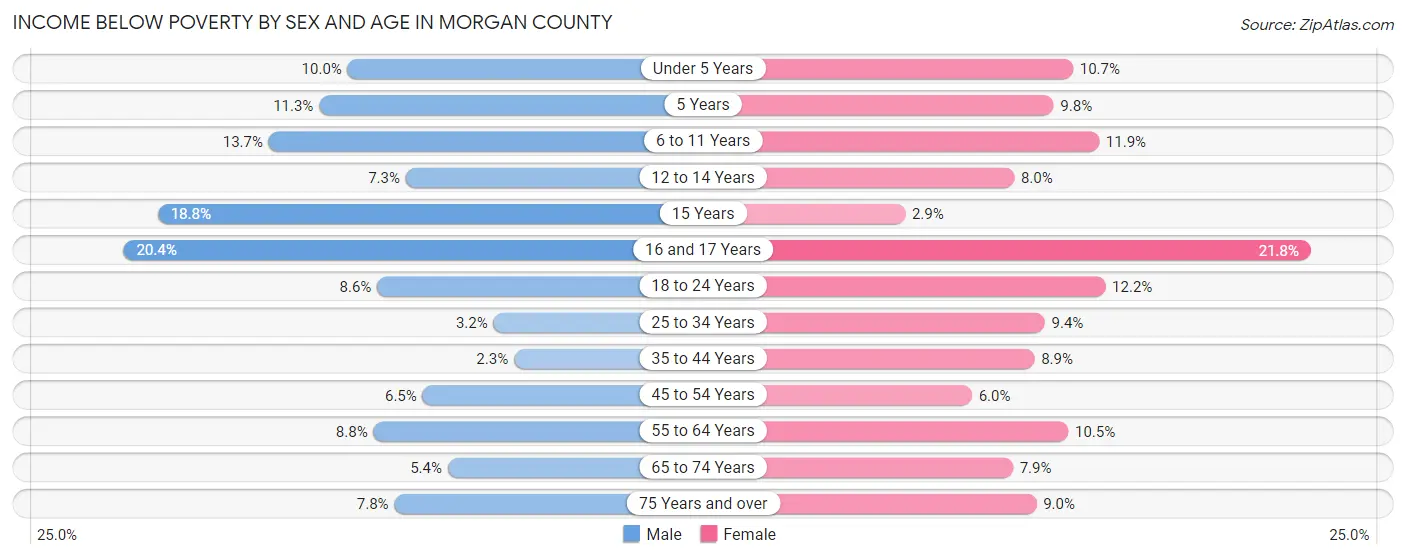
Income Below Poverty by Sex and Age in Morgan County
With 7.5% poverty level for males and 9.5% for females among the residents of Morgan County, 16 and 17 year old males and 16 and 17 year old females are the most vulnerable to poverty, with 219 males (20.4%) and 228 females (21.8%) in their respective age groups living below the poverty level.
| Age Bracket | Male | Female |
| Under 5 Years | 179 (10.0%) | 188 (10.7%) |
| 5 Years | 35 (11.3%) | 28 (9.8%) |
| 6 to 11 Years | 360 (13.7%) | 293 (11.9%) |
| 12 to 14 Years | 127 (7.3%) | 115 (8.0%) |
| 15 Years | 83 (18.8%) | 17 (2.9%) |
| 16 and 17 Years | 219 (20.4%) | 228 (21.8%) |
| 18 to 24 Years | 267 (8.6%) | 318 (12.2%) |
| 25 to 34 Years | 132 (3.2%) | 380 (9.4%) |
| 35 to 44 Years | 95 (2.3%) | 383 (8.9%) |
| 45 to 54 Years | 325 (6.5%) | 299 (6.0%) |
| 55 to 64 Years | 484 (8.8%) | 567 (10.5%) |
| 65 to 74 Years | 195 (5.4%) | 313 (7.9%) |
| 75 Years and over | 155 (7.8%) | 209 (9.0%) |
| Total | 2,656 (7.5%) | 3,338 (9.5%) |
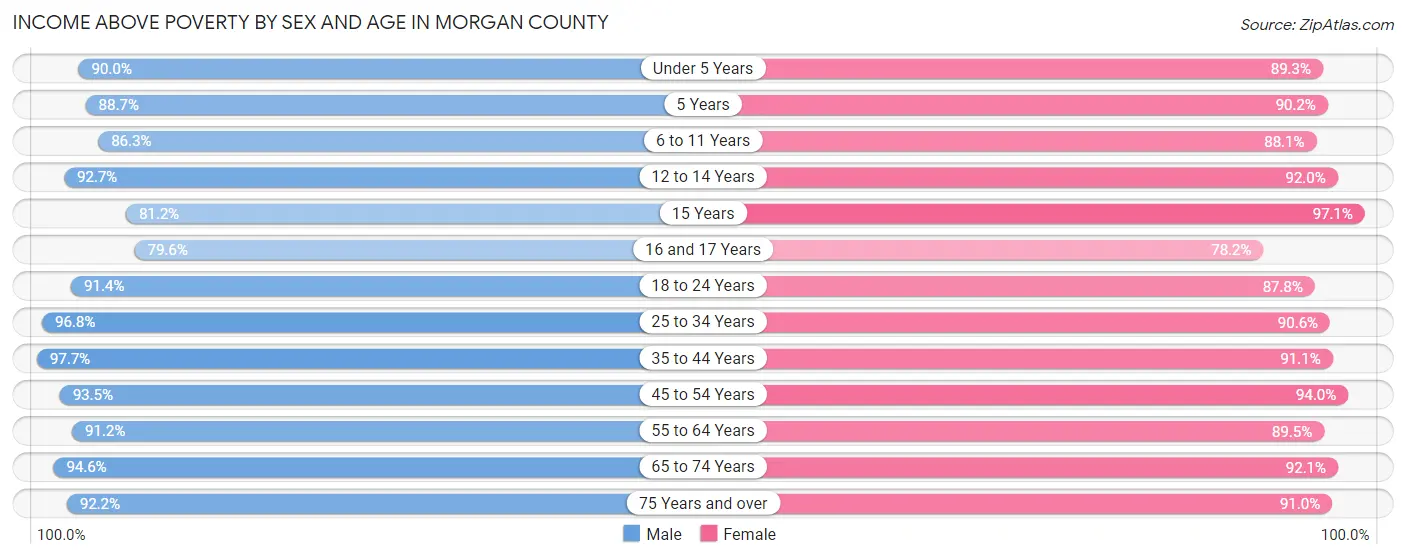
Income Above Poverty by Sex and Age in Morgan County
According to the poverty statistics in Morgan County, males aged 35 to 44 years and females aged 15 years are the age groups that are most secure financially, with 97.7% of males and 97.1% of females in these age groups living above the poverty line.
| Age Bracket | Male | Female |
| Under 5 Years | 1,610 (90.0%) | 1,566 (89.3%) |
| 5 Years | 274 (88.7%) | 257 (90.2%) |
| 6 to 11 Years | 2,274 (86.3%) | 2,163 (88.1%) |
| 12 to 14 Years | 1,610 (92.7%) | 1,324 (92.0%) |
| 15 Years | 358 (81.2%) | 563 (97.1%) |
| 16 and 17 Years | 854 (79.6%) | 820 (78.2%) |
| 18 to 24 Years | 2,825 (91.4%) | 2,284 (87.8%) |
| 25 to 34 Years | 3,940 (96.8%) | 3,659 (90.6%) |
| 35 to 44 Years | 4,059 (97.7%) | 3,908 (91.1%) |
| 45 to 54 Years | 4,653 (93.5%) | 4,658 (94.0%) |
| 55 to 64 Years | 5,011 (91.2%) | 4,834 (89.5%) |
| 65 to 74 Years | 3,441 (94.6%) | 3,635 (92.1%) |
| 75 Years and over | 1,823 (92.2%) | 2,109 (91.0%) |
| Total | 32,732 (92.5%) | 31,780 (90.5%) |
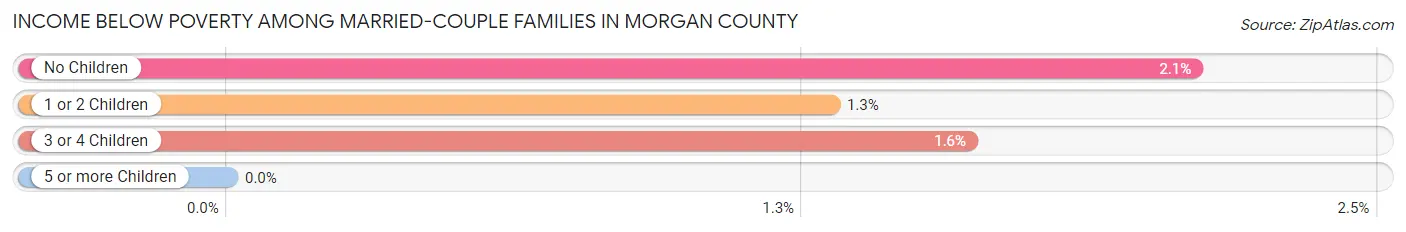
Income Below Poverty Among Married-Couple Families in Morgan County
The poverty statistics for married-couple families in Morgan County show that 1.8% or 282 of the total 15,542 families live below the poverty line. Families with no children have the highest poverty rate of 2.1%, comprising of 204 families. On the other hand, families with 5 or more children have the lowest poverty rate of 0.0%, which includes 0 families.
| Children | Above Poverty | Below Poverty |
| No Children | 9,523 (97.9%) | 204 (2.1%) |
| 1 or 2 Children | 4,508 (98.7%) | 60 (1.3%) |
| 3 or 4 Children | 1,103 (98.4%) | 18 (1.6%) |
| 5 or more Children | 126 (100.0%) | 0 (0.0%) |
| Total | 15,260 (98.2%) | 282 (1.8%) |
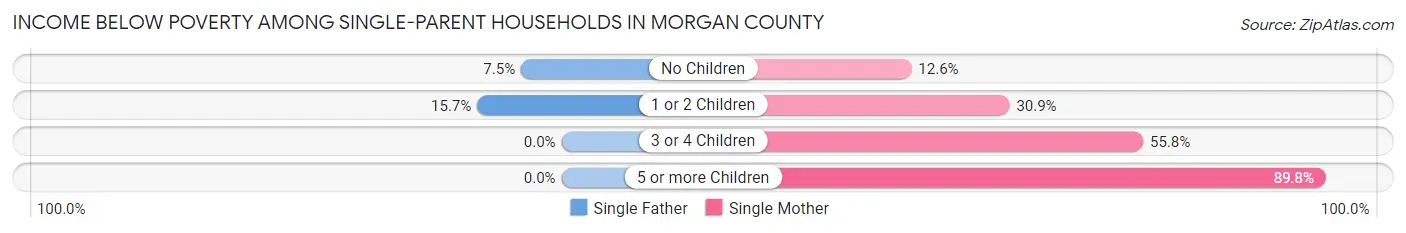
Income Below Poverty Among Single-Parent Households in Morgan County
According to the poverty data in Morgan County, 11.7% or 171 single-father households and 27.5% or 789 single-mother households are living below the poverty line. Among single-father households, those with 1 or 2 children have the highest poverty rate, with 123 households (15.7%) experiencing poverty. Likewise, among single-mother households, those with 5 or more children have the highest poverty rate, with 44 households (89.8%) falling below the poverty line.
| Children | Single Father | Single Mother |
| No Children | 48 (7.5%) | 142 (12.6%) |
| 1 or 2 Children | 123 (15.7%) | 424 (30.9%) |
| 3 or 4 Children | 0 (0.0%) | 179 (55.8%) |
| 5 or more Children | 0 (0.0%) | 44 (89.8%) |
| Total | 171 (11.7%) | 789 (27.5%) |
Income Below Poverty Among Married-Couple vs Single-Parent Households in Morgan County
The poverty data for Morgan County shows that 282 of the married-couple family households (1.8%) and 960 of the single-parent households (22.2%) are living below the poverty level. Within the married-couple family households, those with no children have the highest poverty rate, with 204 households (2.1%) falling below the poverty line. Among the single-parent households, those with 5 or more children have the highest poverty rate, with 44 household (89.8%) living below poverty.
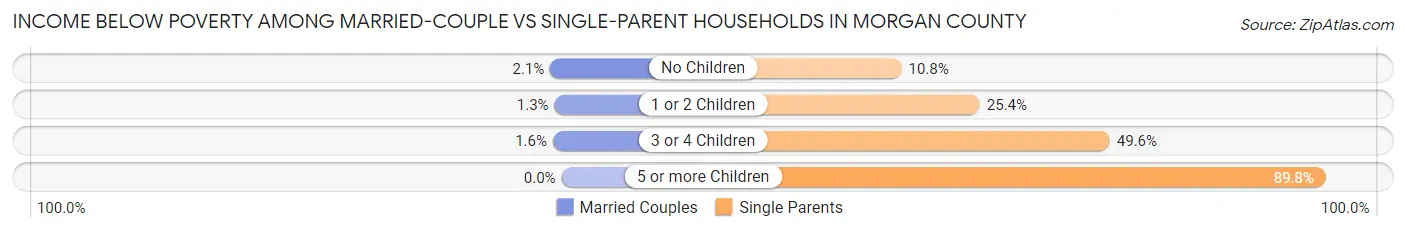
| Children | Married-Couple Families | Single-Parent Households |
| No Children | 204 (2.1%) | 190 (10.8%) |
| 1 or 2 Children | 60 (1.3%) | 547 (25.4%) |
| 3 or 4 Children | 18 (1.6%) | 179 (49.6%) |
| 5 or more Children | 0 (0.0%) | 44 (89.8%) |
| Total | 282 (1.8%) | 960 (22.2%) |
Employment Characteristics in Morgan County
Employment by Class of Employer in Morgan County
Among the 34,416 employed individuals in Morgan County, private company employees (23,956 | 69.6%), not-for-profit organizations (3,369 | 9.8%), and self-employed (not incorporated) (1,924 | 5.6%) make up the most common classes of employment.
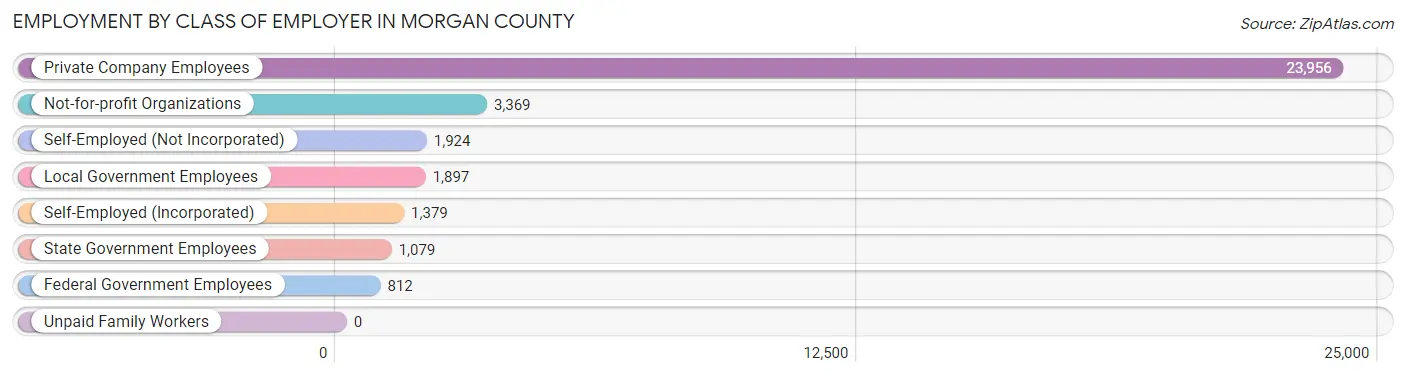
| Employer Class | # Employees | % Employees |
| Private Company Employees | 23,956 | 69.6% |
| Self-Employed (Incorporated) | 1,379 | 4.0% |
| Self-Employed (Not Incorporated) | 1,924 | 5.6% |
| Not-for-profit Organizations | 3,369 | 9.8% |
| Local Government Employees | 1,897 | 5.5% |
| State Government Employees | 1,079 | 3.1% |
| Federal Government Employees | 812 | 2.4% |
| Unpaid Family Workers | 0 | 0.0% |
| Total | 34,416 | 100.0% |
Employment Status by Age in Morgan County
According to the labor force statistics for Morgan County, out of the total population over 16 years of age (57,943), 62.8% or 36,388 individuals are in the labor force, with 4.0% or 1,456 of them unemployed. The age group with the highest labor force participation rate is 25 to 29 years, with 87.5% or 3,545 individuals in the labor force. Within the labor force, the 16 to 19 years age range has the highest percentage of unemployed individuals, with 14.1% or 229 of them being unemployed.
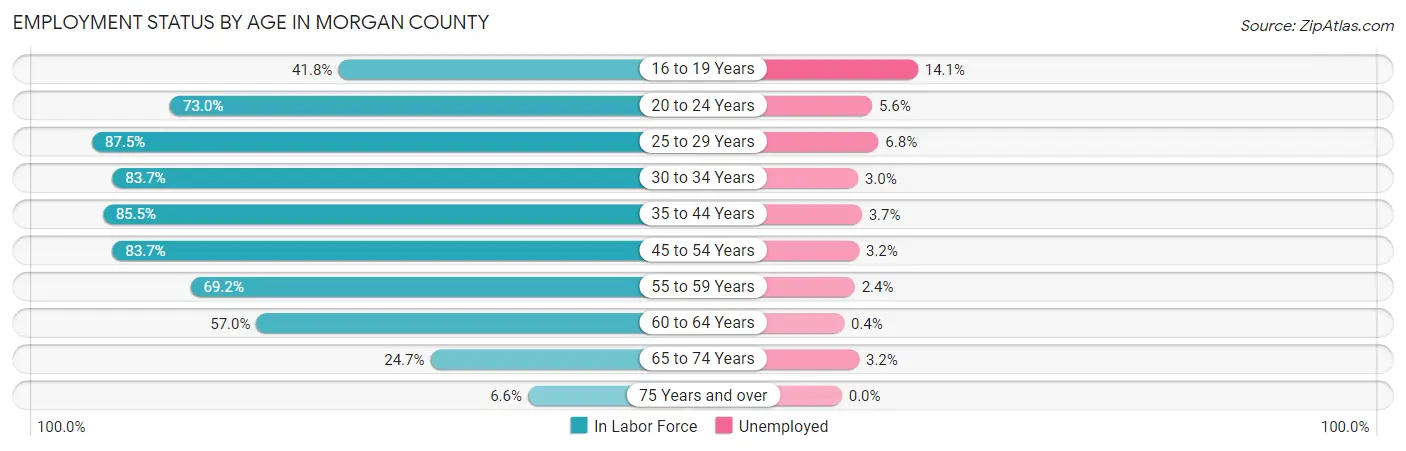
| Age Bracket | In Labor Force | Unemployed |
| 16 to 19 Years | 1,626 (41.8%) | 229 (14.1%) |
| 20 to 24 Years | 2,912 (73.0%) | 163 (5.6%) |
| 25 to 29 Years | 3,545 (87.5%) | 241 (6.8%) |
| 30 to 34 Years | 3,466 (83.7%) | 104 (3.0%) |
| 35 to 44 Years | 7,297 (85.5%) | 270 (3.7%) |
| 45 to 54 Years | 8,376 (83.7%) | 268 (3.2%) |
| 55 to 59 Years | 4,254 (69.2%) | 102 (2.4%) |
| 60 to 64 Years | 2,720 (57.0%) | 11 (0.4%) |
| 65 to 74 Years | 1,892 (24.7%) | 61 (3.2%) |
| 75 Years and over | 314 (6.6%) | 0 (0.0%) |
| Total | 36,388 (62.8%) | 1,456 (4.0%) |
Employment Status by Educational Attainment in Morgan County
According to labor force statistics for Morgan County, 78.8% of individuals (29,670) out of the total population between 25 and 64 years of age (37,652) are in the labor force, with 3.4% or 1,009 of them being unemployed. The group with the highest labor force participation rate are those with the educational attainment of bachelor's degree or higher, with 86.9% or 6,843 individuals in the labor force. Within the labor force, individuals with less than high school education have the highest percentage of unemployment, with 9.8% or 245 of them being unemployed.
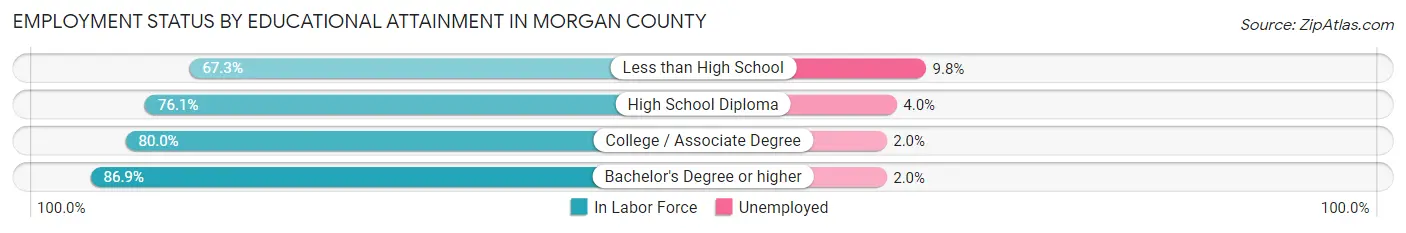
| Educational Attainment | In Labor Force | Unemployed |
| Less than High School | 2,500 (67.3%) | 364 (9.8%) |
| High School Diploma | 10,432 (76.1%) | 548 (4.0%) |
| College / Associate Degree | 9,885 (80.0%) | 247 (2.0%) |
| Bachelor's Degree or higher | 6,843 (86.9%) | 157 (2.0%) |
| Total | 29,670 (78.8%) | 1,280 (3.4%) |
Employment Occupations by Sex in Morgan County
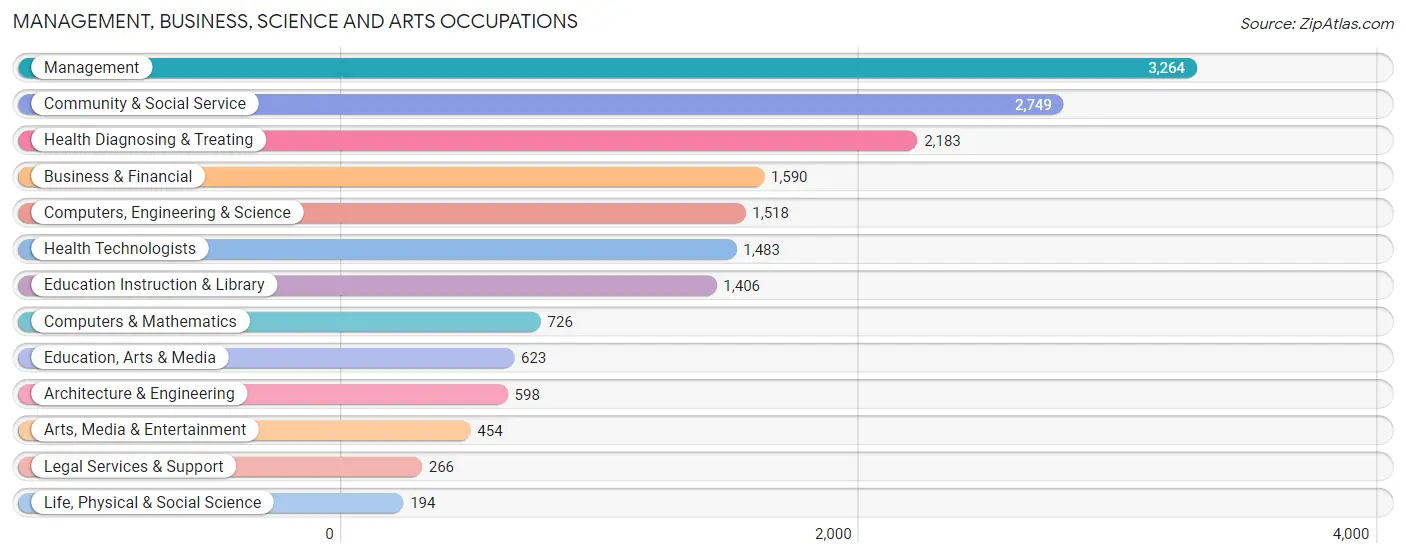
Management, Business, Science and Arts Occupations
The most common Management, Business, Science and Arts occupations in Morgan County are Management (3,264 | 9.4%), Community & Social Service (2,749 | 7.9%), Health Diagnosing & Treating (2,183 | 6.3%), Business & Financial (1,590 | 4.6%), and Computers, Engineering & Science (1,518 | 4.4%).
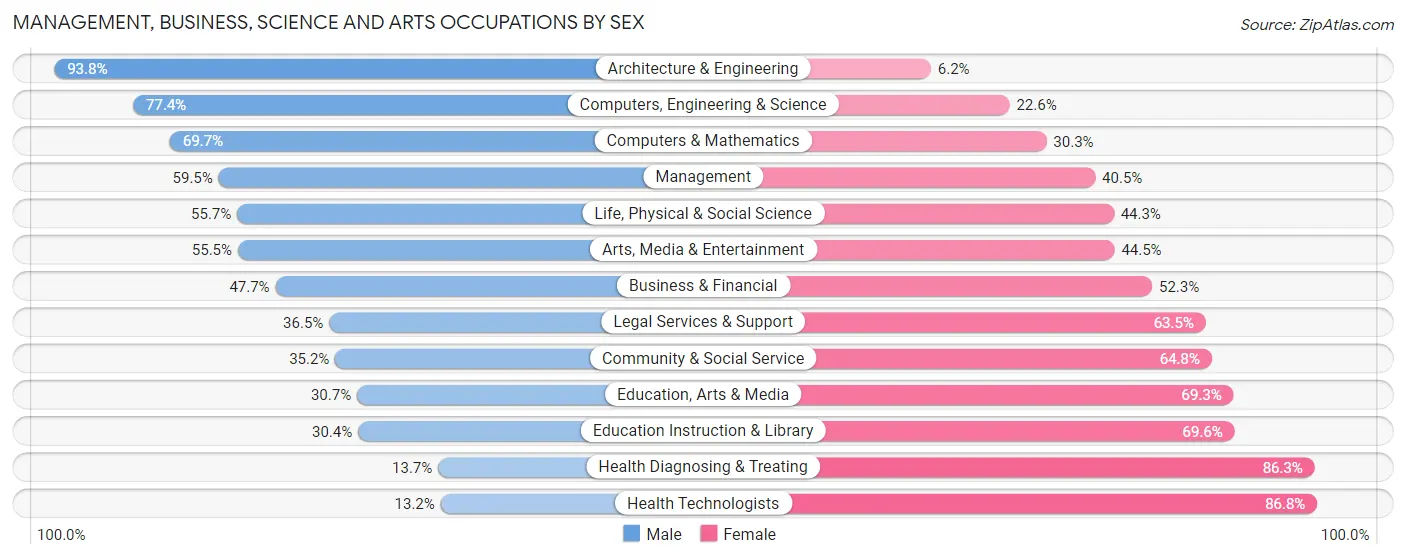
Management, Business, Science and Arts Occupations by Sex
Within the Management, Business, Science and Arts occupations in Morgan County, the most male-oriented occupations are Architecture & Engineering (93.8%), Computers, Engineering & Science (77.4%), and Computers & Mathematics (69.7%), while the most female-oriented occupations are Health Technologists (86.8%), Health Diagnosing & Treating (86.3%), and Education Instruction & Library (69.6%).
| Occupation | Male | Female |
| Management | 1,943 (59.5%) | 1,321 (40.5%) |
| Business & Financial | 758 (47.7%) | 832 (52.3%) |
| Computers, Engineering & Science | 1,175 (77.4%) | 343 (22.6%) |
| Computers & Mathematics | 506 (69.7%) | 220 (30.3%) |
| Architecture & Engineering | 561 (93.8%) | 37 (6.2%) |
| Life, Physical & Social Science | 108 (55.7%) | 86 (44.3%) |
| Community & Social Service | 968 (35.2%) | 1,781 (64.8%) |
| Education, Arts & Media | 191 (30.7%) | 432 (69.3%) |
| Legal Services & Support | 97 (36.5%) | 169 (63.5%) |
| Education Instruction & Library | 428 (30.4%) | 978 (69.6%) |
| Arts, Media & Entertainment | 252 (55.5%) | 202 (44.5%) |
| Health Diagnosing & Treating | 300 (13.7%) | 1,883 (86.3%) |
| Health Technologists | 196 (13.2%) | 1,287 (86.8%) |
| Total (Category) | 5,144 (45.5%) | 6,160 (54.5%) |
| Total (Overall) | 18,884 (54.2%) | 15,938 (45.8%) |
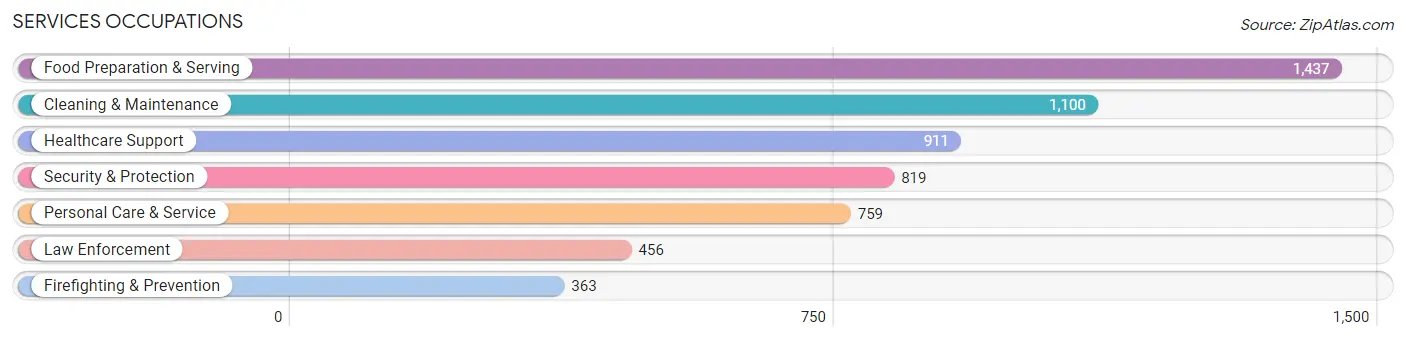
Services Occupations
The most common Services occupations in Morgan County are Food Preparation & Serving (1,437 | 4.1%), Cleaning & Maintenance (1,100 | 3.2%), Healthcare Support (911 | 2.6%), Security & Protection (819 | 2.4%), and Personal Care & Service (759 | 2.2%).
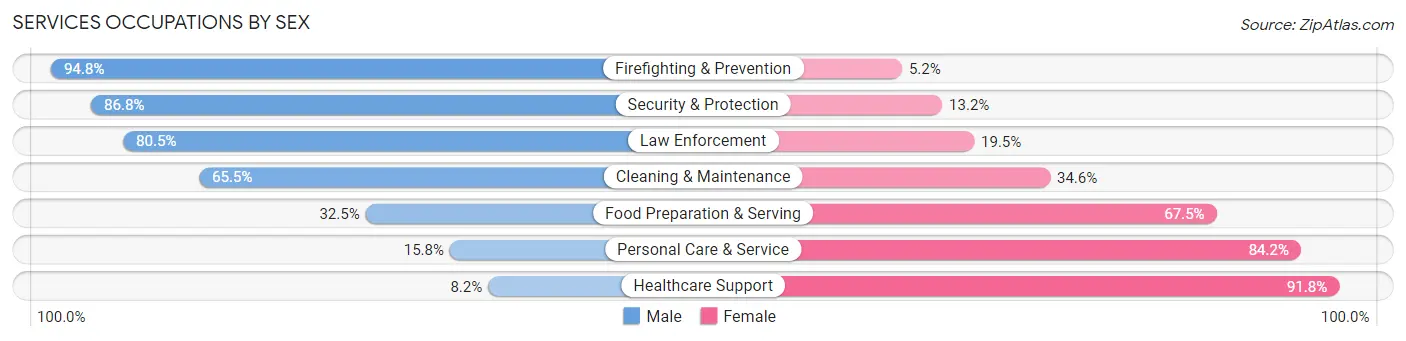
Services Occupations by Sex
Within the Services occupations in Morgan County, the most male-oriented occupations are Firefighting & Prevention (94.8%), Security & Protection (86.8%), and Law Enforcement (80.5%), while the most female-oriented occupations are Healthcare Support (91.8%), Personal Care & Service (84.2%), and Food Preparation & Serving (67.5%).
| Occupation | Male | Female |
| Healthcare Support | 75 (8.2%) | 836 (91.8%) |
| Security & Protection | 711 (86.8%) | 108 (13.2%) |
| Firefighting & Prevention | 344 (94.8%) | 19 (5.2%) |
| Law Enforcement | 367 (80.5%) | 89 (19.5%) |
| Food Preparation & Serving | 467 (32.5%) | 970 (67.5%) |
| Cleaning & Maintenance | 720 (65.4%) | 380 (34.5%) |
| Personal Care & Service | 120 (15.8%) | 639 (84.2%) |
| Total (Category) | 2,093 (41.6%) | 2,933 (58.4%) |
| Total (Overall) | 18,884 (54.2%) | 15,938 (45.8%) |
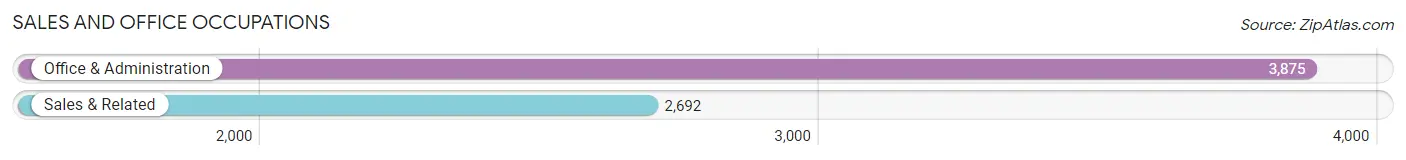
Sales and Office Occupations
The most common Sales and Office occupations in Morgan County are Office & Administration (3,875 | 11.1%), and Sales & Related (2,692 | 7.7%).
Sales and Office Occupations by Sex
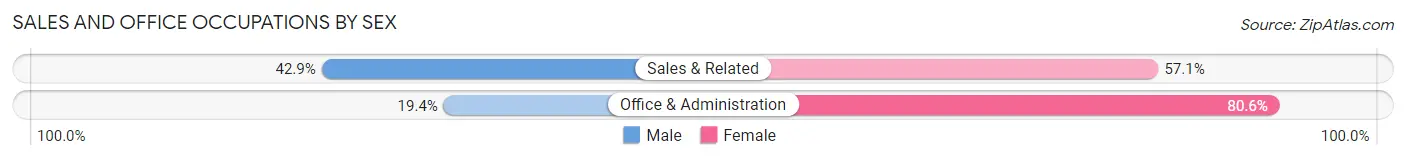
| Occupation | Male | Female |
| Sales & Related | 1,155 (42.9%) | 1,537 (57.1%) |
| Office & Administration | 752 (19.4%) | 3,123 (80.6%) |
| Total (Category) | 1,907 (29.0%) | 4,660 (71.0%) |
| Total (Overall) | 18,884 (54.2%) | 15,938 (45.8%) |
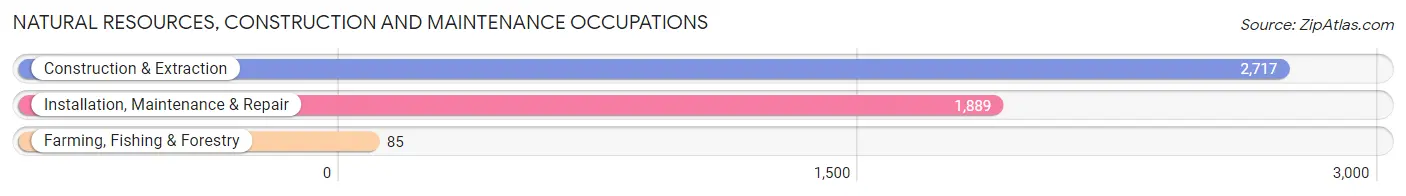
Natural Resources, Construction and Maintenance Occupations
The most common Natural Resources, Construction and Maintenance occupations in Morgan County are Construction & Extraction (2,717 | 7.8%), Installation, Maintenance & Repair (1,889 | 5.4%), and Farming, Fishing & Forestry (85 | 0.2%).
Natural Resources, Construction and Maintenance Occupations by Sex
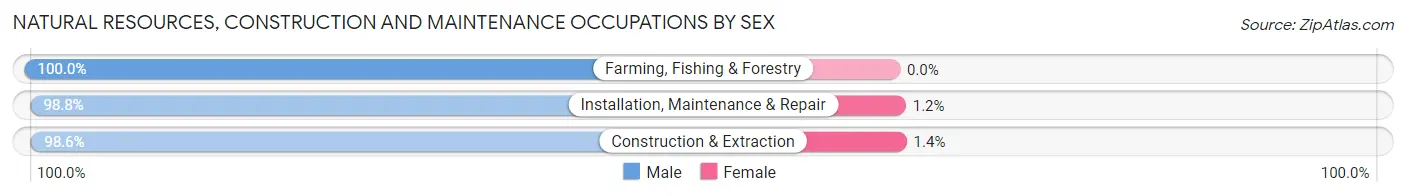
| Occupation | Male | Female |
| Farming, Fishing & Forestry | 85 (100.0%) | 0 (0.0%) |
| Construction & Extraction | 2,679 (98.6%) | 38 (1.4%) |
| Installation, Maintenance & Repair | 1,866 (98.8%) | 23 (1.2%) |
| Total (Category) | 4,630 (98.7%) | 61 (1.3%) |
| Total (Overall) | 18,884 (54.2%) | 15,938 (45.8%) |
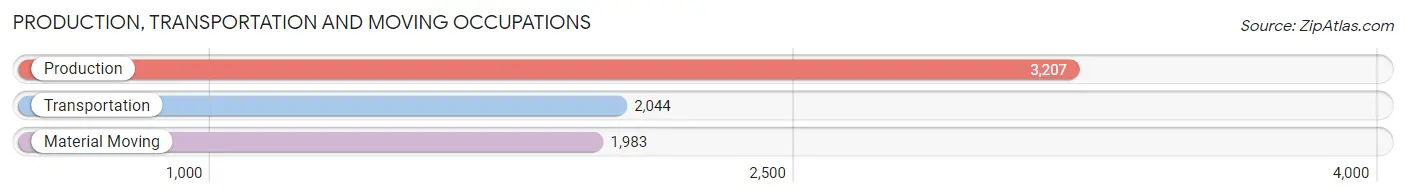
Production, Transportation and Moving Occupations
The most common Production, Transportation and Moving occupations in Morgan County are Production (3,207 | 9.2%), Transportation (2,044 | 5.9%), and Material Moving (1,983 | 5.7%).
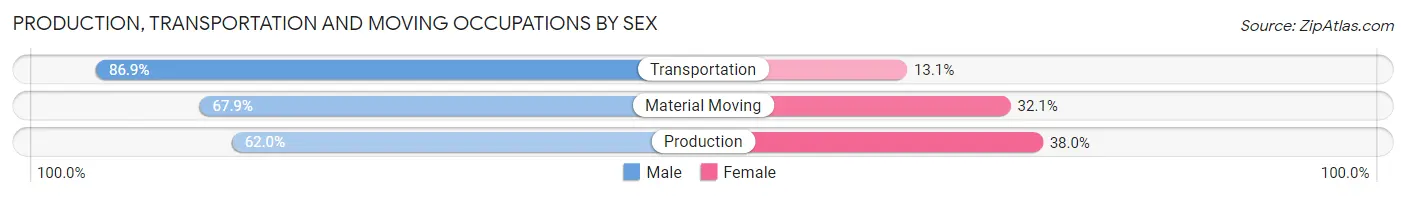
Production, Transportation and Moving Occupations by Sex
| Occupation | Male | Female |
| Production | 1,988 (62.0%) | 1,219 (38.0%) |
| Transportation | 1,776 (86.9%) | 268 (13.1%) |
| Material Moving | 1,346 (67.9%) | 637 (32.1%) |
| Total (Category) | 5,110 (70.6%) | 2,124 (29.4%) |
| Total (Overall) | 18,884 (54.2%) | 15,938 (45.8%) |
Employment Industries by Sex in Morgan County
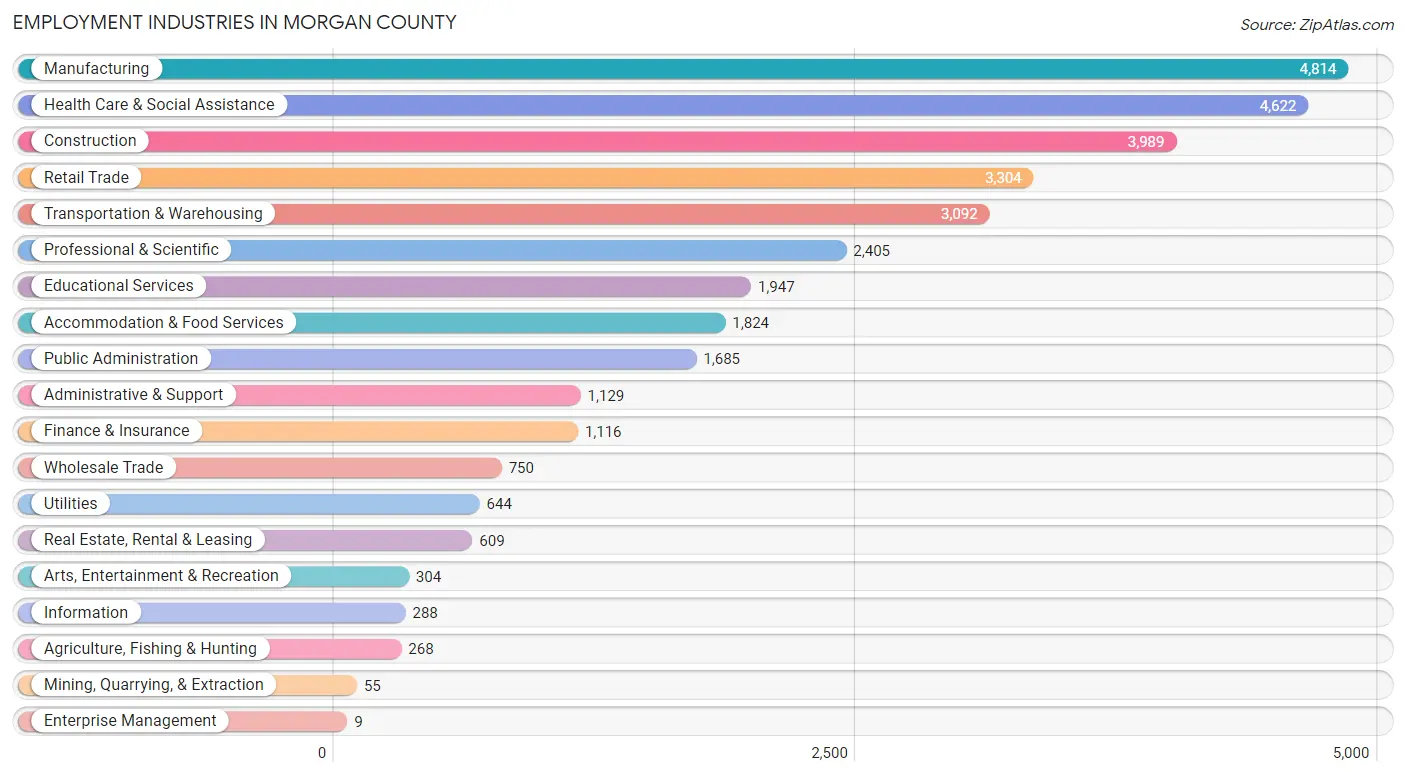
Employment Industries in Morgan County
The major employment industries in Morgan County include Manufacturing (4,814 | 13.8%), Health Care & Social Assistance (4,622 | 13.3%), Construction (3,989 | 11.5%), Retail Trade (3,304 | 9.5%), and Transportation & Warehousing (3,092 | 8.9%).
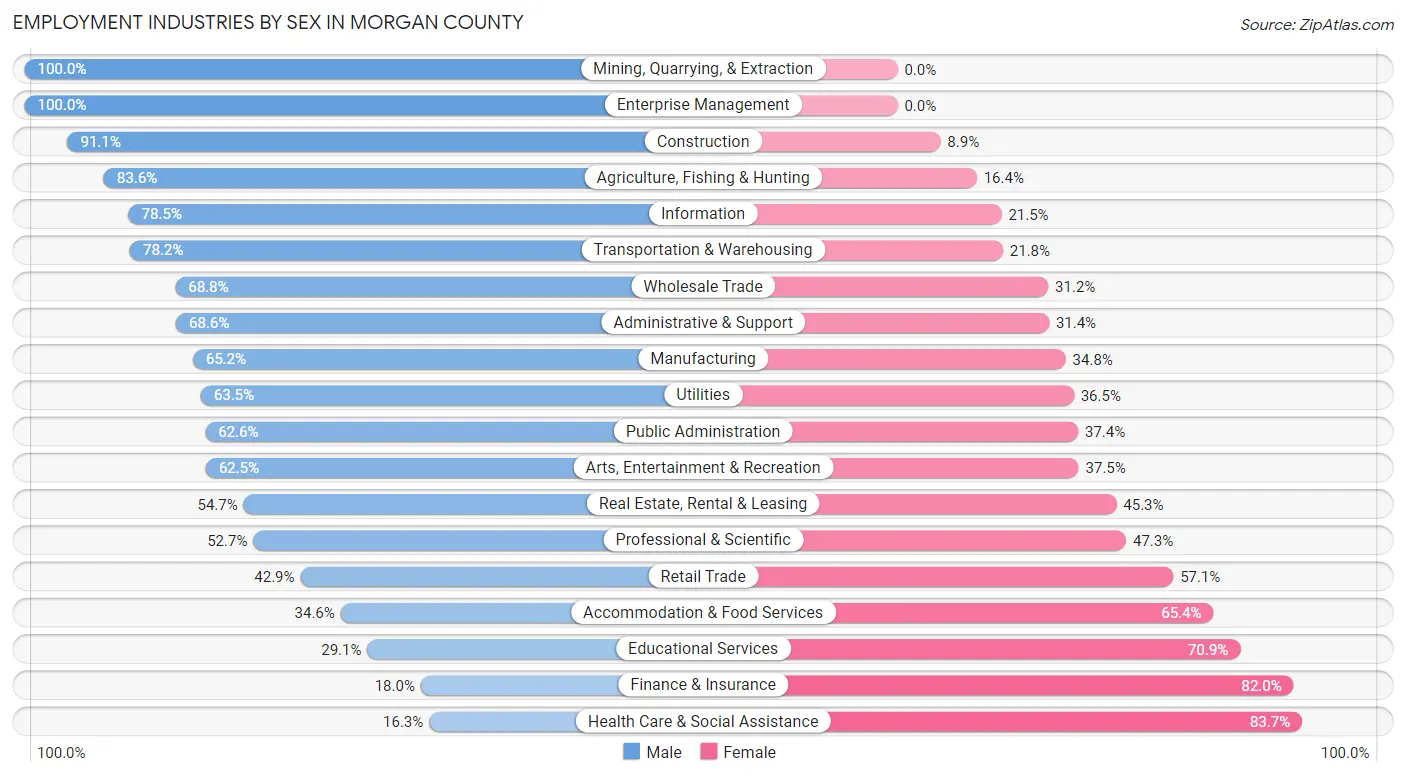
Employment Industries by Sex in Morgan County
The Morgan County industries that see more men than women are Mining, Quarrying, & Extraction (100.0%), Enterprise Management (100.0%), and Construction (91.1%), whereas the industries that tend to have a higher number of women are Health Care & Social Assistance (83.7%), Finance & Insurance (82.0%), and Educational Services (70.9%).
| Industry | Male | Female |
| Agriculture, Fishing & Hunting | 224 (83.6%) | 44 (16.4%) |
| Mining, Quarrying, & Extraction | 55 (100.0%) | 0 (0.0%) |
| Construction | 3,634 (91.1%) | 355 (8.9%) |
| Manufacturing | 3,138 (65.2%) | 1,676 (34.8%) |
| Wholesale Trade | 516 (68.8%) | 234 (31.2%) |
| Retail Trade | 1,418 (42.9%) | 1,886 (57.1%) |
| Transportation & Warehousing | 2,417 (78.2%) | 675 (21.8%) |
| Utilities | 409 (63.5%) | 235 (36.5%) |
| Information | 226 (78.5%) | 62 (21.5%) |
| Finance & Insurance | 201 (18.0%) | 915 (82.0%) |
| Real Estate, Rental & Leasing | 333 (54.7%) | 276 (45.3%) |
| Professional & Scientific | 1,267 (52.7%) | 1,138 (47.3%) |
| Enterprise Management | 9 (100.0%) | 0 (0.0%) |
| Administrative & Support | 775 (68.6%) | 354 (31.4%) |
| Educational Services | 566 (29.1%) | 1,381 (70.9%) |
| Health Care & Social Assistance | 752 (16.3%) | 3,870 (83.7%) |
| Arts, Entertainment & Recreation | 190 (62.5%) | 114 (37.5%) |
| Accommodation & Food Services | 631 (34.6%) | 1,193 (65.4%) |
| Public Administration | 1,055 (62.6%) | 630 (37.4%) |
| Total | 18,884 (54.2%) | 15,938 (45.8%) |
Education in Morgan County
School Enrollment in Morgan County
The most common levels of schooling among the 15,628 students in Morgan County are high school (4,216 | 27.0%), middle school (3,893 | 24.9%), and elementary school (3,531 | 22.6%).
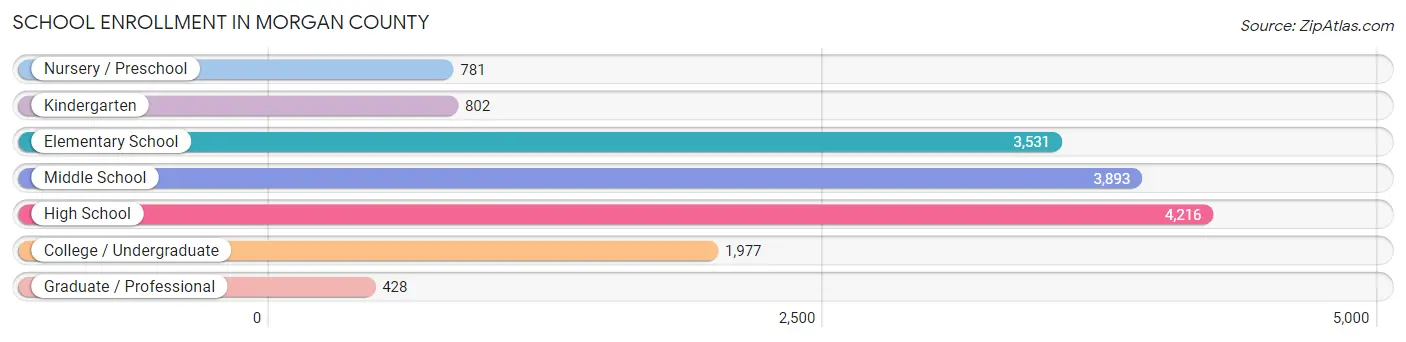
| School Level | # Students | % Students |
| Nursery / Preschool | 781 | 5.0% |
| Kindergarten | 802 | 5.1% |
| Elementary School | 3,531 | 22.6% |
| Middle School | 3,893 | 24.9% |
| High School | 4,216 | 27.0% |
| College / Undergraduate | 1,977 | 12.7% |
| Graduate / Professional | 428 | 2.7% |
| Total | 15,628 | 100.0% |
School Enrollment by Age by Funding Source in Morgan County
Out of a total of 15,628 students who are enrolled in schools in Morgan County, 2,125 (13.6%) attend a private institution, while the remaining 13,503 (86.4%) are enrolled in public schools. The age group of 3 to 4 year olds has the highest likelihood of being enrolled in private schools, with 290 (52.3% in the age bracket) enrolled. Conversely, the age group of 15 to 17 year olds has the lowest likelihood of being enrolled in a private school, with 2,803 (96.0% in the age bracket) attending a public institution.
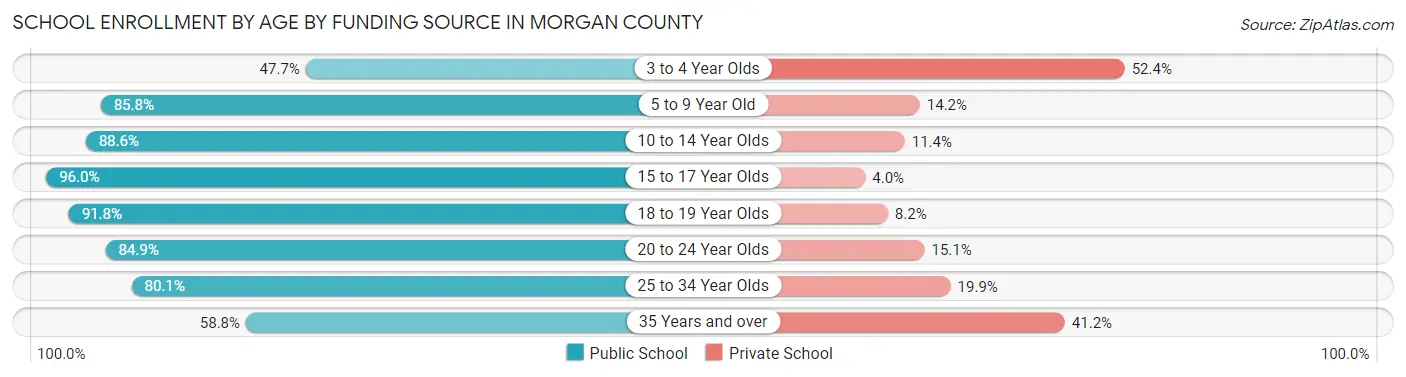
| Age Bracket | Public School | Private School |
| 3 to 4 Year Olds | 264 (47.6%) | 290 (52.3%) |
| 5 to 9 Year Old | 3,361 (85.8%) | 556 (14.2%) |
| 10 to 14 Year Olds | 4,370 (88.6%) | 562 (11.4%) |
| 15 to 17 Year Olds | 2,803 (96.0%) | 118 (4.0%) |
| 18 to 19 Year Olds | 1,080 (91.8%) | 97 (8.2%) |
| 20 to 24 Year Olds | 834 (84.9%) | 148 (15.1%) |
| 25 to 34 Year Olds | 466 (80.1%) | 116 (19.9%) |
| 35 Years and over | 331 (58.8%) | 232 (41.2%) |
| Total | 13,503 (86.4%) | 2,125 (13.6%) |
Educational Attainment by Field of Study in Morgan County
Business (2,025 | 17.8%), science & technology (1,572 | 13.9%), education (1,545 | 13.6%), arts & humanities (895 | 7.9%), and liberal arts & history (848 | 7.5%) are the most common fields of study among 11,350 individuals in Morgan County who have obtained a bachelor's degree or higher.
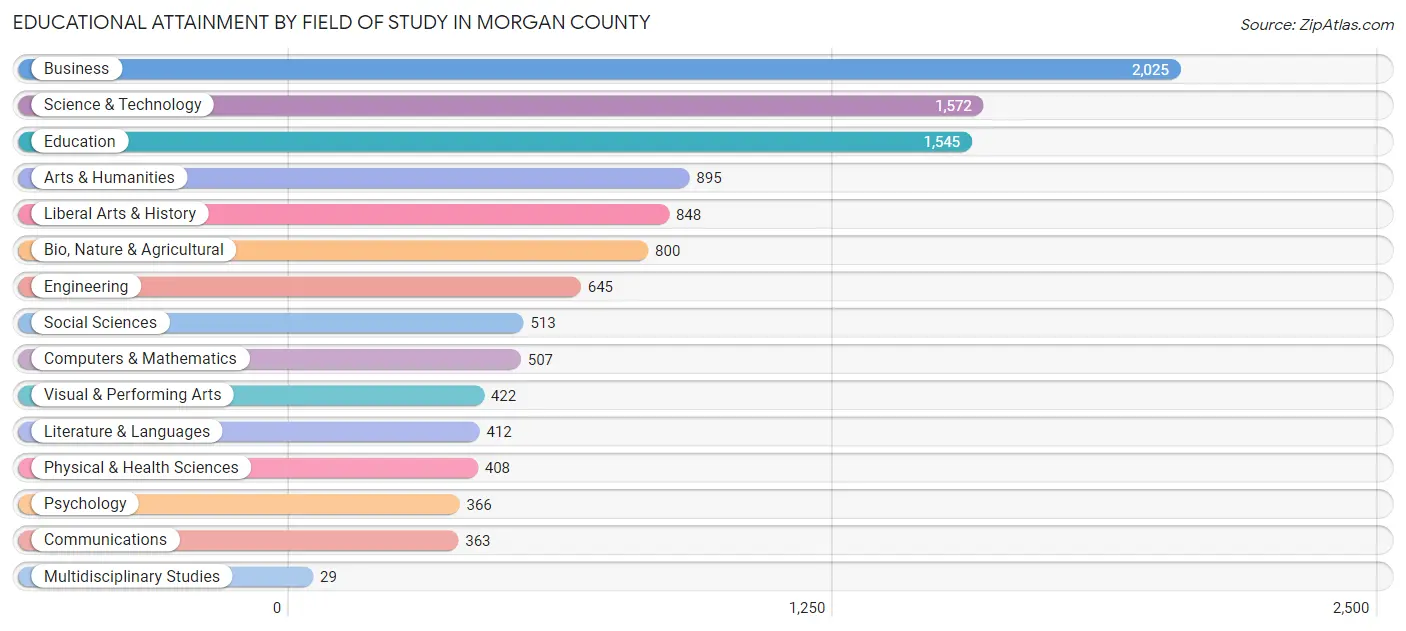
| Field of Study | # Graduates | % Graduates |
| Computers & Mathematics | 507 | 4.5% |
| Bio, Nature & Agricultural | 800 | 7.0% |
| Physical & Health Sciences | 408 | 3.6% |
| Psychology | 366 | 3.2% |
| Social Sciences | 513 | 4.5% |
| Engineering | 645 | 5.7% |
| Multidisciplinary Studies | 29 | 0.3% |
| Science & Technology | 1,572 | 13.9% |
| Business | 2,025 | 17.8% |
| Education | 1,545 | 13.6% |
| Literature & Languages | 412 | 3.6% |
| Liberal Arts & History | 848 | 7.5% |
| Visual & Performing Arts | 422 | 3.7% |
| Communications | 363 | 3.2% |
| Arts & Humanities | 895 | 7.9% |
| Total | 11,350 | 100.0% |
Transportation & Commute in Morgan County
Vehicle Availability by Sex in Morgan County
The most prevalent vehicle ownership categories in Morgan County are males with 2 vehicles (7,115, accounting for 38.1%) and females with 2 vehicles (5,905, making up 45.4%).
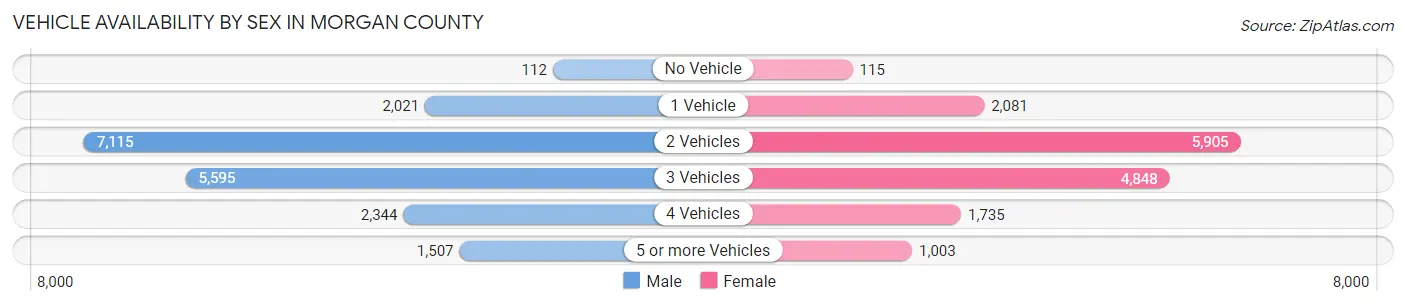
| Vehicles Available | Male | Female |
| No Vehicle | 112 (0.6%) | 115 (0.7%) |
| 1 Vehicle | 2,021 (10.8%) | 2,081 (13.3%) |
| 2 Vehicles | 7,115 (38.1%) | 5,905 (37.6%) |
| 3 Vehicles | 5,595 (29.9%) | 4,848 (30.9%) |
| 4 Vehicles | 2,344 (12.5%) | 1,735 (11.1%) |
| 5 or more Vehicles | 1,507 (8.1%) | 1,003 (6.4%) |
| Total | 18,694 (100.0%) | 15,687 (100.0%) |
Commute Time in Morgan County
The most frequently occuring commute durations in Morgan County are 30 to 34 minutes (5,434 commuters, 17.2%), 45 to 59 minutes (4,352 commuters, 13.8%), and 20 to 24 minutes (3,581 commuters, 11.3%).
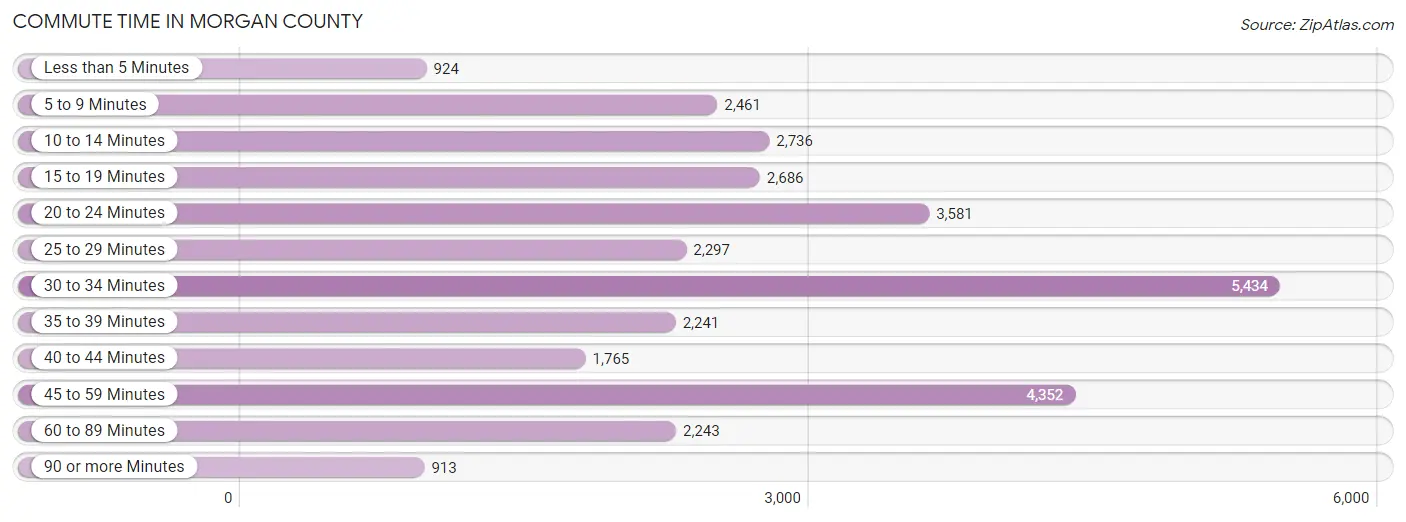
| Commute Time | # Commuters | % Commuters |
| Less than 5 Minutes | 924 | 2.9% |
| 5 to 9 Minutes | 2,461 | 7.8% |
| 10 to 14 Minutes | 2,736 | 8.6% |
| 15 to 19 Minutes | 2,686 | 8.5% |
| 20 to 24 Minutes | 3,581 | 11.3% |
| 25 to 29 Minutes | 2,297 | 7.3% |
| 30 to 34 Minutes | 5,434 | 17.2% |
| 35 to 39 Minutes | 2,241 | 7.1% |
| 40 to 44 Minutes | 1,765 | 5.6% |
| 45 to 59 Minutes | 4,352 | 13.8% |
| 60 to 89 Minutes | 2,243 | 7.1% |
| 90 or more Minutes | 913 | 2.9% |
Commute Time by Sex in Morgan County
The most common commute times in Morgan County are 30 to 34 minutes (3,157 commuters, 18.0%) for males and 30 to 34 minutes (2,277 commuters, 16.2%) for females.
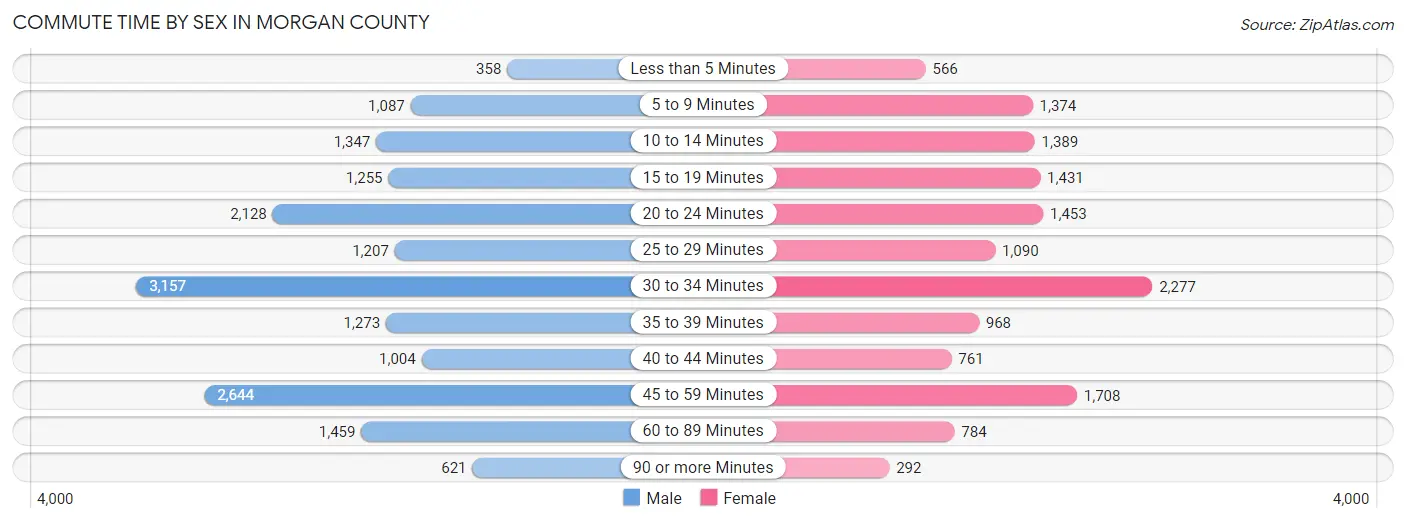
| Commute Time | Male | Female |
| Less than 5 Minutes | 358 (2.0%) | 566 (4.0%) |
| 5 to 9 Minutes | 1,087 (6.2%) | 1,374 (9.8%) |
| 10 to 14 Minutes | 1,347 (7.7%) | 1,389 (9.9%) |
| 15 to 19 Minutes | 1,255 (7.2%) | 1,431 (10.2%) |
| 20 to 24 Minutes | 2,128 (12.1%) | 1,453 (10.3%) |
| 25 to 29 Minutes | 1,207 (6.9%) | 1,090 (7.7%) |
| 30 to 34 Minutes | 3,157 (18.0%) | 2,277 (16.2%) |
| 35 to 39 Minutes | 1,273 (7.3%) | 968 (6.9%) |
| 40 to 44 Minutes | 1,004 (5.7%) | 761 (5.4%) |
| 45 to 59 Minutes | 2,644 (15.1%) | 1,708 (12.1%) |
| 60 to 89 Minutes | 1,459 (8.3%) | 784 (5.6%) |
| 90 or more Minutes | 621 (3.5%) | 292 (2.1%) |
Time of Departure to Work by Sex in Morgan County
The most frequent times of departure to work in Morgan County are 6:00 AM to 6:29 AM (2,911, 16.6%) for males and 7:00 AM to 7:29 AM (2,448, 17.4%) for females.
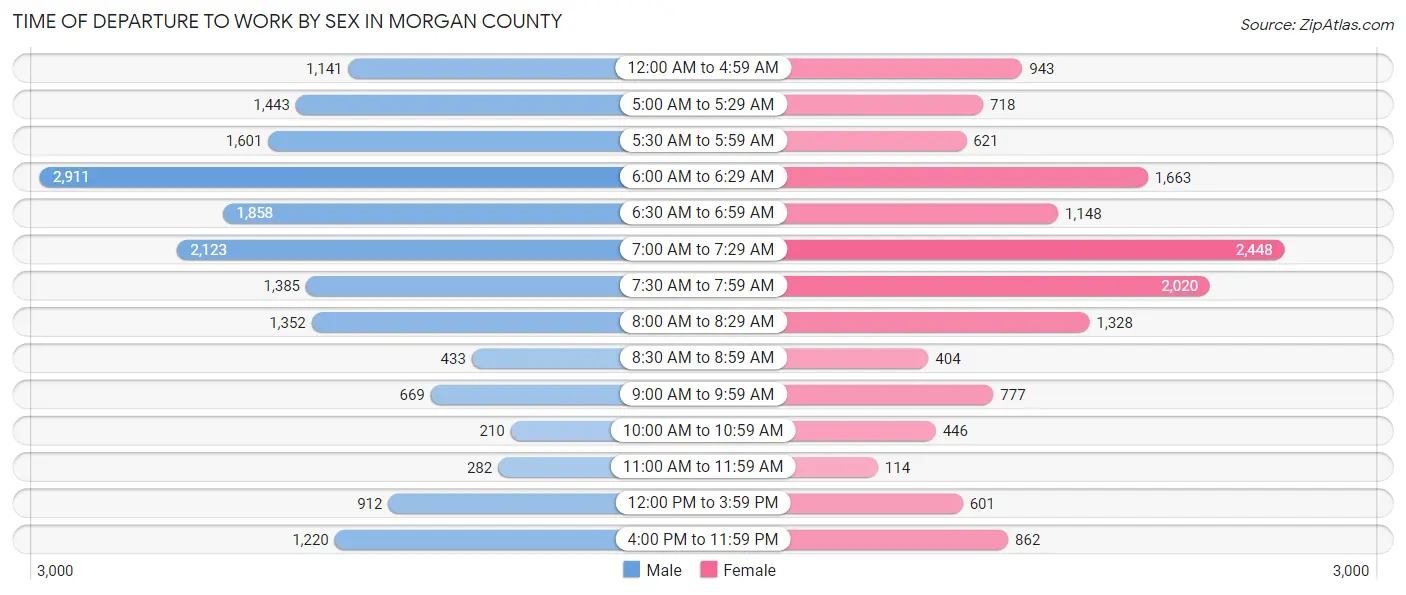
| Time of Departure | Male | Female |
| 12:00 AM to 4:59 AM | 1,141 (6.5%) | 943 (6.7%) |
| 5:00 AM to 5:29 AM | 1,443 (8.2%) | 718 (5.1%) |
| 5:30 AM to 5:59 AM | 1,601 (9.1%) | 621 (4.4%) |
| 6:00 AM to 6:29 AM | 2,911 (16.6%) | 1,663 (11.8%) |
| 6:30 AM to 6:59 AM | 1,858 (10.6%) | 1,148 (8.2%) |
| 7:00 AM to 7:29 AM | 2,123 (12.1%) | 2,448 (17.4%) |
| 7:30 AM to 7:59 AM | 1,385 (7.9%) | 2,020 (14.3%) |
| 8:00 AM to 8:29 AM | 1,352 (7.7%) | 1,328 (9.4%) |
| 8:30 AM to 8:59 AM | 433 (2.5%) | 404 (2.9%) |
| 9:00 AM to 9:59 AM | 669 (3.8%) | 777 (5.5%) |
| 10:00 AM to 10:59 AM | 210 (1.2%) | 446 (3.2%) |
| 11:00 AM to 11:59 AM | 282 (1.6%) | 114 (0.8%) |
| 12:00 PM to 3:59 PM | 912 (5.2%) | 601 (4.3%) |
| 4:00 PM to 11:59 PM | 1,220 (7.0%) | 862 (6.1%) |
| Total | 17,540 (100.0%) | 14,093 (100.0%) |
Housing Occupancy in Morgan County
Occupancy by Ownership in Morgan County
Of the total 27,138 dwellings in Morgan County, owner-occupied units account for 22,372 (82.4%), while renter-occupied units make up 4,766 (17.6%).
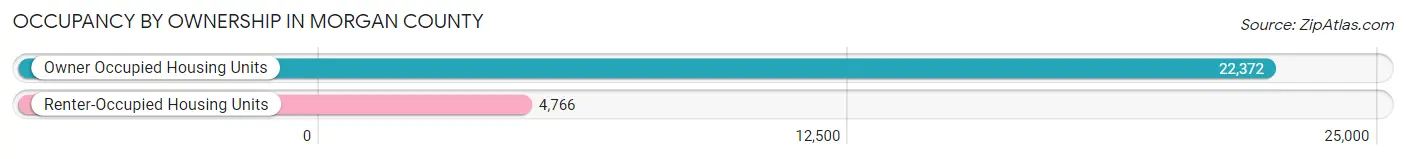
| Occupancy | # Housing Units | % Housing Units |
| Owner Occupied Housing Units | 22,372 | 82.4% |
| Renter-Occupied Housing Units | 4,766 | 17.6% |
| Total Occupied Housing Units | 27,138 | 100.0% |
Occupancy by Household Size in Morgan County
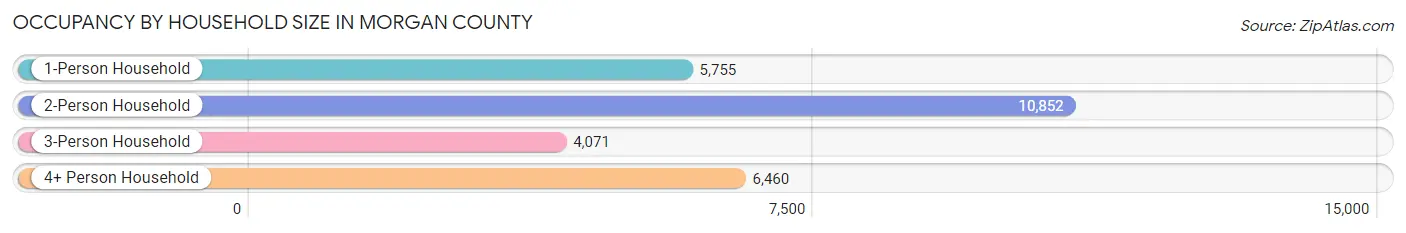
| Household Size | # Housing Units | % Housing Units |
| 1-Person Household | 5,755 | 21.2% |
| 2-Person Household | 10,852 | 40.0% |
| 3-Person Household | 4,071 | 15.0% |
| 4+ Person Household | 6,460 | 23.8% |
| Total Housing Units | 27,138 | 100.0% |
Occupancy by Ownership by Household Size in Morgan County
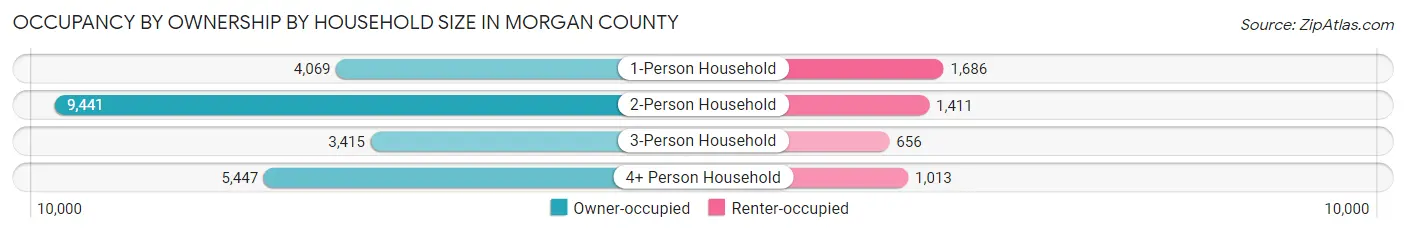
| Household Size | Owner-occupied | Renter-occupied |
| 1-Person Household | 4,069 (70.7%) | 1,686 (29.3%) |
| 2-Person Household | 9,441 (87.0%) | 1,411 (13.0%) |
| 3-Person Household | 3,415 (83.9%) | 656 (16.1%) |
| 4+ Person Household | 5,447 (84.3%) | 1,013 (15.7%) |
| Total Housing Units | 22,372 (82.4%) | 4,766 (17.6%) |
Occupancy by Educational Attainment in Morgan County
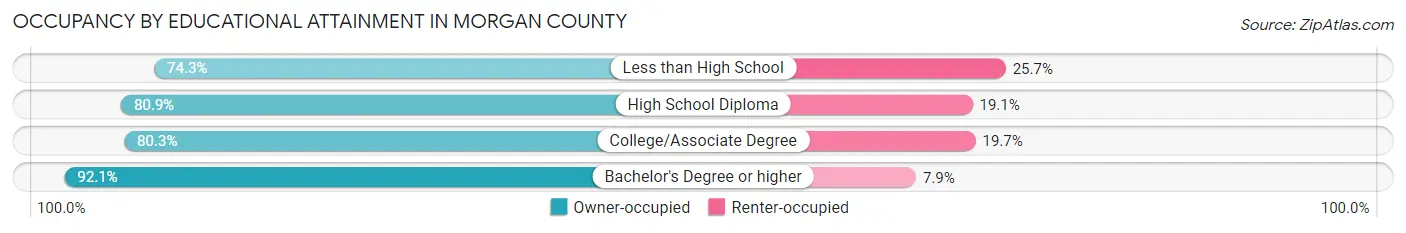
| Household Size | Owner-occupied | Renter-occupied |
| Less than High School | 1,990 (74.3%) | 688 (25.7%) |
| High School Diploma | 7,818 (80.9%) | 1,847 (19.1%) |
| College/Associate Degree | 7,223 (80.3%) | 1,773 (19.7%) |
| Bachelor's Degree or higher | 5,341 (92.1%) | 458 (7.9%) |
Occupancy by Age of Householder in Morgan County
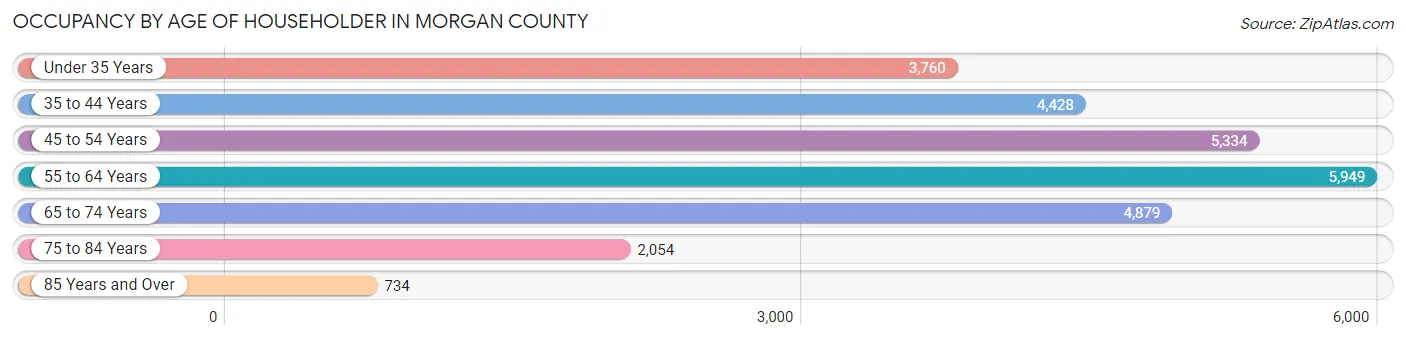
| Age Bracket | # Households | % Households |
| Under 35 Years | 3,760 | 13.9% |
| 35 to 44 Years | 4,428 | 16.3% |
| 45 to 54 Years | 5,334 | 19.7% |
| 55 to 64 Years | 5,949 | 21.9% |
| 65 to 74 Years | 4,879 | 18.0% |
| 75 to 84 Years | 2,054 | 7.6% |
| 85 Years and Over | 734 | 2.7% |
| Total | 27,138 | 100.0% |
Housing Finances in Morgan County
Median Income by Occupancy in Morgan County
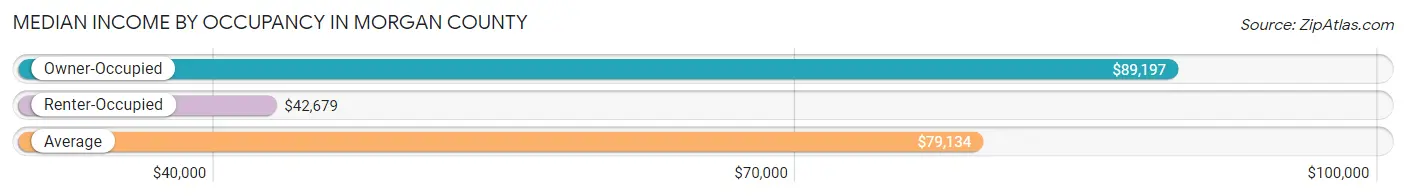
| Occupancy Type | # Households | Median Income |
| Owner-Occupied | 22,372 (82.4%) | $89,197 |
| Renter-Occupied | 4,766 (17.6%) | $42,679 |
| Average | 27,138 (100.0%) | $79,134 |
Occupancy by Householder Income Bracket in Morgan County
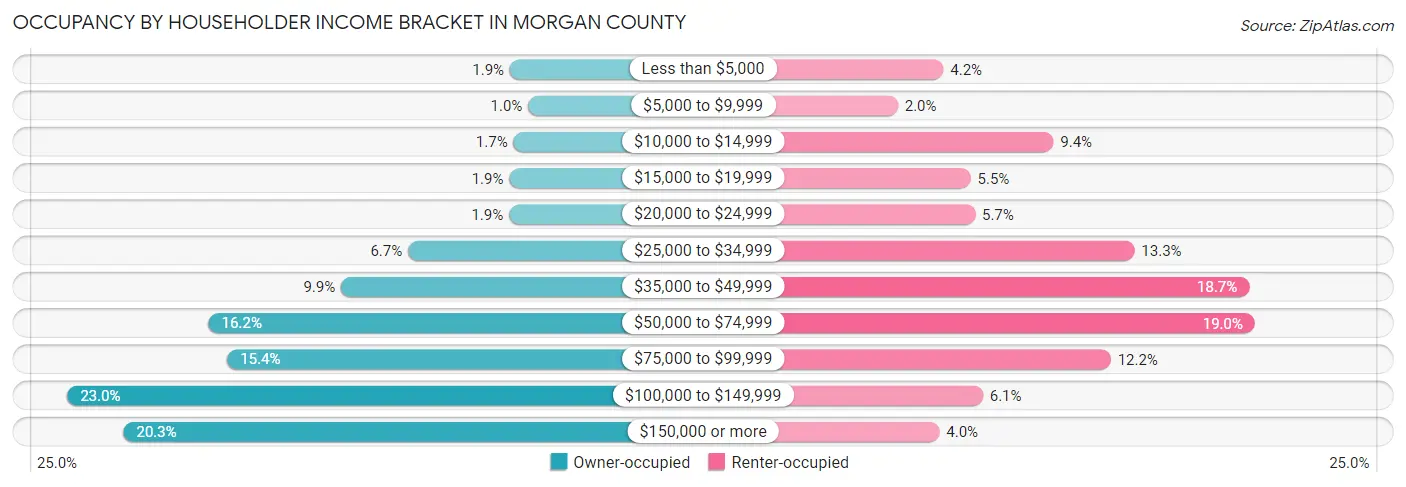
| Income Bracket | Owner-occupied | Renter-occupied |
| Less than $5,000 | 423 (1.9%) | 199 (4.2%) |
| $5,000 to $9,999 | 228 (1.0%) | 96 (2.0%) |
| $10,000 to $14,999 | 384 (1.7%) | 449 (9.4%) |
| $15,000 to $19,999 | 430 (1.9%) | 261 (5.5%) |
| $20,000 to $24,999 | 432 (1.9%) | 271 (5.7%) |
| $25,000 to $34,999 | 1,507 (6.7%) | 633 (13.3%) |
| $35,000 to $49,999 | 2,221 (9.9%) | 893 (18.7%) |
| $50,000 to $74,999 | 3,634 (16.2%) | 906 (19.0%) |
| $75,000 to $99,999 | 3,433 (15.3%) | 579 (12.1%) |
| $100,000 to $149,999 | 5,139 (23.0%) | 289 (6.1%) |
| $150,000 or more | 4,541 (20.3%) | 190 (4.0%) |
| Total | 22,372 (100.0%) | 4,766 (100.0%) |
Monthly Housing Cost Tiers in Morgan County
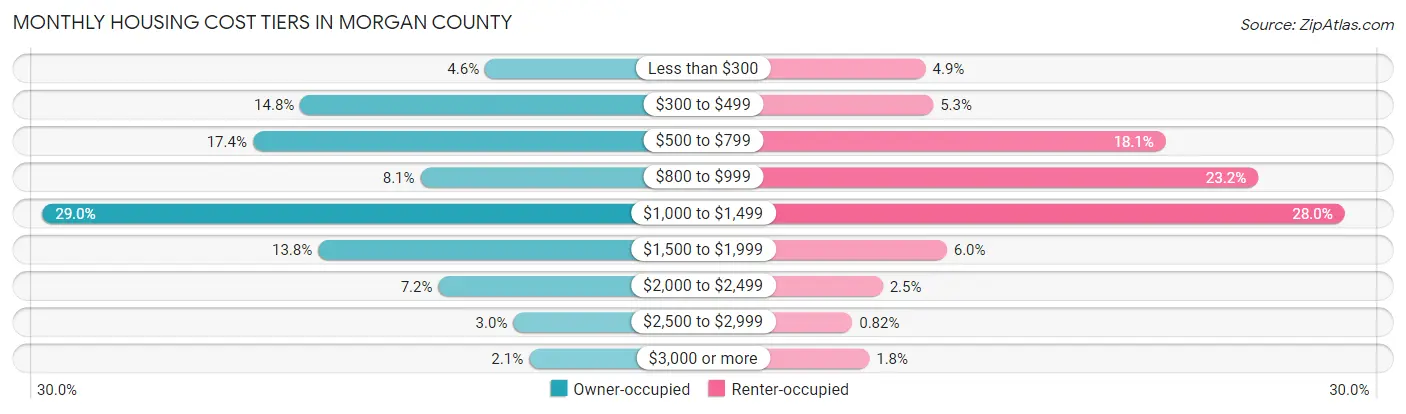
| Monthly Cost | Owner-occupied | Renter-occupied |
| Less than $300 | 1,022 (4.6%) | 232 (4.9%) |
| $300 to $499 | 3,307 (14.8%) | 252 (5.3%) |
| $500 to $799 | 3,892 (17.4%) | 864 (18.1%) |
| $800 to $999 | 1,822 (8.1%) | 1,107 (23.2%) |
| $1,000 to $1,499 | 6,493 (29.0%) | 1,335 (28.0%) |
| $1,500 to $1,999 | 3,085 (13.8%) | 288 (6.0%) |
| $2,000 to $2,499 | 1,599 (7.1%) | 119 (2.5%) |
| $2,500 to $2,999 | 674 (3.0%) | 39 (0.8%) |
| $3,000 or more | 478 (2.1%) | 84 (1.8%) |
| Total | 22,372 (100.0%) | 4,766 (100.0%) |
Physical Housing Characteristics in Morgan County
Housing Structures in Morgan County
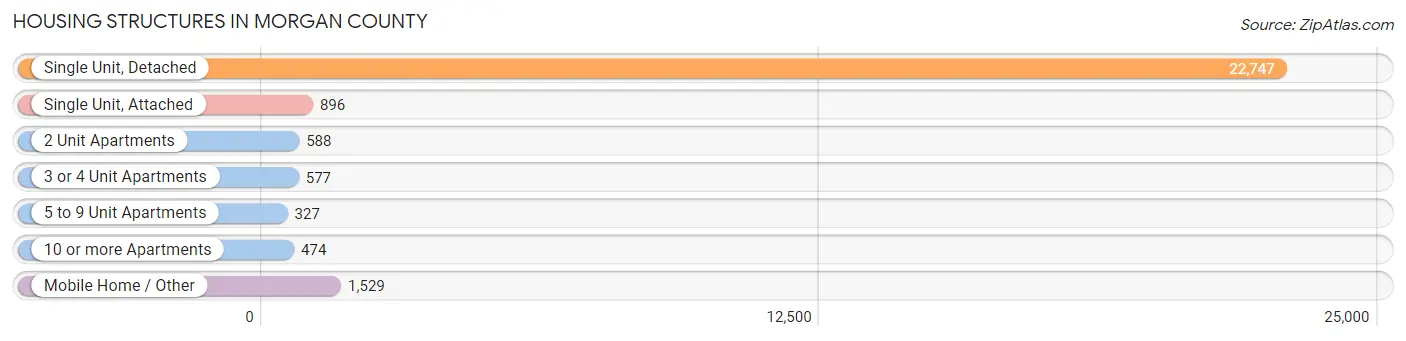
| Structure Type | # Housing Units | % Housing Units |
| Single Unit, Detached | 22,747 | 83.8% |
| Single Unit, Attached | 896 | 3.3% |
| 2 Unit Apartments | 588 | 2.2% |
| 3 or 4 Unit Apartments | 577 | 2.1% |
| 5 to 9 Unit Apartments | 327 | 1.2% |
| 10 or more Apartments | 474 | 1.8% |
| Mobile Home / Other | 1,529 | 5.6% |
| Total | 27,138 | 100.0% |
Housing Structures by Occupancy in Morgan County
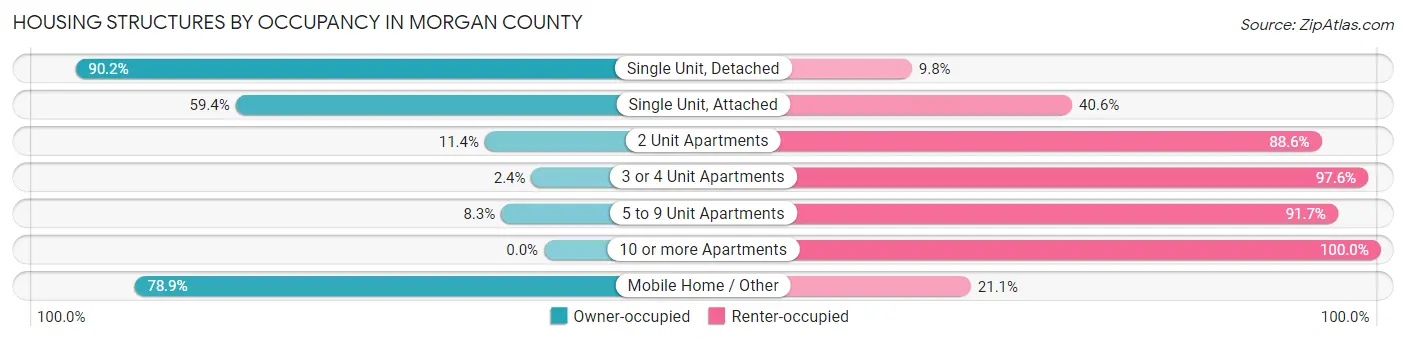
| Structure Type | Owner-occupied | Renter-occupied |
| Single Unit, Detached | 20,526 (90.2%) | 2,221 (9.8%) |
| Single Unit, Attached | 532 (59.4%) | 364 (40.6%) |
| 2 Unit Apartments | 67 (11.4%) | 521 (88.6%) |
| 3 or 4 Unit Apartments | 14 (2.4%) | 563 (97.6%) |
| 5 to 9 Unit Apartments | 27 (8.3%) | 300 (91.7%) |
| 10 or more Apartments | 0 (0.0%) | 474 (100.0%) |
| Mobile Home / Other | 1,206 (78.9%) | 323 (21.1%) |
| Total | 22,372 (82.4%) | 4,766 (17.6%) |
Housing Structures by Number of Rooms in Morgan County
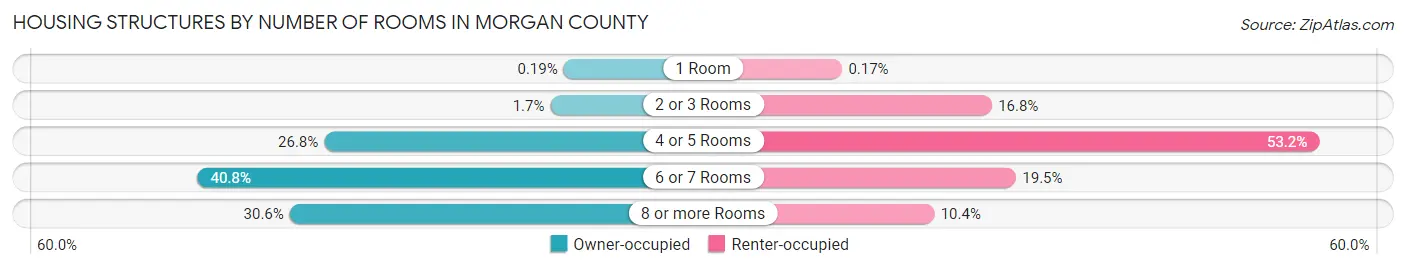
| Number of Rooms | Owner-occupied | Renter-occupied |
| 1 Room | 43 (0.2%) | 8 (0.2%) |
| 2 or 3 Rooms | 372 (1.7%) | 800 (16.8%) |
| 4 or 5 Rooms | 5,986 (26.8%) | 2,534 (53.2%) |
| 6 or 7 Rooms | 9,127 (40.8%) | 928 (19.5%) |
| 8 or more Rooms | 6,844 (30.6%) | 496 (10.4%) |
| Total | 22,372 (100.0%) | 4,766 (100.0%) |
Housing Structure by Heating Type in Morgan County
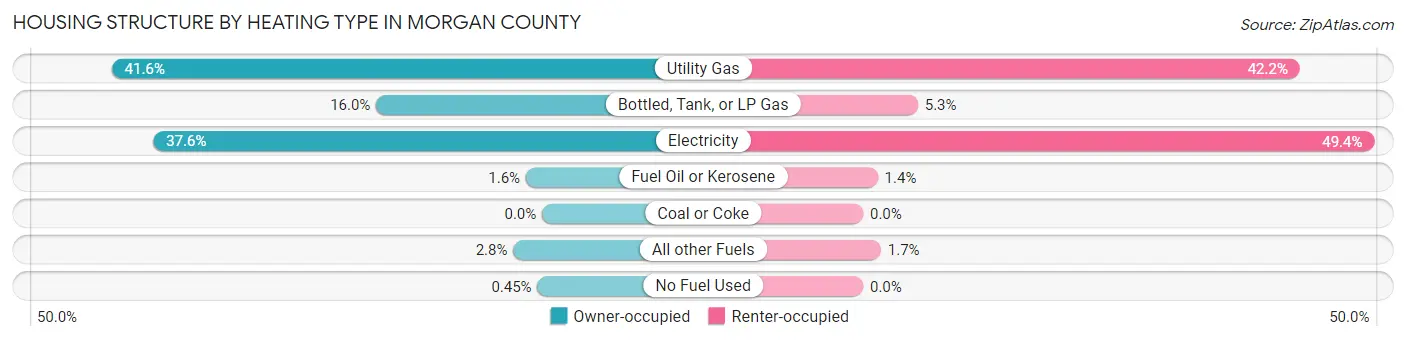
| Heating Type | Owner-occupied | Renter-occupied |
| Utility Gas | 9,305 (41.6%) | 2,011 (42.2%) |
| Bottled, Tank, or LP Gas | 3,586 (16.0%) | 252 (5.3%) |
| Electricity | 8,408 (37.6%) | 2,354 (49.4%) |
| Fuel Oil or Kerosene | 350 (1.6%) | 67 (1.4%) |
| Coal or Coke | 0 (0.0%) | 0 (0.0%) |
| All other Fuels | 622 (2.8%) | 82 (1.7%) |
| No Fuel Used | 101 (0.4%) | 0 (0.0%) |
| Total | 22,372 (100.0%) | 4,766 (100.0%) |
Household Vehicle Usage in Morgan County
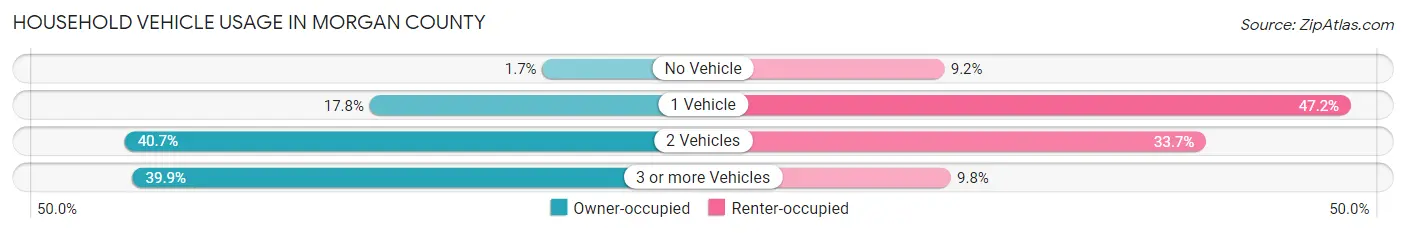
| Vehicles per Household | Owner-occupied | Renter-occupied |
| No Vehicle | 372 (1.7%) | 440 (9.2%) |
| 1 Vehicle | 3,977 (17.8%) | 2,251 (47.2%) |
| 2 Vehicles | 9,094 (40.6%) | 1,607 (33.7%) |
| 3 or more Vehicles | 8,929 (39.9%) | 468 (9.8%) |
| Total | 22,372 (100.0%) | 4,766 (100.0%) |
Real Estate & Mortgages in Morgan County
Real Estate and Mortgage Overview in Morgan County
| Characteristic | Without Mortgage | With Mortgage |
| Housing Units | 7,115 | 15,257 |
| Median Property Value | $188,900 | $205,200 |
| Median Household Income | $65,496 | $3,466 |
| Monthly Housing Costs | $469 | $466 |
| Real Estate Taxes | $849 | $405 |
Property Value by Mortgage Status in Morgan County
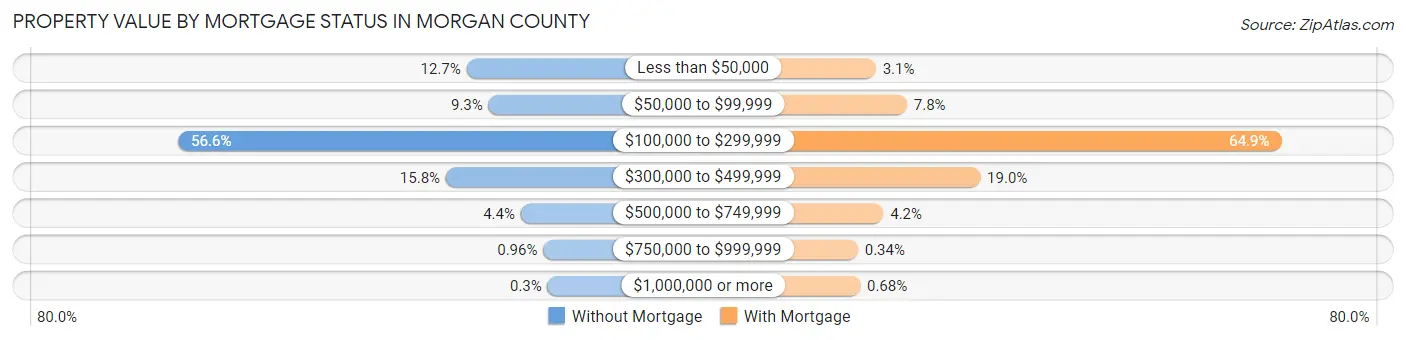
| Property Value | Without Mortgage | With Mortgage |
| Less than $50,000 | 901 (12.7%) | 469 (3.1%) |
| $50,000 to $99,999 | 661 (9.3%) | 1,193 (7.8%) |
| $100,000 to $299,999 | 4,028 (56.6%) | 9,897 (64.9%) |
| $300,000 to $499,999 | 1,124 (15.8%) | 2,897 (19.0%) |
| $500,000 to $749,999 | 312 (4.4%) | 646 (4.2%) |
| $750,000 to $999,999 | 68 (1.0%) | 52 (0.3%) |
| $1,000,000 or more | 21 (0.3%) | 103 (0.7%) |
| Total | 7,115 (100.0%) | 15,257 (100.0%) |
Household Income by Mortgage Status in Morgan County
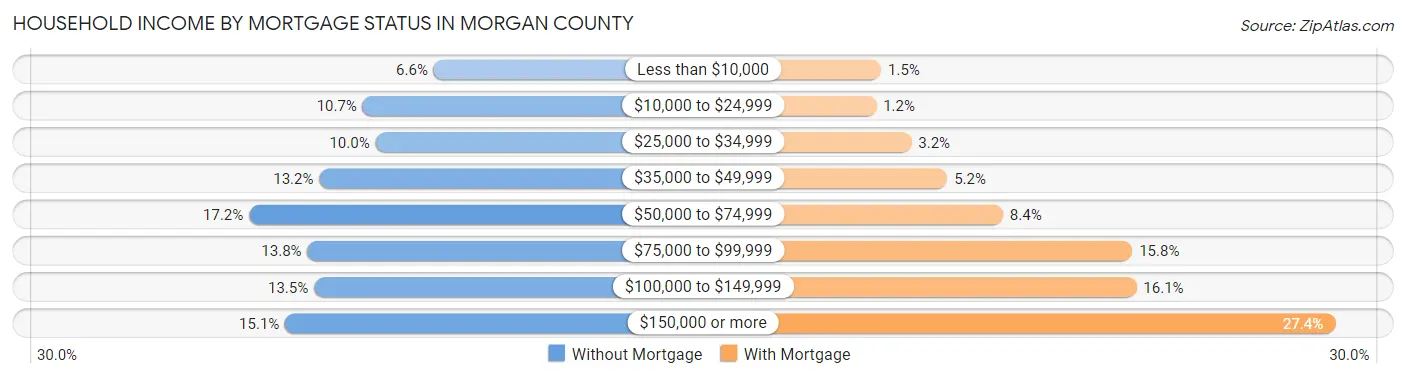
| Household Income | Without Mortgage | With Mortgage |
| Less than $10,000 | 471 (6.6%) | 222 (1.5%) |
| $10,000 to $24,999 | 760 (10.7%) | 180 (1.2%) |
| $25,000 to $34,999 | 708 (10.0%) | 486 (3.2%) |
| $35,000 to $49,999 | 936 (13.2%) | 799 (5.2%) |
| $50,000 to $74,999 | 1,222 (17.2%) | 1,285 (8.4%) |
| $75,000 to $99,999 | 985 (13.8%) | 2,412 (15.8%) |
| $100,000 to $149,999 | 958 (13.5%) | 2,448 (16.1%) |
| $150,000 or more | 1,075 (15.1%) | 4,181 (27.4%) |
| Total | 7,115 (100.0%) | 15,257 (100.0%) |
Property Value to Household Income Ratio in Morgan County
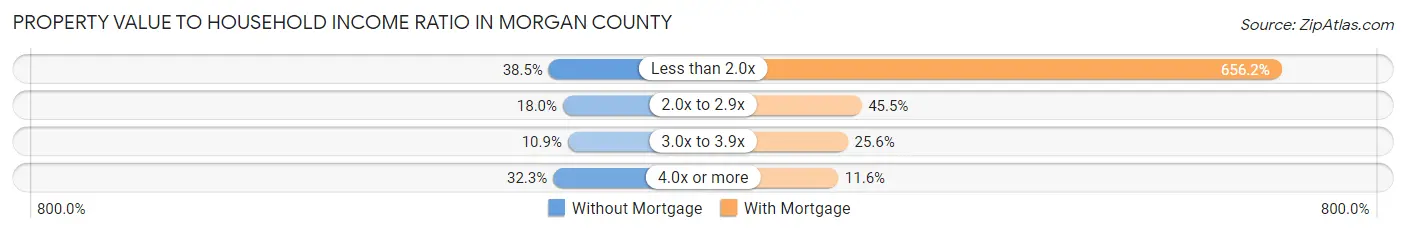
| Value-to-Income Ratio | Without Mortgage | With Mortgage |
| Less than 2.0x | 2,740 (38.5%) | 100,114 (656.2%) |
| 2.0x to 2.9x | 1,280 (18.0%) | 6,934 (45.5%) |
| 3.0x to 3.9x | 773 (10.9%) | 3,903 (25.6%) |
| 4.0x or more | 2,297 (32.3%) | 1,774 (11.6%) |
| Total | 7,115 (100.0%) | 15,257 (100.0%) |
Real Estate Taxes by Mortgage Status in Morgan County
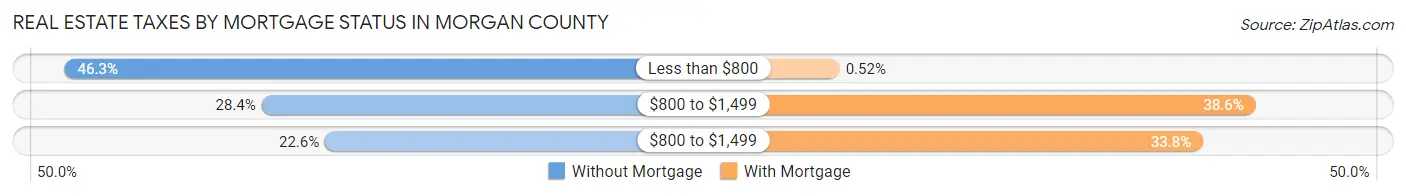
| Property Taxes | Without Mortgage | With Mortgage |
| Less than $800 | 3,297 (46.3%) | 80 (0.5%) |
| $800 to $1,499 | 2,018 (28.4%) | 5,886 (38.6%) |
| $800 to $1,499 | 1,605 (22.6%) | 5,154 (33.8%) |
| Total | 7,115 (100.0%) | 15,257 (100.0%) |
Health & Disability in Morgan County
Health Insurance Coverage by Age in Morgan County
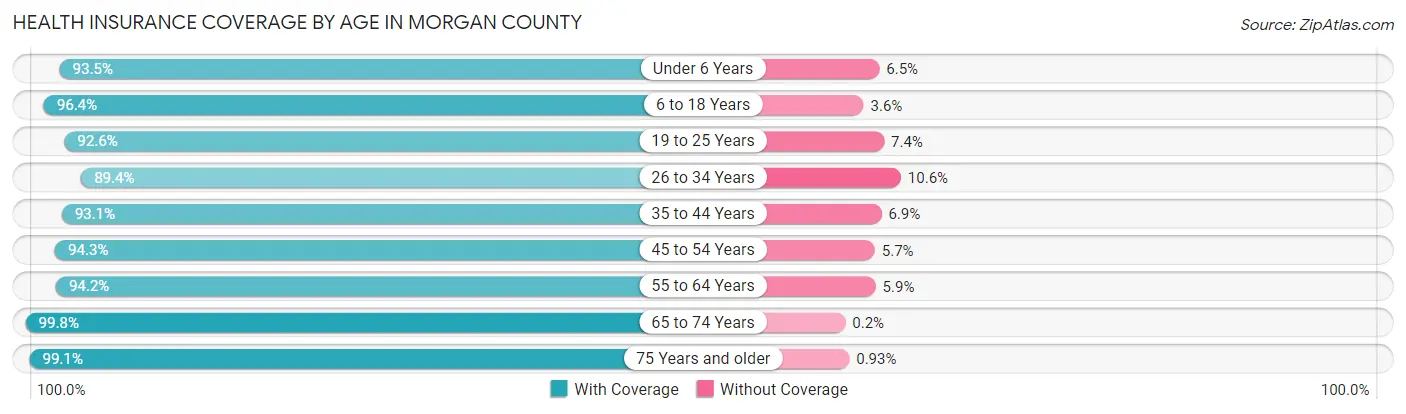
| Age Bracket | With Coverage | Without Coverage |
| Under 6 Years | 4,003 (93.5%) | 280 (6.5%) |
| 6 to 18 Years | 12,186 (96.4%) | 455 (3.6%) |
| 19 to 25 Years | 5,209 (92.6%) | 418 (7.4%) |
| 26 to 34 Years | 6,440 (89.4%) | 760 (10.6%) |
| 35 to 44 Years | 7,839 (93.1%) | 584 (6.9%) |
| 45 to 54 Years | 9,330 (94.3%) | 564 (5.7%) |
| 55 to 64 Years | 10,212 (94.2%) | 634 (5.9%) |
| 65 to 74 Years | 7,569 (99.8%) | 15 (0.2%) |
| 75 Years and older | 4,256 (99.1%) | 40 (0.9%) |
| Total | 67,044 (94.7%) | 3,750 (5.3%) |
Health Insurance Coverage by Citizenship Status in Morgan County
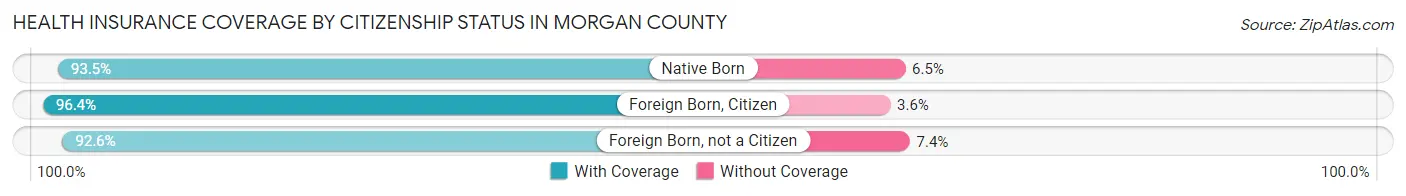
| Citizenship Status | With Coverage | Without Coverage |
| Native Born | 4,003 (93.5%) | 280 (6.5%) |
| Foreign Born, Citizen | 12,186 (96.4%) | 455 (3.6%) |
| Foreign Born, not a Citizen | 5,209 (92.6%) | 418 (7.4%) |
Health Insurance Coverage by Household Income in Morgan County
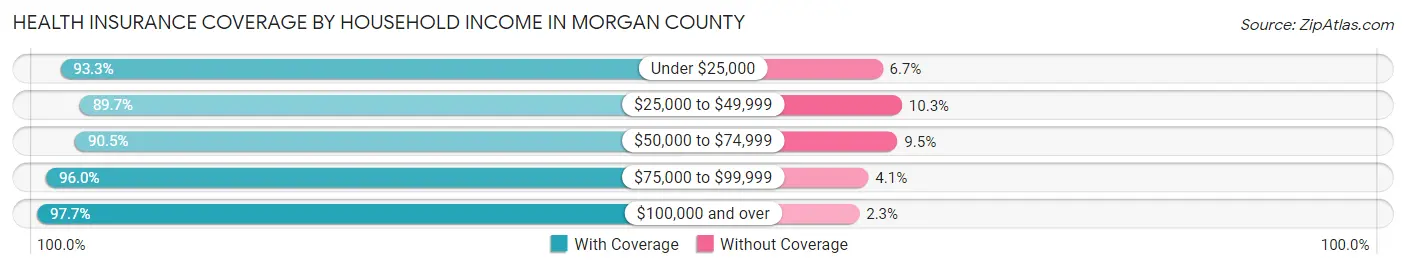
| Household Income | With Coverage | Without Coverage |
| Under $25,000 | 5,338 (93.3%) | 383 (6.7%) |
| $25,000 to $49,999 | 9,125 (89.7%) | 1,051 (10.3%) |
| $50,000 to $74,999 | 10,232 (90.5%) | 1,071 (9.5%) |
| $75,000 to $99,999 | 10,804 (96.0%) | 456 (4.1%) |
| $100,000 and over | 31,468 (97.7%) | 753 (2.3%) |
Public vs Private Health Insurance Coverage by Age in Morgan County
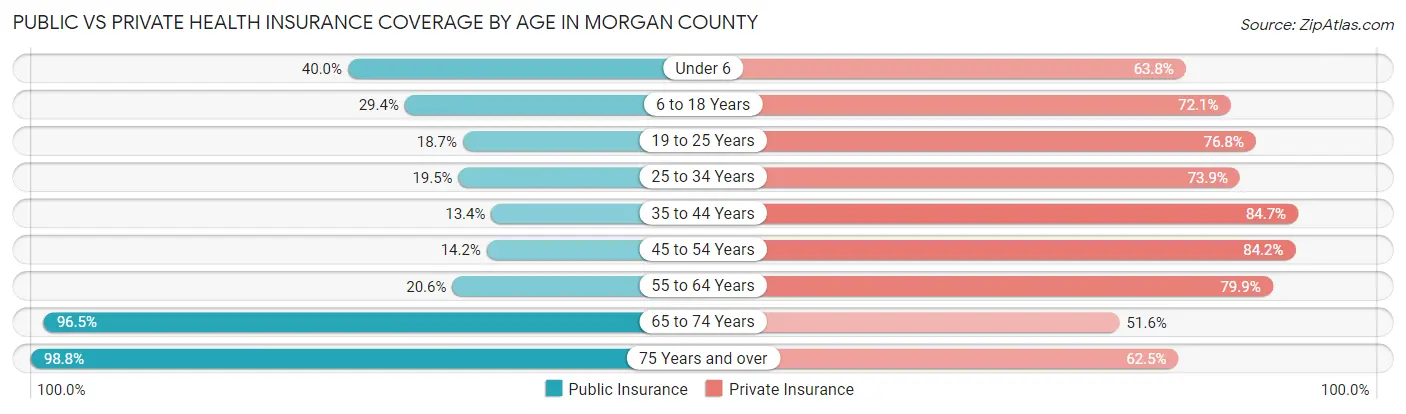
| Age Bracket | Public Insurance | Private Insurance |
| Under 6 | 1,713 (40.0%) | 2,734 (63.8%) |
| 6 to 18 Years | 3,722 (29.4%) | 9,117 (72.1%) |
| 19 to 25 Years | 1,050 (18.7%) | 4,324 (76.8%) |
| 25 to 34 Years | 1,402 (19.5%) | 5,318 (73.9%) |
| 35 to 44 Years | 1,127 (13.4%) | 7,131 (84.7%) |
| 45 to 54 Years | 1,408 (14.2%) | 8,329 (84.2%) |
| 55 to 64 Years | 2,236 (20.6%) | 8,670 (79.9%) |
| 65 to 74 Years | 7,315 (96.5%) | 3,911 (51.6%) |
| 75 Years and over | 4,246 (98.8%) | 2,684 (62.5%) |
| Total | 24,219 (34.2%) | 52,218 (73.8%) |
Disability Status by Sex by Age in Morgan County
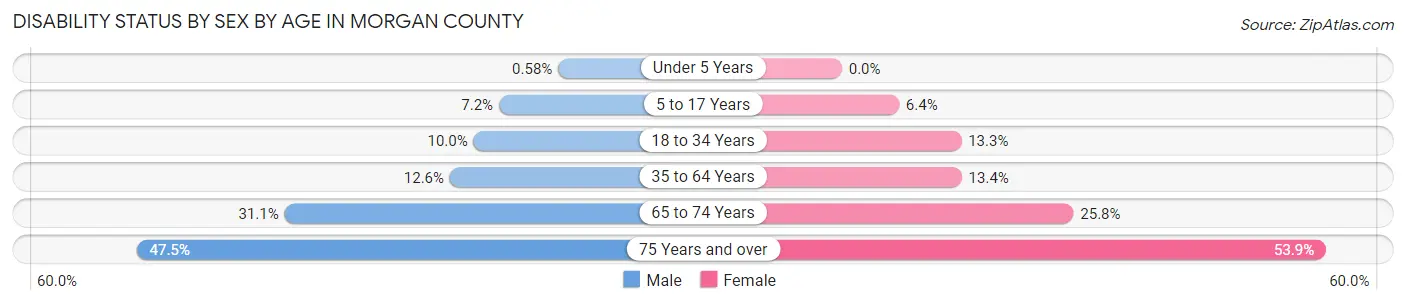
| Age Bracket | Male | Female |
| Under 5 Years | 11 (0.6%) | 0 (0.0%) |
| 5 to 17 Years | 454 (7.2%) | 376 (6.4%) |
| 18 to 34 Years | 716 (10.0%) | 885 (13.3%) |
| 35 to 64 Years | 1,835 (12.6%) | 1,956 (13.4%) |
| 65 to 74 Years | 1,129 (31.0%) | 1,018 (25.8%) |
| 75 Years and over | 940 (47.5%) | 1,250 (53.9%) |
Disability Class by Sex by Age in Morgan County
Disability Class: Hearing Difficulty
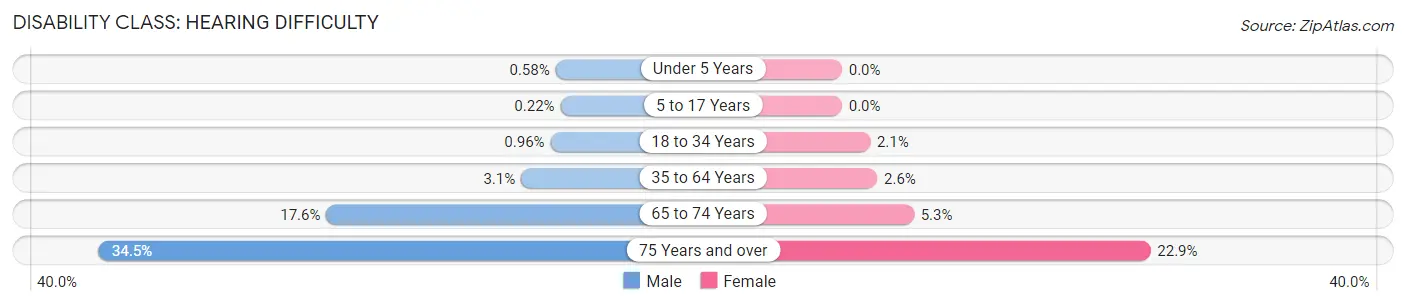
| Age Bracket | Male | Female |
| Under 5 Years | 11 (0.6%) | 0 (0.0%) |
| 5 to 17 Years | 14 (0.2%) | 0 (0.0%) |
| 18 to 34 Years | 69 (1.0%) | 139 (2.1%) |
| 35 to 64 Years | 456 (3.1%) | 384 (2.6%) |
| 65 to 74 Years | 640 (17.6%) | 211 (5.3%) |
| 75 Years and over | 682 (34.5%) | 531 (22.9%) |
Disability Class: Vision Difficulty
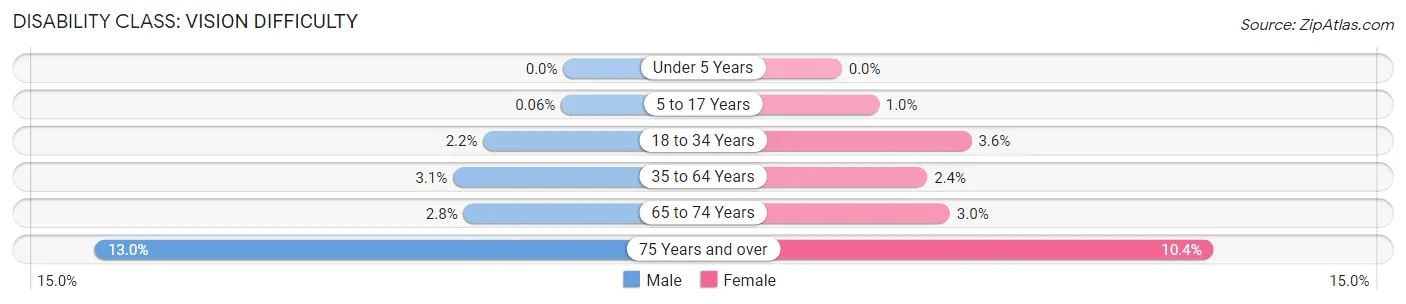
| Age Bracket | Male | Female |
| Under 5 Years | 0 (0.0%) | 0 (0.0%) |
| 5 to 17 Years | 4 (0.1%) | 61 (1.0%) |
| 18 to 34 Years | 160 (2.2%) | 240 (3.6%) |
| 35 to 64 Years | 445 (3.1%) | 348 (2.4%) |
| 65 to 74 Years | 101 (2.8%) | 119 (3.0%) |
| 75 Years and over | 258 (13.0%) | 240 (10.3%) |
Disability Class: Cognitive Difficulty
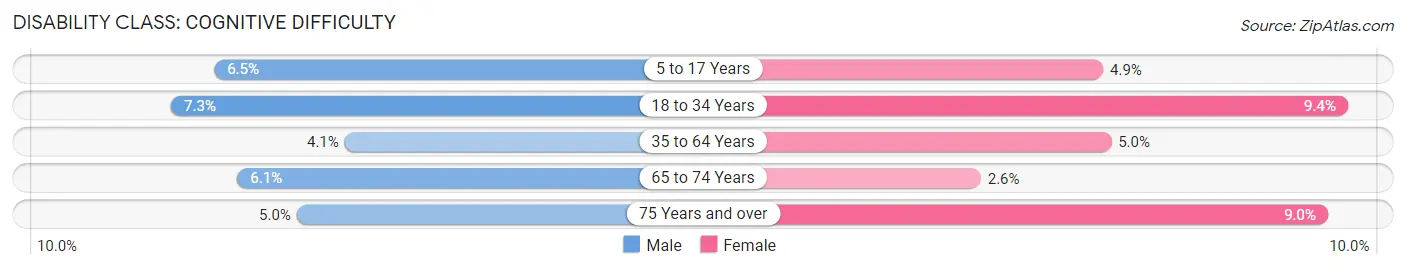
| Age Bracket | Male | Female |
| 5 to 17 Years | 410 (6.5%) | 287 (4.9%) |
| 18 to 34 Years | 521 (7.3%) | 625 (9.4%) |
| 35 to 64 Years | 589 (4.1%) | 732 (5.0%) |
| 65 to 74 Years | 220 (6.0%) | 102 (2.6%) |
| 75 Years and over | 98 (5.0%) | 209 (9.0%) |
Disability Class: Ambulatory Difficulty
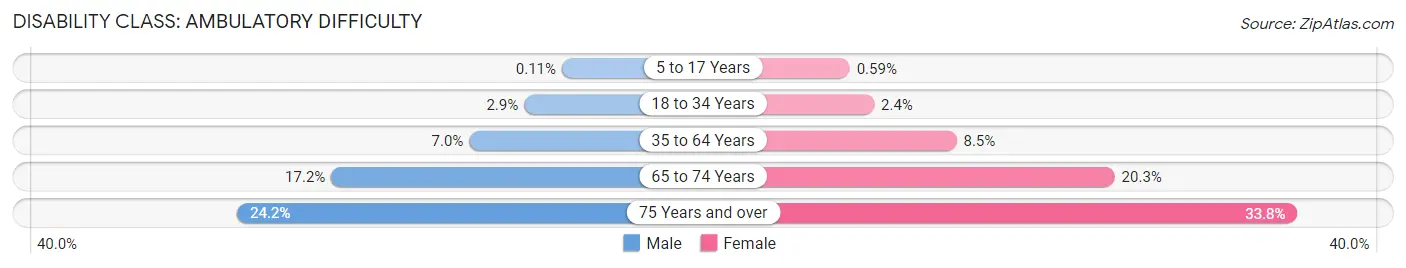
| Age Bracket | Male | Female |
| 5 to 17 Years | 7 (0.1%) | 35 (0.6%) |
| 18 to 34 Years | 209 (2.9%) | 160 (2.4%) |
| 35 to 64 Years | 1,015 (7.0%) | 1,248 (8.5%) |
| 65 to 74 Years | 627 (17.2%) | 800 (20.3%) |
| 75 Years and over | 479 (24.2%) | 784 (33.8%) |
Disability Class: Self-Care Difficulty
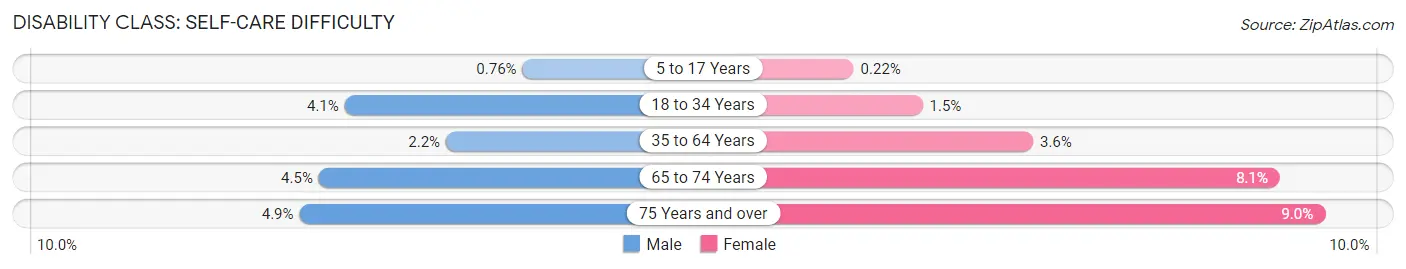
| Age Bracket | Male | Female |
| 5 to 17 Years | 48 (0.8%) | 13 (0.2%) |
| 18 to 34 Years | 291 (4.1%) | 100 (1.5%) |
| 35 to 64 Years | 317 (2.2%) | 520 (3.5%) |
| 65 to 74 Years | 165 (4.5%) | 321 (8.1%) |
| 75 Years and over | 97 (4.9%) | 208 (9.0%) |
Technology Access in Morgan County
Computing Device Access in Morgan County
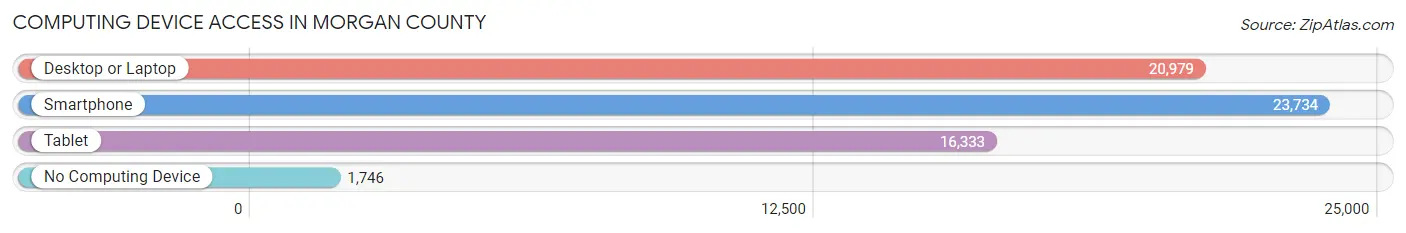
| Device Type | # Households | % Households |
| Desktop or Laptop | 20,979 | 77.3% |
| Smartphone | 23,734 | 87.5% |
| Tablet | 16,333 | 60.2% |
| No Computing Device | 1,746 | 6.4% |
| Total | 27,138 | 100.0% |
Internet Access in Morgan County
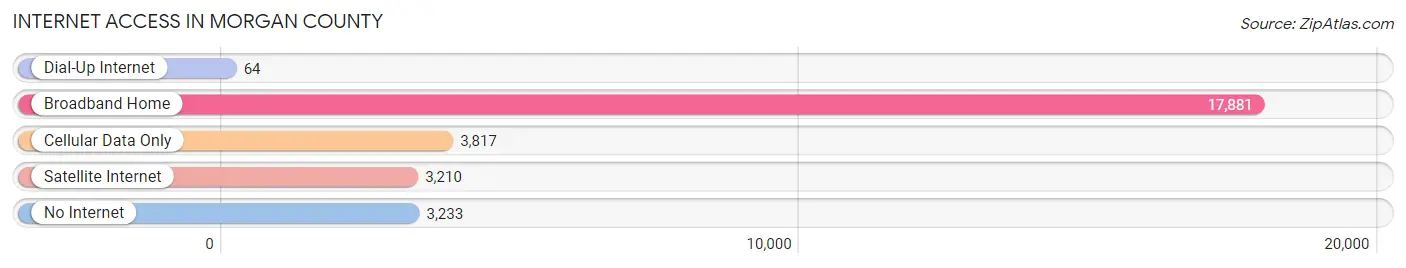
| Internet Type | # Households | % Households |
| Dial-Up Internet | 64 | 0.2% |
| Broadband Home | 17,881 | 65.9% |
| Cellular Data Only | 3,817 | 14.1% |
| Satellite Internet | 3,210 | 11.8% |
| No Internet | 3,233 | 11.9% |
| Total | 27,138 | 100.0% |
Morgan County Summary
Morgan County is located in the central part of the state of Indiana, in the United States. It is part of the Indianapolis metropolitan area and is bordered by Marion, Hendricks, Putnam, Johnson, and Shelby counties. The county seat is Martinsville.
History
Morgan County was formed in 1822 from portions of Johnson and Shelby counties. It was named for General Daniel Morgan, a Revolutionary War hero. The first settlers arrived in the area in the early 1800s, and the county was officially organized in 1822.
The county was largely agricultural in its early years, with corn, wheat, and livestock being the main products. The first railroad line was built in 1852, connecting Martinsville to Indianapolis. This allowed for the growth of industry in the county, and by the late 1800s, the county was home to several factories, including a glass factory, a furniture factory, and a paper mill.
In the early 1900s, the county experienced a population boom, as many people moved to the area to take advantage of the growing economy. This growth continued until the Great Depression, when the county's population began to decline.
Geography
Morgan County is located in the central part of Indiana, in the United States. It is part of the Indianapolis metropolitan area and is bordered by Marion, Hendricks, Putnam, Johnson, and Shelby counties. The county has a total area of 441 square miles, of which 437 square miles is land and 4.2 square miles is water.
The county is mostly flat, with some rolling hills in the northern and western parts. The White River runs through the county, and there are several small lakes and ponds. The climate is humid continental, with hot summers and cold winters.
Economy
The economy of Morgan County is largely based on agriculture and manufacturing. The county is home to several large farms, which produce corn, wheat, soybeans, and livestock. There are also several factories in the county, including a glass factory, a furniture factory, and a paper mill.
The county also has a growing tourism industry, with several attractions, including the Morgan County Fairgrounds, the Morgan County Historical Museum, and the Morgan County Speedway.
Demographics
As of the 2010 census, Morgan County had a population of 68,842. The racial makeup of the county was 94.3% White, 2.3% African American, 0.4% Native American, 0.7% Asian, 0.1% Pacific Islander, 0.9% from other races, and 1.3% from two or more races. Hispanic or Latino of any race were 2.3% of the population.
The median income for a household in the county was $45,837, and the median income for a family was $54,837. The per capita income for the county was $22,837. About 8.7% of families and 11.3% of the population were below the poverty line, including 15.2% of those under age 18 and 8.2% of those age 65 or over.
Common Questions
What is the Total Population of Morgan County?
Total Population of Morgan County is 71,757.
What is the Total Male Population of Morgan County?
Total Male Population of Morgan County is 35,959.
What is the Total Female Population of Morgan County?
Total Female Population of Morgan County is 35,798.
What is the Ratio of Males per 100 Females in Morgan County?
There are 100.45 Males per 100 Females in Morgan County.
What is the Ratio of Females per 100 Males in Morgan County?
There are 99.55 Females per 100 Males in Morgan County.
What is the Median Population Age in Morgan County?
Median Population Age in Morgan County is 41.5 Years.
What is the Average Family Size in Morgan County
Average Family Size in Morgan County is 3.0 People.
What is the Average Household Size in Morgan County
Average Household Size in Morgan County is 2.6 People.
What is Per Capita Income in Morgan County?
Per Capita income in Morgan County is $37,861.
What is the Median Family Income in Morgan County?
Median Family Income in Morgan County is $91,142.
What is the Median Household income in Morgan County?
Median Household Income in Morgan County is $79,134.
What is Income or Wage Gap in Morgan County?
Income or Wage Gap in Morgan County is 32.3%.
Women in Morgan County earn 67.7 cents for every dollar earned by a man.
What is Family Income Deficit in Morgan County?
Family Income Deficit in Morgan County is $11,323.
Families that are below poverty line in Morgan County earn $11,323 less on average than the poverty threshold level.
What is Inequality or Gini Index in Morgan County?
Inequality or Gini Index in Morgan County is 0.42.
How Large is the Labor Force in Morgan County?
There are 36,388 People in the Labor Forcein in Morgan County.
What is the Percentage of People in the Labor Force in Morgan County?
62.8% of People are in the Labor Force in Morgan County.
What is the Unemployment Rate in Morgan County?
Unemployment Rate in Morgan County is 4.0%.