Montgomery County, IN
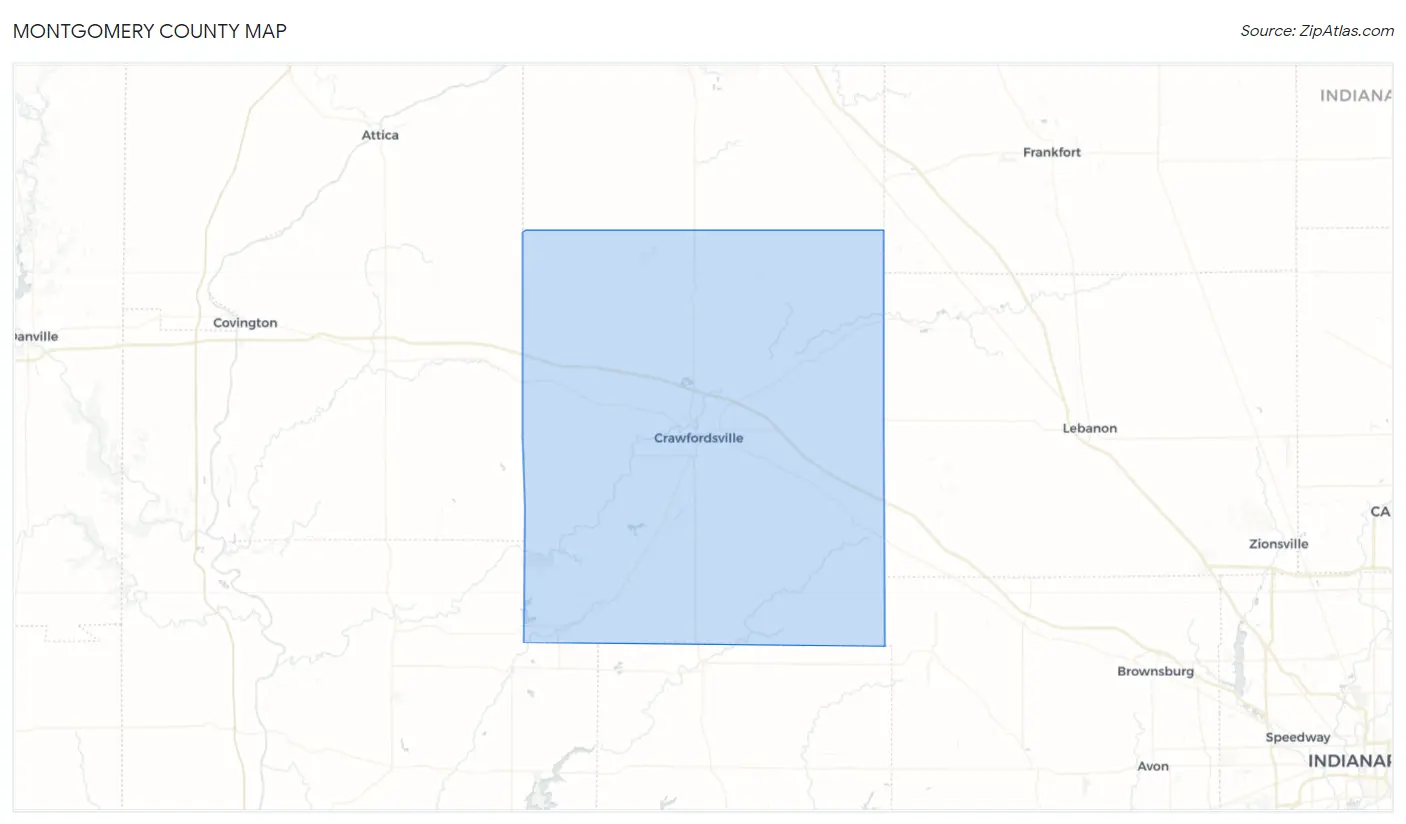
Montgomery County Map
Montgomery County Overview
38,018
TOTAL POPULATION
19,455
MALE POPULATION
18,563
FEMALE POPULATION
104.81
MALES / 100 FEMALES
95.42
FEMALES / 100 MALES
40.4
MEDIAN AGE
3.0
AVG FAMILY SIZE
2.4
AVG HOUSEHOLD SIZE
$32,975
PER CAPITA INCOME
$81,676
AVG FAMILY INCOME
$62,937
AVG HOUSEHOLD INCOME
21.1%
WAGE / INCOME GAP [ % ]
78.9¢/ $1
WAGE / INCOME GAP [ $ ]
$9,944
FAMILY INCOME DEFICIT
0.43
INEQUALITY / GINI INDEX
19,450
LABOR FORCE [ PEOPLE ]
63.9%
PERCENT IN LABOR FORCE
4.0%
UNEMPLOYMENT RATE
Montgomery County Area Codes
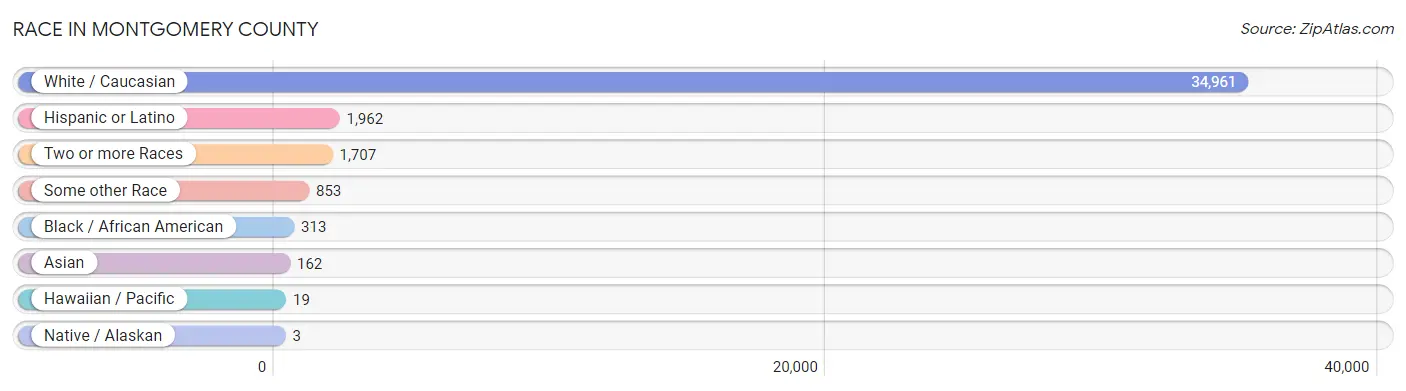
Race in Montgomery County
The most populous races in Montgomery County are White / Caucasian (34,961 | 92.0%), Hispanic or Latino (1,962 | 5.2%), and Two or more Races (1,707 | 4.5%).
| Race | # Population | % Population |
| Asian | 162 | 0.4% |
| Black / African American | 313 | 0.8% |
| Hawaiian / Pacific | 19 | 0.1% |
| Hispanic or Latino | 1,962 | 5.2% |
| Native / Alaskan | 3 | 0.0% |
| White / Caucasian | 34,961 | 92.0% |
| Two or more Races | 1,707 | 4.5% |
| Some other Race | 853 | 2.2% |
| Total | 38,018 | 100.0% |
Ancestry in Montgomery County
The most populous ancestries reported in Montgomery County are German (7,191 | 18.9%), Irish (4,648 | 12.2%), English (4,289 | 11.3%), American (3,673 | 9.7%), and Mexican (1,565 | 4.1%), together accounting for 56.2% of all Montgomery County residents.

| Ancestry | # Population | % Population |
| African | 6 | 0.0% |
| Albanian | 30 | 0.1% |
| American | 3,673 | 9.7% |
| Apache | 54 | 0.1% |
| Arab | 379 | 1.0% |
| Armenian | 12 | 0.0% |
| Austrian | 6 | 0.0% |
| Bhutanese | 18 | 0.1% |
| Blackfeet | 33 | 0.1% |
| British | 244 | 0.6% |
| Bulgarian | 9 | 0.0% |
| Burmese | 31 | 0.1% |
| Canadian | 9 | 0.0% |
| Central American | 18 | 0.1% |
| Cherokee | 129 | 0.3% |
| Choctaw | 9 | 0.0% |
| Croatian | 6 | 0.0% |
| Cuban | 25 | 0.1% |
| Czech | 89 | 0.2% |
| Danish | 131 | 0.3% |
| Dominican | 12 | 0.0% |
| Dutch | 447 | 1.2% |
| Eastern European | 22 | 0.1% |
| English | 4,289 | 11.3% |
| European | 518 | 1.4% |
| Finnish | 5 | 0.0% |
| French | 883 | 2.3% |
| French Canadian | 94 | 0.3% |
| German | 7,191 | 18.9% |
| Greek | 59 | 0.2% |
| Haitian | 1 | 0.0% |
| Honduran | 17 | 0.0% |
| Houma | 16 | 0.0% |
| Hungarian | 69 | 0.2% |
| Indian (Asian) | 74 | 0.2% |
| Irish | 4,648 | 12.2% |
| Iroquois | 1 | 0.0% |
| Italian | 685 | 1.8% |
| Japanese | 16 | 0.0% |
| Korean | 55 | 0.1% |
| Laotian | 15 | 0.0% |
| Latvian | 16 | 0.0% |
| Lebanese | 376 | 1.0% |
| Lithuanian | 18 | 0.1% |
| Mexican | 1,565 | 4.1% |
| Mexican American Indian | 1 | 0.0% |
| Native Hawaiian | 19 | 0.1% |
| Norwegian | 124 | 0.3% |
| Pakistani | 50 | 0.1% |
| Pennsylvania German | 30 | 0.1% |
| Polish | 460 | 1.2% |
| Puerto Rican | 193 | 0.5% |
| Romanian | 19 | 0.1% |
| Russian | 29 | 0.1% |
| Salvadoran | 1 | 0.0% |
| Samoan | 2 | 0.0% |
| Scandinavian | 58 | 0.2% |
| Scotch-Irish | 482 | 1.3% |
| Scottish | 920 | 2.4% |
| Sioux | 10 | 0.0% |
| Slovak | 21 | 0.1% |
| Spaniard | 37 | 0.1% |
| Spanish | 79 | 0.2% |
| Subsaharan African | 6 | 0.0% |
| Swedish | 321 | 0.8% |
| Swiss | 84 | 0.2% |
| Thai | 34 | 0.1% |
| Turkish | 2 | 0.0% |
| Welsh | 231 | 0.6% |
| Yugoslavian | 137 | 0.4% | View All 70 Rows |
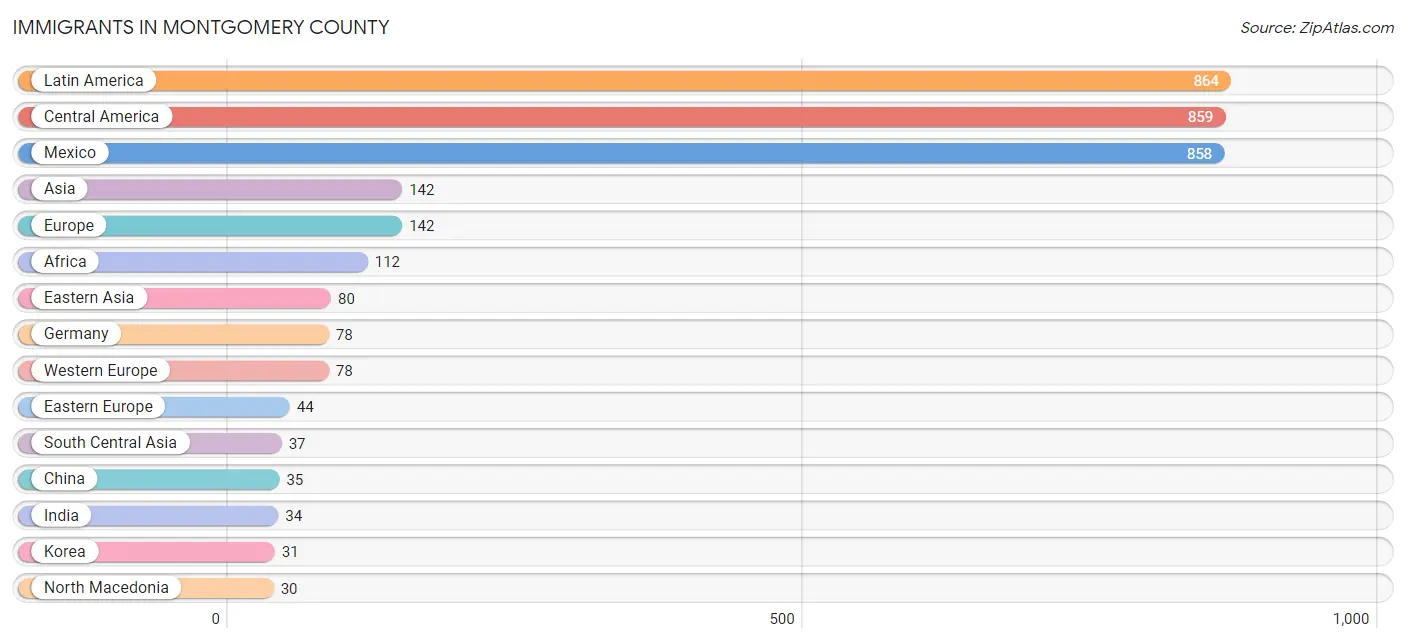
Immigrants in Montgomery County
The most numerous immigrant groups reported in Montgomery County came from Latin America (864 | 2.3%), Central America (859 | 2.3%), Mexico (858 | 2.3%), Asia (142 | 0.4%), and Europe (142 | 0.4%), together accounting for 7.5% of all Montgomery County residents.
| Immigration Origin | # Population | % Population |
| Africa | 112 | 0.3% |
| Asia | 142 | 0.4% |
| Cambodia | 16 | 0.0% |
| Canada | 13 | 0.0% |
| Caribbean | 2 | 0.0% |
| Central America | 859 | 2.3% |
| China | 35 | 0.1% |
| Colombia | 3 | 0.0% |
| Croatia | 4 | 0.0% |
| Dominican Republic | 2 | 0.0% |
| Eastern Asia | 80 | 0.2% |
| Eastern Europe | 44 | 0.1% |
| El Salvador | 1 | 0.0% |
| England | 6 | 0.0% |
| Europe | 142 | 0.4% |
| Germany | 78 | 0.2% |
| India | 34 | 0.1% |
| Japan | 14 | 0.0% |
| Korea | 31 | 0.1% |
| Latin America | 864 | 2.3% |
| Mexico | 858 | 2.3% |
| North Macedonia | 30 | 0.1% |
| Northern Europe | 20 | 0.1% |
| Pakistan | 3 | 0.0% |
| Philippines | 9 | 0.0% |
| Romania | 10 | 0.0% |
| South America | 3 | 0.0% |
| South Central Asia | 37 | 0.1% |
| South Eastern Asia | 25 | 0.1% |
| Western Europe | 78 | 0.2% | View All 30 Rows |
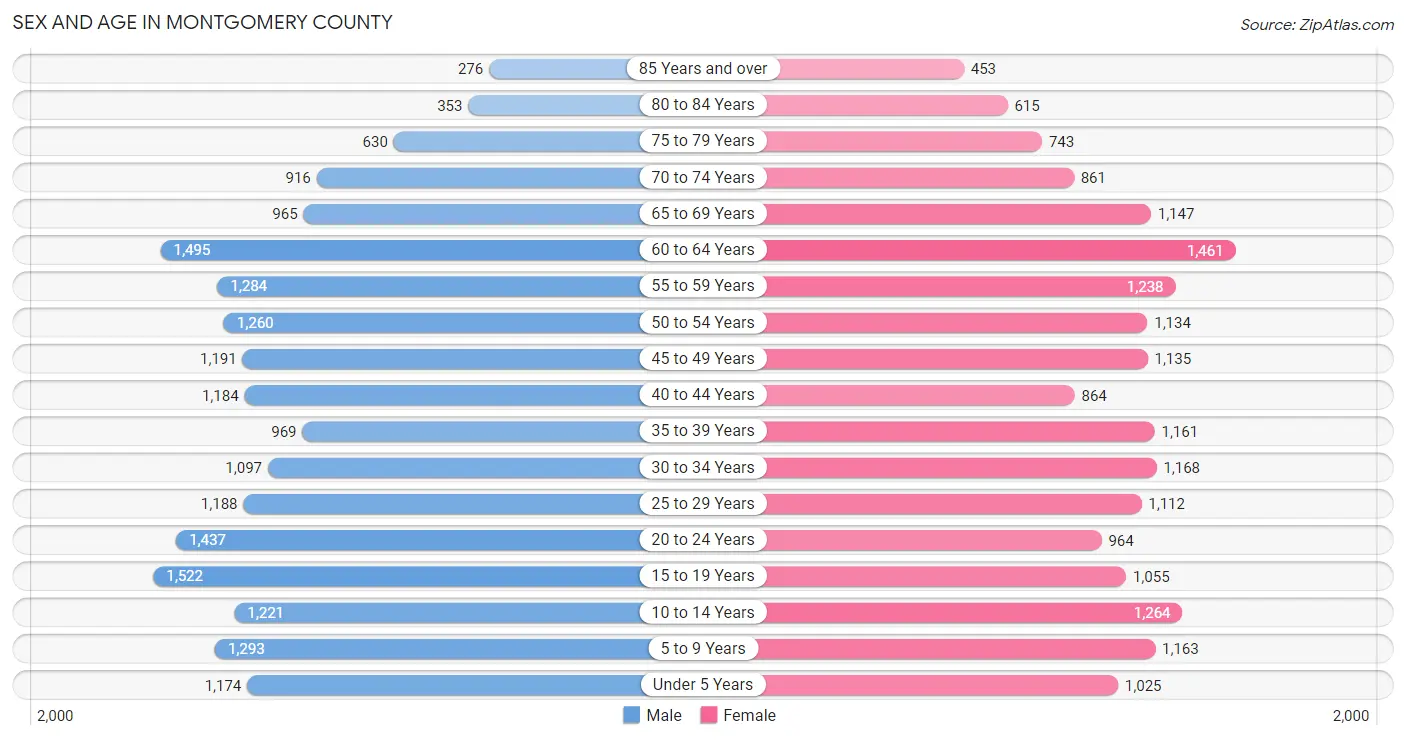
Sex and Age in Montgomery County
Sex and Age in Montgomery County
The most populous age groups in Montgomery County are 15 to 19 Years (1,522 | 7.8%) for men and 60 to 64 Years (1,461 | 7.9%) for women.
| Age Bracket | Male | Female |
| Under 5 Years | 1,174 (6.0%) | 1,025 (5.5%) |
| 5 to 9 Years | 1,293 (6.7%) | 1,163 (6.3%) |
| 10 to 14 Years | 1,221 (6.3%) | 1,264 (6.8%) |
| 15 to 19 Years | 1,522 (7.8%) | 1,055 (5.7%) |
| 20 to 24 Years | 1,437 (7.4%) | 964 (5.2%) |
| 25 to 29 Years | 1,188 (6.1%) | 1,112 (6.0%) |
| 30 to 34 Years | 1,097 (5.6%) | 1,168 (6.3%) |
| 35 to 39 Years | 969 (5.0%) | 1,161 (6.2%) |
| 40 to 44 Years | 1,184 (6.1%) | 864 (4.6%) |
| 45 to 49 Years | 1,191 (6.1%) | 1,135 (6.1%) |
| 50 to 54 Years | 1,260 (6.5%) | 1,134 (6.1%) |
| 55 to 59 Years | 1,284 (6.6%) | 1,238 (6.7%) |
| 60 to 64 Years | 1,495 (7.7%) | 1,461 (7.9%) |
| 65 to 69 Years | 965 (5.0%) | 1,147 (6.2%) |
| 70 to 74 Years | 916 (4.7%) | 861 (4.6%) |
| 75 to 79 Years | 630 (3.2%) | 743 (4.0%) |
| 80 to 84 Years | 353 (1.8%) | 615 (3.3%) |
| 85 Years and over | 276 (1.4%) | 453 (2.4%) |
| Total | 19,455 (100.0%) | 18,563 (100.0%) |
Families and Households in Montgomery County
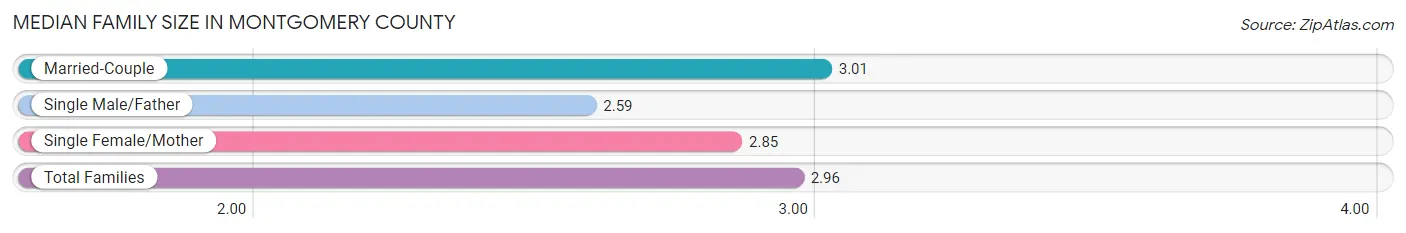
Median Family Size in Montgomery County
The median family size in Montgomery County is 2.96 persons per family, with married-couple families (7,702 | 79.0%) accounting for the largest median family size of 3.01 persons per family. On the other hand, single male/father families (763 | 7.8%) represent the smallest median family size with 2.59 persons per family.
| Family Type | # Families | Family Size |
| Married-Couple | 7,702 (79.0%) | 3.01 |
| Single Male/Father | 763 (7.8%) | 2.59 |
| Single Female/Mother | 1,282 (13.2%) | 2.85 |
| Total Families | 9,747 (100.0%) | 2.96 |
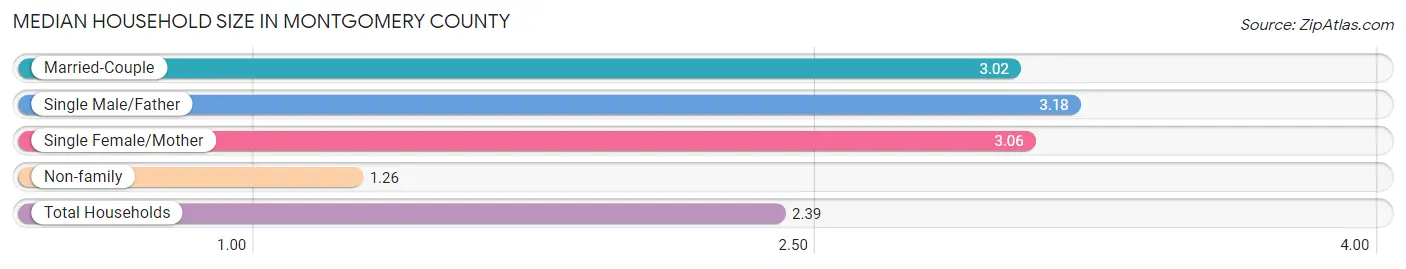
Median Household Size in Montgomery County
The median household size in Montgomery County is 2.39 persons per household, with single male/father households (763 | 5.0%) accounting for the largest median household size of 3.18 persons per household. non-family households (5,657 | 36.7%) represent the smallest median household size with 1.26 persons per household.
| Household Type | # Households | Household Size |
| Married-Couple | 7,702 (50.0%) | 3.02 |
| Single Male/Father | 763 (5.0%) | 3.18 |
| Single Female/Mother | 1,282 (8.3%) | 3.06 |
| Non-family | 5,657 (36.7%) | 1.26 |
| Total Households | 15,404 (100.0%) | 2.39 |
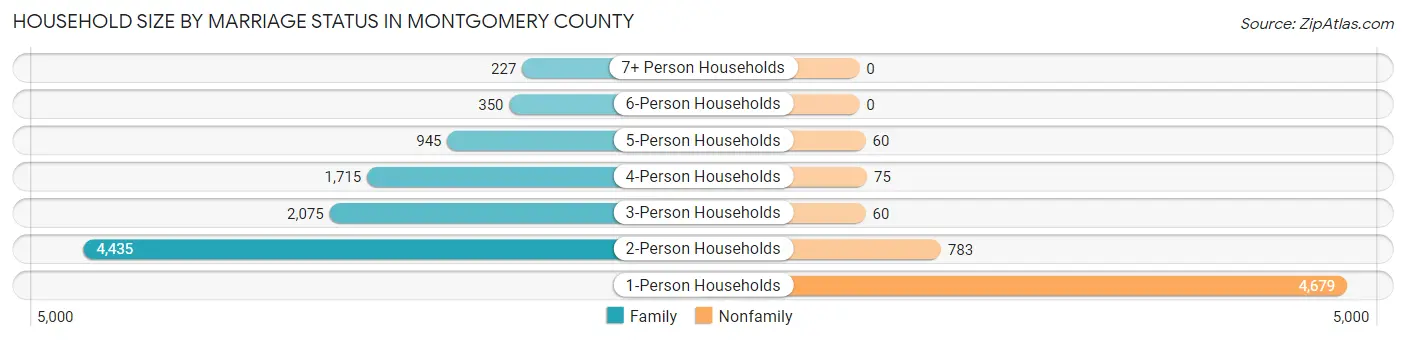
Household Size by Marriage Status in Montgomery County
Out of a total of 15,404 households in Montgomery County, 9,747 (63.3%) are family households, while 5,657 (36.7%) are nonfamily households. The most numerous type of family households are 2-person households, comprising 4,435, and the most common type of nonfamily households are 1-person households, comprising 4,679.
| Household Size | Family Households | Nonfamily Households |
| 1-Person Households | - | 4,679 (30.4%) |
| 2-Person Households | 4,435 (28.8%) | 783 (5.1%) |
| 3-Person Households | 2,075 (13.5%) | 60 (0.4%) |
| 4-Person Households | 1,715 (11.1%) | 75 (0.5%) |
| 5-Person Households | 945 (6.1%) | 60 (0.4%) |
| 6-Person Households | 350 (2.3%) | 0 (0.0%) |
| 7+ Person Households | 227 (1.5%) | 0 (0.0%) |
| Total | 9,747 (63.3%) | 5,657 (36.7%) |
Female Fertility in Montgomery County
Fertility by Age in Montgomery County
Average fertility rate in Montgomery County is 66.0 births per 1,000 women. Women in the age bracket of 20 to 34 years have the highest fertility rate with 141.0 births per 1,000 women. Women in the age bracket of 20 to 34 years acount for 90.3% of all women with births.

| Age Bracket | Women with Births | Births / 1,000 Women |
| 15 to 19 years | 13 (2.6%) | 12.0 |
| 20 to 34 years | 458 (90.3%) | 141.0 |
| 35 to 50 years | 36 (7.1%) | 11.0 |
| Total | 507 (100.0%) | 66.0 |
Fertility by Age by Marriage Status in Montgomery County
47.5% of women with births (507) in Montgomery County are married. The highest percentage of unmarried women with births falls into 15 to 19 years age bracket with 61.5% of them unmarried at the time of birth, while the lowest percentage of unmarried women with births belong to 35 to 50 years age bracket with 0.0% of them unmarried.

| Age Bracket | Married | Unmarried |
| 15 to 19 years | 5 (38.5%) | 8 (61.5%) |
| 20 to 34 years | 200 (43.7%) | 258 (56.3%) |
| 35 to 50 years | 36 (100.0%) | 0 (0.0%) |
| Total | 241 (47.5%) | 266 (52.5%) |
Fertility by Education in Montgomery County
Average fertility rate in Montgomery County is 66.0 births per 1,000 women. Women with the education attainment of graduate degree have the highest fertility rate of 252.0 births per 1,000 women, while women with the education attainment of college or associate's degree have the lowest fertility at 34.0 births per 1,000 women. Women with the education attainment of high school diploma represent 29.0% of all women with births.

| Educational Attainment | Women with Births | Births / 1,000 Women |
| Less than High School | 52 (10.3%) | 37.0 |
| High School Diploma | 147 (29.0%) | 62.0 |
| College or Associate's Degree | 74 (14.6%) | 34.0 |
| Bachelor's Degree | 102 (20.1%) | 88.0 |
| Graduate Degree | 132 (26.0%) | 252.0 |
| Total | 507 (100.0%) | 66.0 |
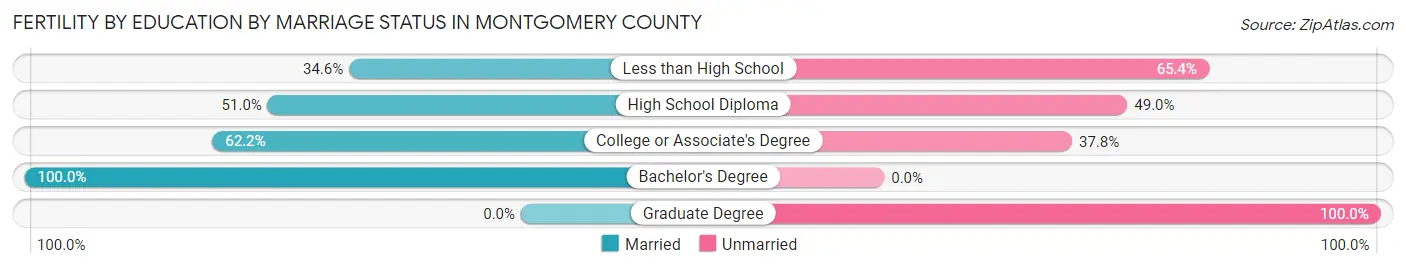
Fertility by Education by Marriage Status in Montgomery County
52.5% of women with births in Montgomery County are unmarried. Women with the educational attainment of bachelor's degree are most likely to be married with 100.0% of them married at childbirth, while women with the educational attainment of graduate degree are least likely to be married with 100.0% of them unmarried at childbirth.
| Educational Attainment | Married | Unmarried |
| Less than High School | 18 (34.6%) | 34 (65.4%) |
| High School Diploma | 75 (51.0%) | 72 (49.0%) |
| College or Associate's Degree | 46 (62.2%) | 28 (37.8%) |
| Bachelor's Degree | 102 (100.0%) | 0 (0.0%) |
| Graduate Degree | 0 (0.0%) | 132 (100.0%) |
| Total | 241 (47.5%) | 266 (52.5%) |
Income in Montgomery County
Income Overview in Montgomery County
Per Capita Income in Montgomery County is $32,975, while median incomes of families and households are $81,676 and $62,937 respectively.
| Characteristic | Number | Measure |
| Per Capita Income | 38,018 | $32,975 |
| Median Family Income | 9,747 | $81,676 |
| Mean Family Income | 9,747 | $97,679 |
| Median Household Income | 15,404 | $62,937 |
| Mean Household Income | 15,404 | $80,316 |
| Income Deficit | 9,747 | $9,944 |
| Wage / Income Gap (%) | 38,018 | 21.13% |
| Wage / Income Gap ($) | 38,018 | 78.87¢ per $1 |
| Gini / Inequality Index | 38,018 | 0.43 |
Earnings by Sex in Montgomery County
Average Earnings in Montgomery County are $39,064, $42,199 for men and $33,282 for women, a difference of 21.1%.
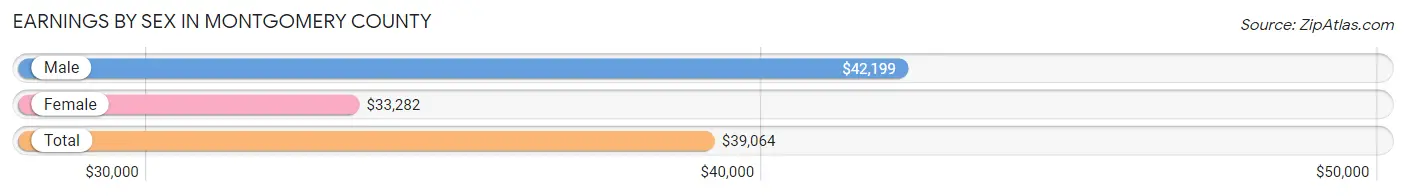
| Sex | Number | Average Earnings |
| Male | 11,407 (56.1%) | $42,199 |
| Female | 8,934 (43.9%) | $33,282 |
| Total | 20,341 (100.0%) | $39,064 |
Earnings by Sex by Income Bracket in Montgomery County
The most common earnings brackets in Montgomery County are $100,000+ for men (1,386 | 12.1%) and $100,000+ for women (698 | 7.8%).
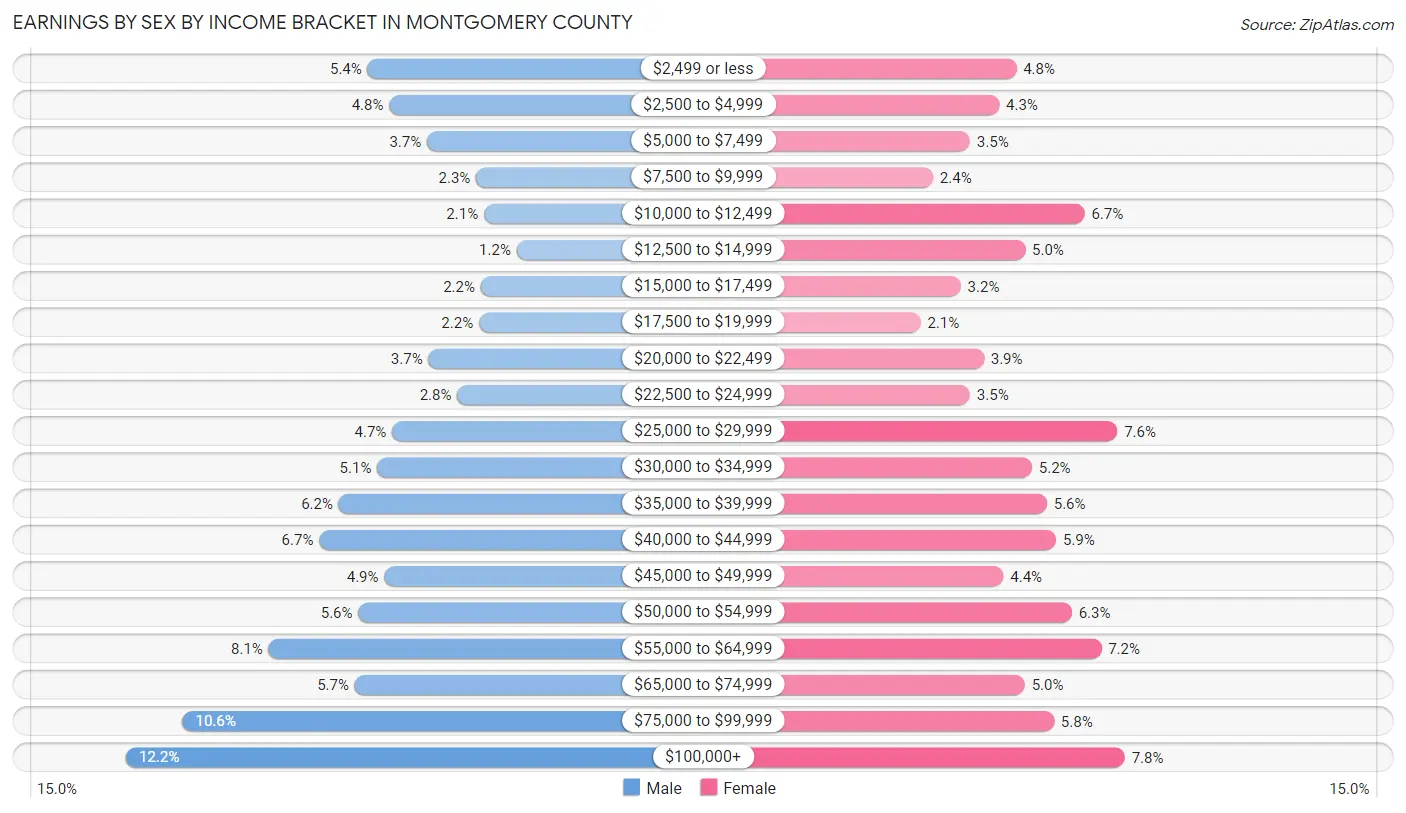
| Income | Male | Female |
| $2,499 or less | 611 (5.4%) | 425 (4.8%) |
| $2,500 to $4,999 | 542 (4.8%) | 382 (4.3%) |
| $5,000 to $7,499 | 421 (3.7%) | 309 (3.5%) |
| $7,500 to $9,999 | 263 (2.3%) | 216 (2.4%) |
| $10,000 to $12,499 | 238 (2.1%) | 597 (6.7%) |
| $12,500 to $14,999 | 133 (1.2%) | 448 (5.0%) |
| $15,000 to $17,499 | 249 (2.2%) | 286 (3.2%) |
| $17,500 to $19,999 | 254 (2.2%) | 185 (2.1%) |
| $20,000 to $22,499 | 416 (3.6%) | 344 (3.8%) |
| $22,500 to $24,999 | 324 (2.8%) | 309 (3.5%) |
| $25,000 to $29,999 | 533 (4.7%) | 679 (7.6%) |
| $30,000 to $34,999 | 581 (5.1%) | 465 (5.2%) |
| $35,000 to $39,999 | 704 (6.2%) | 502 (5.6%) |
| $40,000 to $44,999 | 767 (6.7%) | 525 (5.9%) |
| $45,000 to $49,999 | 558 (4.9%) | 393 (4.4%) |
| $50,000 to $54,999 | 641 (5.6%) | 565 (6.3%) |
| $55,000 to $64,999 | 929 (8.1%) | 639 (7.1%) |
| $65,000 to $74,999 | 652 (5.7%) | 447 (5.0%) |
| $75,000 to $99,999 | 1,205 (10.6%) | 520 (5.8%) |
| $100,000+ | 1,386 (12.1%) | 698 (7.8%) |
| Total | 11,407 (100.0%) | 8,934 (100.0%) |
Earnings by Sex by Educational Attainment in Montgomery County
Average earnings in Montgomery County are $51,141 for men and $39,165 for women, a difference of 23.4%. Men with an educational attainment of graduate degree enjoy the highest average annual earnings of $86,473, while those with less than high school education earn the least with $39,073. Women with an educational attainment of graduate degree earn the most with the average annual earnings of $85,714, while those with less than high school education have the smallest earnings of $21,750.
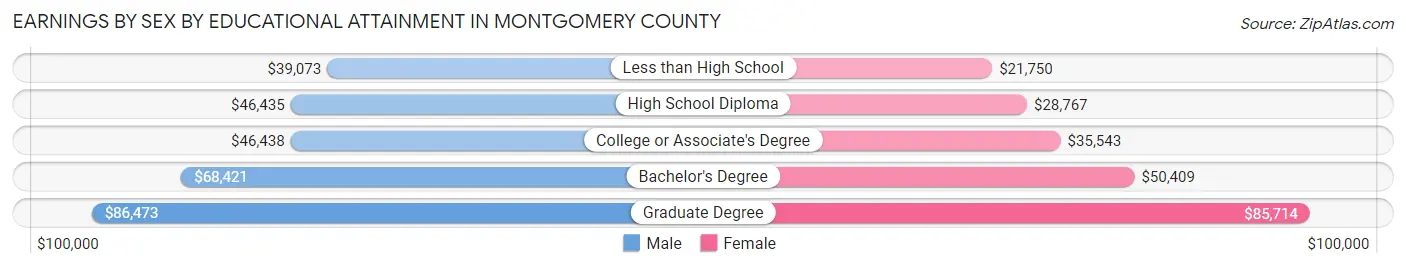
| Educational Attainment | Male Income | Female Income |
| Less than High School | $39,073 | $21,750 |
| High School Diploma | $46,435 | $28,767 |
| College or Associate's Degree | $46,438 | $35,543 |
| Bachelor's Degree | $68,421 | $50,409 |
| Graduate Degree | $86,473 | $85,714 |
| Total | $51,141 | $39,165 |
Family Income in Montgomery County
Family Income Brackets in Montgomery County
According to the Montgomery County family income data, there are 2,446 families falling into the $100,000 to $149,999 income range, which is the most common income bracket and makes up 25.1% of all families. Conversely, the $10,000 to $14,999 income bracket is the least frequent group with only 127 families (1.3%) belonging to this category.
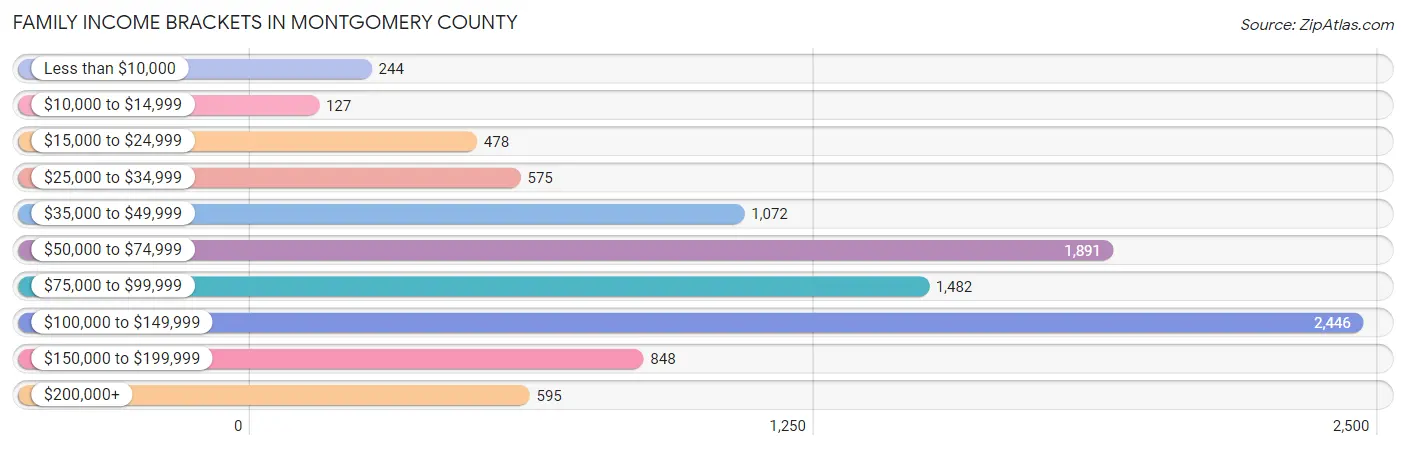
| Income Bracket | # Families | % Families |
| Less than $10,000 | 244 | 2.5% |
| $10,000 to $14,999 | 127 | 1.3% |
| $15,000 to $24,999 | 478 | 4.9% |
| $25,000 to $34,999 | 575 | 5.9% |
| $35,000 to $49,999 | 1,072 | 11.0% |
| $50,000 to $74,999 | 1,891 | 19.4% |
| $75,000 to $99,999 | 1,482 | 15.2% |
| $100,000 to $149,999 | 2,446 | 25.1% |
| $150,000 to $199,999 | 848 | 8.7% |
| $200,000+ | 595 | 6.1% |
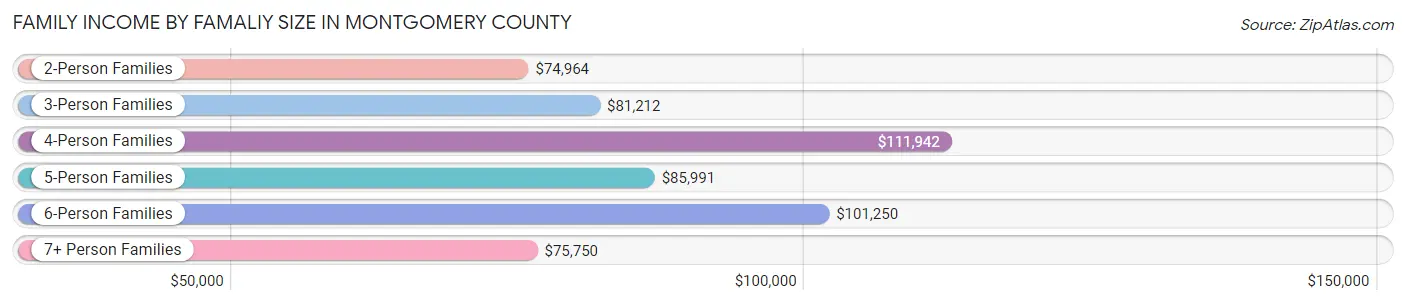
Family Income by Famaliy Size in Montgomery County
4-person families (1,537 | 15.8%) account for the highest median family income in Montgomery County with $111,942 per family, while 2-person families (4,748 | 48.7%) have the highest median income of $37,482 per family member.
| Income Bracket | # Families | Median Income |
| 2-Person Families | 4,748 (48.7%) | $74,964 |
| 3-Person Families | 2,017 (20.7%) | $81,212 |
| 4-Person Families | 1,537 (15.8%) | $111,942 |
| 5-Person Families | 935 (9.6%) | $85,991 |
| 6-Person Families | 336 (3.5%) | $101,250 |
| 7+ Person Families | 174 (1.8%) | $75,750 |
| Total | 9,747 (100.0%) | $81,676 |
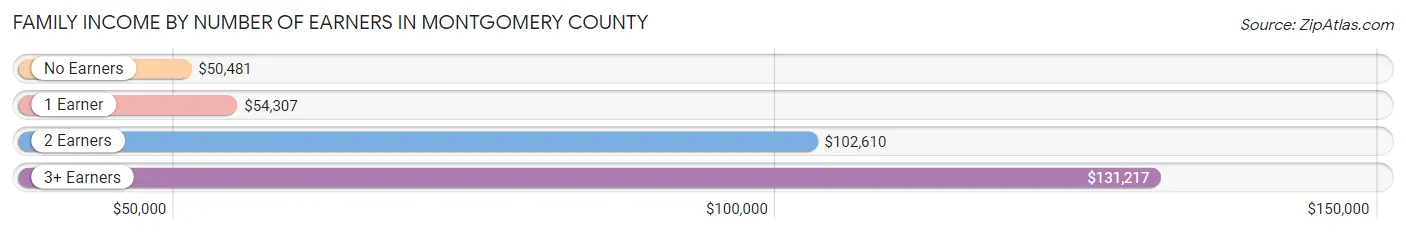
Family Income by Number of Earners in Montgomery County
The median family income in Montgomery County is $81,676, with families comprising 3+ earners (1,155) having the highest median family income of $131,217, while families with no earners (1,437) have the lowest median family income of $50,481, accounting for 11.8% and 14.7% of families, respectively.
| Number of Earners | # Families | Median Income |
| No Earners | 1,437 (14.7%) | $50,481 |
| 1 Earner | 3,051 (31.3%) | $54,307 |
| 2 Earners | 4,104 (42.1%) | $102,610 |
| 3+ Earners | 1,155 (11.8%) | $131,217 |
| Total | 9,747 (100.0%) | $81,676 |
Household Income in Montgomery County
Household Income Brackets in Montgomery County
With 2,865 households falling in the category, the $100,000 to $149,999 income range is the most frequent in Montgomery County, accounting for 18.6% of all households. In contrast, only 555 households (3.6%) fall into the less than $10,000 income bracket, making it the least populous group.

| Income Bracket | # Households | % Households |
| Less than $10,000 | 555 | 3.6% |
| $10,000 to $14,999 | 693 | 4.5% |
| $15,000 to $24,999 | 1,386 | 9.0% |
| $25,000 to $34,999 | 1,386 | 9.0% |
| $35,000 to $49,999 | 2,110 | 13.7% |
| $50,000 to $74,999 | 2,757 | 17.9% |
| $75,000 to $99,999 | 2,003 | 13.0% |
| $100,000 to $149,999 | 2,865 | 18.6% |
| $150,000 to $199,999 | 924 | 6.0% |
| $200,000+ | 693 | 4.5% |
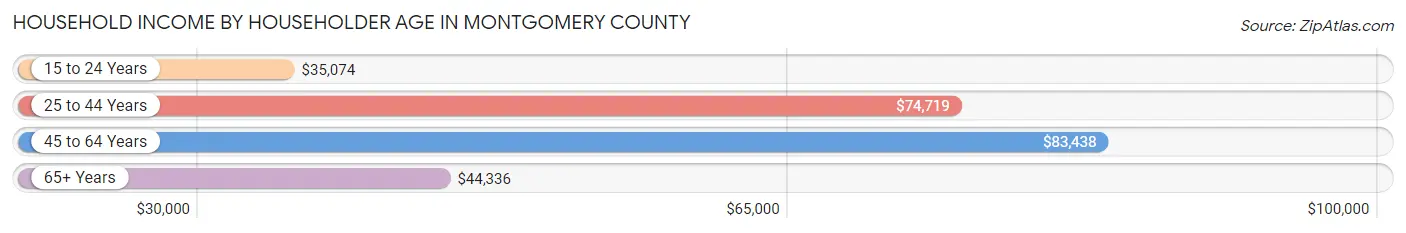
Household Income by Householder Age in Montgomery County
The median household income in Montgomery County is $62,937, with the highest median household income of $83,438 found in the 45 to 64 years age bracket for the primary householder. A total of 5,978 households (38.8%) fall into this category. Meanwhile, the 15 to 24 years age bracket for the primary householder has the lowest median household income of $35,074, with 733 households (4.8%) in this group.
| Income Bracket | # Households | Median Income |
| 15 to 24 Years | 733 (4.8%) | $35,074 |
| 25 to 44 Years | 4,298 (27.9%) | $74,719 |
| 45 to 64 Years | 5,978 (38.8%) | $83,438 |
| 65+ Years | 4,395 (28.5%) | $44,336 |
| Total | 15,404 (100.0%) | $62,937 |
Poverty in Montgomery County
Income Below Poverty by Sex and Age in Montgomery County
With 10.4% poverty level for males and 15.1% for females among the residents of Montgomery County, 12 to 14 year old males and 18 to 24 year old females are the most vulnerable to poverty, with 167 males (25.5%) and 364 females (27.8%) in their respective age groups living below the poverty level.

| Age Bracket | Male | Female |
| Under 5 Years | 168 (14.4%) | 176 (19.0%) |
| 5 Years | 17 (9.0%) | 64 (17.7%) |
| 6 to 11 Years | 249 (16.1%) | 172 (13.9%) |
| 12 to 14 Years | 167 (25.5%) | 156 (22.5%) |
| 15 Years | 15 (6.2%) | 29 (14.6%) |
| 16 and 17 Years | 110 (18.2%) | 111 (22.0%) |
| 18 to 24 Years | 255 (18.3%) | 364 (27.8%) |
| 25 to 34 Years | 146 (6.5%) | 331 (14.8%) |
| 35 to 44 Years | 197 (9.2%) | 328 (16.2%) |
| 45 to 54 Years | 128 (5.2%) | 195 (8.6%) |
| 55 to 64 Years | 216 (7.8%) | 367 (13.7%) |
| 65 to 74 Years | 199 (10.7%) | 149 (7.5%) |
| 75 Years and over | 47 (4.0%) | 284 (17.3%) |
| Total | 1,914 (10.4%) | 2,726 (15.1%) |
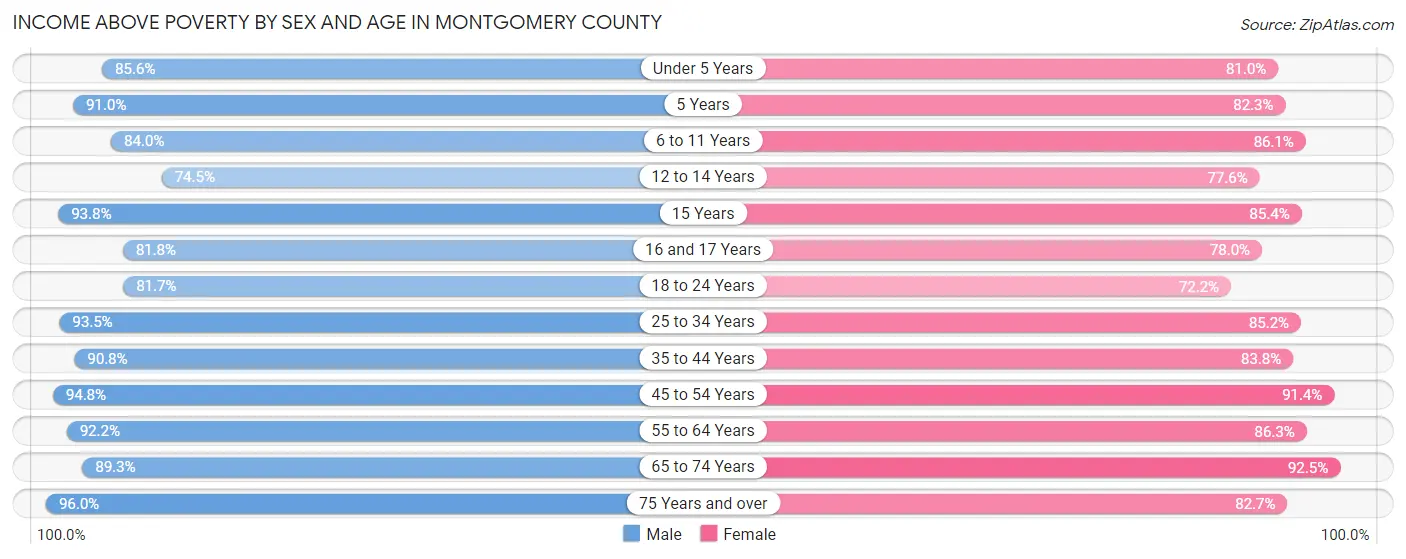
Income Above Poverty by Sex and Age in Montgomery County
According to the poverty statistics in Montgomery County, males aged 75 years and over and females aged 65 to 74 years are the age groups that are most secure financially, with 96.0% of males and 92.5% of females in these age groups living above the poverty line.
| Age Bracket | Male | Female |
| Under 5 Years | 1,001 (85.6%) | 750 (81.0%) |
| 5 Years | 172 (91.0%) | 298 (82.3%) |
| 6 to 11 Years | 1,302 (84.0%) | 1,065 (86.1%) |
| 12 to 14 Years | 489 (74.5%) | 539 (77.5%) |
| 15 Years | 225 (93.8%) | 169 (85.4%) |
| 16 and 17 Years | 494 (81.8%) | 393 (78.0%) |
| 18 to 24 Years | 1,138 (81.7%) | 947 (72.2%) |
| 25 to 34 Years | 2,109 (93.5%) | 1,909 (85.2%) |
| 35 to 44 Years | 1,935 (90.8%) | 1,692 (83.8%) |
| 45 to 54 Years | 2,312 (94.8%) | 2,070 (91.4%) |
| 55 to 64 Years | 2,542 (92.2%) | 2,307 (86.3%) |
| 65 to 74 Years | 1,657 (89.3%) | 1,829 (92.5%) |
| 75 Years and over | 1,137 (96.0%) | 1,358 (82.7%) |
| Total | 16,513 (89.6%) | 15,326 (84.9%) |
Income Below Poverty Among Married-Couple Families in Montgomery County
The poverty statistics for married-couple families in Montgomery County show that 3.8% or 296 of the total 7,702 families live below the poverty line. Families with 5 or more children have the highest poverty rate of 11.5%, comprising of 6 families. On the other hand, families with no children have the lowest poverty rate of 2.0%, which includes 93 families.
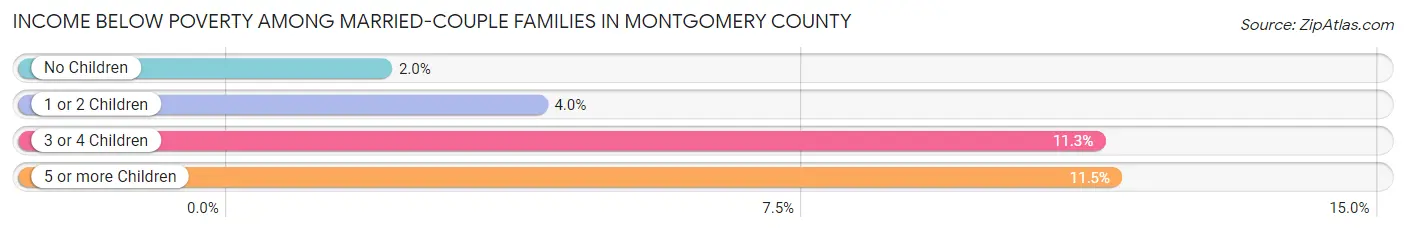
| Children | Above Poverty | Below Poverty |
| No Children | 4,541 (98.0%) | 93 (2.0%) |
| 1 or 2 Children | 1,902 (96.0%) | 80 (4.0%) |
| 3 or 4 Children | 917 (88.7%) | 117 (11.3%) |
| 5 or more Children | 46 (88.5%) | 6 (11.5%) |
| Total | 7,406 (96.2%) | 296 (3.8%) |
Income Below Poverty Among Single-Parent Households in Montgomery County
According to the poverty data in Montgomery County, 15.3% or 117 single-father households and 31.4% or 403 single-mother households are living below the poverty line. Among single-father households, those with 3 or 4 children have the highest poverty rate, with 17 households (25.0%) experiencing poverty. Likewise, among single-mother households, those with 5 or more children have the highest poverty rate, with 8 households (88.9%) falling below the poverty line.
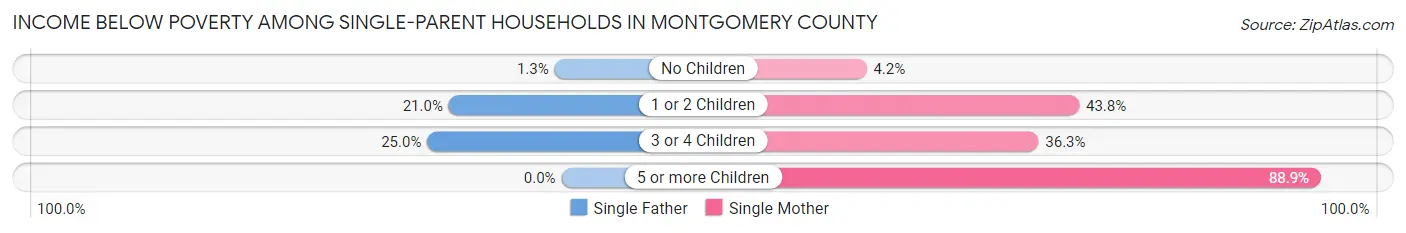
| Children | Single Father | Single Mother |
| No Children | 3 (1.3%) | 16 (4.2%) |
| 1 or 2 Children | 97 (21.0%) | 313 (43.8%) |
| 3 or 4 Children | 17 (25.0%) | 66 (36.3%) |
| 5 or more Children | 0 (0.0%) | 8 (88.9%) |
| Total | 117 (15.3%) | 403 (31.4%) |
Income Below Poverty Among Married-Couple vs Single-Parent Households in Montgomery County
The poverty data for Montgomery County shows that 296 of the married-couple family households (3.8%) and 520 of the single-parent households (25.4%) are living below the poverty level. Within the married-couple family households, those with 5 or more children have the highest poverty rate, with 6 households (11.5%) falling below the poverty line. Among the single-parent households, those with 5 or more children have the highest poverty rate, with 8 household (88.9%) living below poverty.
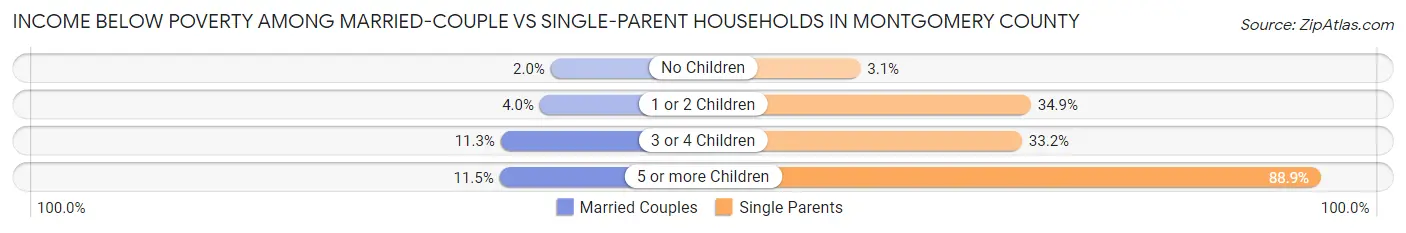
| Children | Married-Couple Families | Single-Parent Households |
| No Children | 93 (2.0%) | 19 (3.1%) |
| 1 or 2 Children | 80 (4.0%) | 410 (34.9%) |
| 3 or 4 Children | 117 (11.3%) | 83 (33.2%) |
| 5 or more Children | 6 (11.5%) | 8 (88.9%) |
| Total | 296 (3.8%) | 520 (25.4%) |
Employment Characteristics in Montgomery County
Employment by Class of Employer in Montgomery County
Among the 17,939 employed individuals in Montgomery County, private company employees (12,841 | 71.6%), not-for-profit organizations (1,461 | 8.1%), and local government employees (1,175 | 6.6%) make up the most common classes of employment.
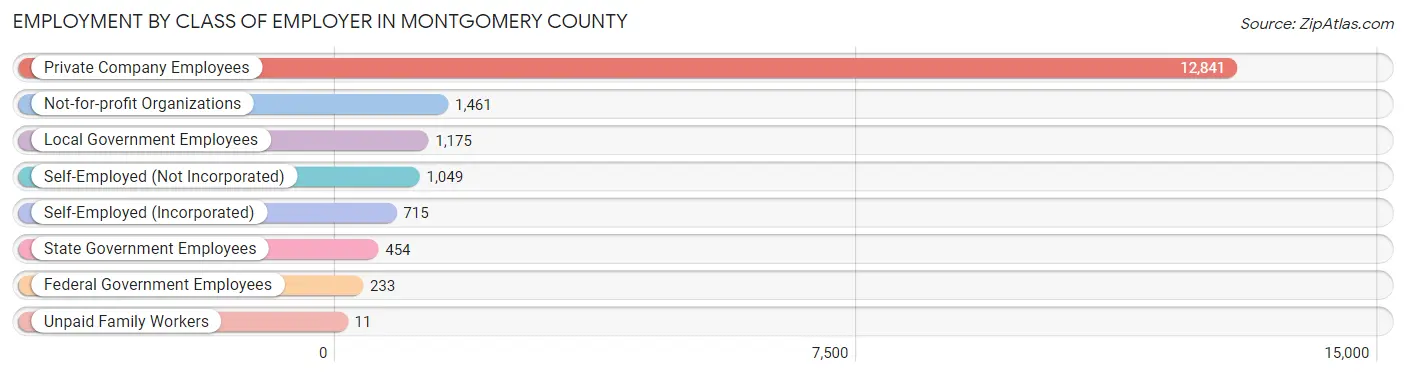
| Employer Class | # Employees | % Employees |
| Private Company Employees | 12,841 | 71.6% |
| Self-Employed (Incorporated) | 715 | 4.0% |
| Self-Employed (Not Incorporated) | 1,049 | 5.9% |
| Not-for-profit Organizations | 1,461 | 8.1% |
| Local Government Employees | 1,175 | 6.6% |
| State Government Employees | 454 | 2.5% |
| Federal Government Employees | 233 | 1.3% |
| Unpaid Family Workers | 11 | 0.1% |
| Total | 17,939 | 100.0% |
Employment Status by Age in Montgomery County
According to the labor force statistics for Montgomery County, out of the total population over 16 years of age (30,438), 63.9% or 19,450 individuals are in the labor force, with 4.0% or 778 of them unemployed. The age group with the highest labor force participation rate is 45 to 54 years, with 85.9% or 4,054 individuals in the labor force. Within the labor force, the 16 to 19 years age range has the highest percentage of unemployed individuals, with 11.8% or 148 of them being unemployed.
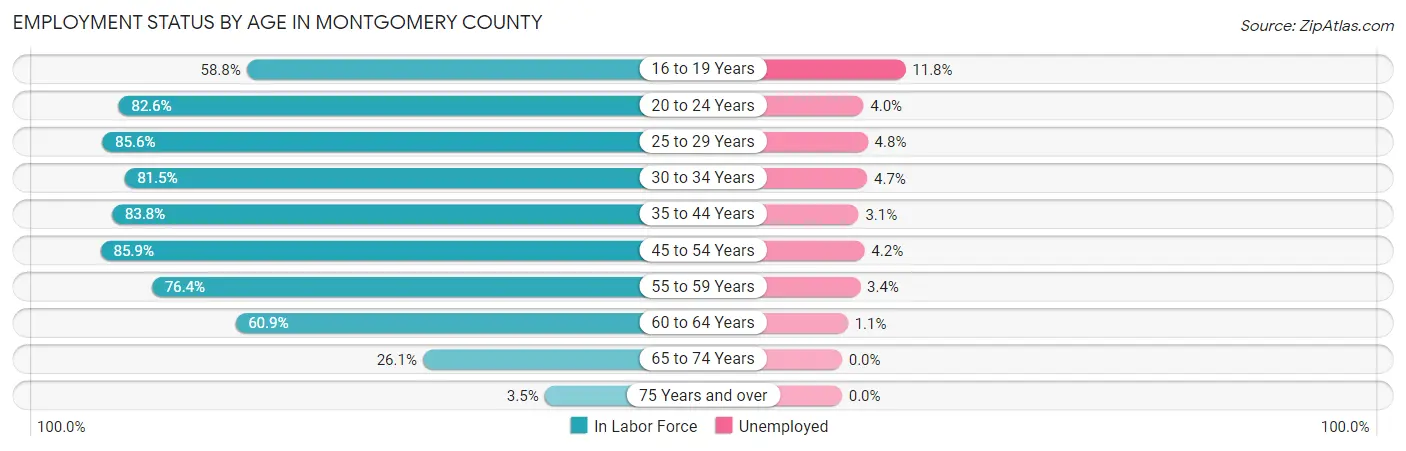
| Age Bracket | In Labor Force | Unemployed |
| 16 to 19 Years | 1,257 (58.8%) | 148 (11.8%) |
| 20 to 24 Years | 1,983 (82.6%) | 79 (4.0%) |
| 25 to 29 Years | 1,969 (85.6%) | 95 (4.8%) |
| 30 to 34 Years | 1,846 (81.5%) | 87 (4.7%) |
| 35 to 44 Years | 3,501 (83.8%) | 109 (3.1%) |
| 45 to 54 Years | 4,054 (85.9%) | 170 (4.2%) |
| 55 to 59 Years | 1,927 (76.4%) | 66 (3.4%) |
| 60 to 64 Years | 1,800 (60.9%) | 20 (1.1%) |
| 65 to 74 Years | 1,015 (26.1%) | 0 (0.0%) |
| 75 Years and over | 107 (3.5%) | 0 (0.0%) |
| Total | 19,450 (63.9%) | 778 (4.0%) |
Employment Status by Educational Attainment in Montgomery County
According to labor force statistics for Montgomery County, 79.7% of individuals (15,096) out of the total population between 25 and 64 years of age (18,941) are in the labor force, with 3.6% or 543 of them being unemployed. The group with the highest labor force participation rate are those with the educational attainment of bachelor's degree or higher, with 89.8% or 3,909 individuals in the labor force. Within the labor force, individuals with less than high school education have the highest percentage of unemployment, with 10.0% or 102 of them being unemployed.
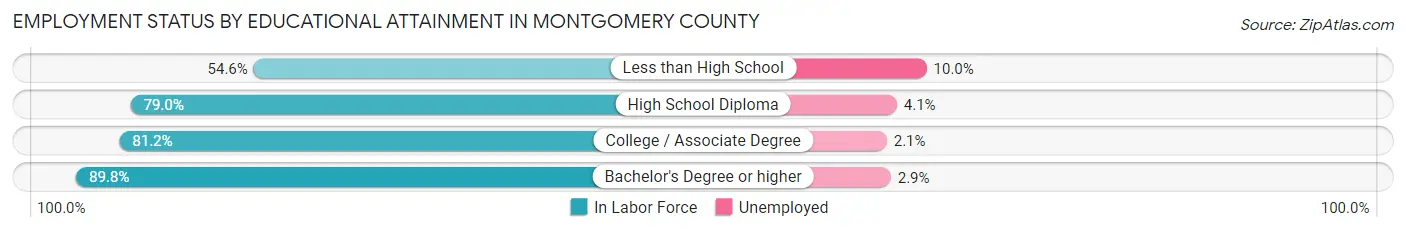
| Educational Attainment | In Labor Force | Unemployed |
| Less than High School | 1,017 (54.6%) | 186 (10.0%) |
| High School Diploma | 5,867 (79.0%) | 305 (4.1%) |
| College / Associate Degree | 4,303 (81.2%) | 111 (2.1%) |
| Bachelor's Degree or higher | 3,909 (89.8%) | 126 (2.9%) |
| Total | 15,096 (79.7%) | 682 (3.6%) |
Employment Occupations by Sex in Montgomery County
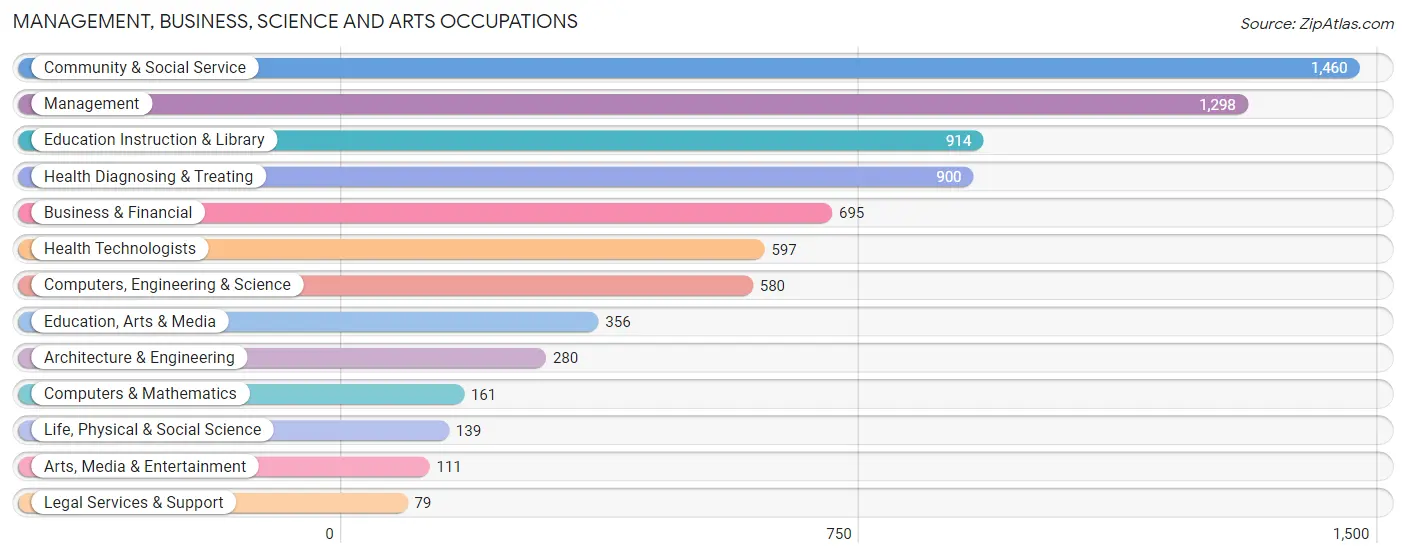
Management, Business, Science and Arts Occupations
The most common Management, Business, Science and Arts occupations in Montgomery County are Community & Social Service (1,460 | 7.8%), Management (1,298 | 7.0%), Education Instruction & Library (914 | 4.9%), Health Diagnosing & Treating (900 | 4.8%), and Business & Financial (695 | 3.7%).
Management, Business, Science and Arts Occupations by Sex
Within the Management, Business, Science and Arts occupations in Montgomery County, the most male-oriented occupations are Architecture & Engineering (90.0%), Computers, Engineering & Science (82.4%), and Computers & Mathematics (75.8%), while the most female-oriented occupations are Health Technologists (96.7%), Health Diagnosing & Treating (90.0%), and Legal Services & Support (75.9%).
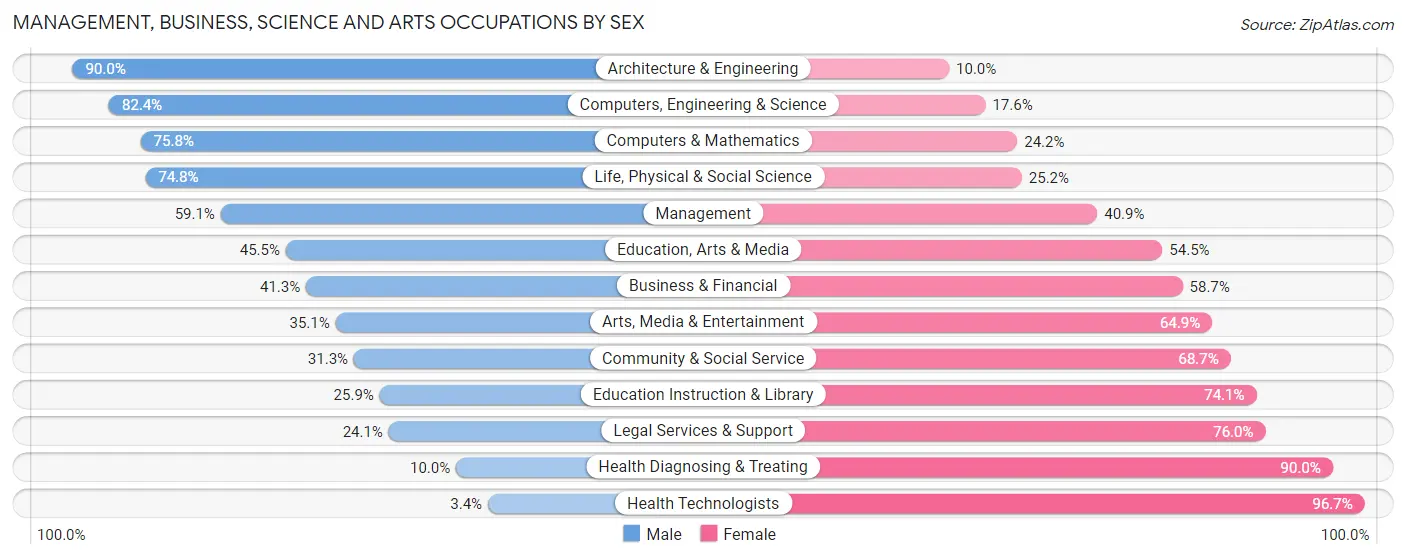
| Occupation | Male | Female |
| Management | 767 (59.1%) | 531 (40.9%) |
| Business & Financial | 287 (41.3%) | 408 (58.7%) |
| Computers, Engineering & Science | 478 (82.4%) | 102 (17.6%) |
| Computers & Mathematics | 122 (75.8%) | 39 (24.2%) |
| Architecture & Engineering | 252 (90.0%) | 28 (10.0%) |
| Life, Physical & Social Science | 104 (74.8%) | 35 (25.2%) |
| Community & Social Service | 457 (31.3%) | 1,003 (68.7%) |
| Education, Arts & Media | 162 (45.5%) | 194 (54.5%) |
| Legal Services & Support | 19 (24.0%) | 60 (75.9%) |
| Education Instruction & Library | 237 (25.9%) | 677 (74.1%) |
| Arts, Media & Entertainment | 39 (35.1%) | 72 (64.9%) |
| Health Diagnosing & Treating | 90 (10.0%) | 810 (90.0%) |
| Health Technologists | 20 (3.4%) | 577 (96.7%) |
| Total (Category) | 2,079 (42.1%) | 2,854 (57.9%) |
| Total (Overall) | 10,390 (55.7%) | 8,269 (44.3%) |
Services Occupations
The most common Services occupations in Montgomery County are Food Preparation & Serving (1,376 | 7.4%), Cleaning & Maintenance (749 | 4.0%), Personal Care & Service (613 | 3.3%), Healthcare Support (358 | 1.9%), and Security & Protection (256 | 1.4%).
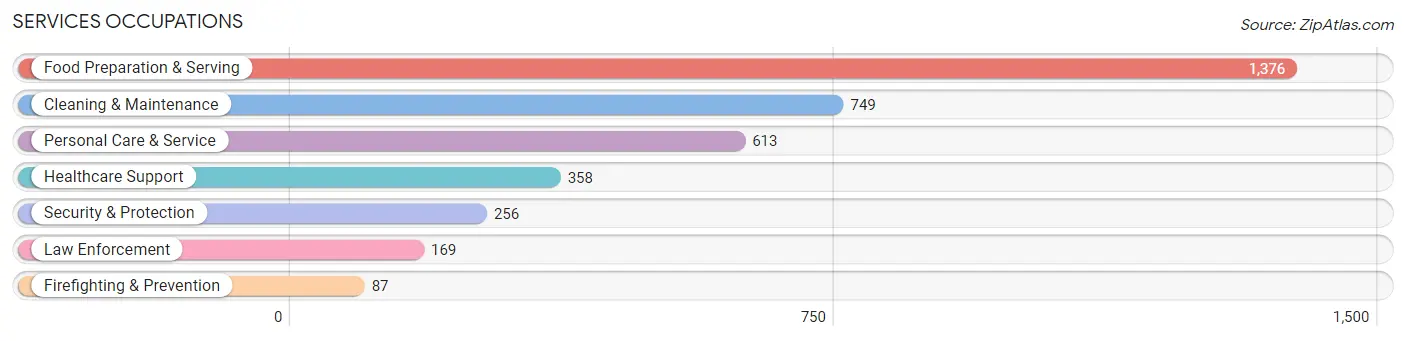
Services Occupations by Sex
Within the Services occupations in Montgomery County, the most male-oriented occupations are Law Enforcement (90.5%), Security & Protection (76.2%), and Cleaning & Maintenance (63.7%), while the most female-oriented occupations are Healthcare Support (98.6%), Personal Care & Service (82.9%), and Firefighting & Prevention (51.7%).

| Occupation | Male | Female |
| Healthcare Support | 5 (1.4%) | 353 (98.6%) |
| Security & Protection | 195 (76.2%) | 61 (23.8%) |
| Firefighting & Prevention | 42 (48.3%) | 45 (51.7%) |
| Law Enforcement | 153 (90.5%) | 16 (9.5%) |
| Food Preparation & Serving | 666 (48.4%) | 710 (51.6%) |
| Cleaning & Maintenance | 477 (63.7%) | 272 (36.3%) |
| Personal Care & Service | 105 (17.1%) | 508 (82.9%) |
| Total (Category) | 1,448 (43.2%) | 1,904 (56.8%) |
| Total (Overall) | 10,390 (55.7%) | 8,269 (44.3%) |
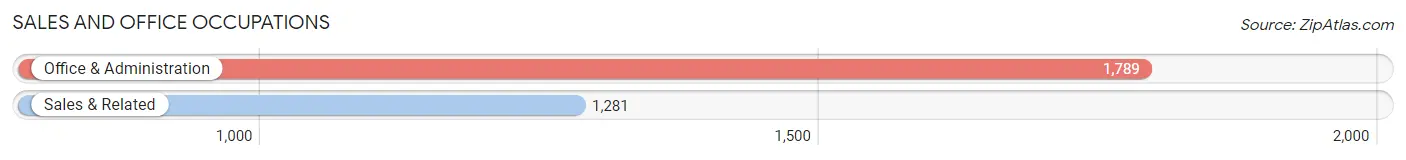
Sales and Office Occupations
The most common Sales and Office occupations in Montgomery County are Office & Administration (1,789 | 9.6%), and Sales & Related (1,281 | 6.9%).
Sales and Office Occupations by Sex
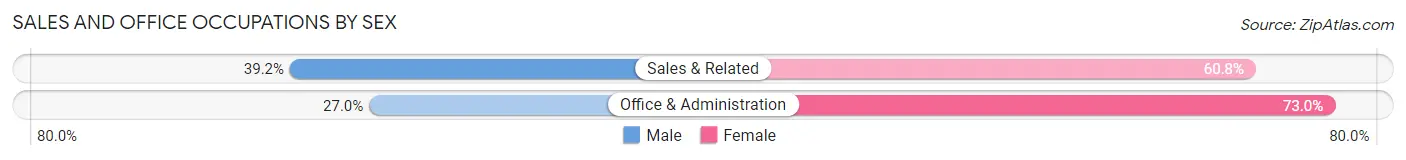
| Occupation | Male | Female |
| Sales & Related | 502 (39.2%) | 779 (60.8%) |
| Office & Administration | 483 (27.0%) | 1,306 (73.0%) |
| Total (Category) | 985 (32.1%) | 2,085 (67.9%) |
| Total (Overall) | 10,390 (55.7%) | 8,269 (44.3%) |
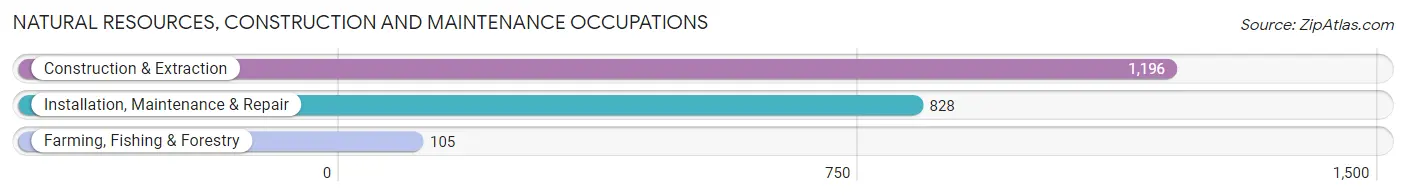
Natural Resources, Construction and Maintenance Occupations
The most common Natural Resources, Construction and Maintenance occupations in Montgomery County are Construction & Extraction (1,196 | 6.4%), Installation, Maintenance & Repair (828 | 4.4%), and Farming, Fishing & Forestry (105 | 0.6%).
Natural Resources, Construction and Maintenance Occupations by Sex
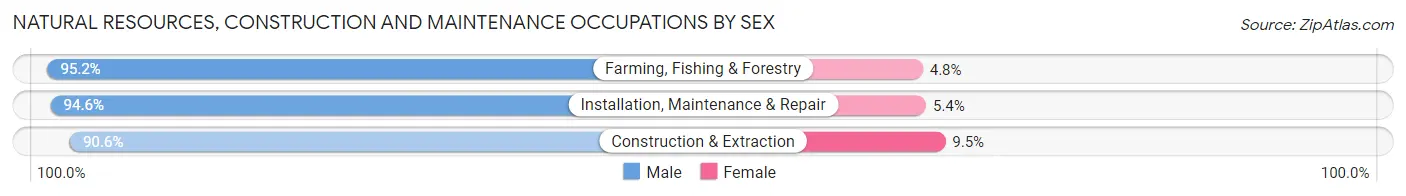
| Occupation | Male | Female |
| Farming, Fishing & Forestry | 100 (95.2%) | 5 (4.8%) |
| Construction & Extraction | 1,083 (90.5%) | 113 (9.5%) |
| Installation, Maintenance & Repair | 783 (94.6%) | 45 (5.4%) |
| Total (Category) | 1,966 (92.3%) | 163 (7.7%) |
| Total (Overall) | 10,390 (55.7%) | 8,269 (44.3%) |
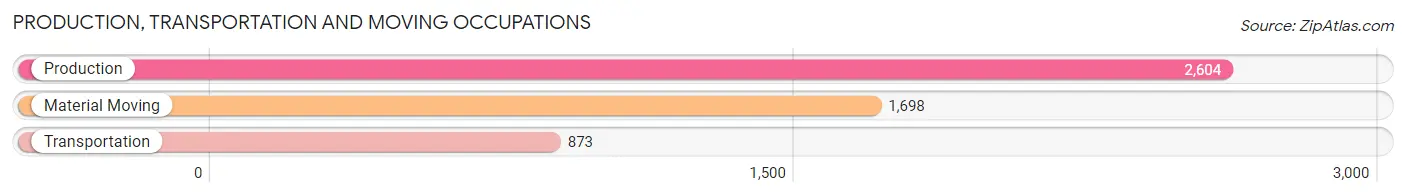
Production, Transportation and Moving Occupations
The most common Production, Transportation and Moving occupations in Montgomery County are Production (2,604 | 14.0%), Material Moving (1,698 | 9.1%), and Transportation (873 | 4.7%).
Production, Transportation and Moving Occupations by Sex
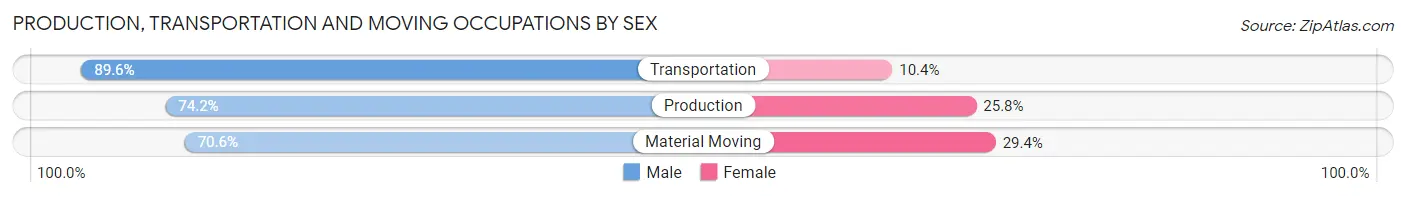
| Occupation | Male | Female |
| Production | 1,931 (74.2%) | 673 (25.8%) |
| Transportation | 782 (89.6%) | 91 (10.4%) |
| Material Moving | 1,199 (70.6%) | 499 (29.4%) |
| Total (Category) | 3,912 (75.6%) | 1,263 (24.4%) |
| Total (Overall) | 10,390 (55.7%) | 8,269 (44.3%) |
Employment Industries by Sex in Montgomery County
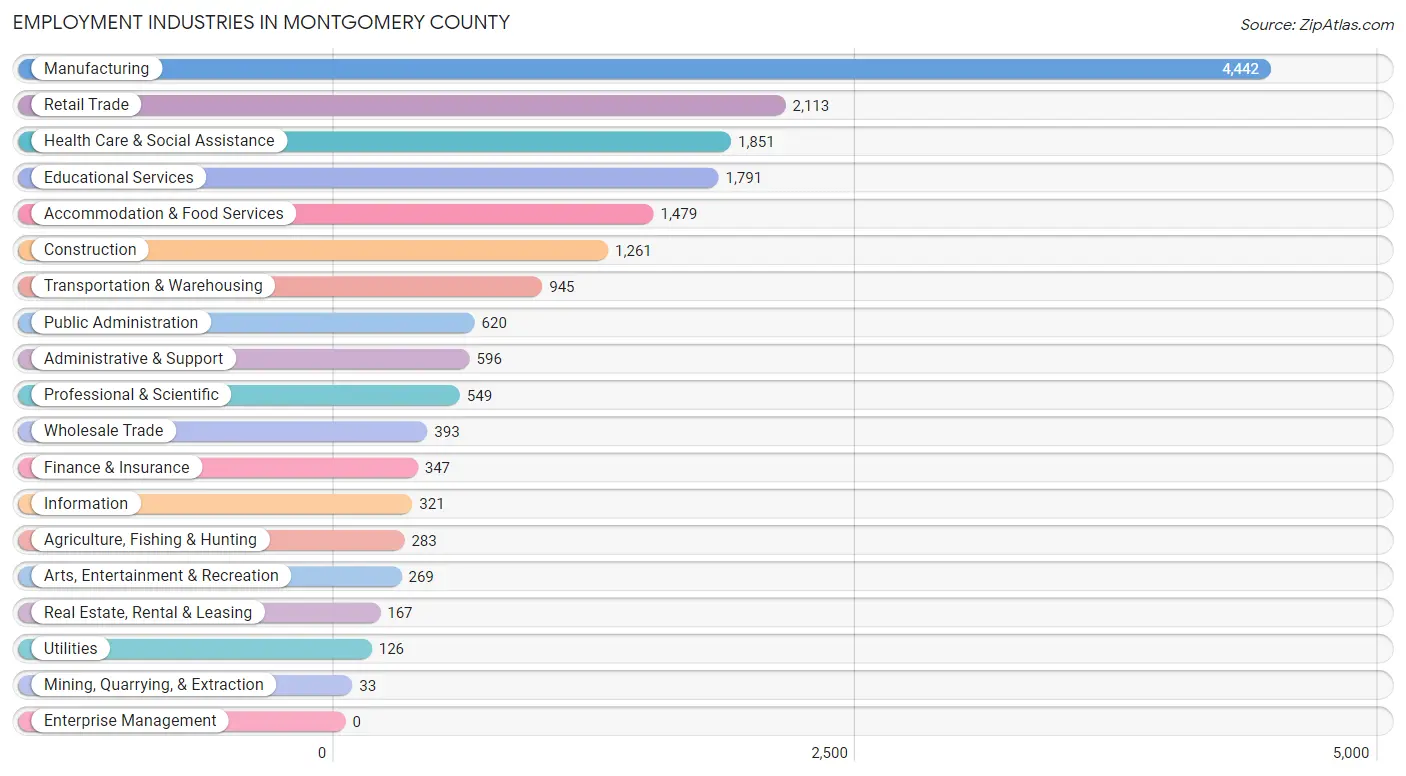
Employment Industries in Montgomery County
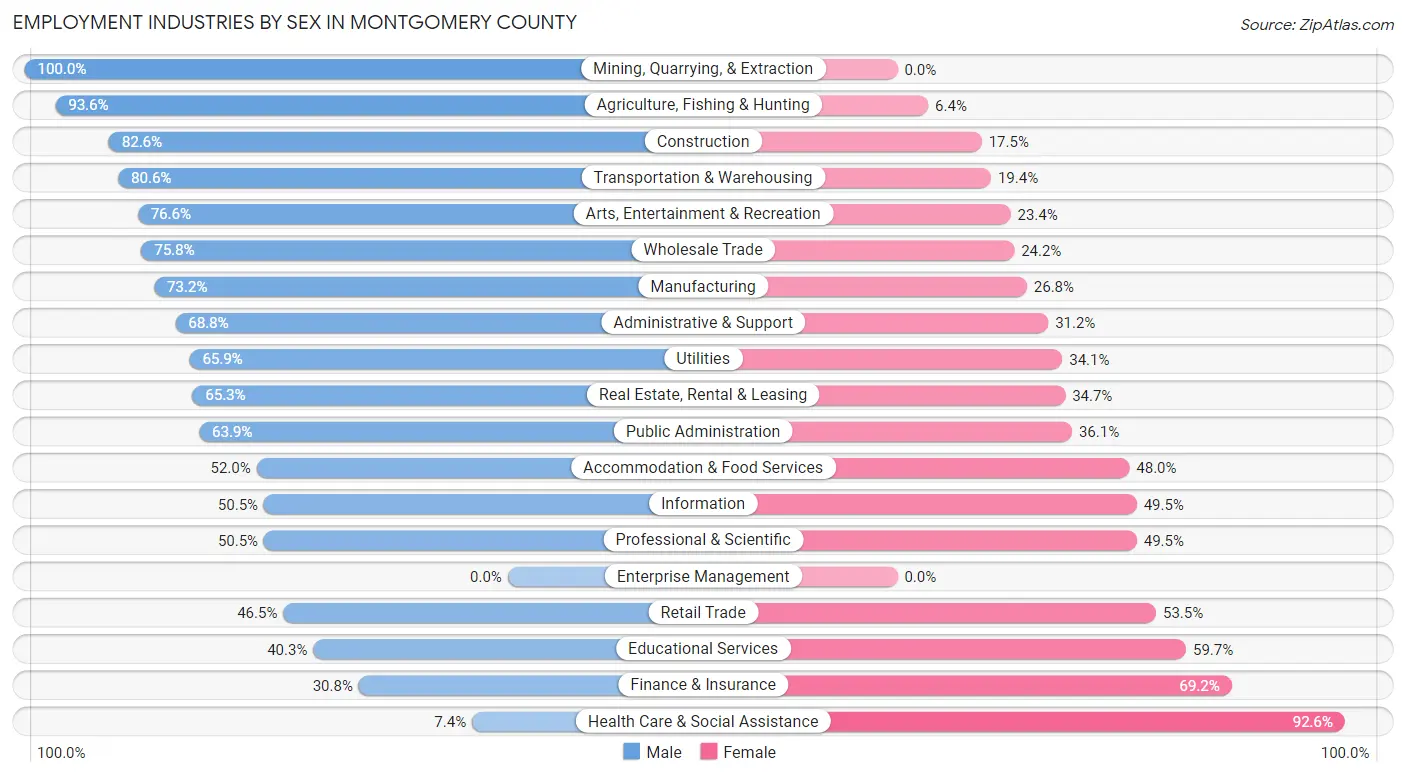
The major employment industries in Montgomery County include Manufacturing (4,442 | 23.8%), Retail Trade (2,113 | 11.3%), Health Care & Social Assistance (1,851 | 9.9%), Educational Services (1,791 | 9.6%), and Accommodation & Food Services (1,479 | 7.9%).
Employment Industries by Sex in Montgomery County
The Montgomery County industries that see more men than women are Mining, Quarrying, & Extraction (100.0%), Agriculture, Fishing & Hunting (93.6%), and Construction (82.6%), whereas the industries that tend to have a higher number of women are Health Care & Social Assistance (92.6%), Finance & Insurance (69.2%), and Educational Services (59.7%).
| Industry | Male | Female |
| Agriculture, Fishing & Hunting | 265 (93.6%) | 18 (6.4%) |
| Mining, Quarrying, & Extraction | 33 (100.0%) | 0 (0.0%) |
| Construction | 1,041 (82.6%) | 220 (17.4%) |
| Manufacturing | 3,252 (73.2%) | 1,190 (26.8%) |
| Wholesale Trade | 298 (75.8%) | 95 (24.2%) |
| Retail Trade | 982 (46.5%) | 1,131 (53.5%) |
| Transportation & Warehousing | 762 (80.6%) | 183 (19.4%) |
| Utilities | 83 (65.9%) | 43 (34.1%) |
| Information | 162 (50.5%) | 159 (49.5%) |
| Finance & Insurance | 107 (30.8%) | 240 (69.2%) |
| Real Estate, Rental & Leasing | 109 (65.3%) | 58 (34.7%) |
| Professional & Scientific | 277 (50.5%) | 272 (49.5%) |
| Enterprise Management | 0 (0.0%) | 0 (0.0%) |
| Administrative & Support | 410 (68.8%) | 186 (31.2%) |
| Educational Services | 721 (40.3%) | 1,070 (59.7%) |
| Health Care & Social Assistance | 137 (7.4%) | 1,714 (92.6%) |
| Arts, Entertainment & Recreation | 206 (76.6%) | 63 (23.4%) |
| Accommodation & Food Services | 769 (52.0%) | 710 (48.0%) |
| Public Administration | 396 (63.9%) | 224 (36.1%) |
| Total | 10,390 (55.7%) | 8,269 (44.3%) |
Education in Montgomery County
School Enrollment in Montgomery County
The most common levels of schooling among the 8,884 students in Montgomery County are elementary school (2,125 | 23.9%), high school (2,098 | 23.6%), and middle school (1,734 | 19.5%).

| School Level | # Students | % Students |
| Nursery / Preschool | 582 | 6.6% |
| Kindergarten | 485 | 5.5% |
| Elementary School | 2,125 | 23.9% |
| Middle School | 1,734 | 19.5% |
| High School | 2,098 | 23.6% |
| College / Undergraduate | 1,666 | 18.8% |
| Graduate / Professional | 194 | 2.2% |
| Total | 8,884 | 100.0% |
School Enrollment by Age by Funding Source in Montgomery County
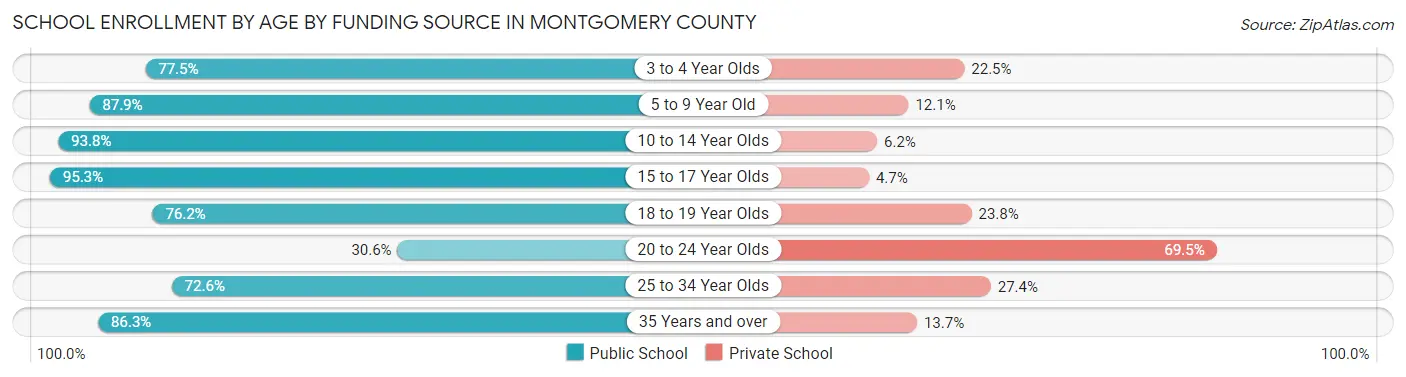
Out of a total of 8,884 students who are enrolled in schools in Montgomery County, 1,519 (17.1%) attend a private institution, while the remaining 7,365 (82.9%) are enrolled in public schools. The age group of 20 to 24 year olds has the highest likelihood of being enrolled in private schools, with 607 (69.5% in the age bracket) enrolled. Conversely, the age group of 15 to 17 year olds has the lowest likelihood of being enrolled in a private school, with 1,435 (95.3% in the age bracket) attending a public institution.
| Age Bracket | Public School | Private School |
| 3 to 4 Year Olds | 338 (77.5%) | 98 (22.5%) |
| 5 to 9 Year Old | 1,989 (87.9%) | 273 (12.1%) |
| 10 to 14 Year Olds | 2,288 (93.8%) | 152 (6.2%) |
| 15 to 17 Year Olds | 1,435 (95.3%) | 71 (4.7%) |
| 18 to 19 Year Olds | 534 (76.2%) | 167 (23.8%) |
| 20 to 24 Year Olds | 267 (30.5%) | 607 (69.5%) |
| 25 to 34 Year Olds | 318 (72.6%) | 120 (27.4%) |
| 35 Years and over | 196 (86.3%) | 31 (13.7%) |
| Total | 7,365 (82.9%) | 1,519 (17.1%) |
Educational Attainment by Field of Study in Montgomery County
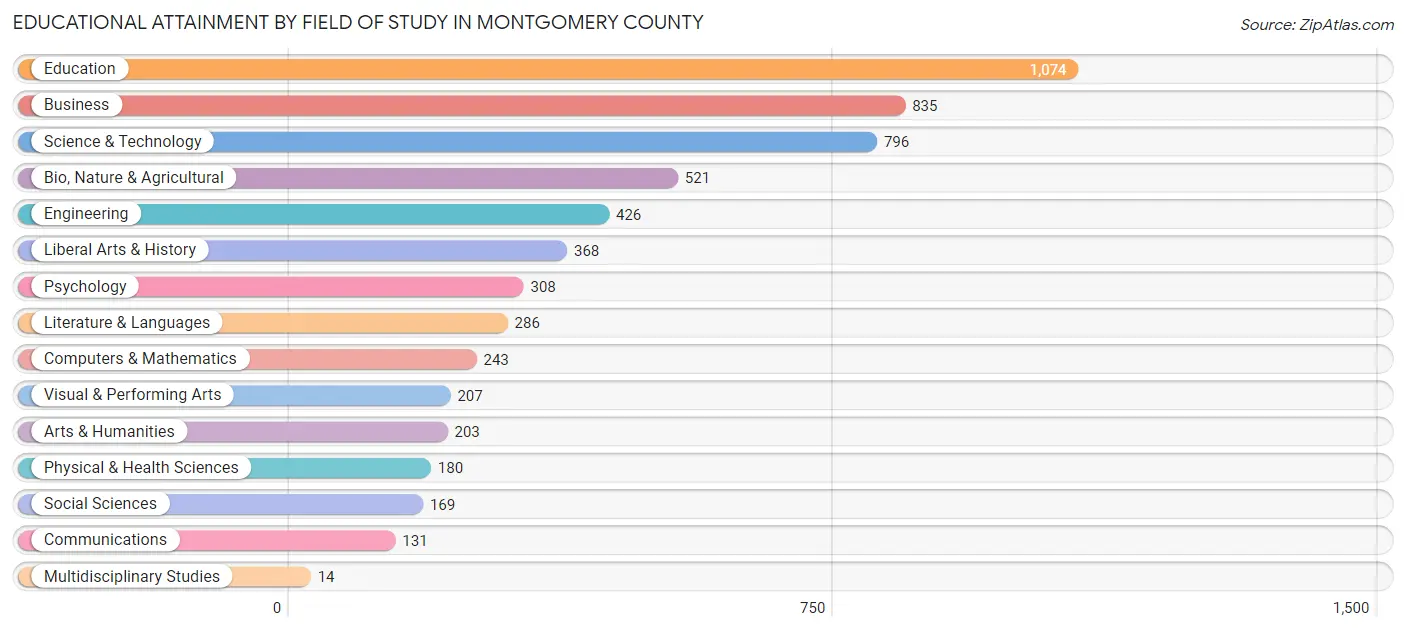
Education (1,074 | 18.6%), business (835 | 14.5%), science & technology (796 | 13.8%), bio, nature & agricultural (521 | 9.0%), and engineering (426 | 7.4%) are the most common fields of study among 5,761 individuals in Montgomery County who have obtained a bachelor's degree or higher.
| Field of Study | # Graduates | % Graduates |
| Computers & Mathematics | 243 | 4.2% |
| Bio, Nature & Agricultural | 521 | 9.0% |
| Physical & Health Sciences | 180 | 3.1% |
| Psychology | 308 | 5.3% |
| Social Sciences | 169 | 2.9% |
| Engineering | 426 | 7.4% |
| Multidisciplinary Studies | 14 | 0.2% |
| Science & Technology | 796 | 13.8% |
| Business | 835 | 14.5% |
| Education | 1,074 | 18.6% |
| Literature & Languages | 286 | 5.0% |
| Liberal Arts & History | 368 | 6.4% |
| Visual & Performing Arts | 207 | 3.6% |
| Communications | 131 | 2.3% |
| Arts & Humanities | 203 | 3.5% |
| Total | 5,761 | 100.0% |
Transportation & Commute in Montgomery County
Vehicle Availability by Sex in Montgomery County
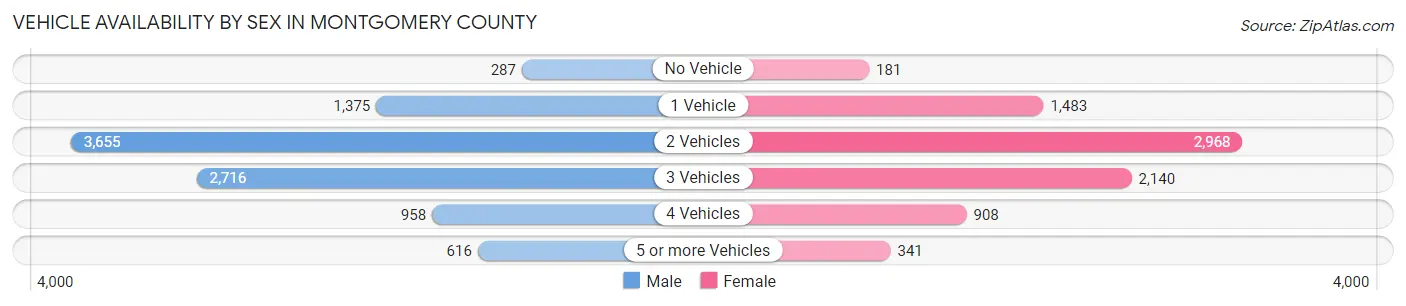
The most prevalent vehicle ownership categories in Montgomery County are males with 2 vehicles (3,655, accounting for 38.1%) and females with 2 vehicles (2,968, making up 45.6%).
| Vehicles Available | Male | Female |
| No Vehicle | 287 (3.0%) | 181 (2.3%) |
| 1 Vehicle | 1,375 (14.3%) | 1,483 (18.5%) |
| 2 Vehicles | 3,655 (38.1%) | 2,968 (37.0%) |
| 3 Vehicles | 2,716 (28.3%) | 2,140 (26.7%) |
| 4 Vehicles | 958 (10.0%) | 908 (11.3%) |
| 5 or more Vehicles | 616 (6.4%) | 341 (4.3%) |
| Total | 9,607 (100.0%) | 8,021 (100.0%) |
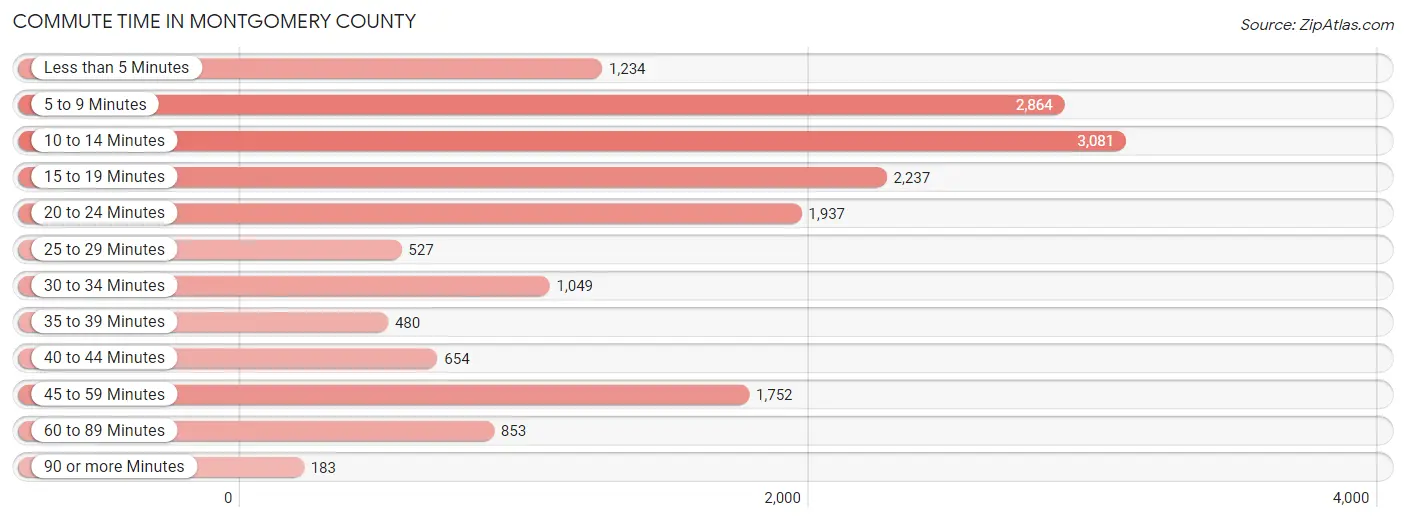
Commute Time in Montgomery County
The most frequently occuring commute durations in Montgomery County are 10 to 14 minutes (3,081 commuters, 18.3%), 5 to 9 minutes (2,864 commuters, 17.0%), and 15 to 19 minutes (2,237 commuters, 13.3%).
| Commute Time | # Commuters | % Commuters |
| Less than 5 Minutes | 1,234 | 7.3% |
| 5 to 9 Minutes | 2,864 | 17.0% |
| 10 to 14 Minutes | 3,081 | 18.3% |
| 15 to 19 Minutes | 2,237 | 13.3% |
| 20 to 24 Minutes | 1,937 | 11.5% |
| 25 to 29 Minutes | 527 | 3.1% |
| 30 to 34 Minutes | 1,049 | 6.2% |
| 35 to 39 Minutes | 480 | 2.9% |
| 40 to 44 Minutes | 654 | 3.9% |
| 45 to 59 Minutes | 1,752 | 10.4% |
| 60 to 89 Minutes | 853 | 5.1% |
| 90 or more Minutes | 183 | 1.1% |
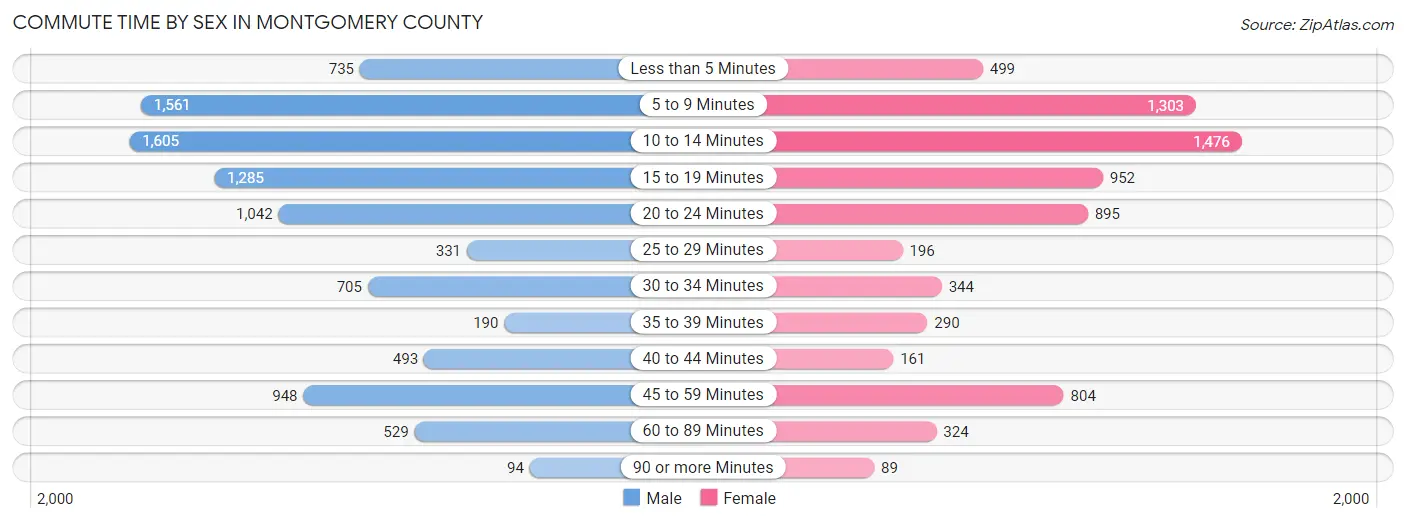
Commute Time by Sex in Montgomery County
The most common commute times in Montgomery County are 10 to 14 minutes (1,605 commuters, 16.9%) for males and 10 to 14 minutes (1,476 commuters, 20.1%) for females.
| Commute Time | Male | Female |
| Less than 5 Minutes | 735 (7.7%) | 499 (6.8%) |
| 5 to 9 Minutes | 1,561 (16.4%) | 1,303 (17.8%) |
| 10 to 14 Minutes | 1,605 (16.9%) | 1,476 (20.1%) |
| 15 to 19 Minutes | 1,285 (13.5%) | 952 (13.0%) |
| 20 to 24 Minutes | 1,042 (11.0%) | 895 (12.2%) |
| 25 to 29 Minutes | 331 (3.5%) | 196 (2.7%) |
| 30 to 34 Minutes | 705 (7.4%) | 344 (4.7%) |
| 35 to 39 Minutes | 190 (2.0%) | 290 (4.0%) |
| 40 to 44 Minutes | 493 (5.2%) | 161 (2.2%) |
| 45 to 59 Minutes | 948 (10.0%) | 804 (11.0%) |
| 60 to 89 Minutes | 529 (5.6%) | 324 (4.4%) |
| 90 or more Minutes | 94 (1.0%) | 89 (1.2%) |
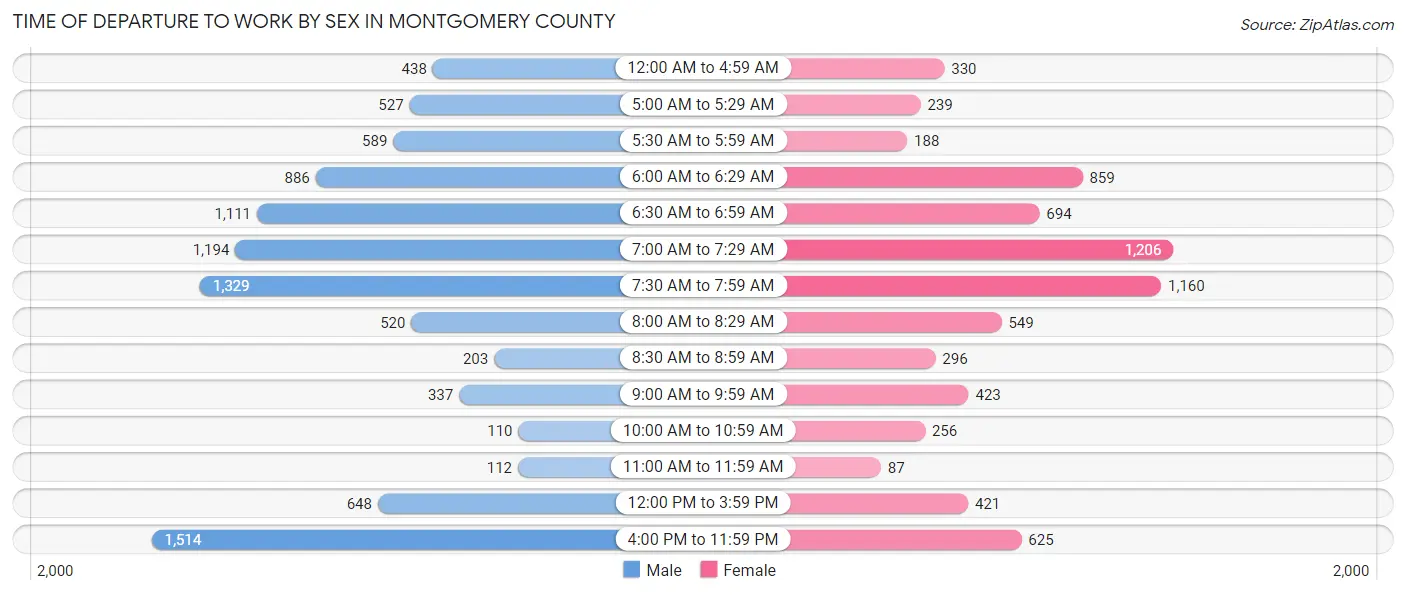
Time of Departure to Work by Sex in Montgomery County
The most frequent times of departure to work in Montgomery County are 4:00 PM to 11:59 PM (1,514, 15.9%) for males and 7:00 AM to 7:29 AM (1,206, 16.5%) for females.
| Time of Departure | Male | Female |
| 12:00 AM to 4:59 AM | 438 (4.6%) | 330 (4.5%) |
| 5:00 AM to 5:29 AM | 527 (5.5%) | 239 (3.3%) |
| 5:30 AM to 5:59 AM | 589 (6.2%) | 188 (2.6%) |
| 6:00 AM to 6:29 AM | 886 (9.3%) | 859 (11.7%) |
| 6:30 AM to 6:59 AM | 1,111 (11.7%) | 694 (9.5%) |
| 7:00 AM to 7:29 AM | 1,194 (12.5%) | 1,206 (16.5%) |
| 7:30 AM to 7:59 AM | 1,329 (14.0%) | 1,160 (15.8%) |
| 8:00 AM to 8:29 AM | 520 (5.5%) | 549 (7.5%) |
| 8:30 AM to 8:59 AM | 203 (2.1%) | 296 (4.0%) |
| 9:00 AM to 9:59 AM | 337 (3.5%) | 423 (5.8%) |
| 10:00 AM to 10:59 AM | 110 (1.2%) | 256 (3.5%) |
| 11:00 AM to 11:59 AM | 112 (1.2%) | 87 (1.2%) |
| 12:00 PM to 3:59 PM | 648 (6.8%) | 421 (5.7%) |
| 4:00 PM to 11:59 PM | 1,514 (15.9%) | 625 (8.5%) |
| Total | 9,518 (100.0%) | 7,333 (100.0%) |
Housing Occupancy in Montgomery County
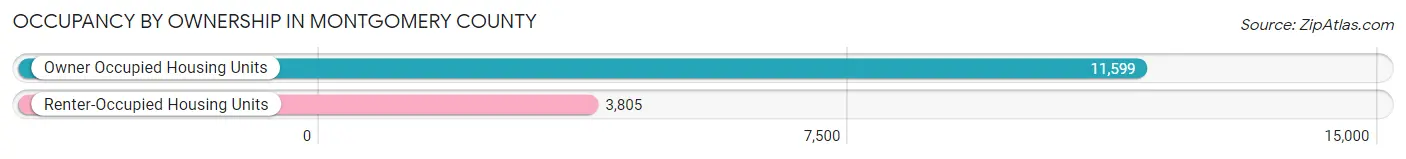
Occupancy by Ownership in Montgomery County
Of the total 15,404 dwellings in Montgomery County, owner-occupied units account for 11,599 (75.3%), while renter-occupied units make up 3,805 (24.7%).
| Occupancy | # Housing Units | % Housing Units |
| Owner Occupied Housing Units | 11,599 | 75.3% |
| Renter-Occupied Housing Units | 3,805 | 24.7% |
| Total Occupied Housing Units | 15,404 | 100.0% |
Occupancy by Household Size in Montgomery County
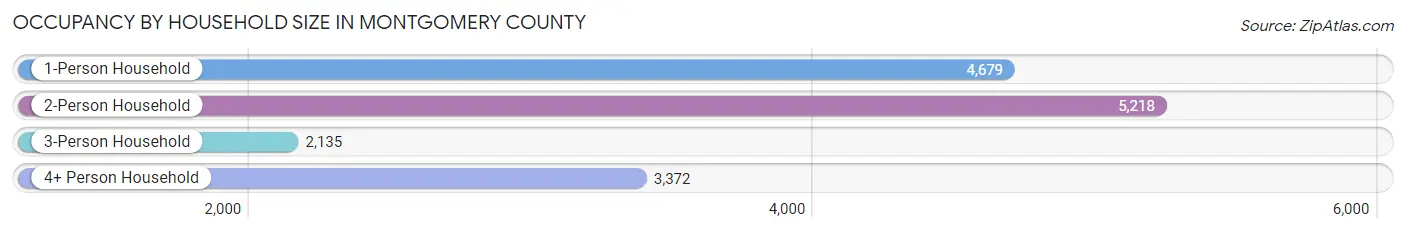
| Household Size | # Housing Units | % Housing Units |
| 1-Person Household | 4,679 | 30.4% |
| 2-Person Household | 5,218 | 33.9% |
| 3-Person Household | 2,135 | 13.9% |
| 4+ Person Household | 3,372 | 21.9% |
| Total Housing Units | 15,404 | 100.0% |
Occupancy by Ownership by Household Size in Montgomery County
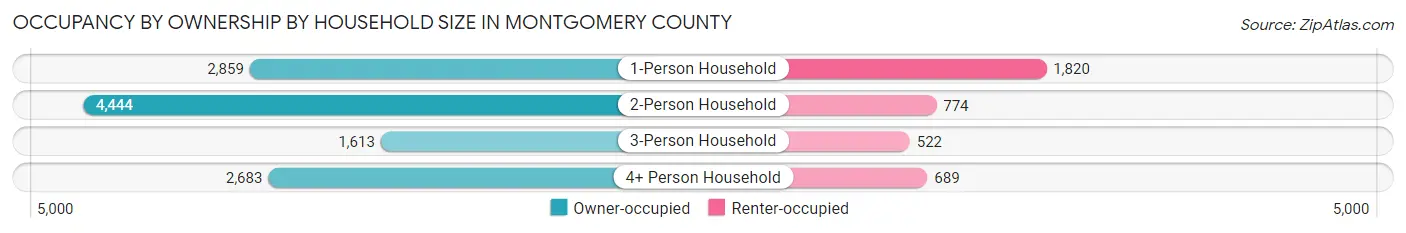
| Household Size | Owner-occupied | Renter-occupied |
| 1-Person Household | 2,859 (61.1%) | 1,820 (38.9%) |
| 2-Person Household | 4,444 (85.2%) | 774 (14.8%) |
| 3-Person Household | 1,613 (75.5%) | 522 (24.4%) |
| 4+ Person Household | 2,683 (79.6%) | 689 (20.4%) |
| Total Housing Units | 11,599 (75.3%) | 3,805 (24.7%) |
Occupancy by Educational Attainment in Montgomery County
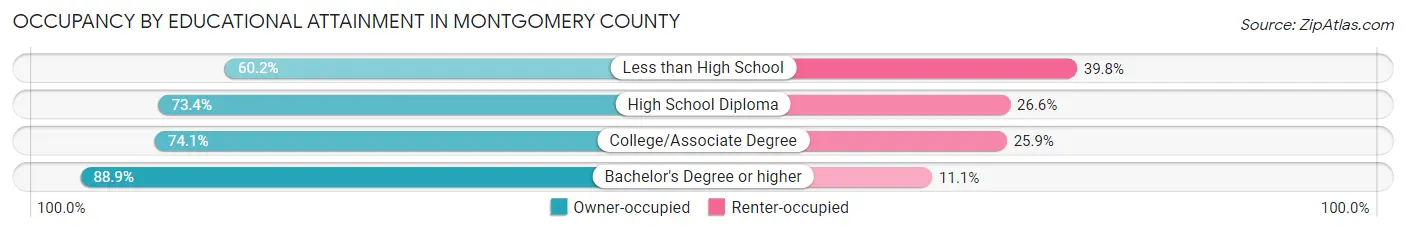
| Household Size | Owner-occupied | Renter-occupied |
| Less than High School | 963 (60.2%) | 636 (39.8%) |
| High School Diploma | 4,778 (73.4%) | 1,728 (26.6%) |
| College/Associate Degree | 3,164 (74.1%) | 1,105 (25.9%) |
| Bachelor's Degree or higher | 2,694 (88.9%) | 336 (11.1%) |
Occupancy by Age of Householder in Montgomery County
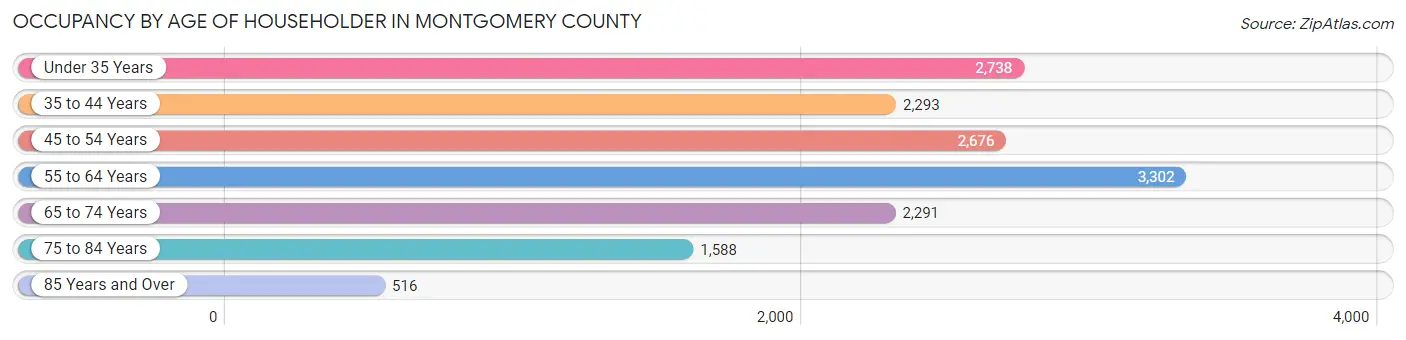
| Age Bracket | # Households | % Households |
| Under 35 Years | 2,738 | 17.8% |
| 35 to 44 Years | 2,293 | 14.9% |
| 45 to 54 Years | 2,676 | 17.4% |
| 55 to 64 Years | 3,302 | 21.4% |
| 65 to 74 Years | 2,291 | 14.9% |
| 75 to 84 Years | 1,588 | 10.3% |
| 85 Years and Over | 516 | 3.4% |
| Total | 15,404 | 100.0% |
Housing Finances in Montgomery County
Median Income by Occupancy in Montgomery County
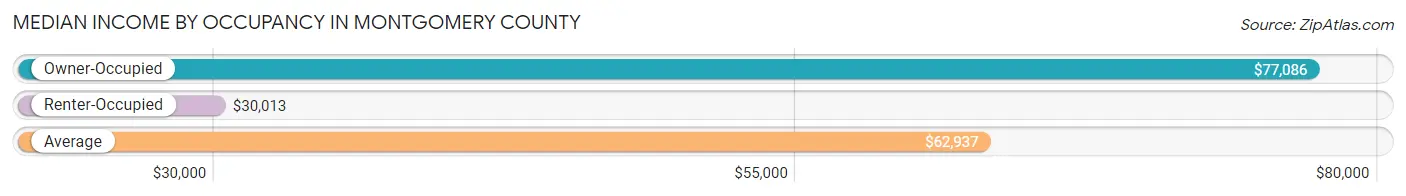
| Occupancy Type | # Households | Median Income |
| Owner-Occupied | 11,599 (75.3%) | $77,086 |
| Renter-Occupied | 3,805 (24.7%) | $30,013 |
| Average | 15,404 (100.0%) | $62,937 |
Occupancy by Householder Income Bracket in Montgomery County

| Income Bracket | Owner-occupied | Renter-occupied |
| Less than $5,000 | 173 (1.5%) | 227 (6.0%) |
| $5,000 to $9,999 | 85 (0.7%) | 76 (2.0%) |
| $10,000 to $14,999 | 199 (1.7%) | 496 (13.0%) |
| $15,000 to $19,999 | 301 (2.6%) | 289 (7.6%) |
| $20,000 to $24,999 | 398 (3.4%) | 401 (10.5%) |
| $25,000 to $34,999 | 768 (6.6%) | 623 (16.4%) |
| $35,000 to $49,999 | 1,531 (13.2%) | 577 (15.2%) |
| $50,000 to $74,999 | 2,231 (19.2%) | 526 (13.8%) |
| $75,000 to $99,999 | 1,673 (14.4%) | 330 (8.7%) |
| $100,000 to $149,999 | 2,671 (23.0%) | 201 (5.3%) |
| $150,000 or more | 1,569 (13.5%) | 59 (1.5%) |
| Total | 11,599 (100.0%) | 3,805 (100.0%) |
Monthly Housing Cost Tiers in Montgomery County
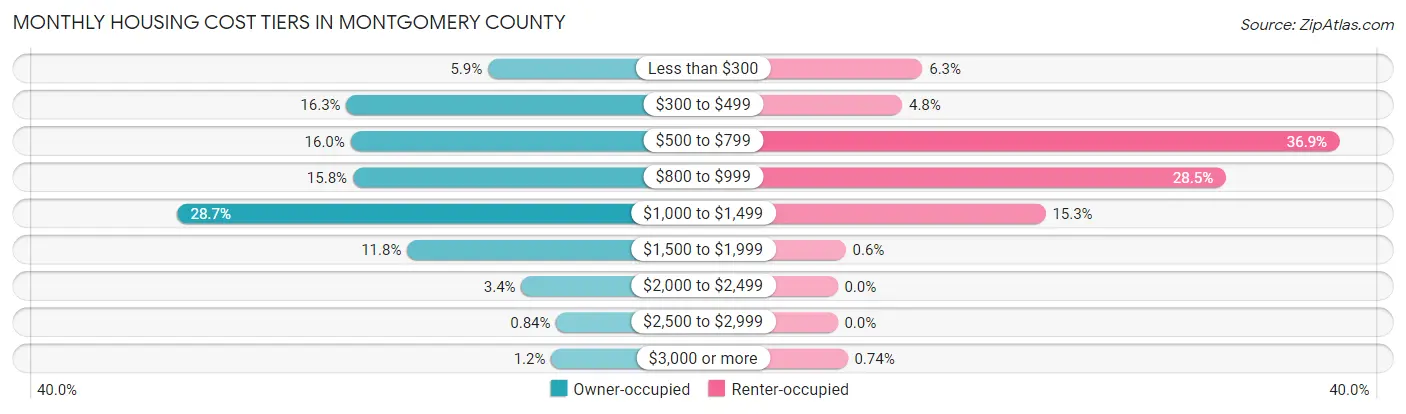
| Monthly Cost | Owner-occupied | Renter-occupied |
| Less than $300 | 681 (5.9%) | 238 (6.2%) |
| $300 to $499 | 1,891 (16.3%) | 181 (4.8%) |
| $500 to $799 | 1,855 (16.0%) | 1,405 (36.9%) |
| $800 to $999 | 1,835 (15.8%) | 1,086 (28.5%) |
| $1,000 to $1,499 | 3,332 (28.7%) | 583 (15.3%) |
| $1,500 to $1,999 | 1,371 (11.8%) | 23 (0.6%) |
| $2,000 to $2,499 | 396 (3.4%) | 0 (0.0%) |
| $2,500 to $2,999 | 98 (0.8%) | 0 (0.0%) |
| $3,000 or more | 140 (1.2%) | 28 (0.7%) |
| Total | 11,599 (100.0%) | 3,805 (100.0%) |
Physical Housing Characteristics in Montgomery County
Housing Structures in Montgomery County
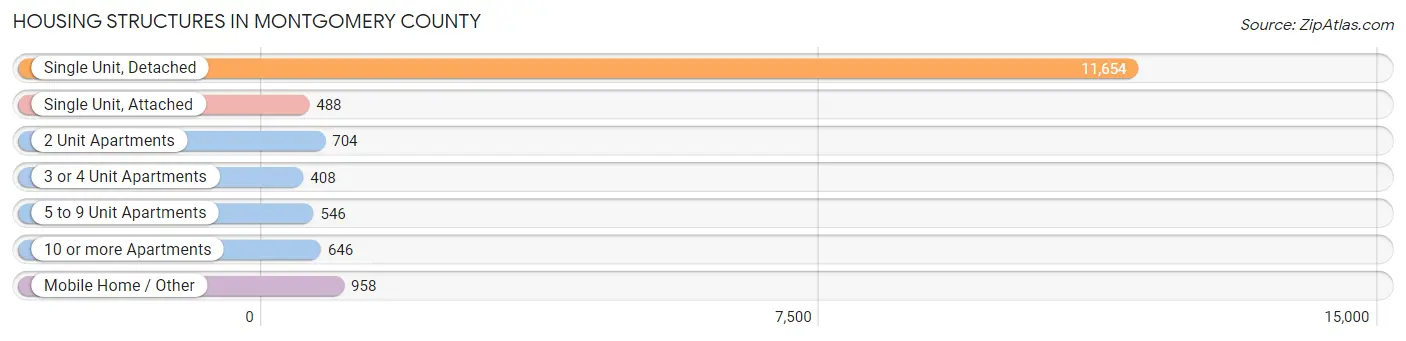
| Structure Type | # Housing Units | % Housing Units |
| Single Unit, Detached | 11,654 | 75.7% |
| Single Unit, Attached | 488 | 3.2% |
| 2 Unit Apartments | 704 | 4.6% |
| 3 or 4 Unit Apartments | 408 | 2.6% |
| 5 to 9 Unit Apartments | 546 | 3.5% |
| 10 or more Apartments | 646 | 4.2% |
| Mobile Home / Other | 958 | 6.2% |
| Total | 15,404 | 100.0% |
Housing Structures by Occupancy in Montgomery County
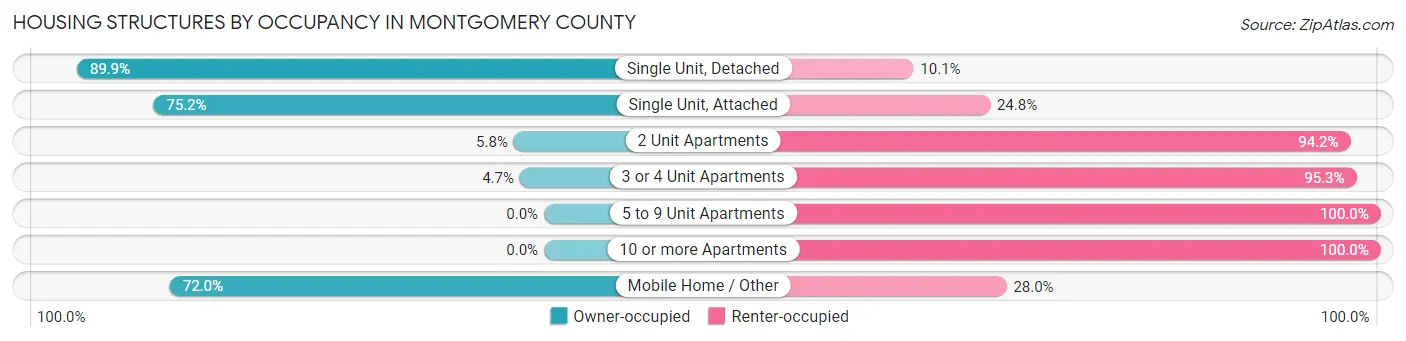
| Structure Type | Owner-occupied | Renter-occupied |
| Single Unit, Detached | 10,482 (89.9%) | 1,172 (10.1%) |
| Single Unit, Attached | 367 (75.2%) | 121 (24.8%) |
| 2 Unit Apartments | 41 (5.8%) | 663 (94.2%) |
| 3 or 4 Unit Apartments | 19 (4.7%) | 389 (95.3%) |
| 5 to 9 Unit Apartments | 0 (0.0%) | 546 (100.0%) |
| 10 or more Apartments | 0 (0.0%) | 646 (100.0%) |
| Mobile Home / Other | 690 (72.0%) | 268 (28.0%) |
| Total | 11,599 (75.3%) | 3,805 (24.7%) |
Housing Structures by Number of Rooms in Montgomery County
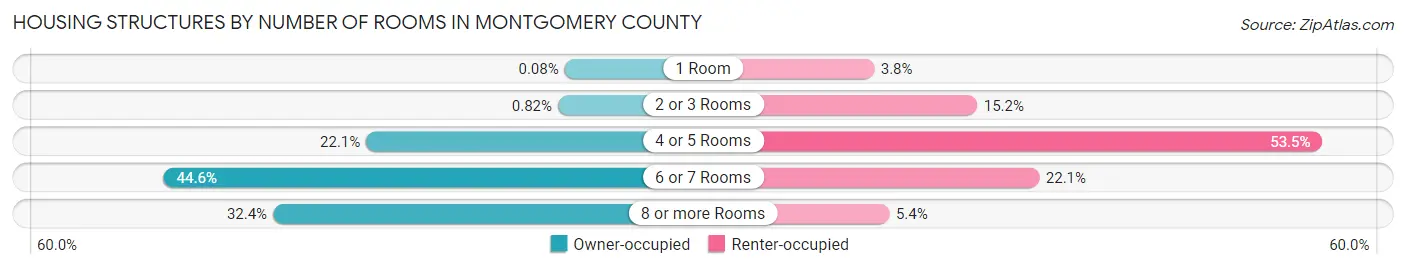
| Number of Rooms | Owner-occupied | Renter-occupied |
| 1 Room | 9 (0.1%) | 143 (3.8%) |
| 2 or 3 Rooms | 95 (0.8%) | 578 (15.2%) |
| 4 or 5 Rooms | 2,563 (22.1%) | 2,037 (53.5%) |
| 6 or 7 Rooms | 5,169 (44.6%) | 840 (22.1%) |
| 8 or more Rooms | 3,763 (32.4%) | 207 (5.4%) |
| Total | 11,599 (100.0%) | 3,805 (100.0%) |
Housing Structure by Heating Type in Montgomery County
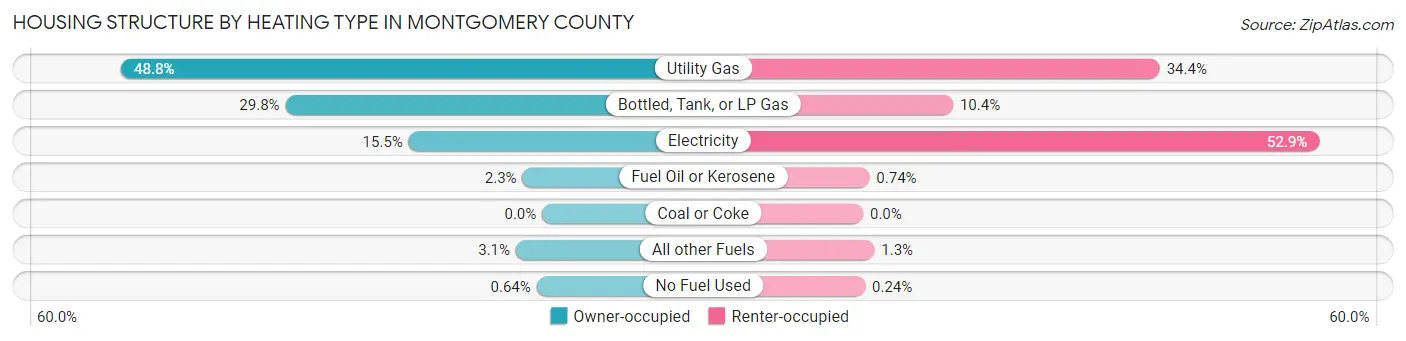
| Heating Type | Owner-occupied | Renter-occupied |
| Utility Gas | 5,660 (48.8%) | 1,309 (34.4%) |
| Bottled, Tank, or LP Gas | 3,452 (29.8%) | 397 (10.4%) |
| Electricity | 1,794 (15.5%) | 2,012 (52.9%) |
| Fuel Oil or Kerosene | 265 (2.3%) | 28 (0.7%) |
| Coal or Coke | 0 (0.0%) | 0 (0.0%) |
| All other Fuels | 354 (3.0%) | 50 (1.3%) |
| No Fuel Used | 74 (0.6%) | 9 (0.2%) |
| Total | 11,599 (100.0%) | 3,805 (100.0%) |
Household Vehicle Usage in Montgomery County

| Vehicles per Household | Owner-occupied | Renter-occupied |
| No Vehicle | 315 (2.7%) | 583 (15.3%) |
| 1 Vehicle | 2,548 (22.0%) | 1,941 (51.0%) |
| 2 Vehicles | 4,611 (39.8%) | 839 (22.1%) |
| 3 or more Vehicles | 4,125 (35.6%) | 442 (11.6%) |
| Total | 11,599 (100.0%) | 3,805 (100.0%) |
Real Estate & Mortgages in Montgomery County
Real Estate and Mortgage Overview in Montgomery County
| Characteristic | Without Mortgage | With Mortgage |
| Housing Units | 3,790 | 7,809 |
| Median Property Value | $136,600 | $162,700 |
| Median Household Income | $52,647 | $1,263 |
| Monthly Housing Costs | $434 | $113 |
| Real Estate Taxes | $835 | $82 |
Property Value by Mortgage Status in Montgomery County
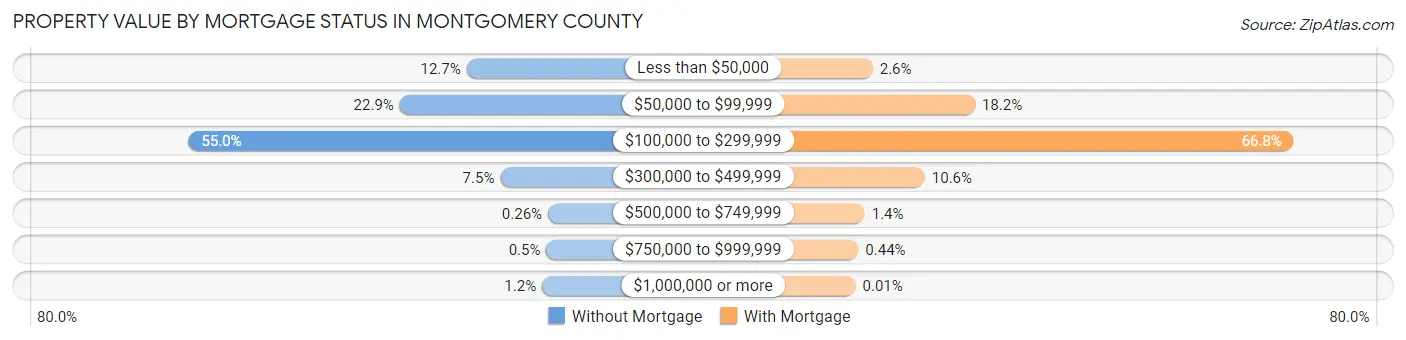
| Property Value | Without Mortgage | With Mortgage |
| Less than $50,000 | 480 (12.7%) | 205 (2.6%) |
| $50,000 to $99,999 | 866 (22.9%) | 1,421 (18.2%) |
| $100,000 to $299,999 | 2,086 (55.0%) | 5,213 (66.8%) |
| $300,000 to $499,999 | 285 (7.5%) | 825 (10.6%) |
| $500,000 to $749,999 | 10 (0.3%) | 110 (1.4%) |
| $750,000 to $999,999 | 19 (0.5%) | 34 (0.4%) |
| $1,000,000 or more | 44 (1.2%) | 1 (0.0%) |
| Total | 3,790 (100.0%) | 7,809 (100.0%) |
Household Income by Mortgage Status in Montgomery County
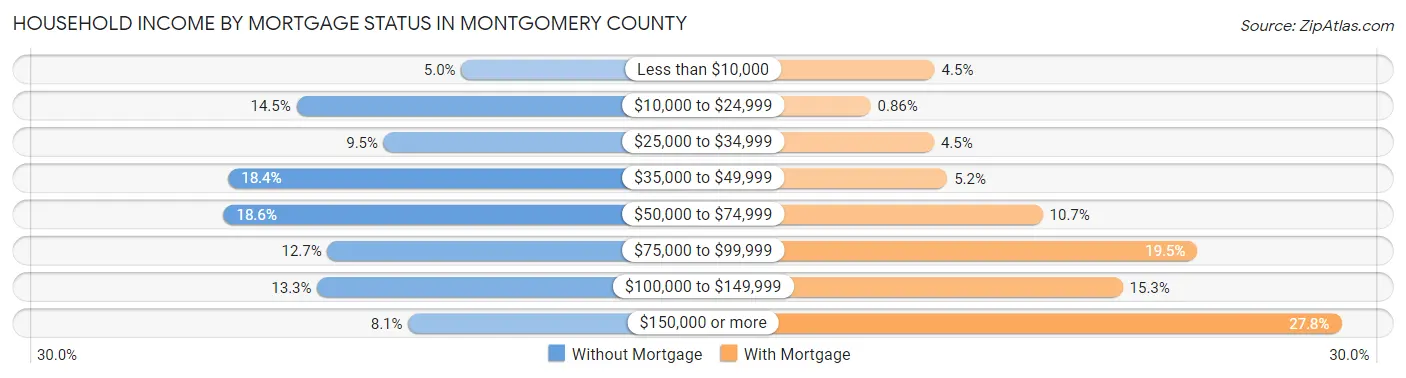
| Household Income | Without Mortgage | With Mortgage |
| Less than $10,000 | 191 (5.0%) | 353 (4.5%) |
| $10,000 to $24,999 | 548 (14.5%) | 67 (0.9%) |
| $25,000 to $34,999 | 359 (9.5%) | 350 (4.5%) |
| $35,000 to $49,999 | 696 (18.4%) | 409 (5.2%) |
| $50,000 to $74,999 | 706 (18.6%) | 835 (10.7%) |
| $75,000 to $99,999 | 481 (12.7%) | 1,525 (19.5%) |
| $100,000 to $149,999 | 503 (13.3%) | 1,192 (15.3%) |
| $150,000 or more | 306 (8.1%) | 2,168 (27.8%) |
| Total | 3,790 (100.0%) | 7,809 (100.0%) |
Property Value to Household Income Ratio in Montgomery County
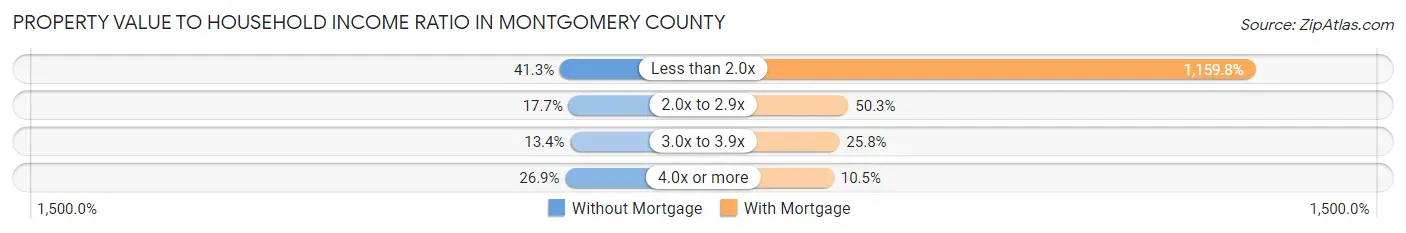
| Value-to-Income Ratio | Without Mortgage | With Mortgage |
| Less than 2.0x | 1,566 (41.3%) | 90,567 (1,159.8%) |
| 2.0x to 2.9x | 669 (17.6%) | 3,925 (50.3%) |
| 3.0x to 3.9x | 509 (13.4%) | 2,017 (25.8%) |
| 4.0x or more | 1,020 (26.9%) | 820 (10.5%) |
| Total | 3,790 (100.0%) | 7,809 (100.0%) |
Real Estate Taxes by Mortgage Status in Montgomery County
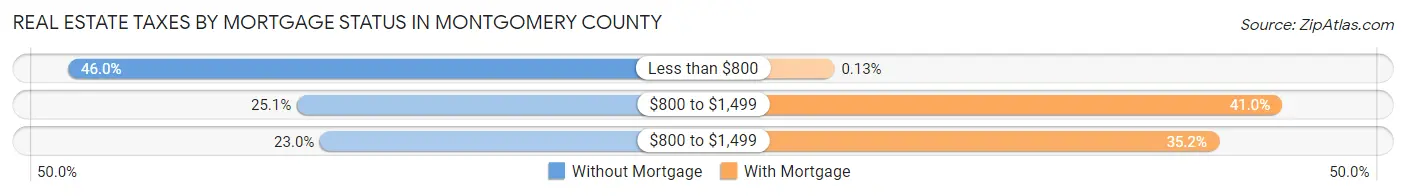
| Property Taxes | Without Mortgage | With Mortgage |
| Less than $800 | 1,744 (46.0%) | 10 (0.1%) |
| $800 to $1,499 | 952 (25.1%) | 3,202 (41.0%) |
| $800 to $1,499 | 872 (23.0%) | 2,750 (35.2%) |
| Total | 3,790 (100.0%) | 7,809 (100.0%) |
Health & Disability in Montgomery County
Health Insurance Coverage by Age in Montgomery County
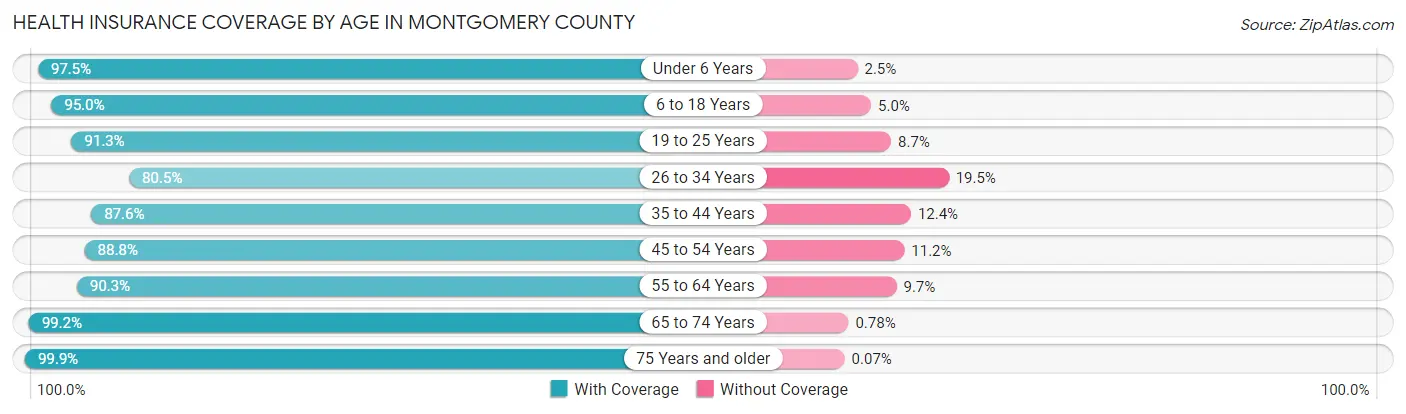
| Age Bracket | With Coverage | Without Coverage |
| Under 6 Years | 2,682 (97.5%) | 68 (2.5%) |
| 6 to 18 Years | 6,222 (95.0%) | 327 (5.0%) |
| 19 to 25 Years | 2,928 (91.3%) | 280 (8.7%) |
| 26 to 34 Years | 3,246 (80.5%) | 785 (19.5%) |
| 35 to 44 Years | 3,636 (87.6%) | 516 (12.4%) |
| 45 to 54 Years | 4,178 (88.8%) | 527 (11.2%) |
| 55 to 64 Years | 4,903 (90.3%) | 529 (9.7%) |
| 65 to 74 Years | 3,804 (99.2%) | 30 (0.8%) |
| 75 Years and older | 2,824 (99.9%) | 2 (0.1%) |
| Total | 34,423 (91.8%) | 3,064 (8.2%) |
Health Insurance Coverage by Citizenship Status in Montgomery County
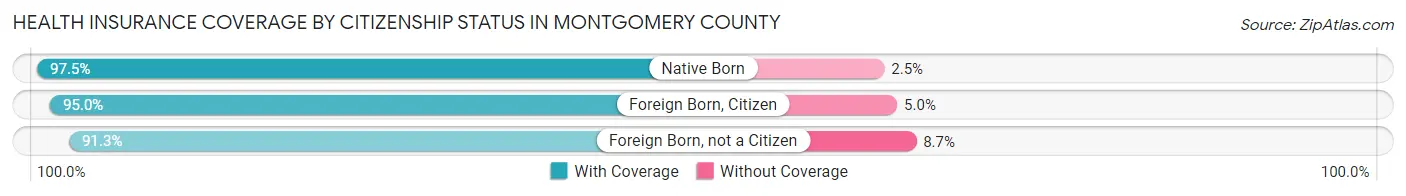
| Citizenship Status | With Coverage | Without Coverage |
| Native Born | 2,682 (97.5%) | 68 (2.5%) |
| Foreign Born, Citizen | 6,222 (95.0%) | 327 (5.0%) |
| Foreign Born, not a Citizen | 2,928 (91.3%) | 280 (8.7%) |
Health Insurance Coverage by Household Income in Montgomery County
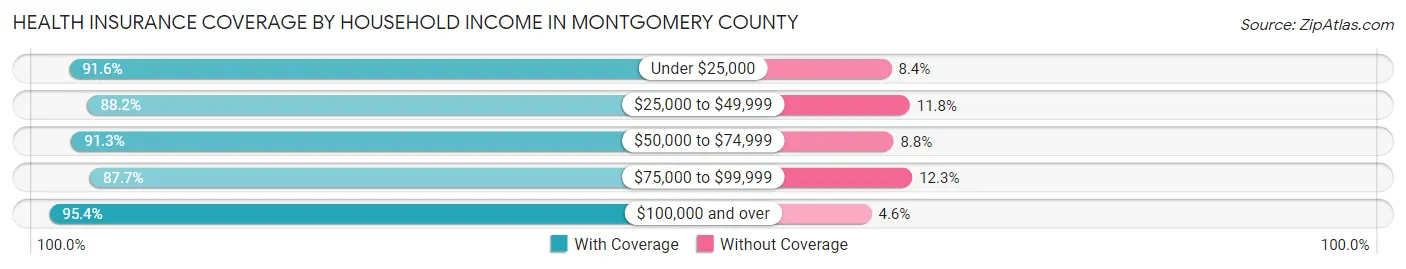
| Household Income | With Coverage | Without Coverage |
| Under $25,000 | 3,644 (91.6%) | 333 (8.4%) |
| $25,000 to $49,999 | 6,274 (88.2%) | 840 (11.8%) |
| $50,000 to $74,999 | 5,650 (91.2%) | 542 (8.7%) |
| $75,000 to $99,999 | 5,036 (87.7%) | 704 (12.3%) |
| $100,000 and over | 13,106 (95.4%) | 636 (4.6%) |
Public vs Private Health Insurance Coverage by Age in Montgomery County

| Age Bracket | Public Insurance | Private Insurance |
| Under 6 | 1,187 (43.2%) | 1,708 (62.1%) |
| 6 to 18 Years | 2,095 (32.0%) | 4,400 (67.2%) |
| 19 to 25 Years | 380 (11.8%) | 2,615 (81.5%) |
| 25 to 34 Years | 684 (17.0%) | 2,673 (66.3%) |
| 35 to 44 Years | 916 (22.1%) | 2,820 (67.9%) |
| 45 to 54 Years | 492 (10.5%) | 3,841 (81.6%) |
| 55 to 64 Years | 1,100 (20.3%) | 4,049 (74.5%) |
| 65 to 74 Years | 3,694 (96.4%) | 2,408 (62.8%) |
| 75 Years and over | 2,821 (99.8%) | 1,960 (69.4%) |
| Total | 13,369 (35.7%) | 26,474 (70.6%) |
Disability Status by Sex by Age in Montgomery County
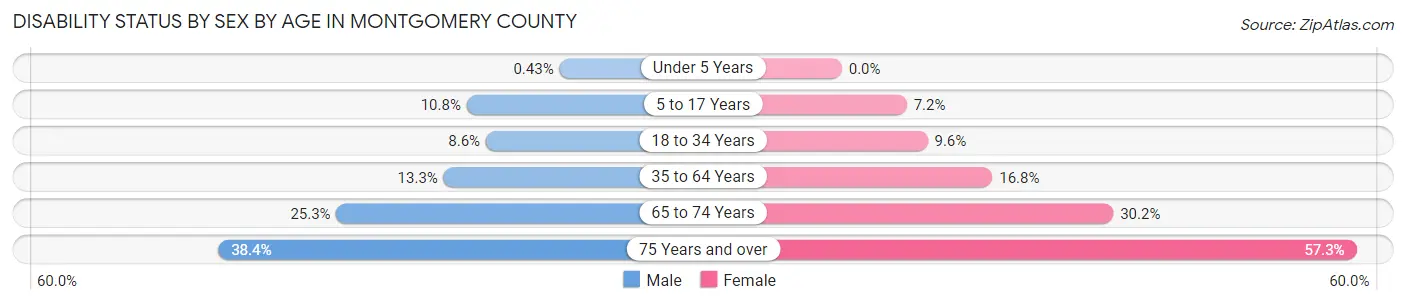
| Age Bracket | Male | Female |
| Under 5 Years | 5 (0.4%) | 0 (0.0%) |
| 5 to 17 Years | 361 (10.8%) | 226 (7.2%) |
| 18 to 34 Years | 373 (8.6%) | 337 (9.6%) |
| 35 to 64 Years | 977 (13.3%) | 1,166 (16.8%) |
| 65 to 74 Years | 469 (25.3%) | 598 (30.2%) |
| 75 Years and over | 455 (38.4%) | 941 (57.3%) |
Disability Class by Sex by Age in Montgomery County
Disability Class: Hearing Difficulty
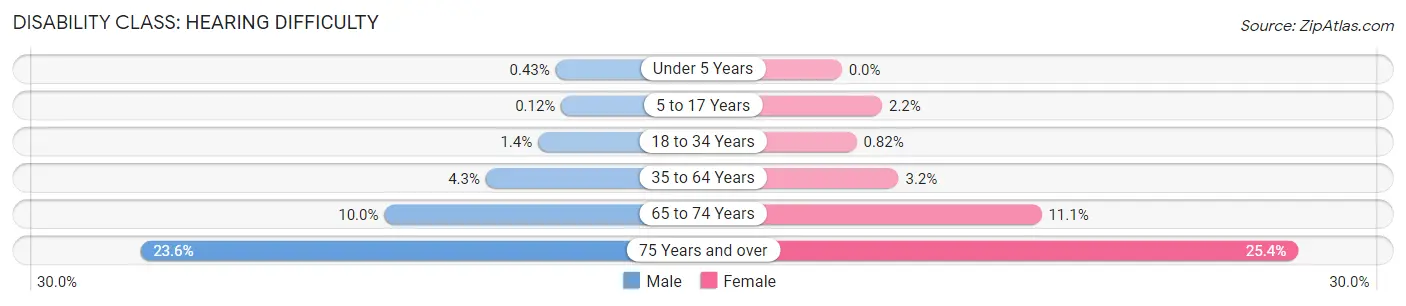
| Age Bracket | Male | Female |
| Under 5 Years | 5 (0.4%) | 0 (0.0%) |
| 5 to 17 Years | 4 (0.1%) | 70 (2.2%) |
| 18 to 34 Years | 61 (1.4%) | 29 (0.8%) |
| 35 to 64 Years | 317 (4.3%) | 220 (3.2%) |
| 65 to 74 Years | 185 (10.0%) | 220 (11.1%) |
| 75 Years and over | 279 (23.6%) | 417 (25.4%) |
Disability Class: Vision Difficulty
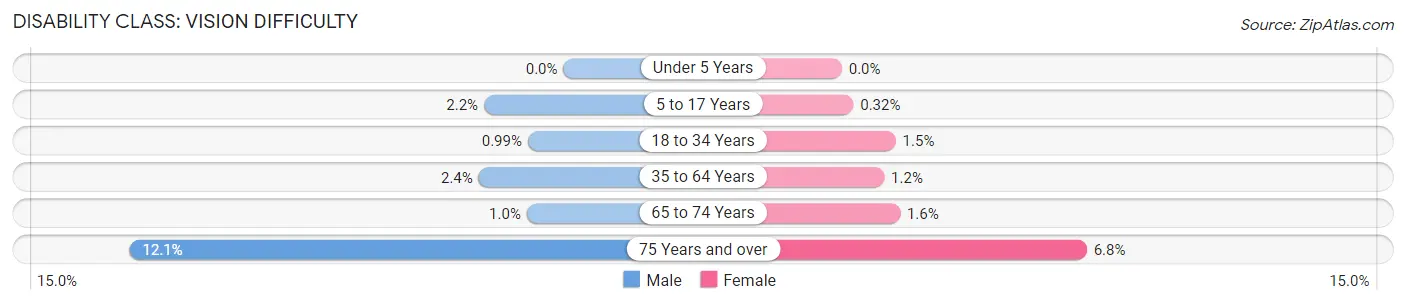
| Age Bracket | Male | Female |
| Under 5 Years | 0 (0.0%) | 0 (0.0%) |
| 5 to 17 Years | 74 (2.2%) | 10 (0.3%) |
| 18 to 34 Years | 43 (1.0%) | 53 (1.5%) |
| 35 to 64 Years | 173 (2.4%) | 82 (1.2%) |
| 65 to 74 Years | 19 (1.0%) | 32 (1.6%) |
| 75 Years and over | 143 (12.1%) | 112 (6.8%) |
Disability Class: Cognitive Difficulty
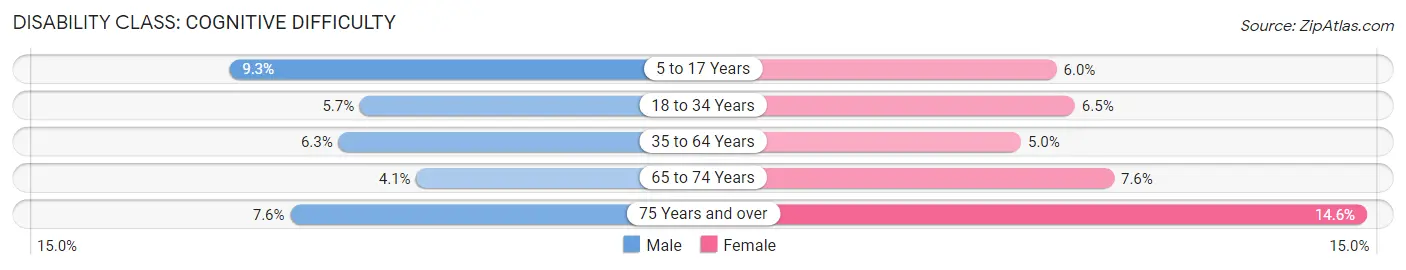
| Age Bracket | Male | Female |
| 5 to 17 Years | 312 (9.3%) | 187 (6.0%) |
| 18 to 34 Years | 245 (5.7%) | 229 (6.5%) |
| 35 to 64 Years | 459 (6.3%) | 347 (5.0%) |
| 65 to 74 Years | 76 (4.1%) | 150 (7.6%) |
| 75 Years and over | 90 (7.6%) | 240 (14.6%) |
Disability Class: Ambulatory Difficulty
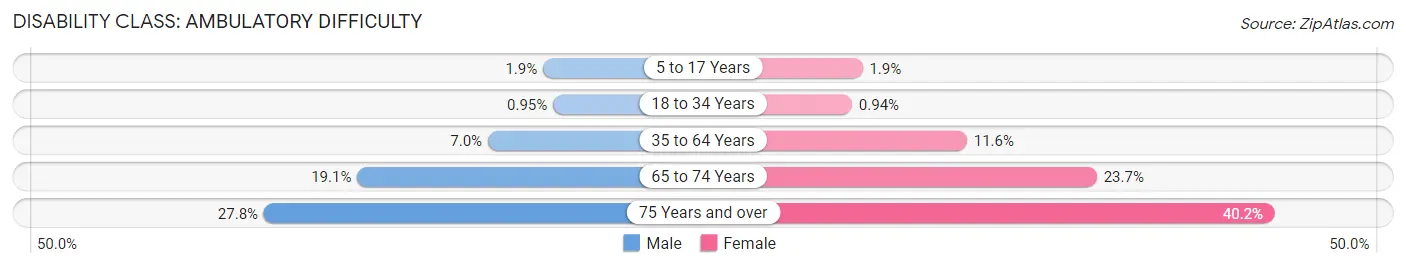
| Age Bracket | Male | Female |
| 5 to 17 Years | 63 (1.9%) | 60 (1.9%) |
| 18 to 34 Years | 41 (0.9%) | 33 (0.9%) |
| 35 to 64 Years | 513 (7.0%) | 807 (11.6%) |
| 65 to 74 Years | 355 (19.1%) | 468 (23.7%) |
| 75 Years and over | 329 (27.8%) | 660 (40.2%) |
Disability Class: Self-Care Difficulty
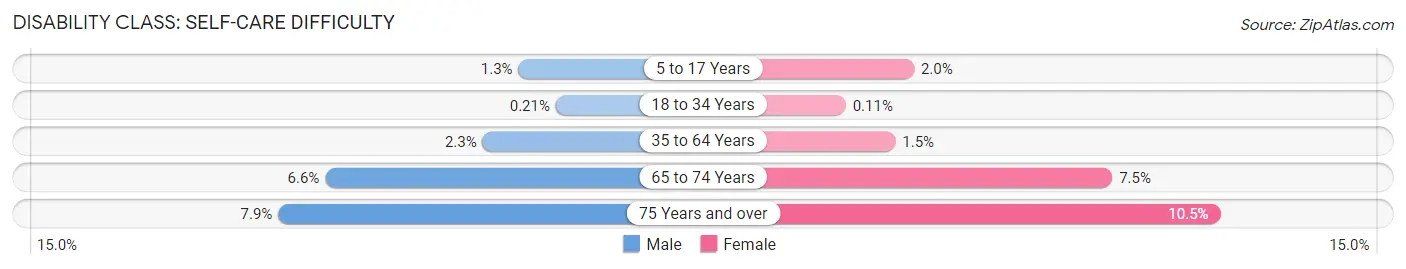
| Age Bracket | Male | Female |
| 5 to 17 Years | 42 (1.3%) | 63 (2.0%) |
| 18 to 34 Years | 9 (0.2%) | 4 (0.1%) |
| 35 to 64 Years | 165 (2.2%) | 104 (1.5%) |
| 65 to 74 Years | 123 (6.6%) | 149 (7.5%) |
| 75 Years and over | 94 (7.9%) | 173 (10.5%) |
Technology Access in Montgomery County
Computing Device Access in Montgomery County
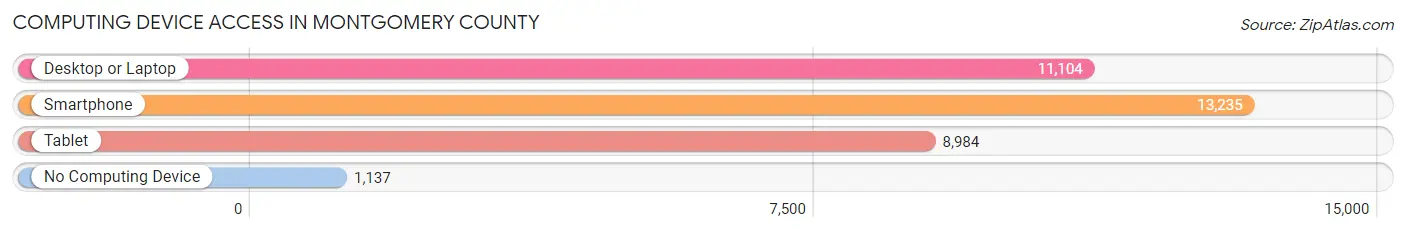
| Device Type | # Households | % Households |
| Desktop or Laptop | 11,104 | 72.1% |
| Smartphone | 13,235 | 85.9% |
| Tablet | 8,984 | 58.3% |
| No Computing Device | 1,137 | 7.4% |
| Total | 15,404 | 100.0% |
Internet Access in Montgomery County
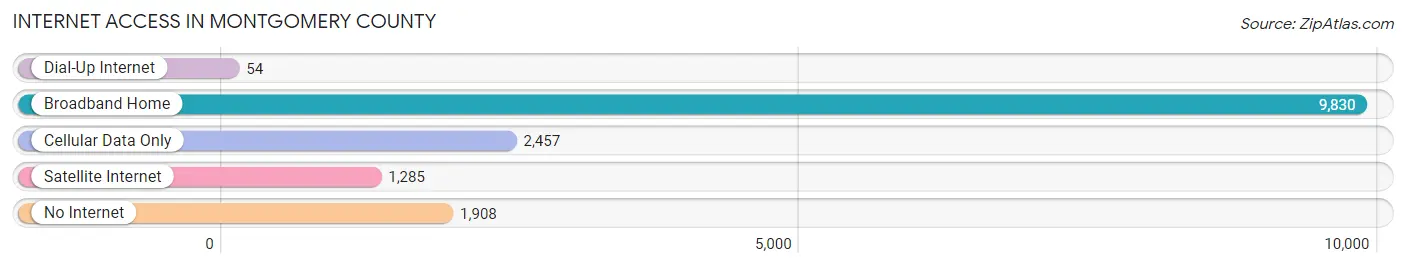
| Internet Type | # Households | % Households |
| Dial-Up Internet | 54 | 0.4% |
| Broadband Home | 9,830 | 63.8% |
| Cellular Data Only | 2,457 | 16.0% |
| Satellite Internet | 1,285 | 8.3% |
| No Internet | 1,908 | 12.4% |
| Total | 15,404 | 100.0% |
Montgomery County Summary
Montgomery County, Indiana is located in the west-central part of the state, and is part of the Wabash Valley region. It is bordered by Fountain County to the north, Parke County to the east, Putnam County to the south, and Vermillion County to the west. The county seat is Crawfordsville, and the county is named for Richard Montgomery, an American Revolutionary War general.
Geography
Montgomery County covers an area of 437 square miles, of which 434 square miles is land and 3 square miles is water. The county is located in the Central Till Plains region of Indiana, and is characterized by rolling hills and flat plains. The Wabash River forms the western border of the county, and the Sugar Creek flows through the county from north to south. The highest point in the county is located in the northwest corner, at an elevation of 890 feet.
The county is home to several state parks and recreational areas, including Shades State Park, Turkey Run State Park, and Raccoon Lake State Recreation Area. The county also contains several wildlife areas, including the Big Walnut Wildlife Area, the Sugar Creek Wildlife Area, and the Wabash River Wildlife Area.
Demographics
As of the 2010 census, Montgomery County had a population of 38,124. The racial makeup of the county was 95.3% White, 1.2% African American, 0.3% Native American, 0.7% Asian, 0.1% Pacific Islander, 1.2% from other races, and 1.2% from two or more races. Hispanic or Latino of any race were 3.2% of the population.
The median household income in the county was $45,945, and the median family income was $54,945. The per capita income was $22,845. About 10.2% of the population was below the poverty line.
Economy
The economy of Montgomery County is largely based on agriculture and manufacturing. The county is home to several large agricultural operations, including the Wabash Valley Produce Company, the Montgomery County Pork Producers, and the Montgomery County Dairy Farmers. The county is also home to several large manufacturing companies, including the Crawfordsville Foundry, the Crawfordsville Paper Mill, and the Crawfordsville Steel Mill.
The county is also home to several educational institutions, including Wabash College, Ivy Tech Community College, and the Crawfordsville Public Schools. The county is also home to several healthcare facilities, including the Montgomery County Hospital, the Crawfordsville Medical Center, and the Crawfordsville Rehabilitation Center.
History
Montgomery County was formed in 1822 from parts of Parke and Fountain counties. The county was named for Richard Montgomery, an American Revolutionary War general. The county seat was originally located in New Market, but was moved to Crawfordsville in 1824.
The county was largely agricultural in the 19th century, and the county's economy was largely based on corn, wheat, and livestock. The county was also home to several manufacturing companies, including the Crawfordsville Foundry, the Crawfordsville Paper Mill, and the Crawfordsville Steel Mill.
In the 20th century, the county's economy shifted to focus more on manufacturing and education. The county is home to several educational institutions, including Wabash College, Ivy Tech Community College, and the Crawfordsville Public Schools. The county is also home to several healthcare facilities, including the Montgomery County Hospital, the Crawfordsville Medical Center, and the Crawfordsville Rehabilitation Center.
Common Questions
What is the Total Population of Montgomery County?
Total Population of Montgomery County is 38,018.
What is the Total Male Population of Montgomery County?
Total Male Population of Montgomery County is 19,455.
What is the Total Female Population of Montgomery County?
Total Female Population of Montgomery County is 18,563.
What is the Ratio of Males per 100 Females in Montgomery County?
There are 104.81 Males per 100 Females in Montgomery County.
What is the Ratio of Females per 100 Males in Montgomery County?
There are 95.42 Females per 100 Males in Montgomery County.
What is the Median Population Age in Montgomery County?
Median Population Age in Montgomery County is 40.4 Years.
What is the Average Family Size in Montgomery County
Average Family Size in Montgomery County is 3.0 People.
What is the Average Household Size in Montgomery County
Average Household Size in Montgomery County is 2.4 People.
What is Per Capita Income in Montgomery County?
Per Capita income in Montgomery County is $32,975.
What is the Median Family Income in Montgomery County?
Median Family Income in Montgomery County is $81,676.
What is the Median Household income in Montgomery County?
Median Household Income in Montgomery County is $62,937.
What is Income or Wage Gap in Montgomery County?
Income or Wage Gap in Montgomery County is 21.1%.
Women in Montgomery County earn 78.9 cents for every dollar earned by a man.
What is Family Income Deficit in Montgomery County?
Family Income Deficit in Montgomery County is $9,944.
Families that are below poverty line in Montgomery County earn $9,944 less on average than the poverty threshold level.
What is Inequality or Gini Index in Montgomery County?
Inequality or Gini Index in Montgomery County is 0.43.
How Large is the Labor Force in Montgomery County?
There are 19,450 People in the Labor Forcein in Montgomery County.
What is the Percentage of People in the Labor Force in Montgomery County?
63.9% of People are in the Labor Force in Montgomery County.
What is the Unemployment Rate in Montgomery County?
Unemployment Rate in Montgomery County is 4.0%.