Marshall County, IN
Marshall County Map
Marshall County Overview
46,208
TOTAL POPULATION
23,370
MALE POPULATION
22,838
FEMALE POPULATION
102.33
MALES / 100 FEMALES
97.72
FEMALES / 100 MALES
39.9
MEDIAN AGE
3.3
AVG FAMILY SIZE
2.7
AVG HOUSEHOLD SIZE
$32,218
PER CAPITA INCOME
$82,926
AVG FAMILY INCOME
$66,016
AVG HOUSEHOLD INCOME
34.1%
WAGE / INCOME GAP [ % ]
65.9¢/ $1
WAGE / INCOME GAP [ $ ]
$11,118
FAMILY INCOME DEFICIT
0.43
INEQUALITY / GINI INDEX
22,425
LABOR FORCE [ PEOPLE ]
62.0%
PERCENT IN LABOR FORCE
3.0%
UNEMPLOYMENT RATE
Marshall County Area Codes
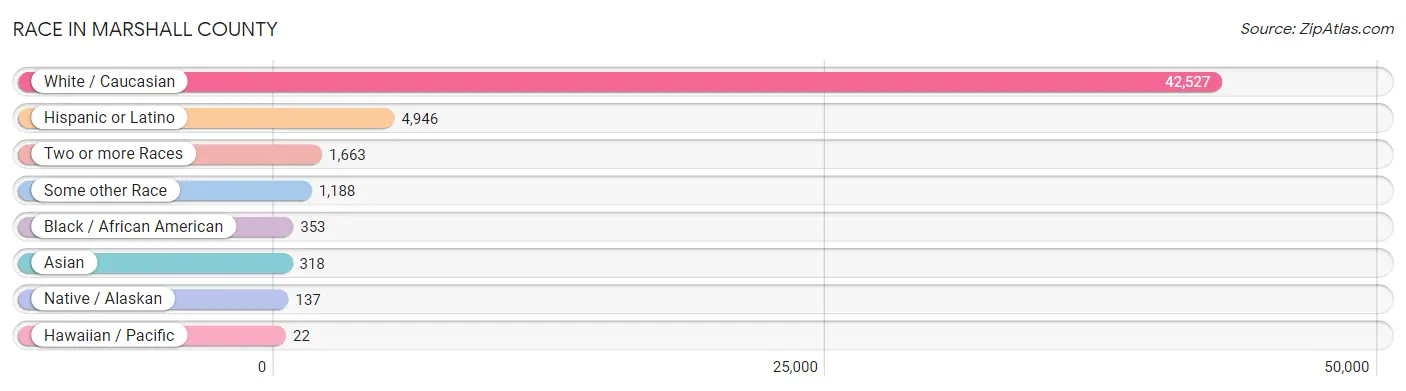
Race in Marshall County
The most populous races in Marshall County are White / Caucasian (42,527 | 92.0%), Hispanic or Latino (4,946 | 10.7%), and Two or more Races (1,663 | 3.6%).
| Race | # Population | % Population |
| Asian | 318 | 0.7% |
| Black / African American | 353 | 0.8% |
| Hawaiian / Pacific | 22 | 0.1% |
| Hispanic or Latino | 4,946 | 10.7% |
| Native / Alaskan | 137 | 0.3% |
| White / Caucasian | 42,527 | 92.0% |
| Two or more Races | 1,663 | 3.6% |
| Some other Race | 1,188 | 2.6% |
| Total | 46,208 | 100.0% |
Ancestry in Marshall County
The most populous ancestries reported in Marshall County are German (10,108 | 21.9%), English (3,912 | 8.5%), Mexican (3,777 | 8.2%), Irish (3,674 | 8.0%), and American (3,405 | 7.4%), together accounting for 53.8% of all Marshall County residents.

| Ancestry | # Population | % Population |
| African | 22 | 0.1% |
| American | 3,405 | 7.4% |
| Apache | 30 | 0.1% |
| Arab | 47 | 0.1% |
| Armenian | 35 | 0.1% |
| Austrian | 88 | 0.2% |
| Belgian | 54 | 0.1% |
| Bhutanese | 23 | 0.1% |
| Blackfeet | 7 | 0.0% |
| British | 81 | 0.2% |
| Bulgarian | 33 | 0.1% |
| Burmese | 42 | 0.1% |
| Cajun | 4 | 0.0% |
| Canadian | 47 | 0.1% |
| Celtic | 14 | 0.0% |
| Central American | 837 | 1.8% |
| Central American Indian | 145 | 0.3% |
| Cherokee | 80 | 0.2% |
| Colombian | 55 | 0.1% |
| Cree | 18 | 0.0% |
| Croatian | 64 | 0.1% |
| Cuban | 12 | 0.0% |
| Czech | 29 | 0.1% |
| Danish | 56 | 0.1% |
| Dutch | 742 | 1.6% |
| Dutch West Indian | 13 | 0.0% |
| Eastern European | 25 | 0.1% |
| English | 3,912 | 8.5% |
| Estonian | 8 | 0.0% |
| European | 705 | 1.5% |
| Finnish | 31 | 0.1% |
| French | 617 | 1.3% |
| French Canadian | 56 | 0.1% |
| German | 10,108 | 21.9% |
| Greek | 27 | 0.1% |
| Guatemalan | 31 | 0.1% |
| Honduran | 806 | 1.7% |
| Hungarian | 286 | 0.6% |
| Indian (Asian) | 161 | 0.4% |
| Irish | 3,674 | 8.0% |
| Italian | 944 | 2.0% |
| Korean | 55 | 0.1% |
| Lebanese | 39 | 0.1% |
| Lithuanian | 110 | 0.2% |
| Mexican | 3,777 | 8.2% |
| Mexican American Indian | 68 | 0.2% |
| Navajo | 15 | 0.0% |
| Northern European | 17 | 0.0% |
| Norwegian | 245 | 0.5% |
| Pakistani | 18 | 0.0% |
| Paraguayan | 19 | 0.0% |
| Pennsylvania German | 355 | 0.8% |
| Peruvian | 18 | 0.0% |
| Polish | 1,416 | 3.1% |
| Puerto Rican | 88 | 0.2% |
| Romanian | 33 | 0.1% |
| Russian | 175 | 0.4% |
| Scandinavian | 53 | 0.1% |
| Scotch-Irish | 251 | 0.5% |
| Scottish | 767 | 1.7% |
| Serbian | 4 | 0.0% |
| Slavic | 14 | 0.0% |
| Slovak | 45 | 0.1% |
| Slovene | 8 | 0.0% |
| South American | 92 | 0.2% |
| Spaniard | 30 | 0.1% |
| Spanish | 4 | 0.0% |
| Sri Lankan | 36 | 0.1% |
| Subsaharan African | 22 | 0.1% |
| Swedish | 329 | 0.7% |
| Swiss | 397 | 0.9% |
| Thai | 31 | 0.1% |
| Turkish | 1 | 0.0% |
| Ukrainian | 19 | 0.0% |
| Welsh | 118 | 0.3% |
| West Indian | 2 | 0.0% | View All 76 Rows |
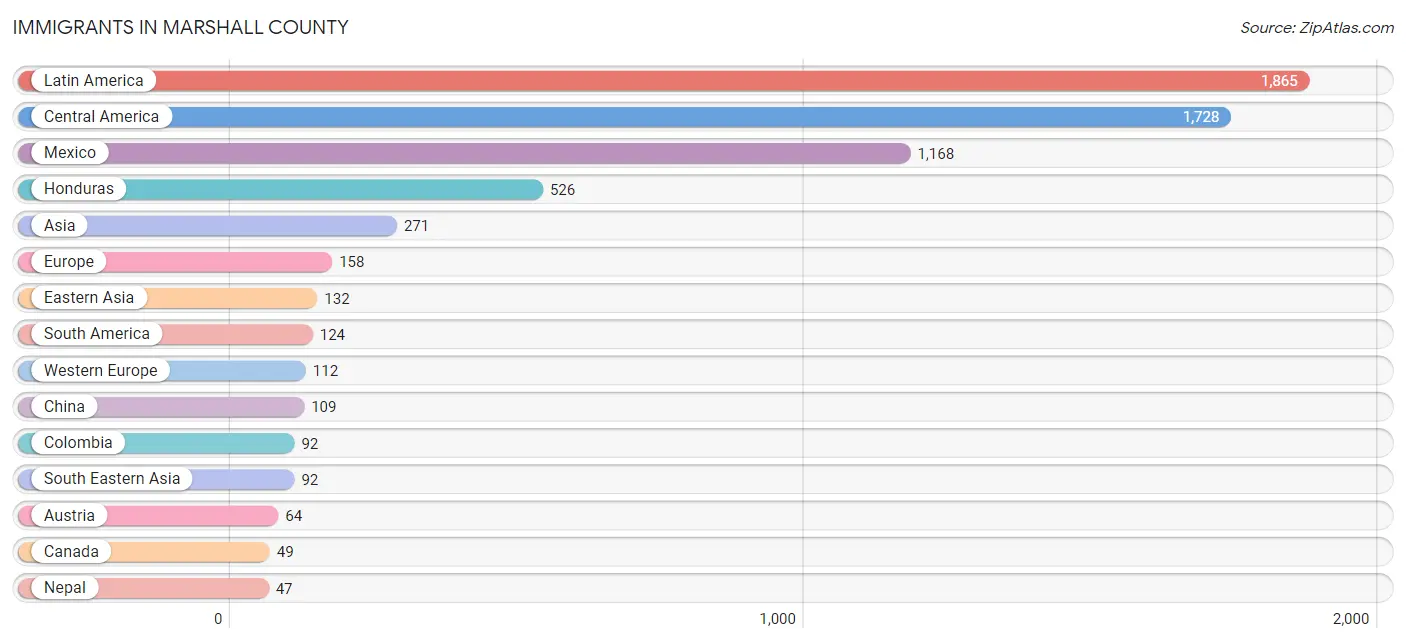
Immigrants in Marshall County
The most numerous immigrant groups reported in Marshall County came from Latin America (1,865 | 4.0%), Central America (1,728 | 3.7%), Mexico (1,168 | 2.5%), Honduras (526 | 1.1%), and Asia (271 | 0.6%), together accounting for 12.0% of all Marshall County residents.
| Immigration Origin | # Population | % Population |
| Asia | 271 | 0.6% |
| Austria | 64 | 0.1% |
| Barbados | 13 | 0.0% |
| Brazil | 11 | 0.0% |
| Canada | 49 | 0.1% |
| Caribbean | 13 | 0.0% |
| Central America | 1,728 | 3.7% |
| China | 109 | 0.2% |
| Colombia | 92 | 0.2% |
| Croatia | 2 | 0.0% |
| Eastern Asia | 132 | 0.3% |
| Eastern Europe | 46 | 0.1% |
| Europe | 158 | 0.3% |
| France | 4 | 0.0% |
| Germany | 44 | 0.1% |
| Guatemala | 34 | 0.1% |
| Guyana | 2 | 0.0% |
| Honduras | 526 | 1.1% |
| Korea | 23 | 0.1% |
| Latin America | 1,865 | 4.0% |
| Lithuania | 9 | 0.0% |
| Mexico | 1,168 | 2.5% |
| Nepal | 47 | 0.1% |
| Philippines | 41 | 0.1% |
| Russia | 35 | 0.1% |
| South America | 124 | 0.3% |
| South Central Asia | 47 | 0.1% |
| South Eastern Asia | 92 | 0.2% |
| Thailand | 18 | 0.0% |
| Vietnam | 33 | 0.1% |
| Western Europe | 112 | 0.2% | View All 31 Rows |
Sex and Age in Marshall County
Sex and Age in Marshall County
The most populous age groups in Marshall County are 60 to 64 Years (1,884 | 8.1%) for men and 10 to 14 Years (1,682 | 7.4%) for women.

| Age Bracket | Male | Female |
| Under 5 Years | 1,549 (6.6%) | 1,297 (5.7%) |
| 5 to 9 Years | 1,771 (7.6%) | 1,365 (6.0%) |
| 10 to 14 Years | 1,581 (6.8%) | 1,682 (7.4%) |
| 15 to 19 Years | 1,767 (7.6%) | 1,636 (7.2%) |
| 20 to 24 Years | 1,337 (5.7%) | 1,274 (5.6%) |
| 25 to 29 Years | 1,528 (6.5%) | 1,215 (5.3%) |
| 30 to 34 Years | 1,266 (5.4%) | 1,164 (5.1%) |
| 35 to 39 Years | 1,353 (5.8%) | 1,388 (6.1%) |
| 40 to 44 Years | 1,338 (5.7%) | 1,304 (5.7%) |
| 45 to 49 Years | 1,496 (6.4%) | 1,368 (6.0%) |
| 50 to 54 Years | 1,366 (5.9%) | 1,499 (6.6%) |
| 55 to 59 Years | 1,440 (6.2%) | 1,478 (6.5%) |
| 60 to 64 Years | 1,884 (8.1%) | 1,519 (6.7%) |
| 65 to 69 Years | 1,289 (5.5%) | 1,385 (6.1%) |
| 70 to 74 Years | 973 (4.2%) | 1,046 (4.6%) |
| 75 to 79 Years | 656 (2.8%) | 819 (3.6%) |
| 80 to 84 Years | 369 (1.6%) | 510 (2.2%) |
| 85 Years and over | 407 (1.7%) | 889 (3.9%) |
| Total | 23,370 (100.0%) | 22,838 (100.0%) |
Families and Households in Marshall County
Median Family Size in Marshall County
The median family size in Marshall County is 3.31 persons per family, with married-couple families (9,253 | 80.5%) accounting for the largest median family size of 3.36 persons per family. On the other hand, single male/father families (937 | 8.2%) represent the smallest median family size with 2.69 persons per family.

| Family Type | # Families | Family Size |
| Married-Couple | 9,253 (80.5%) | 3.36 |
| Single Male/Father | 937 (8.2%) | 2.69 |
| Single Female/Mother | 1,308 (11.4%) | 3.34 |
| Total Families | 11,498 (100.0%) | 3.31 |
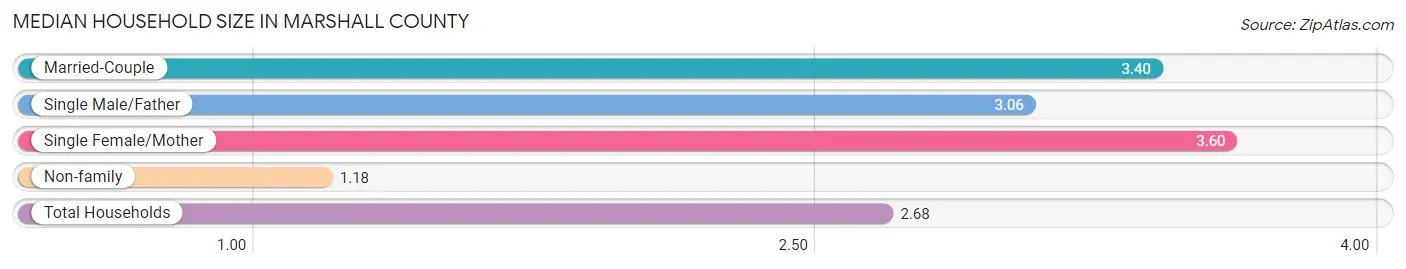
Median Household Size in Marshall County
The median household size in Marshall County is 2.68 persons per household, with single female/mother households (1,308 | 7.7%) accounting for the largest median household size of 3.6 persons per household. non-family households (5,417 | 32.0%) represent the smallest median household size with 1.18 persons per household.
| Household Type | # Households | Household Size |
| Married-Couple | 9,253 (54.7%) | 3.40 |
| Single Male/Father | 937 (5.5%) | 3.06 |
| Single Female/Mother | 1,308 (7.7%) | 3.60 |
| Non-family | 5,417 (32.0%) | 1.18 |
| Total Households | 16,915 (100.0%) | 2.68 |
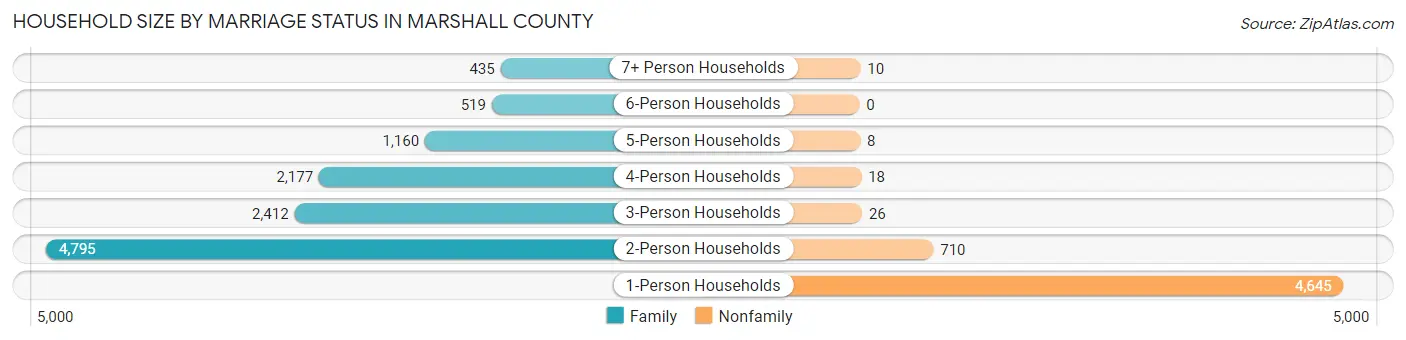
Household Size by Marriage Status in Marshall County
Out of a total of 16,915 households in Marshall County, 11,498 (68.0%) are family households, while 5,417 (32.0%) are nonfamily households. The most numerous type of family households are 2-person households, comprising 4,795, and the most common type of nonfamily households are 1-person households, comprising 4,645.
| Household Size | Family Households | Nonfamily Households |
| 1-Person Households | - | 4,645 (27.5%) |
| 2-Person Households | 4,795 (28.3%) | 710 (4.2%) |
| 3-Person Households | 2,412 (14.3%) | 26 (0.2%) |
| 4-Person Households | 2,177 (12.9%) | 18 (0.1%) |
| 5-Person Households | 1,160 (6.9%) | 8 (0.1%) |
| 6-Person Households | 519 (3.1%) | 0 (0.0%) |
| 7+ Person Households | 435 (2.6%) | 10 (0.1%) |
| Total | 11,498 (68.0%) | 5,417 (32.0%) |
Female Fertility in Marshall County
Fertility by Age in Marshall County
Average fertility rate in Marshall County is 46.0 births per 1,000 women. Women in the age bracket of 20 to 34 years have the highest fertility rate with 103.0 births per 1,000 women. Women in the age bracket of 20 to 34 years acount for 84.7% of all women with births.

| Age Bracket | Women with Births | Births / 1,000 Women |
| 15 to 19 years | 0 (0.0%) | 0.0 |
| 20 to 34 years | 376 (84.7%) | 103.0 |
| 35 to 50 years | 68 (15.3%) | 16.0 |
| Total | 444 (100.0%) | 46.0 |
Fertility by Age by Marriage Status in Marshall County
77.0% of women with births (444) in Marshall County are married. The highest percentage of unmarried women with births falls into 20 to 34 years age bracket with 26.1% of them unmarried at the time of birth, while the lowest percentage of unmarried women with births belong to 35 to 50 years age bracket with 5.9% of them unmarried.

| Age Bracket | Married | Unmarried |
| 15 to 19 years | 0 (0.0%) | 0 (0.0%) |
| 20 to 34 years | 278 (73.9%) | 98 (26.1%) |
| 35 to 50 years | 64 (94.1%) | 4 (5.9%) |
| Total | 342 (77.0%) | 102 (23.0%) |
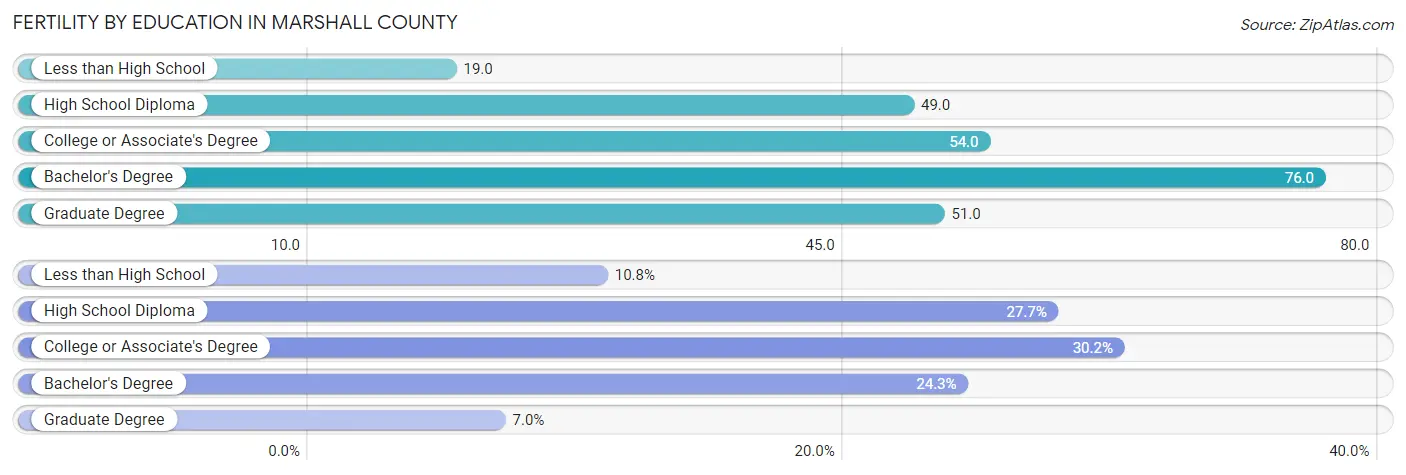
Fertility by Education in Marshall County
Average fertility rate in Marshall County is 46.0 births per 1,000 women. Women with the education attainment of bachelor's degree have the highest fertility rate of 76.0 births per 1,000 women, while women with the education attainment of less than high school have the lowest fertility at 19.0 births per 1,000 women. Women with the education attainment of college or associate's degree represent 30.2% of all women with births.
| Educational Attainment | Women with Births | Births / 1,000 Women |
| Less than High School | 48 (10.8%) | 19.0 |
| High School Diploma | 123 (27.7%) | 49.0 |
| College or Associate's Degree | 134 (30.2%) | 54.0 |
| Bachelor's Degree | 108 (24.3%) | 76.0 |
| Graduate Degree | 31 (7.0%) | 51.0 |
| Total | 444 (100.0%) | 46.0 |
Fertility by Education by Marriage Status in Marshall County
23.0% of women with births in Marshall County are unmarried. Women with the educational attainment of graduate degree are most likely to be married with 100.0% of them married at childbirth, while women with the educational attainment of bachelor's degree are least likely to be married with 43.5% of them unmarried at childbirth.

| Educational Attainment | Married | Unmarried |
| Less than High School | 38 (79.2%) | 10 (20.8%) |
| High School Diploma | 96 (78.0%) | 27 (22.0%) |
| College or Associate's Degree | 116 (86.6%) | 18 (13.4%) |
| Bachelor's Degree | 61 (56.5%) | 47 (43.5%) |
| Graduate Degree | 31 (100.0%) | 0 (0.0%) |
| Total | 342 (77.0%) | 102 (23.0%) |
Income in Marshall County
Income Overview in Marshall County
Per Capita Income in Marshall County is $32,218, while median incomes of families and households are $82,926 and $66,016 respectively.
| Characteristic | Number | Measure |
| Per Capita Income | 46,208 | $32,218 |
| Median Family Income | 11,498 | $82,926 |
| Mean Family Income | 11,498 | $99,474 |
| Median Household Income | 16,915 | $66,016 |
| Mean Household Income | 16,915 | $84,516 |
| Income Deficit | 11,498 | $11,118 |
| Wage / Income Gap (%) | 46,208 | 34.09% |
| Wage / Income Gap ($) | 46,208 | 65.91¢ per $1 |
| Gini / Inequality Index | 46,208 | 0.43 |
Earnings by Sex in Marshall County
Average Earnings in Marshall County are $39,470, $47,046 for men and $31,006 for women, a difference of 34.1%.

| Sex | Number | Average Earnings |
| Male | 13,252 (55.9%) | $47,046 |
| Female | 10,437 (44.1%) | $31,006 |
| Total | 23,689 (100.0%) | $39,470 |
Earnings by Sex by Income Bracket in Marshall County
The most common earnings brackets in Marshall County are $75,000 to $99,999 for men (1,642 | 12.4%) and $25,000 to $29,999 for women (746 | 7.1%).

| Income | Male | Female |
| $2,499 or less | 644 (4.9%) | 674 (6.5%) |
| $2,500 to $4,999 | 327 (2.5%) | 546 (5.2%) |
| $5,000 to $7,499 | 408 (3.1%) | 534 (5.1%) |
| $7,500 to $9,999 | 368 (2.8%) | 311 (3.0%) |
| $10,000 to $12,499 | 351 (2.6%) | 522 (5.0%) |
| $12,500 to $14,999 | 277 (2.1%) | 293 (2.8%) |
| $15,000 to $17,499 | 154 (1.2%) | 428 (4.1%) |
| $17,500 to $19,999 | 196 (1.5%) | 221 (2.1%) |
| $20,000 to $22,499 | 210 (1.6%) | 286 (2.7%) |
| $22,500 to $24,999 | 267 (2.0%) | 480 (4.6%) |
| $25,000 to $29,999 | 560 (4.2%) | 746 (7.1%) |
| $30,000 to $34,999 | 1,028 (7.8%) | 695 (6.7%) |
| $35,000 to $39,999 | 751 (5.7%) | 744 (7.1%) |
| $40,000 to $44,999 | 648 (4.9%) | 561 (5.4%) |
| $45,000 to $49,999 | 757 (5.7%) | 721 (6.9%) |
| $50,000 to $54,999 | 765 (5.8%) | 667 (6.4%) |
| $55,000 to $64,999 | 1,586 (12.0%) | 634 (6.1%) |
| $65,000 to $74,999 | 1,023 (7.7%) | 547 (5.2%) |
| $75,000 to $99,999 | 1,642 (12.4%) | 465 (4.5%) |
| $100,000+ | 1,290 (9.7%) | 362 (3.5%) |
| Total | 13,252 (100.0%) | 10,437 (100.0%) |
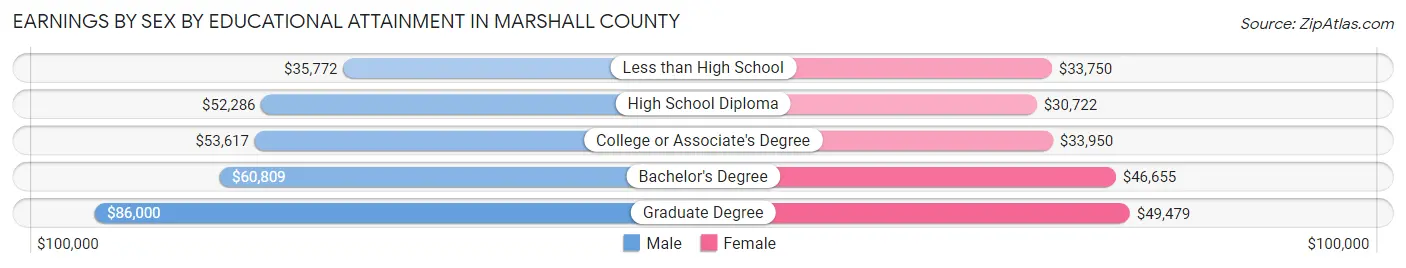
Earnings by Sex by Educational Attainment in Marshall County
Average earnings in Marshall County are $52,095 for men and $37,100 for women, a difference of 28.8%. Men with an educational attainment of graduate degree enjoy the highest average annual earnings of $86,000, while those with less than high school education earn the least with $35,772. Women with an educational attainment of graduate degree earn the most with the average annual earnings of $49,479, while those with high school diploma education have the smallest earnings of $30,722.
| Educational Attainment | Male Income | Female Income |
| Less than High School | $35,772 | $33,750 |
| High School Diploma | $52,286 | $30,722 |
| College or Associate's Degree | $53,617 | $33,950 |
| Bachelor's Degree | $60,809 | $46,655 |
| Graduate Degree | $86,000 | $49,479 |
| Total | $52,095 | $37,100 |
Family Income in Marshall County
Family Income Brackets in Marshall County
According to the Marshall County family income data, there are 2,449 families falling into the $100,000 to $149,999 income range, which is the most common income bracket and makes up 21.3% of all families. Conversely, the $10,000 to $14,999 income bracket is the least frequent group with only 195 families (1.7%) belonging to this category.

| Income Bracket | # Families | % Families |
| Less than $10,000 | 218 | 1.9% |
| $10,000 to $14,999 | 195 | 1.7% |
| $15,000 to $24,999 | 345 | 3.0% |
| $25,000 to $34,999 | 1,012 | 8.8% |
| $35,000 to $49,999 | 1,311 | 11.4% |
| $50,000 to $74,999 | 1,886 | 16.4% |
| $75,000 to $99,999 | 2,346 | 20.4% |
| $100,000 to $149,999 | 2,449 | 21.3% |
| $150,000 to $199,999 | 1,046 | 9.1% |
| $200,000+ | 690 | 6.0% |
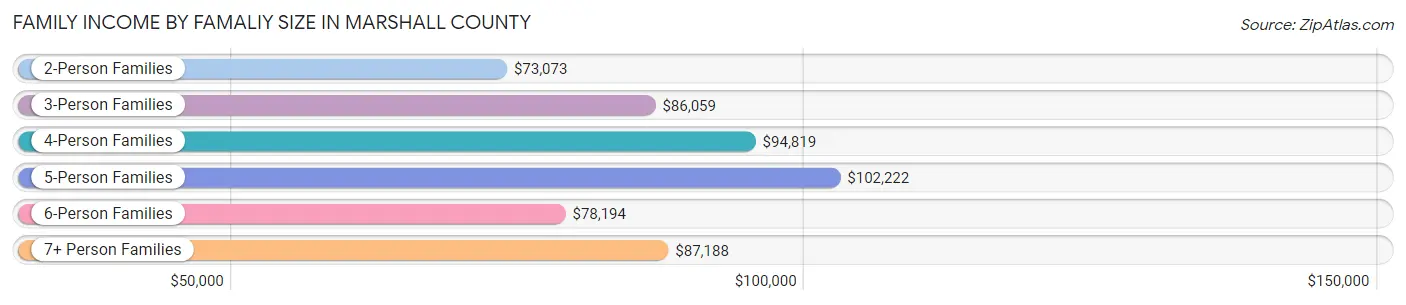
Family Income by Famaliy Size in Marshall County
5-person families (920 | 8.0%) account for the highest median family income in Marshall County with $102,222 per family, while 2-person families (5,003 | 43.5%) have the highest median income of $36,536 per family member.
| Income Bracket | # Families | Median Income |
| 2-Person Families | 5,003 (43.5%) | $73,073 |
| 3-Person Families | 2,545 (22.1%) | $86,059 |
| 4-Person Families | 2,115 (18.4%) | $94,819 |
| 5-Person Families | 920 (8.0%) | $102,222 |
| 6-Person Families | 495 (4.3%) | $78,194 |
| 7+ Person Families | 420 (3.6%) | $87,188 |
| Total | 11,498 (100.0%) | $82,926 |
Family Income by Number of Earners in Marshall County
The median family income in Marshall County is $82,926, with families comprising 3+ earners (1,747) having the highest median family income of $127,043, while families with no earners (1,625) have the lowest median family income of $45,946, accounting for 15.2% and 14.1% of families, respectively.
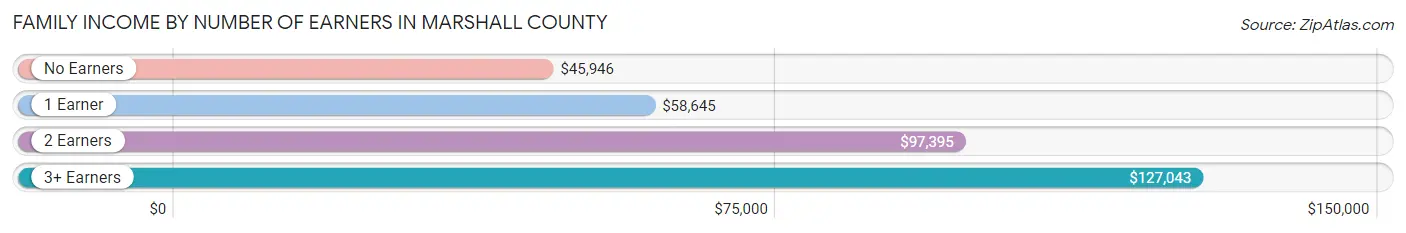
| Number of Earners | # Families | Median Income |
| No Earners | 1,625 (14.1%) | $45,946 |
| 1 Earner | 3,530 (30.7%) | $58,645 |
| 2 Earners | 4,596 (40.0%) | $97,395 |
| 3+ Earners | 1,747 (15.2%) | $127,043 |
| Total | 11,498 (100.0%) | $82,926 |
Household Income in Marshall County
Household Income Brackets in Marshall County
With 3,011 households falling in the category, the $50,000 to $74,999 income range is the most frequent in Marshall County, accounting for 17.8% of all households. In contrast, only 507 households (3.0%) fall into the $10,000 to $14,999 income bracket, making it the least populous group.
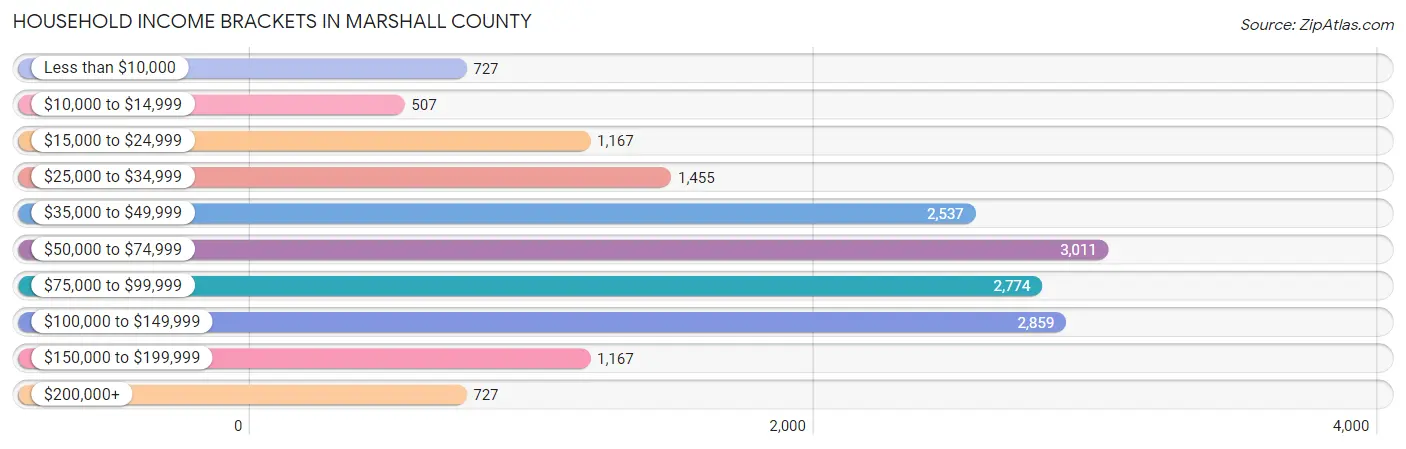
| Income Bracket | # Households | % Households |
| Less than $10,000 | 727 | 4.3% |
| $10,000 to $14,999 | 507 | 3.0% |
| $15,000 to $24,999 | 1,167 | 6.9% |
| $25,000 to $34,999 | 1,455 | 8.6% |
| $35,000 to $49,999 | 2,537 | 15.0% |
| $50,000 to $74,999 | 3,011 | 17.8% |
| $75,000 to $99,999 | 2,774 | 16.4% |
| $100,000 to $149,999 | 2,859 | 16.9% |
| $150,000 to $199,999 | 1,167 | 6.9% |
| $200,000+ | 727 | 4.3% |
Household Income by Householder Age in Marshall County
The median household income in Marshall County is $66,016, with the highest median household income of $81,781 found in the 45 to 64 years age bracket for the primary householder. A total of 6,889 households (40.7%) fall into this category. Meanwhile, the 15 to 24 years age bracket for the primary householder has the lowest median household income of $32,375, with 397 households (2.4%) in this group.
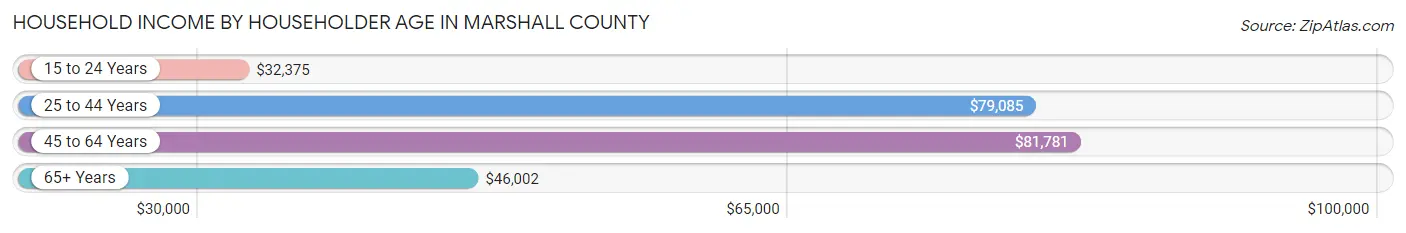
| Income Bracket | # Households | Median Income |
| 15 to 24 Years | 397 (2.4%) | $32,375 |
| 25 to 44 Years | 4,599 (27.2%) | $79,085 |
| 45 to 64 Years | 6,889 (40.7%) | $81,781 |
| 65+ Years | 5,030 (29.7%) | $46,002 |
| Total | 16,915 (100.0%) | $66,016 |
Poverty in Marshall County
Income Below Poverty by Sex and Age in Marshall County
With 8.9% poverty level for males and 12.8% for females among the residents of Marshall County, 15 year old males and 16 and 17 year old females are the most vulnerable to poverty, with 99 males (21.1%) and 248 females (35.2%) in their respective age groups living below the poverty level.
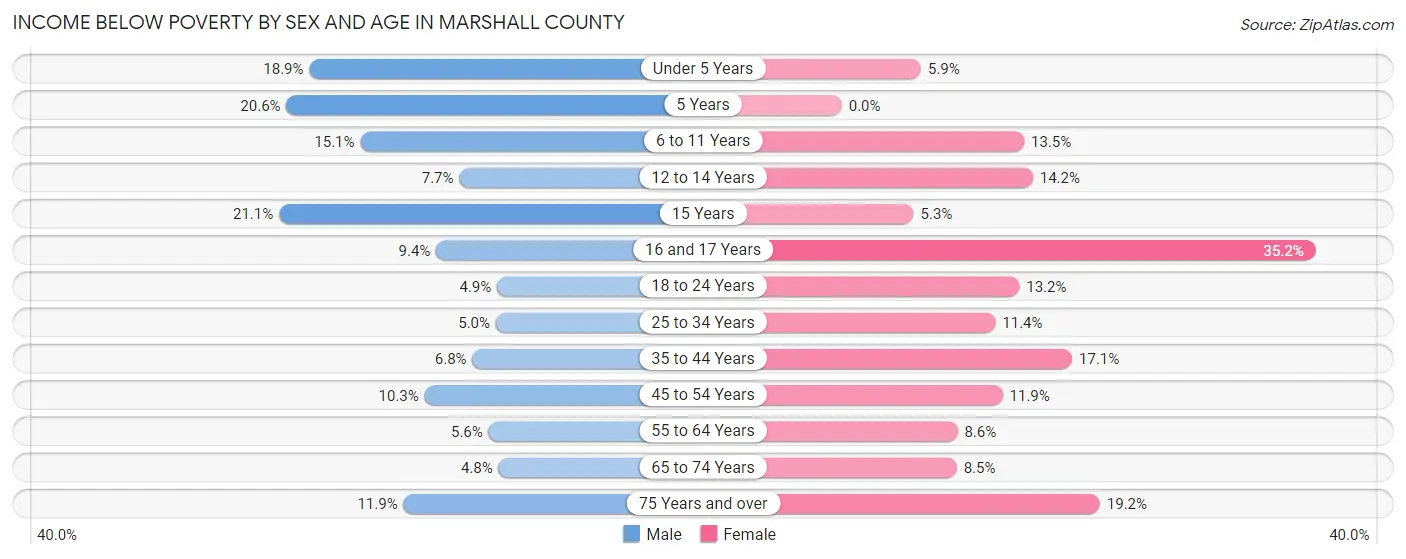
| Age Bracket | Male | Female |
| Under 5 Years | 289 (18.9%) | 76 (5.9%) |
| 5 Years | 59 (20.6%) | 0 (0.0%) |
| 6 to 11 Years | 306 (15.1%) | 242 (13.5%) |
| 12 to 14 Years | 69 (7.7%) | 139 (14.2%) |
| 15 Years | 99 (21.1%) | 17 (5.3%) |
| 16 and 17 Years | 61 (9.4%) | 248 (35.2%) |
| 18 to 24 Years | 97 (4.9%) | 246 (13.2%) |
| 25 to 34 Years | 138 (5.0%) | 269 (11.4%) |
| 35 to 44 Years | 179 (6.8%) | 456 (17.1%) |
| 45 to 54 Years | 291 (10.3%) | 341 (11.9%) |
| 55 to 64 Years | 184 (5.6%) | 256 (8.6%) |
| 65 to 74 Years | 108 (4.8%) | 206 (8.5%) |
| 75 Years and over | 159 (11.9%) | 384 (19.2%) |
| Total | 2,039 (8.9%) | 2,880 (12.8%) |
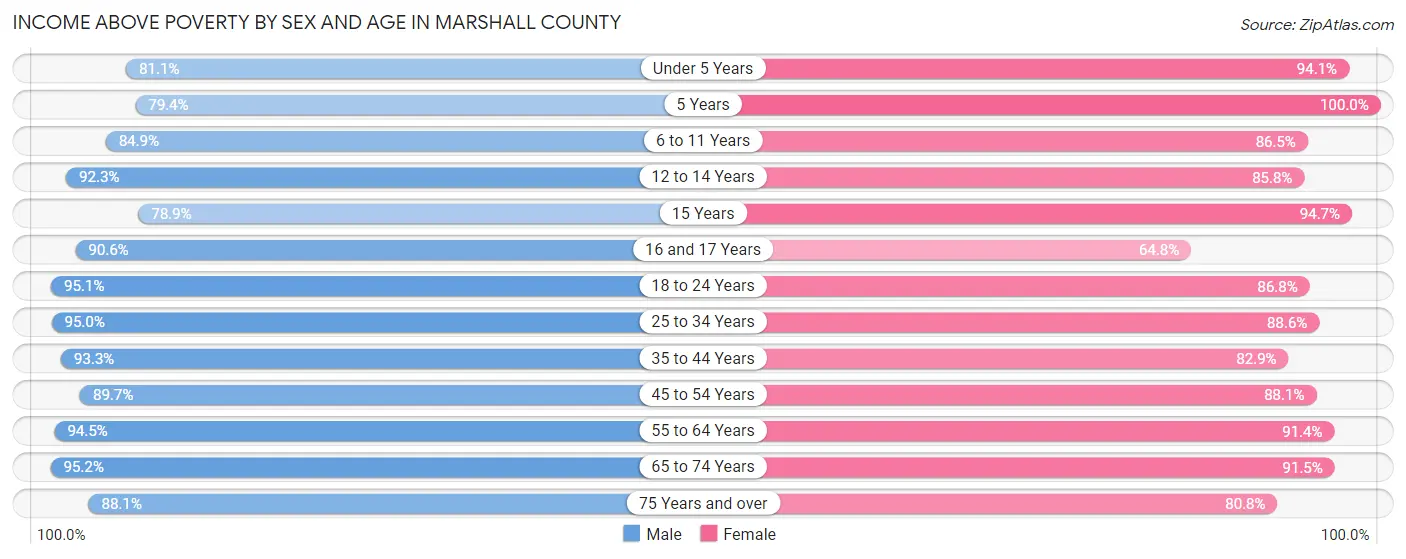
Income Above Poverty by Sex and Age in Marshall County
According to the poverty statistics in Marshall County, males aged 65 to 74 years and females aged 5 years are the age groups that are most secure financially, with 95.2% of males and 100.0% of females in these age groups living above the poverty line.
| Age Bracket | Male | Female |
| Under 5 Years | 1,243 (81.1%) | 1,216 (94.1%) |
| 5 Years | 228 (79.4%) | 236 (100.0%) |
| 6 to 11 Years | 1,724 (84.9%) | 1,547 (86.5%) |
| 12 to 14 Years | 825 (92.3%) | 841 (85.8%) |
| 15 Years | 370 (78.9%) | 302 (94.7%) |
| 16 and 17 Years | 585 (90.6%) | 457 (64.8%) |
| 18 to 24 Years | 1,874 (95.1%) | 1,621 (86.8%) |
| 25 to 34 Years | 2,614 (95.0%) | 2,091 (88.6%) |
| 35 to 44 Years | 2,473 (93.2%) | 2,210 (82.9%) |
| 45 to 54 Years | 2,535 (89.7%) | 2,514 (88.1%) |
| 55 to 64 Years | 3,134 (94.5%) | 2,723 (91.4%) |
| 65 to 74 Years | 2,138 (95.2%) | 2,208 (91.5%) |
| 75 Years and over | 1,180 (88.1%) | 1,620 (80.8%) |
| Total | 20,923 (91.1%) | 19,586 (87.2%) |
Income Below Poverty Among Married-Couple Families in Marshall County
The poverty statistics for married-couple families in Marshall County show that 4.7% or 434 of the total 9,253 families live below the poverty line. Families with 5 or more children have the highest poverty rate of 25.5%, comprising of 69 families. On the other hand, families with no children have the lowest poverty rate of 2.6%, which includes 140 families.

| Children | Above Poverty | Below Poverty |
| No Children | 5,137 (97.4%) | 140 (2.6%) |
| 1 or 2 Children | 2,697 (97.1%) | 80 (2.9%) |
| 3 or 4 Children | 783 (84.4%) | 145 (15.6%) |
| 5 or more Children | 202 (74.5%) | 69 (25.5%) |
| Total | 8,819 (95.3%) | 434 (4.7%) |
Income Below Poverty Among Single-Parent Households in Marshall County
According to the poverty data in Marshall County, 3.0% or 28 single-father households and 23.9% or 313 single-mother households are living below the poverty line. Among single-father households, those with no children have the highest poverty rate, with 13 households (4.0%) experiencing poverty. Likewise, among single-mother households, those with 3 or 4 children have the highest poverty rate, with 74 households (33.8%) falling below the poverty line.

| Children | Single Father | Single Mother |
| No Children | 13 (4.0%) | 115 (22.8%) |
| 1 or 2 Children | 15 (2.7%) | 109 (20.3%) |
| 3 or 4 Children | 0 (0.0%) | 74 (33.8%) |
| 5 or more Children | 0 (0.0%) | 15 (31.2%) |
| Total | 28 (3.0%) | 313 (23.9%) |
Income Below Poverty Among Married-Couple vs Single-Parent Households in Marshall County
The poverty data for Marshall County shows that 434 of the married-couple family households (4.7%) and 341 of the single-parent households (15.2%) are living below the poverty level. Within the married-couple family households, those with 5 or more children have the highest poverty rate, with 69 households (25.5%) falling below the poverty line. Among the single-parent households, those with 5 or more children have the highest poverty rate, with 15 household (31.2%) living below poverty.

| Children | Married-Couple Families | Single-Parent Households |
| No Children | 140 (2.6%) | 128 (15.4%) |
| 1 or 2 Children | 80 (2.9%) | 124 (11.4%) |
| 3 or 4 Children | 145 (15.6%) | 74 (26.7%) |
| 5 or more Children | 69 (25.5%) | 15 (31.2%) |
| Total | 434 (4.7%) | 341 (15.2%) |
Employment Characteristics in Marshall County
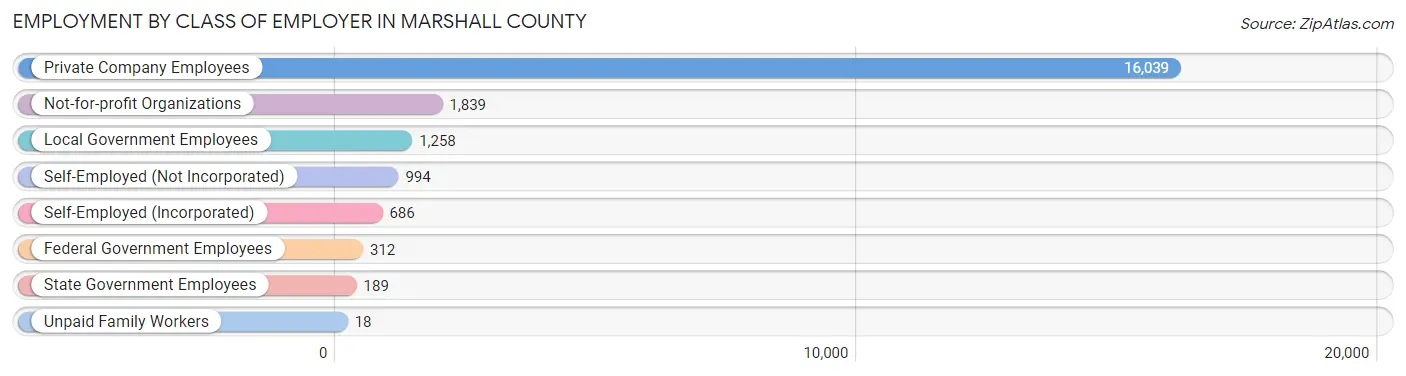
Employment by Class of Employer in Marshall County
Among the 21,335 employed individuals in Marshall County, private company employees (16,039 | 75.2%), not-for-profit organizations (1,839 | 8.6%), and local government employees (1,258 | 5.9%) make up the most common classes of employment.
| Employer Class | # Employees | % Employees |
| Private Company Employees | 16,039 | 75.2% |
| Self-Employed (Incorporated) | 686 | 3.2% |
| Self-Employed (Not Incorporated) | 994 | 4.7% |
| Not-for-profit Organizations | 1,839 | 8.6% |
| Local Government Employees | 1,258 | 5.9% |
| State Government Employees | 189 | 0.9% |
| Federal Government Employees | 312 | 1.5% |
| Unpaid Family Workers | 18 | 0.1% |
| Total | 21,335 | 100.0% |
Employment Status by Age in Marshall County
According to the labor force statistics for Marshall County, out of the total population over 16 years of age (36,169), 62.0% or 22,425 individuals are in the labor force, with 3.0% or 673 of them unemployed. The age group with the highest labor force participation rate is 45 to 54 years, with 85.4% or 4,893 individuals in the labor force. Within the labor force, the 16 to 19 years age range has the highest percentage of unemployed individuals, with 9.2% or 94 of them being unemployed.

| Age Bracket | In Labor Force | Unemployed |
| 16 to 19 Years | 1,023 (39.2%) | 94 (9.2%) |
| 20 to 24 Years | 2,076 (79.5%) | 83 (4.0%) |
| 25 to 29 Years | 2,030 (74.0%) | 67 (3.3%) |
| 30 to 34 Years | 1,939 (79.8%) | 78 (4.0%) |
| 35 to 44 Years | 4,333 (80.5%) | 130 (3.0%) |
| 45 to 54 Years | 4,893 (85.4%) | 108 (2.2%) |
| 55 to 59 Years | 2,358 (80.8%) | 61 (2.6%) |
| 60 to 64 Years | 2,355 (69.2%) | 40 (1.7%) |
| 65 to 74 Years | 1,239 (26.4%) | 12 (1.0%) |
| 75 Years and over | 172 (4.7%) | 0 (0.0%) |
| Total | 22,425 (62.0%) | 673 (3.0%) |
Employment Status by Educational Attainment in Marshall County
According to labor force statistics for Marshall County, 79.2% of individuals (17,904) out of the total population between 25 and 64 years of age (22,606) are in the labor force, with 2.7% or 483 of them being unemployed. The group with the highest labor force participation rate are those with the educational attainment of bachelor's degree or higher, with 88.3% or 4,147 individuals in the labor force. Within the labor force, individuals with less than high school education have the highest percentage of unemployment, with 5.2% or 114 of them being unemployed.

| Educational Attainment | In Labor Force | Unemployed |
| Less than High School | 2,190 (62.3%) | 183 (5.2%) |
| High School Diploma | 6,083 (78.8%) | 124 (1.6%) |
| College / Associate Degree | 5,479 (82.1%) | 207 (3.1%) |
| Bachelor's Degree or higher | 4,147 (88.3%) | 117 (2.5%) |
| Total | 17,904 (79.2%) | 610 (2.7%) |
Employment Occupations by Sex in Marshall County
Management, Business, Science and Arts Occupations
The most common Management, Business, Science and Arts occupations in Marshall County are Management (1,866 | 8.6%), Community & Social Service (1,565 | 7.2%), Education Instruction & Library (987 | 4.5%), Health Diagnosing & Treating (874 | 4.0%), and Business & Financial (743 | 3.4%).

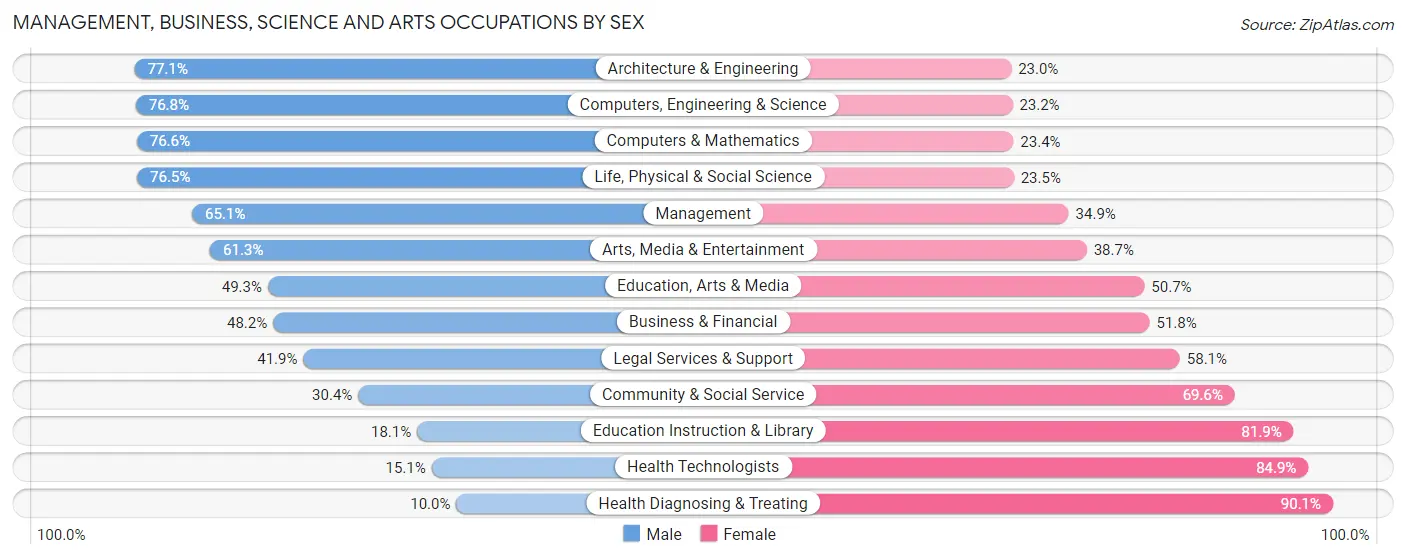
Management, Business, Science and Arts Occupations by Sex
Within the Management, Business, Science and Arts occupations in Marshall County, the most male-oriented occupations are Architecture & Engineering (77.0%), Computers, Engineering & Science (76.8%), and Computers & Mathematics (76.6%), while the most female-oriented occupations are Health Diagnosing & Treating (90.0%), Health Technologists (84.9%), and Education Instruction & Library (81.9%).
| Occupation | Male | Female |
| Management | 1,214 (65.1%) | 652 (34.9%) |
| Business & Financial | 358 (48.2%) | 385 (51.8%) |
| Computers, Engineering & Science | 516 (76.8%) | 156 (23.2%) |
| Computers & Mathematics | 193 (76.6%) | 59 (23.4%) |
| Architecture & Engineering | 235 (77.0%) | 70 (23.0%) |
| Life, Physical & Social Science | 88 (76.5%) | 27 (23.5%) |
| Community & Social Service | 476 (30.4%) | 1,089 (69.6%) |
| Education, Arts & Media | 166 (49.3%) | 171 (50.7%) |
| Legal Services & Support | 36 (41.9%) | 50 (58.1%) |
| Education Instruction & Library | 179 (18.1%) | 808 (81.9%) |
| Arts, Media & Entertainment | 95 (61.3%) | 60 (38.7%) |
| Health Diagnosing & Treating | 87 (10.0%) | 787 (90.0%) |
| Health Technologists | 87 (15.1%) | 489 (84.9%) |
| Total (Category) | 2,651 (46.4%) | 3,069 (53.6%) |
| Total (Overall) | 12,246 (56.4%) | 9,470 (43.6%) |
Services Occupations
The most common Services occupations in Marshall County are Food Preparation & Serving (1,004 | 4.6%), Cleaning & Maintenance (563 | 2.6%), Healthcare Support (453 | 2.1%), Personal Care & Service (334 | 1.5%), and Security & Protection (191 | 0.9%).
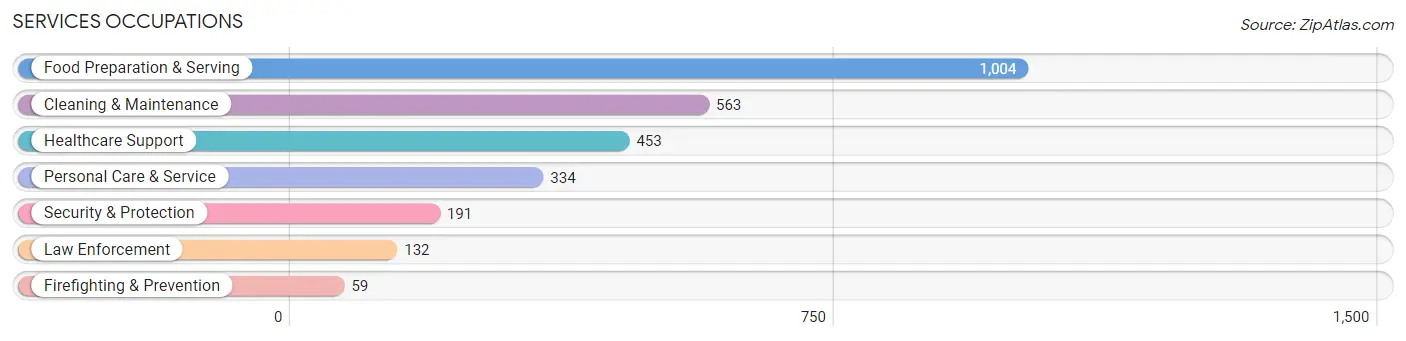
Services Occupations by Sex
Within the Services occupations in Marshall County, the most male-oriented occupations are Firefighting & Prevention (93.2%), Security & Protection (92.1%), and Law Enforcement (91.7%), while the most female-oriented occupations are Healthcare Support (86.8%), Personal Care & Service (85.0%), and Food Preparation & Serving (66.4%).
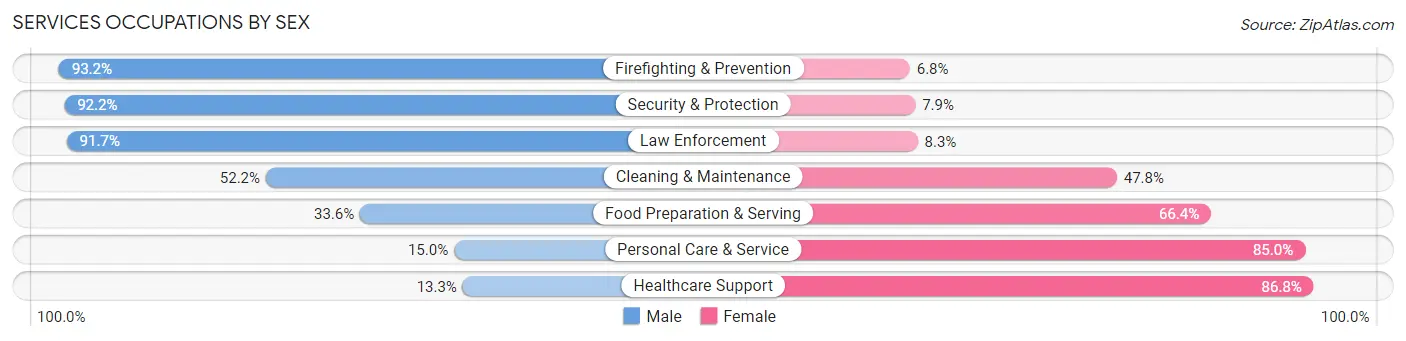
| Occupation | Male | Female |
| Healthcare Support | 60 (13.3%) | 393 (86.8%) |
| Security & Protection | 176 (92.1%) | 15 (7.9%) |
| Firefighting & Prevention | 55 (93.2%) | 4 (6.8%) |
| Law Enforcement | 121 (91.7%) | 11 (8.3%) |
| Food Preparation & Serving | 337 (33.6%) | 667 (66.4%) |
| Cleaning & Maintenance | 294 (52.2%) | 269 (47.8%) |
| Personal Care & Service | 50 (15.0%) | 284 (85.0%) |
| Total (Category) | 917 (36.0%) | 1,628 (64.0%) |
| Total (Overall) | 12,246 (56.4%) | 9,470 (43.6%) |
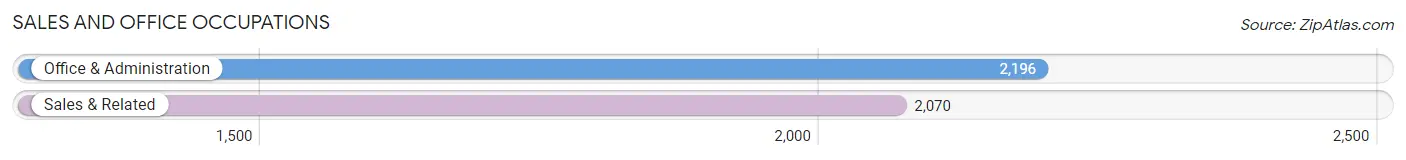
Sales and Office Occupations
The most common Sales and Office occupations in Marshall County are Office & Administration (2,196 | 10.1%), and Sales & Related (2,070 | 9.5%).
Sales and Office Occupations by Sex

| Occupation | Male | Female |
| Sales & Related | 1,088 (52.6%) | 982 (47.4%) |
| Office & Administration | 286 (13.0%) | 1,910 (87.0%) |
| Total (Category) | 1,374 (32.2%) | 2,892 (67.8%) |
| Total (Overall) | 12,246 (56.4%) | 9,470 (43.6%) |
Natural Resources, Construction and Maintenance Occupations
The most common Natural Resources, Construction and Maintenance occupations in Marshall County are Construction & Extraction (1,496 | 6.9%), Installation, Maintenance & Repair (874 | 4.0%), and Farming, Fishing & Forestry (161 | 0.7%).

Natural Resources, Construction and Maintenance Occupations by Sex

| Occupation | Male | Female |
| Farming, Fishing & Forestry | 84 (52.2%) | 77 (47.8%) |
| Construction & Extraction | 1,404 (93.9%) | 92 (6.1%) |
| Installation, Maintenance & Repair | 866 (99.1%) | 8 (0.9%) |
| Total (Category) | 2,354 (93.0%) | 177 (7.0%) |
| Total (Overall) | 12,246 (56.4%) | 9,470 (43.6%) |
Production, Transportation and Moving Occupations
The most common Production, Transportation and Moving occupations in Marshall County are Production (4,133 | 19.0%), Material Moving (1,360 | 6.3%), and Transportation (1,161 | 5.3%).

Production, Transportation and Moving Occupations by Sex
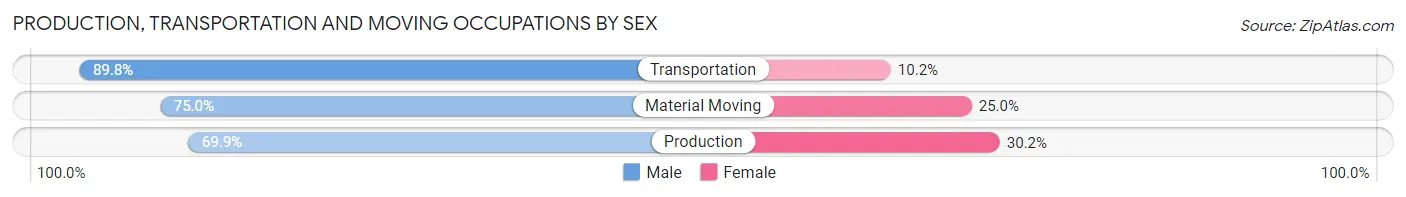
| Occupation | Male | Female |
| Production | 2,887 (69.9%) | 1,246 (30.1%) |
| Transportation | 1,043 (89.8%) | 118 (10.2%) |
| Material Moving | 1,020 (75.0%) | 340 (25.0%) |
| Total (Category) | 4,950 (74.4%) | 1,704 (25.6%) |
| Total (Overall) | 12,246 (56.4%) | 9,470 (43.6%) |
Employment Industries by Sex in Marshall County
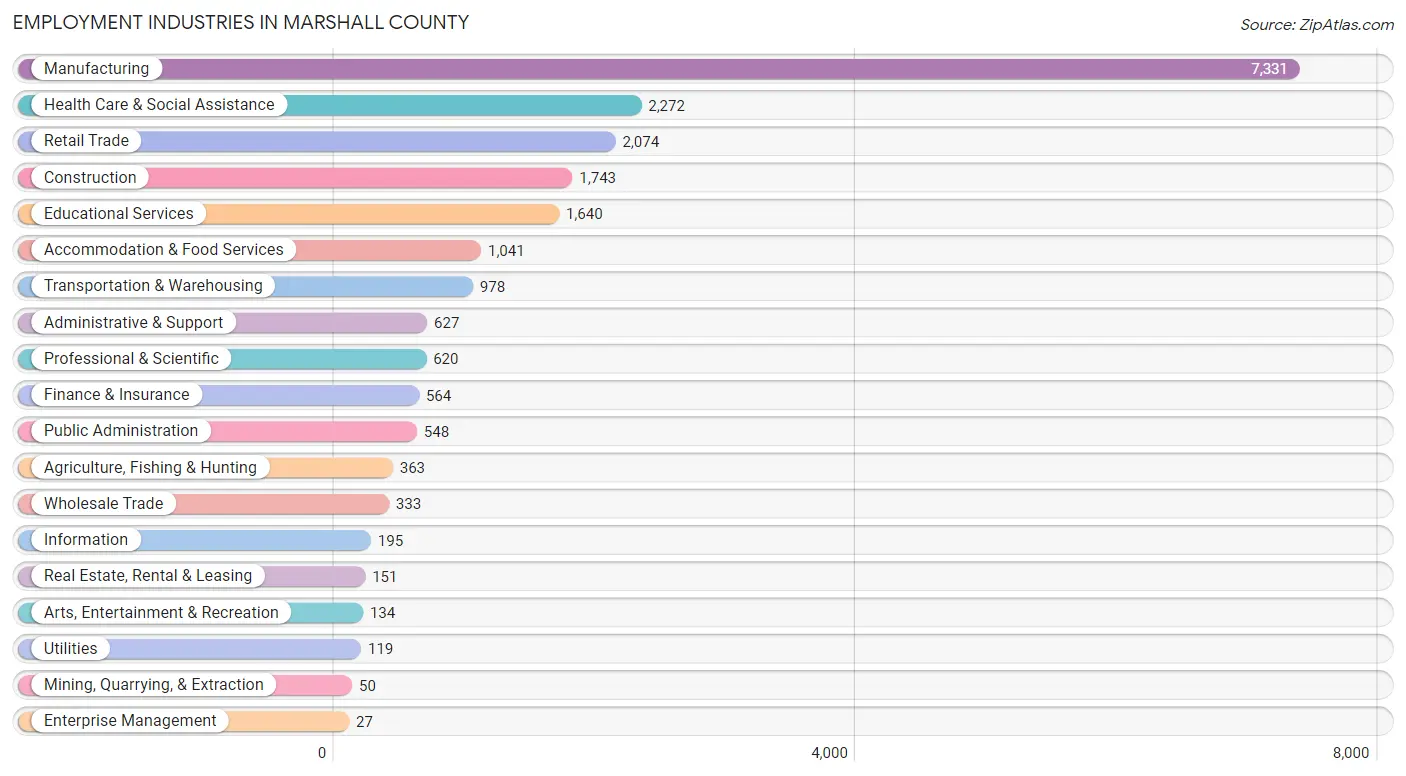
Employment Industries in Marshall County
The major employment industries in Marshall County include Manufacturing (7,331 | 33.8%), Health Care & Social Assistance (2,272 | 10.5%), Retail Trade (2,074 | 9.6%), Construction (1,743 | 8.0%), and Educational Services (1,640 | 7.5%).
Employment Industries by Sex in Marshall County
The Marshall County industries that see more men than women are Transportation & Warehousing (92.5%), Construction (87.2%), and Agriculture, Fishing & Hunting (84.0%), whereas the industries that tend to have a higher number of women are Finance & Insurance (86.9%), Health Care & Social Assistance (79.2%), and Educational Services (71.7%).
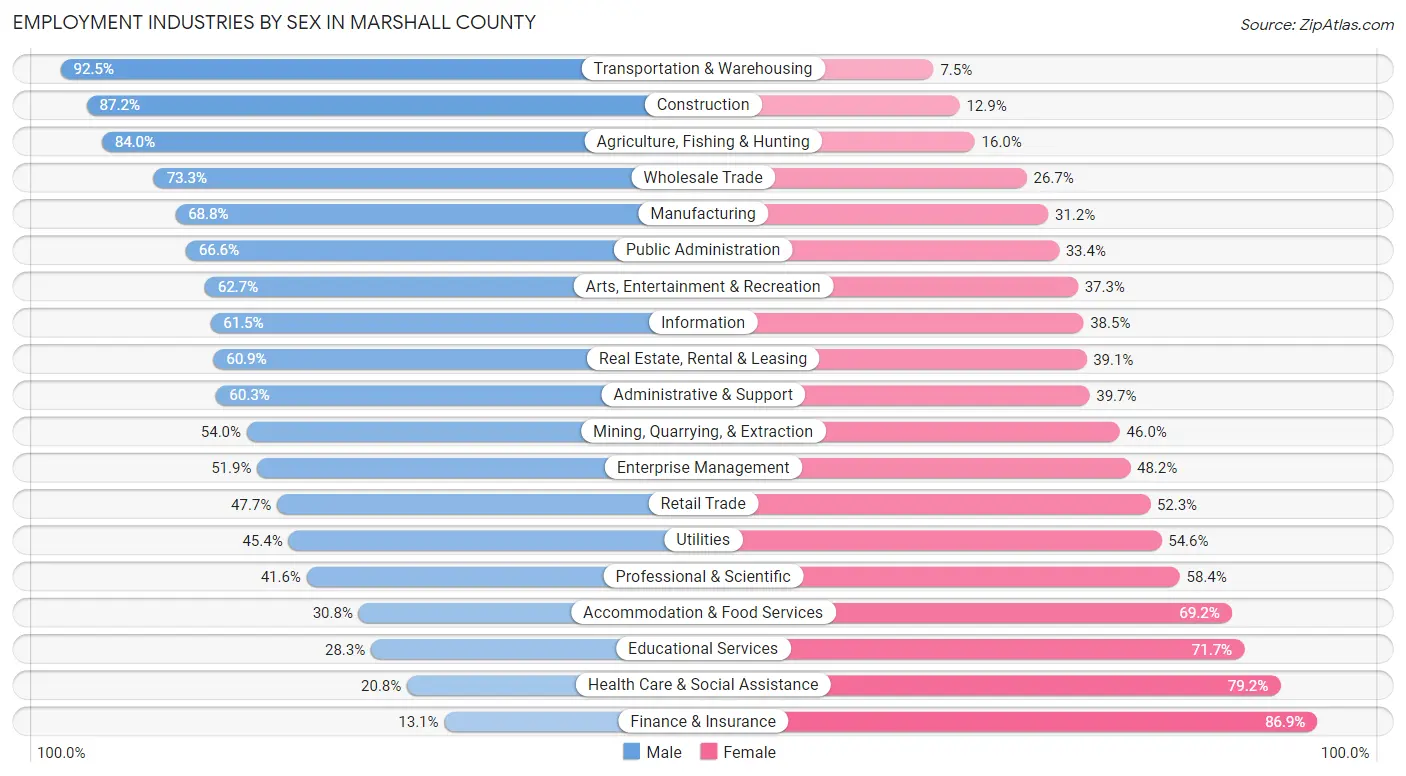
| Industry | Male | Female |
| Agriculture, Fishing & Hunting | 305 (84.0%) | 58 (16.0%) |
| Mining, Quarrying, & Extraction | 27 (54.0%) | 23 (46.0%) |
| Construction | 1,519 (87.2%) | 224 (12.9%) |
| Manufacturing | 5,045 (68.8%) | 2,286 (31.2%) |
| Wholesale Trade | 244 (73.3%) | 89 (26.7%) |
| Retail Trade | 990 (47.7%) | 1,084 (52.3%) |
| Transportation & Warehousing | 905 (92.5%) | 73 (7.5%) |
| Utilities | 54 (45.4%) | 65 (54.6%) |
| Information | 120 (61.5%) | 75 (38.5%) |
| Finance & Insurance | 74 (13.1%) | 490 (86.9%) |
| Real Estate, Rental & Leasing | 92 (60.9%) | 59 (39.1%) |
| Professional & Scientific | 258 (41.6%) | 362 (58.4%) |
| Enterprise Management | 14 (51.8%) | 13 (48.1%) |
| Administrative & Support | 378 (60.3%) | 249 (39.7%) |
| Educational Services | 464 (28.3%) | 1,176 (71.7%) |
| Health Care & Social Assistance | 473 (20.8%) | 1,799 (79.2%) |
| Arts, Entertainment & Recreation | 84 (62.7%) | 50 (37.3%) |
| Accommodation & Food Services | 321 (30.8%) | 720 (69.2%) |
| Public Administration | 365 (66.6%) | 183 (33.4%) |
| Total | 12,246 (56.4%) | 9,470 (43.6%) |
Education in Marshall County
School Enrollment in Marshall County
The most common levels of schooling among the 11,008 students in Marshall County are middle school (2,859 | 26.0%), high school (2,568 | 23.3%), and elementary school (2,292 | 20.8%).

| School Level | # Students | % Students |
| Nursery / Preschool | 795 | 7.2% |
| Kindergarten | 426 | 3.9% |
| Elementary School | 2,292 | 20.8% |
| Middle School | 2,859 | 26.0% |
| High School | 2,568 | 23.3% |
| College / Undergraduate | 1,792 | 16.3% |
| Graduate / Professional | 276 | 2.5% |
| Total | 11,008 | 100.0% |
School Enrollment by Age by Funding Source in Marshall County
Out of a total of 11,008 students who are enrolled in schools in Marshall County, 2,345 (21.3%) attend a private institution, while the remaining 8,663 (78.7%) are enrolled in public schools. The age group of 25 to 34 year olds has the highest likelihood of being enrolled in private schools, with 296 (53.4% in the age bracket) enrolled. Conversely, the age group of 15 to 17 year olds has the lowest likelihood of being enrolled in a private school, with 1,824 (92.5% in the age bracket) attending a public institution.
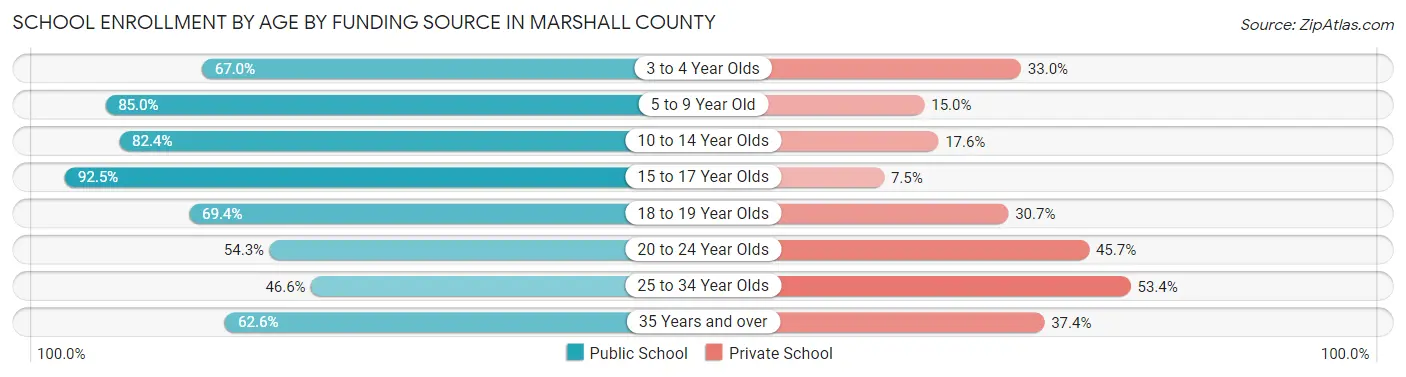
| Age Bracket | Public School | Private School |
| 3 to 4 Year Olds | 349 (67.0%) | 172 (33.0%) |
| 5 to 9 Year Old | 2,286 (85.0%) | 404 (15.0%) |
| 10 to 14 Year Olds | 2,616 (82.4%) | 559 (17.6%) |
| 15 to 17 Year Olds | 1,824 (92.5%) | 148 (7.5%) |
| 18 to 19 Year Olds | 654 (69.4%) | 289 (30.6%) |
| 20 to 24 Year Olds | 334 (54.3%) | 281 (45.7%) |
| 25 to 34 Year Olds | 258 (46.6%) | 296 (53.4%) |
| 35 Years and over | 337 (62.6%) | 201 (37.4%) |
| Total | 8,663 (78.7%) | 2,345 (21.3%) |
Educational Attainment by Field of Study in Marshall County
Business (1,423 | 21.0%), education (1,393 | 20.6%), science & technology (763 | 11.3%), liberal arts & history (485 | 7.2%), and bio, nature & agricultural (431 | 6.4%) are the most common fields of study among 6,763 individuals in Marshall County who have obtained a bachelor's degree or higher.
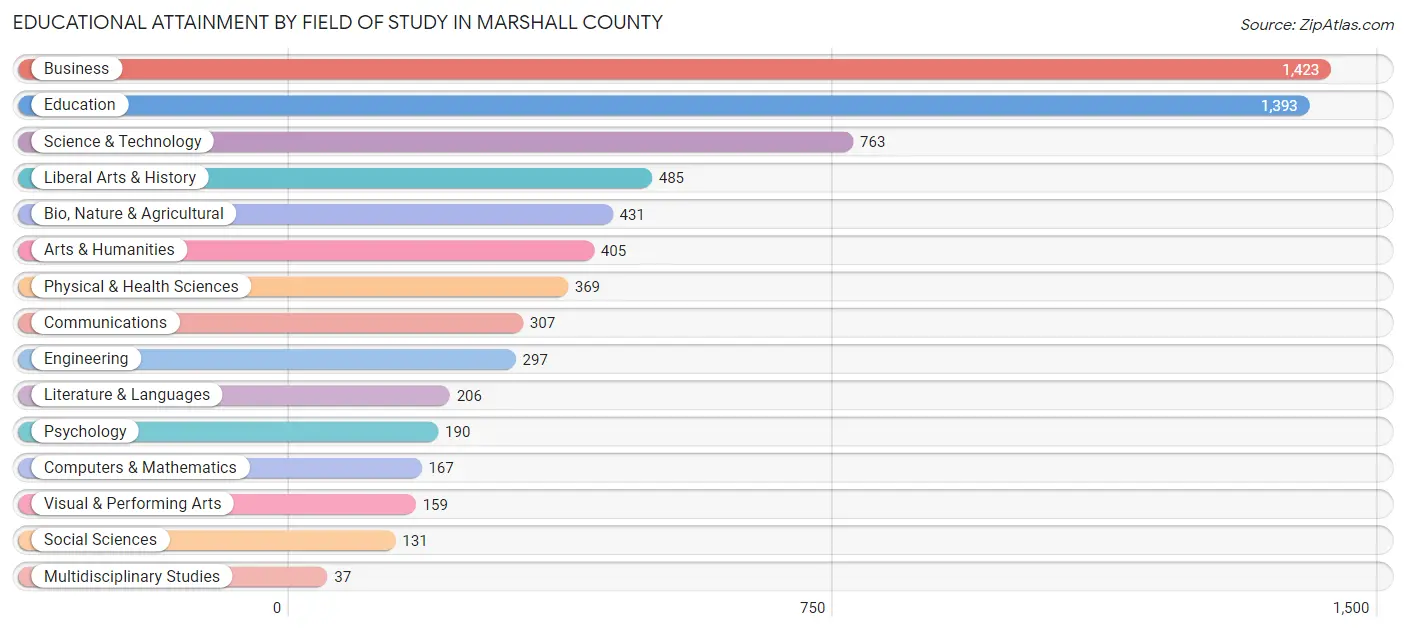
| Field of Study | # Graduates | % Graduates |
| Computers & Mathematics | 167 | 2.5% |
| Bio, Nature & Agricultural | 431 | 6.4% |
| Physical & Health Sciences | 369 | 5.5% |
| Psychology | 190 | 2.8% |
| Social Sciences | 131 | 1.9% |
| Engineering | 297 | 4.4% |
| Multidisciplinary Studies | 37 | 0.5% |
| Science & Technology | 763 | 11.3% |
| Business | 1,423 | 21.0% |
| Education | 1,393 | 20.6% |
| Literature & Languages | 206 | 3.0% |
| Liberal Arts & History | 485 | 7.2% |
| Visual & Performing Arts | 159 | 2.4% |
| Communications | 307 | 4.5% |
| Arts & Humanities | 405 | 6.0% |
| Total | 6,763 | 100.0% |
Transportation & Commute in Marshall County
Vehicle Availability by Sex in Marshall County
The most prevalent vehicle ownership categories in Marshall County are males with 2 vehicles (4,780, accounting for 39.7%) and females with 2 vehicles (3,559, making up 51.5%).

| Vehicles Available | Male | Female |
| No Vehicle | 669 (5.6%) | 311 (3.4%) |
| 1 Vehicle | 1,406 (11.7%) | 1,373 (14.8%) |
| 2 Vehicles | 4,780 (39.7%) | 3,559 (38.4%) |
| 3 Vehicles | 2,618 (21.7%) | 2,098 (22.6%) |
| 4 Vehicles | 1,569 (13.0%) | 1,171 (12.6%) |
| 5 or more Vehicles | 1,010 (8.4%) | 760 (8.2%) |
| Total | 12,052 (100.0%) | 9,272 (100.0%) |
Commute Time in Marshall County
The most frequently occuring commute durations in Marshall County are 5 to 9 minutes (3,164 commuters, 15.5%), 10 to 14 minutes (3,162 commuters, 15.5%), and 15 to 19 minutes (2,786 commuters, 13.7%).
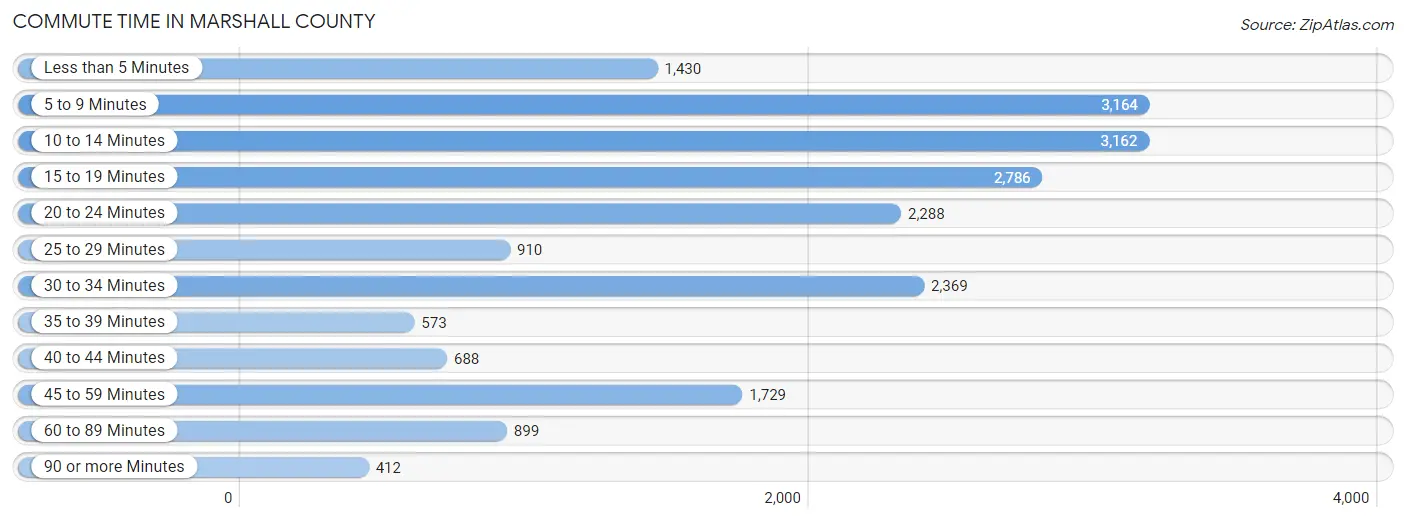
| Commute Time | # Commuters | % Commuters |
| Less than 5 Minutes | 1,430 | 7.0% |
| 5 to 9 Minutes | 3,164 | 15.5% |
| 10 to 14 Minutes | 3,162 | 15.5% |
| 15 to 19 Minutes | 2,786 | 13.7% |
| 20 to 24 Minutes | 2,288 | 11.2% |
| 25 to 29 Minutes | 910 | 4.5% |
| 30 to 34 Minutes | 2,369 | 11.6% |
| 35 to 39 Minutes | 573 | 2.8% |
| 40 to 44 Minutes | 688 | 3.4% |
| 45 to 59 Minutes | 1,729 | 8.5% |
| 60 to 89 Minutes | 899 | 4.4% |
| 90 or more Minutes | 412 | 2.0% |
Commute Time by Sex in Marshall County
The most common commute times in Marshall County are 5 to 9 minutes (1,572 commuters, 13.5%) for males and 10 to 14 minutes (1,629 commuters, 18.6%) for females.
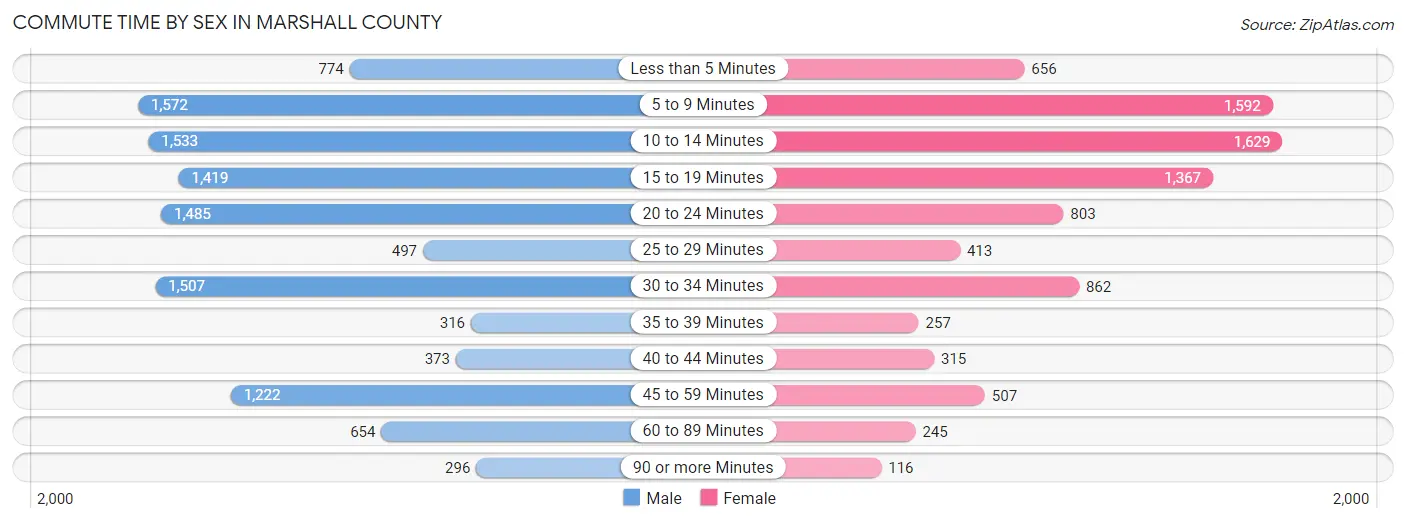
| Commute Time | Male | Female |
| Less than 5 Minutes | 774 (6.6%) | 656 (7.5%) |
| 5 to 9 Minutes | 1,572 (13.5%) | 1,592 (18.2%) |
| 10 to 14 Minutes | 1,533 (13.2%) | 1,629 (18.6%) |
| 15 to 19 Minutes | 1,419 (12.2%) | 1,367 (15.6%) |
| 20 to 24 Minutes | 1,485 (12.8%) | 803 (9.2%) |
| 25 to 29 Minutes | 497 (4.3%) | 413 (4.7%) |
| 30 to 34 Minutes | 1,507 (12.9%) | 862 (9.8%) |
| 35 to 39 Minutes | 316 (2.7%) | 257 (2.9%) |
| 40 to 44 Minutes | 373 (3.2%) | 315 (3.6%) |
| 45 to 59 Minutes | 1,222 (10.5%) | 507 (5.8%) |
| 60 to 89 Minutes | 654 (5.6%) | 245 (2.8%) |
| 90 or more Minutes | 296 (2.5%) | 116 (1.3%) |
Time of Departure to Work by Sex in Marshall County
The most frequent times of departure to work in Marshall County are 12:00 AM to 4:59 AM (2,229, 19.1%) for males and 7:30 AM to 7:59 AM (1,336, 15.2%) for females.

| Time of Departure | Male | Female |
| 12:00 AM to 4:59 AM | 2,229 (19.1%) | 776 (8.9%) |
| 5:00 AM to 5:29 AM | 640 (5.5%) | 386 (4.4%) |
| 5:30 AM to 5:59 AM | 1,071 (9.2%) | 549 (6.3%) |
| 6:00 AM to 6:29 AM | 1,040 (8.9%) | 589 (6.7%) |
| 6:30 AM to 6:59 AM | 898 (7.7%) | 817 (9.3%) |
| 7:00 AM to 7:29 AM | 1,391 (11.9%) | 991 (11.3%) |
| 7:30 AM to 7:59 AM | 1,006 (8.6%) | 1,336 (15.2%) |
| 8:00 AM to 8:29 AM | 688 (5.9%) | 739 (8.4%) |
| 8:30 AM to 8:59 AM | 202 (1.7%) | 384 (4.4%) |
| 9:00 AM to 9:59 AM | 357 (3.1%) | 521 (5.9%) |
| 10:00 AM to 10:59 AM | 144 (1.2%) | 193 (2.2%) |
| 11:00 AM to 11:59 AM | 224 (1.9%) | 126 (1.4%) |
| 12:00 PM to 3:59 PM | 570 (4.9%) | 659 (7.5%) |
| 4:00 PM to 11:59 PM | 1,188 (10.2%) | 696 (7.9%) |
| Total | 11,648 (100.0%) | 8,762 (100.0%) |
Housing Occupancy in Marshall County
Occupancy by Ownership in Marshall County
Of the total 16,915 dwellings in Marshall County, owner-occupied units account for 12,939 (76.5%), while renter-occupied units make up 3,976 (23.5%).

| Occupancy | # Housing Units | % Housing Units |
| Owner Occupied Housing Units | 12,939 | 76.5% |
| Renter-Occupied Housing Units | 3,976 | 23.5% |
| Total Occupied Housing Units | 16,915 | 100.0% |
Occupancy by Household Size in Marshall County

| Household Size | # Housing Units | % Housing Units |
| 1-Person Household | 4,645 | 27.5% |
| 2-Person Household | 5,505 | 32.6% |
| 3-Person Household | 2,438 | 14.4% |
| 4+ Person Household | 4,327 | 25.6% |
| Total Housing Units | 16,915 | 100.0% |
Occupancy by Ownership by Household Size in Marshall County

| Household Size | Owner-occupied | Renter-occupied |
| 1-Person Household | 3,005 (64.7%) | 1,640 (35.3%) |
| 2-Person Household | 4,681 (85.0%) | 824 (15.0%) |
| 3-Person Household | 2,007 (82.3%) | 431 (17.7%) |
| 4+ Person Household | 3,246 (75.0%) | 1,081 (25.0%) |
| Total Housing Units | 12,939 (76.5%) | 3,976 (23.5%) |
Occupancy by Educational Attainment in Marshall County

| Household Size | Owner-occupied | Renter-occupied |
| Less than High School | 1,337 (61.5%) | 836 (38.5%) |
| High School Diploma | 4,660 (76.7%) | 1,412 (23.3%) |
| College/Associate Degree | 3,877 (77.9%) | 1,099 (22.1%) |
| Bachelor's Degree or higher | 3,065 (83.0%) | 629 (17.0%) |
Occupancy by Age of Householder in Marshall County

| Age Bracket | # Households | % Households |
| Under 35 Years | 2,394 | 14.1% |
| 35 to 44 Years | 2,602 | 15.4% |
| 45 to 54 Years | 3,093 | 18.3% |
| 55 to 64 Years | 3,796 | 22.4% |
| 65 to 74 Years | 2,806 | 16.6% |
| 75 to 84 Years | 1,412 | 8.4% |
| 85 Years and Over | 812 | 4.8% |
| Total | 16,915 | 100.0% |
Housing Finances in Marshall County
Median Income by Occupancy in Marshall County

| Occupancy Type | # Households | Median Income |
| Owner-Occupied | 12,939 (76.5%) | $77,237 |
| Renter-Occupied | 3,976 (23.5%) | $41,483 |
| Average | 16,915 (100.0%) | $66,016 |
Occupancy by Householder Income Bracket in Marshall County

| Income Bracket | Owner-occupied | Renter-occupied |
| Less than $5,000 | 325 (2.5%) | 232 (5.8%) |
| $5,000 to $9,999 | 66 (0.5%) | 109 (2.7%) |
| $10,000 to $14,999 | 291 (2.2%) | 216 (5.4%) |
| $15,000 to $19,999 | 322 (2.5%) | 247 (6.2%) |
| $20,000 to $24,999 | 436 (3.4%) | 161 (4.1%) |
| $25,000 to $34,999 | 888 (6.9%) | 565 (14.2%) |
| $35,000 to $49,999 | 1,622 (12.5%) | 919 (23.1%) |
| $50,000 to $74,999 | 2,328 (18.0%) | 677 (17.0%) |
| $75,000 to $99,999 | 2,260 (17.5%) | 506 (12.7%) |
| $100,000 to $149,999 | 2,551 (19.7%) | 301 (7.6%) |
| $150,000 or more | 1,850 (14.3%) | 43 (1.1%) |
| Total | 12,939 (100.0%) | 3,976 (100.0%) |
Monthly Housing Cost Tiers in Marshall County

| Monthly Cost | Owner-occupied | Renter-occupied |
| Less than $300 | 833 (6.4%) | 102 (2.6%) |
| $300 to $499 | 2,150 (16.6%) | 175 (4.4%) |
| $500 to $799 | 2,876 (22.2%) | 973 (24.5%) |
| $800 to $999 | 1,375 (10.6%) | 1,139 (28.6%) |
| $1,000 to $1,499 | 3,230 (25.0%) | 1,093 (27.5%) |
| $1,500 to $1,999 | 1,594 (12.3%) | 186 (4.7%) |
| $2,000 to $2,499 | 609 (4.7%) | 15 (0.4%) |
| $2,500 to $2,999 | 164 (1.3%) | 0 (0.0%) |
| $3,000 or more | 108 (0.8%) | 15 (0.4%) |
| Total | 12,939 (100.0%) | 3,976 (100.0%) |
Physical Housing Characteristics in Marshall County
Housing Structures in Marshall County

| Structure Type | # Housing Units | % Housing Units |
| Single Unit, Detached | 14,031 | 83.0% |
| Single Unit, Attached | 254 | 1.5% |
| 2 Unit Apartments | 321 | 1.9% |
| 3 or 4 Unit Apartments | 288 | 1.7% |
| 5 to 9 Unit Apartments | 320 | 1.9% |
| 10 or more Apartments | 663 | 3.9% |
| Mobile Home / Other | 1,038 | 6.1% |
| Total | 16,915 | 100.0% |
Housing Structures by Occupancy in Marshall County

| Structure Type | Owner-occupied | Renter-occupied |
| Single Unit, Detached | 12,054 (85.9%) | 1,977 (14.1%) |
| Single Unit, Attached | 179 (70.5%) | 75 (29.5%) |
| 2 Unit Apartments | 31 (9.7%) | 290 (90.3%) |
| 3 or 4 Unit Apartments | 18 (6.2%) | 270 (93.8%) |
| 5 to 9 Unit Apartments | 7 (2.2%) | 313 (97.8%) |
| 10 or more Apartments | 20 (3.0%) | 643 (97.0%) |
| Mobile Home / Other | 630 (60.7%) | 408 (39.3%) |
| Total | 12,939 (76.5%) | 3,976 (23.5%) |
Housing Structures by Number of Rooms in Marshall County
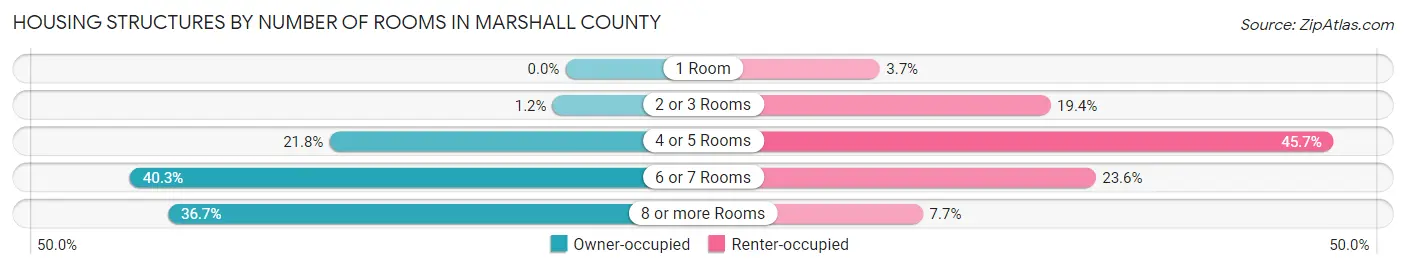
| Number of Rooms | Owner-occupied | Renter-occupied |
| 1 Room | 0 (0.0%) | 145 (3.6%) |
| 2 or 3 Rooms | 154 (1.2%) | 773 (19.4%) |
| 4 or 5 Rooms | 2,824 (21.8%) | 1,815 (45.7%) |
| 6 or 7 Rooms | 5,209 (40.3%) | 939 (23.6%) |
| 8 or more Rooms | 4,752 (36.7%) | 304 (7.6%) |
| Total | 12,939 (100.0%) | 3,976 (100.0%) |
Housing Structure by Heating Type in Marshall County
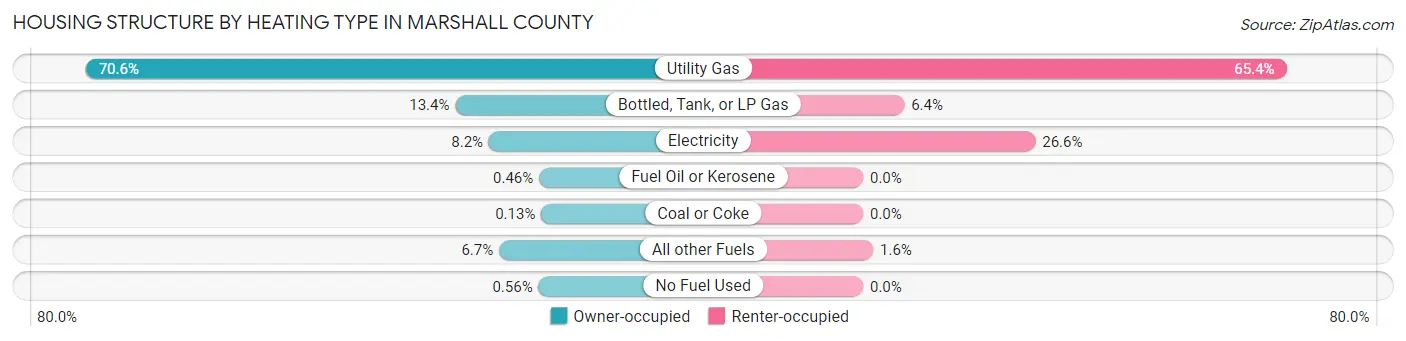
| Heating Type | Owner-occupied | Renter-occupied |
| Utility Gas | 9,128 (70.6%) | 2,602 (65.4%) |
| Bottled, Tank, or LP Gas | 1,737 (13.4%) | 253 (6.4%) |
| Electricity | 1,063 (8.2%) | 1,059 (26.6%) |
| Fuel Oil or Kerosene | 60 (0.5%) | 0 (0.0%) |
| Coal or Coke | 17 (0.1%) | 0 (0.0%) |
| All other Fuels | 861 (6.7%) | 62 (1.6%) |
| No Fuel Used | 73 (0.6%) | 0 (0.0%) |
| Total | 12,939 (100.0%) | 3,976 (100.0%) |
Household Vehicle Usage in Marshall County

| Vehicles per Household | Owner-occupied | Renter-occupied |
| No Vehicle | 622 (4.8%) | 414 (10.4%) |
| 1 Vehicle | 2,962 (22.9%) | 1,644 (41.3%) |
| 2 Vehicles | 5,084 (39.3%) | 1,558 (39.2%) |
| 3 or more Vehicles | 4,271 (33.0%) | 360 (9.0%) |
| Total | 12,939 (100.0%) | 3,976 (100.0%) |
Real Estate & Mortgages in Marshall County
Real Estate and Mortgage Overview in Marshall County
| Characteristic | Without Mortgage | With Mortgage |
| Housing Units | 5,031 | 7,908 |
| Median Property Value | $167,900 | $172,400 |
| Median Household Income | $59,693 | $1,262 |
| Monthly Housing Costs | $470 | $103 |
| Real Estate Taxes | $1,103 | $146 |
Property Value by Mortgage Status in Marshall County
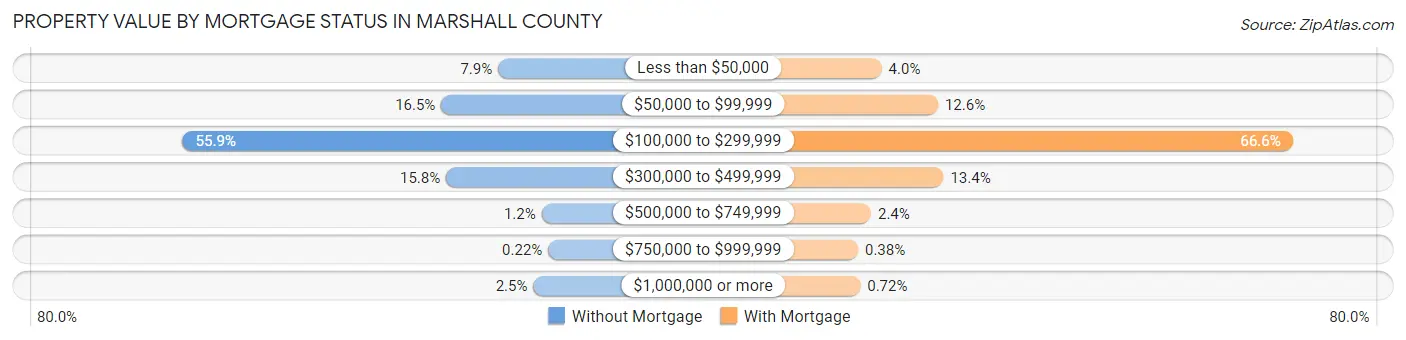
| Property Value | Without Mortgage | With Mortgage |
| Less than $50,000 | 395 (7.9%) | 315 (4.0%) |
| $50,000 to $99,999 | 831 (16.5%) | 993 (12.6%) |
| $100,000 to $299,999 | 2,813 (55.9%) | 5,266 (66.6%) |
| $300,000 to $499,999 | 794 (15.8%) | 1,060 (13.4%) |
| $500,000 to $749,999 | 62 (1.2%) | 187 (2.4%) |
| $750,000 to $999,999 | 11 (0.2%) | 30 (0.4%) |
| $1,000,000 or more | 125 (2.5%) | 57 (0.7%) |
| Total | 5,031 (100.0%) | 7,908 (100.0%) |
Household Income by Mortgage Status in Marshall County

| Household Income | Without Mortgage | With Mortgage |
| Less than $10,000 | 271 (5.4%) | 350 (4.4%) |
| $10,000 to $24,999 | 662 (13.2%) | 120 (1.5%) |
| $25,000 to $34,999 | 477 (9.5%) | 387 (4.9%) |
| $35,000 to $49,999 | 771 (15.3%) | 411 (5.2%) |
| $50,000 to $74,999 | 774 (15.4%) | 851 (10.8%) |
| $75,000 to $99,999 | 823 (16.4%) | 1,554 (19.7%) |
| $100,000 to $149,999 | 665 (13.2%) | 1,437 (18.2%) |
| $150,000 or more | 588 (11.7%) | 1,886 (23.8%) |
| Total | 5,031 (100.0%) | 7,908 (100.0%) |
Property Value to Household Income Ratio in Marshall County
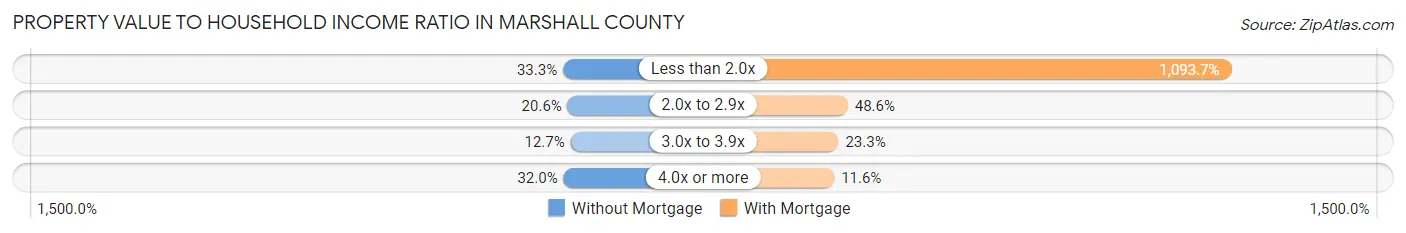
| Value-to-Income Ratio | Without Mortgage | With Mortgage |
| Less than 2.0x | 1,677 (33.3%) | 86,486 (1,093.7%) |
| 2.0x to 2.9x | 1,036 (20.6%) | 3,845 (48.6%) |
| 3.0x to 3.9x | 641 (12.7%) | 1,840 (23.3%) |
| 4.0x or more | 1,608 (32.0%) | 918 (11.6%) |
| Total | 5,031 (100.0%) | 7,908 (100.0%) |
Real Estate Taxes by Mortgage Status in Marshall County

| Property Taxes | Without Mortgage | With Mortgage |
| Less than $800 | 1,808 (35.9%) | 52 (0.7%) |
| $800 to $1,499 | 1,294 (25.7%) | 2,342 (29.6%) |
| $800 to $1,499 | 1,843 (36.6%) | 2,682 (33.9%) |
| Total | 5,031 (100.0%) | 7,908 (100.0%) |
Health & Disability in Marshall County
Health Insurance Coverage by Age in Marshall County
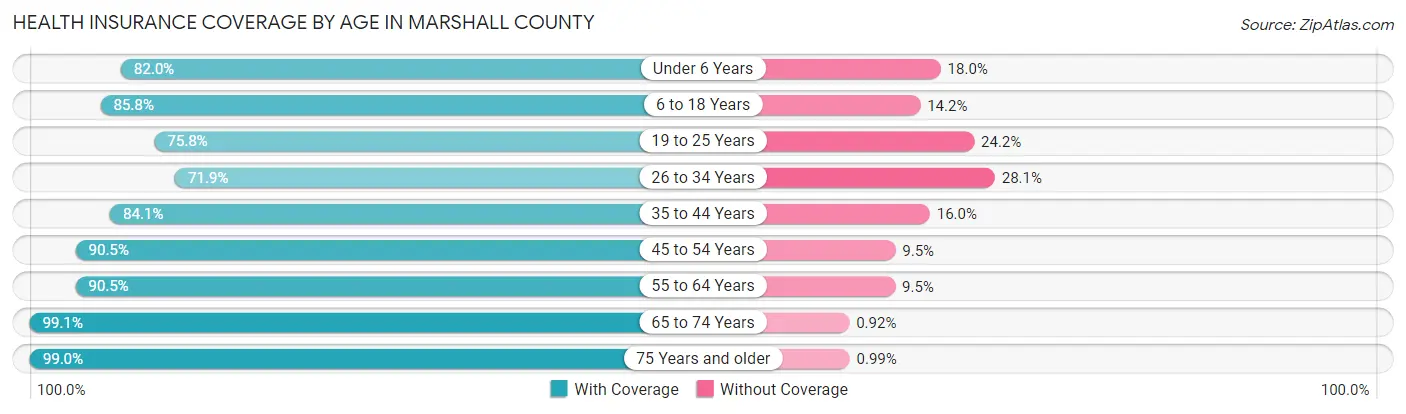
| Age Bracket | With Coverage | Without Coverage |
| Under 6 Years | 2,794 (82.0%) | 612 (18.0%) |
| 6 to 18 Years | 7,549 (85.8%) | 1,245 (14.2%) |
| 19 to 25 Years | 2,774 (75.8%) | 886 (24.2%) |
| 26 to 34 Years | 3,200 (71.9%) | 1,249 (28.1%) |
| 35 to 44 Years | 4,470 (84.1%) | 848 (16.0%) |
| 45 to 54 Years | 5,140 (90.5%) | 541 (9.5%) |
| 55 to 64 Years | 5,700 (90.5%) | 597 (9.5%) |
| 65 to 74 Years | 4,617 (99.1%) | 43 (0.9%) |
| 75 Years and older | 3,310 (99.0%) | 33 (1.0%) |
| Total | 39,554 (86.7%) | 6,054 (13.3%) |
Health Insurance Coverage by Citizenship Status in Marshall County
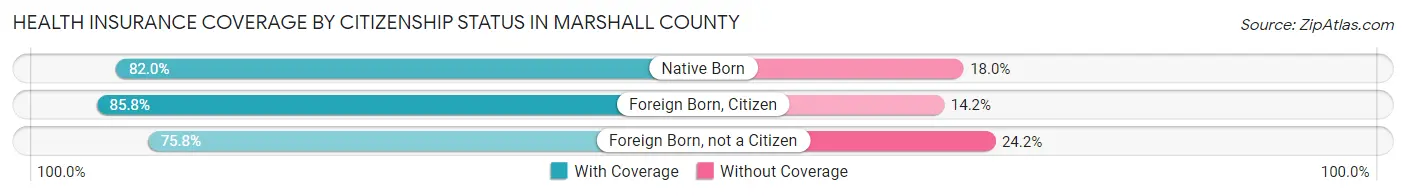
| Citizenship Status | With Coverage | Without Coverage |
| Native Born | 2,794 (82.0%) | 612 (18.0%) |
| Foreign Born, Citizen | 7,549 (85.8%) | 1,245 (14.2%) |
| Foreign Born, not a Citizen | 2,774 (75.8%) | 886 (24.2%) |
Health Insurance Coverage by Household Income in Marshall County
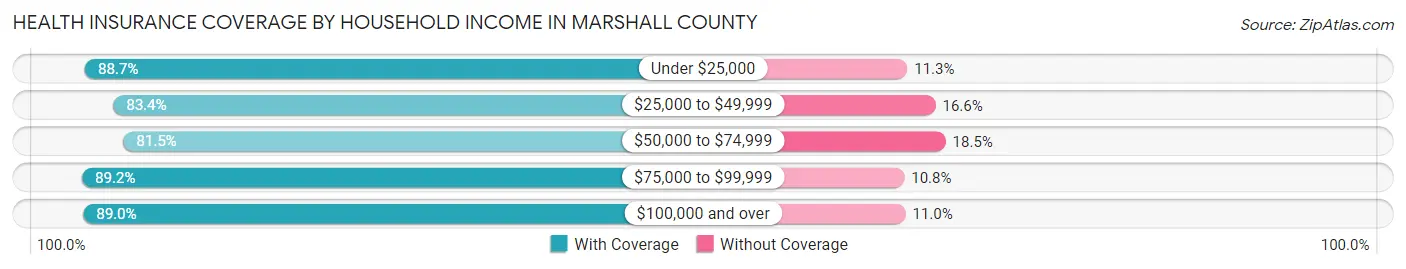
| Household Income | With Coverage | Without Coverage |
| Under $25,000 | 3,465 (88.7%) | 443 (11.3%) |
| $25,000 to $49,999 | 7,527 (83.4%) | 1,501 (16.6%) |
| $50,000 to $74,999 | 5,839 (81.5%) | 1,327 (18.5%) |
| $75,000 to $99,999 | 7,673 (89.2%) | 926 (10.8%) |
| $100,000 and over | 14,850 (89.0%) | 1,837 (11.0%) |
Public vs Private Health Insurance Coverage by Age in Marshall County

| Age Bracket | Public Insurance | Private Insurance |
| Under 6 | 1,163 (34.2%) | 1,713 (50.3%) |
| 6 to 18 Years | 2,559 (29.1%) | 5,580 (63.4%) |
| 19 to 25 Years | 522 (14.3%) | 2,412 (65.9%) |
| 25 to 34 Years | 670 (15.1%) | 2,669 (60.0%) |
| 35 to 44 Years | 697 (13.1%) | 3,975 (74.8%) |
| 45 to 54 Years | 628 (11.1%) | 4,581 (80.6%) |
| 55 to 64 Years | 1,116 (17.7%) | 4,902 (77.8%) |
| 65 to 74 Years | 4,334 (93.0%) | 2,467 (52.9%) |
| 75 Years and over | 3,258 (97.5%) | 1,796 (53.7%) |
| Total | 14,947 (32.8%) | 30,095 (66.0%) |
Disability Status by Sex by Age in Marshall County

| Age Bracket | Male | Female |
| Under 5 Years | 45 (2.9%) | 0 (0.0%) |
| 5 to 17 Years | 468 (10.5%) | 208 (5.1%) |
| 18 to 34 Years | 227 (4.8%) | 274 (6.5%) |
| 35 to 64 Years | 980 (11.1%) | 1,073 (12.6%) |
| 65 to 74 Years | 464 (20.7%) | 462 (19.1%) |
| 75 Years and over | 581 (43.4%) | 916 (45.7%) |
Disability Class by Sex by Age in Marshall County
Disability Class: Hearing Difficulty

| Age Bracket | Male | Female |
| Under 5 Years | 45 (2.9%) | 0 (0.0%) |
| 5 to 17 Years | 2 (0.0%) | 34 (0.8%) |
| 18 to 34 Years | 34 (0.7%) | 23 (0.5%) |
| 35 to 64 Years | 347 (3.9%) | 148 (1.7%) |
| 65 to 74 Years | 234 (10.4%) | 162 (6.7%) |
| 75 Years and over | 347 (25.9%) | 370 (18.5%) |
Disability Class: Vision Difficulty
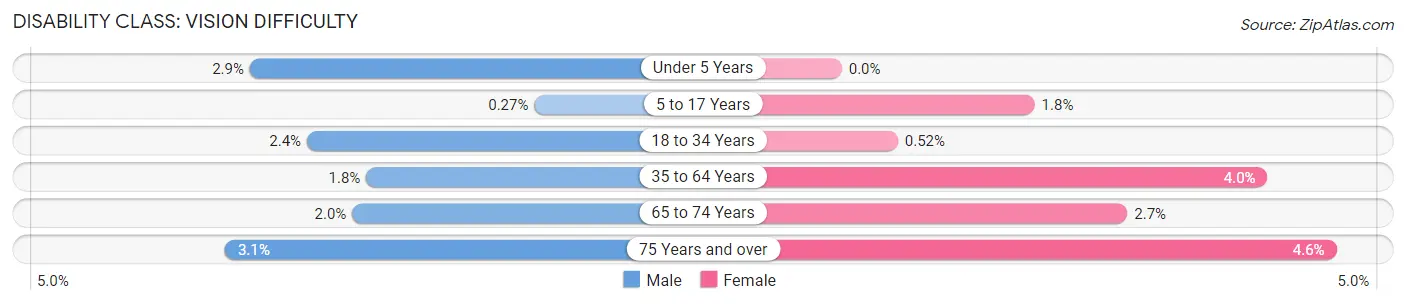
| Age Bracket | Male | Female |
| Under 5 Years | 45 (2.9%) | 0 (0.0%) |
| 5 to 17 Years | 12 (0.3%) | 73 (1.8%) |
| 18 to 34 Years | 112 (2.4%) | 22 (0.5%) |
| 35 to 64 Years | 161 (1.8%) | 336 (4.0%) |
| 65 to 74 Years | 44 (2.0%) | 64 (2.6%) |
| 75 Years and over | 42 (3.1%) | 92 (4.6%) |
Disability Class: Cognitive Difficulty

| Age Bracket | Male | Female |
| 5 to 17 Years | 403 (9.0%) | 149 (3.7%) |
| 18 to 34 Years | 131 (2.8%) | 236 (5.6%) |
| 35 to 64 Years | 190 (2.2%) | 562 (6.6%) |
| 65 to 74 Years | 88 (3.9%) | 88 (3.6%) |
| 75 Years and over | 124 (9.3%) | 344 (17.2%) |
Disability Class: Ambulatory Difficulty

| Age Bracket | Male | Female |
| 5 to 17 Years | 17 (0.4%) | 54 (1.3%) |
| 18 to 34 Years | 0 (0.0%) | 50 (1.2%) |
| 35 to 64 Years | 481 (5.5%) | 576 (6.8%) |
| 65 to 74 Years | 213 (9.5%) | 270 (11.2%) |
| 75 Years and over | 392 (29.3%) | 658 (32.8%) |
Disability Class: Self-Care Difficulty

| Age Bracket | Male | Female |
| 5 to 17 Years | 117 (2.6%) | 54 (1.3%) |
| 18 to 34 Years | 1 (0.0%) | 21 (0.5%) |
| 35 to 64 Years | 128 (1.5%) | 169 (2.0%) |
| 65 to 74 Years | 113 (5.0%) | 98 (4.1%) |
| 75 Years and over | 151 (11.3%) | 222 (11.1%) |
Technology Access in Marshall County
Computing Device Access in Marshall County

| Device Type | # Households | % Households |
| Desktop or Laptop | 11,613 | 68.7% |
| Smartphone | 13,397 | 79.2% |
| Tablet | 9,261 | 54.7% |
| No Computing Device | 2,240 | 13.2% |
| Total | 16,915 | 100.0% |
Internet Access in Marshall County
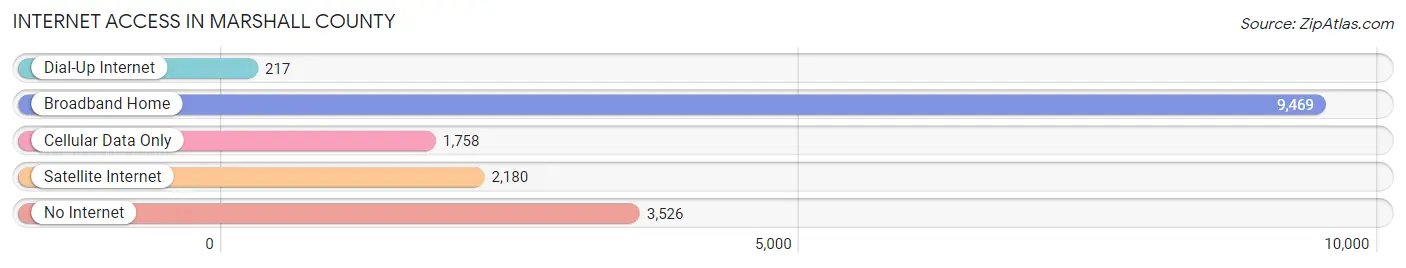
| Internet Type | # Households | % Households |
| Dial-Up Internet | 217 | 1.3% |
| Broadband Home | 9,469 | 56.0% |
| Cellular Data Only | 1,758 | 10.4% |
| Satellite Internet | 2,180 | 12.9% |
| No Internet | 3,526 | 20.8% |
| Total | 16,915 | 100.0% |
Marshall County Summary
Marshall County, Indiana is located in the northern part of the state, just south of the Michigan border. It is part of the South Bend-Mishawaka metropolitan area and is bordered by St. Joseph County to the north, Elkhart County to the east, Fulton County to the south, and Starke County to the west. The county seat is Plymouth, and the largest city is Bremen.
History
Marshall County was formed in 1836 from parts of St. Joseph and Elkhart counties. It was named after Chief Justice of the Supreme Court John Marshall. The first settlers arrived in the area in the early 1830s, and the county was officially organized in 1836. The first county seat was located in the town of La Paz, but it was moved to Plymouth in 1837.
The county experienced rapid growth in the late 19th and early 20th centuries, due in part to the development of the railroad. The first railroad line was built in 1851, and by the early 1900s, the county had several railroads running through it. This allowed for the development of several industries, including the manufacture of farm equipment, furniture, and other products.
Geography
Marshall County covers an area of 437 square miles and is located in the northern part of Indiana. It is bordered by St. Joseph County to the north, Elkhart County to the east, Fulton County to the south, and Starke County to the west. The county is mostly flat, with some rolling hills in the northern part. The highest point in the county is located in the town of Bourbon, at an elevation of 890 feet.
The county is drained by the Yellow River, which flows through the center of the county. Other major waterways include the Tippecanoe River, which forms the western border of the county, and the Kankakee River, which forms the eastern border.
Economy
Marshall County has a diverse economy, with a mix of manufacturing, agriculture, and services. The county is home to several large manufacturing companies, including Bremen Castings, which produces aluminum and steel castings, and Bremen Automotive, which manufactures automotive parts.
Agriculture is also an important part of the county’s economy. The county is home to several large farms, which produce corn, soybeans, wheat, and other crops. Livestock production is also important, with the county being home to several large dairy farms.
The county also has a thriving service sector, with several large employers in the healthcare, education, and retail industries. The county is home to several hospitals, including the Plymouth Medical Center, and several colleges and universities, including Ancilla College and Indiana University South Bend.
Demographics
As of the 2010 census, Marshall County had a population of 47,051. The population is predominantly white (93.3%), with small percentages of African Americans (2.3%), Hispanics (2.2%), and Asians (1.2%). The median household income is $50,945, and the median home value is $118,400.
The county is served by several school districts, including the Plymouth Community School Corporation, the Bremen Public School Corporation, and the Triton School Corporation. The county is also home to several private schools, including the Plymouth Christian Academy and the Bremen Christian Academy.
Conclusion
Marshall County, Indiana is a diverse and vibrant county located in the northern part of the state. It has a rich history, a diverse economy, and a population that is predominantly white. The county is home to several large manufacturing companies, several large farms, and a thriving service sector. It is also served by several school districts and private schools. Marshall County is an ideal place to live, work, and raise a family.
Common Questions
What is the Total Population of Marshall County?
Total Population of Marshall County is 46,208.
What is the Total Male Population of Marshall County?
Total Male Population of Marshall County is 23,370.
What is the Total Female Population of Marshall County?
Total Female Population of Marshall County is 22,838.
What is the Ratio of Males per 100 Females in Marshall County?
There are 102.33 Males per 100 Females in Marshall County.
What is the Ratio of Females per 100 Males in Marshall County?
There are 97.72 Females per 100 Males in Marshall County.
What is the Median Population Age in Marshall County?
Median Population Age in Marshall County is 39.9 Years.
What is the Average Family Size in Marshall County
Average Family Size in Marshall County is 3.3 People.
What is the Average Household Size in Marshall County
Average Household Size in Marshall County is 2.7 People.
What is Per Capita Income in Marshall County?
Per Capita income in Marshall County is $32,218.
What is the Median Family Income in Marshall County?
Median Family Income in Marshall County is $82,926.
What is the Median Household income in Marshall County?
Median Household Income in Marshall County is $66,016.
What is Income or Wage Gap in Marshall County?
Income or Wage Gap in Marshall County is 34.1%.
Women in Marshall County earn 65.9 cents for every dollar earned by a man.
What is Family Income Deficit in Marshall County?
Family Income Deficit in Marshall County is $11,118.
Families that are below poverty line in Marshall County earn $11,118 less on average than the poverty threshold level.
What is Inequality or Gini Index in Marshall County?
Inequality or Gini Index in Marshall County is 0.43.
How Large is the Labor Force in Marshall County?
There are 22,425 People in the Labor Forcein in Marshall County.
What is the Percentage of People in the Labor Force in Marshall County?
62.0% of People are in the Labor Force in Marshall County.
What is the Unemployment Rate in Marshall County?
Unemployment Rate in Marshall County is 3.0%.