Marion County, IN
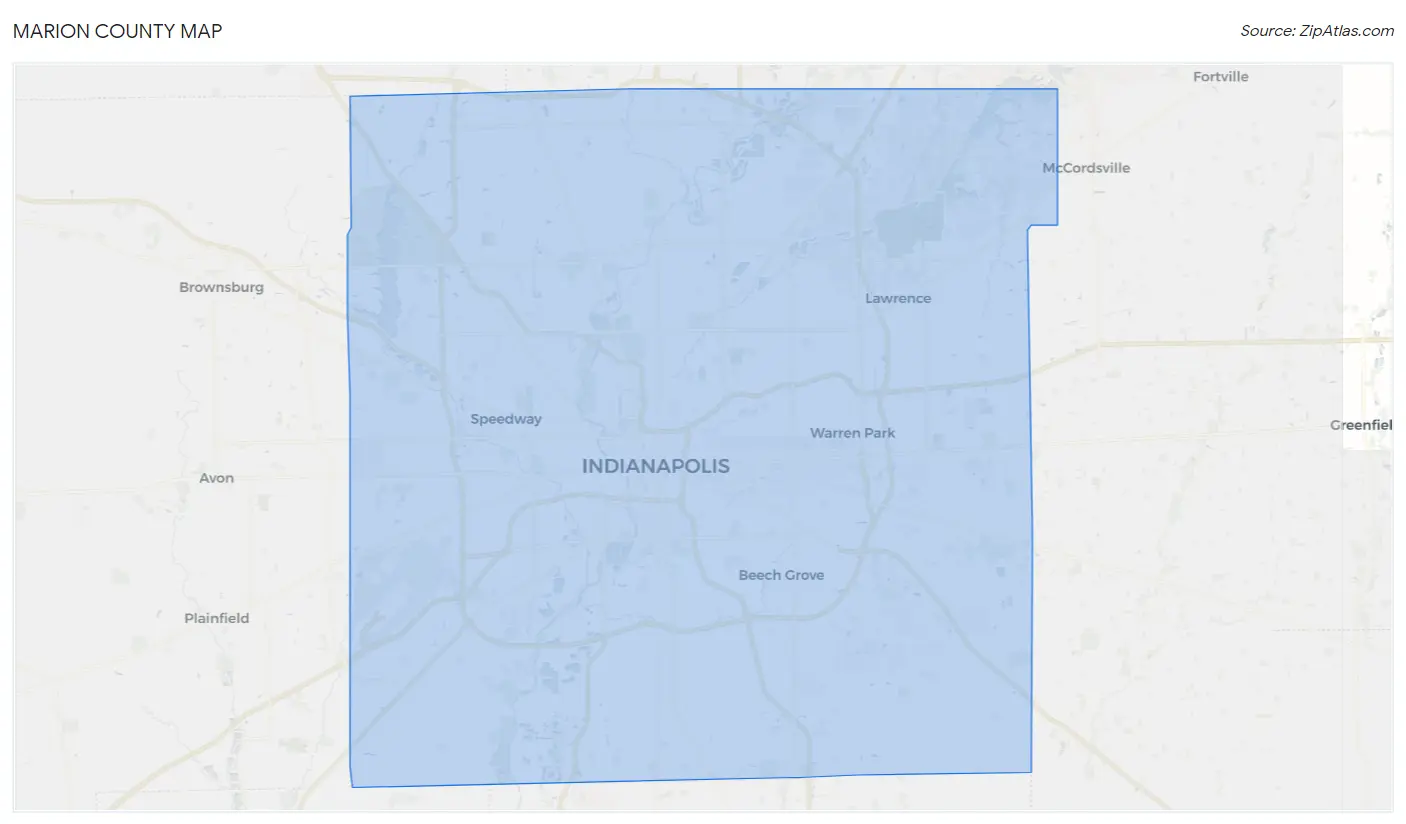
Marion County Map
Marion County Overview
971,737
TOTAL POPULATION
471,206
MALE POPULATION
500,531
FEMALE POPULATION
94.14
MALES / 100 FEMALES
106.22
FEMALES / 100 MALES
34.4
MEDIAN AGE
3.3
AVG FAMILY SIZE
2.4
AVG HOUSEHOLD SIZE
$34,796
PER CAPITA INCOME
$76,851
AVG FAMILY INCOME
$59,504
AVG HOUSEHOLD INCOME
19.3%
WAGE / INCOME GAP [ % ]
80.7¢/ $1
WAGE / INCOME GAP [ $ ]
$12,112
FAMILY INCOME DEFICIT
0.47
INEQUALITY / GINI INDEX
511,904
LABOR FORCE [ PEOPLE ]
67.5%
PERCENT IN LABOR FORCE
5.5%
UNEMPLOYMENT RATE
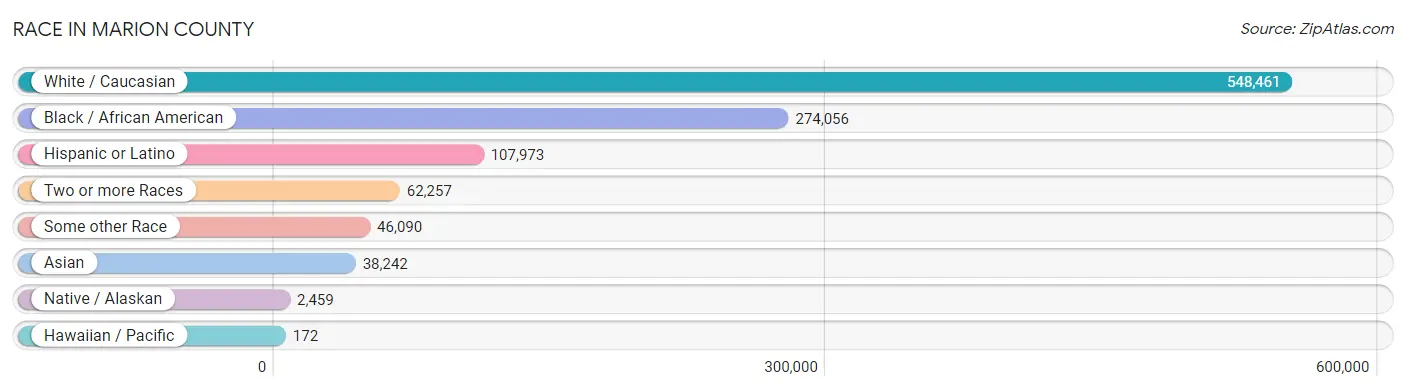
Race in Marion County
The most populous races in Marion County are White / Caucasian (548,461 | 56.4%), Black / African American (274,056 | 28.2%), and Hispanic or Latino (107,973 | 11.1%).
| Race | # Population | % Population |
| Asian | 38,242 | 3.9% |
| Black / African American | 274,056 | 28.2% |
| Hawaiian / Pacific | 172 | 0.0% |
| Hispanic or Latino | 107,973 | 11.1% |
| Native / Alaskan | 2,459 | 0.3% |
| White / Caucasian | 548,461 | 56.4% |
| Two or more Races | 62,257 | 6.4% |
| Some other Race | 46,090 | 4.7% |
| Total | 971,737 | 100.0% |
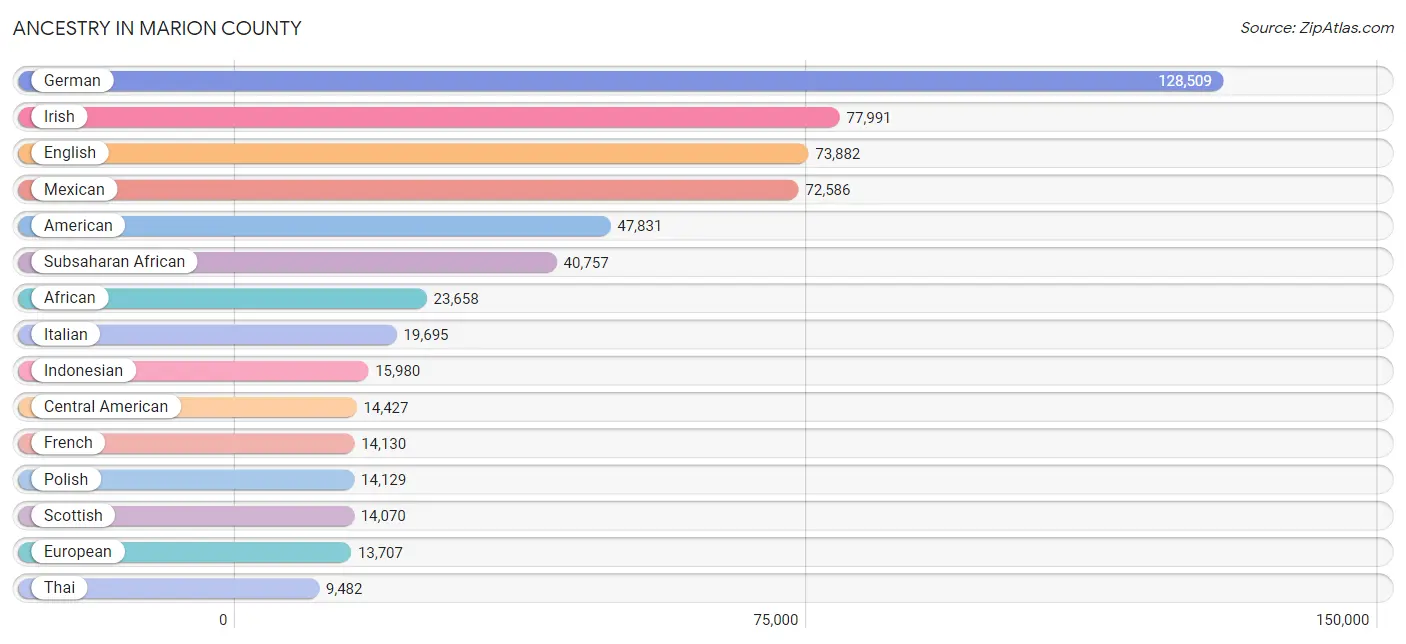
Ancestry in Marion County
The most populous ancestries reported in Marion County are German (128,509 | 13.2%), Irish (77,991 | 8.0%), English (73,882 | 7.6%), Mexican (72,586 | 7.5%), and American (47,831 | 4.9%), together accounting for 41.2% of all Marion County residents.
| Ancestry | # Population | % Population |
| Afghan | 111 | 0.0% |
| African | 23,658 | 2.4% |
| Alaskan Athabascan | 112 | 0.0% |
| Albanian | 15 | 0.0% |
| Alsatian | 9 | 0.0% |
| American | 47,831 | 4.9% |
| Apache | 237 | 0.0% |
| Arab | 3,464 | 0.4% |
| Arapaho | 37 | 0.0% |
| Argentinean | 176 | 0.0% |
| Armenian | 315 | 0.0% |
| Australian | 146 | 0.0% |
| Austrian | 1,116 | 0.1% |
| Bahamian | 83 | 0.0% |
| Bangladeshi | 180 | 0.0% |
| Barbadian | 212 | 0.0% |
| Basque | 38 | 0.0% |
| Belgian | 1,158 | 0.1% |
| Belizean | 27 | 0.0% |
| Bhutanese | 2,073 | 0.2% |
| Blackfeet | 272 | 0.0% |
| Bolivian | 28 | 0.0% |
| Brazilian | 397 | 0.0% |
| British | 4,577 | 0.5% |
| British West Indian | 28 | 0.0% |
| Bulgarian | 121 | 0.0% |
| Burmese | 2,125 | 0.2% |
| Cajun | 54 | 0.0% |
| Canadian | 510 | 0.1% |
| Cape Verdean | 21 | 0.0% |
| Carpatho Rusyn | 24 | 0.0% |
| Celtic | 112 | 0.0% |
| Central American | 14,427 | 1.5% |
| Central American Indian | 574 | 0.1% |
| Cherokee | 2,625 | 0.3% |
| Chickasaw | 13 | 0.0% |
| Chilean | 155 | 0.0% |
| Chinese | 20 | 0.0% |
| Chippewa | 153 | 0.0% |
| Choctaw | 183 | 0.0% |
| Colombian | 1,374 | 0.1% |
| Costa Rican | 152 | 0.0% |
| Cree | 16 | 0.0% |
| Creek | 7 | 0.0% |
| Croatian | 723 | 0.1% |
| Crow | 28 | 0.0% |
| Cuban | 1,956 | 0.2% |
| Cypriot | 32 | 0.0% |
| Czech | 1,505 | 0.2% |
| Czechoslovakian | 317 | 0.0% |
| Danish | 1,454 | 0.2% |
| Dominican | 2,497 | 0.3% |
| Dutch | 7,670 | 0.8% |
| Eastern European | 1,309 | 0.1% |
| Ecuadorian | 173 | 0.0% |
| Egyptian | 269 | 0.0% |
| English | 73,882 | 7.6% |
| Estonian | 48 | 0.0% |
| Ethiopian | 1,134 | 0.1% |
| European | 13,707 | 1.4% |
| Fijian | 9 | 0.0% |
| Filipino | 44 | 0.0% |
| Finnish | 837 | 0.1% |
| French | 14,130 | 1.5% |
| French American Indian | 7 | 0.0% |
| French Canadian | 1,545 | 0.2% |
| German | 128,509 | 13.2% |
| German Russian | 41 | 0.0% |
| Ghanaian | 752 | 0.1% |
| Greek | 2,276 | 0.2% |
| Guamanian / Chamorro | 111 | 0.0% |
| Guatemalan | 3,943 | 0.4% |
| Guyanese | 79 | 0.0% |
| Haitian | 3,134 | 0.3% |
| Honduran | 4,149 | 0.4% |
| Hopi | 5 | 0.0% |
| Hungarian | 1,913 | 0.2% |
| Icelander | 23 | 0.0% |
| Indian (Asian) | 5,113 | 0.5% |
| Indonesian | 15,980 | 1.6% |
| Inupiat | 31 | 0.0% |
| Iranian | 549 | 0.1% |
| Iraqi | 149 | 0.0% |
| Irish | 77,991 | 8.0% |
| Iroquois | 73 | 0.0% |
| Israeli | 303 | 0.0% |
| Italian | 19,695 | 2.0% |
| Jamaican | 1,013 | 0.1% |
| Japanese | 465 | 0.1% |
| Jordanian | 169 | 0.0% |
| Kenyan | 874 | 0.1% |
| Kiowa | 12 | 0.0% |
| Korean | 5,685 | 0.6% |
| Laotian | 101 | 0.0% |
| Latvian | 305 | 0.0% |
| Lebanese | 1,008 | 0.1% |
| Liberian | 479 | 0.1% |
| Lithuanian | 1,185 | 0.1% |
| Luxembourger | 56 | 0.0% |
| Macedonian | 284 | 0.0% |
| Malaysian | 653 | 0.1% |
| Menominee | 26 | 0.0% |
| Mexican | 72,586 | 7.5% |
| Mexican American Indian | 1,774 | 0.2% |
| Mongolian | 160 | 0.0% |
| Moroccan | 213 | 0.0% |
| Native Hawaiian | 279 | 0.0% |
| Navajo | 21 | 0.0% |
| New Zealander | 136 | 0.0% |
| Nicaraguan | 1,169 | 0.1% |
| Nigerian | 8,733 | 0.9% |
| Northern European | 1,014 | 0.1% |
| Norwegian | 4,237 | 0.4% |
| Pakistani | 619 | 0.1% |
| Palestinian | 298 | 0.0% |
| Panamanian | 573 | 0.1% |
| Pennsylvania German | 224 | 0.0% |
| Peruvian | 693 | 0.1% |
| Pima | 14 | 0.0% |
| Polish | 14,129 | 1.5% |
| Portuguese | 528 | 0.1% |
| Potawatomi | 127 | 0.0% |
| Pueblo | 29 | 0.0% |
| Puerto Rican | 6,164 | 0.6% |
| Romanian | 996 | 0.1% |
| Russian | 2,511 | 0.3% |
| Salvadoran | 4,417 | 0.4% |
| Samoan | 223 | 0.0% |
| Scandinavian | 1,882 | 0.2% |
| Scotch-Irish | 6,405 | 0.7% |
| Scottish | 14,070 | 1.5% |
| Seminole | 42 | 0.0% |
| Senegalese | 343 | 0.0% |
| Serbian | 726 | 0.1% |
| Shoshone | 7 | 0.0% |
| Sierra Leonean | 48 | 0.0% |
| Sioux | 230 | 0.0% |
| Slavic | 575 | 0.1% |
| Slovak | 1,179 | 0.1% |
| Slovene | 697 | 0.1% |
| Somali | 125 | 0.0% |
| South African | 222 | 0.0% |
| South American | 4,626 | 0.5% |
| South American Indian | 64 | 0.0% |
| Soviet Union | 10 | 0.0% |
| Spaniard | 886 | 0.1% |
| Spanish | 869 | 0.1% |
| Spanish American | 49 | 0.0% |
| Sri Lankan | 1,435 | 0.2% |
| Subsaharan African | 40,757 | 4.2% |
| Sudanese | 130 | 0.0% |
| Swedish | 4,503 | 0.5% |
| Swiss | 2,745 | 0.3% |
| Syrian | 328 | 0.0% |
| Thai | 9,482 | 1.0% |
| Tongan | 38 | 0.0% |
| Trinidadian and Tobagonian | 197 | 0.0% |
| Turkish | 167 | 0.0% |
| U.S. Virgin Islander | 50 | 0.0% |
| Ugandan | 47 | 0.0% |
| Ukrainian | 1,386 | 0.1% |
| Uruguayan | 43 | 0.0% |
| Venezuelan | 1,973 | 0.2% |
| Vietnamese | 736 | 0.1% |
| Welsh | 4,869 | 0.5% |
| West Indian | 320 | 0.0% |
| Yaqui | 6 | 0.0% |
| Yugoslavian | 231 | 0.0% |
| Zimbabwean | 92 | 0.0% | View All 169 Rows |
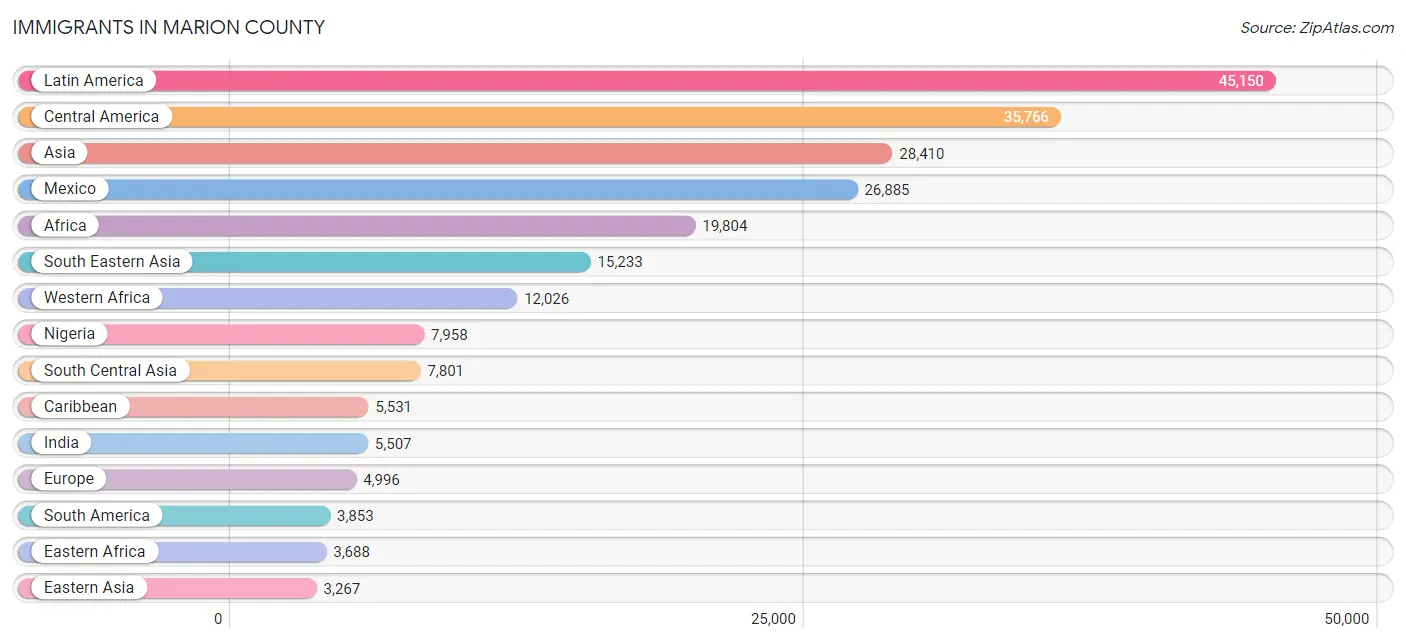
Immigrants in Marion County
The most numerous immigrant groups reported in Marion County came from Latin America (45,150 | 4.6%), Central America (35,766 | 3.7%), Asia (28,410 | 2.9%), Mexico (26,885 | 2.8%), and Africa (19,804 | 2.0%), together accounting for 16.1% of all Marion County residents.
| Immigration Origin | # Population | % Population |
| Afghanistan | 274 | 0.0% |
| Africa | 19,804 | 2.0% |
| Albania | 7 | 0.0% |
| Argentina | 31 | 0.0% |
| Asia | 28,410 | 2.9% |
| Australia | 139 | 0.0% |
| Austria | 54 | 0.0% |
| Bahamas | 230 | 0.0% |
| Bangladesh | 884 | 0.1% |
| Barbados | 207 | 0.0% |
| Belarus | 39 | 0.0% |
| Belgium | 12 | 0.0% |
| Belize | 34 | 0.0% |
| Bolivia | 37 | 0.0% |
| Bosnia and Herzegovina | 146 | 0.0% |
| Brazil | 416 | 0.0% |
| Bulgaria | 57 | 0.0% |
| Cambodia | 239 | 0.0% |
| Cameroon | 749 | 0.1% |
| Canada | 564 | 0.1% |
| Caribbean | 5,531 | 0.6% |
| Central America | 35,766 | 3.7% |
| Chile | 159 | 0.0% |
| China | 2,029 | 0.2% |
| Colombia | 812 | 0.1% |
| Congo | 537 | 0.1% |
| Costa Rica | 66 | 0.0% |
| Croatia | 24 | 0.0% |
| Cuba | 302 | 0.0% |
| Czechoslovakia | 5 | 0.0% |
| Denmark | 32 | 0.0% |
| Dominica | 24 | 0.0% |
| Dominican Republic | 1,637 | 0.2% |
| Eastern Africa | 3,688 | 0.4% |
| Eastern Asia | 3,267 | 0.3% |
| Eastern Europe | 2,217 | 0.2% |
| Ecuador | 109 | 0.0% |
| Egypt | 180 | 0.0% |
| El Salvador | 3,245 | 0.3% |
| England | 502 | 0.1% |
| Eritrea | 509 | 0.1% |
| Ethiopia | 660 | 0.1% |
| Europe | 4,996 | 0.5% |
| France | 70 | 0.0% |
| Germany | 699 | 0.1% |
| Ghana | 552 | 0.1% |
| Greece | 132 | 0.0% |
| Guatemala | 2,121 | 0.2% |
| Guyana | 48 | 0.0% |
| Haiti | 2,269 | 0.2% |
| Honduras | 2,660 | 0.3% |
| Hong Kong | 66 | 0.0% |
| Hungary | 28 | 0.0% |
| India | 5,507 | 0.6% |
| Indonesia | 43 | 0.0% |
| Iran | 372 | 0.0% |
| Iraq | 235 | 0.0% |
| Ireland | 141 | 0.0% |
| Israel | 104 | 0.0% |
| Italy | 173 | 0.0% |
| Jamaica | 538 | 0.1% |
| Japan | 436 | 0.0% |
| Jordan | 233 | 0.0% |
| Kazakhstan | 13 | 0.0% |
| Kenya | 1,097 | 0.1% |
| Korea | 802 | 0.1% |
| Kuwait | 17 | 0.0% |
| Laos | 298 | 0.0% |
| Latin America | 45,150 | 4.6% |
| Latvia | 54 | 0.0% |
| Lebanon | 215 | 0.0% |
| Liberia | 491 | 0.1% |
| Lithuania | 14 | 0.0% |
| Malaysia | 1,080 | 0.1% |
| Mexico | 26,885 | 2.8% |
| Middle Africa | 2,173 | 0.2% |
| Moldova | 40 | 0.0% |
| Morocco | 106 | 0.0% |
| Nepal | 31 | 0.0% |
| Netherlands | 91 | 0.0% |
| Nicaragua | 639 | 0.1% |
| Nigeria | 7,958 | 0.8% |
| North Macedonia | 51 | 0.0% |
| Northern Africa | 762 | 0.1% |
| Northern Europe | 1,260 | 0.1% |
| Norway | 53 | 0.0% |
| Oceania | 344 | 0.0% |
| Pakistan | 621 | 0.1% |
| Panama | 116 | 0.0% |
| Peru | 478 | 0.1% |
| Philippines | 2,013 | 0.2% |
| Poland | 125 | 0.0% |
| Portugal | 113 | 0.0% |
| Romania | 359 | 0.0% |
| Russia | 572 | 0.1% |
| Saudi Arabia | 552 | 0.1% |
| Scotland | 51 | 0.0% |
| Senegal | 422 | 0.0% |
| Serbia | 49 | 0.0% |
| Sierra Leone | 170 | 0.0% |
| Singapore | 60 | 0.0% |
| Somalia | 77 | 0.0% |
| South Africa | 221 | 0.0% |
| South America | 3,853 | 0.4% |
| South Central Asia | 7,801 | 0.8% |
| South Eastern Asia | 15,233 | 1.6% |
| Southern Europe | 563 | 0.1% |
| Spain | 145 | 0.0% |
| Sri Lanka | 43 | 0.0% |
| St. Vincent and the Grenadines | 91 | 0.0% |
| Sudan | 262 | 0.0% |
| Sweden | 9 | 0.0% |
| Switzerland | 23 | 0.0% |
| Syria | 158 | 0.0% |
| Taiwan | 81 | 0.0% |
| Thailand | 927 | 0.1% |
| Trinidad and Tobago | 111 | 0.0% |
| Turkey | 132 | 0.0% |
| Uganda | 326 | 0.0% |
| Ukraine | 539 | 0.1% |
| Uruguay | 38 | 0.0% |
| Uzbekistan | 12 | 0.0% |
| Venezuela | 1,725 | 0.2% |
| Vietnam | 681 | 0.1% |
| West Indies | 43 | 0.0% |
| Western Africa | 12,026 | 1.2% |
| Western Asia | 2,016 | 0.2% |
| Western Europe | 956 | 0.1% |
| Yemen | 37 | 0.0% |
| Zaire | 791 | 0.1% |
| Zimbabwe | 518 | 0.1% | View All 131 Rows |
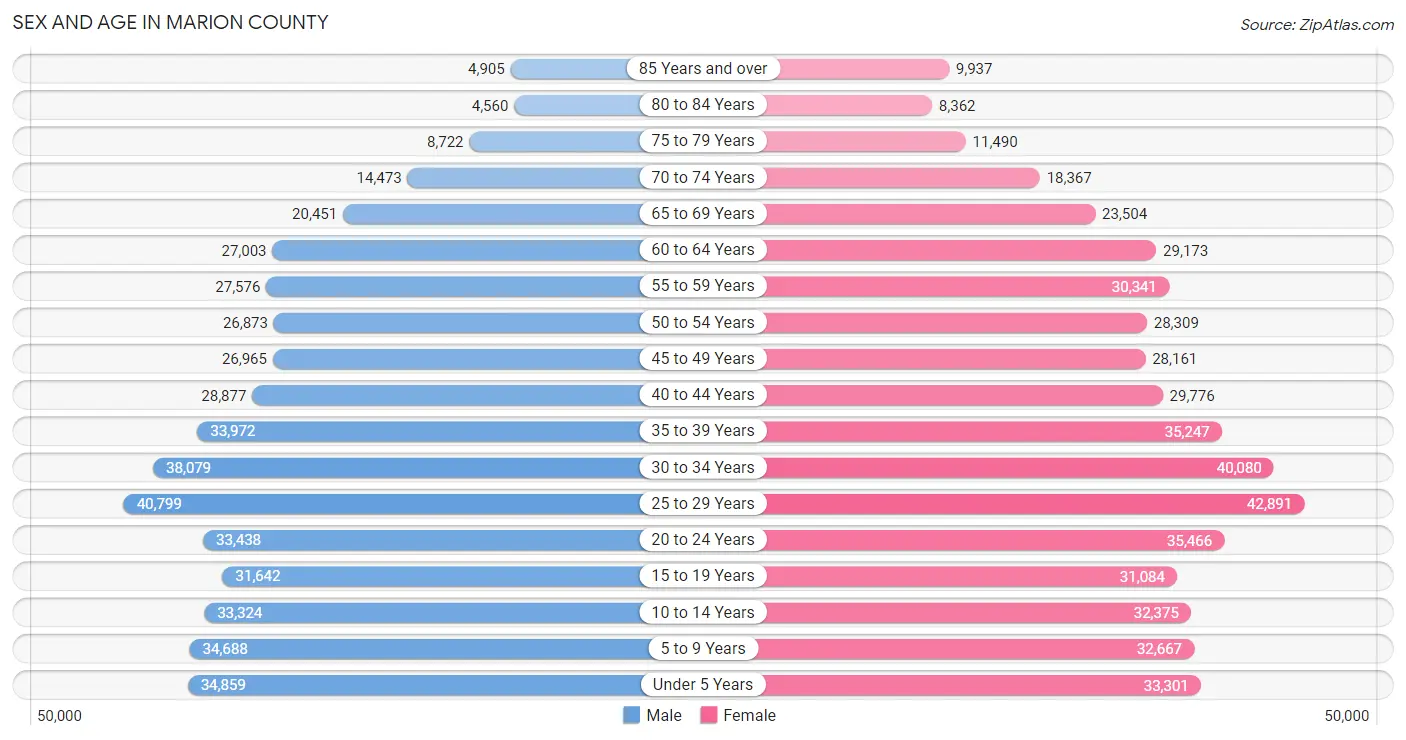
Sex and Age in Marion County
Sex and Age in Marion County
The most populous age groups in Marion County are 25 to 29 Years (40,799 | 8.7%) for men and 25 to 29 Years (42,891 | 8.6%) for women.
| Age Bracket | Male | Female |
| Under 5 Years | 34,859 (7.4%) | 33,301 (6.7%) |
| 5 to 9 Years | 34,688 (7.4%) | 32,667 (6.5%) |
| 10 to 14 Years | 33,324 (7.1%) | 32,375 (6.5%) |
| 15 to 19 Years | 31,642 (6.7%) | 31,084 (6.2%) |
| 20 to 24 Years | 33,438 (7.1%) | 35,466 (7.1%) |
| 25 to 29 Years | 40,799 (8.7%) | 42,891 (8.6%) |
| 30 to 34 Years | 38,079 (8.1%) | 40,080 (8.0%) |
| 35 to 39 Years | 33,972 (7.2%) | 35,247 (7.0%) |
| 40 to 44 Years | 28,877 (6.1%) | 29,776 (5.9%) |
| 45 to 49 Years | 26,965 (5.7%) | 28,161 (5.6%) |
| 50 to 54 Years | 26,873 (5.7%) | 28,309 (5.7%) |
| 55 to 59 Years | 27,576 (5.9%) | 30,341 (6.1%) |
| 60 to 64 Years | 27,003 (5.7%) | 29,173 (5.8%) |
| 65 to 69 Years | 20,451 (4.3%) | 23,504 (4.7%) |
| 70 to 74 Years | 14,473 (3.1%) | 18,367 (3.7%) |
| 75 to 79 Years | 8,722 (1.8%) | 11,490 (2.3%) |
| 80 to 84 Years | 4,560 (1.0%) | 8,362 (1.7%) |
| 85 Years and over | 4,905 (1.0%) | 9,937 (2.0%) |
| Total | 471,206 (100.0%) | 500,531 (100.0%) |
Families and Households in Marion County
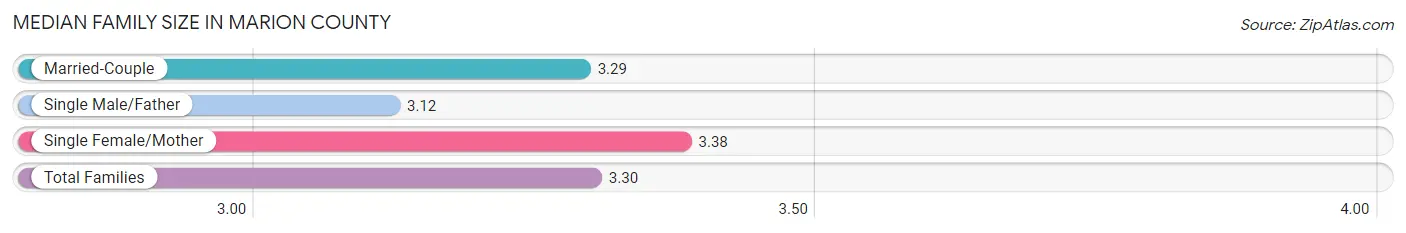
Median Family Size in Marion County
The median family size in Marion County is 3.30 persons per family, with single female/mother families (55,357 | 25.7%) accounting for the largest median family size of 3.38 persons per family. On the other hand, single male/father families (18,237 | 8.5%) represent the smallest median family size with 3.12 persons per family.
| Family Type | # Families | Family Size |
| Married-Couple | 141,839 (65.8%) | 3.29 |
| Single Male/Father | 18,237 (8.5%) | 3.12 |
| Single Female/Mother | 55,357 (25.7%) | 3.38 |
| Total Families | 215,433 (100.0%) | 3.30 |
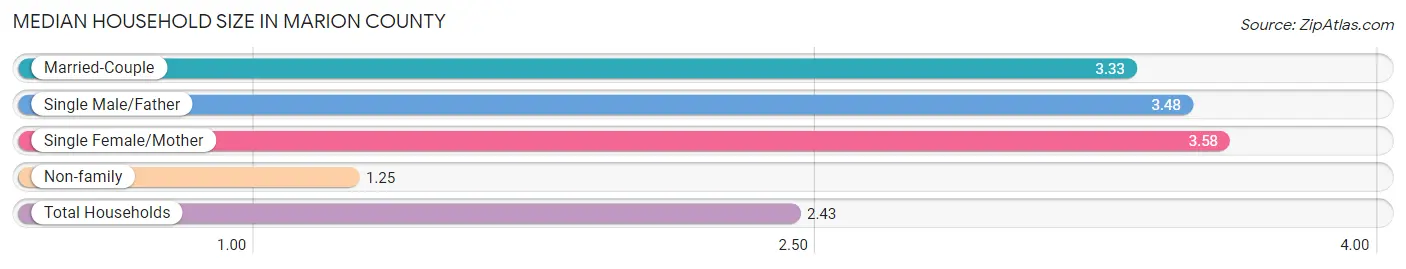
Median Household Size in Marion County
The median household size in Marion County is 2.43 persons per household, with single female/mother households (55,357 | 14.1%) accounting for the largest median household size of 3.58 persons per household. non-family households (177,404 | 45.2%) represent the smallest median household size with 1.25 persons per household.
| Household Type | # Households | Household Size |
| Married-Couple | 141,839 (36.1%) | 3.33 |
| Single Male/Father | 18,237 (4.6%) | 3.48 |
| Single Female/Mother | 55,357 (14.1%) | 3.58 |
| Non-family | 177,404 (45.2%) | 1.25 |
| Total Households | 392,837 (100.0%) | 2.43 |
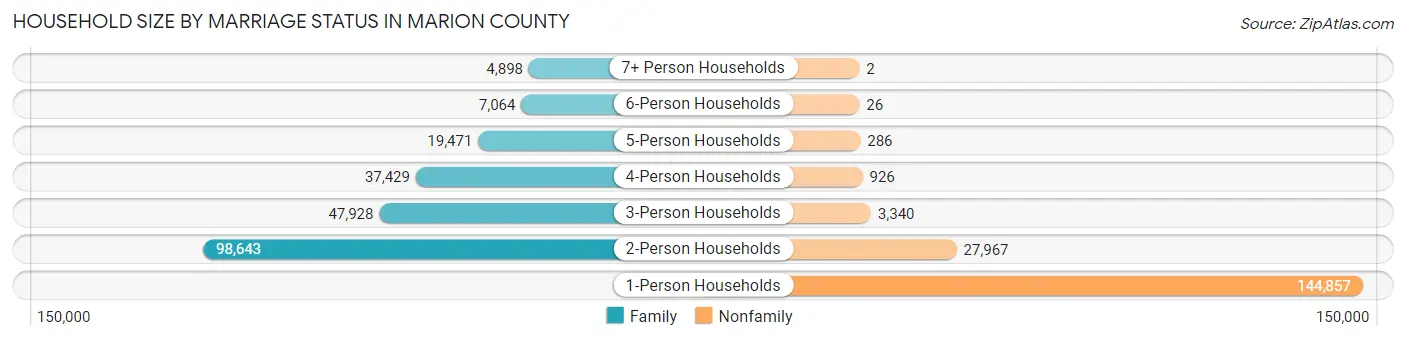
Household Size by Marriage Status in Marion County
Out of a total of 392,837 households in Marion County, 215,433 (54.8%) are family households, while 177,404 (45.2%) are nonfamily households. The most numerous type of family households are 2-person households, comprising 98,643, and the most common type of nonfamily households are 1-person households, comprising 144,857.
| Household Size | Family Households | Nonfamily Households |
| 1-Person Households | - | 144,857 (36.9%) |
| 2-Person Households | 98,643 (25.1%) | 27,967 (7.1%) |
| 3-Person Households | 47,928 (12.2%) | 3,340 (0.9%) |
| 4-Person Households | 37,429 (9.5%) | 926 (0.2%) |
| 5-Person Households | 19,471 (5.0%) | 286 (0.1%) |
| 6-Person Households | 7,064 (1.8%) | 26 (0.0%) |
| 7+ Person Households | 4,898 (1.3%) | 2 (0.0%) |
| Total | 215,433 (54.8%) | 177,404 (45.2%) |
Female Fertility in Marion County
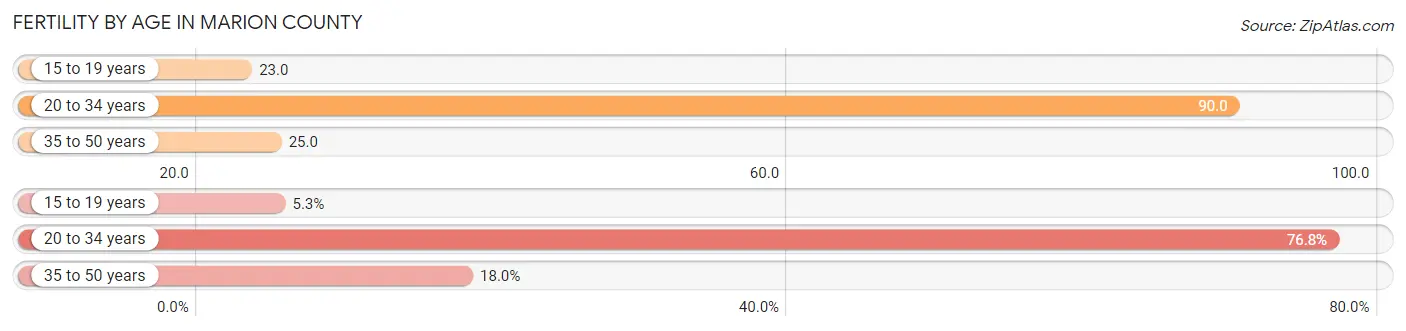
Fertility by Age in Marion County
Average fertility rate in Marion County is 56.0 births per 1,000 women. Women in the age bracket of 20 to 34 years have the highest fertility rate with 90.0 births per 1,000 women. Women in the age bracket of 20 to 34 years acount for 76.7% of all women with births.
| Age Bracket | Women with Births | Births / 1,000 Women |
| 15 to 19 years | 727 (5.3%) | 23.0 |
| 20 to 34 years | 10,607 (76.7%) | 90.0 |
| 35 to 50 years | 2,486 (18.0%) | 25.0 |
| Total | 13,820 (100.0%) | 56.0 |
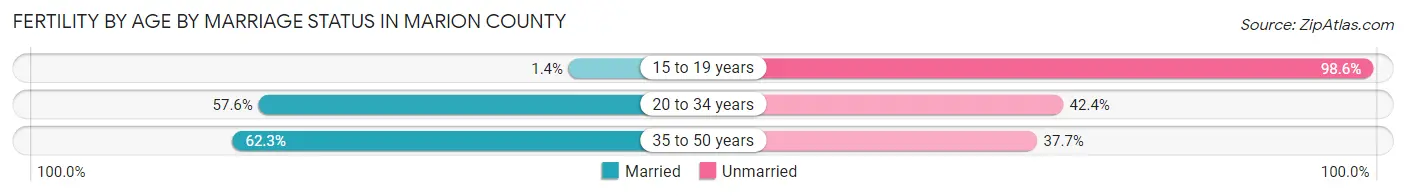
Fertility by Age by Marriage Status in Marion County
55.5% of women with births (13,820) in Marion County are married. The highest percentage of unmarried women with births falls into 15 to 19 years age bracket with 98.6% of them unmarried at the time of birth, while the lowest percentage of unmarried women with births belong to 35 to 50 years age bracket with 37.7% of them unmarried.
| Age Bracket | Married | Unmarried |
| 15 to 19 years | 10 (1.4%) | 717 (98.6%) |
| 20 to 34 years | 6,110 (57.6%) | 4,497 (42.4%) |
| 35 to 50 years | 1,549 (62.3%) | 937 (37.7%) |
| Total | 7,670 (55.5%) | 6,150 (44.5%) |
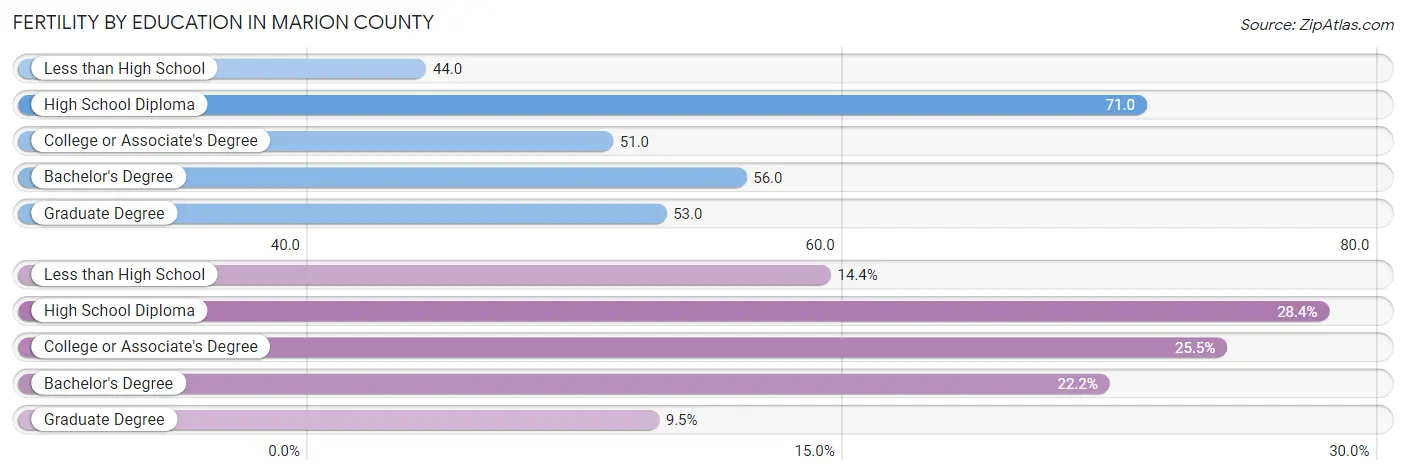
Fertility by Education in Marion County
Average fertility rate in Marion County is 56.0 births per 1,000 women. Women with the education attainment of high school diploma have the highest fertility rate of 71.0 births per 1,000 women, while women with the education attainment of less than high school have the lowest fertility at 44.0 births per 1,000 women. Women with the education attainment of high school diploma represent 28.4% of all women with births.
| Educational Attainment | Women with Births | Births / 1,000 Women |
| Less than High School | 1,986 (14.4%) | 44.0 |
| High School Diploma | 3,922 (28.4%) | 71.0 |
| College or Associate's Degree | 3,525 (25.5%) | 51.0 |
| Bachelor's Degree | 3,069 (22.2%) | 56.0 |
| Graduate Degree | 1,318 (9.5%) | 53.0 |
| Total | 13,820 (100.0%) | 56.0 |
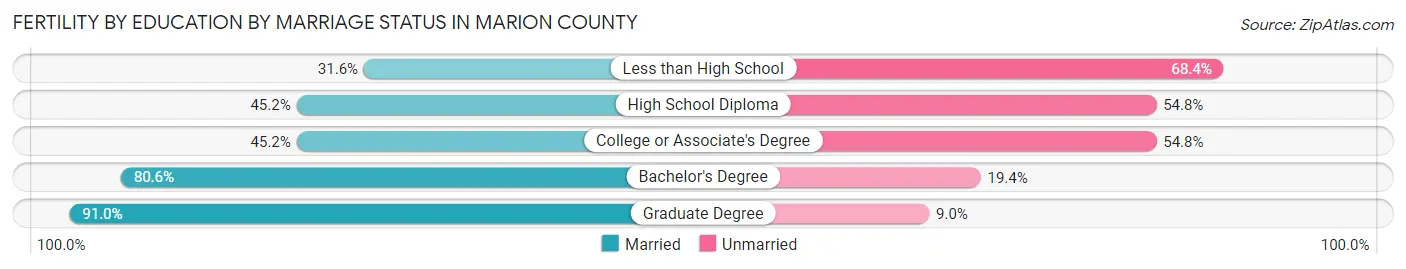
Fertility by Education by Marriage Status in Marion County
44.5% of women with births in Marion County are unmarried. Women with the educational attainment of graduate degree are most likely to be married with 91.0% of them married at childbirth, while women with the educational attainment of less than high school are least likely to be married with 68.4% of them unmarried at childbirth.
| Educational Attainment | Married | Unmarried |
| Less than High School | 628 (31.6%) | 1,358 (68.4%) |
| High School Diploma | 1,773 (45.2%) | 2,149 (54.8%) |
| College or Associate's Degree | 1,593 (45.2%) | 1,932 (54.8%) |
| Bachelor's Degree | 2,474 (80.6%) | 595 (19.4%) |
| Graduate Degree | 1,199 (91.0%) | 119 (9.0%) |
| Total | 7,670 (55.5%) | 6,150 (44.5%) |
Income in Marion County
Income Overview in Marion County
Per Capita Income in Marion County is $34,796, while median incomes of families and households are $76,851 and $59,504 respectively.
| Characteristic | Number | Measure |
| Per Capita Income | 971,737 | $34,796 |
| Median Family Income | 215,433 | $76,851 |
| Mean Family Income | 215,433 | $102,624 |
| Median Household Income | 392,837 | $59,504 |
| Mean Household Income | 392,837 | $83,196 |
| Income Deficit | 215,433 | $12,112 |
| Wage / Income Gap (%) | 971,737 | 19.27% |
| Wage / Income Gap ($) | 971,737 | 80.73¢ per $1 |
| Gini / Inequality Index | 971,737 | 0.47 |
Earnings by Sex in Marion County
Average Earnings in Marion County are $39,403, $43,511 for men and $35,125 for women, a difference of 19.3%.
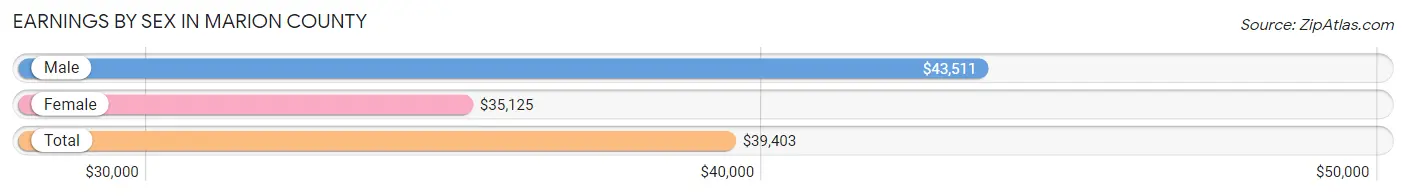
| Sex | Number | Average Earnings |
| Male | 268,243 (50.4%) | $43,511 |
| Female | 264,167 (49.6%) | $35,125 |
| Total | 532,410 (100.0%) | $39,403 |
Earnings by Sex by Income Bracket in Marion County
The most common earnings brackets in Marion County are $100,000+ for men (34,450 | 12.8%) and $75,000 to $99,999 for women (19,142 | 7.2%).
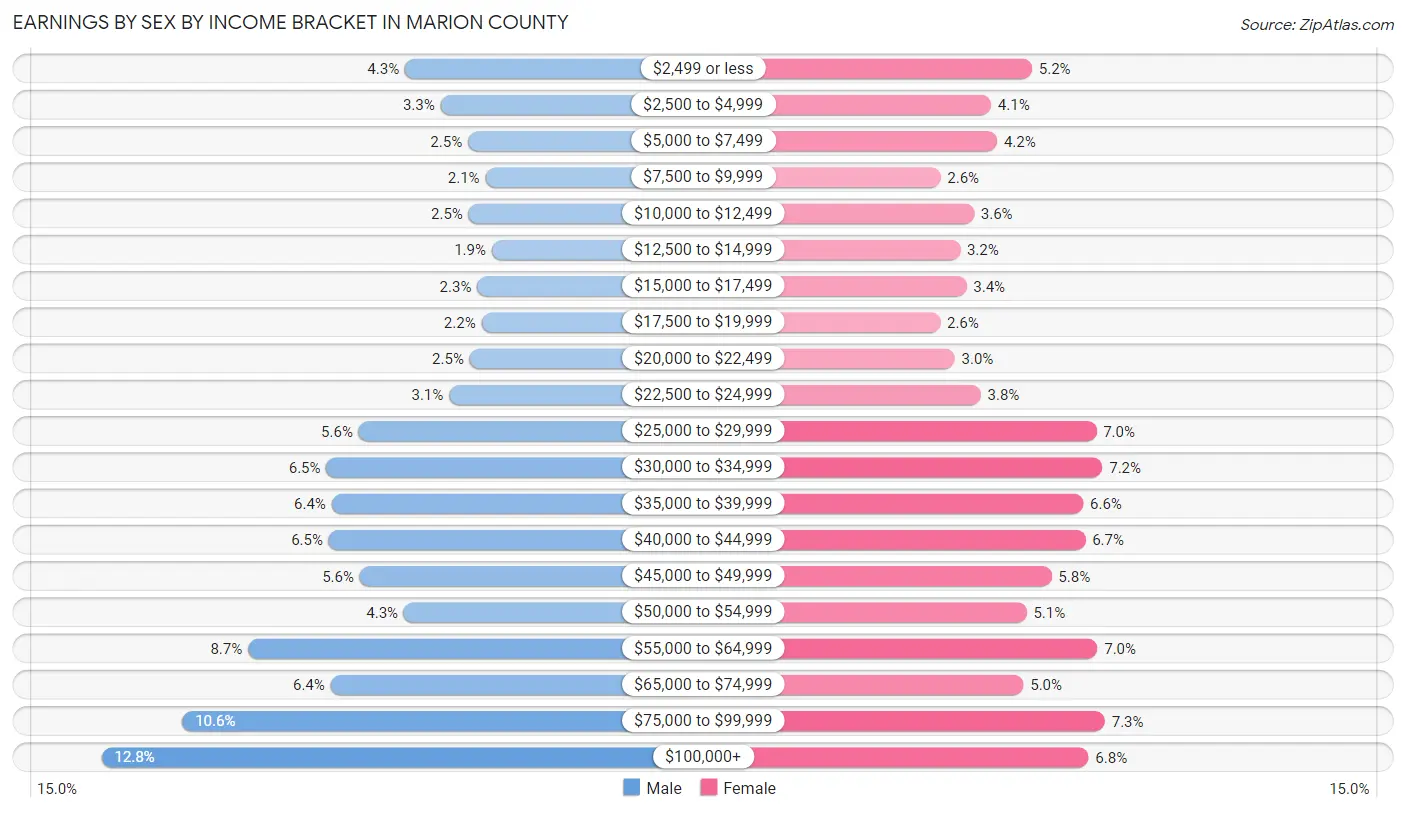
| Income | Male | Female |
| $2,499 or less | 11,571 (4.3%) | 13,740 (5.2%) |
| $2,500 to $4,999 | 8,870 (3.3%) | 10,702 (4.1%) |
| $5,000 to $7,499 | 6,807 (2.5%) | 11,160 (4.2%) |
| $7,500 to $9,999 | 5,504 (2.1%) | 6,957 (2.6%) |
| $10,000 to $12,499 | 6,748 (2.5%) | 9,439 (3.6%) |
| $12,500 to $14,999 | 5,007 (1.9%) | 8,407 (3.2%) |
| $15,000 to $17,499 | 6,124 (2.3%) | 8,871 (3.4%) |
| $17,500 to $19,999 | 5,805 (2.2%) | 6,914 (2.6%) |
| $20,000 to $22,499 | 6,691 (2.5%) | 8,007 (3.0%) |
| $22,500 to $24,999 | 8,240 (3.1%) | 9,939 (3.8%) |
| $25,000 to $29,999 | 15,052 (5.6%) | 18,521 (7.0%) |
| $30,000 to $34,999 | 17,478 (6.5%) | 18,973 (7.2%) |
| $35,000 to $39,999 | 17,084 (6.4%) | 17,545 (6.6%) |
| $40,000 to $44,999 | 17,305 (6.5%) | 17,697 (6.7%) |
| $45,000 to $49,999 | 14,958 (5.6%) | 15,181 (5.8%) |
| $50,000 to $54,999 | 11,638 (4.3%) | 13,328 (5.1%) |
| $55,000 to $64,999 | 23,402 (8.7%) | 18,601 (7.0%) |
| $65,000 to $74,999 | 17,155 (6.4%) | 13,112 (5.0%) |
| $75,000 to $99,999 | 28,354 (10.6%) | 19,142 (7.2%) |
| $100,000+ | 34,450 (12.8%) | 17,931 (6.8%) |
| Total | 268,243 (100.0%) | 264,167 (100.0%) |
Earnings by Sex by Educational Attainment in Marion County
Average earnings in Marion County are $48,790 for men and $39,714 for women, a difference of 18.6%. Men with an educational attainment of graduate degree enjoy the highest average annual earnings of $81,165, while those with less than high school education earn the least with $33,946. Women with an educational attainment of graduate degree earn the most with the average annual earnings of $67,048, while those with less than high school education have the smallest earnings of $22,877.
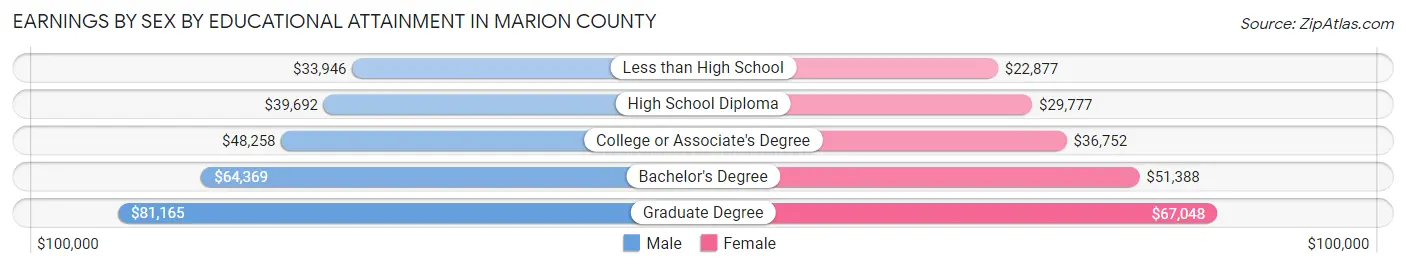
| Educational Attainment | Male Income | Female Income |
| Less than High School | $33,946 | $22,877 |
| High School Diploma | $39,692 | $29,777 |
| College or Associate's Degree | $48,258 | $36,752 |
| Bachelor's Degree | $64,369 | $51,388 |
| Graduate Degree | $81,165 | $67,048 |
| Total | $48,790 | $39,714 |
Family Income in Marion County
Family Income Brackets in Marion County
According to the Marion County family income data, there are 40,071 families falling into the $100,000 to $149,999 income range, which is the most common income bracket and makes up 18.6% of all families. Conversely, the $10,000 to $14,999 income bracket is the least frequent group with only 5,170 families (2.4%) belonging to this category.
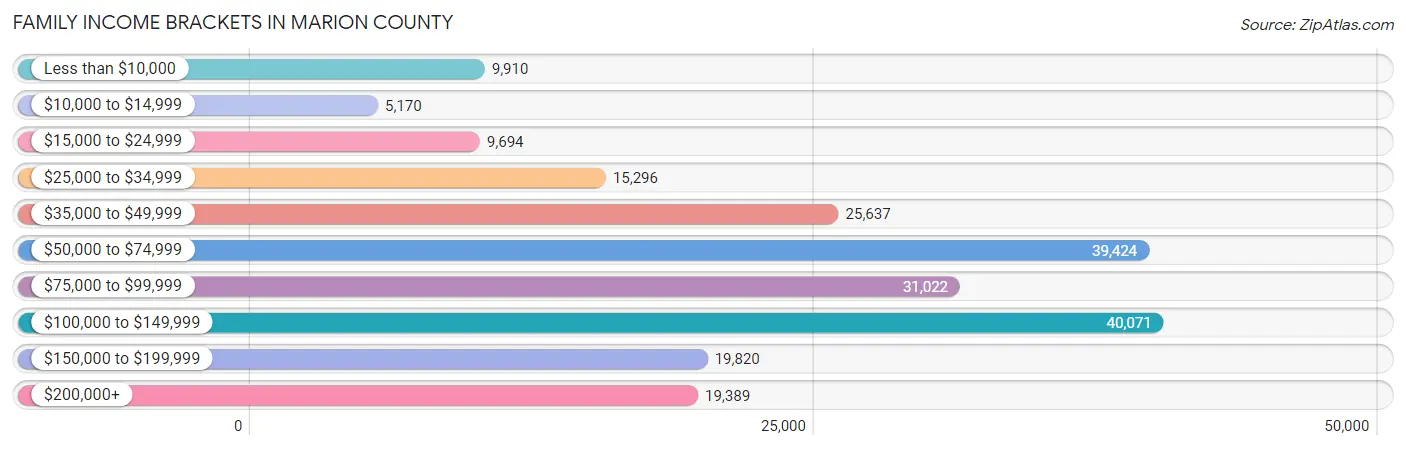
| Income Bracket | # Families | % Families |
| Less than $10,000 | 9,910 | 4.6% |
| $10,000 to $14,999 | 5,170 | 2.4% |
| $15,000 to $24,999 | 9,694 | 4.5% |
| $25,000 to $34,999 | 15,296 | 7.1% |
| $35,000 to $49,999 | 25,637 | 11.9% |
| $50,000 to $74,999 | 39,424 | 18.3% |
| $75,000 to $99,999 | 31,022 | 14.4% |
| $100,000 to $149,999 | 40,071 | 18.6% |
| $150,000 to $199,999 | 19,820 | 9.2% |
| $200,000+ | 19,389 | 9.0% |
Family Income by Famaliy Size in Marion County
4-person families (34,034 | 15.8%) account for the highest median family income in Marion County with $89,358 per family, while 2-person families (105,727 | 49.1%) have the highest median income of $36,964 per family member.
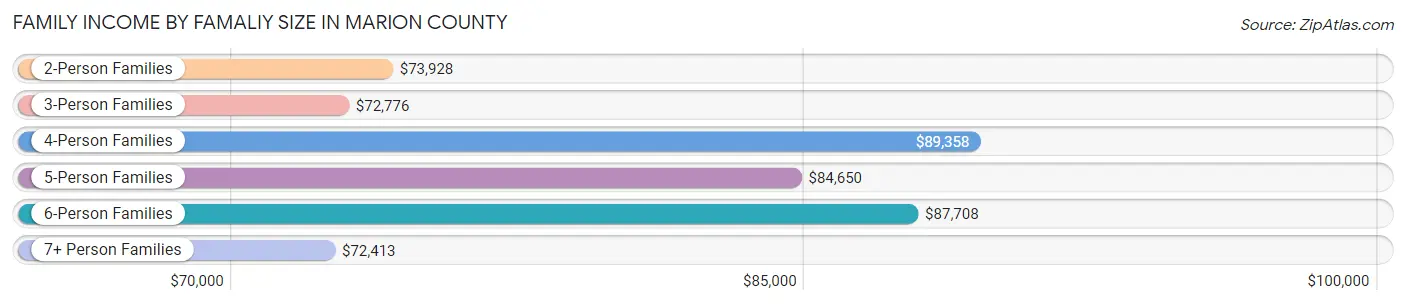
| Income Bracket | # Families | Median Income |
| 2-Person Families | 105,727 (49.1%) | $73,928 |
| 3-Person Families | 47,916 (22.2%) | $72,776 |
| 4-Person Families | 34,034 (15.8%) | $89,358 |
| 5-Person Families | 17,566 (8.2%) | $84,650 |
| 6-Person Families | 6,116 (2.8%) | $87,708 |
| 7+ Person Families | 4,074 (1.9%) | $72,413 |
| Total | 215,433 (100.0%) | $76,851 |
Family Income by Number of Earners in Marion County
The median family income in Marion County is $76,851, with families comprising 3+ earners (21,183) having the highest median family income of $124,734, while families with no earners (26,354) have the lowest median family income of $39,371, accounting for 9.8% and 12.2% of families, respectively.
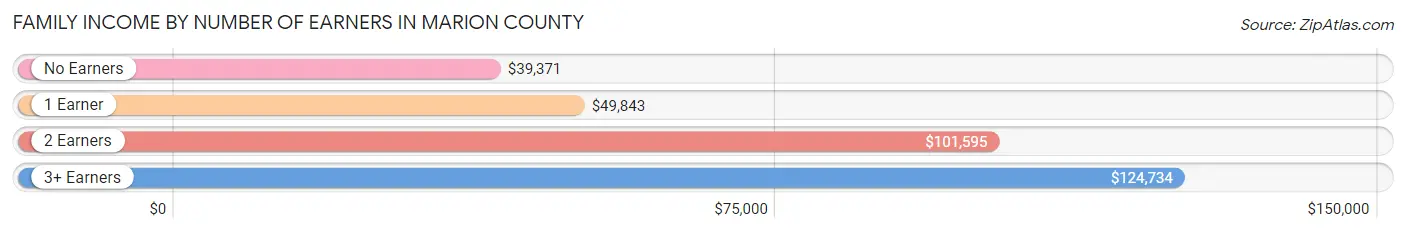
| Number of Earners | # Families | Median Income |
| No Earners | 26,354 (12.2%) | $39,371 |
| 1 Earner | 72,369 (33.6%) | $49,843 |
| 2 Earners | 95,527 (44.3%) | $101,595 |
| 3+ Earners | 21,183 (9.8%) | $124,734 |
| Total | 215,433 (100.0%) | $76,851 |
Household Income in Marion County
Household Income Brackets in Marion County
With 71,496 households falling in the category, the $50,000 to $74,999 income range is the most frequent in Marion County, accounting for 18.2% of all households. In contrast, only 16,106 households (4.1%) fall into the $10,000 to $14,999 income bracket, making it the least populous group.
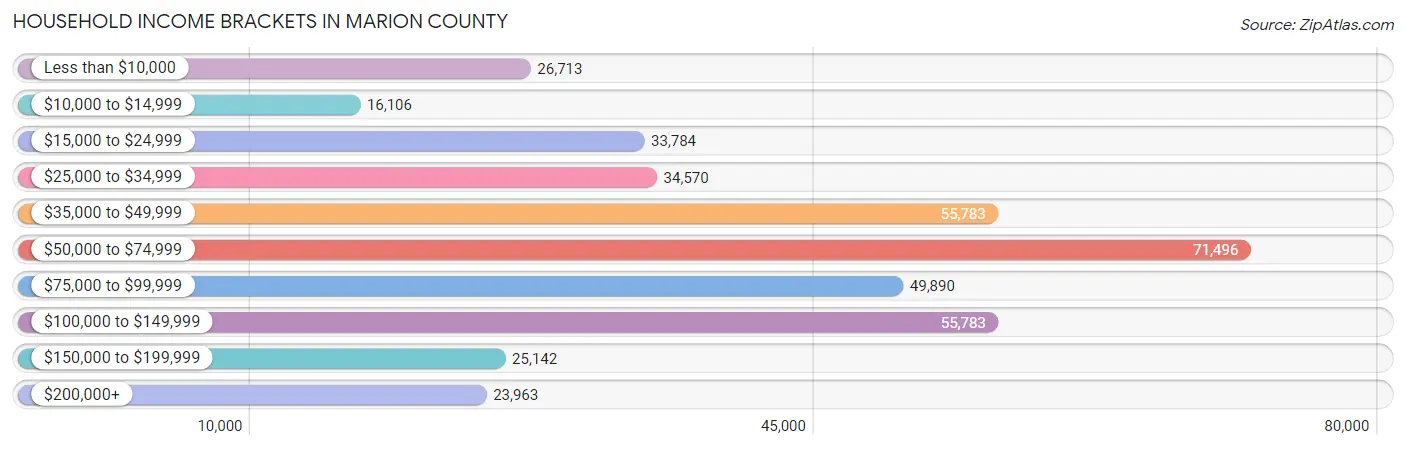
| Income Bracket | # Households | % Households |
| Less than $10,000 | 26,713 | 6.8% |
| $10,000 to $14,999 | 16,106 | 4.1% |
| $15,000 to $24,999 | 33,784 | 8.6% |
| $25,000 to $34,999 | 34,570 | 8.8% |
| $35,000 to $49,999 | 55,783 | 14.2% |
| $50,000 to $74,999 | 71,496 | 18.2% |
| $75,000 to $99,999 | 49,890 | 12.7% |
| $100,000 to $149,999 | 55,783 | 14.2% |
| $150,000 to $199,999 | 25,142 | 6.4% |
| $200,000+ | 23,963 | 6.1% |
Household Income by Householder Age in Marion County
The median household income in Marion County is $59,504, with the highest median household income of $68,617 found in the 45 to 64 years age bracket for the primary householder. A total of 135,396 households (34.5%) fall into this category. Meanwhile, the 15 to 24 years age bracket for the primary householder has the lowest median household income of $37,934, with 21,797 households (5.6%) in this group.
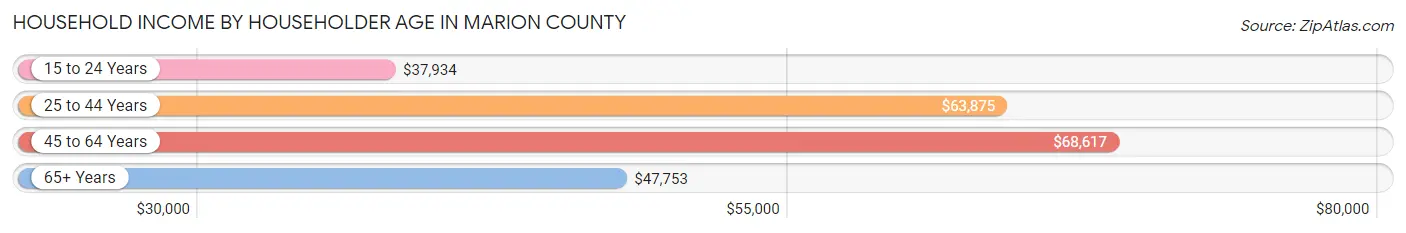
| Income Bracket | # Households | Median Income |
| 15 to 24 Years | 21,797 (5.6%) | $37,934 |
| 25 to 44 Years | 154,970 (39.5%) | $63,875 |
| 45 to 64 Years | 135,396 (34.5%) | $68,617 |
| 65+ Years | 80,674 (20.5%) | $47,753 |
| Total | 392,837 (100.0%) | $59,504 |
Poverty in Marion County
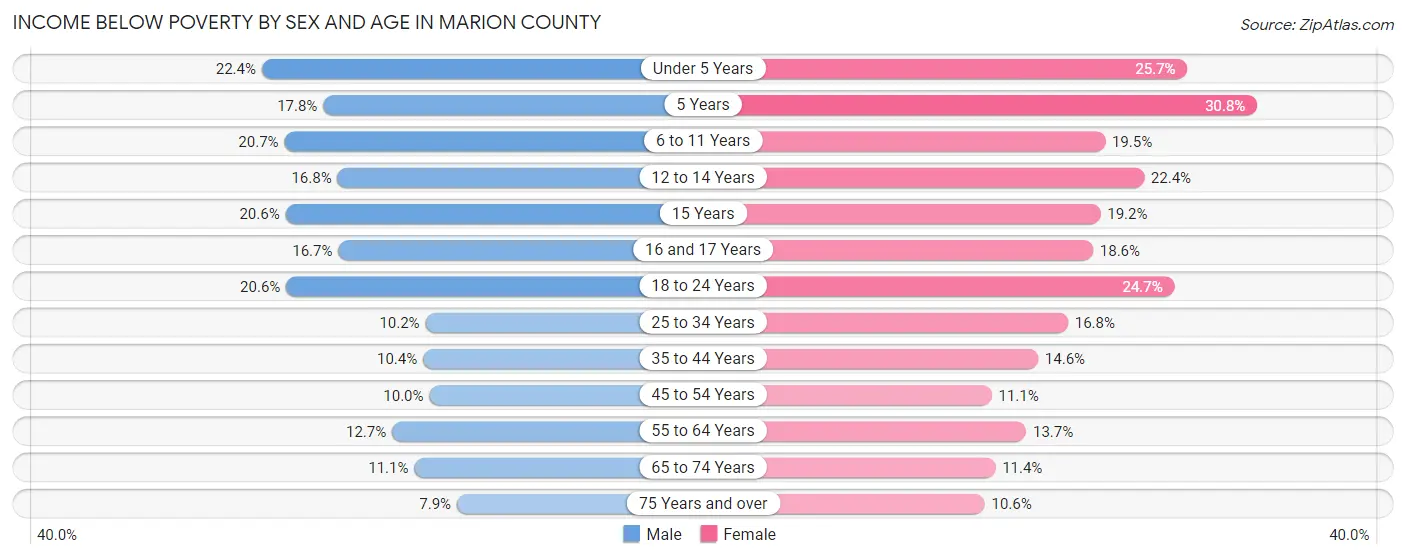
Income Below Poverty by Sex and Age in Marion County
With 14.0% poverty level for males and 16.7% for females among the residents of Marion County, under 5 year old males and 5 year old females are the most vulnerable to poverty, with 7,693 males (22.4%) and 1,769 females (30.8%) in their respective age groups living below the poverty level.
| Age Bracket | Male | Female |
| Under 5 Years | 7,693 (22.4%) | 8,275 (25.7%) |
| 5 Years | 1,263 (17.8%) | 1,769 (30.8%) |
| 6 to 11 Years | 8,350 (20.7%) | 7,299 (19.5%) |
| 12 to 14 Years | 3,148 (16.8%) | 4,467 (22.4%) |
| 15 Years | 1,233 (20.6%) | 1,169 (19.2%) |
| 16 and 17 Years | 2,216 (16.7%) | 2,284 (18.6%) |
| 18 to 24 Years | 8,892 (20.6%) | 11,194 (24.7%) |
| 25 to 34 Years | 7,979 (10.2%) | 13,848 (16.8%) |
| 35 to 44 Years | 6,476 (10.4%) | 9,424 (14.6%) |
| 45 to 54 Years | 5,317 (10.0%) | 6,264 (11.1%) |
| 55 to 64 Years | 6,866 (12.7%) | 8,088 (13.7%) |
| 65 to 74 Years | 3,804 (11.1%) | 4,695 (11.4%) |
| 75 Years and over | 1,384 (7.9%) | 2,956 (10.6%) |
| Total | 64,621 (14.0%) | 81,732 (16.7%) |
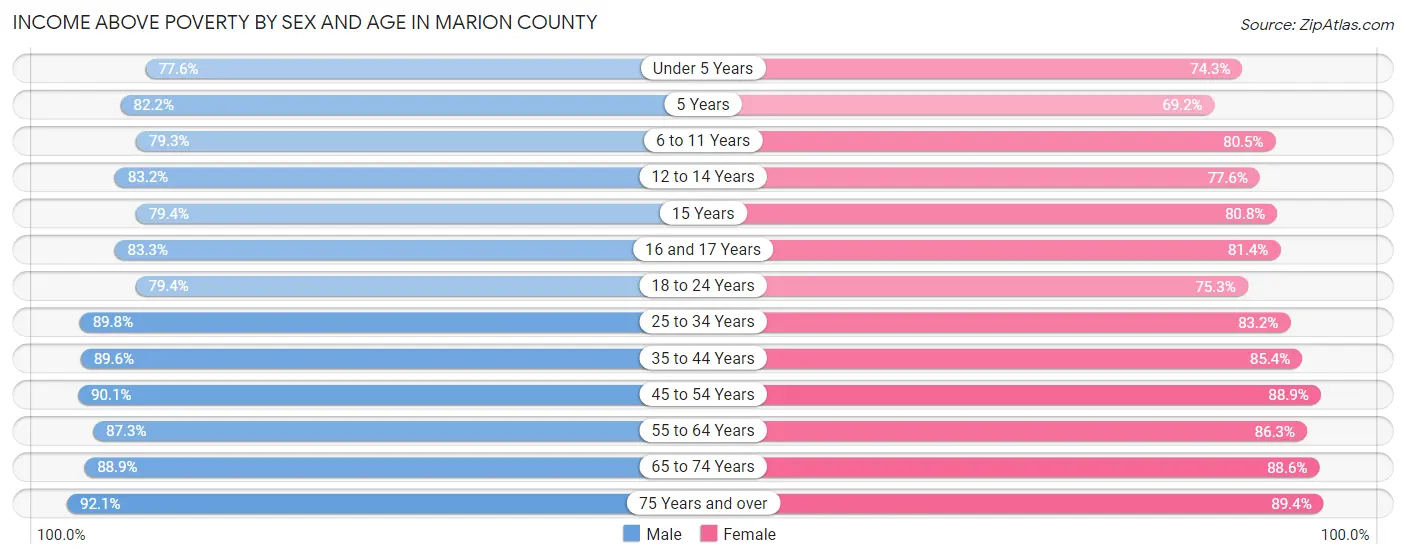
Income Above Poverty by Sex and Age in Marion County
According to the poverty statistics in Marion County, males aged 75 years and over and females aged 75 years and over are the age groups that are most secure financially, with 92.1% of males and 89.4% of females in these age groups living above the poverty line.
| Age Bracket | Male | Female |
| Under 5 Years | 26,660 (77.6%) | 23,974 (74.3%) |
| 5 Years | 5,819 (82.2%) | 3,967 (69.2%) |
| 6 to 11 Years | 31,967 (79.3%) | 30,063 (80.5%) |
| 12 to 14 Years | 15,622 (83.2%) | 15,449 (77.6%) |
| 15 Years | 4,745 (79.4%) | 4,923 (80.8%) |
| 16 and 17 Years | 11,044 (83.3%) | 9,967 (81.4%) |
| 18 to 24 Years | 34,316 (79.4%) | 34,135 (75.3%) |
| 25 to 34 Years | 69,935 (89.8%) | 68,693 (83.2%) |
| 35 to 44 Years | 55,649 (89.6%) | 55,291 (85.4%) |
| 45 to 54 Years | 48,147 (90.0%) | 50,071 (88.9%) |
| 55 to 64 Years | 47,125 (87.3%) | 51,040 (86.3%) |
| 65 to 74 Years | 30,564 (88.9%) | 36,524 (88.6%) |
| 75 Years and over | 16,136 (92.1%) | 24,932 (89.4%) |
| Total | 397,729 (86.0%) | 409,029 (83.4%) |
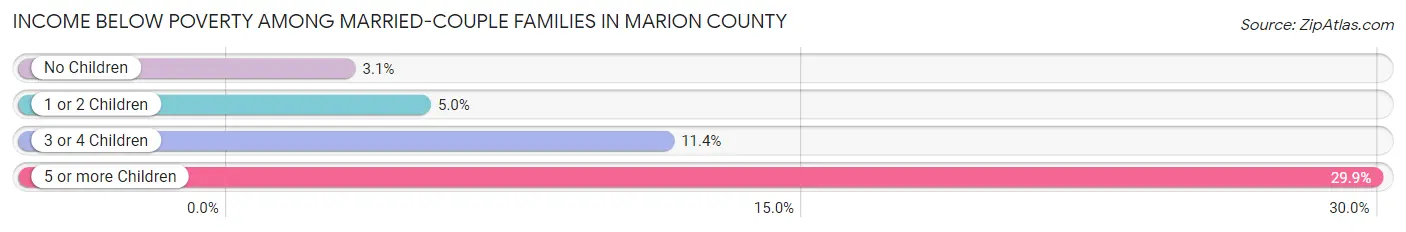
Income Below Poverty Among Married-Couple Families in Marion County
The poverty statistics for married-couple families in Marion County show that 4.7% or 6,667 of the total 141,839 families live below the poverty line. Families with 5 or more children have the highest poverty rate of 29.9%, comprising of 343 families. On the other hand, families with no children have the lowest poverty rate of 3.1%, which includes 2,542 families.
| Children | Above Poverty | Below Poverty |
| No Children | 80,382 (96.9%) | 2,542 (3.1%) |
| 1 or 2 Children | 41,830 (95.0%) | 2,219 (5.0%) |
| 3 or 4 Children | 12,156 (88.6%) | 1,563 (11.4%) |
| 5 or more Children | 804 (70.1%) | 343 (29.9%) |
| Total | 135,172 (95.3%) | 6,667 (4.7%) |
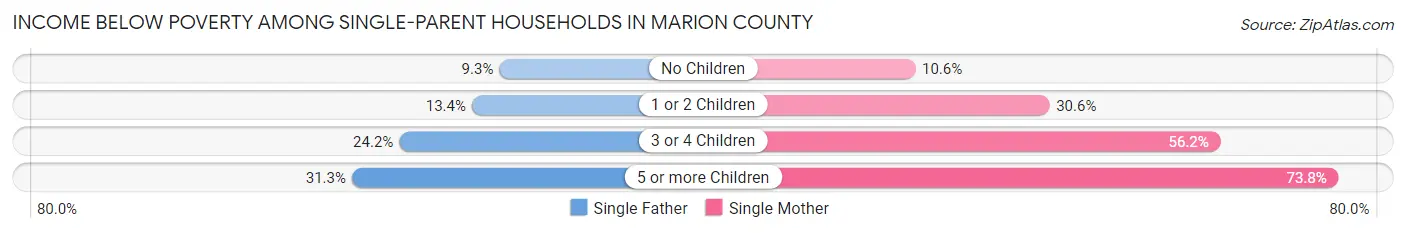
Income Below Poverty Among Single-Parent Households in Marion County
According to the poverty data in Marion County, 12.3% or 2,246 single-father households and 26.9% or 14,882 single-mother households are living below the poverty line. Among single-father households, those with 5 or more children have the highest poverty rate, with 30 households (31.2%) experiencing poverty. Likewise, among single-mother households, those with 5 or more children have the highest poverty rate, with 486 households (73.8%) falling below the poverty line.
| Children | Single Father | Single Mother |
| No Children | 767 (9.3%) | 2,015 (10.6%) |
| 1 or 2 Children | 1,157 (13.4%) | 9,228 (30.6%) |
| 3 or 4 Children | 292 (24.2%) | 3,153 (56.2%) |
| 5 or more Children | 30 (31.2%) | 486 (73.8%) |
| Total | 2,246 (12.3%) | 14,882 (26.9%) |
Income Below Poverty Among Married-Couple vs Single-Parent Households in Marion County
The poverty data for Marion County shows that 6,667 of the married-couple family households (4.7%) and 17,128 of the single-parent households (23.3%) are living below the poverty level. Within the married-couple family households, those with 5 or more children have the highest poverty rate, with 343 households (29.9%) falling below the poverty line. Among the single-parent households, those with 5 or more children have the highest poverty rate, with 516 household (68.3%) living below poverty.
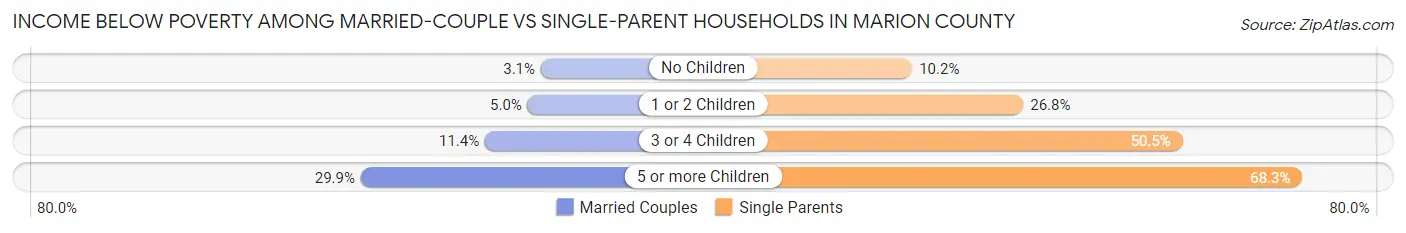
| Children | Married-Couple Families | Single-Parent Households |
| No Children | 2,542 (3.1%) | 2,782 (10.2%) |
| 1 or 2 Children | 2,219 (5.0%) | 10,385 (26.8%) |
| 3 or 4 Children | 1,563 (11.4%) | 3,445 (50.5%) |
| 5 or more Children | 343 (29.9%) | 516 (68.3%) |
| Total | 6,667 (4.7%) | 17,128 (23.3%) |
Employment Characteristics in Marion County
Employment by Class of Employer in Marion County
Among the 474,526 employed individuals in Marion County, private company employees (339,557 | 71.6%), not-for-profit organizations (49,874 | 10.5%), and local government employees (22,733 | 4.8%) make up the most common classes of employment.
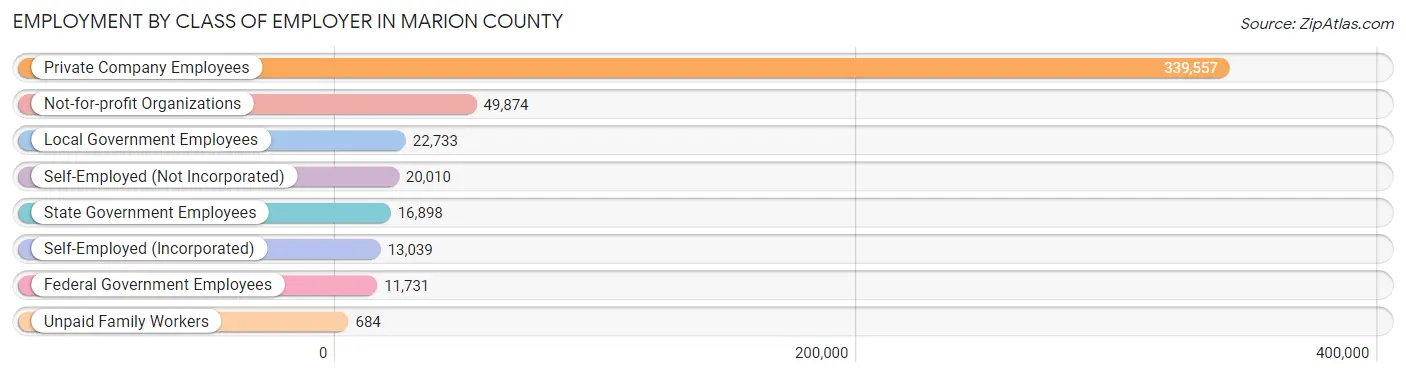
| Employer Class | # Employees | % Employees |
| Private Company Employees | 339,557 | 71.6% |
| Self-Employed (Incorporated) | 13,039 | 2.8% |
| Self-Employed (Not Incorporated) | 20,010 | 4.2% |
| Not-for-profit Organizations | 49,874 | 10.5% |
| Local Government Employees | 22,733 | 4.8% |
| State Government Employees | 16,898 | 3.6% |
| Federal Government Employees | 11,731 | 2.5% |
| Unpaid Family Workers | 684 | 0.1% |
| Total | 474,526 | 100.0% |
Employment Status by Age in Marion County
According to the labor force statistics for Marion County, out of the total population over 16 years of age (758,376), 67.5% or 511,904 individuals are in the labor force, with 5.5% or 28,155 of them unemployed. The age group with the highest labor force participation rate is 25 to 29 years, with 85.7% or 71,722 individuals in the labor force. Within the labor force, the 16 to 19 years age range has the highest percentage of unemployed individuals, with 15.3% or 3,142 of them being unemployed.
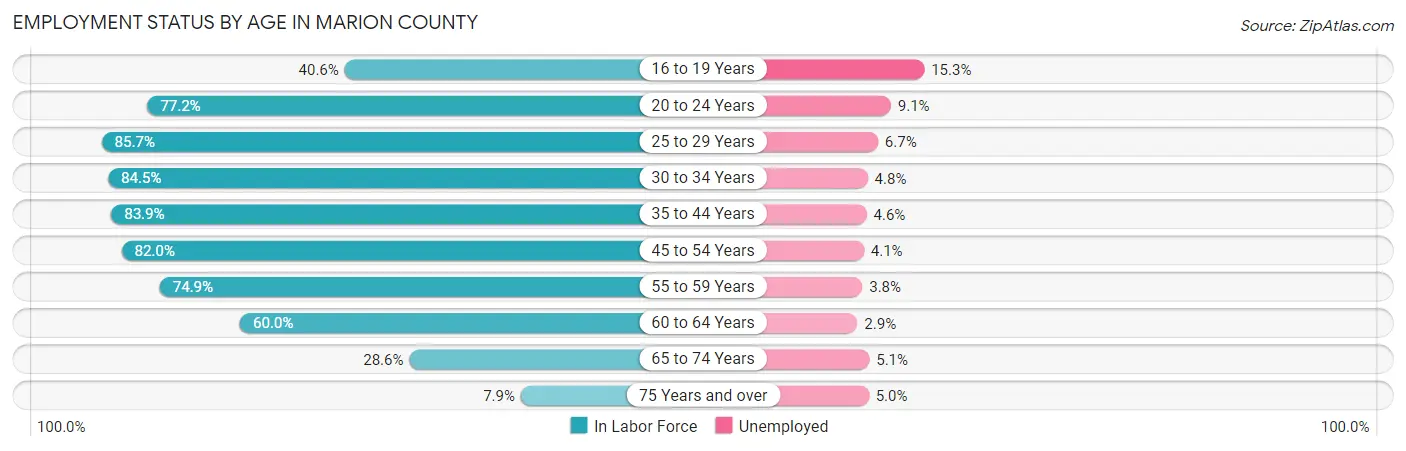
| Age Bracket | In Labor Force | Unemployed |
| 16 to 19 Years | 20,535 (40.6%) | 3,142 (15.3%) |
| 20 to 24 Years | 53,194 (77.2%) | 4,841 (9.1%) |
| 25 to 29 Years | 71,722 (85.7%) | 4,805 (6.7%) |
| 30 to 34 Years | 66,044 (84.5%) | 3,170 (4.8%) |
| 35 to 44 Years | 107,285 (83.9%) | 4,935 (4.6%) |
| 45 to 54 Years | 90,453 (82.0%) | 3,709 (4.1%) |
| 55 to 59 Years | 43,380 (74.9%) | 1,648 (3.8%) |
| 60 to 64 Years | 33,706 (60.0%) | 977 (2.9%) |
| 65 to 74 Years | 21,963 (28.6%) | 1,120 (5.1%) |
| 75 Years and over | 3,790 (7.9%) | 190 (5.0%) |
| Total | 511,904 (67.5%) | 28,155 (5.5%) |
Employment Status by Educational Attainment in Marion County
According to labor force statistics for Marion County, 80.3% of individuals (412,840) out of the total population between 25 and 64 years of age (514,122) are in the labor force, with 4.6% or 18,991 of them being unemployed. The group with the highest labor force participation rate are those with the educational attainment of bachelor's degree or higher, with 90.0% or 158,760 individuals in the labor force. Within the labor force, individuals with less than high school education have the highest percentage of unemployment, with 9.5% or 3,704 of them being unemployed.
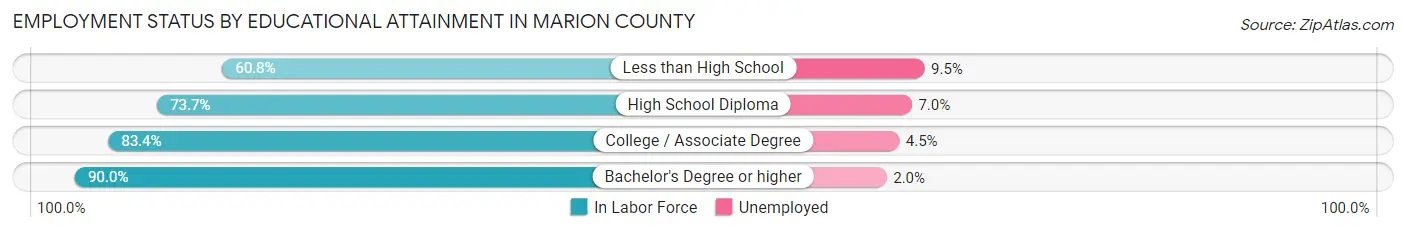
| Educational Attainment | In Labor Force | Unemployed |
| Less than High School | 38,990 (60.8%) | 6,092 (9.5%) |
| High School Diploma | 100,001 (73.7%) | 9,498 (7.0%) |
| College / Associate Degree | 115,014 (83.4%) | 6,206 (4.5%) |
| Bachelor's Degree or higher | 158,760 (90.0%) | 3,528 (2.0%) |
| Total | 412,840 (80.3%) | 23,650 (4.6%) |
Employment Occupations by Sex in Marion County
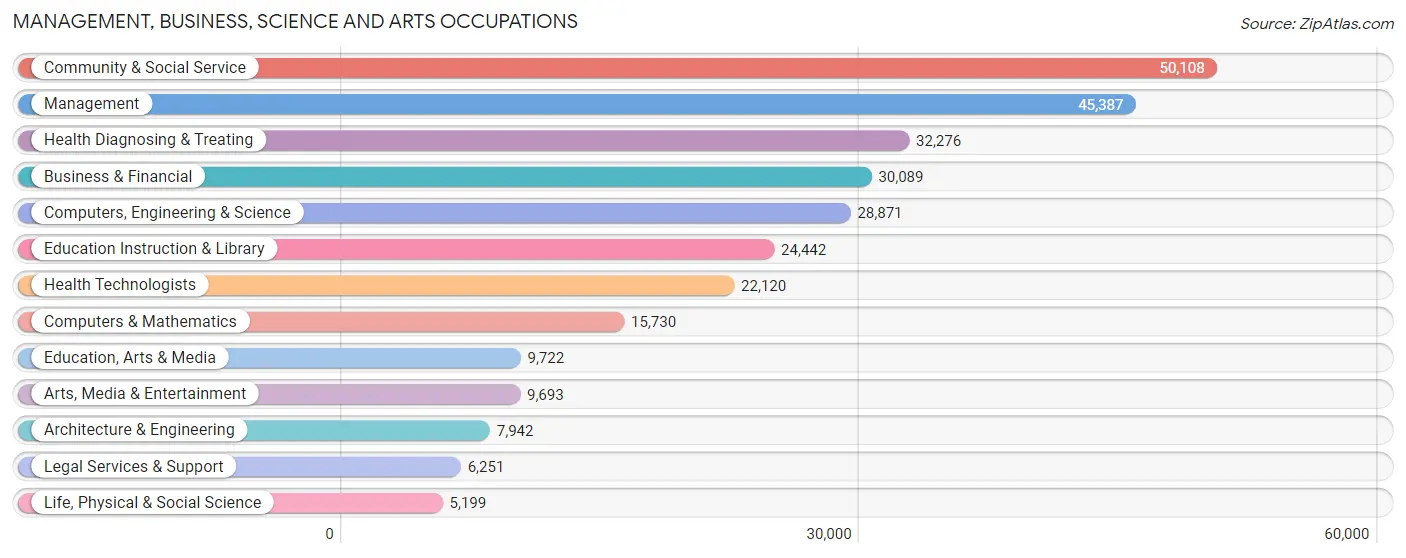
Management, Business, Science and Arts Occupations
The most common Management, Business, Science and Arts occupations in Marion County are Community & Social Service (50,108 | 10.4%), Management (45,387 | 9.4%), Health Diagnosing & Treating (32,276 | 6.7%), Business & Financial (30,089 | 6.2%), and Computers, Engineering & Science (28,871 | 6.0%).
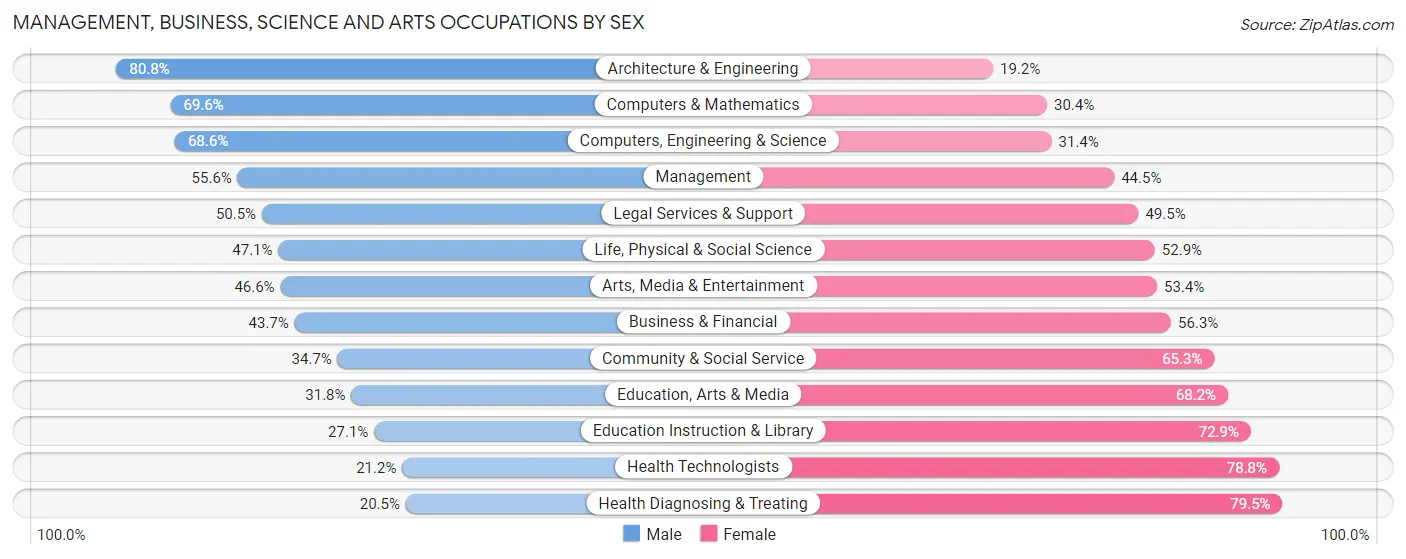
Management, Business, Science and Arts Occupations by Sex
Within the Management, Business, Science and Arts occupations in Marion County, the most male-oriented occupations are Architecture & Engineering (80.8%), Computers & Mathematics (69.6%), and Computers, Engineering & Science (68.6%), while the most female-oriented occupations are Health Diagnosing & Treating (79.5%), Health Technologists (78.8%), and Education Instruction & Library (72.9%).
| Occupation | Male | Female |
| Management | 25,212 (55.5%) | 20,175 (44.5%) |
| Business & Financial | 13,144 (43.7%) | 16,945 (56.3%) |
| Computers, Engineering & Science | 19,810 (68.6%) | 9,061 (31.4%) |
| Computers & Mathematics | 10,943 (69.6%) | 4,787 (30.4%) |
| Architecture & Engineering | 6,420 (80.8%) | 1,522 (19.2%) |
| Life, Physical & Social Science | 2,447 (47.1%) | 2,752 (52.9%) |
| Community & Social Service | 17,389 (34.7%) | 32,719 (65.3%) |
| Education, Arts & Media | 3,095 (31.8%) | 6,627 (68.2%) |
| Legal Services & Support | 3,156 (50.5%) | 3,095 (49.5%) |
| Education Instruction & Library | 6,618 (27.1%) | 17,824 (72.9%) |
| Arts, Media & Entertainment | 4,520 (46.6%) | 5,173 (53.4%) |
| Health Diagnosing & Treating | 6,611 (20.5%) | 25,665 (79.5%) |
| Health Technologists | 4,694 (21.2%) | 17,426 (78.8%) |
| Total (Category) | 82,166 (44.0%) | 104,565 (56.0%) |
| Total (Overall) | 243,350 (50.3%) | 239,957 (49.6%) |
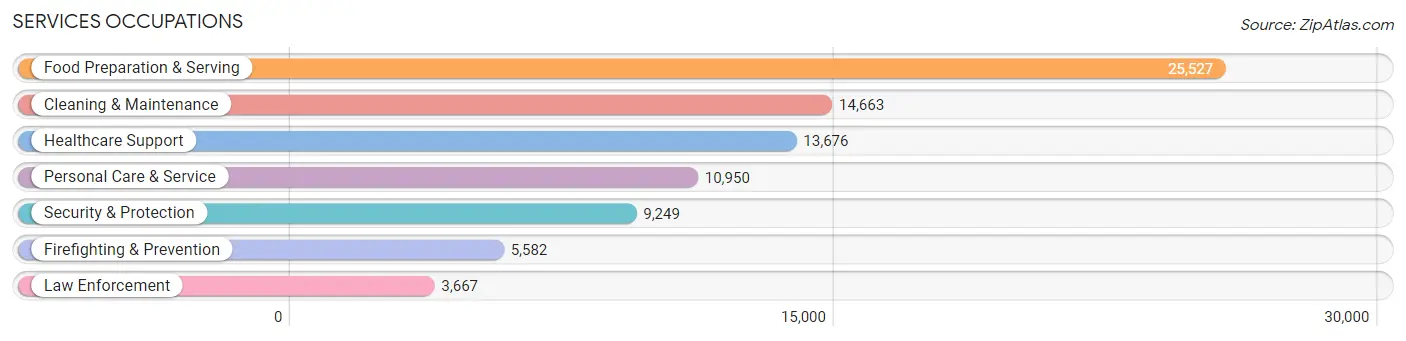
Services Occupations
The most common Services occupations in Marion County are Food Preparation & Serving (25,527 | 5.3%), Cleaning & Maintenance (14,663 | 3.0%), Healthcare Support (13,676 | 2.8%), Personal Care & Service (10,950 | 2.3%), and Security & Protection (9,249 | 1.9%).
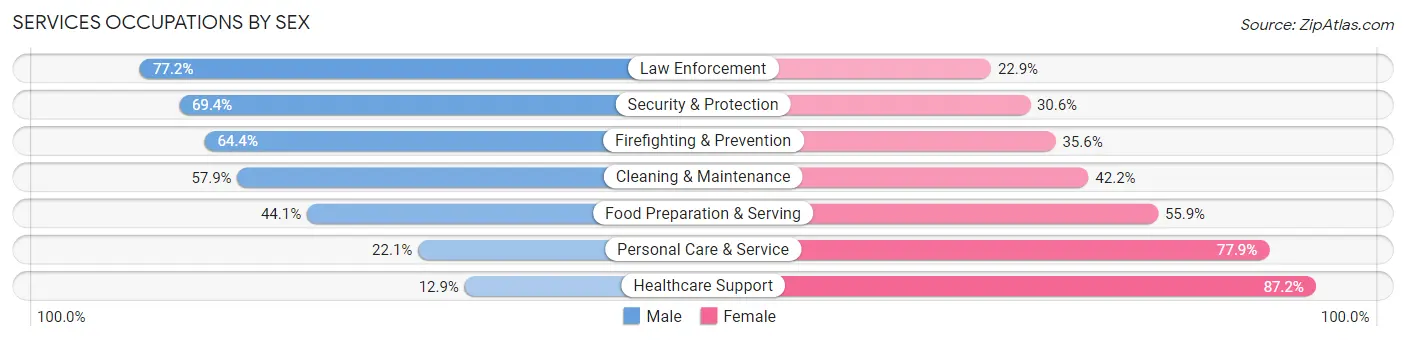
Services Occupations by Sex
Within the Services occupations in Marion County, the most male-oriented occupations are Law Enforcement (77.1%), Security & Protection (69.4%), and Firefighting & Prevention (64.4%), while the most female-oriented occupations are Healthcare Support (87.2%), Personal Care & Service (77.9%), and Food Preparation & Serving (55.9%).
| Occupation | Male | Female |
| Healthcare Support | 1,757 (12.9%) | 11,919 (87.2%) |
| Security & Protection | 6,422 (69.4%) | 2,827 (30.6%) |
| Firefighting & Prevention | 3,593 (64.4%) | 1,989 (35.6%) |
| Law Enforcement | 2,829 (77.1%) | 838 (22.9%) |
| Food Preparation & Serving | 11,252 (44.1%) | 14,275 (55.9%) |
| Cleaning & Maintenance | 8,483 (57.9%) | 6,180 (42.1%) |
| Personal Care & Service | 2,417 (22.1%) | 8,533 (77.9%) |
| Total (Category) | 30,331 (40.9%) | 43,734 (59.1%) |
| Total (Overall) | 243,350 (50.3%) | 239,957 (49.6%) |
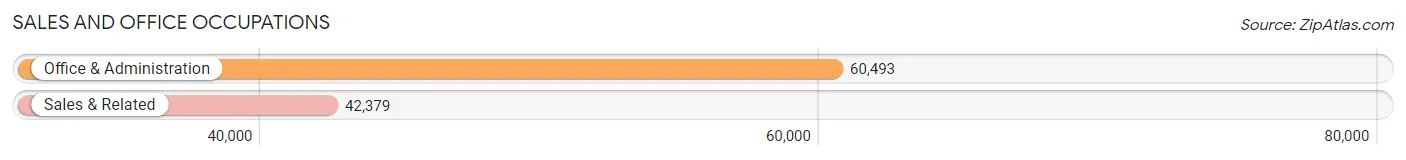
Sales and Office Occupations
The most common Sales and Office occupations in Marion County are Office & Administration (60,493 | 12.5%), and Sales & Related (42,379 | 8.8%).
Sales and Office Occupations by Sex
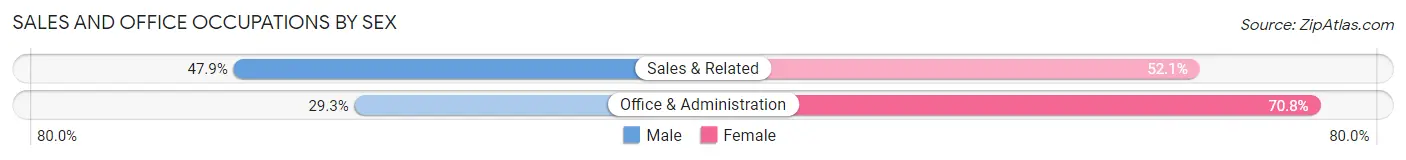
| Occupation | Male | Female |
| Sales & Related | 20,282 (47.9%) | 22,097 (52.1%) |
| Office & Administration | 17,694 (29.2%) | 42,799 (70.8%) |
| Total (Category) | 37,976 (36.9%) | 64,896 (63.1%) |
| Total (Overall) | 243,350 (50.3%) | 239,957 (49.6%) |
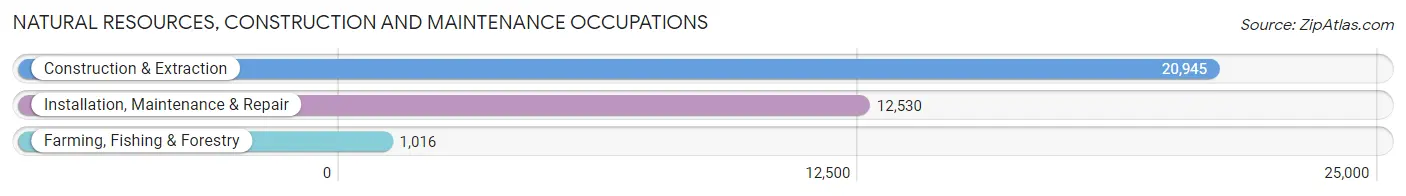
Natural Resources, Construction and Maintenance Occupations
The most common Natural Resources, Construction and Maintenance occupations in Marion County are Construction & Extraction (20,945 | 4.3%), Installation, Maintenance & Repair (12,530 | 2.6%), and Farming, Fishing & Forestry (1,016 | 0.2%).
Natural Resources, Construction and Maintenance Occupations by Sex
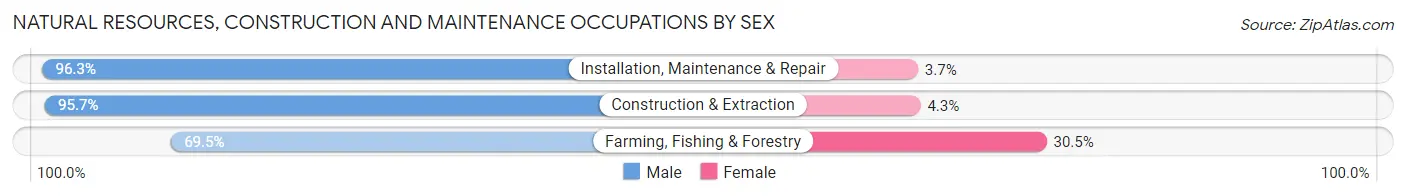
| Occupation | Male | Female |
| Farming, Fishing & Forestry | 706 (69.5%) | 310 (30.5%) |
| Construction & Extraction | 20,048 (95.7%) | 897 (4.3%) |
| Installation, Maintenance & Repair | 12,061 (96.3%) | 469 (3.7%) |
| Total (Category) | 32,815 (95.1%) | 1,676 (4.9%) |
| Total (Overall) | 243,350 (50.3%) | 239,957 (49.6%) |
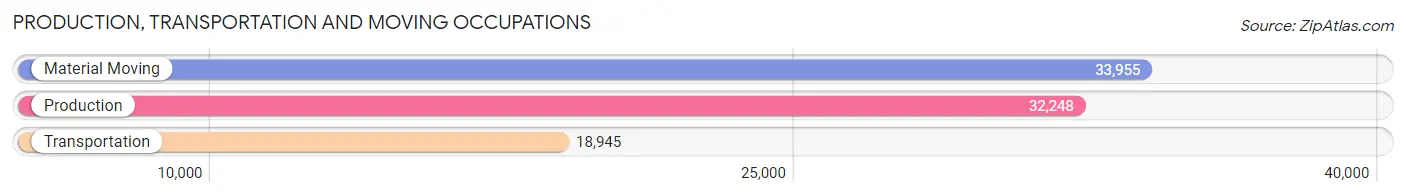
Production, Transportation and Moving Occupations
The most common Production, Transportation and Moving occupations in Marion County are Material Moving (33,955 | 7.0%), Production (32,248 | 6.7%), and Transportation (18,945 | 3.9%).
Production, Transportation and Moving Occupations by Sex
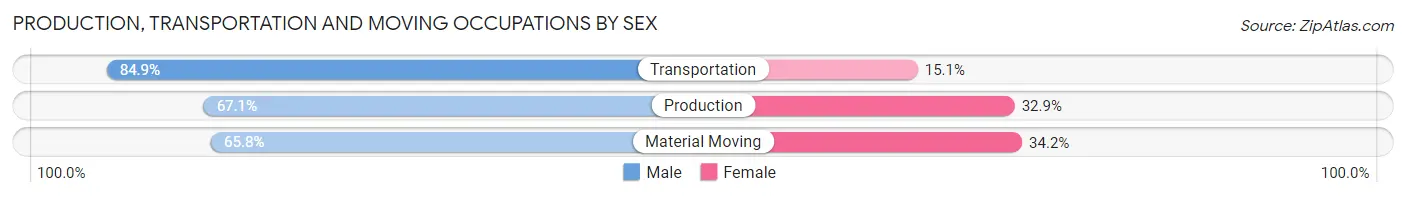
| Occupation | Male | Female |
| Production | 21,646 (67.1%) | 10,602 (32.9%) |
| Transportation | 16,087 (84.9%) | 2,858 (15.1%) |
| Material Moving | 22,329 (65.8%) | 11,626 (34.2%) |
| Total (Category) | 60,062 (70.5%) | 25,086 (29.5%) |
| Total (Overall) | 243,350 (50.3%) | 239,957 (49.6%) |
Employment Industries by Sex in Marion County
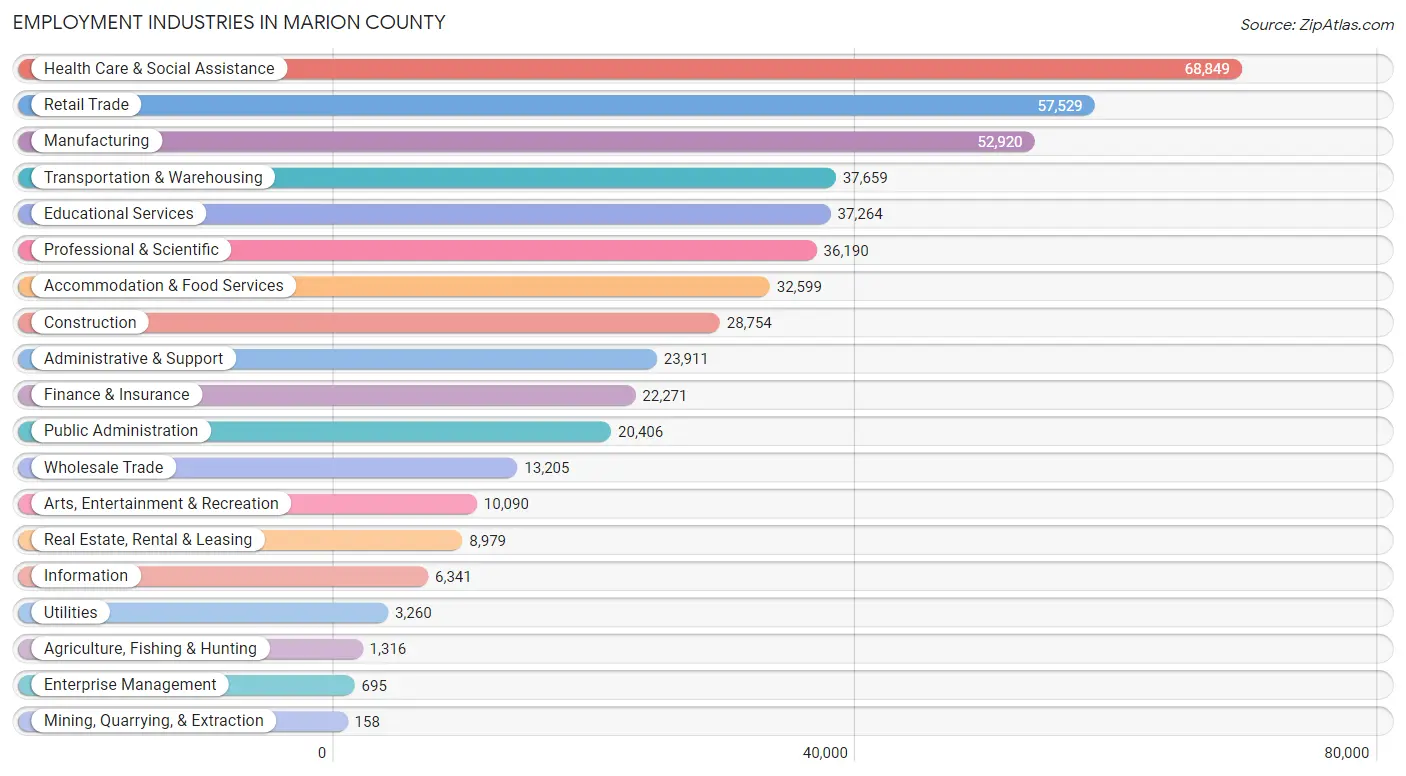
Employment Industries in Marion County
The major employment industries in Marion County include Health Care & Social Assistance (68,849 | 14.2%), Retail Trade (57,529 | 11.9%), Manufacturing (52,920 | 11.0%), Transportation & Warehousing (37,659 | 7.8%), and Educational Services (37,264 | 7.7%).
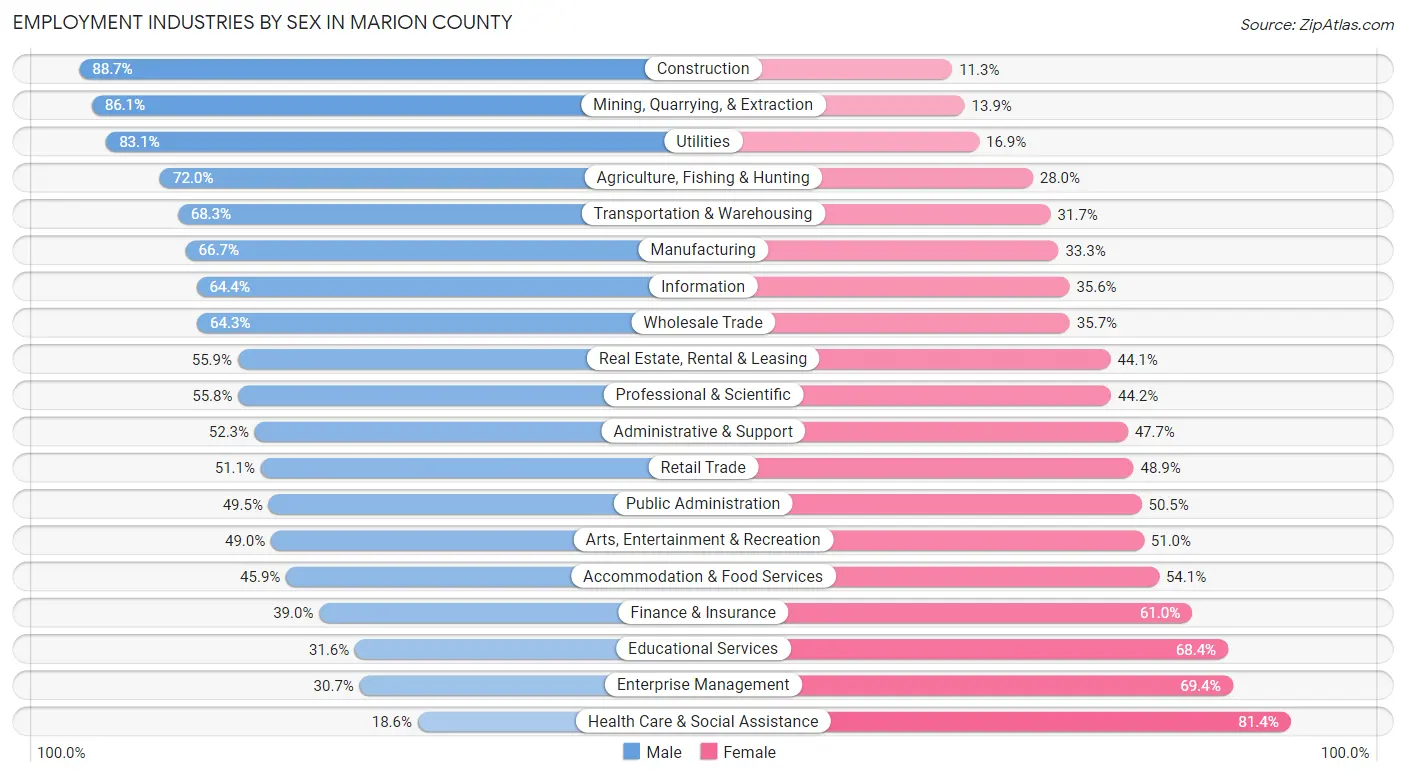
Employment Industries by Sex in Marion County
The Marion County industries that see more men than women are Construction (88.7%), Mining, Quarrying, & Extraction (86.1%), and Utilities (83.1%), whereas the industries that tend to have a higher number of women are Health Care & Social Assistance (81.4%), Enterprise Management (69.4%), and Educational Services (68.4%).
| Industry | Male | Female |
| Agriculture, Fishing & Hunting | 947 (72.0%) | 369 (28.0%) |
| Mining, Quarrying, & Extraction | 136 (86.1%) | 22 (13.9%) |
| Construction | 25,493 (88.7%) | 3,261 (11.3%) |
| Manufacturing | 35,276 (66.7%) | 17,644 (33.3%) |
| Wholesale Trade | 8,491 (64.3%) | 4,714 (35.7%) |
| Retail Trade | 29,402 (51.1%) | 28,127 (48.9%) |
| Transportation & Warehousing | 25,715 (68.3%) | 11,944 (31.7%) |
| Utilities | 2,709 (83.1%) | 551 (16.9%) |
| Information | 4,083 (64.4%) | 2,258 (35.6%) |
| Finance & Insurance | 8,690 (39.0%) | 13,581 (61.0%) |
| Real Estate, Rental & Leasing | 5,017 (55.9%) | 3,962 (44.1%) |
| Professional & Scientific | 20,184 (55.8%) | 16,006 (44.2%) |
| Enterprise Management | 213 (30.6%) | 482 (69.4%) |
| Administrative & Support | 12,515 (52.3%) | 11,396 (47.7%) |
| Educational Services | 11,770 (31.6%) | 25,494 (68.4%) |
| Health Care & Social Assistance | 12,810 (18.6%) | 56,039 (81.4%) |
| Arts, Entertainment & Recreation | 4,943 (49.0%) | 5,147 (51.0%) |
| Accommodation & Food Services | 14,949 (45.9%) | 17,650 (54.1%) |
| Public Administration | 10,095 (49.5%) | 10,311 (50.5%) |
| Total | 243,350 (50.3%) | 239,957 (49.6%) |
Education in Marion County
School Enrollment in Marion County
The most common levels of schooling among the 239,519 students in Marion County are elementary school (52,394 | 21.9%), middle school (52,027 | 21.7%), and high school (51,451 | 21.5%).
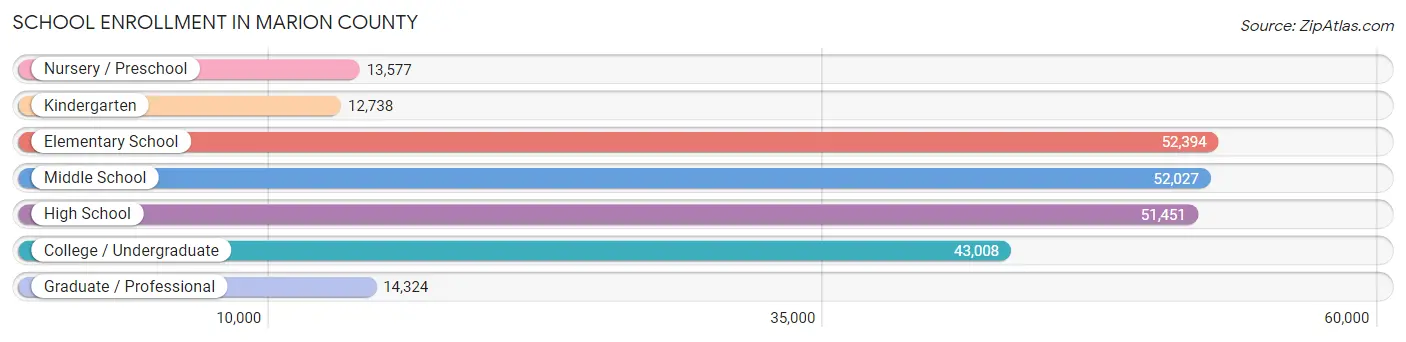
| School Level | # Students | % Students |
| Nursery / Preschool | 13,577 | 5.7% |
| Kindergarten | 12,738 | 5.3% |
| Elementary School | 52,394 | 21.9% |
| Middle School | 52,027 | 21.7% |
| High School | 51,451 | 21.5% |
| College / Undergraduate | 43,008 | 18.0% |
| Graduate / Professional | 14,324 | 6.0% |
| Total | 239,519 | 100.0% |
School Enrollment by Age by Funding Source in Marion County
Out of a total of 239,519 students who are enrolled in schools in Marion County, 46,946 (19.6%) attend a private institution, while the remaining 192,573 (80.4%) are enrolled in public schools. The age group of 3 to 4 year olds has the highest likelihood of being enrolled in private schools, with 4,325 (42.9% in the age bracket) enrolled. Conversely, the age group of 15 to 17 year olds has the lowest likelihood of being enrolled in a private school, with 31,332 (86.6% in the age bracket) attending a public institution.
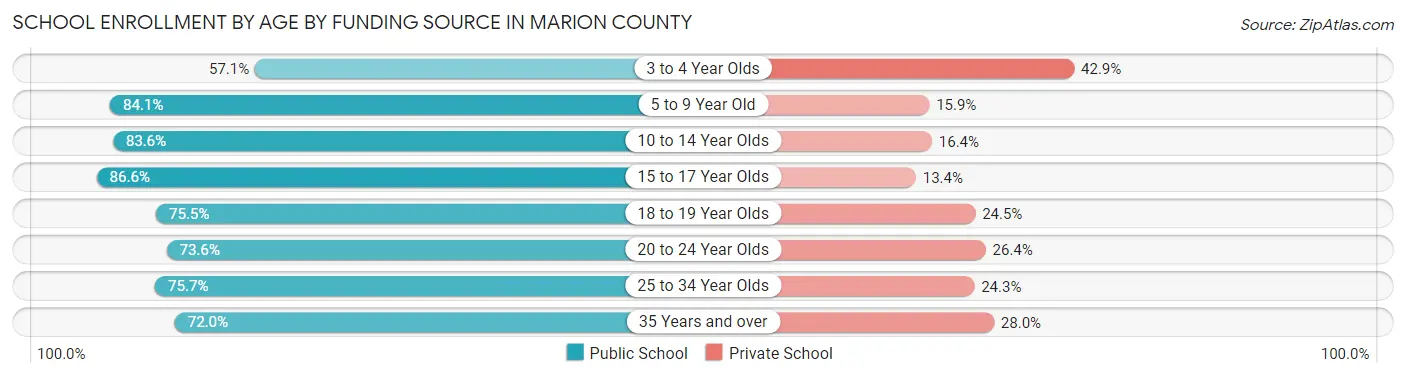
| Age Bracket | Public School | Private School |
| 3 to 4 Year Olds | 5,751 (57.1%) | 4,325 (42.9%) |
| 5 to 9 Year Old | 52,297 (84.1%) | 9,907 (15.9%) |
| 10 to 14 Year Olds | 53,132 (83.6%) | 10,443 (16.4%) |
| 15 to 17 Year Olds | 31,332 (86.6%) | 4,862 (13.4%) |
| 18 to 19 Year Olds | 12,847 (75.5%) | 4,169 (24.5%) |
| 20 to 24 Year Olds | 16,433 (73.6%) | 5,907 (26.4%) |
| 25 to 34 Year Olds | 11,661 (75.7%) | 3,747 (24.3%) |
| 35 Years and over | 9,151 (72.0%) | 3,555 (28.0%) |
| Total | 192,573 (80.4%) | 46,946 (19.6%) |
Educational Attainment by Field of Study in Marion County
Business (46,324 | 19.9%), science & technology (25,681 | 11.1%), education (25,223 | 10.9%), social sciences (15,767 | 6.8%), and arts & humanities (15,658 | 6.7%) are the most common fields of study among 232,282 individuals in Marion County who have obtained a bachelor's degree or higher.
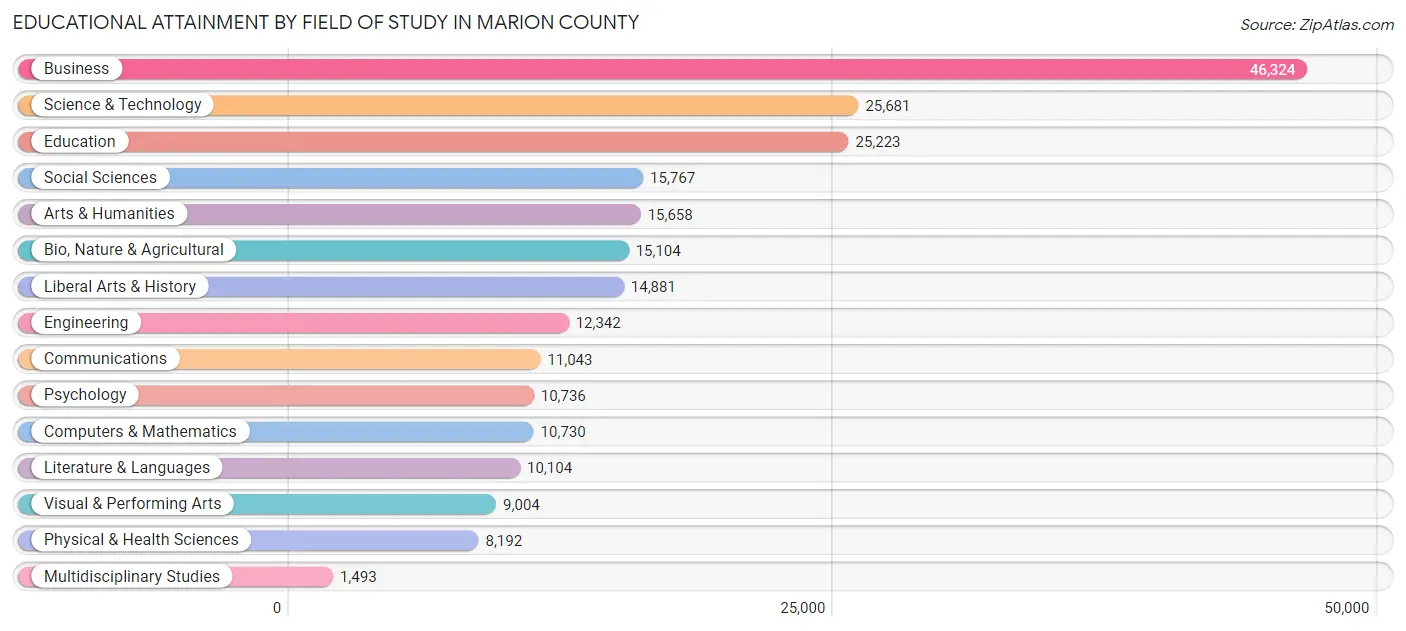
| Field of Study | # Graduates | % Graduates |
| Computers & Mathematics | 10,730 | 4.6% |
| Bio, Nature & Agricultural | 15,104 | 6.5% |
| Physical & Health Sciences | 8,192 | 3.5% |
| Psychology | 10,736 | 4.6% |
| Social Sciences | 15,767 | 6.8% |
| Engineering | 12,342 | 5.3% |
| Multidisciplinary Studies | 1,493 | 0.6% |
| Science & Technology | 25,681 | 11.1% |
| Business | 46,324 | 19.9% |
| Education | 25,223 | 10.9% |
| Literature & Languages | 10,104 | 4.3% |
| Liberal Arts & History | 14,881 | 6.4% |
| Visual & Performing Arts | 9,004 | 3.9% |
| Communications | 11,043 | 4.8% |
| Arts & Humanities | 15,658 | 6.7% |
| Total | 232,282 | 100.0% |
Transportation & Commute in Marion County
Vehicle Availability by Sex in Marion County
The most prevalent vehicle ownership categories in Marion County are males with 2 vehicles (105,365, accounting for 44.1%) and females with 2 vehicles (97,101, making up 45.1%).
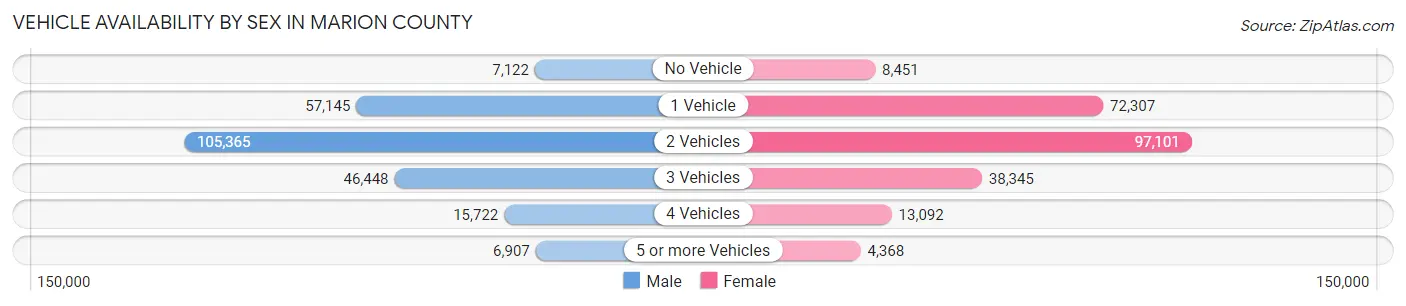
| Vehicles Available | Male | Female |
| No Vehicle | 7,122 (3.0%) | 8,451 (3.6%) |
| 1 Vehicle | 57,145 (23.9%) | 72,307 (30.9%) |
| 2 Vehicles | 105,365 (44.1%) | 97,101 (41.6%) |
| 3 Vehicles | 46,448 (19.5%) | 38,345 (16.4%) |
| 4 Vehicles | 15,722 (6.6%) | 13,092 (5.6%) |
| 5 or more Vehicles | 6,907 (2.9%) | 4,368 (1.9%) |
| Total | 238,709 (100.0%) | 233,664 (100.0%) |
Commute Time in Marion County
The most frequently occuring commute durations in Marion County are 20 to 24 minutes (80,231 commuters, 18.8%), 15 to 19 minutes (72,971 commuters, 17.1%), and 30 to 34 minutes (69,412 commuters, 16.3%).
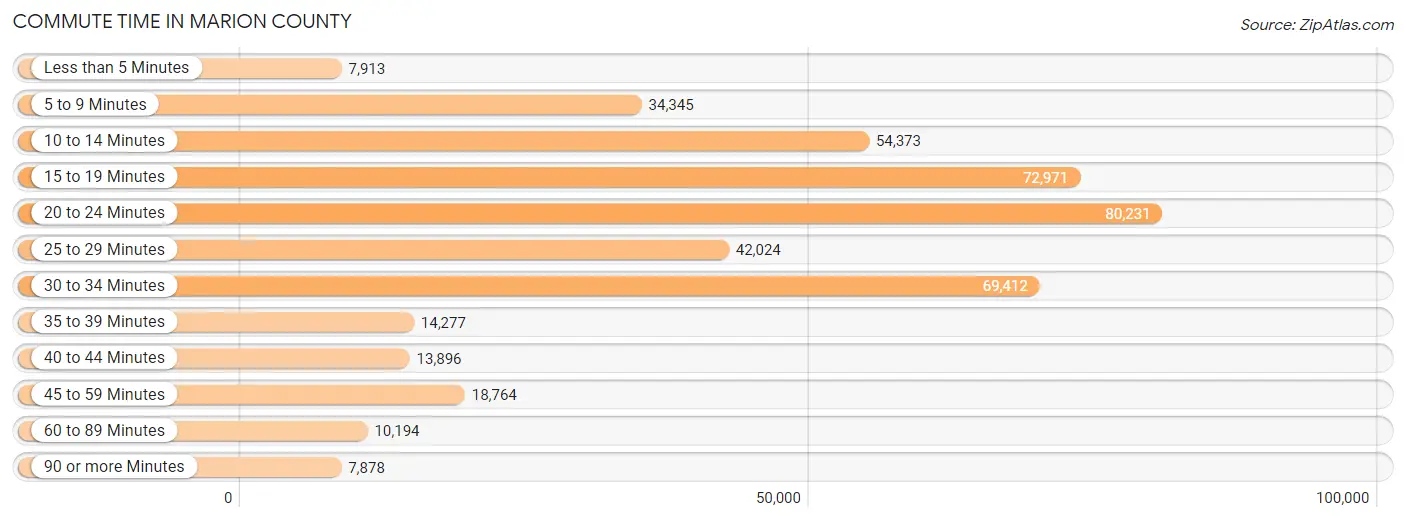
| Commute Time | # Commuters | % Commuters |
| Less than 5 Minutes | 7,913 | 1.9% |
| 5 to 9 Minutes | 34,345 | 8.1% |
| 10 to 14 Minutes | 54,373 | 12.8% |
| 15 to 19 Minutes | 72,971 | 17.1% |
| 20 to 24 Minutes | 80,231 | 18.8% |
| 25 to 29 Minutes | 42,024 | 9.9% |
| 30 to 34 Minutes | 69,412 | 16.3% |
| 35 to 39 Minutes | 14,277 | 3.4% |
| 40 to 44 Minutes | 13,896 | 3.3% |
| 45 to 59 Minutes | 18,764 | 4.4% |
| 60 to 89 Minutes | 10,194 | 2.4% |
| 90 or more Minutes | 7,878 | 1.8% |
Commute Time by Sex in Marion County
The most common commute times in Marion County are 20 to 24 minutes (40,699 commuters, 18.8%) for males and 20 to 24 minutes (39,532 commuters, 18.9%) for females.
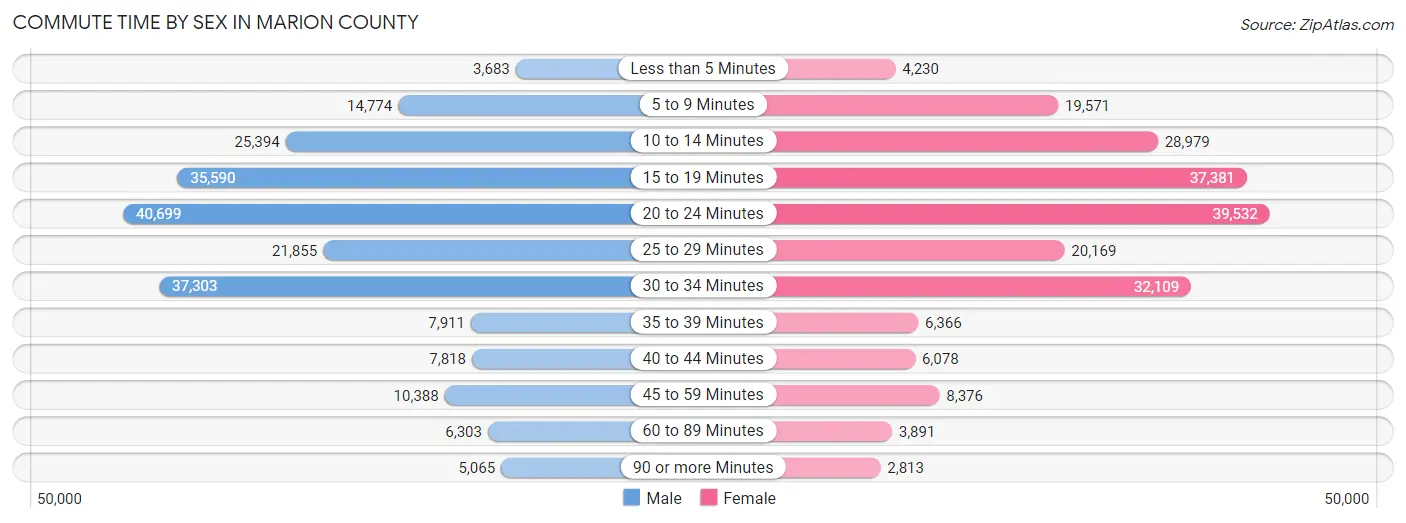
| Commute Time | Male | Female |
| Less than 5 Minutes | 3,683 (1.7%) | 4,230 (2.0%) |
| 5 to 9 Minutes | 14,774 (6.8%) | 19,571 (9.3%) |
| 10 to 14 Minutes | 25,394 (11.7%) | 28,979 (13.8%) |
| 15 to 19 Minutes | 35,590 (16.4%) | 37,381 (17.8%) |
| 20 to 24 Minutes | 40,699 (18.8%) | 39,532 (18.9%) |
| 25 to 29 Minutes | 21,855 (10.1%) | 20,169 (9.6%) |
| 30 to 34 Minutes | 37,303 (17.2%) | 32,109 (15.3%) |
| 35 to 39 Minutes | 7,911 (3.6%) | 6,366 (3.0%) |
| 40 to 44 Minutes | 7,818 (3.6%) | 6,078 (2.9%) |
| 45 to 59 Minutes | 10,388 (4.8%) | 8,376 (4.0%) |
| 60 to 89 Minutes | 6,303 (2.9%) | 3,891 (1.9%) |
| 90 or more Minutes | 5,065 (2.3%) | 2,813 (1.3%) |
Time of Departure to Work by Sex in Marion County
The most frequent times of departure to work in Marion County are 7:00 AM to 7:29 AM (34,533, 15.9%) for males and 7:00 AM to 7:29 AM (34,685, 16.6%) for females.
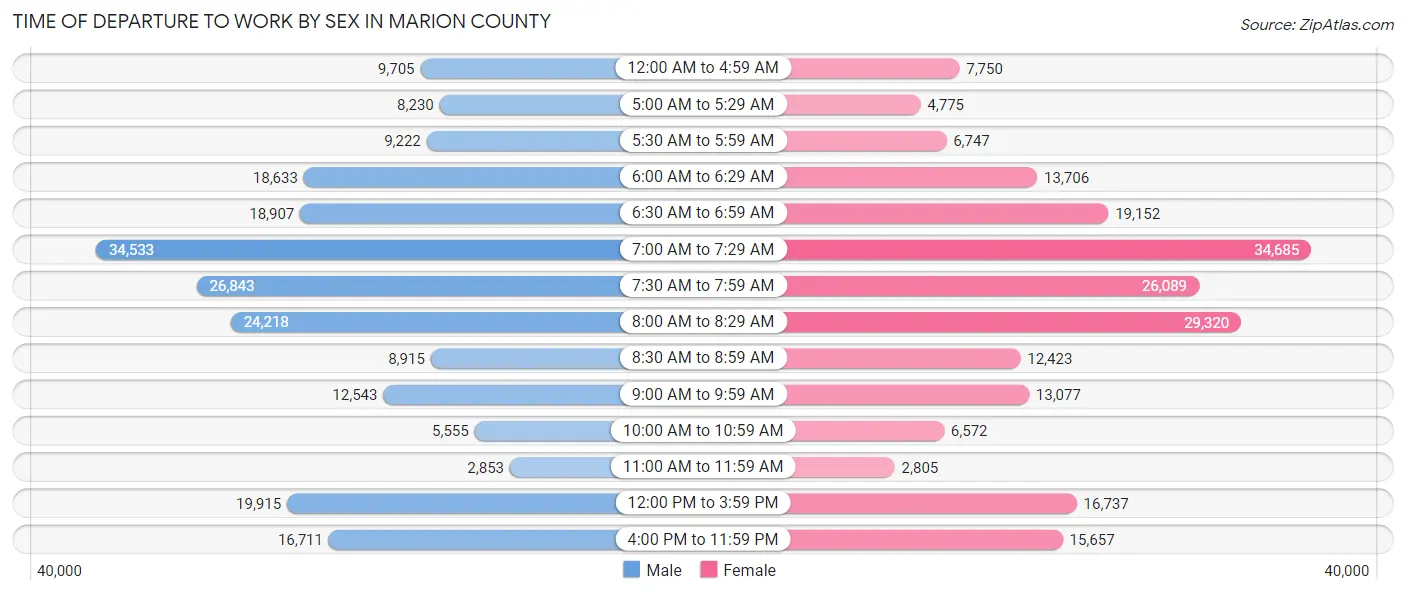
| Time of Departure | Male | Female |
| 12:00 AM to 4:59 AM | 9,705 (4.5%) | 7,750 (3.7%) |
| 5:00 AM to 5:29 AM | 8,230 (3.8%) | 4,775 (2.3%) |
| 5:30 AM to 5:59 AM | 9,222 (4.3%) | 6,747 (3.2%) |
| 6:00 AM to 6:29 AM | 18,633 (8.6%) | 13,706 (6.5%) |
| 6:30 AM to 6:59 AM | 18,907 (8.7%) | 19,152 (9.1%) |
| 7:00 AM to 7:29 AM | 34,533 (15.9%) | 34,685 (16.6%) |
| 7:30 AM to 7:59 AM | 26,843 (12.4%) | 26,089 (12.4%) |
| 8:00 AM to 8:29 AM | 24,218 (11.2%) | 29,320 (14.0%) |
| 8:30 AM to 8:59 AM | 8,915 (4.1%) | 12,423 (5.9%) |
| 9:00 AM to 9:59 AM | 12,543 (5.8%) | 13,077 (6.2%) |
| 10:00 AM to 10:59 AM | 5,555 (2.6%) | 6,572 (3.1%) |
| 11:00 AM to 11:59 AM | 2,853 (1.3%) | 2,805 (1.3%) |
| 12:00 PM to 3:59 PM | 19,915 (9.2%) | 16,737 (8.0%) |
| 4:00 PM to 11:59 PM | 16,711 (7.7%) | 15,657 (7.5%) |
| Total | 216,783 (100.0%) | 209,495 (100.0%) |
Housing Occupancy in Marion County
Occupancy by Ownership in Marion County
Of the total 392,837 dwellings in Marion County, owner-occupied units account for 217,864 (55.5%), while renter-occupied units make up 174,973 (44.5%).
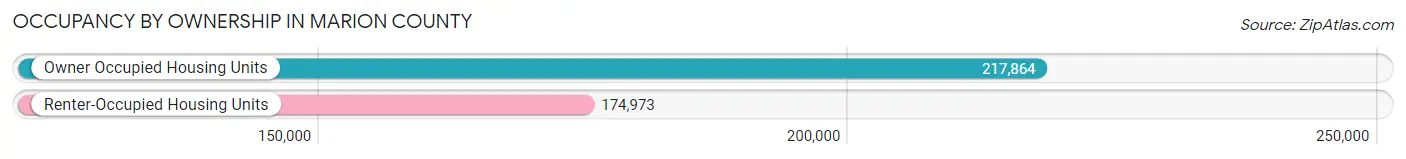
| Occupancy | # Housing Units | % Housing Units |
| Owner Occupied Housing Units | 217,864 | 55.5% |
| Renter-Occupied Housing Units | 174,973 | 44.5% |
| Total Occupied Housing Units | 392,837 | 100.0% |
Occupancy by Household Size in Marion County
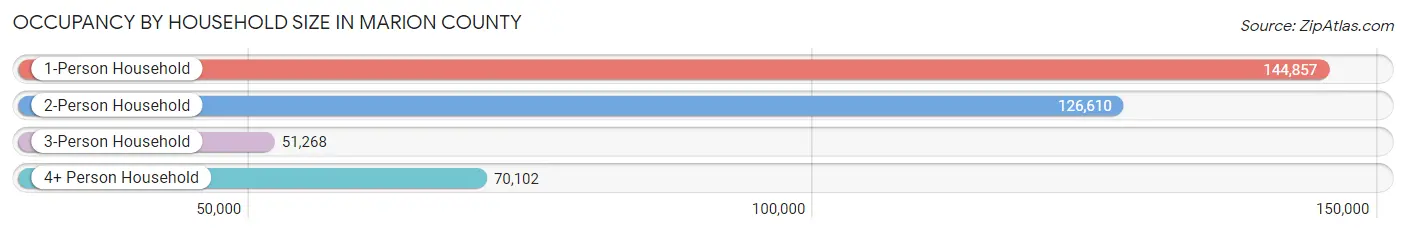
| Household Size | # Housing Units | % Housing Units |
| 1-Person Household | 144,857 | 36.9% |
| 2-Person Household | 126,610 | 32.2% |
| 3-Person Household | 51,268 | 13.1% |
| 4+ Person Household | 70,102 | 17.8% |
| Total Housing Units | 392,837 | 100.0% |
Occupancy by Ownership by Household Size in Marion County
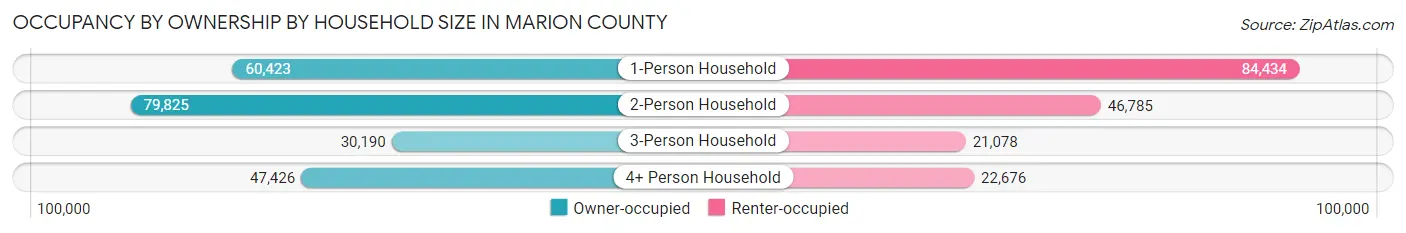
| Household Size | Owner-occupied | Renter-occupied |
| 1-Person Household | 60,423 (41.7%) | 84,434 (58.3%) |
| 2-Person Household | 79,825 (63.0%) | 46,785 (36.9%) |
| 3-Person Household | 30,190 (58.9%) | 21,078 (41.1%) |
| 4+ Person Household | 47,426 (67.6%) | 22,676 (32.4%) |
| Total Housing Units | 217,864 (55.5%) | 174,973 (44.5%) |
Occupancy by Educational Attainment in Marion County
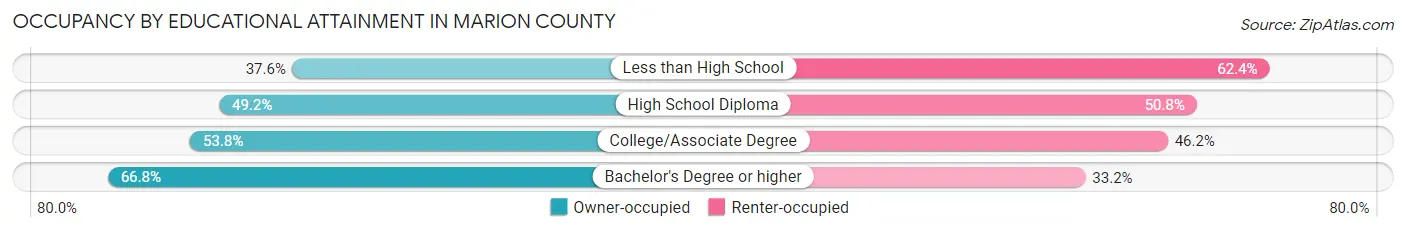
| Household Size | Owner-occupied | Renter-occupied |
| Less than High School | 15,840 (37.6%) | 26,255 (62.4%) |
| High School Diploma | 48,217 (49.2%) | 49,867 (50.8%) |
| College/Associate Degree | 61,801 (53.8%) | 53,154 (46.2%) |
| Bachelor's Degree or higher | 92,006 (66.8%) | 45,697 (33.2%) |
Occupancy by Age of Householder in Marion County
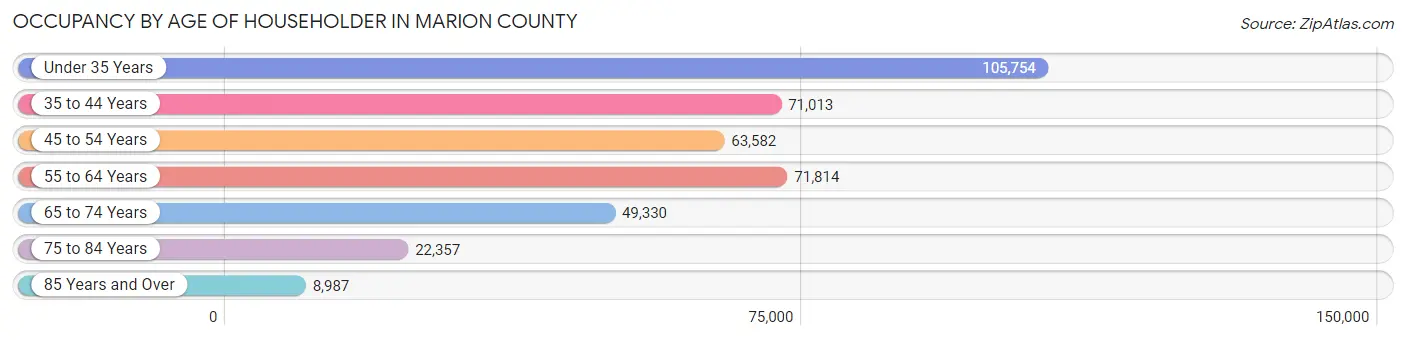
| Age Bracket | # Households | % Households |
| Under 35 Years | 105,754 | 26.9% |
| 35 to 44 Years | 71,013 | 18.1% |
| 45 to 54 Years | 63,582 | 16.2% |
| 55 to 64 Years | 71,814 | 18.3% |
| 65 to 74 Years | 49,330 | 12.6% |
| 75 to 84 Years | 22,357 | 5.7% |
| 85 Years and Over | 8,987 | 2.3% |
| Total | 392,837 | 100.0% |
Housing Finances in Marion County
Median Income by Occupancy in Marion County
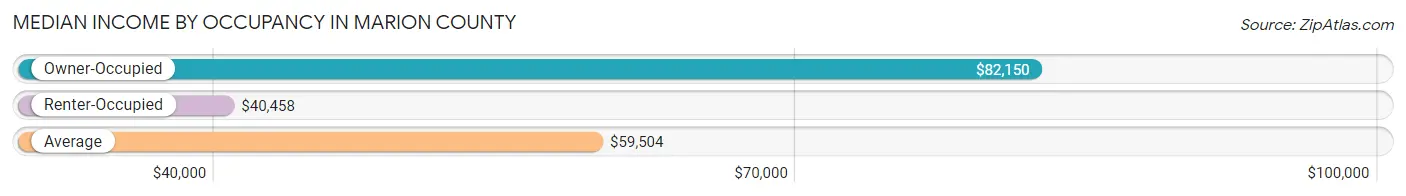
| Occupancy Type | # Households | Median Income |
| Owner-Occupied | 217,864 (55.5%) | $82,150 |
| Renter-Occupied | 174,973 (44.5%) | $40,458 |
| Average | 392,837 (100.0%) | $59,504 |
Occupancy by Householder Income Bracket in Marion County
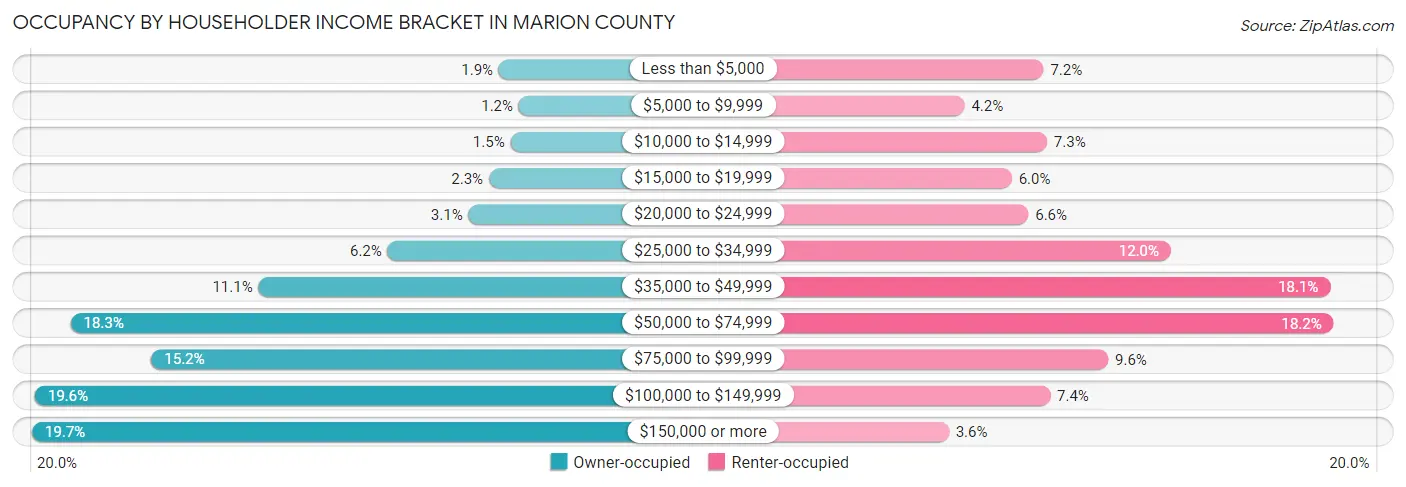
| Income Bracket | Owner-occupied | Renter-occupied |
| Less than $5,000 | 4,200 (1.9%) | 12,523 (7.2%) |
| $5,000 to $9,999 | 2,546 (1.2%) | 7,261 (4.2%) |
| $10,000 to $14,999 | 3,246 (1.5%) | 12,749 (7.3%) |
| $15,000 to $19,999 | 5,036 (2.3%) | 10,411 (5.9%) |
| $20,000 to $24,999 | 6,722 (3.1%) | 11,521 (6.6%) |
| $25,000 to $34,999 | 13,437 (6.2%) | 21,012 (12.0%) |
| $35,000 to $49,999 | 24,162 (11.1%) | 31,630 (18.1%) |
| $50,000 to $74,999 | 39,770 (18.2%) | 31,863 (18.2%) |
| $75,000 to $99,999 | 33,058 (15.2%) | 16,834 (9.6%) |
| $100,000 to $149,999 | 42,714 (19.6%) | 12,958 (7.4%) |
| $150,000 or more | 42,973 (19.7%) | 6,211 (3.5%) |
| Total | 217,864 (100.0%) | 174,973 (100.0%) |
Monthly Housing Cost Tiers in Marion County
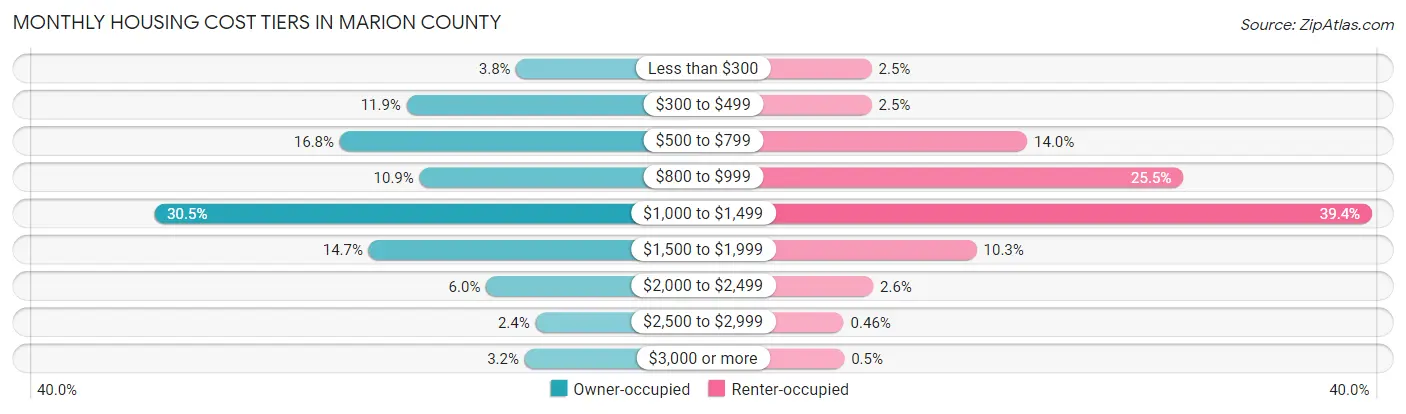
| Monthly Cost | Owner-occupied | Renter-occupied |
| Less than $300 | 8,237 (3.8%) | 4,407 (2.5%) |
| $300 to $499 | 25,847 (11.9%) | 4,406 (2.5%) |
| $500 to $799 | 36,564 (16.8%) | 24,438 (14.0%) |
| $800 to $999 | 23,762 (10.9%) | 44,552 (25.5%) |
| $1,000 to $1,499 | 66,385 (30.5%) | 68,874 (39.4%) |
| $1,500 to $1,999 | 31,926 (14.6%) | 17,930 (10.2%) |
| $2,000 to $2,499 | 13,080 (6.0%) | 4,610 (2.6%) |
| $2,500 to $2,999 | 5,168 (2.4%) | 807 (0.5%) |
| $3,000 or more | 6,895 (3.2%) | 869 (0.5%) |
| Total | 217,864 (100.0%) | 174,973 (100.0%) |
Physical Housing Characteristics in Marion County
Housing Structures in Marion County
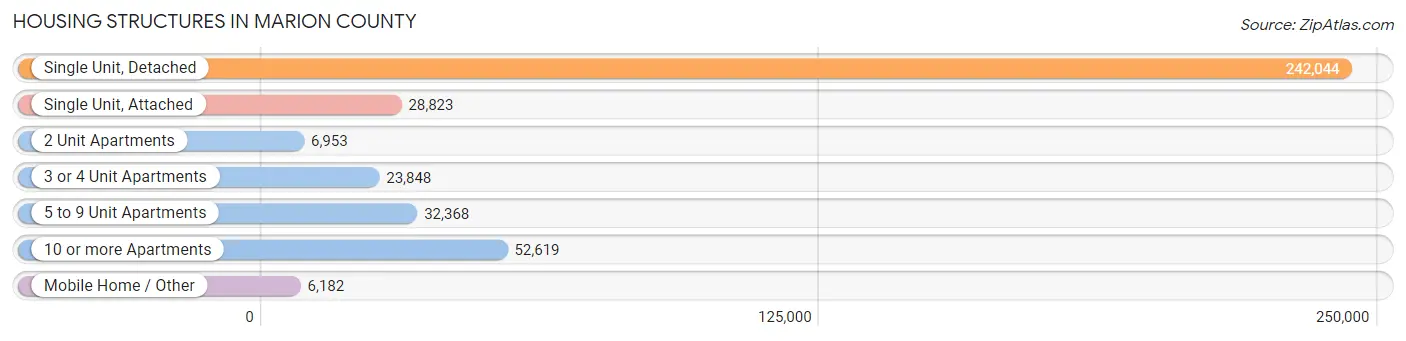
| Structure Type | # Housing Units | % Housing Units |
| Single Unit, Detached | 242,044 | 61.6% |
| Single Unit, Attached | 28,823 | 7.3% |
| 2 Unit Apartments | 6,953 | 1.8% |
| 3 or 4 Unit Apartments | 23,848 | 6.1% |
| 5 to 9 Unit Apartments | 32,368 | 8.2% |
| 10 or more Apartments | 52,619 | 13.4% |
| Mobile Home / Other | 6,182 | 1.6% |
| Total | 392,837 | 100.0% |
Housing Structures by Occupancy in Marion County
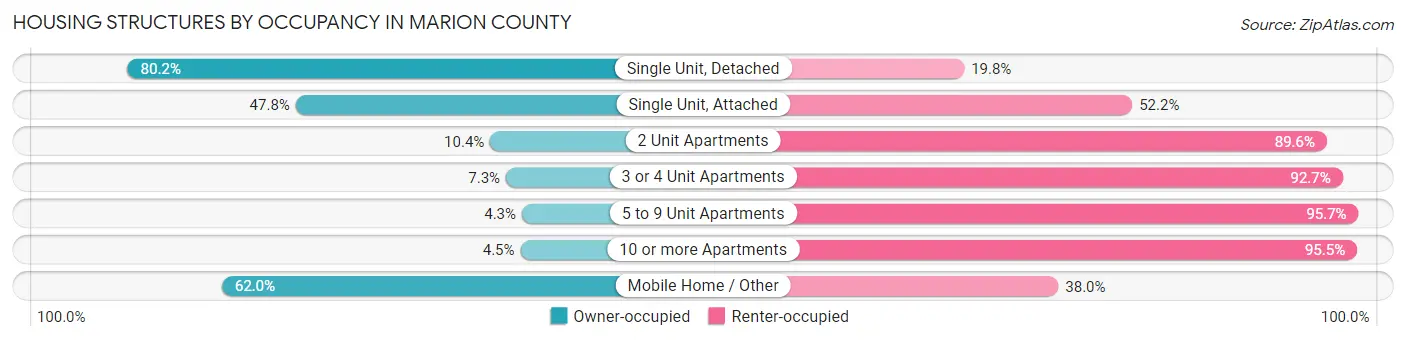
| Structure Type | Owner-occupied | Renter-occupied |
| Single Unit, Detached | 194,014 (80.2%) | 48,030 (19.8%) |
| Single Unit, Attached | 13,780 (47.8%) | 15,043 (52.2%) |
| 2 Unit Apartments | 720 (10.4%) | 6,233 (89.6%) |
| 3 or 4 Unit Apartments | 1,745 (7.3%) | 22,103 (92.7%) |
| 5 to 9 Unit Apartments | 1,380 (4.3%) | 30,988 (95.7%) |
| 10 or more Apartments | 2,390 (4.5%) | 50,229 (95.5%) |
| Mobile Home / Other | 3,835 (62.0%) | 2,347 (38.0%) |
| Total | 217,864 (55.5%) | 174,973 (44.5%) |
Housing Structures by Number of Rooms in Marion County
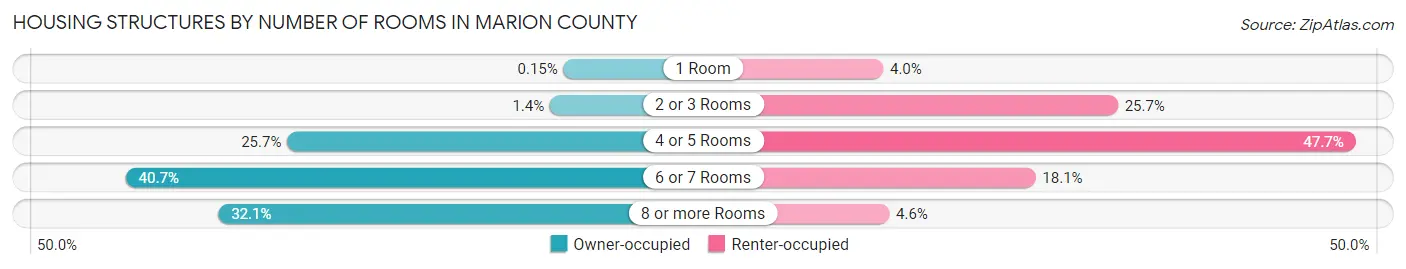
| Number of Rooms | Owner-occupied | Renter-occupied |
| 1 Room | 319 (0.2%) | 6,985 (4.0%) |
| 2 or 3 Rooms | 3,051 (1.4%) | 44,959 (25.7%) |
| 4 or 5 Rooms | 56,010 (25.7%) | 83,437 (47.7%) |
| 6 or 7 Rooms | 88,569 (40.6%) | 31,633 (18.1%) |
| 8 or more Rooms | 69,915 (32.1%) | 7,959 (4.5%) |
| Total | 217,864 (100.0%) | 174,973 (100.0%) |
Housing Structure by Heating Type in Marion County
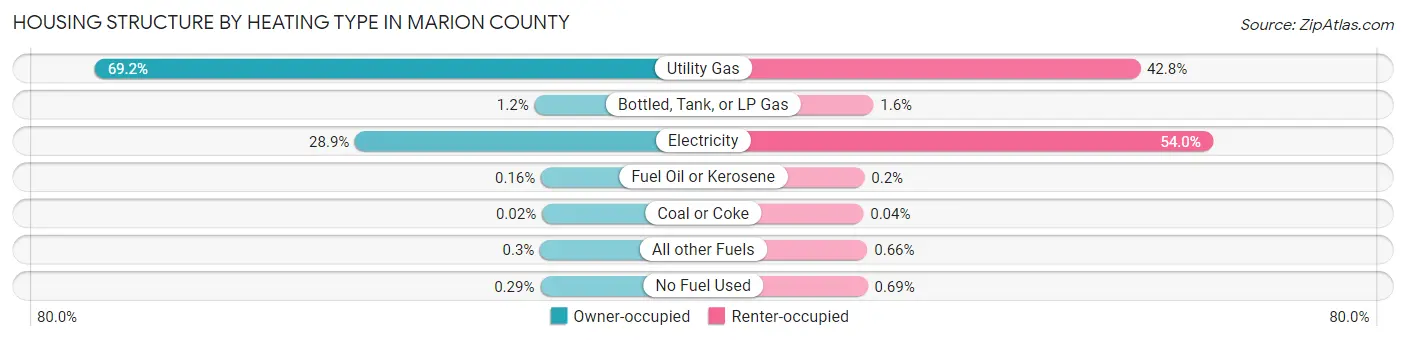
| Heating Type | Owner-occupied | Renter-occupied |
| Utility Gas | 150,677 (69.2%) | 74,910 (42.8%) |
| Bottled, Tank, or LP Gas | 2,561 (1.2%) | 2,781 (1.6%) |
| Electricity | 62,956 (28.9%) | 94,515 (54.0%) |
| Fuel Oil or Kerosene | 348 (0.2%) | 342 (0.2%) |
| Coal or Coke | 51 (0.0%) | 66 (0.0%) |
| All other Fuels | 650 (0.3%) | 1,156 (0.7%) |
| No Fuel Used | 621 (0.3%) | 1,203 (0.7%) |
| Total | 217,864 (100.0%) | 174,973 (100.0%) |
Household Vehicle Usage in Marion County
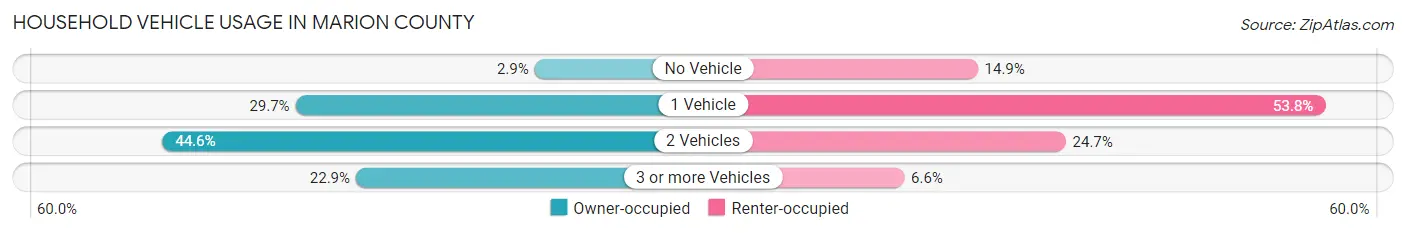
| Vehicles per Household | Owner-occupied | Renter-occupied |
| No Vehicle | 6,282 (2.9%) | 26,004 (14.9%) |
| 1 Vehicle | 64,612 (29.7%) | 94,118 (53.8%) |
| 2 Vehicles | 97,104 (44.6%) | 43,249 (24.7%) |
| 3 or more Vehicles | 49,866 (22.9%) | 11,602 (6.6%) |
| Total | 217,864 (100.0%) | 174,973 (100.0%) |
Real Estate & Mortgages in Marion County
Real Estate and Mortgage Overview in Marion County
| Characteristic | Without Mortgage | With Mortgage |
| Housing Units | 68,024 | 149,840 |
| Median Property Value | $159,200 | $193,700 |
| Median Household Income | $62,264 | $32,996 |
| Monthly Housing Costs | $511 | $6,644 |
| Real Estate Taxes | $1,561 | $4,726 |
Property Value by Mortgage Status in Marion County
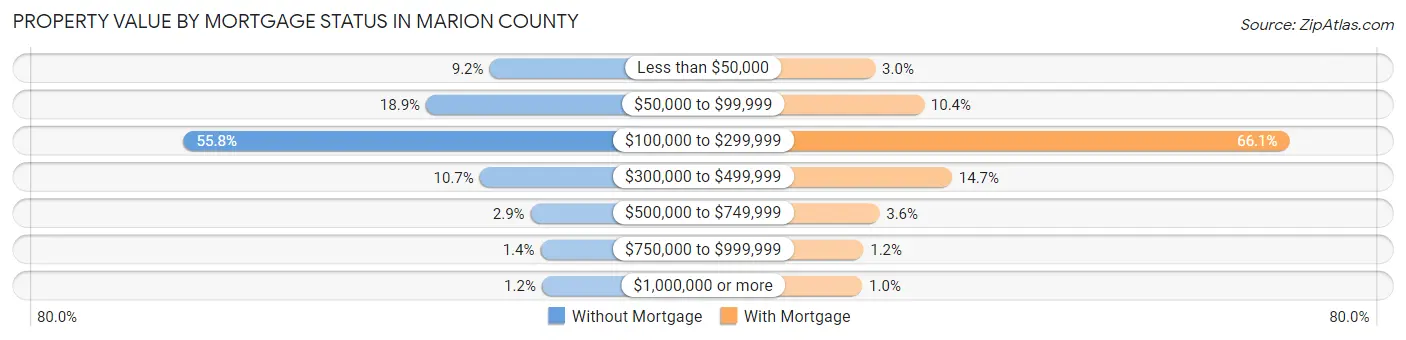
| Property Value | Without Mortgage | With Mortgage |
| Less than $50,000 | 6,245 (9.2%) | 4,484 (3.0%) |
| $50,000 to $99,999 | 12,823 (18.9%) | 15,604 (10.4%) |
| $100,000 to $299,999 | 37,930 (55.8%) | 99,041 (66.1%) |
| $300,000 to $499,999 | 7,263 (10.7%) | 21,994 (14.7%) |
| $500,000 to $749,999 | 1,984 (2.9%) | 5,427 (3.6%) |
| $750,000 to $999,999 | 966 (1.4%) | 1,775 (1.2%) |
| $1,000,000 or more | 813 (1.2%) | 1,515 (1.0%) |
| Total | 68,024 (100.0%) | 149,840 (100.0%) |
Household Income by Mortgage Status in Marion County
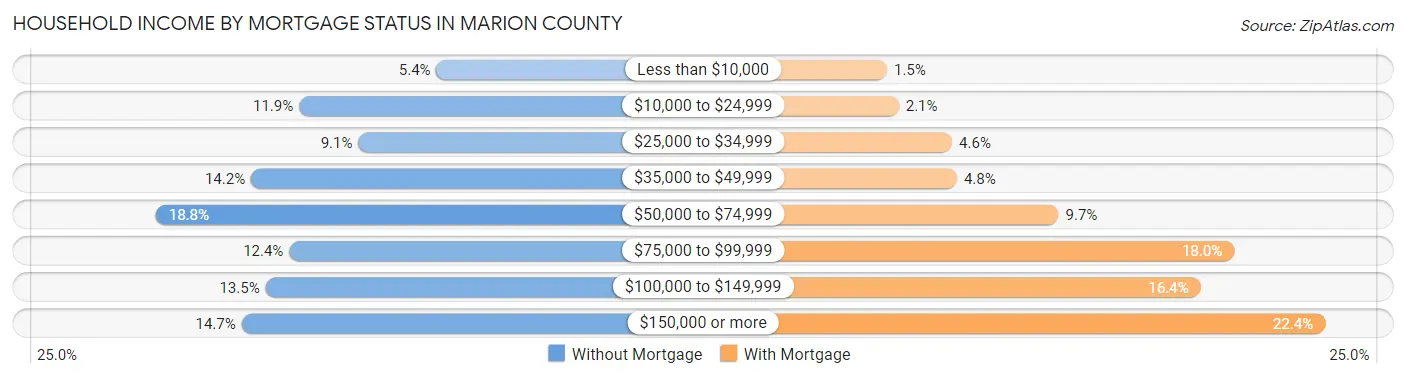
| Household Income | Without Mortgage | With Mortgage |
| Less than $10,000 | 3,665 (5.4%) | 2,251 (1.5%) |
| $10,000 to $24,999 | 8,115 (11.9%) | 3,081 (2.1%) |
| $25,000 to $34,999 | 6,199 (9.1%) | 6,889 (4.6%) |
| $35,000 to $49,999 | 9,674 (14.2%) | 7,238 (4.8%) |
| $50,000 to $74,999 | 12,755 (18.8%) | 14,488 (9.7%) |
| $75,000 to $99,999 | 8,436 (12.4%) | 27,015 (18.0%) |
| $100,000 to $149,999 | 9,203 (13.5%) | 24,622 (16.4%) |
| $150,000 or more | 9,977 (14.7%) | 33,511 (22.4%) |
| Total | 68,024 (100.0%) | 149,840 (100.0%) |
Property Value to Household Income Ratio in Marion County
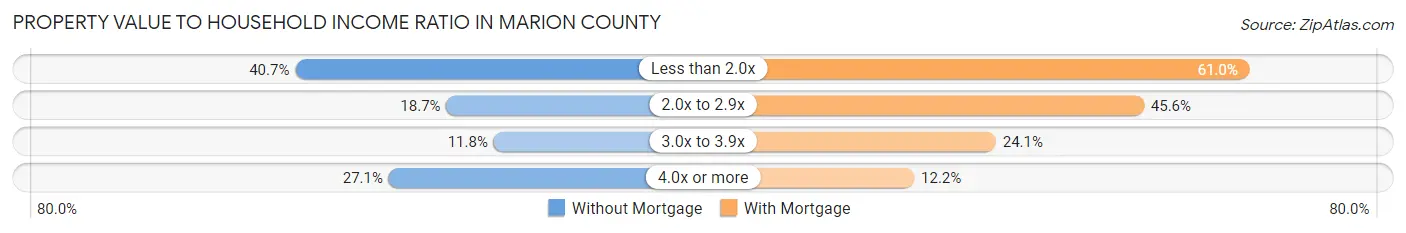
| Value-to-Income Ratio | Without Mortgage | With Mortgage |
| Less than 2.0x | 27,672 (40.7%) | 91,406 (61.0%) |
| 2.0x to 2.9x | 12,736 (18.7%) | 68,345 (45.6%) |
| 3.0x to 3.9x | 8,055 (11.8%) | 36,106 (24.1%) |
| 4.0x or more | 18,430 (27.1%) | 18,321 (12.2%) |
| Total | 68,024 (100.0%) | 149,840 (100.0%) |
Real Estate Taxes by Mortgage Status in Marion County
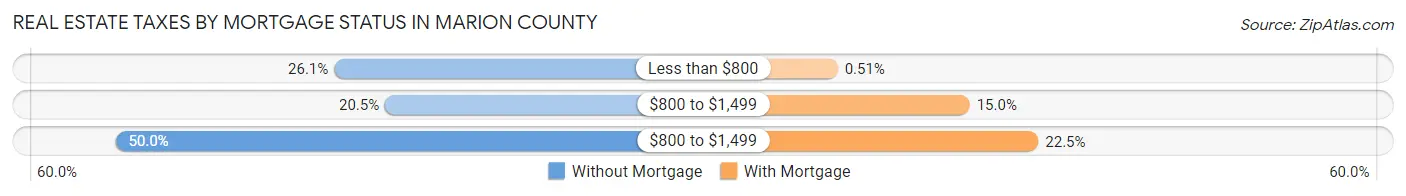
| Property Taxes | Without Mortgage | With Mortgage |
| Less than $800 | 17,743 (26.1%) | 761 (0.5%) |
| $800 to $1,499 | 13,945 (20.5%) | 22,440 (15.0%) |
| $800 to $1,499 | 34,040 (50.0%) | 33,718 (22.5%) |
| Total | 68,024 (100.0%) | 149,840 (100.0%) |
Health & Disability in Marion County
Health Insurance Coverage by Age in Marion County
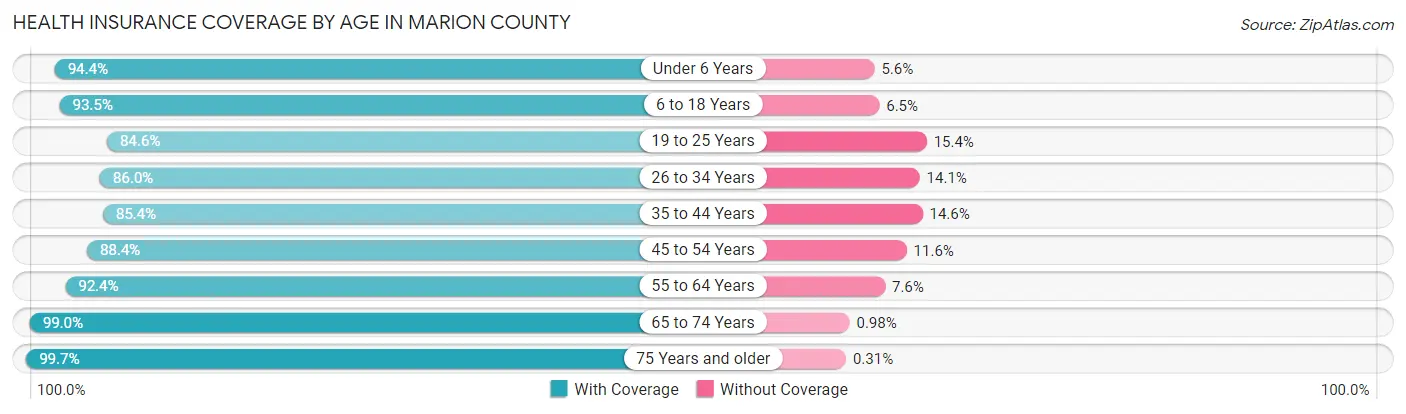
| Age Bracket | With Coverage | Without Coverage |
| Under 6 Years | 76,773 (94.4%) | 4,579 (5.6%) |
| 6 to 18 Years | 159,037 (93.5%) | 11,116 (6.5%) |
| 19 to 25 Years | 81,472 (84.6%) | 14,792 (15.4%) |
| 26 to 34 Years | 124,075 (86.0%) | 20,281 (14.1%) |
| 35 to 44 Years | 108,216 (85.4%) | 18,480 (14.6%) |
| 45 to 54 Years | 96,917 (88.4%) | 12,756 (11.6%) |
| 55 to 64 Years | 104,519 (92.4%) | 8,597 (7.6%) |
| 65 to 74 Years | 74,848 (99.0%) | 739 (1.0%) |
| 75 Years and older | 45,269 (99.7%) | 139 (0.3%) |
| Total | 871,126 (90.5%) | 91,479 (9.5%) |
Health Insurance Coverage by Citizenship Status in Marion County
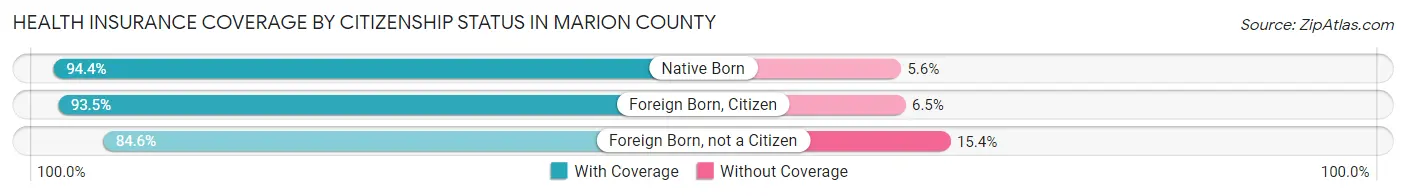
| Citizenship Status | With Coverage | Without Coverage |
| Native Born | 76,773 (94.4%) | 4,579 (5.6%) |
| Foreign Born, Citizen | 159,037 (93.5%) | 11,116 (6.5%) |
| Foreign Born, not a Citizen | 81,472 (84.6%) | 14,792 (15.4%) |
Health Insurance Coverage by Household Income in Marion County
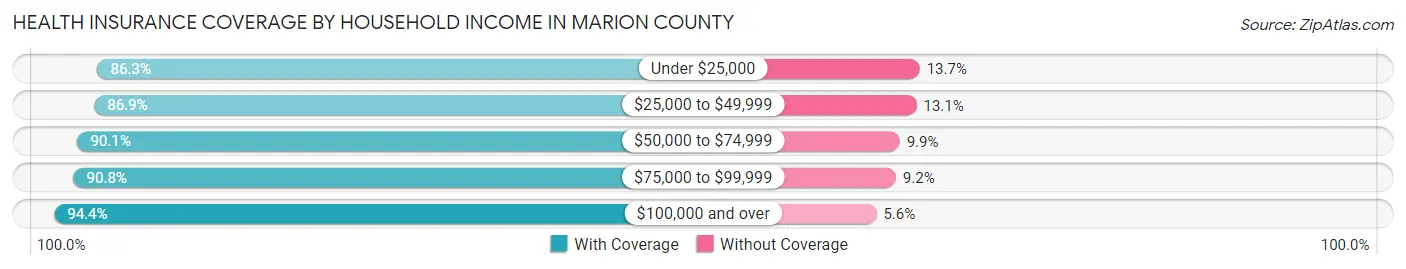
| Household Income | With Coverage | Without Coverage |
| Under $25,000 | 119,149 (86.3%) | 18,869 (13.7%) |
| $25,000 to $49,999 | 165,870 (86.9%) | 24,931 (13.1%) |
| $50,000 to $74,999 | 155,783 (90.1%) | 17,141 (9.9%) |
| $75,000 to $99,999 | 120,867 (90.8%) | 12,251 (9.2%) |
| $100,000 and over | 303,200 (94.4%) | 17,883 (5.6%) |
Public vs Private Health Insurance Coverage by Age in Marion County
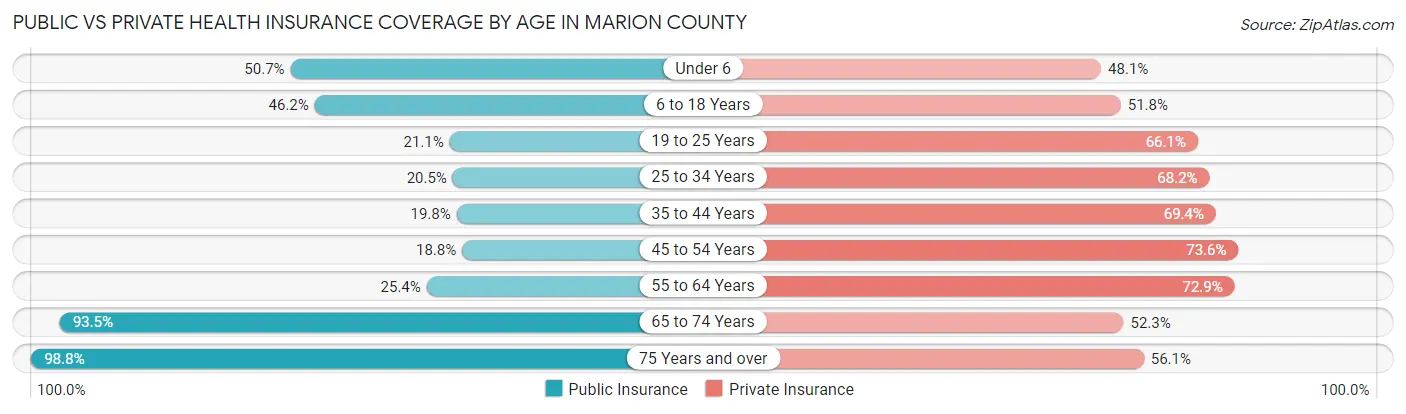
| Age Bracket | Public Insurance | Private Insurance |
| Under 6 | 41,209 (50.7%) | 39,166 (48.1%) |
| 6 to 18 Years | 78,555 (46.2%) | 88,117 (51.8%) |
| 19 to 25 Years | 20,334 (21.1%) | 63,588 (66.1%) |
| 25 to 34 Years | 29,657 (20.5%) | 98,498 (68.2%) |
| 35 to 44 Years | 25,130 (19.8%) | 87,945 (69.4%) |
| 45 to 54 Years | 20,632 (18.8%) | 80,706 (73.6%) |
| 55 to 64 Years | 28,710 (25.4%) | 82,457 (72.9%) |
| 65 to 74 Years | 70,654 (93.5%) | 39,529 (52.3%) |
| 75 Years and over | 44,847 (98.8%) | 25,449 (56.0%) |
| Total | 359,728 (37.4%) | 605,455 (62.9%) |
Disability Status by Sex by Age in Marion County
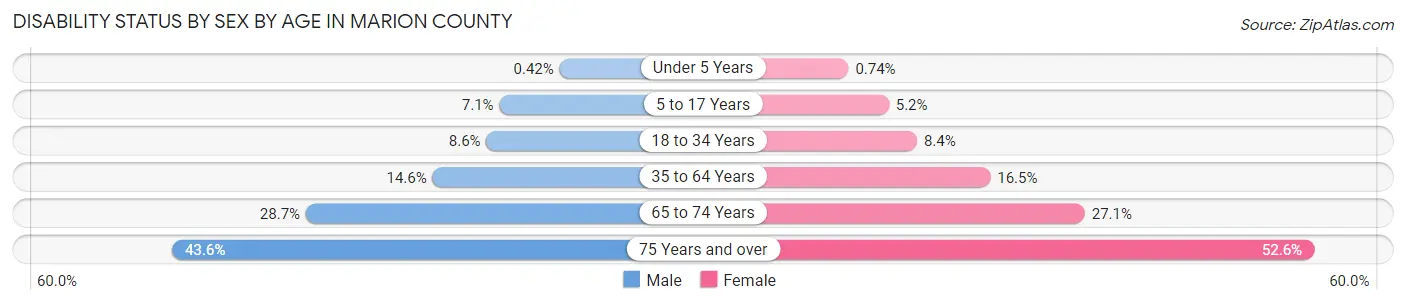
| Age Bracket | Male | Female |
| Under 5 Years | 145 (0.4%) | 246 (0.7%) |
| 5 to 17 Years | 6,212 (7.1%) | 4,357 (5.2%) |
| 18 to 34 Years | 10,539 (8.6%) | 10,922 (8.4%) |
| 35 to 64 Years | 24,680 (14.6%) | 29,795 (16.5%) |
| 65 to 74 Years | 9,854 (28.7%) | 11,153 (27.1%) |
| 75 Years and over | 7,636 (43.6%) | 14,663 (52.6%) |
Disability Class by Sex by Age in Marion County
Disability Class: Hearing Difficulty
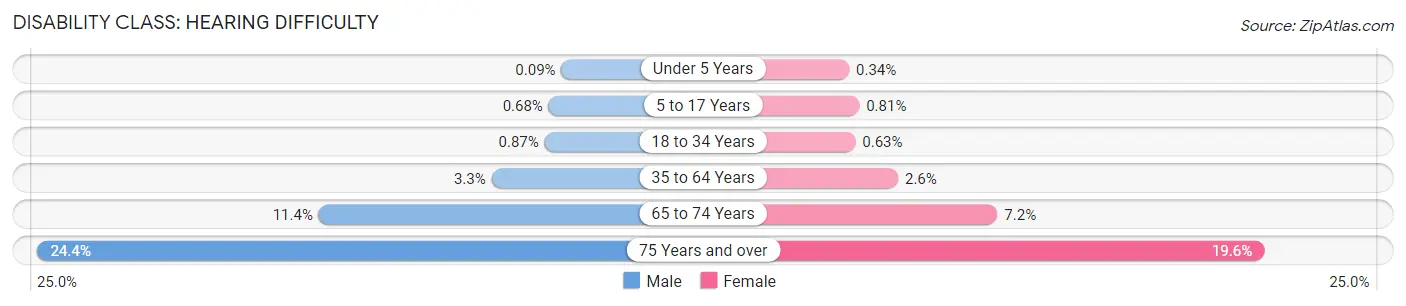
| Age Bracket | Male | Female |
| Under 5 Years | 30 (0.1%) | 113 (0.3%) |
| 5 to 17 Years | 592 (0.7%) | 677 (0.8%) |
| 18 to 34 Years | 1,074 (0.9%) | 827 (0.6%) |
| 35 to 64 Years | 5,641 (3.3%) | 4,710 (2.6%) |
| 65 to 74 Years | 3,901 (11.4%) | 2,978 (7.2%) |
| 75 Years and over | 4,275 (24.4%) | 5,464 (19.6%) |
Disability Class: Vision Difficulty
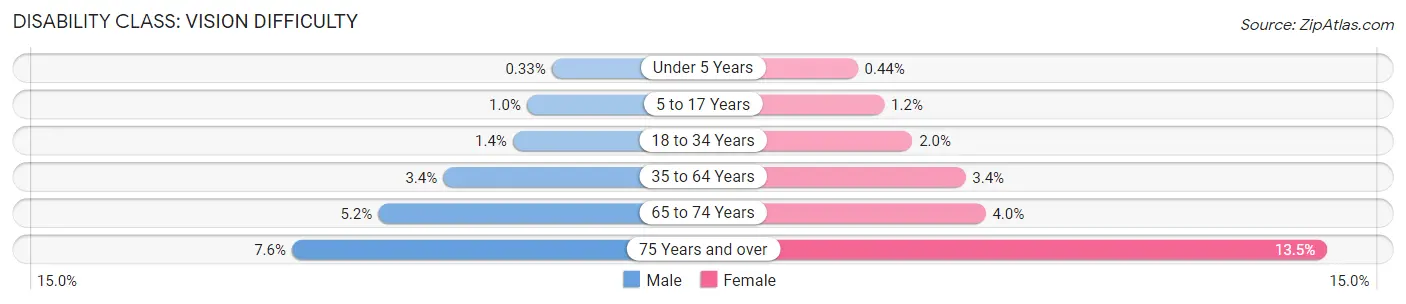
| Age Bracket | Male | Female |
| Under 5 Years | 115 (0.3%) | 147 (0.4%) |
| 5 to 17 Years | 891 (1.0%) | 981 (1.2%) |
| 18 to 34 Years | 1,738 (1.4%) | 2,561 (2.0%) |
| 35 to 64 Years | 5,669 (3.4%) | 6,205 (3.4%) |
| 65 to 74 Years | 1,772 (5.2%) | 1,647 (4.0%) |
| 75 Years and over | 1,324 (7.6%) | 3,768 (13.5%) |
Disability Class: Cognitive Difficulty
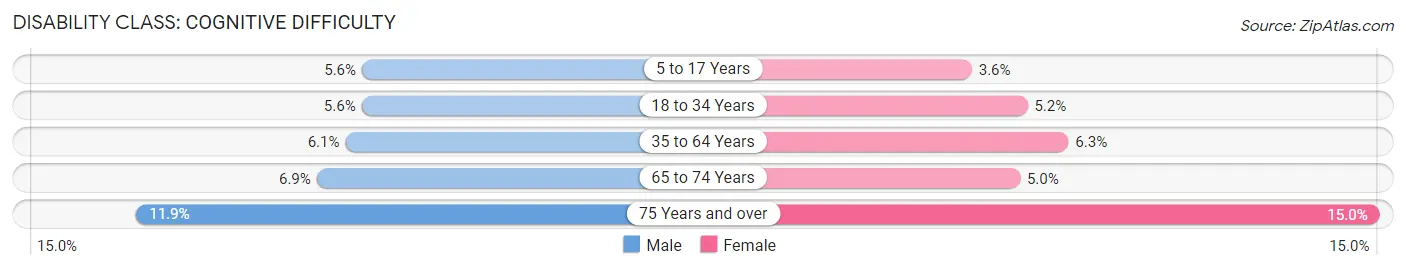
| Age Bracket | Male | Female |
| 5 to 17 Years | 4,890 (5.6%) | 3,019 (3.6%) |
| 18 to 34 Years | 6,905 (5.6%) | 6,748 (5.2%) |
| 35 to 64 Years | 10,274 (6.1%) | 11,369 (6.3%) |
| 65 to 74 Years | 2,362 (6.9%) | 2,044 (5.0%) |
| 75 Years and over | 2,083 (11.9%) | 4,176 (15.0%) |
Disability Class: Ambulatory Difficulty
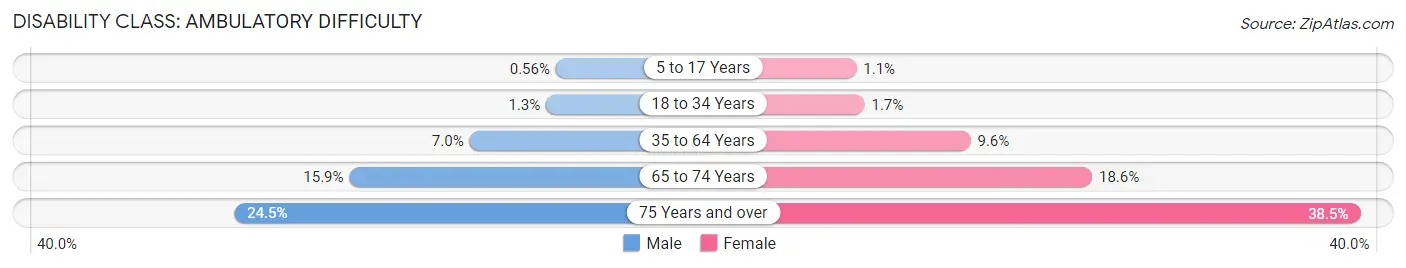
| Age Bracket | Male | Female |
| 5 to 17 Years | 488 (0.6%) | 904 (1.1%) |
| 18 to 34 Years | 1,579 (1.3%) | 2,208 (1.7%) |
| 35 to 64 Years | 11,805 (7.0%) | 17,222 (9.6%) |
| 65 to 74 Years | 5,462 (15.9%) | 7,660 (18.6%) |
| 75 Years and over | 4,283 (24.4%) | 10,733 (38.5%) |
Disability Class: Self-Care Difficulty

| Age Bracket | Male | Female |
| 5 to 17 Years | 1,133 (1.3%) | 1,339 (1.6%) |
| 18 to 34 Years | 927 (0.7%) | 1,233 (0.9%) |
| 35 to 64 Years | 4,411 (2.6%) | 5,543 (3.1%) |
| 65 to 74 Years | 1,625 (4.7%) | 2,172 (5.3%) |
| 75 Years and over | 1,764 (10.1%) | 4,839 (17.3%) |
Technology Access in Marion County
Computing Device Access in Marion County
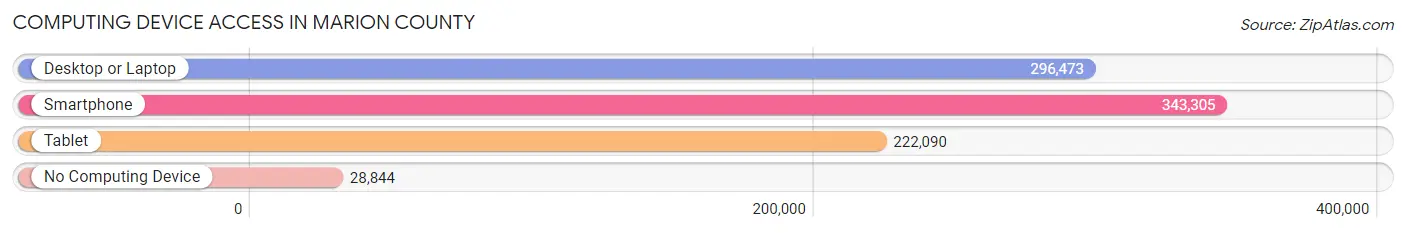
| Device Type | # Households | % Households |
| Desktop or Laptop | 296,473 | 75.5% |
| Smartphone | 343,305 | 87.4% |
| Tablet | 222,090 | 56.5% |
| No Computing Device | 28,844 | 7.3% |
| Total | 392,837 | 100.0% |
Internet Access in Marion County
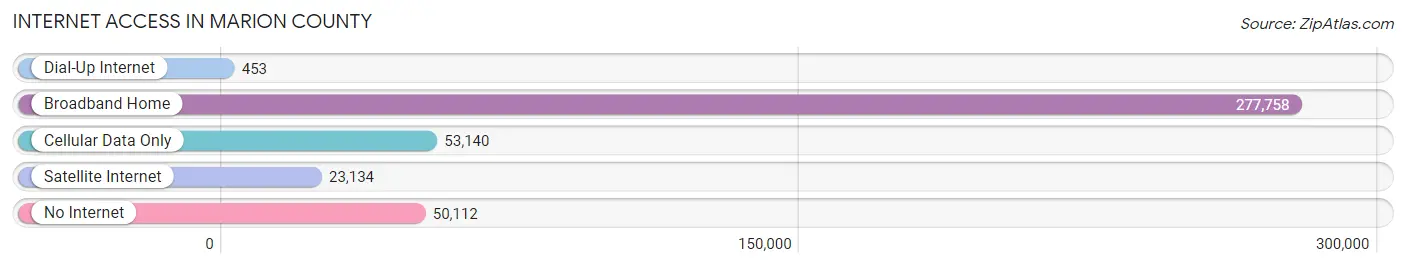
| Internet Type | # Households | % Households |
| Dial-Up Internet | 453 | 0.1% |
| Broadband Home | 277,758 | 70.7% |
| Cellular Data Only | 53,140 | 13.5% |
| Satellite Internet | 23,134 | 5.9% |
| No Internet | 50,112 | 12.8% |
| Total | 392,837 | 100.0% |
Marion County Summary
Marion County, Indiana is located in the central part of the state and is the most populous county in the state. It is bordered by Hamilton, Hancock, Hendricks, Johnson, Morgan, and Shelby counties. The county seat is Indianapolis, which is also the state capital.
Marion County was established in 1822 and named after Revolutionary War hero Francis Marion. The county was originally part of the Northwest Territory and was part of the Indiana Territory when it was created in 1800. The county was organized in 1822 and the first county seat was located in the town of Indianapolis.
Geography
Marion County covers an area of 579 square miles and is located in the Central Till Plains region of Indiana. The county is mostly flat with some rolling hills in the northern and western parts. The White River runs through the county and is a major tributary of the Wabash River. The county is also home to several lakes, including Geist Reservoir, Eagle Creek Reservoir, and Morse Reservoir.
The county is divided into nine townships: Center, Decatur, Franklin, Lawrence, Perry, Pike, Warren, Washington, and Wayne. The county is also home to several unincorporated communities, including Beech Grove, Clermont, Cumberland, Homecroft, and Speedway.
Economy
Marion County has a diverse economy that is driven by the presence of the state capital, Indianapolis. The county is home to several major employers, including Eli Lilly and Company, Anthem, and Rolls-Royce. The county is also home to several major universities, including Indiana University-Purdue University Indianapolis, Butler University, and the University of Indianapolis.
The county is also home to several major sports teams, including the Indianapolis Colts of the National Football League, the Indiana Pacers of the National Basketball Association, and the Indianapolis Indians of Minor League Baseball. The county is also home to the Indianapolis Motor Speedway, which hosts the Indianapolis 500 and the Brickyard 400.
Demographics
As of the 2010 census, Marion County had a population of 903,393. The population was spread out with 24.3% under the age of 18, 10.2% from 18 to 24, 30.2% from 25 to 44, 22.7% from 45 to 64, and 12.6% who were 65 years of age or older. The median age was 34.3 years.
The racial makeup of the county was 68.2% White, 26.2% African American, 0.3% Native American, 2.3% Asian, 0.1% Pacific Islander, 1.2% from other races, and 1.7% from two or more races. Hispanic or Latino of any race were 4.2% of the population.
The median income for a household in the county was $47,697 and the median income for a family was $56,945. The per capita income for the county was $25,845. About 11.2% of families and 14.7% of the population were below the poverty line, including 20.2% of those under age 18 and 8.2% of those age 65 or over.
Marion County is a diverse and vibrant county that is home to the state capital and several major employers. The county has a diverse economy and is home to several major universities and sports teams. The county also has a diverse population with a median age of 34.3 years.
Common Questions
What is the Total Population of Marion County?
Total Population of Marion County is 971,737.
What is the Total Male Population of Marion County?
Total Male Population of Marion County is 471,206.
What is the Total Female Population of Marion County?
Total Female Population of Marion County is 500,531.
What is the Ratio of Males per 100 Females in Marion County?
There are 94.14 Males per 100 Females in Marion County.
What is the Ratio of Females per 100 Males in Marion County?
There are 106.22 Females per 100 Males in Marion County.
What is the Median Population Age in Marion County?
Median Population Age in Marion County is 34.4 Years.
What is the Average Family Size in Marion County
Average Family Size in Marion County is 3.3 People.
What is the Average Household Size in Marion County
Average Household Size in Marion County is 2.4 People.
What is Per Capita Income in Marion County?
Per Capita income in Marion County is $34,796.
What is the Median Family Income in Marion County?
Median Family Income in Marion County is $76,851.
What is the Median Household income in Marion County?
Median Household Income in Marion County is $59,504.
What is Income or Wage Gap in Marion County?
Income or Wage Gap in Marion County is 19.3%.
Women in Marion County earn 80.7 cents for every dollar earned by a man.
What is Family Income Deficit in Marion County?
Family Income Deficit in Marion County is $12,112.
Families that are below poverty line in Marion County earn $12,112 less on average than the poverty threshold level.
What is Inequality or Gini Index in Marion County?
Inequality or Gini Index in Marion County is 0.47.
How Large is the Labor Force in Marion County?
There are 511,904 People in the Labor Forcein in Marion County.
What is the Percentage of People in the Labor Force in Marion County?
67.5% of People are in the Labor Force in Marion County.
What is the Unemployment Rate in Marion County?
Unemployment Rate in Marion County is 5.5%.