Madison County, IN
Madison County Map
Madison County Overview
130,545
TOTAL POPULATION
65,913
MALE POPULATION
64,632
FEMALE POPULATION
101.98
MALES / 100 FEMALES
98.06
FEMALES / 100 MALES
40.7
MEDIAN AGE
3.0
AVG FAMILY SIZE
2.4
AVG HOUSEHOLD SIZE
$31,556
PER CAPITA INCOME
$73,998
AVG FAMILY INCOME
$60,060
AVG HOUSEHOLD INCOME
28.7%
WAGE / INCOME GAP [ % ]
71.3¢/ $1
WAGE / INCOME GAP [ $ ]
$12,080
FAMILY INCOME DEFICIT
0.44
INEQUALITY / GINI INDEX
62,980
LABOR FORCE [ PEOPLE ]
59.4%
PERCENT IN LABOR FORCE
5.5%
UNEMPLOYMENT RATE
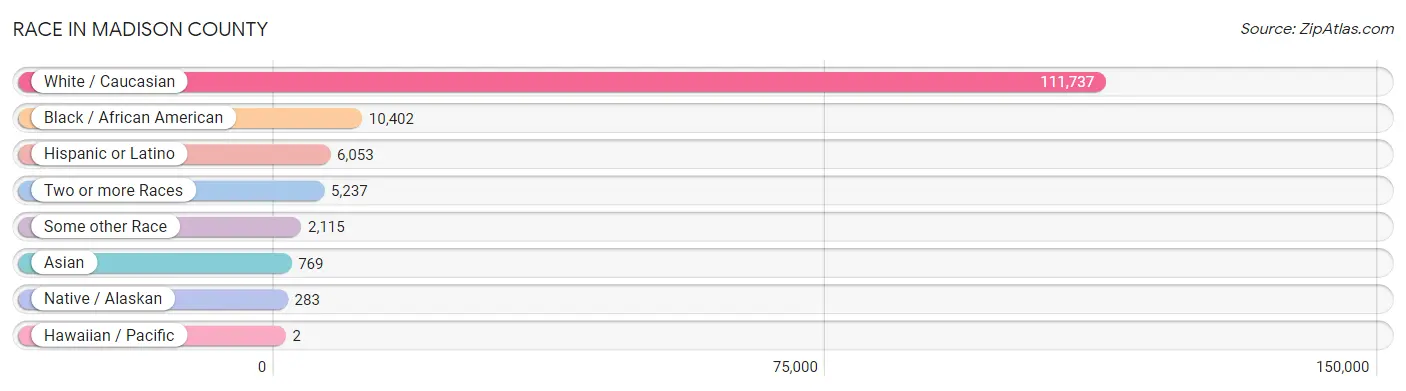
Race in Madison County
The most populous races in Madison County are White / Caucasian (111,737 | 85.6%), Black / African American (10,402 | 8.0%), and Hispanic or Latino (6,053 | 4.6%).
| Race | # Population | % Population |
| Asian | 769 | 0.6% |
| Black / African American | 10,402 | 8.0% |
| Hawaiian / Pacific | 2 | 0.0% |
| Hispanic or Latino | 6,053 | 4.6% |
| Native / Alaskan | 283 | 0.2% |
| White / Caucasian | 111,737 | 85.6% |
| Two or more Races | 5,237 | 4.0% |
| Some other Race | 2,115 | 1.6% |
| Total | 130,545 | 100.0% |
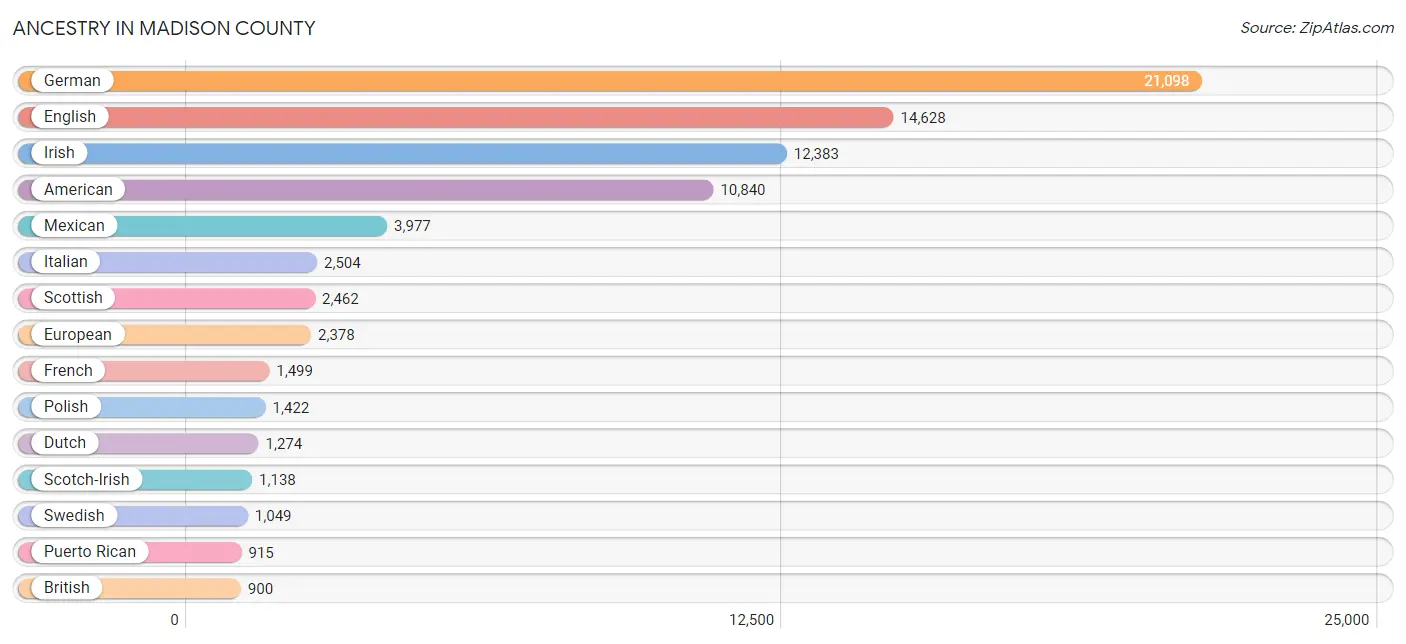
Ancestry in Madison County
The most populous ancestries reported in Madison County are German (21,098 | 16.2%), English (14,628 | 11.2%), Irish (12,383 | 9.5%), American (10,840 | 8.3%), and Mexican (3,977 | 3.0%), together accounting for 48.2% of all Madison County residents.
| Ancestry | # Population | % Population |
| African | 512 | 0.4% |
| Aleut | 1 | 0.0% |
| American | 10,840 | 8.3% |
| Apache | 18 | 0.0% |
| Arab | 109 | 0.1% |
| Argentinean | 19 | 0.0% |
| Austrian | 113 | 0.1% |
| Belgian | 116 | 0.1% |
| Belizean | 43 | 0.0% |
| Bhutanese | 64 | 0.1% |
| Blackfeet | 66 | 0.1% |
| Brazilian | 8 | 0.0% |
| British | 900 | 0.7% |
| Bulgarian | 56 | 0.0% |
| Burmese | 228 | 0.2% |
| Canadian | 37 | 0.0% |
| Central American | 504 | 0.4% |
| Central American Indian | 4 | 0.0% |
| Cherokee | 304 | 0.2% |
| Chickasaw | 4 | 0.0% |
| Chilean | 2 | 0.0% |
| Chippewa | 5 | 0.0% |
| Choctaw | 8 | 0.0% |
| Colombian | 64 | 0.1% |
| Comanche | 9 | 0.0% |
| Creek | 22 | 0.0% |
| Croatian | 87 | 0.1% |
| Crow | 20 | 0.0% |
| Cuban | 151 | 0.1% |
| Czech | 77 | 0.1% |
| Czechoslovakian | 59 | 0.1% |
| Danish | 273 | 0.2% |
| Dominican | 21 | 0.0% |
| Dutch | 1,274 | 1.0% |
| Eastern European | 147 | 0.1% |
| Ecuadorian | 52 | 0.0% |
| Egyptian | 10 | 0.0% |
| English | 14,628 | 11.2% |
| Ethiopian | 30 | 0.0% |
| European | 2,378 | 1.8% |
| Filipino | 14 | 0.0% |
| Finnish | 70 | 0.1% |
| French | 1,499 | 1.1% |
| French Canadian | 139 | 0.1% |
| German | 21,098 | 16.2% |
| Greek | 331 | 0.3% |
| Guatemalan | 52 | 0.0% |
| Haitian | 93 | 0.1% |
| Honduran | 149 | 0.1% |
| Hopi | 9 | 0.0% |
| Hungarian | 74 | 0.1% |
| Indian (Asian) | 127 | 0.1% |
| Indonesian | 37 | 0.0% |
| Inupiat | 5 | 0.0% |
| Irish | 12,383 | 9.5% |
| Israeli | 30 | 0.0% |
| Italian | 2,504 | 1.9% |
| Jamaican | 43 | 0.0% |
| Jordanian | 15 | 0.0% |
| Korean | 181 | 0.1% |
| Laotian | 15 | 0.0% |
| Latvian | 18 | 0.0% |
| Lithuanian | 34 | 0.0% |
| Malaysian | 27 | 0.0% |
| Mexican | 3,977 | 3.0% |
| Mexican American Indian | 156 | 0.1% |
| Moroccan | 65 | 0.1% |
| Native Hawaiian | 47 | 0.0% |
| Navajo | 7 | 0.0% |
| Nicaraguan | 98 | 0.1% |
| Nigerian | 11 | 0.0% |
| Northern European | 170 | 0.1% |
| Norwegian | 240 | 0.2% |
| Osage | 3 | 0.0% |
| Pakistani | 42 | 0.0% |
| Palestinian | 10 | 0.0% |
| Panamanian | 37 | 0.0% |
| Pennsylvania German | 67 | 0.1% |
| Peruvian | 7 | 0.0% |
| Polish | 1,422 | 1.1% |
| Portuguese | 27 | 0.0% |
| Potawatomi | 6 | 0.0% |
| Puerto Rican | 915 | 0.7% |
| Romanian | 43 | 0.0% |
| Russian | 217 | 0.2% |
| Salvadoran | 168 | 0.1% |
| Samoan | 5 | 0.0% |
| Scandinavian | 290 | 0.2% |
| Scotch-Irish | 1,138 | 0.9% |
| Scottish | 2,462 | 1.9% |
| Seminole | 64 | 0.1% |
| Sioux | 12 | 0.0% |
| Slavic | 67 | 0.1% |
| Slovak | 27 | 0.0% |
| Somali | 12 | 0.0% |
| South American | 156 | 0.1% |
| Spaniard | 50 | 0.0% |
| Spanish | 15 | 0.0% |
| Spanish American Indian | 2 | 0.0% |
| Sri Lankan | 189 | 0.1% |
| Subsaharan African | 598 | 0.5% |
| Sudanese | 10 | 0.0% |
| Swedish | 1,049 | 0.8% |
| Swiss | 144 | 0.1% |
| Syrian | 9 | 0.0% |
| Thai | 131 | 0.1% |
| Tohono O'Odham | 14 | 0.0% |
| Ukrainian | 100 | 0.1% |
| Venezuelan | 12 | 0.0% |
| Welsh | 639 | 0.5% |
| Yugoslavian | 38 | 0.0% | View All 111 Rows |
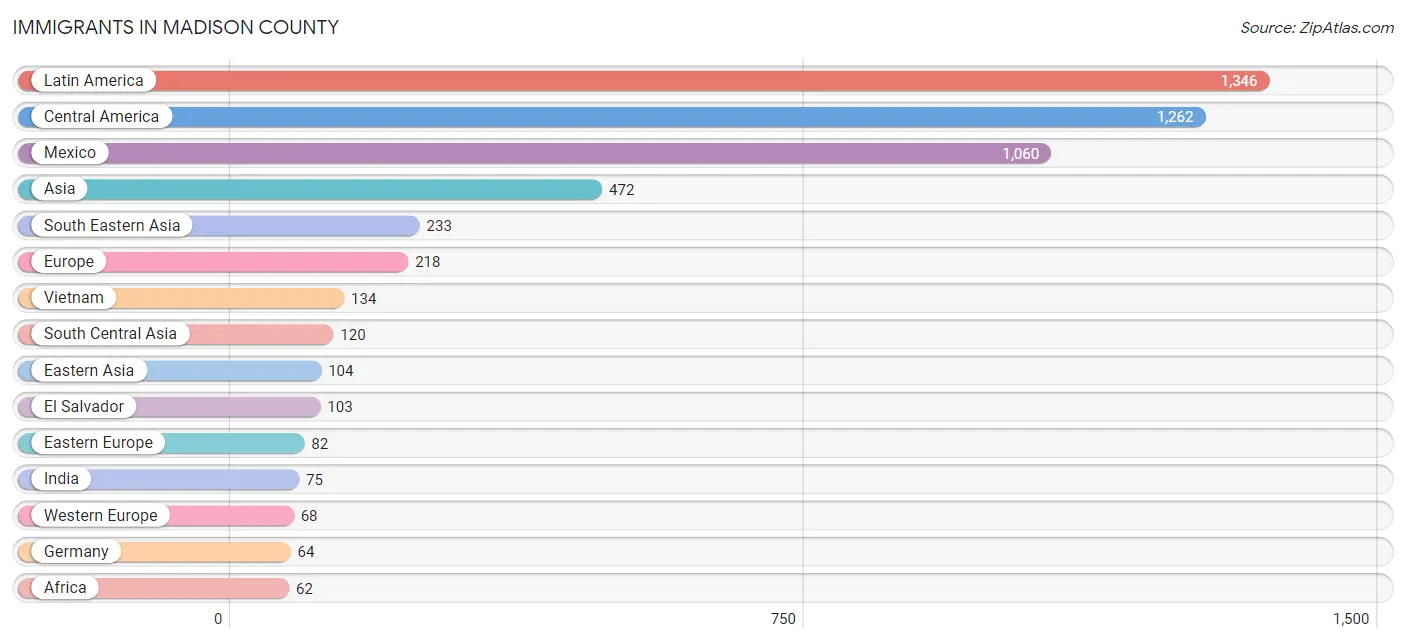
Immigrants in Madison County
The most numerous immigrant groups reported in Madison County came from Latin America (1,346 | 1.0%), Central America (1,262 | 1.0%), Mexico (1,060 | 0.8%), Asia (472 | 0.4%), and South Eastern Asia (233 | 0.2%), together accounting for 3.4% of all Madison County residents.
| Immigration Origin | # Population | % Population |
| Africa | 62 | 0.1% |
| Asia | 472 | 0.4% |
| Barbados | 7 | 0.0% |
| Belize | 27 | 0.0% |
| Brazil | 8 | 0.0% |
| Bulgaria | 56 | 0.0% |
| Canada | 59 | 0.1% |
| Caribbean | 36 | 0.0% |
| Central America | 1,262 | 1.0% |
| Chile | 1 | 0.0% |
| China | 60 | 0.1% |
| Colombia | 27 | 0.0% |
| Cuba | 11 | 0.0% |
| Denmark | 13 | 0.0% |
| Dominican Republic | 1 | 0.0% |
| Eastern Africa | 11 | 0.0% |
| Eastern Asia | 104 | 0.1% |
| Eastern Europe | 82 | 0.1% |
| Egypt | 14 | 0.0% |
| El Salvador | 103 | 0.1% |
| England | 20 | 0.0% |
| Europe | 218 | 0.2% |
| Germany | 64 | 0.1% |
| Guatemala | 28 | 0.0% |
| Haiti | 10 | 0.0% |
| Honduras | 20 | 0.0% |
| India | 75 | 0.1% |
| Indonesia | 28 | 0.0% |
| Italy | 10 | 0.0% |
| Japan | 7 | 0.0% |
| Jordan | 15 | 0.0% |
| Korea | 37 | 0.0% |
| Laos | 10 | 0.0% |
| Latin America | 1,346 | 1.0% |
| Mexico | 1,060 | 0.8% |
| Netherlands | 4 | 0.0% |
| Nicaragua | 12 | 0.0% |
| Northern Africa | 24 | 0.0% |
| Northern Europe | 58 | 0.0% |
| Pakistan | 45 | 0.0% |
| Panama | 12 | 0.0% |
| Philippines | 25 | 0.0% |
| Scotland | 13 | 0.0% |
| South Africa | 21 | 0.0% |
| South America | 48 | 0.0% |
| South Central Asia | 120 | 0.1% |
| South Eastern Asia | 233 | 0.2% |
| Southern Europe | 10 | 0.0% |
| Sudan | 10 | 0.0% |
| Taiwan | 3 | 0.0% |
| Thailand | 36 | 0.0% |
| Trinidad and Tobago | 7 | 0.0% |
| Ukraine | 18 | 0.0% |
| Venezuela | 12 | 0.0% |
| Vietnam | 134 | 0.1% |
| Western Asia | 15 | 0.0% |
| Western Europe | 68 | 0.1% | View All 57 Rows |
Sex and Age in Madison County
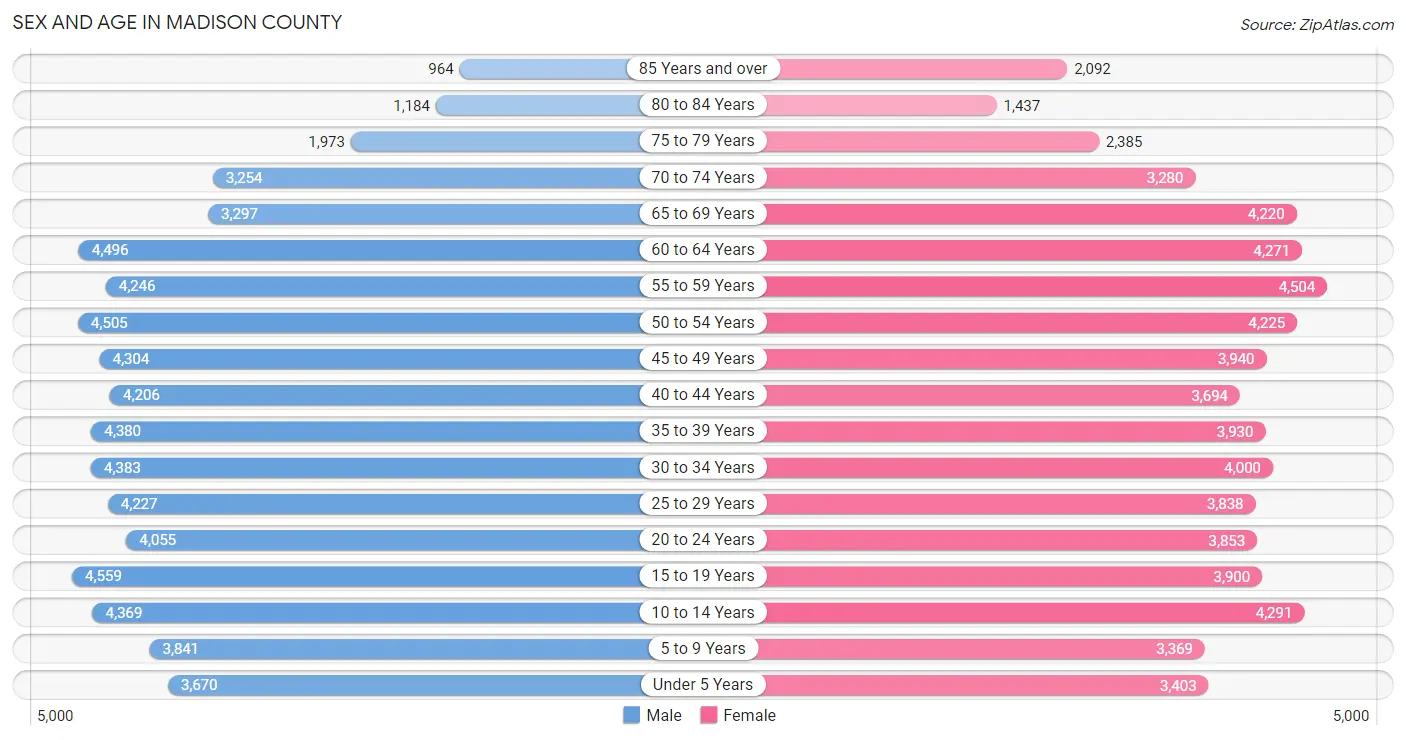
Sex and Age in Madison County
The most populous age groups in Madison County are 15 to 19 Years (4,559 | 6.9%) for men and 55 to 59 Years (4,504 | 7.0%) for women.
| Age Bracket | Male | Female |
| Under 5 Years | 3,670 (5.6%) | 3,403 (5.3%) |
| 5 to 9 Years | 3,841 (5.8%) | 3,369 (5.2%) |
| 10 to 14 Years | 4,369 (6.6%) | 4,291 (6.6%) |
| 15 to 19 Years | 4,559 (6.9%) | 3,900 (6.0%) |
| 20 to 24 Years | 4,055 (6.1%) | 3,853 (6.0%) |
| 25 to 29 Years | 4,227 (6.4%) | 3,838 (5.9%) |
| 30 to 34 Years | 4,383 (6.7%) | 4,000 (6.2%) |
| 35 to 39 Years | 4,380 (6.7%) | 3,930 (6.1%) |
| 40 to 44 Years | 4,206 (6.4%) | 3,694 (5.7%) |
| 45 to 49 Years | 4,304 (6.5%) | 3,940 (6.1%) |
| 50 to 54 Years | 4,505 (6.8%) | 4,225 (6.5%) |
| 55 to 59 Years | 4,246 (6.4%) | 4,504 (7.0%) |
| 60 to 64 Years | 4,496 (6.8%) | 4,271 (6.6%) |
| 65 to 69 Years | 3,297 (5.0%) | 4,220 (6.5%) |
| 70 to 74 Years | 3,254 (4.9%) | 3,280 (5.1%) |
| 75 to 79 Years | 1,973 (3.0%) | 2,385 (3.7%) |
| 80 to 84 Years | 1,184 (1.8%) | 1,437 (2.2%) |
| 85 Years and over | 964 (1.5%) | 2,092 (3.2%) |
| Total | 65,913 (100.0%) | 64,632 (100.0%) |
Families and Households in Madison County
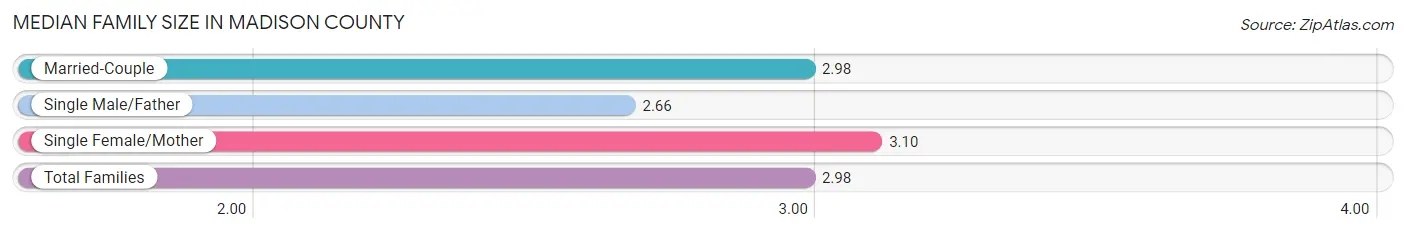
Median Family Size in Madison County
The median family size in Madison County is 2.98 persons per family, with single female/mother families (7,175 | 21.6%) accounting for the largest median family size of 3.1 persons per family. On the other hand, single male/father families (2,697 | 8.1%) represent the smallest median family size with 2.66 persons per family.
| Family Type | # Families | Family Size |
| Married-Couple | 23,292 (70.2%) | 2.98 |
| Single Male/Father | 2,697 (8.1%) | 2.66 |
| Single Female/Mother | 7,175 (21.6%) | 3.10 |
| Total Families | 33,164 (100.0%) | 2.98 |
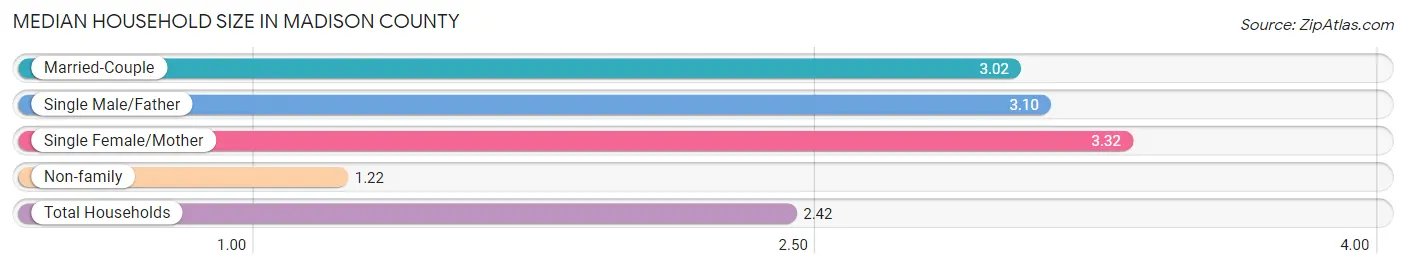
Median Household Size in Madison County
The median household size in Madison County is 2.42 persons per household, with single female/mother households (7,175 | 13.9%) accounting for the largest median household size of 3.32 persons per household. non-family households (18,624 | 36.0%) represent the smallest median household size with 1.22 persons per household.
| Household Type | # Households | Household Size |
| Married-Couple | 23,292 (45.0%) | 3.02 |
| Single Male/Father | 2,697 (5.2%) | 3.10 |
| Single Female/Mother | 7,175 (13.9%) | 3.32 |
| Non-family | 18,624 (36.0%) | 1.22 |
| Total Households | 51,788 (100.0%) | 2.42 |
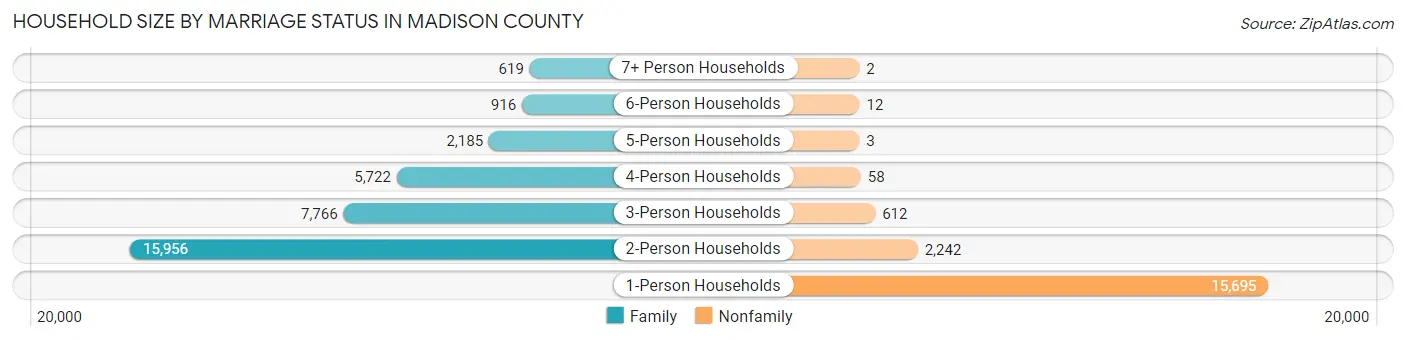
Household Size by Marriage Status in Madison County
Out of a total of 51,788 households in Madison County, 33,164 (64.0%) are family households, while 18,624 (36.0%) are nonfamily households. The most numerous type of family households are 2-person households, comprising 15,956, and the most common type of nonfamily households are 1-person households, comprising 15,695.
| Household Size | Family Households | Nonfamily Households |
| 1-Person Households | - | 15,695 (30.3%) |
| 2-Person Households | 15,956 (30.8%) | 2,242 (4.3%) |
| 3-Person Households | 7,766 (15.0%) | 612 (1.2%) |
| 4-Person Households | 5,722 (11.1%) | 58 (0.1%) |
| 5-Person Households | 2,185 (4.2%) | 3 (0.0%) |
| 6-Person Households | 916 (1.8%) | 12 (0.0%) |
| 7+ Person Households | 619 (1.2%) | 2 (0.0%) |
| Total | 33,164 (64.0%) | 18,624 (36.0%) |
Female Fertility in Madison County
Fertility by Age in Madison County
Average fertility rate in Madison County is 38.0 births per 1,000 women. Women in the age bracket of 20 to 34 years have the highest fertility rate with 79.0 births per 1,000 women. Women in the age bracket of 20 to 34 years acount for 86.3% of all women with births.
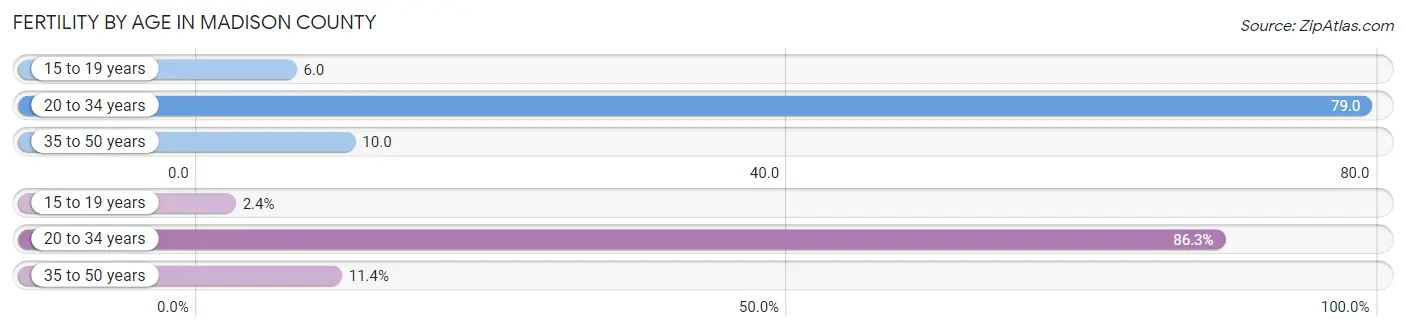
| Age Bracket | Women with Births | Births / 1,000 Women |
| 15 to 19 years | 25 (2.4%) | 6.0 |
| 20 to 34 years | 920 (86.3%) | 79.0 |
| 35 to 50 years | 121 (11.4%) | 10.0 |
| Total | 1,066 (100.0%) | 38.0 |
Fertility by Age by Marriage Status in Madison County
46.0% of women with births (1,066) in Madison County are married. The highest percentage of unmarried women with births falls into 15 to 19 years age bracket with 100.0% of them unmarried at the time of birth, while the lowest percentage of unmarried women with births belong to 35 to 50 years age bracket with 42.1% of them unmarried.
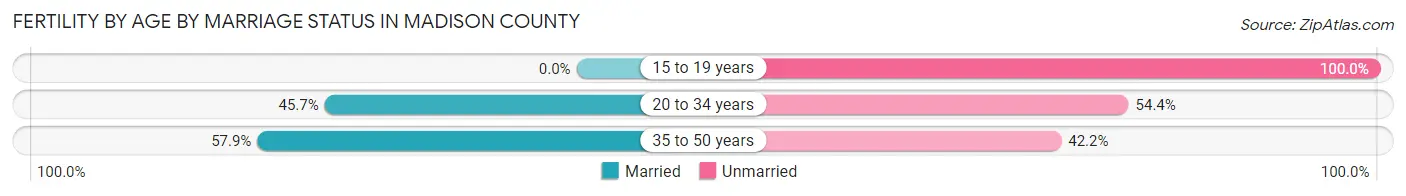
| Age Bracket | Married | Unmarried |
| 15 to 19 years | 0 (0.0%) | 25 (100.0%) |
| 20 to 34 years | 420 (45.7%) | 500 (54.3%) |
| 35 to 50 years | 70 (57.9%) | 51 (42.1%) |
| Total | 490 (46.0%) | 576 (54.0%) |
Fertility by Education in Madison County
Average fertility rate in Madison County is 38.0 births per 1,000 women. Women with the education attainment of high school diploma have the highest fertility rate of 46.0 births per 1,000 women, while women with the education attainment of less than high school have the lowest fertility at 27.0 births per 1,000 women. Women with the education attainment of high school diploma represent 35.8% of all women with births.
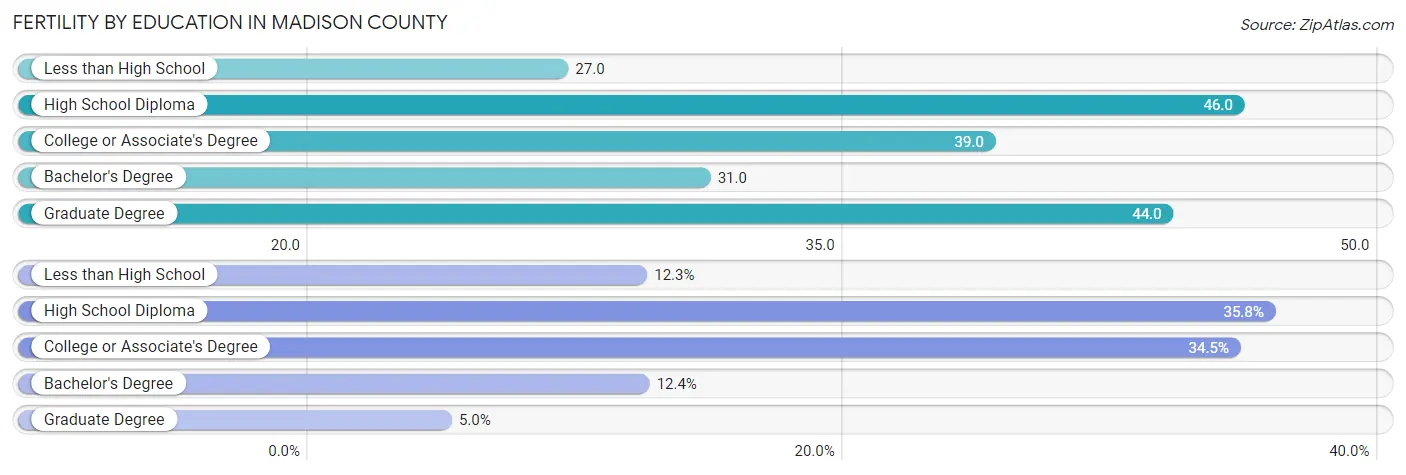
| Educational Attainment | Women with Births | Births / 1,000 Women |
| Less than High School | 131 (12.3%) | 27.0 |
| High School Diploma | 382 (35.8%) | 46.0 |
| College or Associate's Degree | 368 (34.5%) | 39.0 |
| Bachelor's Degree | 132 (12.4%) | 31.0 |
| Graduate Degree | 53 (5.0%) | 44.0 |
| Total | 1,066 (100.0%) | 38.0 |
Fertility by Education by Marriage Status in Madison County
54.0% of women with births in Madison County are unmarried. Women with the educational attainment of bachelor's degree are most likely to be married with 100.0% of them married at childbirth, while women with the educational attainment of high school diploma are least likely to be married with 81.9% of them unmarried at childbirth.
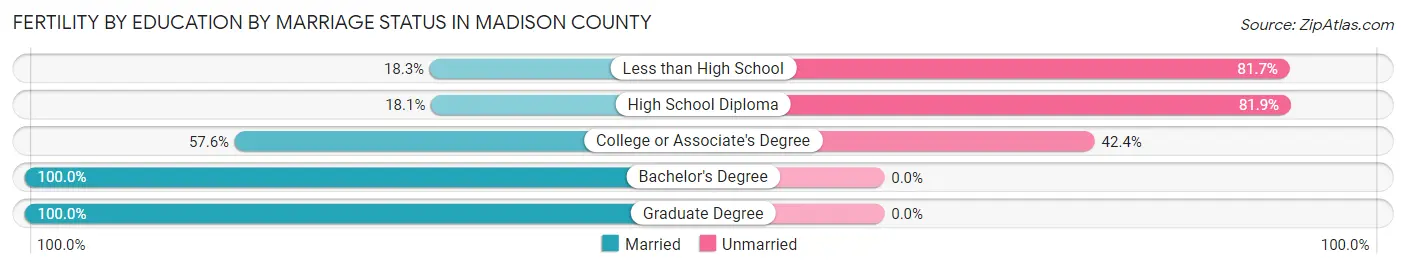
| Educational Attainment | Married | Unmarried |
| Less than High School | 24 (18.3%) | 107 (81.7%) |
| High School Diploma | 69 (18.1%) | 313 (81.9%) |
| College or Associate's Degree | 212 (57.6%) | 156 (42.4%) |
| Bachelor's Degree | 132 (100.0%) | 0 (0.0%) |
| Graduate Degree | 53 (100.0%) | 0 (0.0%) |
| Total | 490 (46.0%) | 576 (54.0%) |
Income in Madison County
Income Overview in Madison County
Per Capita Income in Madison County is $31,556, while median incomes of families and households are $73,998 and $60,060 respectively.
| Characteristic | Number | Measure |
| Per Capita Income | 130,545 | $31,556 |
| Median Family Income | 33,164 | $73,998 |
| Mean Family Income | 33,164 | $90,110 |
| Median Household Income | 51,788 | $60,060 |
| Mean Household Income | 51,788 | $75,913 |
| Income Deficit | 33,164 | $12,080 |
| Wage / Income Gap (%) | 130,545 | 28.69% |
| Wage / Income Gap ($) | 130,545 | 71.31¢ per $1 |
| Gini / Inequality Index | 130,545 | 0.44 |
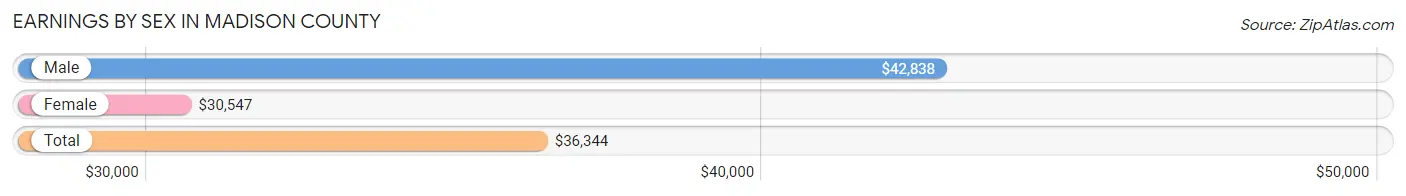
Earnings by Sex in Madison County
Average Earnings in Madison County are $36,344, $42,838 for men and $30,547 for women, a difference of 28.7%.
| Sex | Number | Average Earnings |
| Male | 34,671 (51.9%) | $42,838 |
| Female | 32,149 (48.1%) | $30,547 |
| Total | 66,820 (100.0%) | $36,344 |
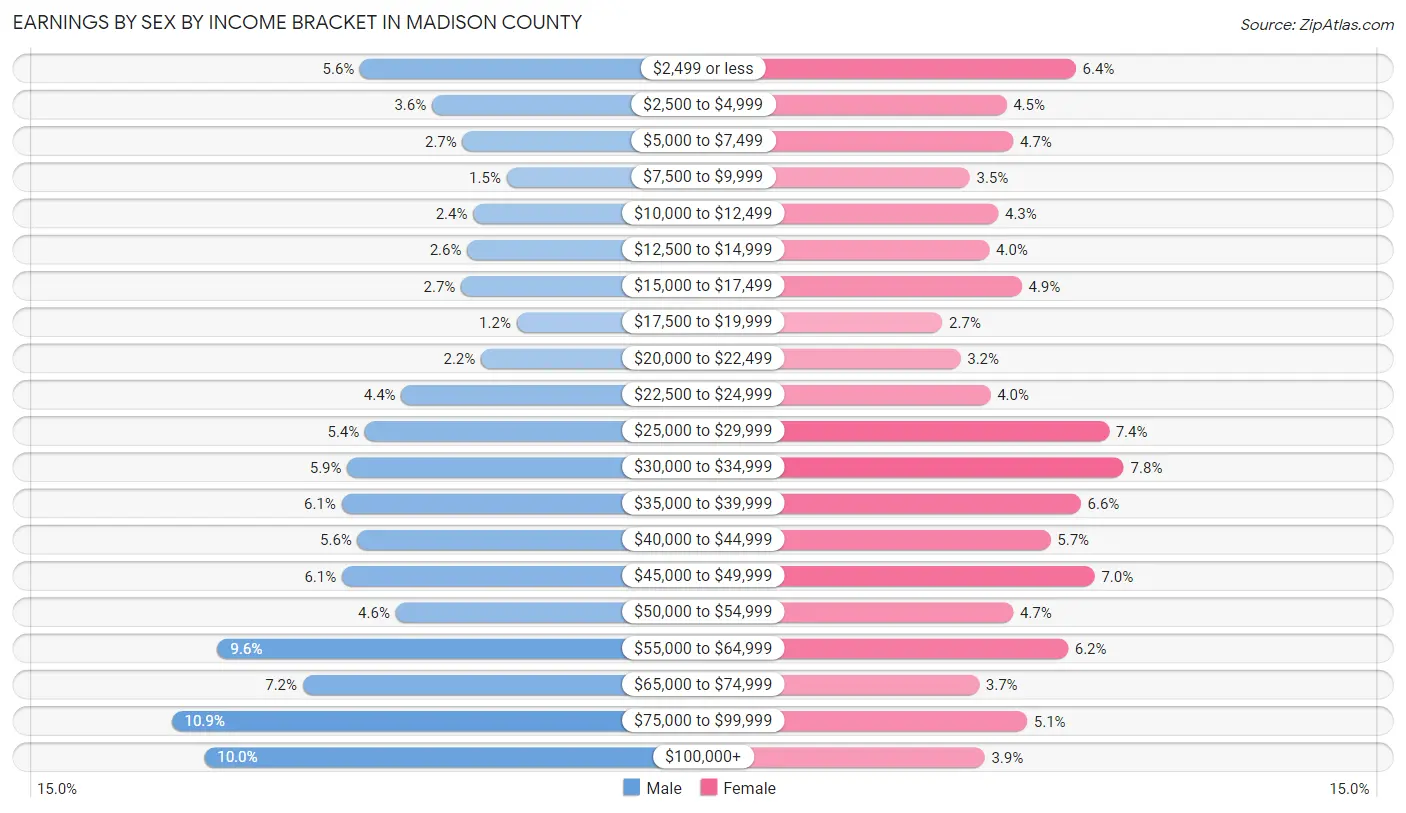
Earnings by Sex by Income Bracket in Madison County
The most common earnings brackets in Madison County are $75,000 to $99,999 for men (3,770 | 10.9%) and $30,000 to $34,999 for women (2,500 | 7.8%).
| Income | Male | Female |
| $2,499 or less | 1,931 (5.6%) | 2,066 (6.4%) |
| $2,500 to $4,999 | 1,230 (3.5%) | 1,439 (4.5%) |
| $5,000 to $7,499 | 932 (2.7%) | 1,501 (4.7%) |
| $7,500 to $9,999 | 504 (1.5%) | 1,108 (3.5%) |
| $10,000 to $12,499 | 829 (2.4%) | 1,367 (4.3%) |
| $12,500 to $14,999 | 886 (2.6%) | 1,287 (4.0%) |
| $15,000 to $17,499 | 946 (2.7%) | 1,578 (4.9%) |
| $17,500 to $19,999 | 407 (1.2%) | 863 (2.7%) |
| $20,000 to $22,499 | 751 (2.2%) | 1,025 (3.2%) |
| $22,500 to $24,999 | 1,528 (4.4%) | 1,297 (4.0%) |
| $25,000 to $29,999 | 1,881 (5.4%) | 2,367 (7.4%) |
| $30,000 to $34,999 | 2,056 (5.9%) | 2,500 (7.8%) |
| $35,000 to $39,999 | 2,111 (6.1%) | 2,113 (6.6%) |
| $40,000 to $44,999 | 1,955 (5.6%) | 1,839 (5.7%) |
| $45,000 to $49,999 | 2,107 (6.1%) | 2,239 (7.0%) |
| $50,000 to $54,999 | 1,583 (4.6%) | 1,500 (4.7%) |
| $55,000 to $64,999 | 3,322 (9.6%) | 1,996 (6.2%) |
| $65,000 to $74,999 | 2,491 (7.2%) | 1,192 (3.7%) |
| $75,000 to $99,999 | 3,770 (10.9%) | 1,628 (5.1%) |
| $100,000+ | 3,451 (10.0%) | 1,244 (3.9%) |
| Total | 34,671 (100.0%) | 32,149 (100.0%) |
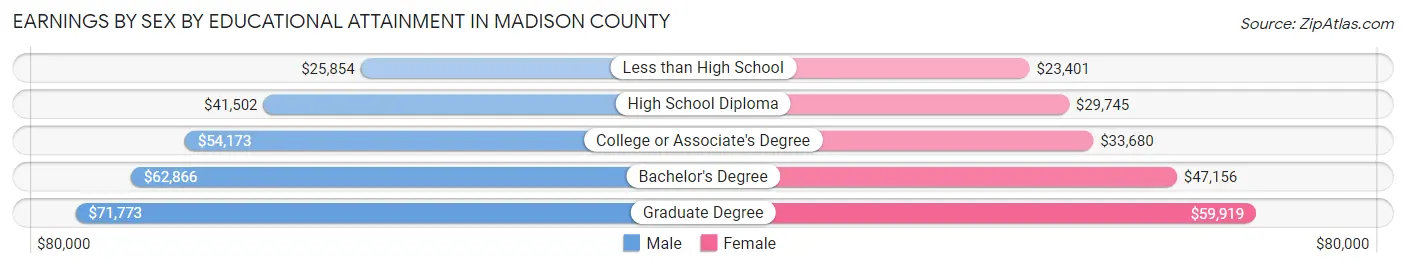
Earnings by Sex by Educational Attainment in Madison County
Average earnings in Madison County are $48,429 for men and $34,678 for women, a difference of 28.4%. Men with an educational attainment of graduate degree enjoy the highest average annual earnings of $71,773, while those with less than high school education earn the least with $25,854. Women with an educational attainment of graduate degree earn the most with the average annual earnings of $59,919, while those with less than high school education have the smallest earnings of $23,401.
| Educational Attainment | Male Income | Female Income |
| Less than High School | $25,854 | $23,401 |
| High School Diploma | $41,502 | $29,745 |
| College or Associate's Degree | $54,173 | $33,680 |
| Bachelor's Degree | $62,866 | $47,156 |
| Graduate Degree | $71,773 | $59,919 |
| Total | $48,429 | $34,678 |
Family Income in Madison County
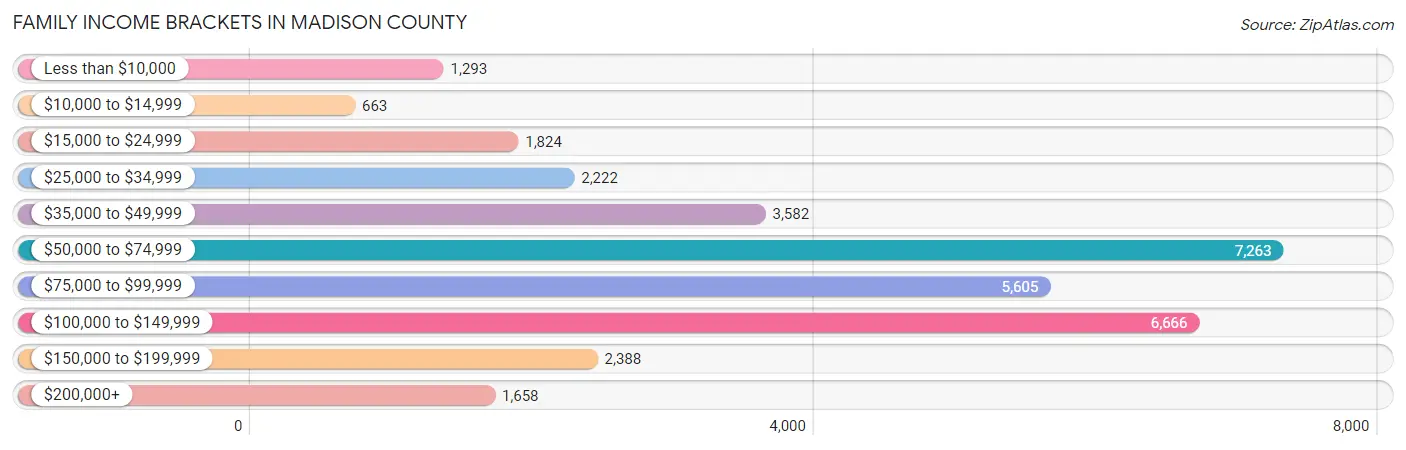
Family Income Brackets in Madison County
According to the Madison County family income data, there are 7,263 families falling into the $50,000 to $74,999 income range, which is the most common income bracket and makes up 21.9% of all families. Conversely, the $10,000 to $14,999 income bracket is the least frequent group with only 663 families (2.0%) belonging to this category.
| Income Bracket | # Families | % Families |
| Less than $10,000 | 1,293 | 3.9% |
| $10,000 to $14,999 | 663 | 2.0% |
| $15,000 to $24,999 | 1,824 | 5.5% |
| $25,000 to $34,999 | 2,222 | 6.7% |
| $35,000 to $49,999 | 3,582 | 10.8% |
| $50,000 to $74,999 | 7,263 | 21.9% |
| $75,000 to $99,999 | 5,605 | 16.9% |
| $100,000 to $149,999 | 6,666 | 20.1% |
| $150,000 to $199,999 | 2,388 | 7.2% |
| $200,000+ | 1,658 | 5.0% |
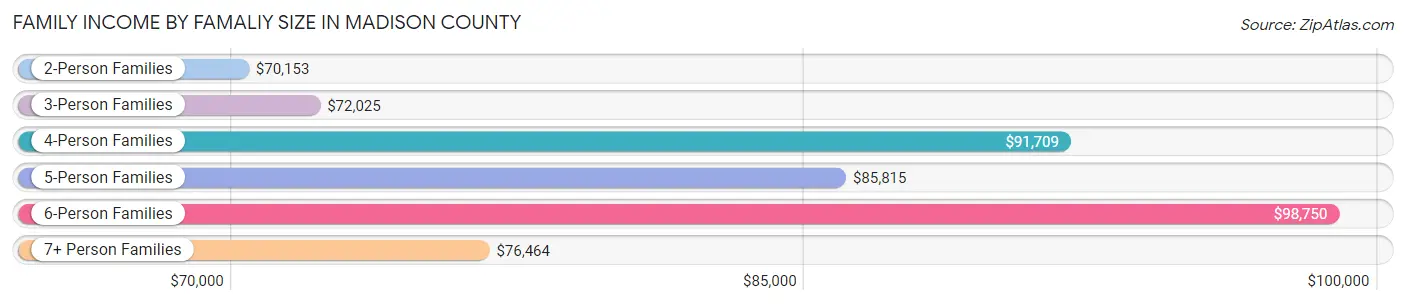
Family Income by Famaliy Size in Madison County
6-person families (822 | 2.5%) account for the highest median family income in Madison County with $98,750 per family, while 2-person families (17,085 | 51.5%) have the highest median income of $35,076 per family member.
| Income Bracket | # Families | Median Income |
| 2-Person Families | 17,085 (51.5%) | $70,153 |
| 3-Person Families | 7,739 (23.3%) | $72,025 |
| 4-Person Families | 5,179 (15.6%) | $91,709 |
| 5-Person Families | 1,824 (5.5%) | $85,815 |
| 6-Person Families | 822 (2.5%) | $98,750 |
| 7+ Person Families | 515 (1.5%) | $76,464 |
| Total | 33,164 (100.0%) | $73,998 |
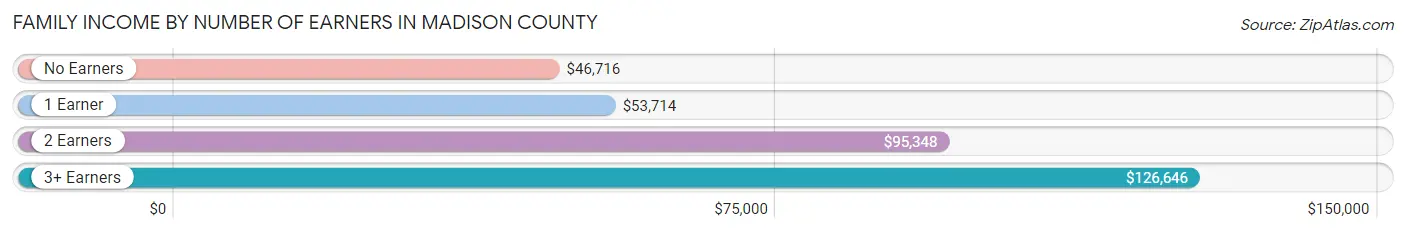
Family Income by Number of Earners in Madison County
The median family income in Madison County is $73,998, with families comprising 3+ earners (3,200) having the highest median family income of $126,646, while families with no earners (5,867) have the lowest median family income of $46,716, accounting for 9.7% and 17.7% of families, respectively.
| Number of Earners | # Families | Median Income |
| No Earners | 5,867 (17.7%) | $46,716 |
| 1 Earner | 10,928 (33.0%) | $53,714 |
| 2 Earners | 13,169 (39.7%) | $95,348 |
| 3+ Earners | 3,200 (9.7%) | $126,646 |
| Total | 33,164 (100.0%) | $73,998 |
Household Income in Madison County
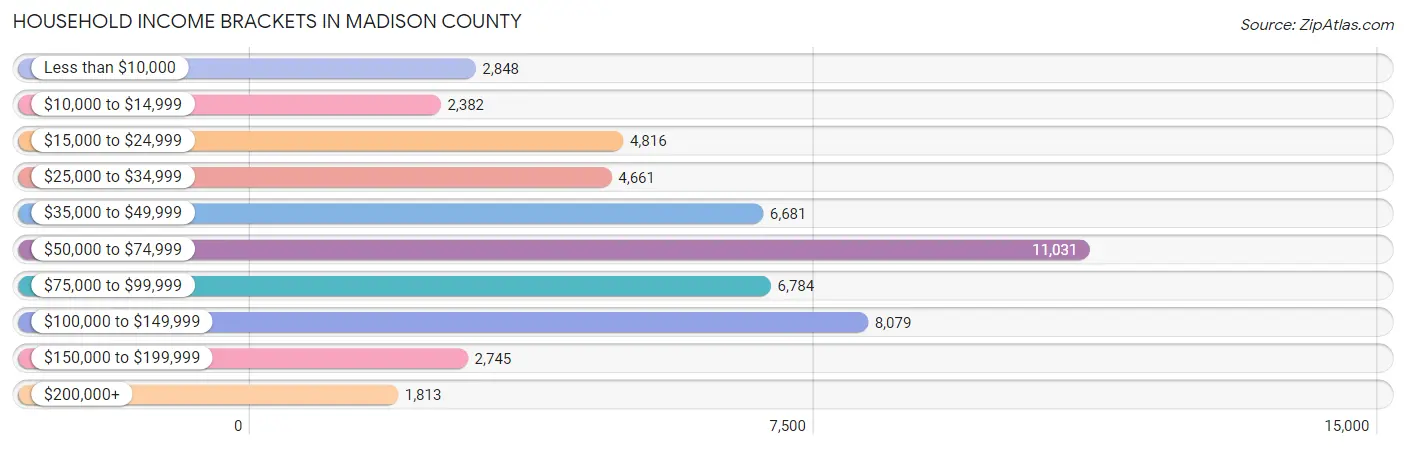
Household Income Brackets in Madison County
With 11,031 households falling in the category, the $50,000 to $74,999 income range is the most frequent in Madison County, accounting for 21.3% of all households. In contrast, only 1,813 households (3.5%) fall into the $200,000+ income bracket, making it the least populous group.
| Income Bracket | # Households | % Households |
| Less than $10,000 | 2,848 | 5.5% |
| $10,000 to $14,999 | 2,382 | 4.6% |
| $15,000 to $24,999 | 4,816 | 9.3% |
| $25,000 to $34,999 | 4,661 | 9.0% |
| $35,000 to $49,999 | 6,681 | 12.9% |
| $50,000 to $74,999 | 11,031 | 21.3% |
| $75,000 to $99,999 | 6,784 | 13.1% |
| $100,000 to $149,999 | 8,079 | 15.6% |
| $150,000 to $199,999 | 2,745 | 5.3% |
| $200,000+ | 1,813 | 3.5% |
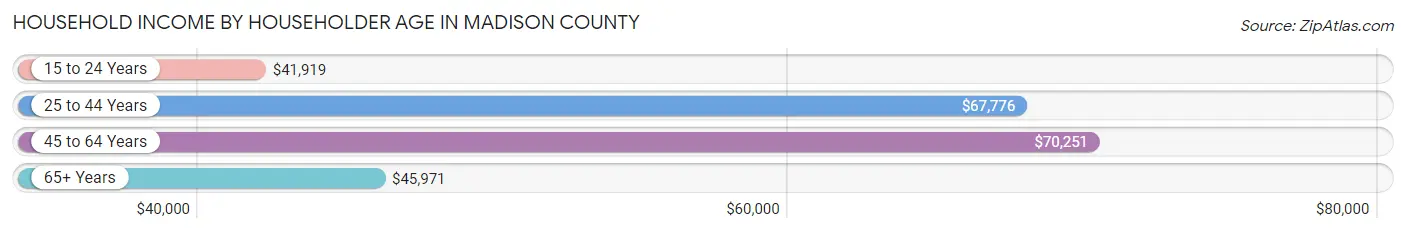
Household Income by Householder Age in Madison County
The median household income in Madison County is $60,060, with the highest median household income of $70,251 found in the 45 to 64 years age bracket for the primary householder. A total of 18,761 households (36.2%) fall into this category. Meanwhile, the 15 to 24 years age bracket for the primary householder has the lowest median household income of $41,919, with 2,132 households (4.1%) in this group.
| Income Bracket | # Households | Median Income |
| 15 to 24 Years | 2,132 (4.1%) | $41,919 |
| 25 to 44 Years | 15,012 (29.0%) | $67,776 |
| 45 to 64 Years | 18,761 (36.2%) | $70,251 |
| 65+ Years | 15,883 (30.7%) | $45,971 |
| Total | 51,788 (100.0%) | $60,060 |
Poverty in Madison County
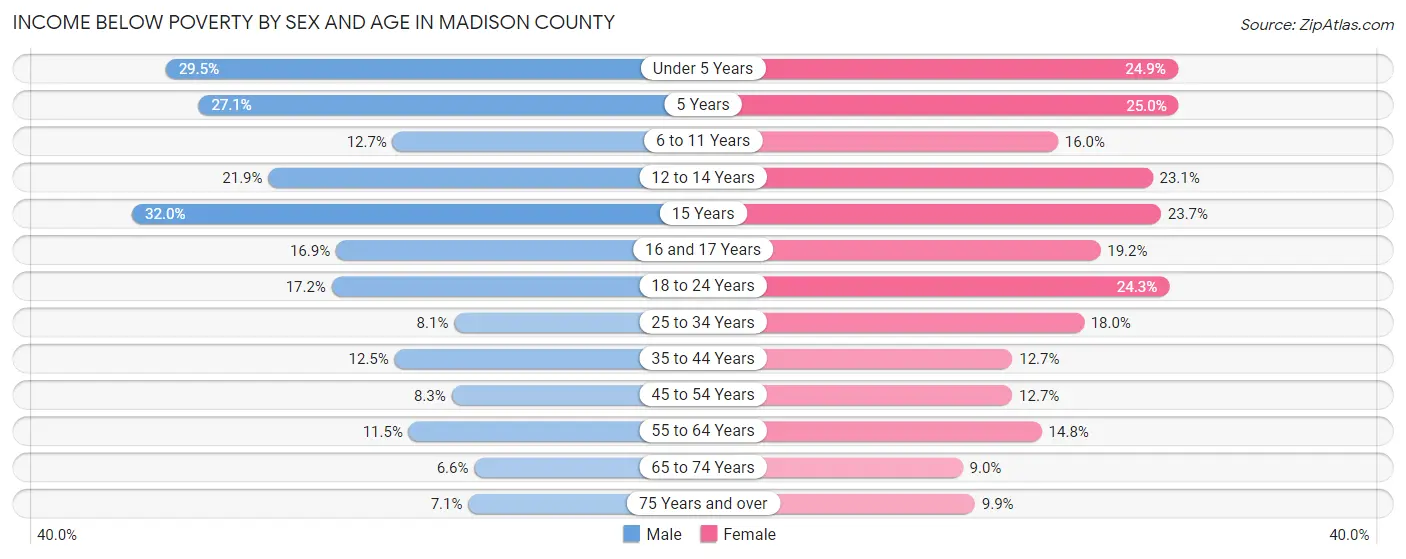
Income Below Poverty by Sex and Age in Madison County
With 12.7% poverty level for males and 15.5% for females among the residents of Madison County, 15 year old males and 5 year old females are the most vulnerable to poverty, with 291 males (32.0%) and 192 females (25.0%) in their respective age groups living below the poverty level.
| Age Bracket | Male | Female |
| Under 5 Years | 1,041 (29.5%) | 828 (24.9%) |
| 5 Years | 275 (27.1%) | 192 (25.0%) |
| 6 to 11 Years | 564 (12.7%) | 643 (16.0%) |
| 12 to 14 Years | 520 (21.9%) | 539 (23.1%) |
| 15 Years | 291 (32.0%) | 149 (23.7%) |
| 16 and 17 Years | 284 (16.9%) | 346 (19.2%) |
| 18 to 24 Years | 912 (17.2%) | 1,187 (24.3%) |
| 25 to 34 Years | 611 (8.1%) | 1,408 (18.0%) |
| 35 to 44 Years | 956 (12.5%) | 958 (12.7%) |
| 45 to 54 Years | 679 (8.3%) | 1,033 (12.7%) |
| 55 to 64 Years | 967 (11.5%) | 1,301 (14.8%) |
| 65 to 74 Years | 422 (6.6%) | 663 (9.0%) |
| 75 Years and over | 285 (7.1%) | 546 (9.9%) |
| Total | 7,807 (12.7%) | 9,793 (15.5%) |
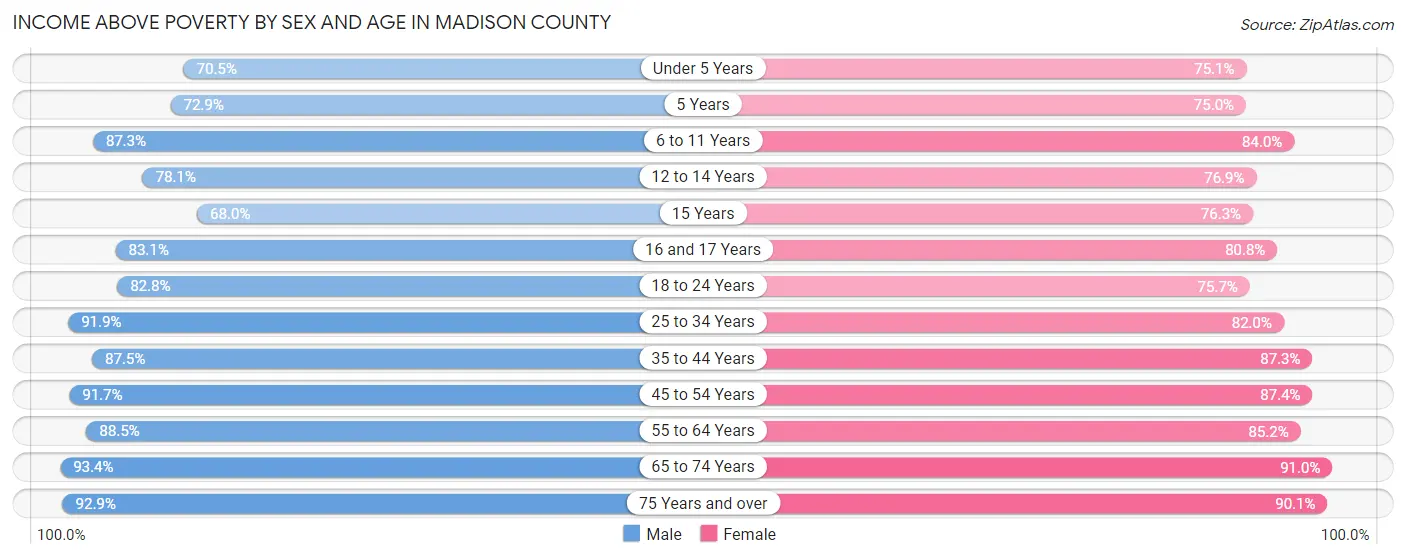
Income Above Poverty by Sex and Age in Madison County
According to the poverty statistics in Madison County, males aged 65 to 74 years and females aged 65 to 74 years are the age groups that are most secure financially, with 93.4% of males and 91.0% of females in these age groups living above the poverty line.
| Age Bracket | Male | Female |
| Under 5 Years | 2,486 (70.5%) | 2,493 (75.1%) |
| 5 Years | 740 (72.9%) | 576 (75.0%) |
| 6 to 11 Years | 3,886 (87.3%) | 3,365 (84.0%) |
| 12 to 14 Years | 1,854 (78.1%) | 1,797 (76.9%) |
| 15 Years | 618 (68.0%) | 480 (76.3%) |
| 16 and 17 Years | 1,398 (83.1%) | 1,457 (80.8%) |
| 18 to 24 Years | 4,389 (82.8%) | 3,697 (75.7%) |
| 25 to 34 Years | 6,928 (91.9%) | 6,430 (82.0%) |
| 35 to 44 Years | 6,676 (87.5%) | 6,608 (87.3%) |
| 45 to 54 Years | 7,502 (91.7%) | 7,132 (87.4%) |
| 55 to 64 Years | 7,456 (88.5%) | 7,468 (85.2%) |
| 65 to 74 Years | 5,961 (93.4%) | 6,727 (91.0%) |
| 75 Years and over | 3,754 (92.9%) | 4,980 (90.1%) |
| Total | 53,648 (87.3%) | 53,210 (84.5%) |
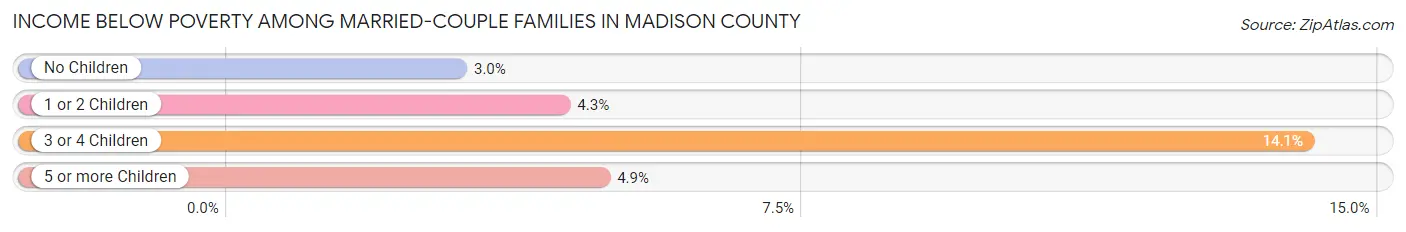
Income Below Poverty Among Married-Couple Families in Madison County
The poverty statistics for married-couple families in Madison County show that 4.2% or 978 of the total 23,292 families live below the poverty line. Families with 3 or 4 children have the highest poverty rate of 14.1%, comprising of 244 families. On the other hand, families with no children have the lowest poverty rate of 3.0%, which includes 446 families.
| Children | Above Poverty | Below Poverty |
| No Children | 14,490 (97.0%) | 446 (3.0%) |
| 1 or 2 Children | 6,156 (95.7%) | 279 (4.3%) |
| 3 or 4 Children | 1,492 (85.9%) | 244 (14.1%) |
| 5 or more Children | 176 (95.1%) | 9 (4.9%) |
| Total | 22,314 (95.8%) | 978 (4.2%) |
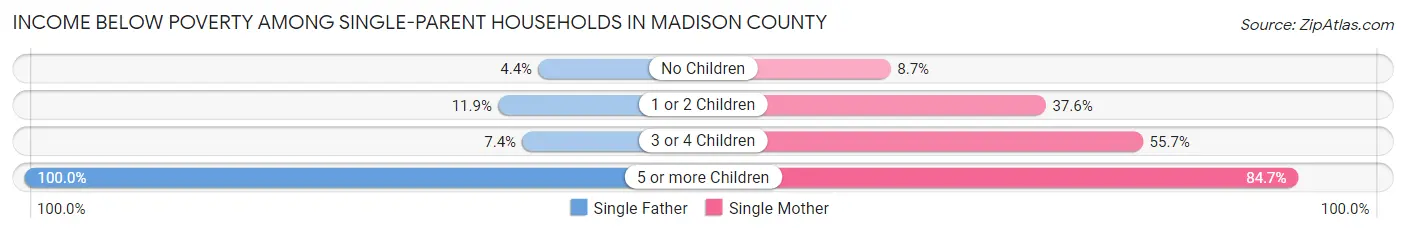
Income Below Poverty Among Single-Parent Households in Madison County
According to the poverty data in Madison County, 9.6% or 259 single-father households and 30.0% or 2,156 single-mother households are living below the poverty line. Among single-father households, those with 5 or more children have the highest poverty rate, with 41 households (100.0%) experiencing poverty. Likewise, among single-mother households, those with 5 or more children have the highest poverty rate, with 83 households (84.7%) falling below the poverty line.
| Children | Single Father | Single Mother |
| No Children | 52 (4.4%) | 218 (8.7%) |
| 1 or 2 Children | 152 (11.9%) | 1,434 (37.6%) |
| 3 or 4 Children | 14 (7.4%) | 421 (55.7%) |
| 5 or more Children | 41 (100.0%) | 83 (84.7%) |
| Total | 259 (9.6%) | 2,156 (30.0%) |
Income Below Poverty Among Married-Couple vs Single-Parent Households in Madison County
The poverty data for Madison County shows that 978 of the married-couple family households (4.2%) and 2,415 of the single-parent households (24.5%) are living below the poverty level. Within the married-couple family households, those with 3 or 4 children have the highest poverty rate, with 244 households (14.1%) falling below the poverty line. Among the single-parent households, those with 5 or more children have the highest poverty rate, with 124 household (89.2%) living below poverty.

| Children | Married-Couple Families | Single-Parent Households |
| No Children | 446 (3.0%) | 270 (7.3%) |
| 1 or 2 Children | 279 (4.3%) | 1,586 (31.1%) |
| 3 or 4 Children | 244 (14.1%) | 435 (46.0%) |
| 5 or more Children | 9 (4.9%) | 124 (89.2%) |
| Total | 978 (4.2%) | 2,415 (24.5%) |
Employment Characteristics in Madison County
Employment by Class of Employer in Madison County
Among the 58,438 employed individuals in Madison County, private company employees (42,753 | 73.2%), not-for-profit organizations (4,813 | 8.2%), and local government employees (3,593 | 6.1%) make up the most common classes of employment.
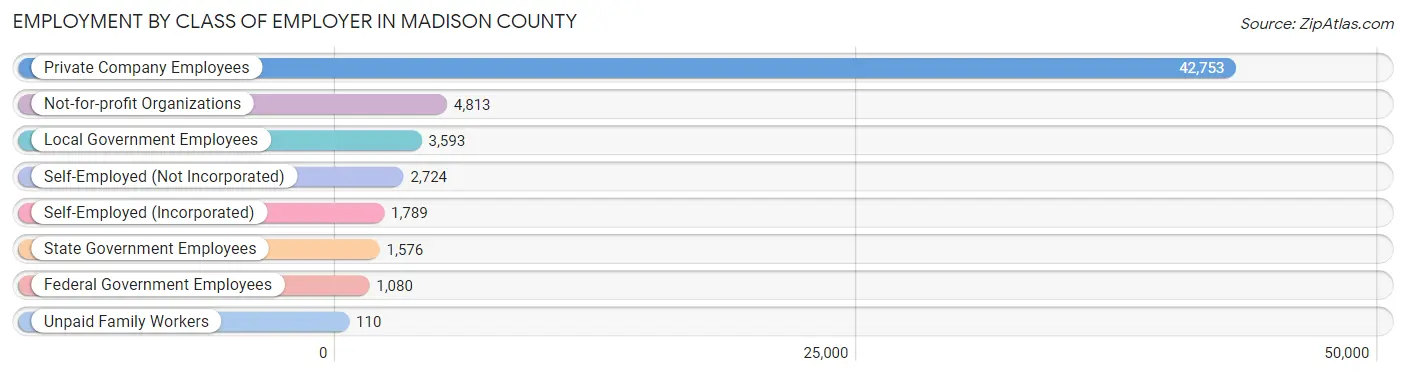
| Employer Class | # Employees | % Employees |
| Private Company Employees | 42,753 | 73.2% |
| Self-Employed (Incorporated) | 1,789 | 3.1% |
| Self-Employed (Not Incorporated) | 2,724 | 4.7% |
| Not-for-profit Organizations | 4,813 | 8.2% |
| Local Government Employees | 3,593 | 6.1% |
| State Government Employees | 1,576 | 2.7% |
| Federal Government Employees | 1,080 | 1.8% |
| Unpaid Family Workers | 110 | 0.2% |
| Total | 58,438 | 100.0% |
Employment Status by Age in Madison County
According to the labor force statistics for Madison County, out of the total population over 16 years of age (106,027), 59.4% or 62,980 individuals are in the labor force, with 5.5% or 3,464 of them unemployed. The age group with the highest labor force participation rate is 25 to 29 years, with 82.9% or 6,686 individuals in the labor force. Within the labor force, the 16 to 19 years age range has the highest percentage of unemployed individuals, with 16.4% or 494 of them being unemployed.
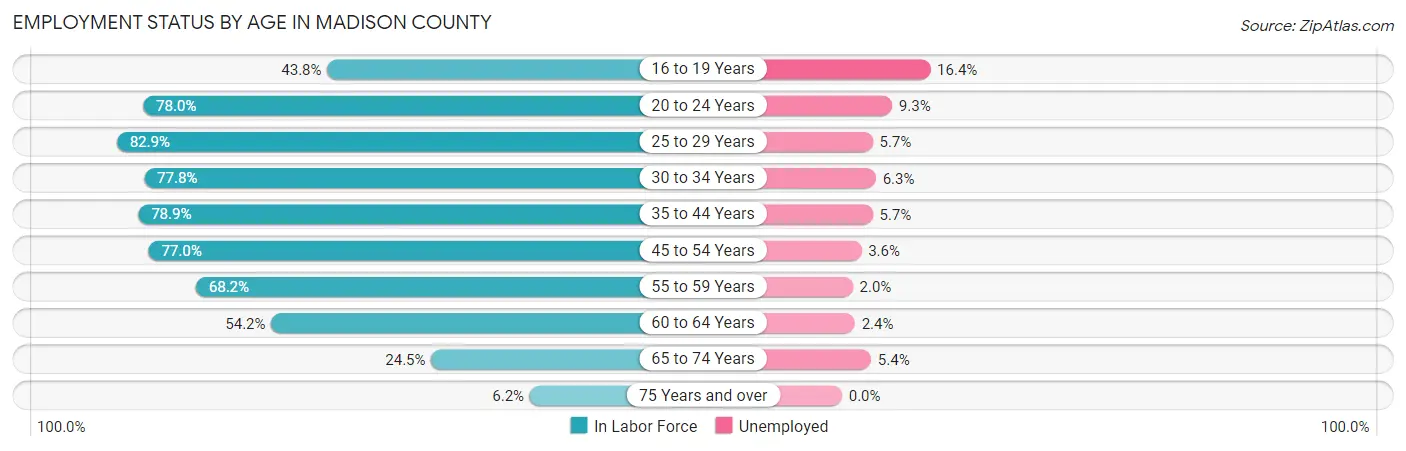
| Age Bracket | In Labor Force | Unemployed |
| 16 to 19 Years | 3,015 (43.8%) | 494 (16.4%) |
| 20 to 24 Years | 6,168 (78.0%) | 574 (9.3%) |
| 25 to 29 Years | 6,686 (82.9%) | 381 (5.7%) |
| 30 to 34 Years | 6,522 (77.8%) | 411 (6.3%) |
| 35 to 44 Years | 12,790 (78.9%) | 729 (5.7%) |
| 45 to 54 Years | 13,070 (77.0%) | 471 (3.6%) |
| 55 to 59 Years | 5,968 (68.2%) | 119 (2.0%) |
| 60 to 64 Years | 4,752 (54.2%) | 114 (2.4%) |
| 65 to 74 Years | 3,442 (24.5%) | 186 (5.4%) |
| 75 Years and over | 622 (6.2%) | 0 (0.0%) |
| Total | 62,980 (59.4%) | 3,464 (5.5%) |
Employment Status by Educational Attainment in Madison County
According to labor force statistics for Madison County, 74.2% of individuals (49,825) out of the total population between 25 and 64 years of age (67,149) are in the labor force, with 4.5% or 2,242 of them being unemployed. The group with the highest labor force participation rate are those with the educational attainment of bachelor's degree or higher, with 87.1% or 11,487 individuals in the labor force. Within the labor force, individuals with less than high school education have the highest percentage of unemployment, with 11.4% or 381 of them being unemployed.
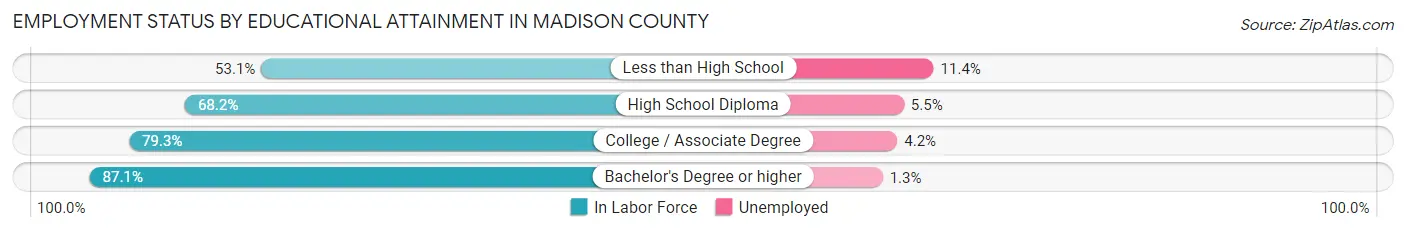
| Educational Attainment | In Labor Force | Unemployed |
| Less than High School | 3,340 (53.1%) | 717 (11.4%) |
| High School Diploma | 17,500 (68.2%) | 1,411 (5.5%) |
| College / Associate Degree | 17,455 (79.3%) | 924 (4.2%) |
| Bachelor's Degree or higher | 11,487 (87.1%) | 171 (1.3%) |
| Total | 49,825 (74.2%) | 3,022 (4.5%) |
Employment Occupations by Sex in Madison County
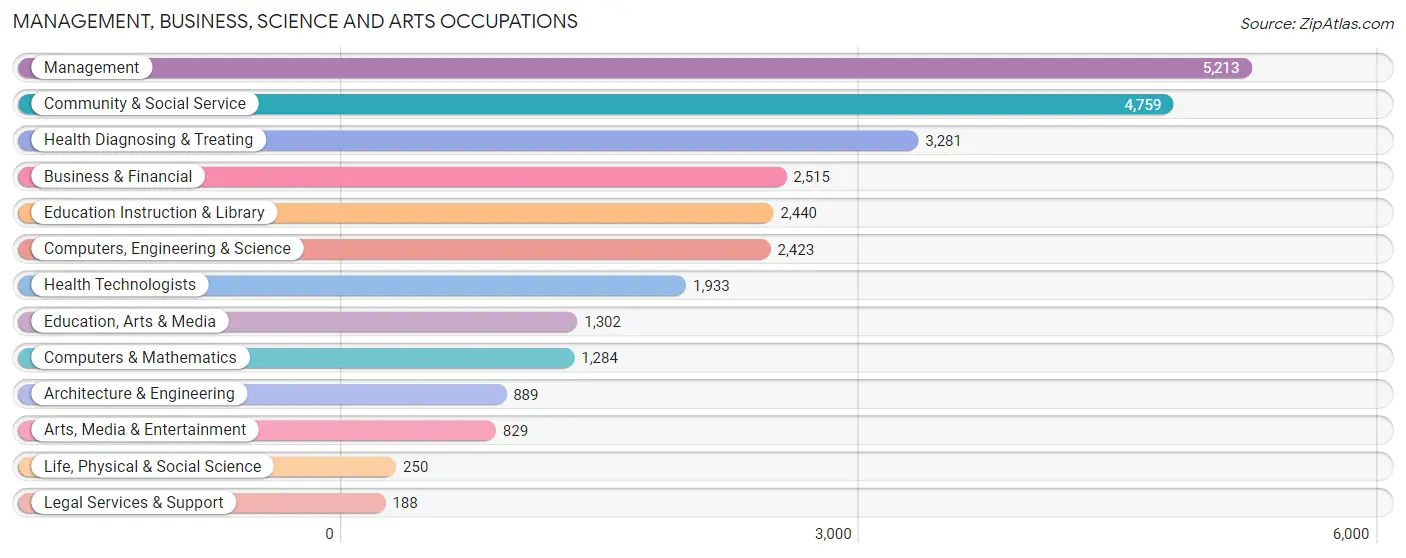
Management, Business, Science and Arts Occupations
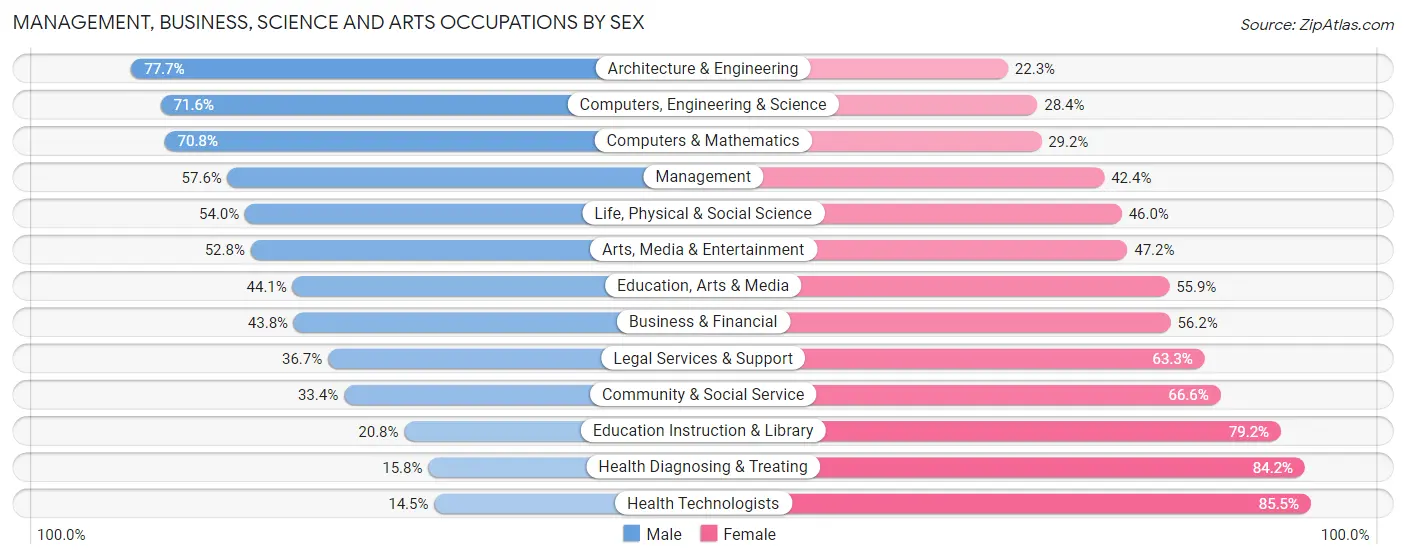
The most common Management, Business, Science and Arts occupations in Madison County are Management (5,213 | 8.8%), Community & Social Service (4,759 | 8.0%), Health Diagnosing & Treating (3,281 | 5.5%), Business & Financial (2,515 | 4.2%), and Education Instruction & Library (2,440 | 4.1%).
Management, Business, Science and Arts Occupations by Sex
Within the Management, Business, Science and Arts occupations in Madison County, the most male-oriented occupations are Architecture & Engineering (77.7%), Computers, Engineering & Science (71.6%), and Computers & Mathematics (70.8%), while the most female-oriented occupations are Health Technologists (85.5%), Health Diagnosing & Treating (84.2%), and Education Instruction & Library (79.2%).
| Occupation | Male | Female |
| Management | 3,005 (57.6%) | 2,208 (42.4%) |
| Business & Financial | 1,102 (43.8%) | 1,413 (56.2%) |
| Computers, Engineering & Science | 1,735 (71.6%) | 688 (28.4%) |
| Computers & Mathematics | 909 (70.8%) | 375 (29.2%) |
| Architecture & Engineering | 691 (77.7%) | 198 (22.3%) |
| Life, Physical & Social Science | 135 (54.0%) | 115 (46.0%) |
| Community & Social Service | 1,588 (33.4%) | 3,171 (66.6%) |
| Education, Arts & Media | 574 (44.1%) | 728 (55.9%) |
| Legal Services & Support | 69 (36.7%) | 119 (63.3%) |
| Education Instruction & Library | 507 (20.8%) | 1,933 (79.2%) |
| Arts, Media & Entertainment | 438 (52.8%) | 391 (47.2%) |
| Health Diagnosing & Treating | 518 (15.8%) | 2,763 (84.2%) |
| Health Technologists | 281 (14.5%) | 1,652 (85.5%) |
| Total (Category) | 7,948 (43.7%) | 10,243 (56.3%) |
| Total (Overall) | 30,796 (51.8%) | 28,666 (48.2%) |
Services Occupations
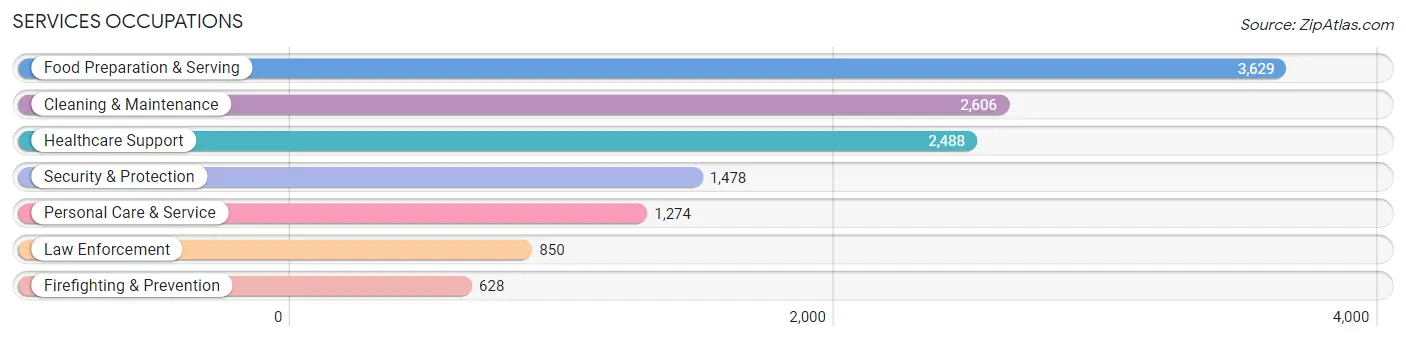
The most common Services occupations in Madison County are Food Preparation & Serving (3,629 | 6.1%), Cleaning & Maintenance (2,606 | 4.4%), Healthcare Support (2,488 | 4.2%), Security & Protection (1,478 | 2.5%), and Personal Care & Service (1,274 | 2.1%).
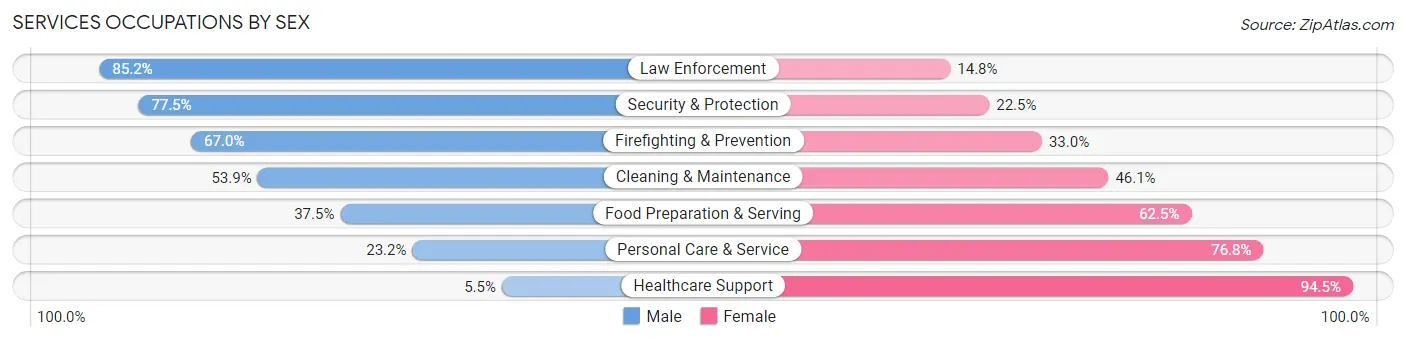
Services Occupations by Sex
Within the Services occupations in Madison County, the most male-oriented occupations are Law Enforcement (85.2%), Security & Protection (77.5%), and Firefighting & Prevention (67.0%), while the most female-oriented occupations are Healthcare Support (94.5%), Personal Care & Service (76.8%), and Food Preparation & Serving (62.5%).
| Occupation | Male | Female |
| Healthcare Support | 137 (5.5%) | 2,351 (94.5%) |
| Security & Protection | 1,145 (77.5%) | 333 (22.5%) |
| Firefighting & Prevention | 421 (67.0%) | 207 (33.0%) |
| Law Enforcement | 724 (85.2%) | 126 (14.8%) |
| Food Preparation & Serving | 1,361 (37.5%) | 2,268 (62.5%) |
| Cleaning & Maintenance | 1,404 (53.9%) | 1,202 (46.1%) |
| Personal Care & Service | 296 (23.2%) | 978 (76.8%) |
| Total (Category) | 4,343 (37.9%) | 7,132 (62.2%) |
| Total (Overall) | 30,796 (51.8%) | 28,666 (48.2%) |
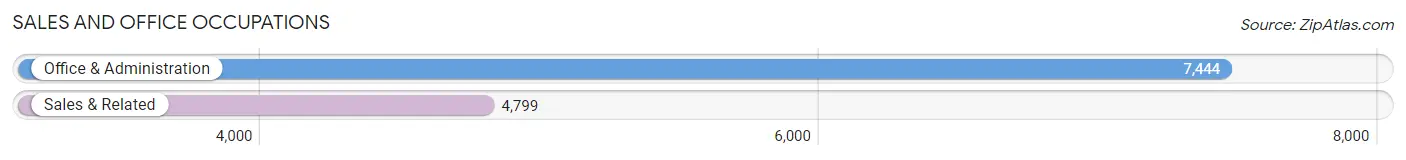
Sales and Office Occupations
The most common Sales and Office occupations in Madison County are Office & Administration (7,444 | 12.5%), and Sales & Related (4,799 | 8.1%).
Sales and Office Occupations by Sex
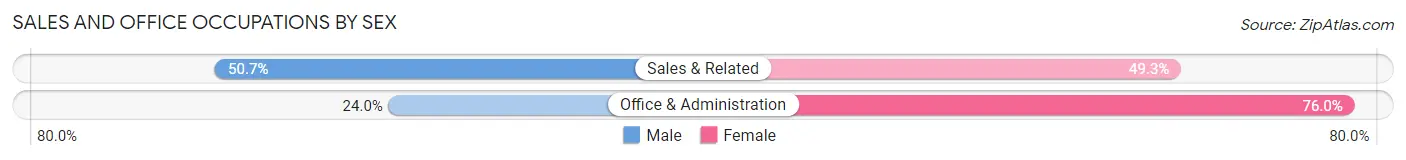
| Occupation | Male | Female |
| Sales & Related | 2,432 (50.7%) | 2,367 (49.3%) |
| Office & Administration | 1,786 (24.0%) | 5,658 (76.0%) |
| Total (Category) | 4,218 (34.4%) | 8,025 (65.5%) |
| Total (Overall) | 30,796 (51.8%) | 28,666 (48.2%) |
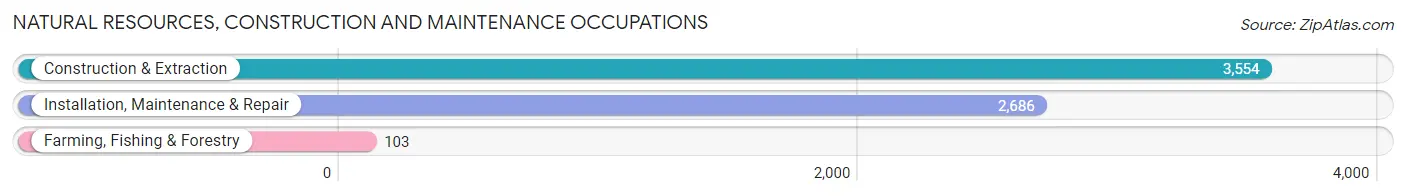
Natural Resources, Construction and Maintenance Occupations
The most common Natural Resources, Construction and Maintenance occupations in Madison County are Construction & Extraction (3,554 | 6.0%), Installation, Maintenance & Repair (2,686 | 4.5%), and Farming, Fishing & Forestry (103 | 0.2%).
Natural Resources, Construction and Maintenance Occupations by Sex
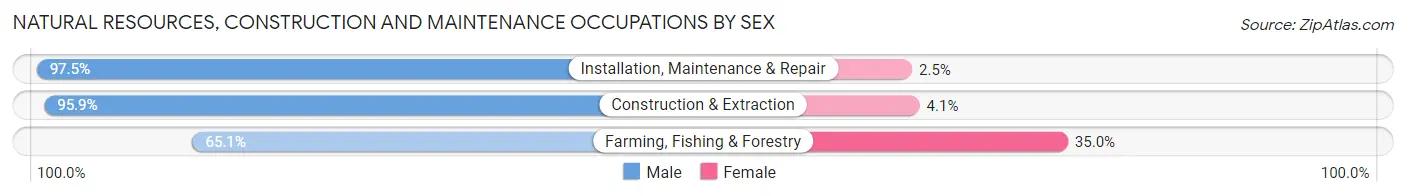
| Occupation | Male | Female |
| Farming, Fishing & Forestry | 67 (65.0%) | 36 (34.9%) |
| Construction & Extraction | 3,408 (95.9%) | 146 (4.1%) |
| Installation, Maintenance & Repair | 2,618 (97.5%) | 68 (2.5%) |
| Total (Category) | 6,093 (96.1%) | 250 (3.9%) |
| Total (Overall) | 30,796 (51.8%) | 28,666 (48.2%) |
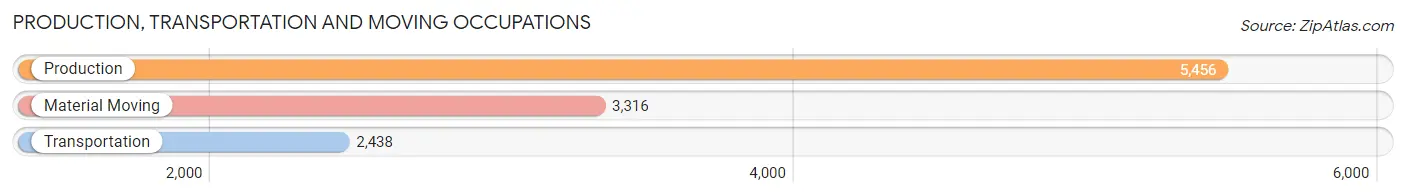
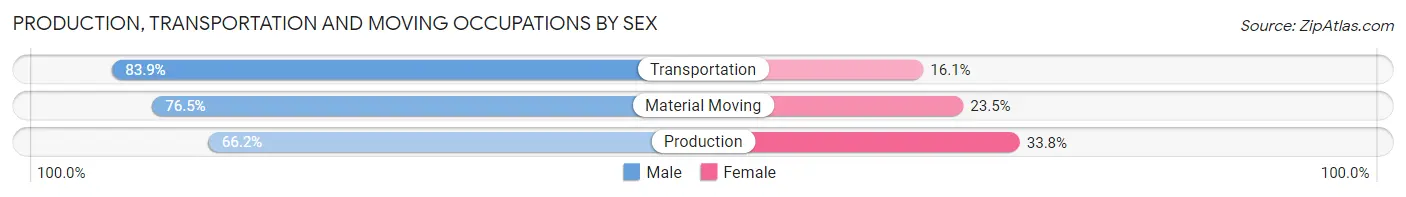
Production, Transportation and Moving Occupations
The most common Production, Transportation and Moving occupations in Madison County are Production (5,456 | 9.2%), Material Moving (3,316 | 5.6%), and Transportation (2,438 | 4.1%).
Production, Transportation and Moving Occupations by Sex
| Occupation | Male | Female |
| Production | 3,611 (66.2%) | 1,845 (33.8%) |
| Transportation | 2,045 (83.9%) | 393 (16.1%) |
| Material Moving | 2,538 (76.5%) | 778 (23.5%) |
| Total (Category) | 8,194 (73.1%) | 3,016 (26.9%) |
| Total (Overall) | 30,796 (51.8%) | 28,666 (48.2%) |
Employment Industries by Sex in Madison County
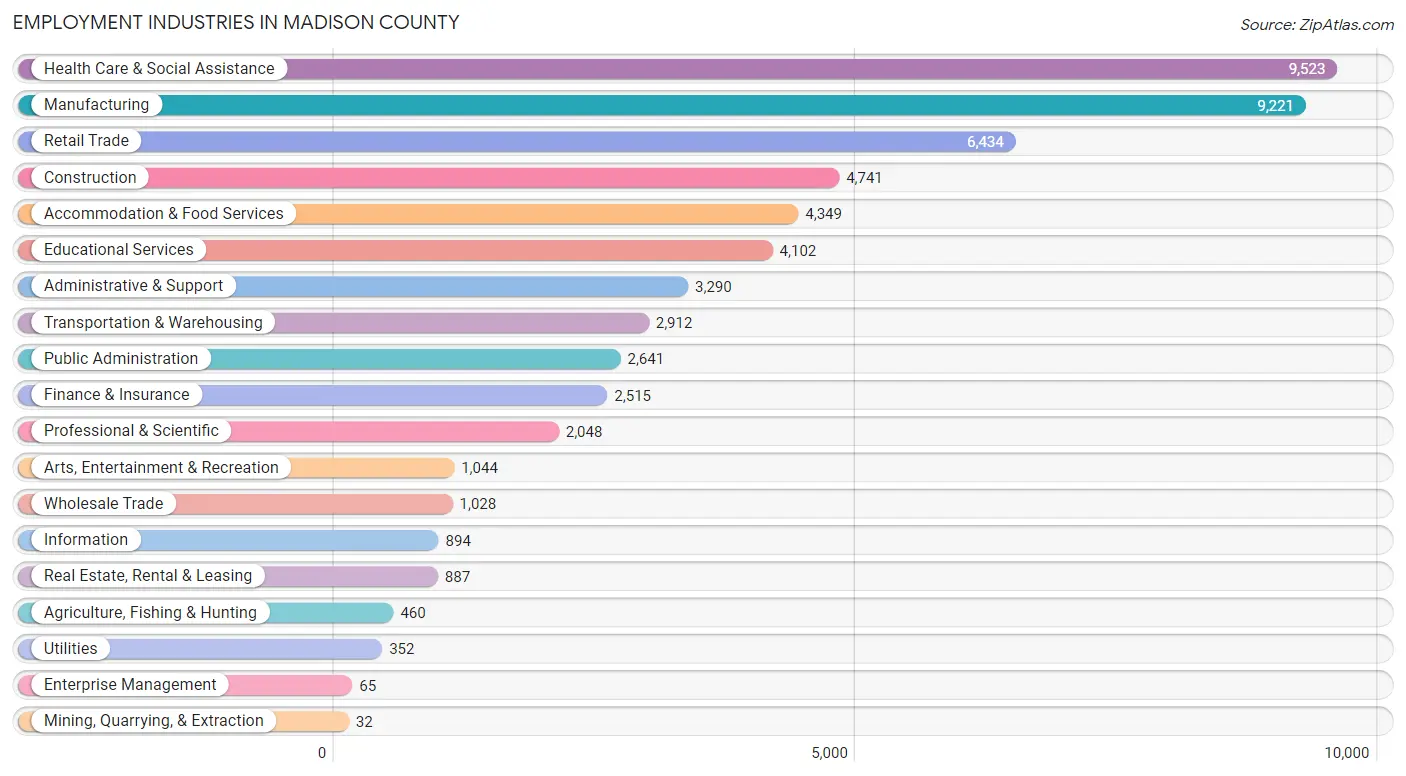
Employment Industries in Madison County
The major employment industries in Madison County include Health Care & Social Assistance (9,523 | 16.0%), Manufacturing (9,221 | 15.5%), Retail Trade (6,434 | 10.8%), Construction (4,741 | 8.0%), and Accommodation & Food Services (4,349 | 7.3%).
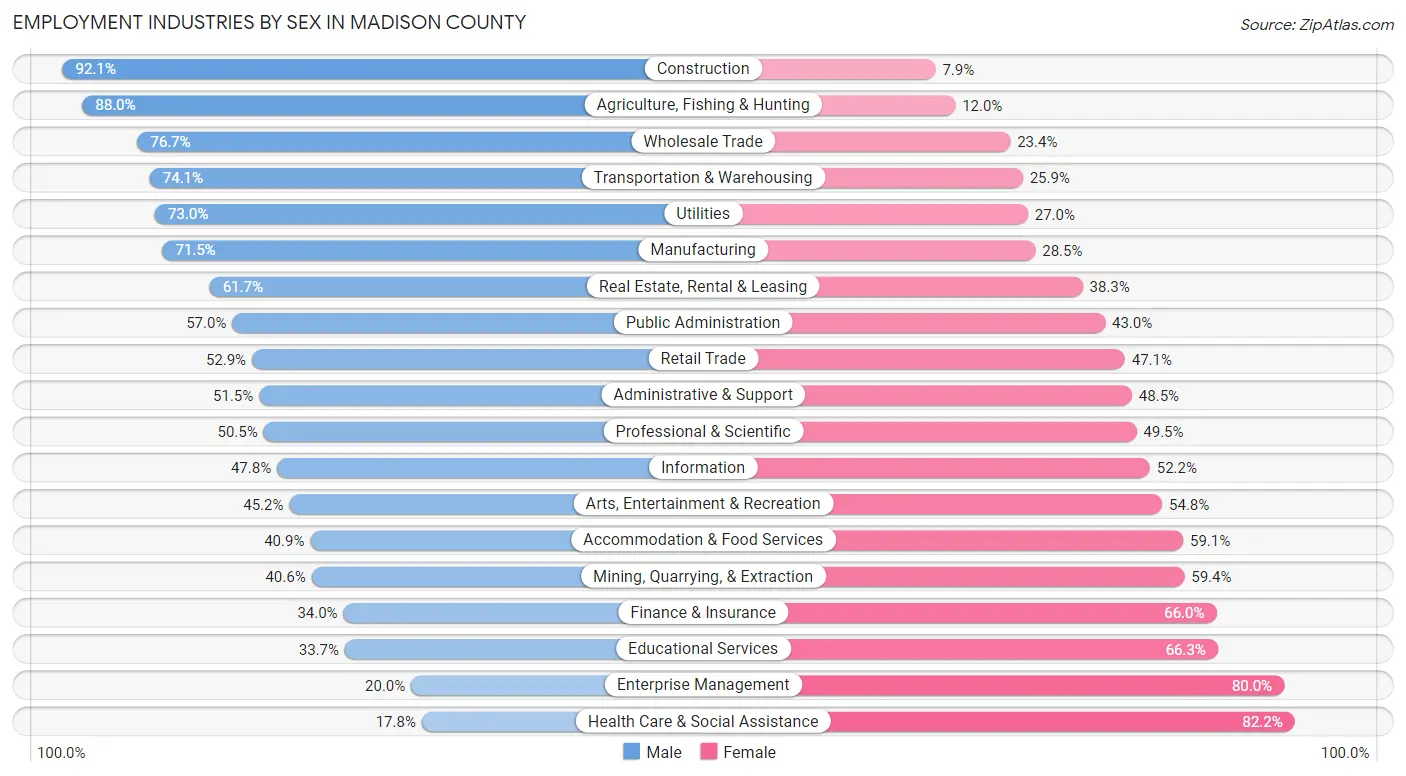
Employment Industries by Sex in Madison County
The Madison County industries that see more men than women are Construction (92.1%), Agriculture, Fishing & Hunting (88.0%), and Wholesale Trade (76.6%), whereas the industries that tend to have a higher number of women are Health Care & Social Assistance (82.2%), Enterprise Management (80.0%), and Educational Services (66.3%).
| Industry | Male | Female |
| Agriculture, Fishing & Hunting | 405 (88.0%) | 55 (12.0%) |
| Mining, Quarrying, & Extraction | 13 (40.6%) | 19 (59.4%) |
| Construction | 4,368 (92.1%) | 373 (7.9%) |
| Manufacturing | 6,589 (71.5%) | 2,632 (28.5%) |
| Wholesale Trade | 788 (76.6%) | 240 (23.4%) |
| Retail Trade | 3,406 (52.9%) | 3,028 (47.1%) |
| Transportation & Warehousing | 2,157 (74.1%) | 755 (25.9%) |
| Utilities | 257 (73.0%) | 95 (27.0%) |
| Information | 427 (47.8%) | 467 (52.2%) |
| Finance & Insurance | 855 (34.0%) | 1,660 (66.0%) |
| Real Estate, Rental & Leasing | 547 (61.7%) | 340 (38.3%) |
| Professional & Scientific | 1,035 (50.5%) | 1,013 (49.5%) |
| Enterprise Management | 13 (20.0%) | 52 (80.0%) |
| Administrative & Support | 1,693 (51.5%) | 1,597 (48.5%) |
| Educational Services | 1,383 (33.7%) | 2,719 (66.3%) |
| Health Care & Social Assistance | 1,695 (17.8%) | 7,828 (82.2%) |
| Arts, Entertainment & Recreation | 472 (45.2%) | 572 (54.8%) |
| Accommodation & Food Services | 1,778 (40.9%) | 2,571 (59.1%) |
| Public Administration | 1,506 (57.0%) | 1,135 (43.0%) |
| Total | 30,796 (51.8%) | 28,666 (48.2%) |
Education in Madison County
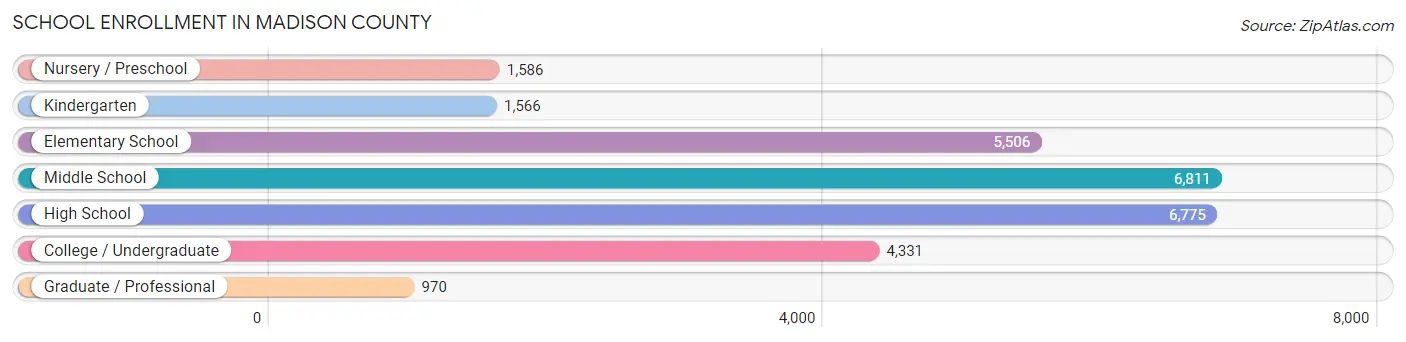
School Enrollment in Madison County
The most common levels of schooling among the 27,545 students in Madison County are middle school (6,811 | 24.7%), high school (6,775 | 24.6%), and elementary school (5,506 | 20.0%).
| School Level | # Students | % Students |
| Nursery / Preschool | 1,586 | 5.8% |
| Kindergarten | 1,566 | 5.7% |
| Elementary School | 5,506 | 20.0% |
| Middle School | 6,811 | 24.7% |
| High School | 6,775 | 24.6% |
| College / Undergraduate | 4,331 | 15.7% |
| Graduate / Professional | 970 | 3.5% |
| Total | 27,545 | 100.0% |
School Enrollment by Age by Funding Source in Madison County
Out of a total of 27,545 students who are enrolled in schools in Madison County, 4,325 (15.7%) attend a private institution, while the remaining 23,220 (84.3%) are enrolled in public schools. The age group of 3 to 4 year olds has the highest likelihood of being enrolled in private schools, with 324 (36.4% in the age bracket) enrolled. Conversely, the age group of 5 to 9 year old has the lowest likelihood of being enrolled in a private school, with 5,927 (89.9% in the age bracket) attending a public institution.
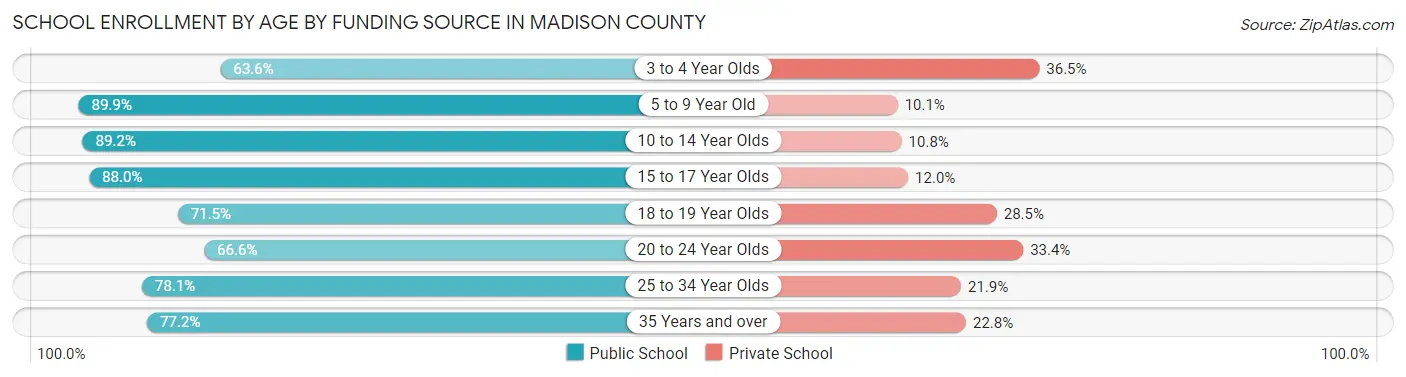
| Age Bracket | Public School | Private School |
| 3 to 4 Year Olds | 565 (63.5%) | 324 (36.4%) |
| 5 to 9 Year Old | 5,927 (89.9%) | 663 (10.1%) |
| 10 to 14 Year Olds | 7,457 (89.2%) | 903 (10.8%) |
| 15 to 17 Year Olds | 4,424 (88.0%) | 604 (12.0%) |
| 18 to 19 Year Olds | 1,516 (71.5%) | 605 (28.5%) |
| 20 to 24 Year Olds | 1,252 (66.6%) | 629 (33.4%) |
| 25 to 34 Year Olds | 1,008 (78.1%) | 282 (21.9%) |
| 35 Years and over | 1,070 (77.2%) | 316 (22.8%) |
| Total | 23,220 (84.3%) | 4,325 (15.7%) |
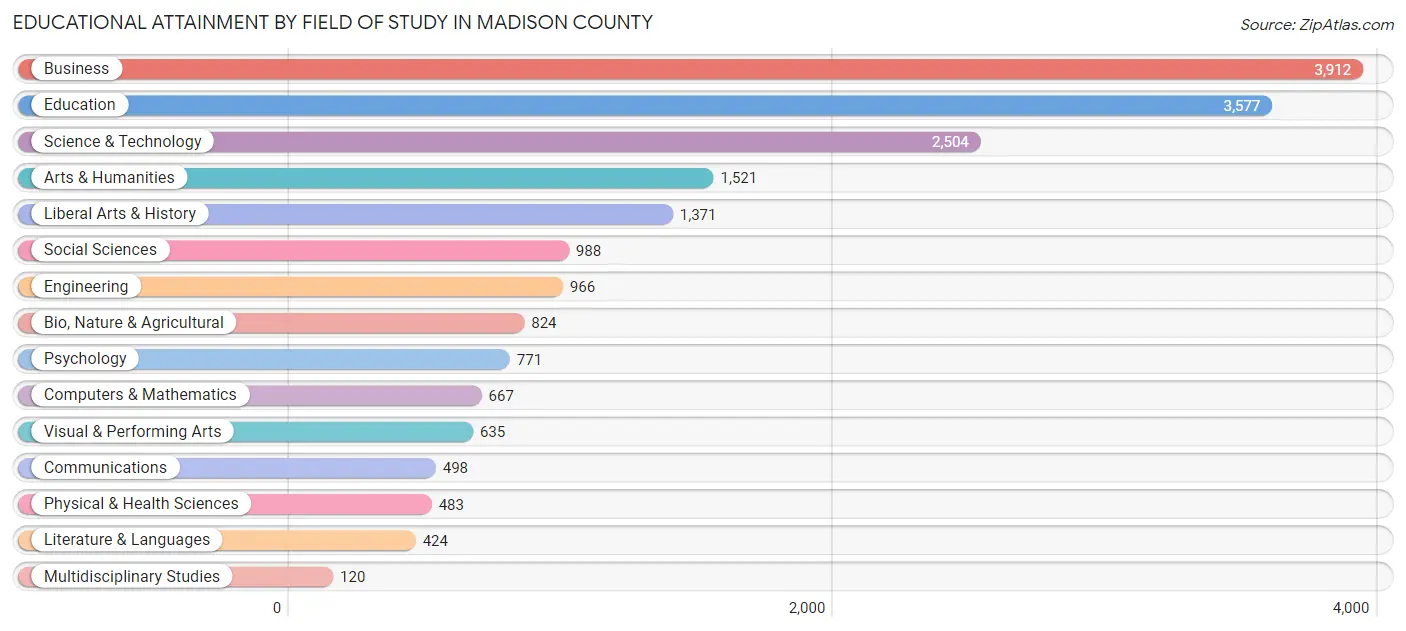
Educational Attainment by Field of Study in Madison County
Business (3,912 | 20.3%), education (3,577 | 18.6%), science & technology (2,504 | 13.0%), arts & humanities (1,521 | 7.9%), and liberal arts & history (1,371 | 7.1%) are the most common fields of study among 19,261 individuals in Madison County who have obtained a bachelor's degree or higher.
| Field of Study | # Graduates | % Graduates |
| Computers & Mathematics | 667 | 3.5% |
| Bio, Nature & Agricultural | 824 | 4.3% |
| Physical & Health Sciences | 483 | 2.5% |
| Psychology | 771 | 4.0% |
| Social Sciences | 988 | 5.1% |
| Engineering | 966 | 5.0% |
| Multidisciplinary Studies | 120 | 0.6% |
| Science & Technology | 2,504 | 13.0% |
| Business | 3,912 | 20.3% |
| Education | 3,577 | 18.6% |
| Literature & Languages | 424 | 2.2% |
| Liberal Arts & History | 1,371 | 7.1% |
| Visual & Performing Arts | 635 | 3.3% |
| Communications | 498 | 2.6% |
| Arts & Humanities | 1,521 | 7.9% |
| Total | 19,261 | 100.0% |
Transportation & Commute in Madison County
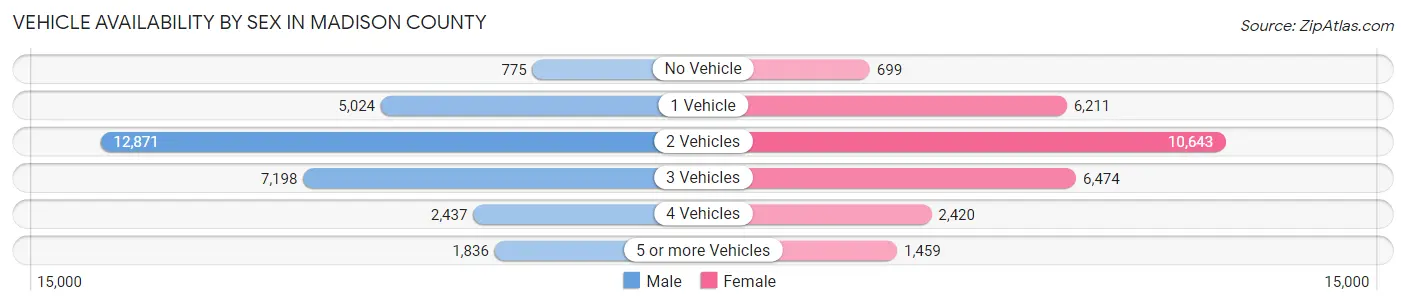
Vehicle Availability by Sex in Madison County
The most prevalent vehicle ownership categories in Madison County are males with 2 vehicles (12,871, accounting for 42.7%) and females with 2 vehicles (10,643, making up 46.1%).
| Vehicles Available | Male | Female |
| No Vehicle | 775 (2.6%) | 699 (2.5%) |
| 1 Vehicle | 5,024 (16.7%) | 6,211 (22.3%) |
| 2 Vehicles | 12,871 (42.7%) | 10,643 (38.1%) |
| 3 Vehicles | 7,198 (23.9%) | 6,474 (23.2%) |
| 4 Vehicles | 2,437 (8.1%) | 2,420 (8.7%) |
| 5 or more Vehicles | 1,836 (6.1%) | 1,459 (5.2%) |
| Total | 30,141 (100.0%) | 27,906 (100.0%) |
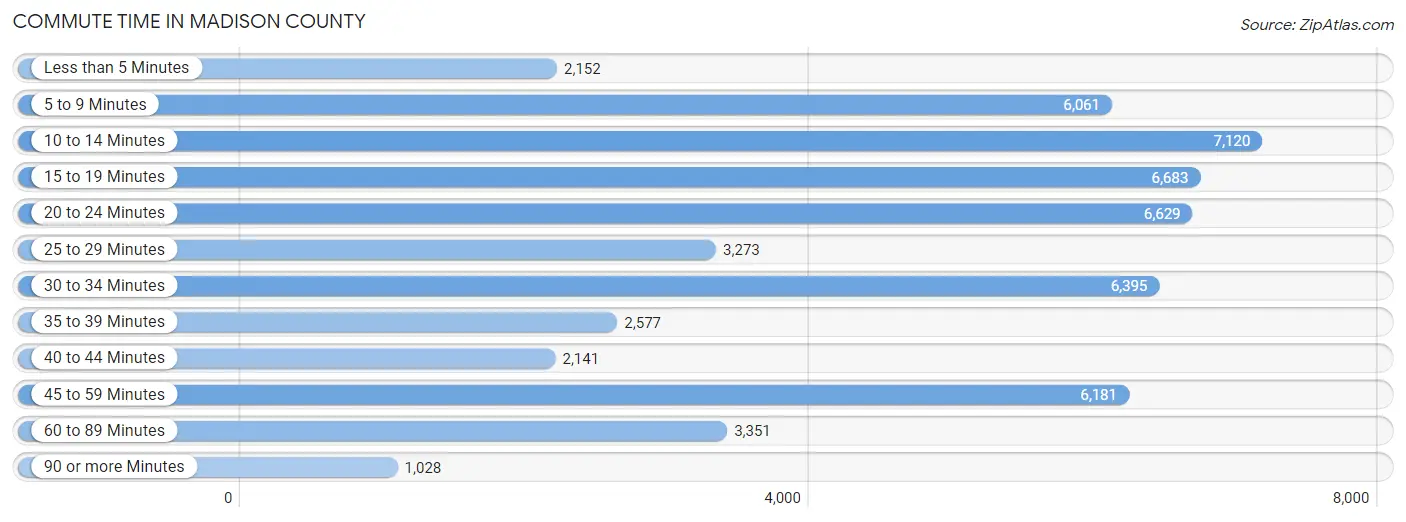
Commute Time in Madison County
The most frequently occuring commute durations in Madison County are 10 to 14 minutes (7,120 commuters, 13.3%), 15 to 19 minutes (6,683 commuters, 12.5%), and 20 to 24 minutes (6,629 commuters, 12.4%).
| Commute Time | # Commuters | % Commuters |
| Less than 5 Minutes | 2,152 | 4.0% |
| 5 to 9 Minutes | 6,061 | 11.3% |
| 10 to 14 Minutes | 7,120 | 13.3% |
| 15 to 19 Minutes | 6,683 | 12.5% |
| 20 to 24 Minutes | 6,629 | 12.4% |
| 25 to 29 Minutes | 3,273 | 6.1% |
| 30 to 34 Minutes | 6,395 | 11.9% |
| 35 to 39 Minutes | 2,577 | 4.8% |
| 40 to 44 Minutes | 2,141 | 4.0% |
| 45 to 59 Minutes | 6,181 | 11.5% |
| 60 to 89 Minutes | 3,351 | 6.2% |
| 90 or more Minutes | 1,028 | 1.9% |
Commute Time by Sex in Madison County
The most common commute times in Madison County are 30 to 34 minutes (3,730 commuters, 13.3%) for males and 10 to 14 minutes (3,586 commuters, 14.1%) for females.
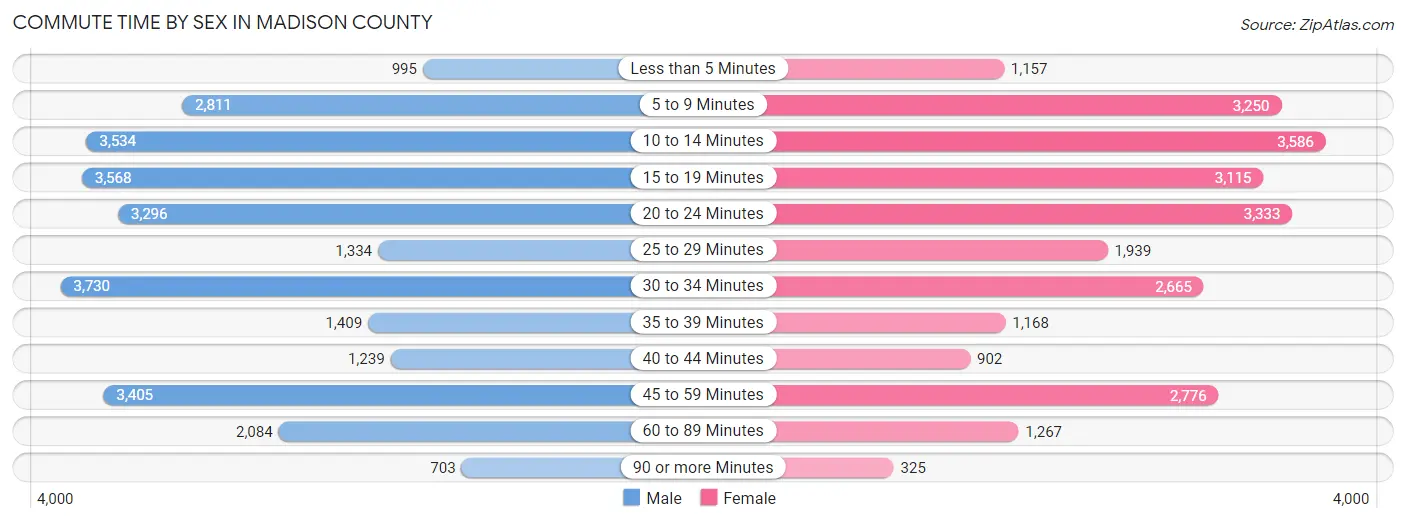
| Commute Time | Male | Female |
| Less than 5 Minutes | 995 (3.5%) | 1,157 (4.5%) |
| 5 to 9 Minutes | 2,811 (10.0%) | 3,250 (12.8%) |
| 10 to 14 Minutes | 3,534 (12.6%) | 3,586 (14.1%) |
| 15 to 19 Minutes | 3,568 (12.7%) | 3,115 (12.2%) |
| 20 to 24 Minutes | 3,296 (11.7%) | 3,333 (13.1%) |
| 25 to 29 Minutes | 1,334 (4.8%) | 1,939 (7.6%) |
| 30 to 34 Minutes | 3,730 (13.3%) | 2,665 (10.5%) |
| 35 to 39 Minutes | 1,409 (5.0%) | 1,168 (4.6%) |
| 40 to 44 Minutes | 1,239 (4.4%) | 902 (3.5%) |
| 45 to 59 Minutes | 3,405 (12.1%) | 2,776 (10.9%) |
| 60 to 89 Minutes | 2,084 (7.4%) | 1,267 (5.0%) |
| 90 or more Minutes | 703 (2.5%) | 325 (1.3%) |
Time of Departure to Work by Sex in Madison County
The most frequent times of departure to work in Madison County are 6:30 AM to 6:59 AM (3,282, 11.7%) for males and 7:00 AM to 7:29 AM (4,012, 15.7%) for females.
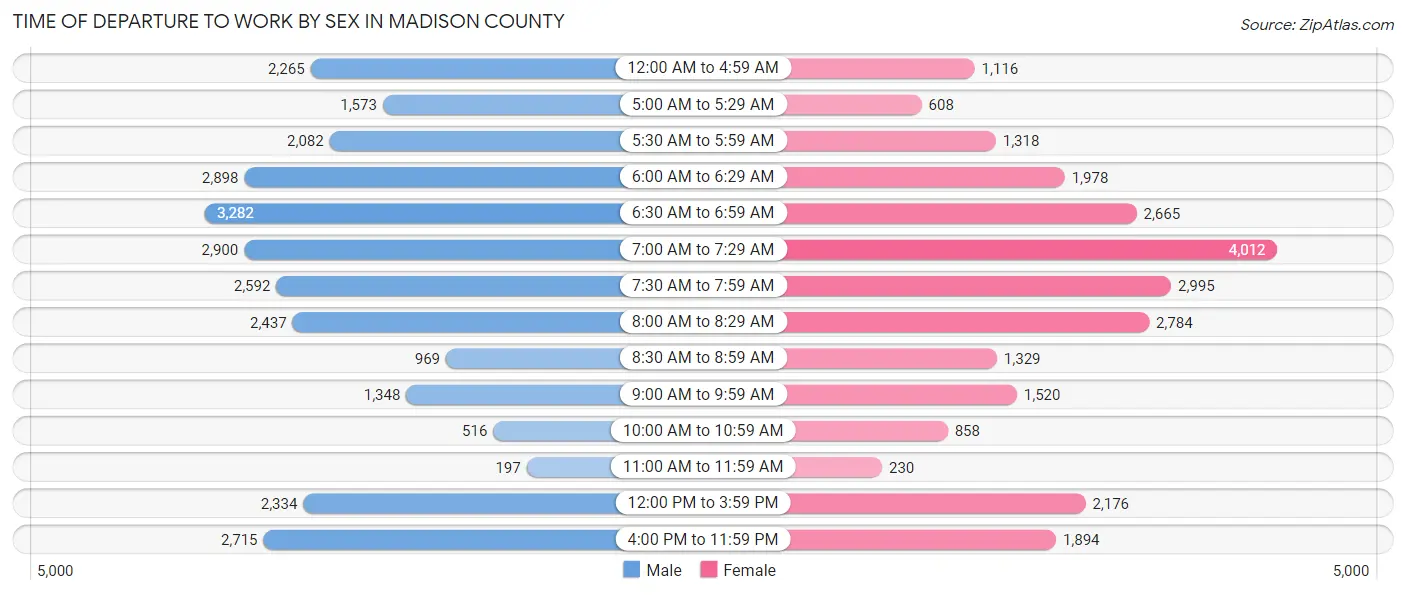
| Time of Departure | Male | Female |
| 12:00 AM to 4:59 AM | 2,265 (8.1%) | 1,116 (4.4%) |
| 5:00 AM to 5:29 AM | 1,573 (5.6%) | 608 (2.4%) |
| 5:30 AM to 5:59 AM | 2,082 (7.4%) | 1,318 (5.2%) |
| 6:00 AM to 6:29 AM | 2,898 (10.3%) | 1,978 (7.8%) |
| 6:30 AM to 6:59 AM | 3,282 (11.7%) | 2,665 (10.5%) |
| 7:00 AM to 7:29 AM | 2,900 (10.3%) | 4,012 (15.7%) |
| 7:30 AM to 7:59 AM | 2,592 (9.2%) | 2,995 (11.7%) |
| 8:00 AM to 8:29 AM | 2,437 (8.7%) | 2,784 (10.9%) |
| 8:30 AM to 8:59 AM | 969 (3.5%) | 1,329 (5.2%) |
| 9:00 AM to 9:59 AM | 1,348 (4.8%) | 1,520 (6.0%) |
| 10:00 AM to 10:59 AM | 516 (1.8%) | 858 (3.4%) |
| 11:00 AM to 11:59 AM | 197 (0.7%) | 230 (0.9%) |
| 12:00 PM to 3:59 PM | 2,334 (8.3%) | 2,176 (8.5%) |
| 4:00 PM to 11:59 PM | 2,715 (9.7%) | 1,894 (7.4%) |
| Total | 28,108 (100.0%) | 25,483 (100.0%) |
Housing Occupancy in Madison County
Occupancy by Ownership in Madison County
Of the total 51,788 dwellings in Madison County, owner-occupied units account for 36,342 (70.2%), while renter-occupied units make up 15,446 (29.8%).
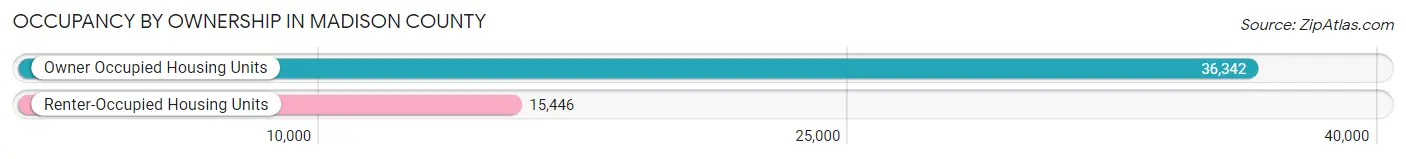
| Occupancy | # Housing Units | % Housing Units |
| Owner Occupied Housing Units | 36,342 | 70.2% |
| Renter-Occupied Housing Units | 15,446 | 29.8% |
| Total Occupied Housing Units | 51,788 | 100.0% |
Occupancy by Household Size in Madison County
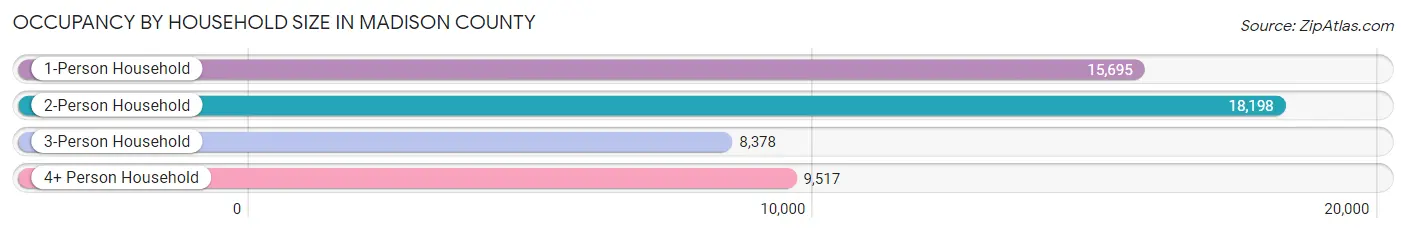
| Household Size | # Housing Units | % Housing Units |
| 1-Person Household | 15,695 | 30.3% |
| 2-Person Household | 18,198 | 35.1% |
| 3-Person Household | 8,378 | 16.2% |
| 4+ Person Household | 9,517 | 18.4% |
| Total Housing Units | 51,788 | 100.0% |
Occupancy by Ownership by Household Size in Madison County
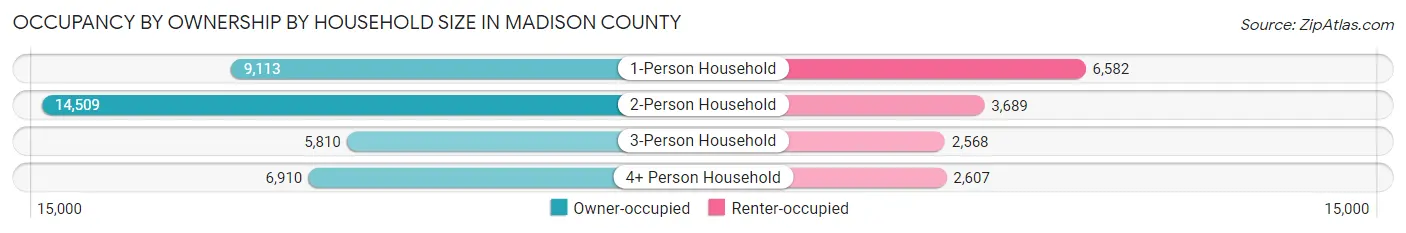
| Household Size | Owner-occupied | Renter-occupied |
| 1-Person Household | 9,113 (58.1%) | 6,582 (41.9%) |
| 2-Person Household | 14,509 (79.7%) | 3,689 (20.3%) |
| 3-Person Household | 5,810 (69.4%) | 2,568 (30.6%) |
| 4+ Person Household | 6,910 (72.6%) | 2,607 (27.4%) |
| Total Housing Units | 36,342 (70.2%) | 15,446 (29.8%) |
Occupancy by Educational Attainment in Madison County
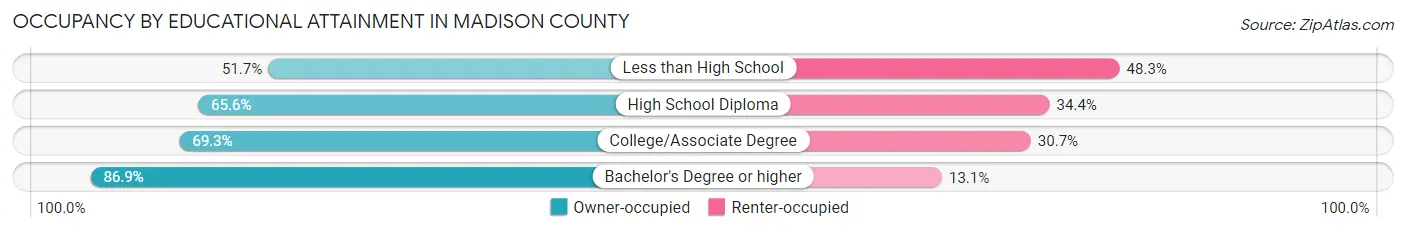
| Household Size | Owner-occupied | Renter-occupied |
| Less than High School | 2,222 (51.7%) | 2,073 (48.3%) |
| High School Diploma | 12,466 (65.6%) | 6,536 (34.4%) |
| College/Associate Degree | 12,258 (69.3%) | 5,425 (30.7%) |
| Bachelor's Degree or higher | 9,396 (86.9%) | 1,412 (13.1%) |
Occupancy by Age of Householder in Madison County
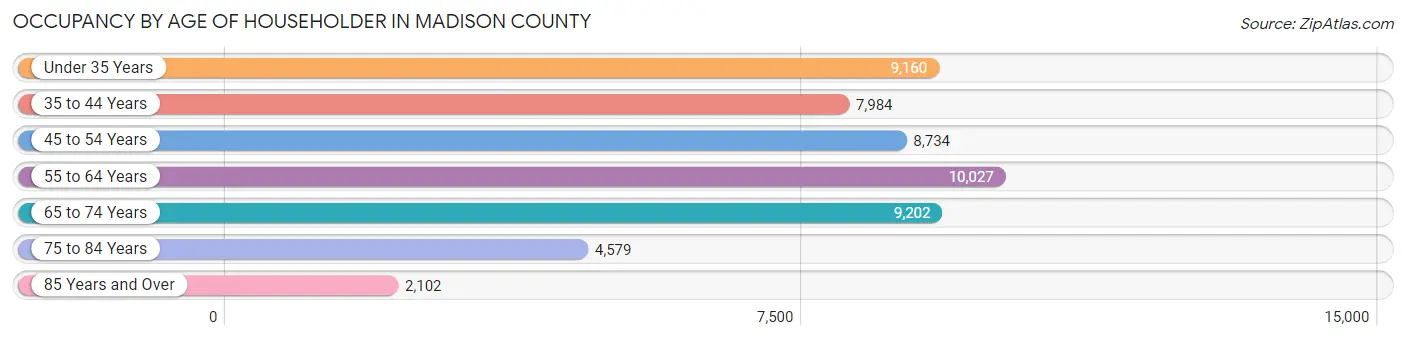
| Age Bracket | # Households | % Households |
| Under 35 Years | 9,160 | 17.7% |
| 35 to 44 Years | 7,984 | 15.4% |
| 45 to 54 Years | 8,734 | 16.9% |
| 55 to 64 Years | 10,027 | 19.4% |
| 65 to 74 Years | 9,202 | 17.8% |
| 75 to 84 Years | 4,579 | 8.8% |
| 85 Years and Over | 2,102 | 4.1% |
| Total | 51,788 | 100.0% |
Housing Finances in Madison County
Median Income by Occupancy in Madison County
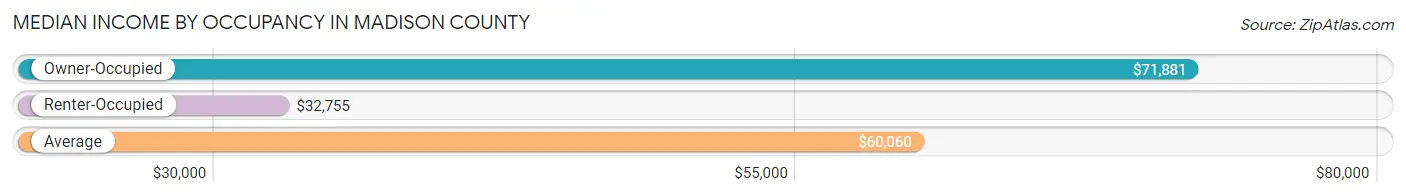
| Occupancy Type | # Households | Median Income |
| Owner-Occupied | 36,342 (70.2%) | $71,881 |
| Renter-Occupied | 15,446 (29.8%) | $32,755 |
| Average | 51,788 (100.0%) | $60,060 |
Occupancy by Householder Income Bracket in Madison County
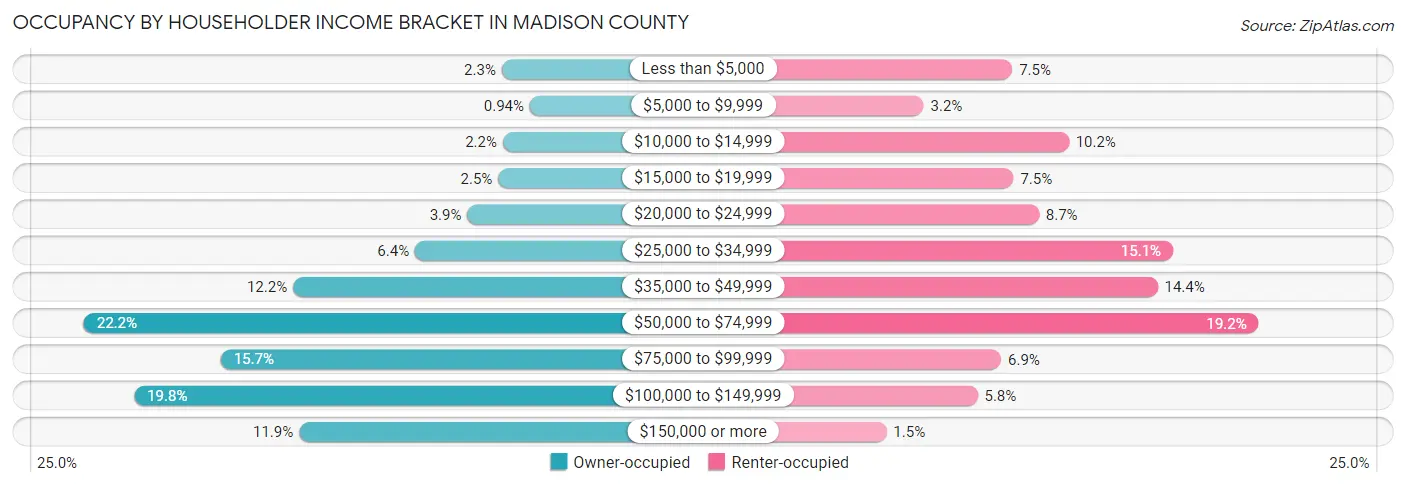
| Income Bracket | Owner-occupied | Renter-occupied |
| Less than $5,000 | 829 (2.3%) | 1,153 (7.5%) |
| $5,000 to $9,999 | 340 (0.9%) | 501 (3.2%) |
| $10,000 to $14,999 | 809 (2.2%) | 1,568 (10.2%) |
| $15,000 to $19,999 | 889 (2.5%) | 1,162 (7.5%) |
| $20,000 to $24,999 | 1,424 (3.9%) | 1,348 (8.7%) |
| $25,000 to $34,999 | 2,329 (6.4%) | 2,334 (15.1%) |
| $35,000 to $49,999 | 4,440 (12.2%) | 2,221 (14.4%) |
| $50,000 to $74,999 | 8,062 (22.2%) | 2,964 (19.2%) |
| $75,000 to $99,999 | 5,692 (15.7%) | 1,070 (6.9%) |
| $100,000 to $149,999 | 7,192 (19.8%) | 898 (5.8%) |
| $150,000 or more | 4,336 (11.9%) | 227 (1.5%) |
| Total | 36,342 (100.0%) | 15,446 (100.0%) |
Monthly Housing Cost Tiers in Madison County
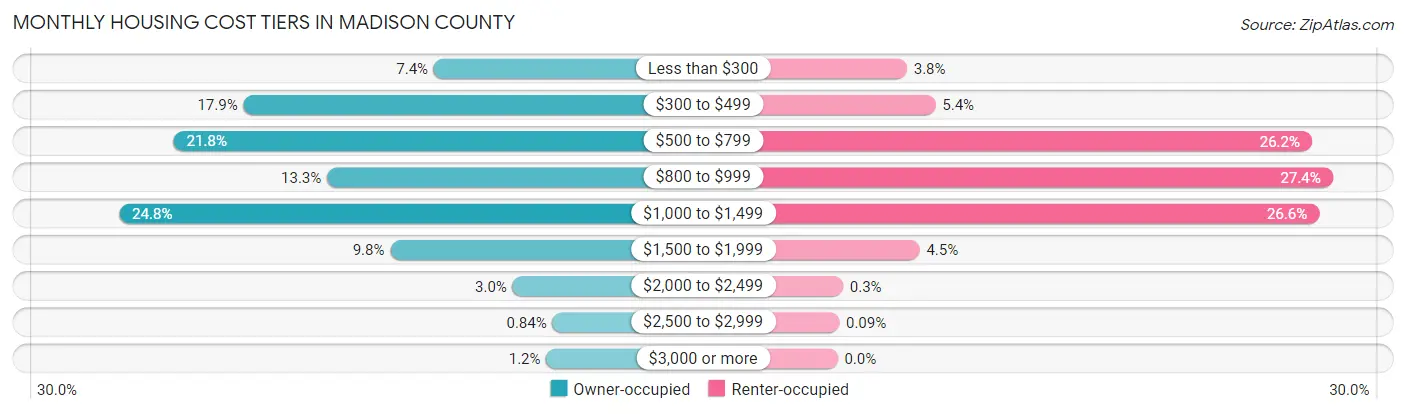
| Monthly Cost | Owner-occupied | Renter-occupied |
| Less than $300 | 2,686 (7.4%) | 591 (3.8%) |
| $300 to $499 | 6,509 (17.9%) | 835 (5.4%) |
| $500 to $799 | 7,910 (21.8%) | 4,047 (26.2%) |
| $800 to $999 | 4,831 (13.3%) | 4,224 (27.4%) |
| $1,000 to $1,499 | 9,005 (24.8%) | 4,109 (26.6%) |
| $1,500 to $1,999 | 3,562 (9.8%) | 700 (4.5%) |
| $2,000 to $2,499 | 1,106 (3.0%) | 46 (0.3%) |
| $2,500 to $2,999 | 304 (0.8%) | 14 (0.1%) |
| $3,000 or more | 429 (1.2%) | 0 (0.0%) |
| Total | 36,342 (100.0%) | 15,446 (100.0%) |
Physical Housing Characteristics in Madison County
Housing Structures in Madison County
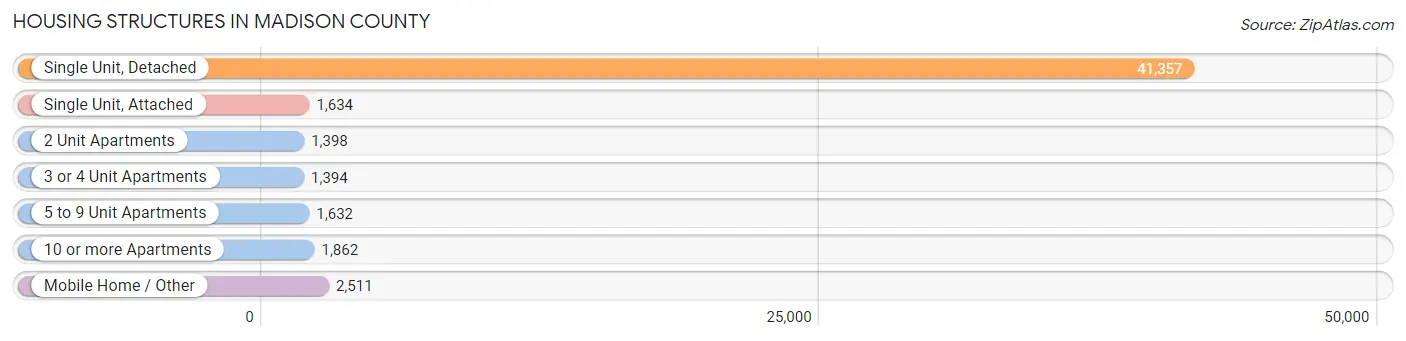
| Structure Type | # Housing Units | % Housing Units |
| Single Unit, Detached | 41,357 | 79.9% |
| Single Unit, Attached | 1,634 | 3.2% |
| 2 Unit Apartments | 1,398 | 2.7% |
| 3 or 4 Unit Apartments | 1,394 | 2.7% |
| 5 to 9 Unit Apartments | 1,632 | 3.2% |
| 10 or more Apartments | 1,862 | 3.6% |
| Mobile Home / Other | 2,511 | 4.9% |
| Total | 51,788 | 100.0% |
Housing Structures by Occupancy in Madison County
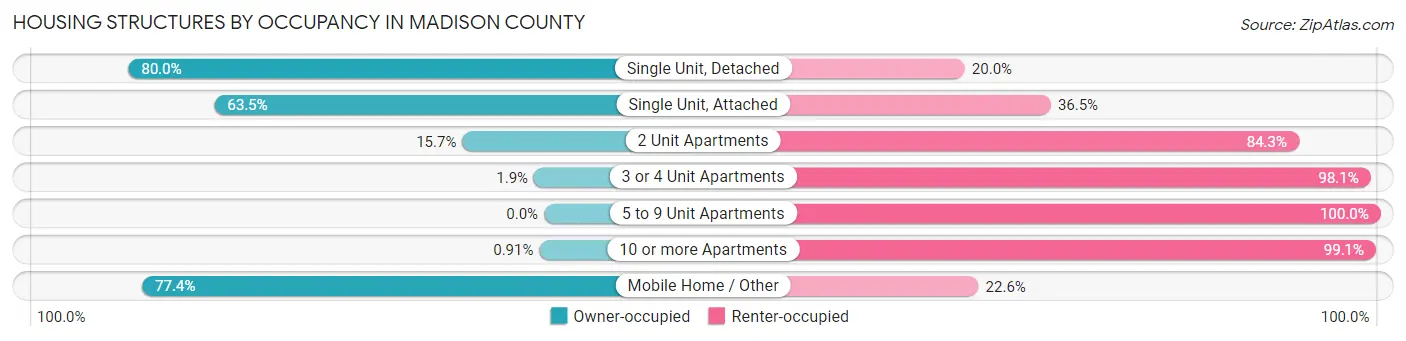
| Structure Type | Owner-occupied | Renter-occupied |
| Single Unit, Detached | 33,098 (80.0%) | 8,259 (20.0%) |
| Single Unit, Attached | 1,037 (63.5%) | 597 (36.5%) |
| 2 Unit Apartments | 220 (15.7%) | 1,178 (84.3%) |
| 3 or 4 Unit Apartments | 27 (1.9%) | 1,367 (98.1%) |
| 5 to 9 Unit Apartments | 0 (0.0%) | 1,632 (100.0%) |
| 10 or more Apartments | 17 (0.9%) | 1,845 (99.1%) |
| Mobile Home / Other | 1,943 (77.4%) | 568 (22.6%) |
| Total | 36,342 (70.2%) | 15,446 (29.8%) |
Housing Structures by Number of Rooms in Madison County
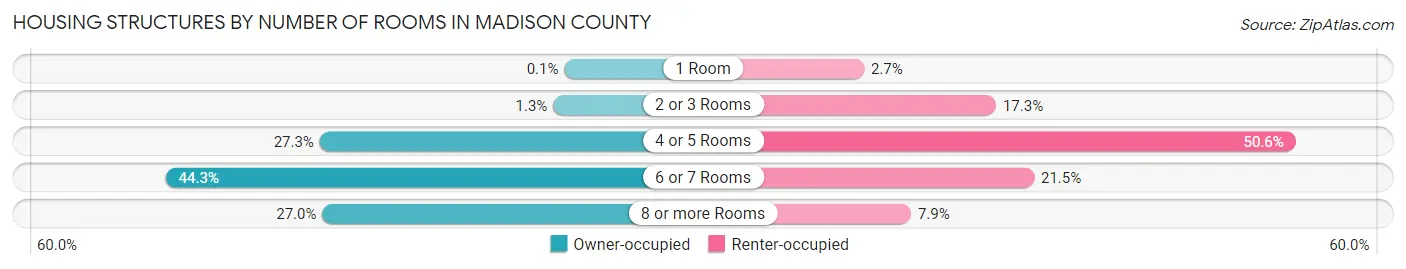
| Number of Rooms | Owner-occupied | Renter-occupied |
| 1 Room | 38 (0.1%) | 413 (2.7%) |
| 2 or 3 Rooms | 488 (1.3%) | 2,676 (17.3%) |
| 4 or 5 Rooms | 9,903 (27.3%) | 7,811 (50.6%) |
| 6 or 7 Rooms | 16,115 (44.3%) | 3,327 (21.5%) |
| 8 or more Rooms | 9,798 (27.0%) | 1,219 (7.9%) |
| Total | 36,342 (100.0%) | 15,446 (100.0%) |
Housing Structure by Heating Type in Madison County
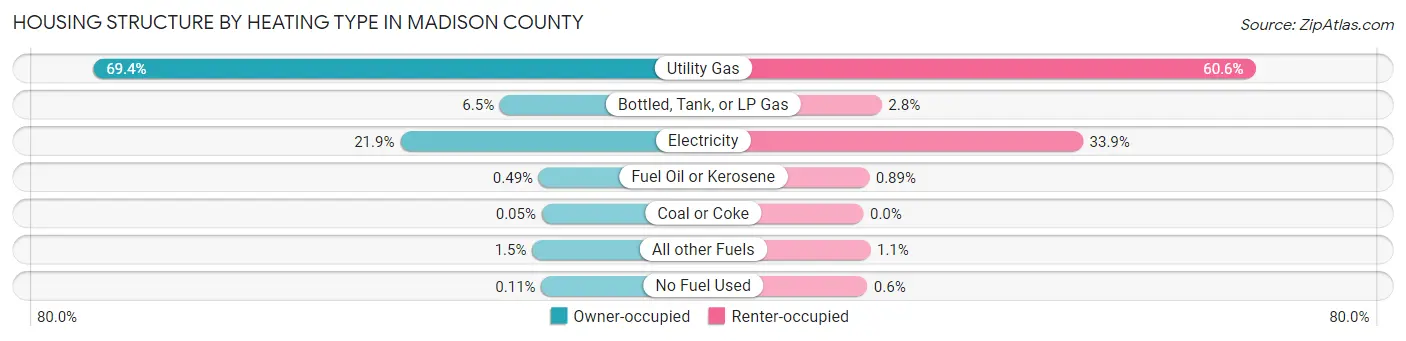
| Heating Type | Owner-occupied | Renter-occupied |
| Utility Gas | 25,216 (69.4%) | 9,367 (60.6%) |
| Bottled, Tank, or LP Gas | 2,366 (6.5%) | 439 (2.8%) |
| Electricity | 7,971 (21.9%) | 5,242 (33.9%) |
| Fuel Oil or Kerosene | 179 (0.5%) | 138 (0.9%) |
| Coal or Coke | 19 (0.1%) | 0 (0.0%) |
| All other Fuels | 550 (1.5%) | 167 (1.1%) |
| No Fuel Used | 41 (0.1%) | 93 (0.6%) |
| Total | 36,342 (100.0%) | 15,446 (100.0%) |
Household Vehicle Usage in Madison County
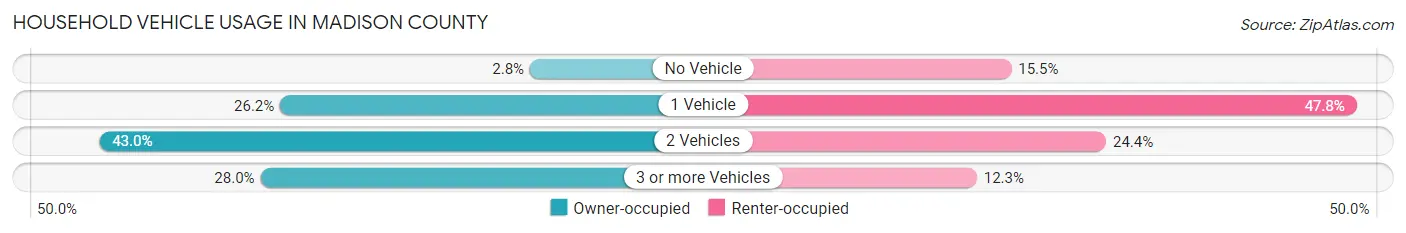
| Vehicles per Household | Owner-occupied | Renter-occupied |
| No Vehicle | 1,027 (2.8%) | 2,399 (15.5%) |
| 1 Vehicle | 9,503 (26.2%) | 7,379 (47.8%) |
| 2 Vehicles | 15,639 (43.0%) | 3,766 (24.4%) |
| 3 or more Vehicles | 10,173 (28.0%) | 1,902 (12.3%) |
| Total | 36,342 (100.0%) | 15,446 (100.0%) |
Real Estate & Mortgages in Madison County
Real Estate and Mortgage Overview in Madison County
| Characteristic | Without Mortgage | With Mortgage |
| Housing Units | 14,023 | 22,319 |
| Median Property Value | $111,600 | $148,300 |
| Median Household Income | $55,703 | $3,239 |
| Monthly Housing Costs | $438 | $429 |
| Real Estate Taxes | $919 | $813 |
Property Value by Mortgage Status in Madison County
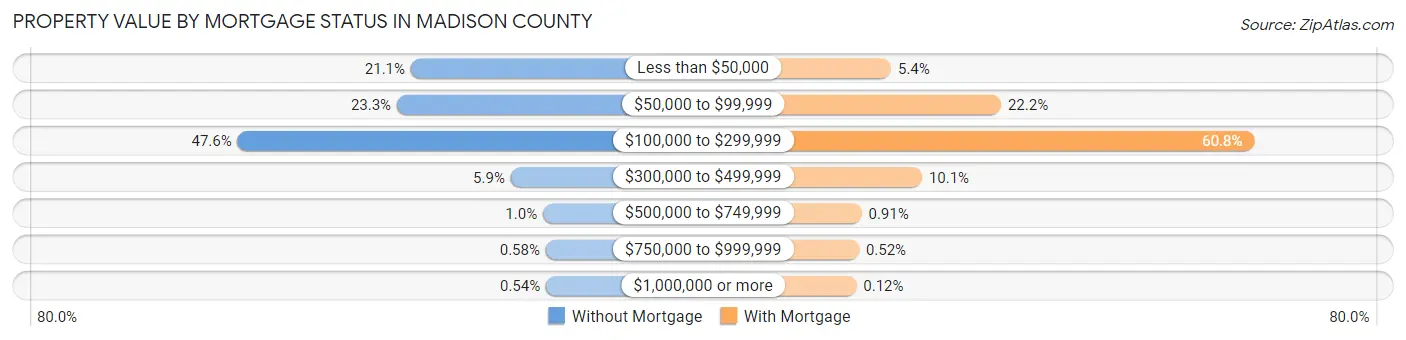
| Property Value | Without Mortgage | With Mortgage |
| Less than $50,000 | 2,965 (21.1%) | 1,207 (5.4%) |
| $50,000 to $99,999 | 3,262 (23.3%) | 4,947 (22.2%) |
| $100,000 to $299,999 | 6,668 (47.5%) | 13,561 (60.8%) |
| $300,000 to $499,999 | 830 (5.9%) | 2,258 (10.1%) |
| $500,000 to $749,999 | 141 (1.0%) | 202 (0.9%) |
| $750,000 to $999,999 | 81 (0.6%) | 117 (0.5%) |
| $1,000,000 or more | 76 (0.5%) | 27 (0.1%) |
| Total | 14,023 (100.0%) | 22,319 (100.0%) |
Household Income by Mortgage Status in Madison County
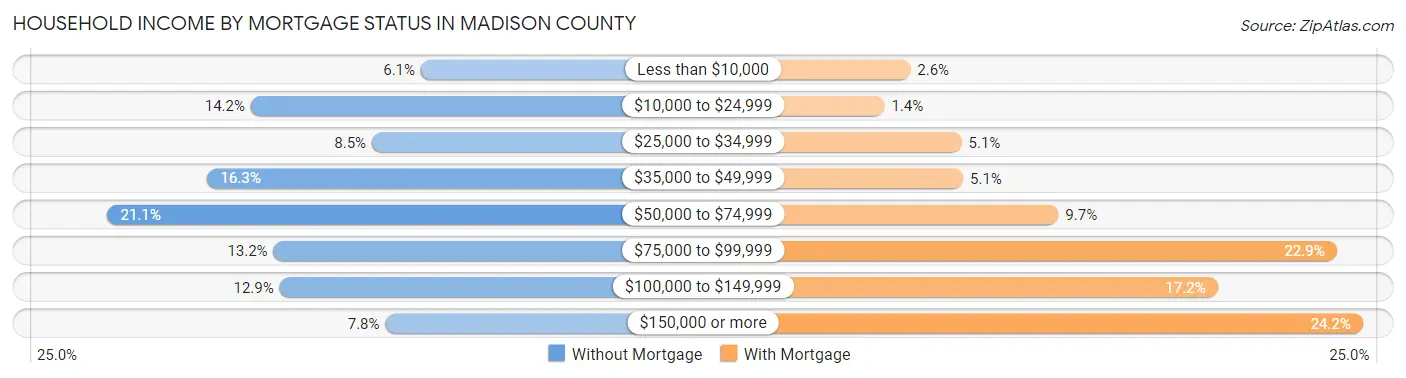
| Household Income | Without Mortgage | With Mortgage |
| Less than $10,000 | 860 (6.1%) | 582 (2.6%) |
| $10,000 to $24,999 | 1,995 (14.2%) | 309 (1.4%) |
| $25,000 to $34,999 | 1,187 (8.5%) | 1,127 (5.1%) |
| $35,000 to $49,999 | 2,285 (16.3%) | 1,142 (5.1%) |
| $50,000 to $74,999 | 2,952 (21.0%) | 2,155 (9.7%) |
| $75,000 to $99,999 | 1,844 (13.2%) | 5,110 (22.9%) |
| $100,000 to $149,999 | 1,803 (12.9%) | 3,848 (17.2%) |
| $150,000 or more | 1,097 (7.8%) | 5,389 (24.1%) |
| Total | 14,023 (100.0%) | 22,319 (100.0%) |
Property Value to Household Income Ratio in Madison County
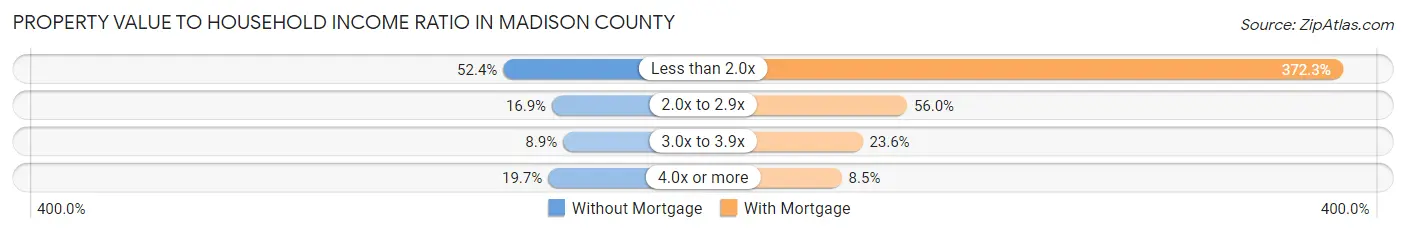
| Value-to-Income Ratio | Without Mortgage | With Mortgage |
| Less than 2.0x | 7,342 (52.4%) | 83,095 (372.3%) |
| 2.0x to 2.9x | 2,370 (16.9%) | 12,490 (56.0%) |
| 3.0x to 3.9x | 1,249 (8.9%) | 5,270 (23.6%) |
| 4.0x or more | 2,768 (19.7%) | 1,905 (8.5%) |
| Total | 14,023 (100.0%) | 22,319 (100.0%) |
Real Estate Taxes by Mortgage Status in Madison County
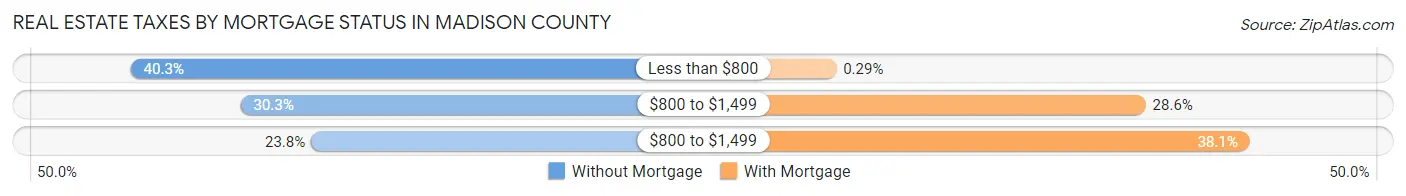
| Property Taxes | Without Mortgage | With Mortgage |
| Less than $800 | 5,652 (40.3%) | 64 (0.3%) |
| $800 to $1,499 | 4,246 (30.3%) | 6,372 (28.5%) |
| $800 to $1,499 | 3,343 (23.8%) | 8,492 (38.1%) |
| Total | 14,023 (100.0%) | 22,319 (100.0%) |
Health & Disability in Madison County
Health Insurance Coverage by Age in Madison County
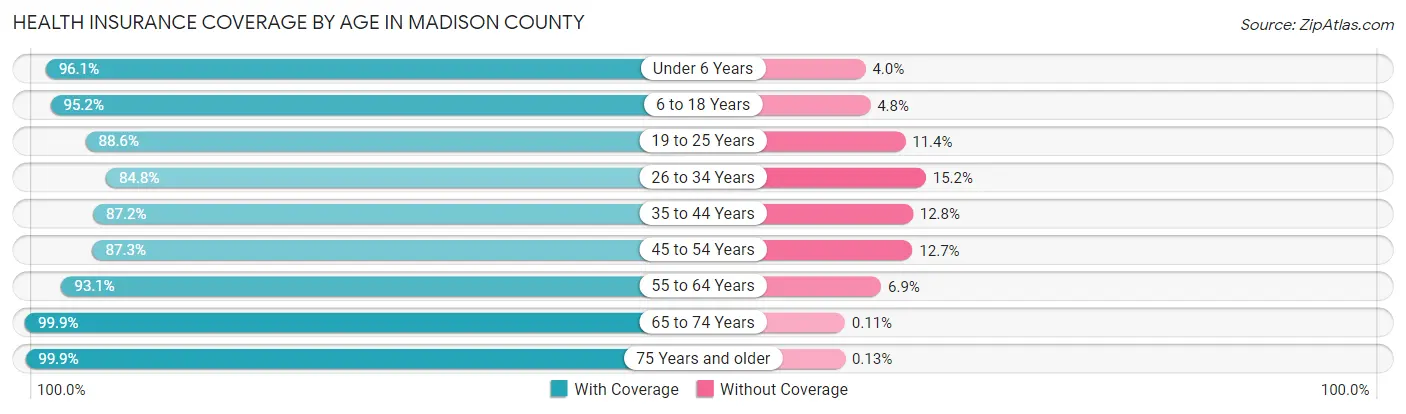
| Age Bracket | With Coverage | Without Coverage |
| Under 6 Years | 8,537 (96.1%) | 351 (4.0%) |
| 6 to 18 Years | 19,829 (95.2%) | 1,007 (4.8%) |
| 19 to 25 Years | 9,482 (88.6%) | 1,218 (11.4%) |
| 26 to 34 Years | 11,701 (84.8%) | 2,097 (15.2%) |
| 35 to 44 Years | 13,258 (87.2%) | 1,942 (12.8%) |
| 45 to 54 Years | 14,270 (87.3%) | 2,076 (12.7%) |
| 55 to 64 Years | 16,019 (93.1%) | 1,179 (6.9%) |
| 65 to 74 Years | 13,758 (99.9%) | 15 (0.1%) |
| 75 Years and older | 9,553 (99.9%) | 12 (0.1%) |
| Total | 116,407 (92.2%) | 9,897 (7.8%) |
Health Insurance Coverage by Citizenship Status in Madison County
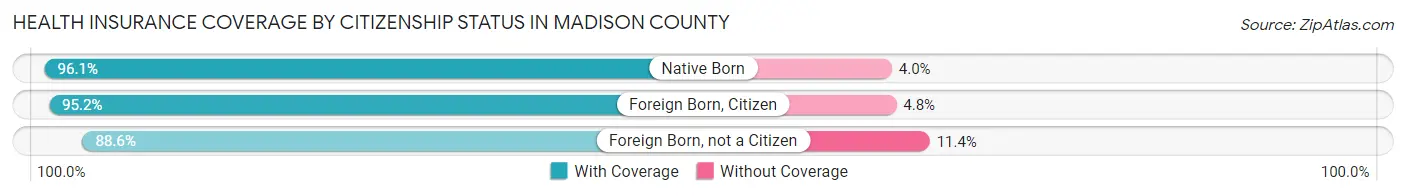
| Citizenship Status | With Coverage | Without Coverage |
| Native Born | 8,537 (96.1%) | 351 (4.0%) |
| Foreign Born, Citizen | 19,829 (95.2%) | 1,007 (4.8%) |
| Foreign Born, not a Citizen | 9,482 (88.6%) | 1,218 (11.4%) |
Health Insurance Coverage by Household Income in Madison County
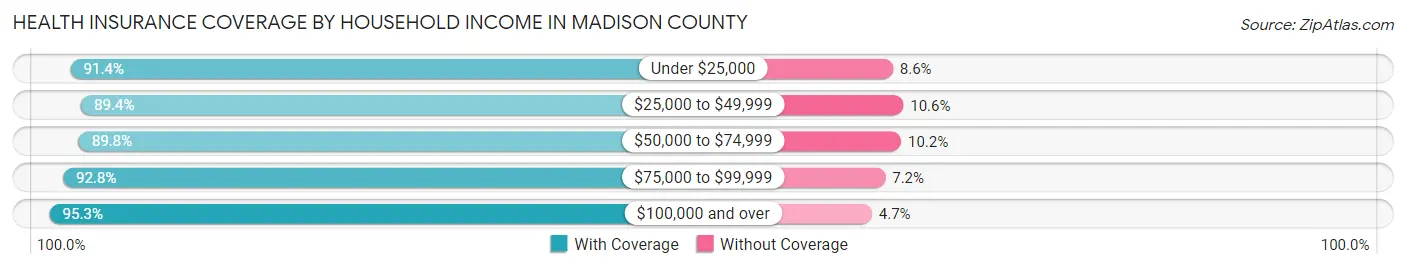
| Household Income | With Coverage | Without Coverage |
| Under $25,000 | 15,428 (91.4%) | 1,458 (8.6%) |
| $25,000 to $49,999 | 20,373 (89.4%) | 2,412 (10.6%) |
| $50,000 to $74,999 | 24,276 (89.8%) | 2,745 (10.2%) |
| $75,000 to $99,999 | 17,161 (92.8%) | 1,333 (7.2%) |
| $100,000 and over | 38,050 (95.3%) | 1,872 (4.7%) |
Public vs Private Health Insurance Coverage by Age in Madison County
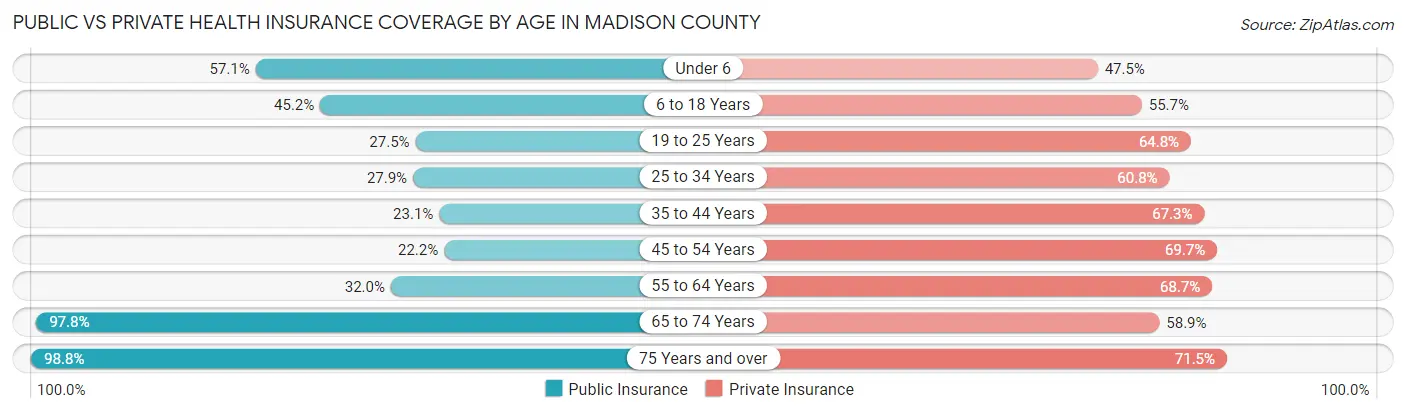
| Age Bracket | Public Insurance | Private Insurance |
| Under 6 | 5,079 (57.1%) | 4,222 (47.5%) |
| 6 to 18 Years | 9,408 (45.2%) | 11,602 (55.7%) |
| 19 to 25 Years | 2,938 (27.5%) | 6,934 (64.8%) |
| 25 to 34 Years | 3,853 (27.9%) | 8,389 (60.8%) |
| 35 to 44 Years | 3,504 (23.1%) | 10,226 (67.3%) |
| 45 to 54 Years | 3,621 (22.2%) | 11,388 (69.7%) |
| 55 to 64 Years | 5,509 (32.0%) | 11,822 (68.7%) |
| 65 to 74 Years | 13,474 (97.8%) | 8,118 (58.9%) |
| 75 Years and over | 9,450 (98.8%) | 6,836 (71.5%) |
| Total | 56,836 (45.0%) | 79,537 (63.0%) |
Disability Status by Sex by Age in Madison County
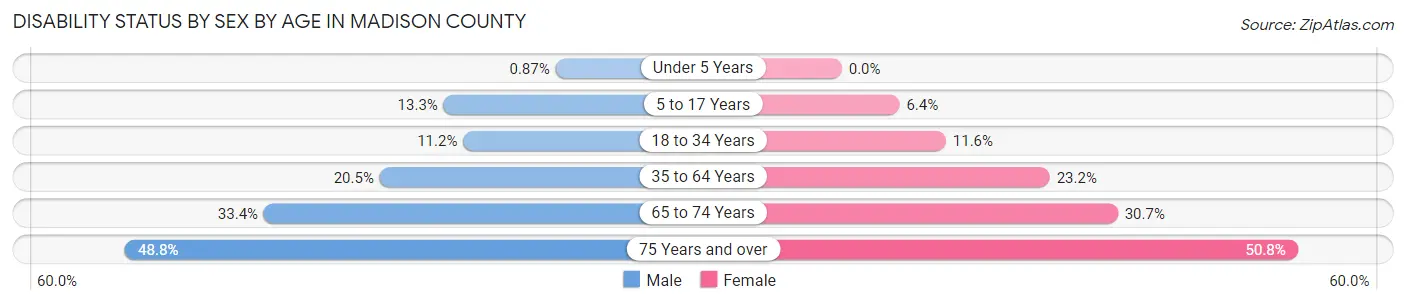
| Age Bracket | Male | Female |
| Under 5 Years | 32 (0.9%) | 0 (0.0%) |
| 5 to 17 Years | 1,439 (13.3%) | 648 (6.4%) |
| 18 to 34 Years | 1,467 (11.2%) | 1,520 (11.6%) |
| 35 to 64 Years | 4,957 (20.4%) | 5,673 (23.2%) |
| 65 to 74 Years | 2,129 (33.4%) | 2,271 (30.7%) |
| 75 Years and over | 1,971 (48.8%) | 2,805 (50.8%) |
Disability Class by Sex by Age in Madison County
Disability Class: Hearing Difficulty
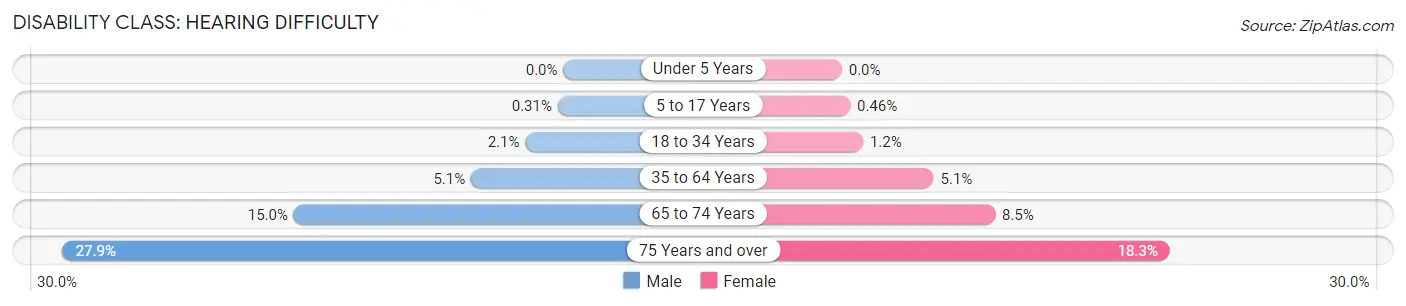
| Age Bracket | Male | Female |
| Under 5 Years | 0 (0.0%) | 0 (0.0%) |
| 5 to 17 Years | 33 (0.3%) | 46 (0.5%) |
| 18 to 34 Years | 279 (2.1%) | 155 (1.2%) |
| 35 to 64 Years | 1,246 (5.1%) | 1,253 (5.1%) |
| 65 to 74 Years | 958 (15.0%) | 630 (8.5%) |
| 75 Years and over | 1,126 (27.9%) | 1,009 (18.3%) |
Disability Class: Vision Difficulty
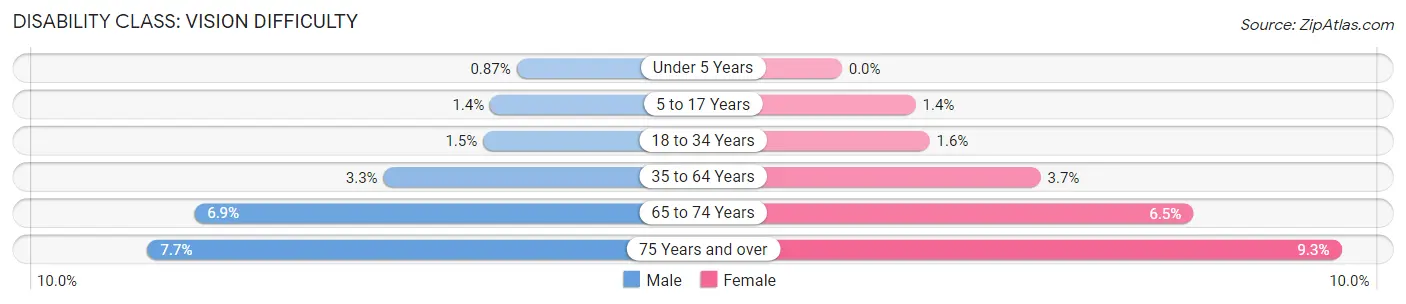
| Age Bracket | Male | Female |
| Under 5 Years | 32 (0.9%) | 0 (0.0%) |
| 5 to 17 Years | 147 (1.4%) | 138 (1.4%) |
| 18 to 34 Years | 196 (1.5%) | 214 (1.6%) |
| 35 to 64 Years | 810 (3.3%) | 905 (3.7%) |
| 65 to 74 Years | 437 (6.9%) | 482 (6.5%) |
| 75 Years and over | 312 (7.7%) | 512 (9.3%) |
Disability Class: Cognitive Difficulty
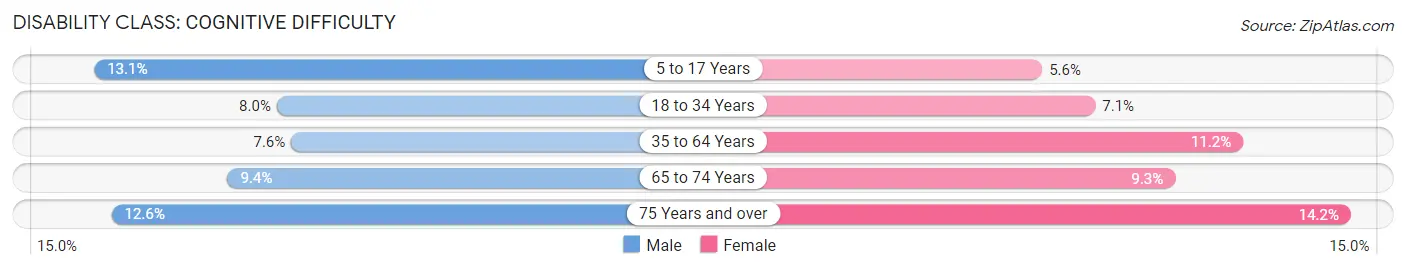
| Age Bracket | Male | Female |
| 5 to 17 Years | 1,410 (13.1%) | 563 (5.6%) |
| 18 to 34 Years | 1,050 (8.0%) | 926 (7.1%) |
| 35 to 64 Years | 1,838 (7.6%) | 2,736 (11.2%) |
| 65 to 74 Years | 597 (9.3%) | 686 (9.3%) |
| 75 Years and over | 508 (12.6%) | 783 (14.2%) |
Disability Class: Ambulatory Difficulty
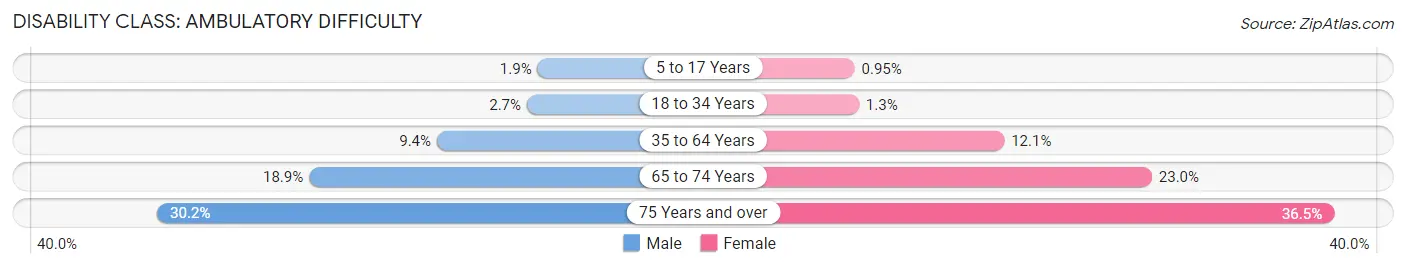
| Age Bracket | Male | Female |
| 5 to 17 Years | 207 (1.9%) | 96 (0.9%) |
| 18 to 34 Years | 357 (2.7%) | 166 (1.3%) |
| 35 to 64 Years | 2,277 (9.4%) | 2,954 (12.1%) |
| 65 to 74 Years | 1,205 (18.9%) | 1,701 (23.0%) |
| 75 Years and over | 1,218 (30.2%) | 2,019 (36.5%) |
Disability Class: Self-Care Difficulty
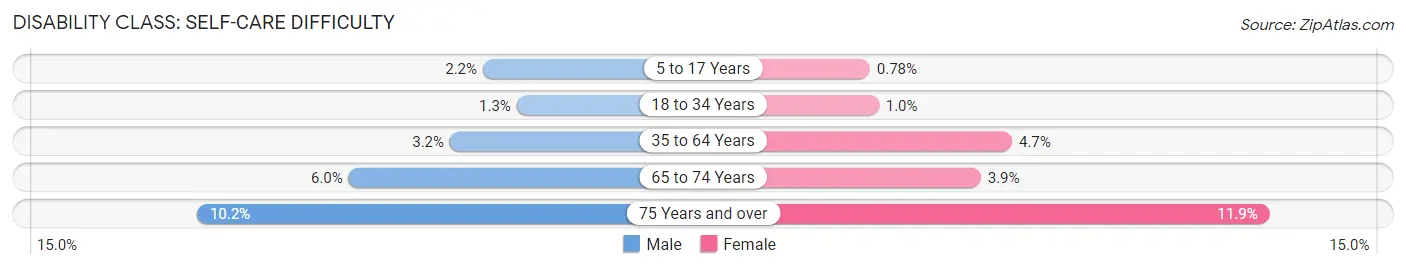
| Age Bracket | Male | Female |
| 5 to 17 Years | 242 (2.2%) | 79 (0.8%) |
| 18 to 34 Years | 171 (1.3%) | 135 (1.0%) |
| 35 to 64 Years | 767 (3.2%) | 1,161 (4.7%) |
| 65 to 74 Years | 382 (6.0%) | 286 (3.9%) |
| 75 Years and over | 412 (10.2%) | 658 (11.9%) |
Technology Access in Madison County
Computing Device Access in Madison County
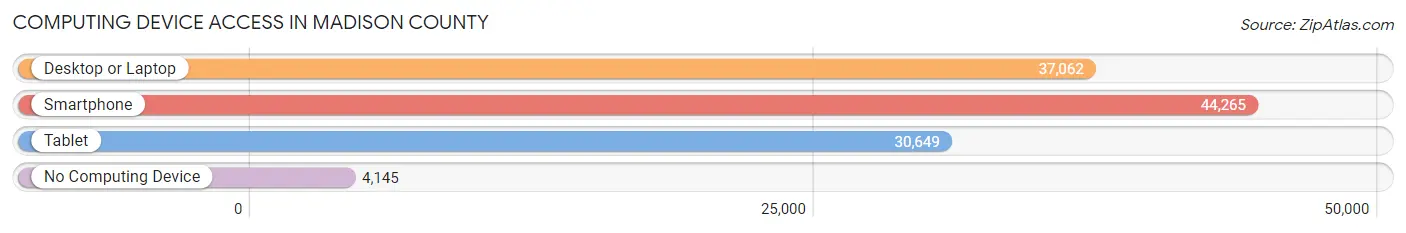
| Device Type | # Households | % Households |
| Desktop or Laptop | 37,062 | 71.6% |
| Smartphone | 44,265 | 85.5% |
| Tablet | 30,649 | 59.2% |
| No Computing Device | 4,145 | 8.0% |
| Total | 51,788 | 100.0% |
Internet Access in Madison County
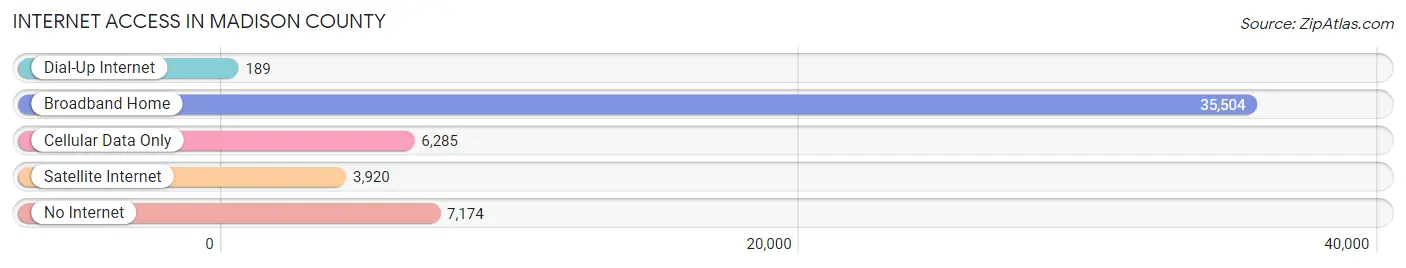
| Internet Type | # Households | % Households |
| Dial-Up Internet | 189 | 0.4% |
| Broadband Home | 35,504 | 68.6% |
| Cellular Data Only | 6,285 | 12.1% |
| Satellite Internet | 3,920 | 7.6% |
| No Internet | 7,174 | 13.9% |
| Total | 51,788 | 100.0% |
Madison County Summary
Madison County, Indiana is located in the central part of the state, just east of Indianapolis. It is bordered by Delaware, Henry, Hancock, Hamilton, and Tipton counties. The county seat is Anderson, and the county is part of the Anderson Metropolitan Statistical Area.
History
Madison County was established in 1823 and named after James Madison, the fourth President of the United States. The county was originally part of the Delaware New Purchase, which was a large tract of land purchased from the Delaware Indians in 1818. The county was initially divided into two townships, Anderson and Stony Creek.
The first settlers in the area were mostly Quakers from North Carolina, who arrived in the early 1820s. The county was largely agricultural, with corn, wheat, and oats being the main crops. The county also had a thriving livestock industry, with cattle, sheep, and hogs being raised.
The county experienced rapid growth in the late 19th and early 20th centuries, due to the development of the railroads and the growth of the industrial sector. The city of Anderson became a major industrial center, with the Anderson Car Company, the Anderson Glass Company, and the Anderson Foundry all being established in the city.
Geography
Madison County is located in the central part of Indiana, just east of Indianapolis. It is bordered by Delaware, Henry, Hancock, Hamilton, and Tipton counties. The county has a total area of 441 square miles, of which 437 square miles is land and 4 square miles is water.
The county is mostly flat, with some rolling hills in the northern and western parts of the county. The White River runs through the county, and there are several small lakes and ponds scattered throughout the county. The county is part of the Central Till Plains region of Indiana.
Economy
Madison County has a diverse economy, with a mix of manufacturing, agriculture, and services. The county is home to several large manufacturing companies, including Delphi Automotive, General Motors, and Nestle. The county also has a thriving agricultural sector, with corn, soybeans, and wheat being the main crops.
The county also has a large service sector, with healthcare, education, and retail being the main industries. The county is home to several hospitals, including St. Vincent Anderson Regional Hospital and Community Hospital Anderson. The county also has several colleges and universities, including Anderson University and Ivy Tech Community College.
Demographics
As of the 2010 census, Madison County had a population of 129,636. The population was spread out, with 24.3% under the age of 18, 8.7% from 18 to 24, 28.2% from 25 to 44, 24.3% from 45 to 64, and 14.5% who were 65 years of age or older. The median age was 37.4 years.
The racial makeup of the county was 87.2% White, 8.2% African American, 0.4% Native American, 1.2% Asian, 0.1% Pacific Islander, 1.3% from other races, and 1.6% from two or more races. Hispanic or Latino of any race were 3.2% of the population.
The median income for a household in the county was $45,945, and the median income for a family was $54,945. The per capita income for the county was $22,845. About 8.7% of families and 11.3% of the population were below the poverty line, including 15.2% of those under age 18 and 6.2% of those age 65 or over.
Common Questions
What is the Total Population of Madison County?
Total Population of Madison County is 130,545.
What is the Total Male Population of Madison County?
Total Male Population of Madison County is 65,913.
What is the Total Female Population of Madison County?
Total Female Population of Madison County is 64,632.
What is the Ratio of Males per 100 Females in Madison County?
There are 101.98 Males per 100 Females in Madison County.
What is the Ratio of Females per 100 Males in Madison County?
There are 98.06 Females per 100 Males in Madison County.
What is the Median Population Age in Madison County?
Median Population Age in Madison County is 40.7 Years.
What is the Average Family Size in Madison County
Average Family Size in Madison County is 3.0 People.
What is the Average Household Size in Madison County
Average Household Size in Madison County is 2.4 People.
What is Per Capita Income in Madison County?
Per Capita income in Madison County is $31,556.
What is the Median Family Income in Madison County?
Median Family Income in Madison County is $73,998.
What is the Median Household income in Madison County?
Median Household Income in Madison County is $60,060.
What is Income or Wage Gap in Madison County?
Income or Wage Gap in Madison County is 28.7%.
Women in Madison County earn 71.3 cents for every dollar earned by a man.
What is Family Income Deficit in Madison County?
Family Income Deficit in Madison County is $12,080.
Families that are below poverty line in Madison County earn $12,080 less on average than the poverty threshold level.
What is Inequality or Gini Index in Madison County?
Inequality or Gini Index in Madison County is 0.44.
How Large is the Labor Force in Madison County?
There are 62,980 People in the Labor Forcein in Madison County.
What is the Percentage of People in the Labor Force in Madison County?
59.4% of People are in the Labor Force in Madison County.
What is the Unemployment Rate in Madison County?
Unemployment Rate in Madison County is 5.5%.