Kosciusko County, IN
Kosciusko County Map
Kosciusko County Overview
80,442
TOTAL POPULATION
40,282
MALE POPULATION
40,160
FEMALE POPULATION
100.30
MALES / 100 FEMALES
99.70
FEMALES / 100 MALES
39.0
MEDIAN AGE
3.1
AVG FAMILY SIZE
2.5
AVG HOUSEHOLD SIZE
$35,297
PER CAPITA INCOME
$87,637
AVG FAMILY INCOME
$70,945
AVG HOUSEHOLD INCOME
43.5%
WAGE / INCOME GAP [ % ]
56.5¢/ $1
WAGE / INCOME GAP [ $ ]
$10,130
FAMILY INCOME DEFICIT
0.41
INEQUALITY / GINI INDEX
42,148
LABOR FORCE [ PEOPLE ]
65.8%
PERCENT IN LABOR FORCE
3.3%
UNEMPLOYMENT RATE
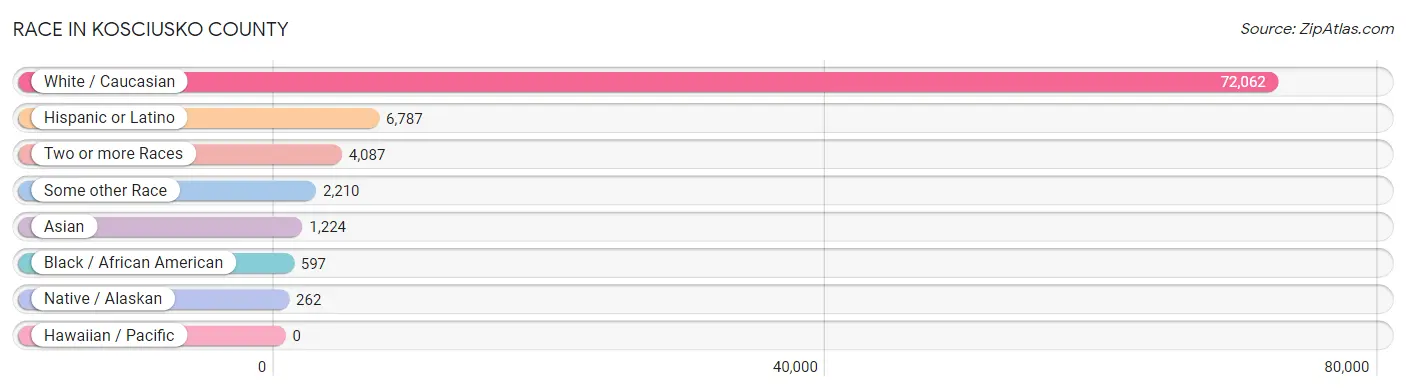
Race in Kosciusko County
The most populous races in Kosciusko County are White / Caucasian (72,062 | 89.6%), Hispanic or Latino (6,787 | 8.4%), and Two or more Races (4,087 | 5.1%).
| Race | # Population | % Population |
| Asian | 1,224 | 1.5% |
| Black / African American | 597 | 0.7% |
| Hawaiian / Pacific | 0 | 0.0% |
| Hispanic or Latino | 6,787 | 8.4% |
| Native / Alaskan | 262 | 0.3% |
| White / Caucasian | 72,062 | 89.6% |
| Two or more Races | 4,087 | 5.1% |
| Some other Race | 2,210 | 2.8% |
| Total | 80,442 | 100.0% |
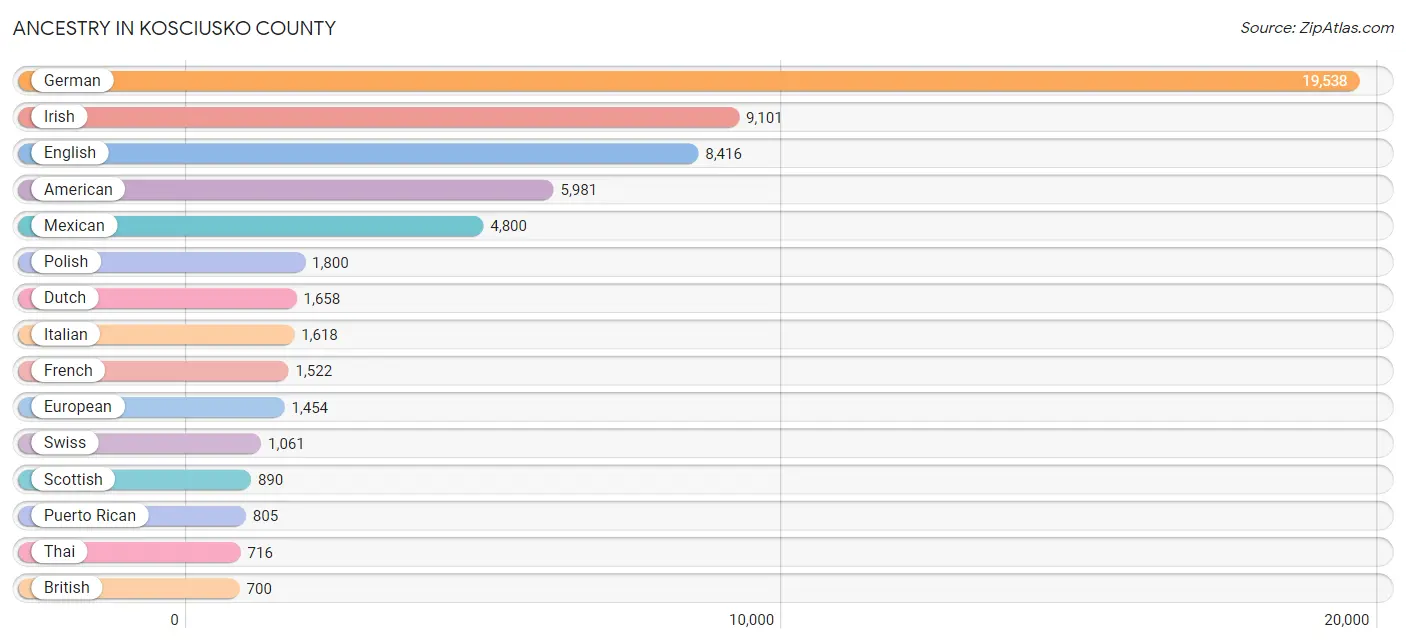
Ancestry in Kosciusko County
The most populous ancestries reported in Kosciusko County are German (19,538 | 24.3%), Irish (9,101 | 11.3%), English (8,416 | 10.5%), American (5,981 | 7.4%), and Mexican (4,800 | 6.0%), together accounting for 59.5% of all Kosciusko County residents.
| Ancestry | # Population | % Population |
| African | 27 | 0.0% |
| American | 5,981 | 7.4% |
| Apache | 19 | 0.0% |
| Arab | 49 | 0.1% |
| Armenian | 4 | 0.0% |
| Australian | 81 | 0.1% |
| Austrian | 206 | 0.3% |
| Belgian | 66 | 0.1% |
| Bhutanese | 73 | 0.1% |
| Blackfeet | 35 | 0.0% |
| Bolivian | 28 | 0.0% |
| Brazilian | 51 | 0.1% |
| British | 700 | 0.9% |
| Burmese | 41 | 0.1% |
| Canadian | 32 | 0.0% |
| Central American | 453 | 0.6% |
| Central American Indian | 3 | 0.0% |
| Cherokee | 113 | 0.1% |
| Chilean | 6 | 0.0% |
| Chippewa | 13 | 0.0% |
| Choctaw | 17 | 0.0% |
| Colombian | 34 | 0.0% |
| Costa Rican | 7 | 0.0% |
| Croatian | 96 | 0.1% |
| Czech | 223 | 0.3% |
| Czechoslovakian | 52 | 0.1% |
| Danish | 109 | 0.1% |
| Dutch | 1,658 | 2.1% |
| Eastern European | 62 | 0.1% |
| Ecuadorian | 13 | 0.0% |
| English | 8,416 | 10.5% |
| Ethiopian | 37 | 0.1% |
| European | 1,454 | 1.8% |
| Filipino | 20 | 0.0% |
| Finnish | 50 | 0.1% |
| French | 1,522 | 1.9% |
| French Canadian | 241 | 0.3% |
| German | 19,538 | 24.3% |
| Greek | 92 | 0.1% |
| Guatemalan | 365 | 0.4% |
| Guyanese | 5 | 0.0% |
| Honduran | 17 | 0.0% |
| Hungarian | 274 | 0.3% |
| Indian (Asian) | 191 | 0.2% |
| Indonesian | 82 | 0.1% |
| Irish | 9,101 | 11.3% |
| Iroquois | 3 | 0.0% |
| Italian | 1,618 | 2.0% |
| Jamaican | 80 | 0.1% |
| Kiowa | 6 | 0.0% |
| Korean | 205 | 0.3% |
| Latvian | 87 | 0.1% |
| Lebanese | 32 | 0.0% |
| Lithuanian | 167 | 0.2% |
| Malaysian | 2 | 0.0% |
| Mexican | 4,800 | 6.0% |
| Native Hawaiian | 23 | 0.0% |
| Nigerian | 9 | 0.0% |
| Northern European | 30 | 0.0% |
| Norwegian | 521 | 0.6% |
| Pakistani | 42 | 0.1% |
| Palestinian | 17 | 0.0% |
| Panamanian | 63 | 0.1% |
| Pennsylvania German | 317 | 0.4% |
| Peruvian | 169 | 0.2% |
| Polish | 1,800 | 2.2% |
| Portuguese | 91 | 0.1% |
| Puerto Rican | 805 | 1.0% |
| Romanian | 118 | 0.2% |
| Russian | 213 | 0.3% |
| Salvadoran | 1 | 0.0% |
| Scandinavian | 94 | 0.1% |
| Scotch-Irish | 643 | 0.8% |
| Scottish | 890 | 1.1% |
| Serbian | 43 | 0.1% |
| Sioux | 7 | 0.0% |
| Slavic | 15 | 0.0% |
| Slovak | 69 | 0.1% |
| South African | 5 | 0.0% |
| South American | 273 | 0.3% |
| Spaniard | 65 | 0.1% |
| Spanish | 124 | 0.2% |
| Sri Lankan | 33 | 0.0% |
| Subsaharan African | 126 | 0.2% |
| Swedish | 700 | 0.9% |
| Swiss | 1,061 | 1.3% |
| Thai | 716 | 0.9% |
| Ugandan | 20 | 0.0% |
| Ukrainian | 111 | 0.1% |
| Venezuelan | 23 | 0.0% |
| Welsh | 639 | 0.8% |
| Yugoslavian | 7 | 0.0% | View All 92 Rows |
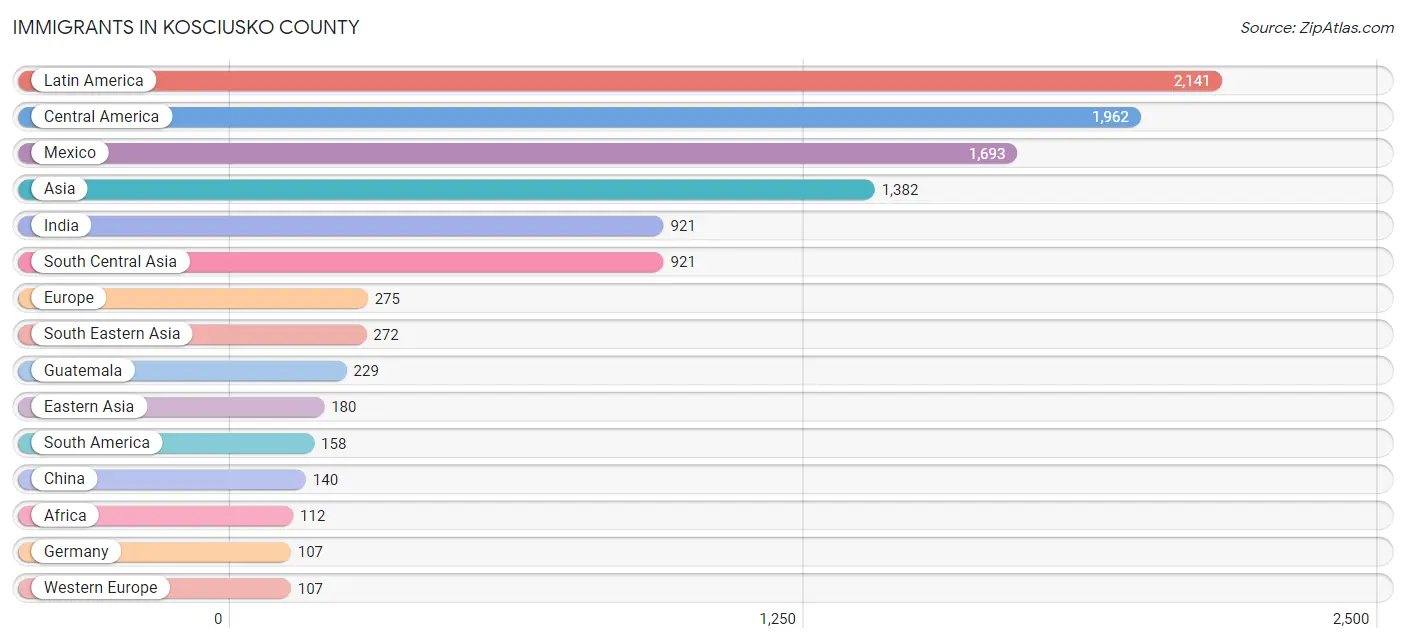
Immigrants in Kosciusko County
The most numerous immigrant groups reported in Kosciusko County came from Latin America (2,141 | 2.7%), Central America (1,962 | 2.4%), Mexico (1,693 | 2.1%), Asia (1,382 | 1.7%), and India (921 | 1.1%), together accounting for 10.1% of all Kosciusko County residents.
| Immigration Origin | # Population | % Population |
| Africa | 112 | 0.1% |
| Asia | 1,382 | 1.7% |
| Australia | 38 | 0.1% |
| Azores | 19 | 0.0% |
| Belarus | 1 | 0.0% |
| Bolivia | 28 | 0.0% |
| Brazil | 37 | 0.1% |
| Canada | 53 | 0.1% |
| Caribbean | 21 | 0.0% |
| Central America | 1,962 | 2.4% |
| China | 140 | 0.2% |
| Colombia | 34 | 0.0% |
| Denmark | 10 | 0.0% |
| Eastern Africa | 78 | 0.1% |
| Eastern Asia | 180 | 0.2% |
| Eastern Europe | 105 | 0.1% |
| Ecuador | 13 | 0.0% |
| El Salvador | 1 | 0.0% |
| England | 5 | 0.0% |
| Ethiopia | 48 | 0.1% |
| Europe | 275 | 0.3% |
| Germany | 107 | 0.1% |
| Guatemala | 229 | 0.3% |
| Guyana | 3 | 0.0% |
| Honduras | 17 | 0.0% |
| India | 921 | 1.1% |
| Italy | 13 | 0.0% |
| Japan | 13 | 0.0% |
| Korea | 27 | 0.0% |
| Laos | 2 | 0.0% |
| Latin America | 2,141 | 2.7% |
| Lithuania | 104 | 0.1% |
| Mexico | 1,693 | 2.1% |
| Nigeria | 9 | 0.0% |
| Northern Europe | 31 | 0.0% |
| Oceania | 38 | 0.1% |
| Panama | 22 | 0.0% |
| Peru | 20 | 0.0% |
| Philippines | 96 | 0.1% |
| Portugal | 19 | 0.0% |
| Scotland | 9 | 0.0% |
| South Africa | 5 | 0.0% |
| South America | 158 | 0.2% |
| South Central Asia | 921 | 1.1% |
| South Eastern Asia | 272 | 0.3% |
| Southern Europe | 32 | 0.0% |
| Taiwan | 38 | 0.1% |
| Thailand | 73 | 0.1% |
| Trinidad and Tobago | 21 | 0.0% |
| Venezuela | 23 | 0.0% |
| Vietnam | 30 | 0.0% |
| Western Africa | 9 | 0.0% |
| Western Europe | 107 | 0.1% | View All 53 Rows |
Sex and Age in Kosciusko County
Sex and Age in Kosciusko County
The most populous age groups in Kosciusko County are 10 to 14 Years (3,223 | 8.0%) for men and 60 to 64 Years (3,000 | 7.5%) for women.
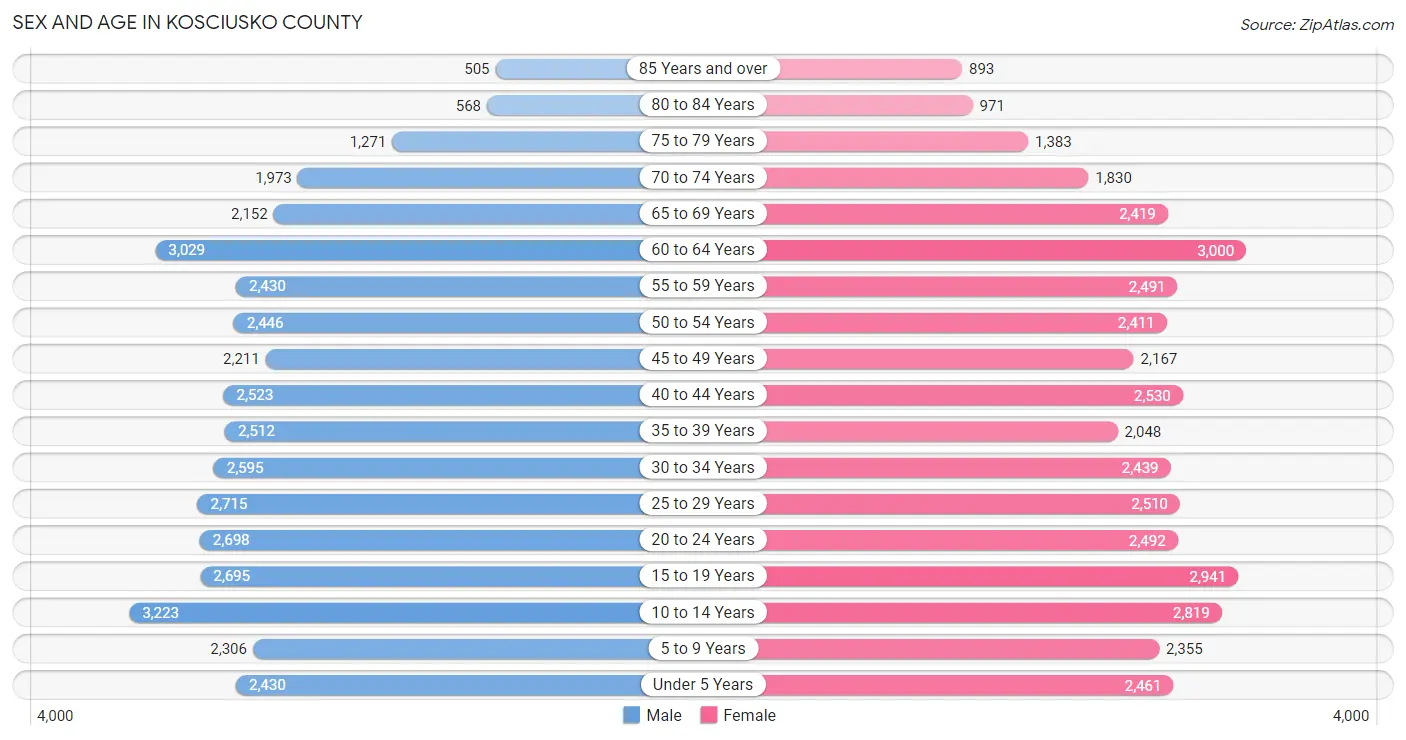
| Age Bracket | Male | Female |
| Under 5 Years | 2,430 (6.0%) | 2,461 (6.1%) |
| 5 to 9 Years | 2,306 (5.7%) | 2,355 (5.9%) |
| 10 to 14 Years | 3,223 (8.0%) | 2,819 (7.0%) |
| 15 to 19 Years | 2,695 (6.7%) | 2,941 (7.3%) |
| 20 to 24 Years | 2,698 (6.7%) | 2,492 (6.2%) |
| 25 to 29 Years | 2,715 (6.7%) | 2,510 (6.2%) |
| 30 to 34 Years | 2,595 (6.4%) | 2,439 (6.1%) |
| 35 to 39 Years | 2,512 (6.2%) | 2,048 (5.1%) |
| 40 to 44 Years | 2,523 (6.3%) | 2,530 (6.3%) |
| 45 to 49 Years | 2,211 (5.5%) | 2,167 (5.4%) |
| 50 to 54 Years | 2,446 (6.1%) | 2,411 (6.0%) |
| 55 to 59 Years | 2,430 (6.0%) | 2,491 (6.2%) |
| 60 to 64 Years | 3,029 (7.5%) | 3,000 (7.5%) |
| 65 to 69 Years | 2,152 (5.3%) | 2,419 (6.0%) |
| 70 to 74 Years | 1,973 (4.9%) | 1,830 (4.6%) |
| 75 to 79 Years | 1,271 (3.2%) | 1,383 (3.4%) |
| 80 to 84 Years | 568 (1.4%) | 971 (2.4%) |
| 85 Years and over | 505 (1.3%) | 893 (2.2%) |
| Total | 40,282 (100.0%) | 40,160 (100.0%) |
Families and Households in Kosciusko County
Median Family Size in Kosciusko County
The median family size in Kosciusko County is 3.07 persons per family, with married-couple families (16,221 | 77.7%) accounting for the largest median family size of 3.09 persons per family. On the other hand, single male/father families (1,761 | 8.4%) represent the smallest median family size with 2.80 persons per family.
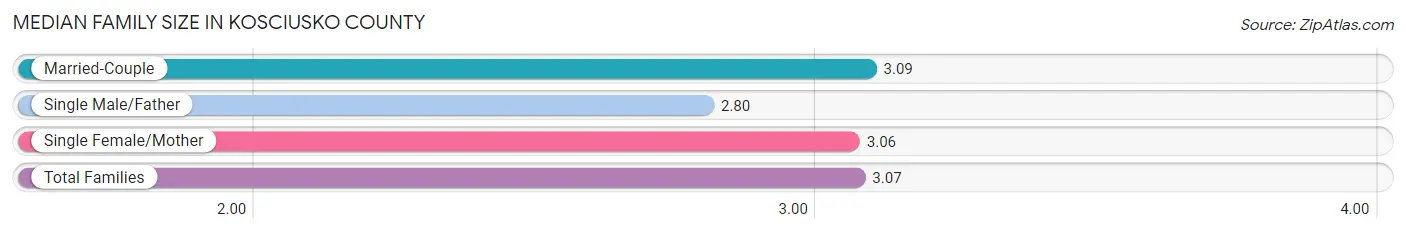
| Family Type | # Families | Family Size |
| Married-Couple | 16,221 (77.7%) | 3.09 |
| Single Male/Father | 1,761 (8.4%) | 2.80 |
| Single Female/Mother | 2,901 (13.9%) | 3.06 |
| Total Families | 20,883 (100.0%) | 3.07 |
Median Household Size in Kosciusko County
The median household size in Kosciusko County is 2.52 persons per household, with single male/father households (1,761 | 5.6%) accounting for the largest median household size of 3.34 persons per household. non-family households (10,442 | 33.3%) represent the smallest median household size with 1.23 persons per household.
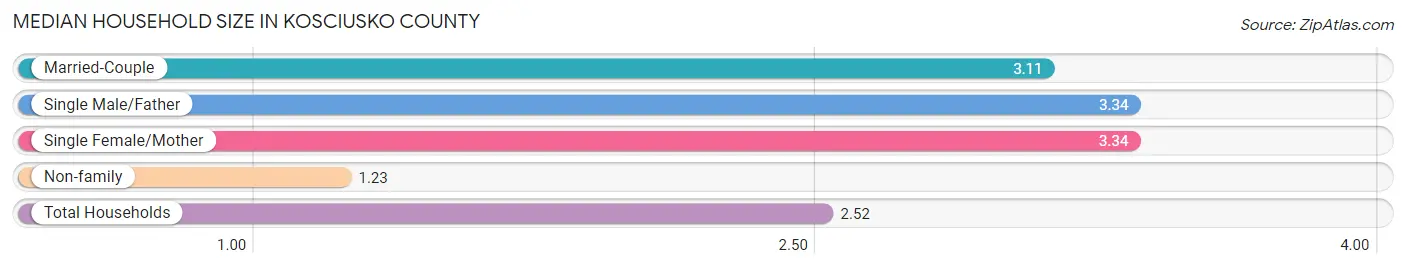
| Household Type | # Households | Household Size |
| Married-Couple | 16,221 (51.8%) | 3.11 |
| Single Male/Father | 1,761 (5.6%) | 3.34 |
| Single Female/Mother | 2,901 (9.3%) | 3.34 |
| Non-family | 10,442 (33.3%) | 1.23 |
| Total Households | 31,325 (100.0%) | 2.52 |
Household Size by Marriage Status in Kosciusko County
Out of a total of 31,325 households in Kosciusko County, 20,883 (66.7%) are family households, while 10,442 (33.3%) are nonfamily households. The most numerous type of family households are 2-person households, comprising 10,078, and the most common type of nonfamily households are 1-person households, comprising 8,543.
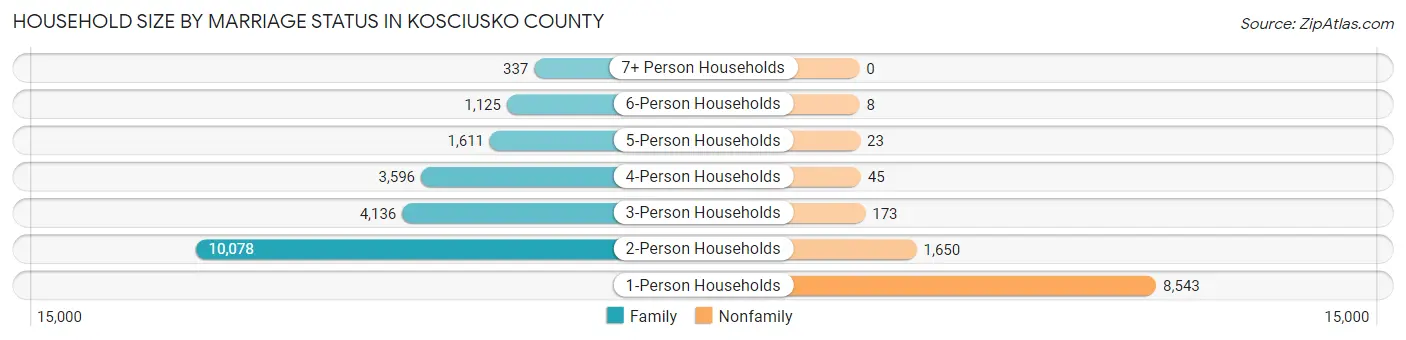
| Household Size | Family Households | Nonfamily Households |
| 1-Person Households | - | 8,543 (27.3%) |
| 2-Person Households | 10,078 (32.2%) | 1,650 (5.3%) |
| 3-Person Households | 4,136 (13.2%) | 173 (0.5%) |
| 4-Person Households | 3,596 (11.5%) | 45 (0.1%) |
| 5-Person Households | 1,611 (5.1%) | 23 (0.1%) |
| 6-Person Households | 1,125 (3.6%) | 8 (0.0%) |
| 7+ Person Households | 337 (1.1%) | 0 (0.0%) |
| Total | 20,883 (66.7%) | 10,442 (33.3%) |
Female Fertility in Kosciusko County
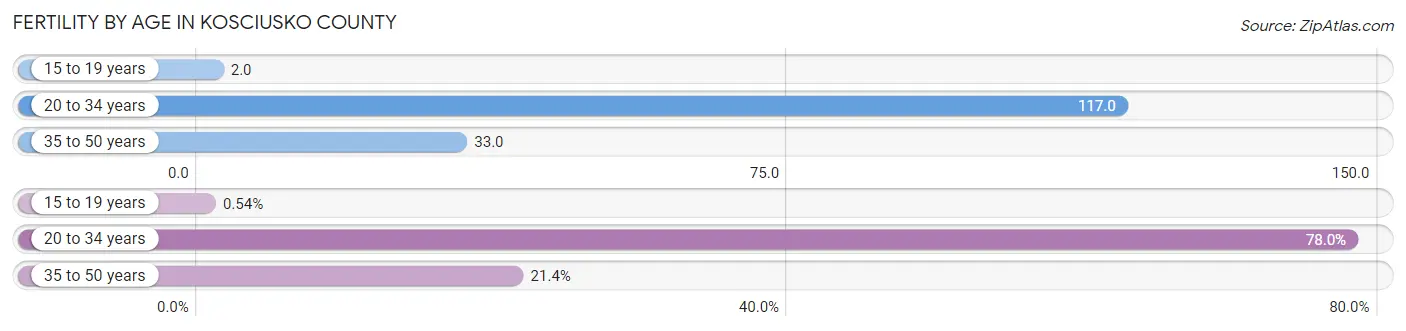
Fertility by Age in Kosciusko County
Average fertility rate in Kosciusko County is 63.0 births per 1,000 women. Women in the age bracket of 20 to 34 years have the highest fertility rate with 117.0 births per 1,000 women. Women in the age bracket of 20 to 34 years acount for 78.0% of all women with births.
| Age Bracket | Women with Births | Births / 1,000 Women |
| 15 to 19 years | 6 (0.5%) | 2.0 |
| 20 to 34 years | 867 (78.0%) | 117.0 |
| 35 to 50 years | 238 (21.4%) | 33.0 |
| Total | 1,111 (100.0%) | 63.0 |
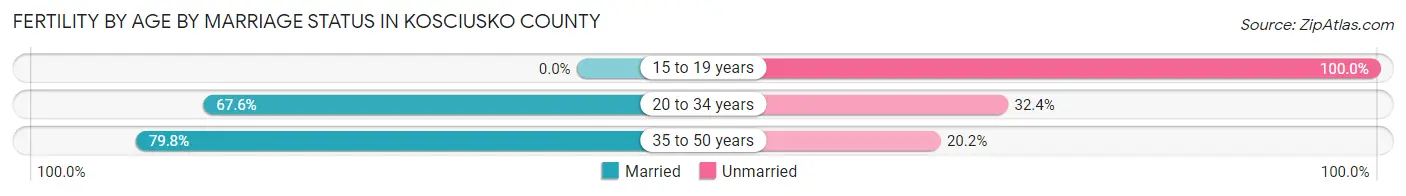
Fertility by Age by Marriage Status in Kosciusko County
69.8% of women with births (1,111) in Kosciusko County are married. The highest percentage of unmarried women with births falls into 15 to 19 years age bracket with 100.0% of them unmarried at the time of birth, while the lowest percentage of unmarried women with births belong to 35 to 50 years age bracket with 20.2% of them unmarried.
| Age Bracket | Married | Unmarried |
| 15 to 19 years | 0 (0.0%) | 6 (100.0%) |
| 20 to 34 years | 586 (67.6%) | 281 (32.4%) |
| 35 to 50 years | 190 (79.8%) | 48 (20.2%) |
| Total | 775 (69.8%) | 336 (30.2%) |
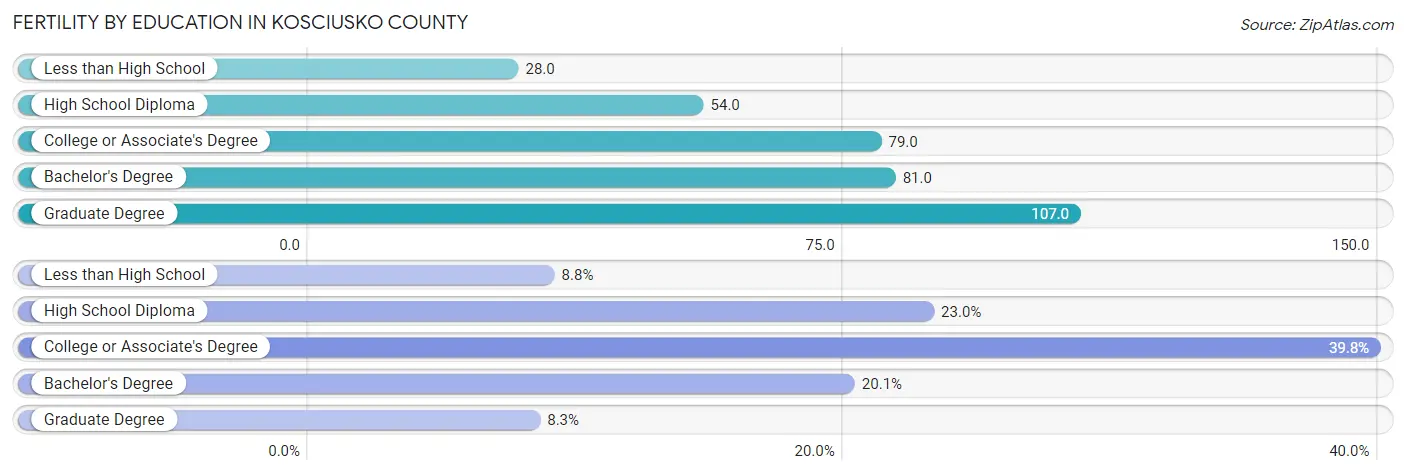
Fertility by Education in Kosciusko County
Average fertility rate in Kosciusko County is 63.0 births per 1,000 women. Women with the education attainment of graduate degree have the highest fertility rate of 107.0 births per 1,000 women, while women with the education attainment of less than high school have the lowest fertility at 28.0 births per 1,000 women. Women with the education attainment of college or associate's degree represent 39.8% of all women with births.
| Educational Attainment | Women with Births | Births / 1,000 Women |
| Less than High School | 98 (8.8%) | 28.0 |
| High School Diploma | 256 (23.0%) | 54.0 |
| College or Associate's Degree | 442 (39.8%) | 79.0 |
| Bachelor's Degree | 223 (20.1%) | 81.0 |
| Graduate Degree | 92 (8.3%) | 107.0 |
| Total | 1,111 (100.0%) | 63.0 |
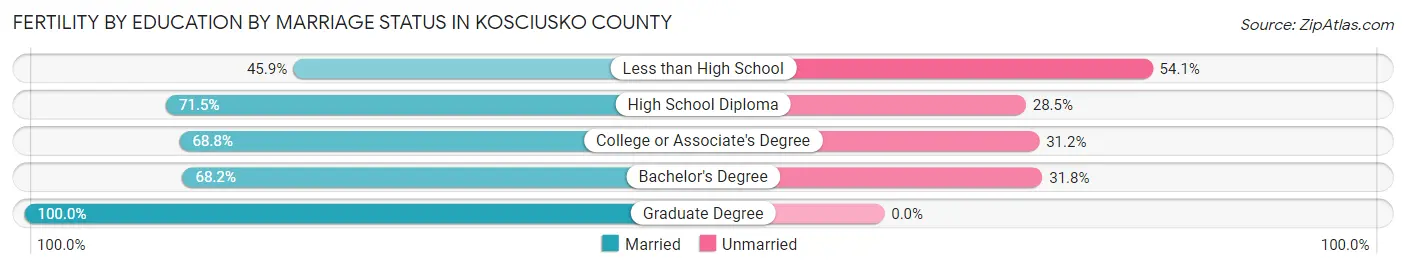
Fertility by Education by Marriage Status in Kosciusko County
30.2% of women with births in Kosciusko County are unmarried. Women with the educational attainment of graduate degree are most likely to be married with 100.0% of them married at childbirth, while women with the educational attainment of less than high school are least likely to be married with 54.1% of them unmarried at childbirth.
| Educational Attainment | Married | Unmarried |
| Less than High School | 45 (45.9%) | 53 (54.1%) |
| High School Diploma | 183 (71.5%) | 73 (28.5%) |
| College or Associate's Degree | 304 (68.8%) | 138 (31.2%) |
| Bachelor's Degree | 152 (68.2%) | 71 (31.8%) |
| Graduate Degree | 92 (100.0%) | 0 (0.0%) |
| Total | 775 (69.8%) | 336 (30.2%) |
Income in Kosciusko County
Income Overview in Kosciusko County
Per Capita Income in Kosciusko County is $35,297, while median incomes of families and households are $87,637 and $70,945 respectively.
| Characteristic | Number | Measure |
| Per Capita Income | 80,442 | $35,297 |
| Median Family Income | 20,883 | $87,637 |
| Mean Family Income | 20,883 | $104,194 |
| Median Household Income | 31,325 | $70,945 |
| Mean Household Income | 31,325 | $88,194 |
| Income Deficit | 20,883 | $10,130 |
| Wage / Income Gap (%) | 80,442 | 43.49% |
| Wage / Income Gap ($) | 80,442 | 56.51¢ per $1 |
| Gini / Inequality Index | 80,442 | 0.41 |
Earnings by Sex in Kosciusko County
Average Earnings in Kosciusko County are $40,436, $52,497 for men and $29,668 for women, a difference of 43.5%.
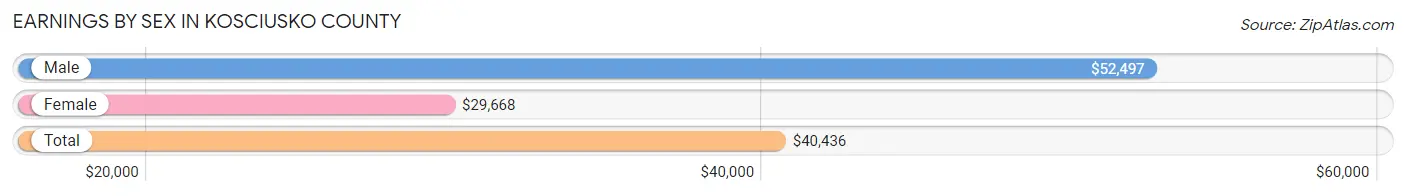
| Sex | Number | Average Earnings |
| Male | 24,209 (54.3%) | $52,497 |
| Female | 20,370 (45.7%) | $29,668 |
| Total | 44,579 (100.0%) | $40,436 |
Earnings by Sex by Income Bracket in Kosciusko County
The most common earnings brackets in Kosciusko County are $75,000 to $99,999 for men (3,408 | 14.1%) and $25,000 to $29,999 for women (1,623 | 8.0%).
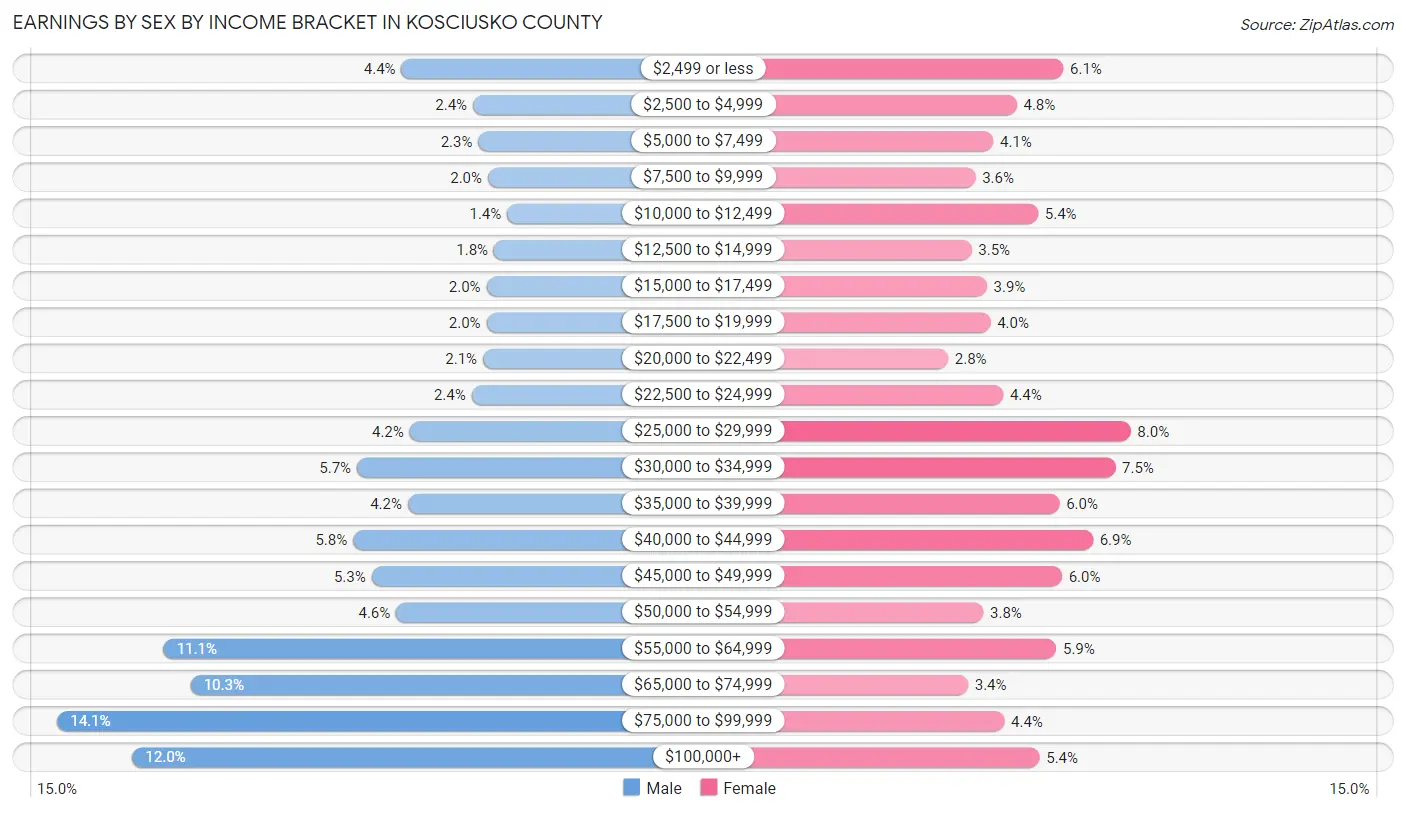
| Income | Male | Female |
| $2,499 or less | 1,067 (4.4%) | 1,238 (6.1%) |
| $2,500 to $4,999 | 582 (2.4%) | 972 (4.8%) |
| $5,000 to $7,499 | 544 (2.2%) | 838 (4.1%) |
| $7,500 to $9,999 | 480 (2.0%) | 735 (3.6%) |
| $10,000 to $12,499 | 349 (1.4%) | 1,093 (5.4%) |
| $12,500 to $14,999 | 438 (1.8%) | 713 (3.5%) |
| $15,000 to $17,499 | 488 (2.0%) | 800 (3.9%) |
| $17,500 to $19,999 | 490 (2.0%) | 820 (4.0%) |
| $20,000 to $22,499 | 513 (2.1%) | 579 (2.8%) |
| $22,500 to $24,999 | 591 (2.4%) | 895 (4.4%) |
| $25,000 to $29,999 | 1,012 (4.2%) | 1,623 (8.0%) |
| $30,000 to $34,999 | 1,371 (5.7%) | 1,536 (7.5%) |
| $35,000 to $39,999 | 1,024 (4.2%) | 1,217 (6.0%) |
| $40,000 to $44,999 | 1,396 (5.8%) | 1,407 (6.9%) |
| $45,000 to $49,999 | 1,271 (5.2%) | 1,231 (6.0%) |
| $50,000 to $54,999 | 1,103 (4.6%) | 781 (3.8%) |
| $55,000 to $64,999 | 2,685 (11.1%) | 1,197 (5.9%) |
| $65,000 to $74,999 | 2,500 (10.3%) | 692 (3.4%) |
| $75,000 to $99,999 | 3,408 (14.1%) | 901 (4.4%) |
| $100,000+ | 2,897 (12.0%) | 1,102 (5.4%) |
| Total | 24,209 (100.0%) | 20,370 (100.0%) |
Earnings by Sex by Educational Attainment in Kosciusko County
Average earnings in Kosciusko County are $57,793 for men and $33,997 for women, a difference of 41.2%. Men with an educational attainment of graduate degree enjoy the highest average annual earnings of $75,951, while those with less than high school education earn the least with $46,620. Women with an educational attainment of graduate degree earn the most with the average annual earnings of $56,550, while those with less than high school education have the smallest earnings of $28,072.
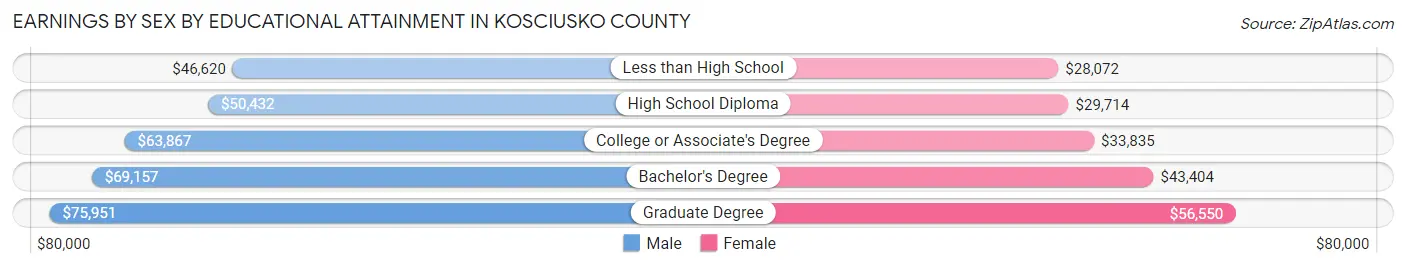
| Educational Attainment | Male Income | Female Income |
| Less than High School | $46,620 | $28,072 |
| High School Diploma | $50,432 | $29,714 |
| College or Associate's Degree | $63,867 | $33,835 |
| Bachelor's Degree | $69,157 | $43,404 |
| Graduate Degree | $75,951 | $56,550 |
| Total | $57,793 | $33,997 |
Family Income in Kosciusko County
Family Income Brackets in Kosciusko County
According to the Kosciusko County family income data, there are 5,054 families falling into the $100,000 to $149,999 income range, which is the most common income bracket and makes up 24.2% of all families. Conversely, the $10,000 to $14,999 income bracket is the least frequent group with only 271 families (1.3%) belonging to this category.
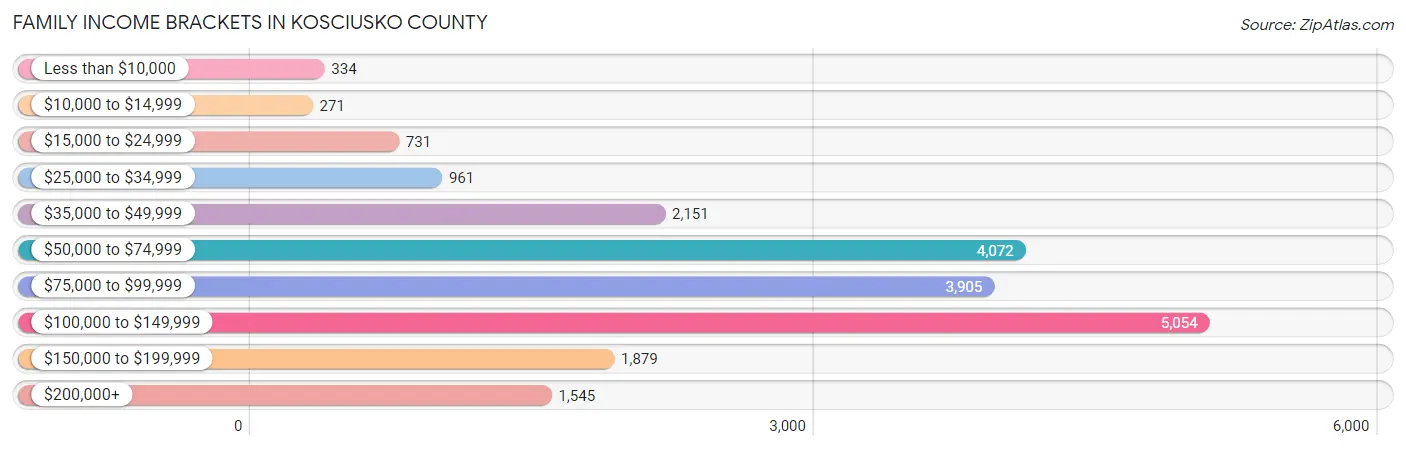
| Income Bracket | # Families | % Families |
| Less than $10,000 | 334 | 1.6% |
| $10,000 to $14,999 | 271 | 1.3% |
| $15,000 to $24,999 | 731 | 3.5% |
| $25,000 to $34,999 | 961 | 4.6% |
| $35,000 to $49,999 | 2,151 | 10.3% |
| $50,000 to $74,999 | 4,072 | 19.5% |
| $75,000 to $99,999 | 3,905 | 18.7% |
| $100,000 to $149,999 | 5,054 | 24.2% |
| $150,000 to $199,999 | 1,879 | 9.0% |
| $200,000+ | 1,545 | 7.4% |
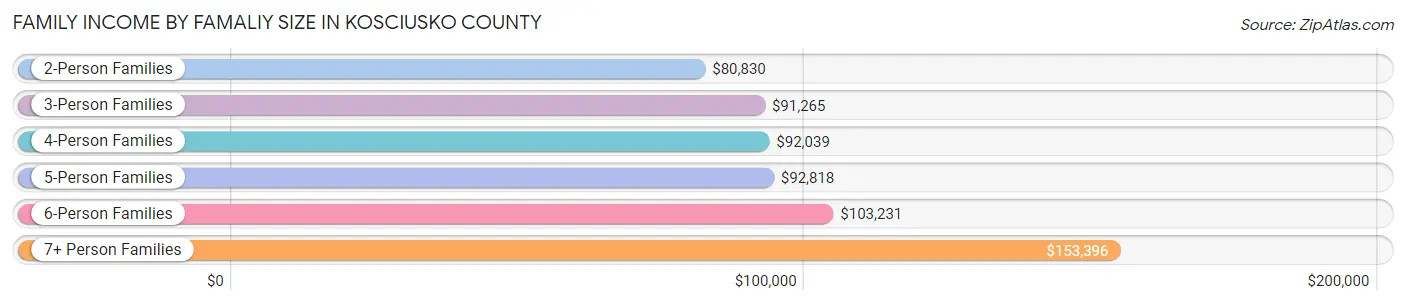
Family Income by Famaliy Size in Kosciusko County
7+ person families (273 | 1.3%) account for the highest median family income in Kosciusko County with $153,396 per family, while 2-person families (10,690 | 51.2%) have the highest median income of $40,415 per family member.
| Income Bracket | # Families | Median Income |
| 2-Person Families | 10,690 (51.2%) | $80,830 |
| 3-Person Families | 4,297 (20.6%) | $91,265 |
| 4-Person Families | 3,262 (15.6%) | $92,039 |
| 5-Person Families | 1,257 (6.0%) | $92,818 |
| 6-Person Families | 1,104 (5.3%) | $103,231 |
| 7+ Person Families | 273 (1.3%) | $153,396 |
| Total | 20,883 (100.0%) | $87,637 |
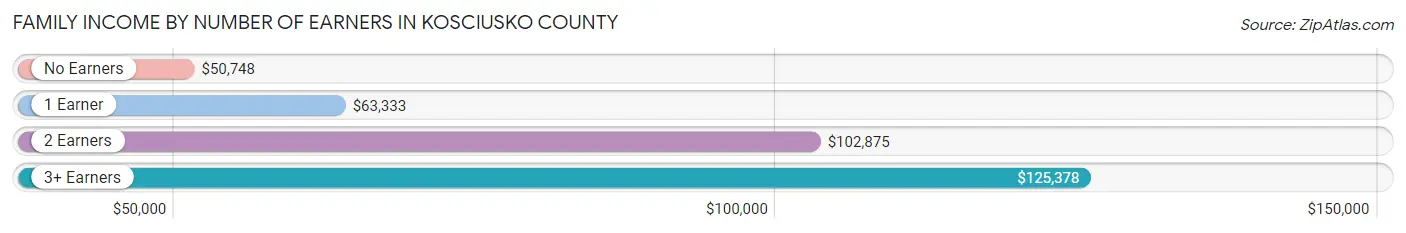
Family Income by Number of Earners in Kosciusko County
The median family income in Kosciusko County is $87,637, with families comprising 3+ earners (2,476) having the highest median family income of $125,378, while families with no earners (2,784) have the lowest median family income of $50,748, accounting for 11.9% and 13.3% of families, respectively.
| Number of Earners | # Families | Median Income |
| No Earners | 2,784 (13.3%) | $50,748 |
| 1 Earner | 6,578 (31.5%) | $63,333 |
| 2 Earners | 9,045 (43.3%) | $102,875 |
| 3+ Earners | 2,476 (11.9%) | $125,378 |
| Total | 20,883 (100.0%) | $87,637 |
Household Income in Kosciusko County
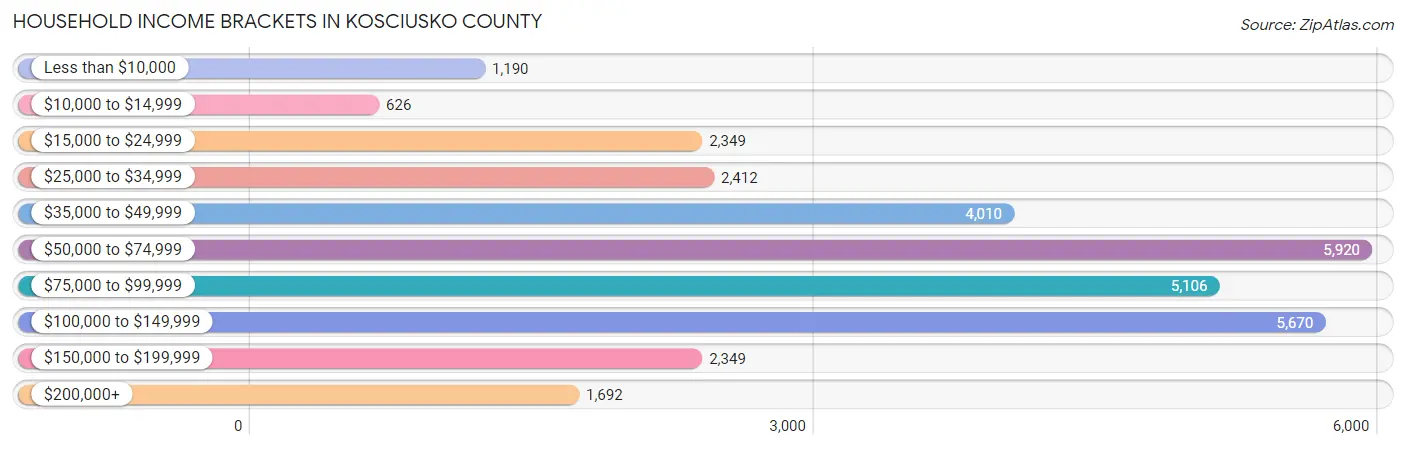
Household Income Brackets in Kosciusko County
With 5,920 households falling in the category, the $50,000 to $74,999 income range is the most frequent in Kosciusko County, accounting for 18.9% of all households. In contrast, only 626 households (2.0%) fall into the $10,000 to $14,999 income bracket, making it the least populous group.
| Income Bracket | # Households | % Households |
| Less than $10,000 | 1,190 | 3.8% |
| $10,000 to $14,999 | 626 | 2.0% |
| $15,000 to $24,999 | 2,349 | 7.5% |
| $25,000 to $34,999 | 2,412 | 7.7% |
| $35,000 to $49,999 | 4,010 | 12.8% |
| $50,000 to $74,999 | 5,920 | 18.9% |
| $75,000 to $99,999 | 5,106 | 16.3% |
| $100,000 to $149,999 | 5,670 | 18.1% |
| $150,000 to $199,999 | 2,349 | 7.5% |
| $200,000+ | 1,692 | 5.4% |
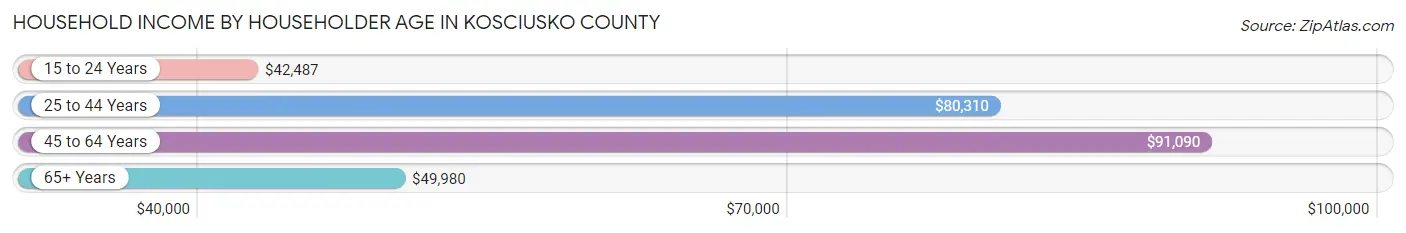
Household Income by Householder Age in Kosciusko County
The median household income in Kosciusko County is $70,945, with the highest median household income of $91,090 found in the 45 to 64 years age bracket for the primary householder. A total of 11,294 households (36.0%) fall into this category. Meanwhile, the 15 to 24 years age bracket for the primary householder has the lowest median household income of $42,487, with 1,609 households (5.1%) in this group.
| Income Bracket | # Households | Median Income |
| 15 to 24 Years | 1,609 (5.1%) | $42,487 |
| 25 to 44 Years | 9,746 (31.1%) | $80,310 |
| 45 to 64 Years | 11,294 (36.0%) | $91,090 |
| 65+ Years | 8,676 (27.7%) | $49,980 |
| Total | 31,325 (100.0%) | $70,945 |
Poverty in Kosciusko County
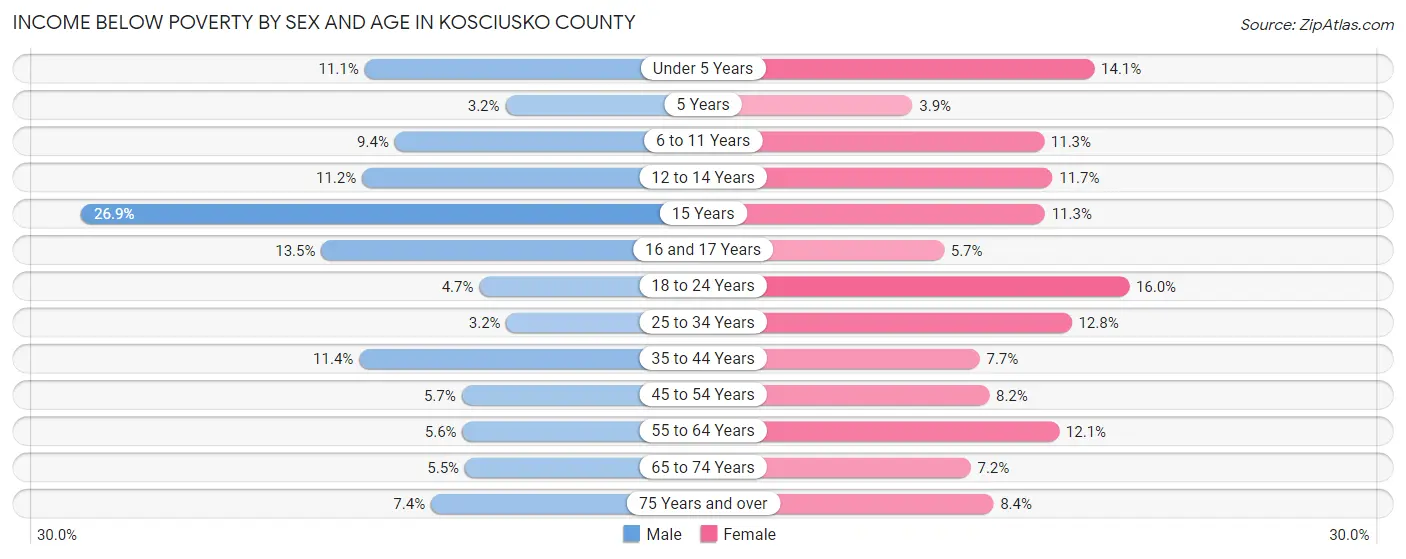
Income Below Poverty by Sex and Age in Kosciusko County
With 7.4% poverty level for males and 10.4% for females among the residents of Kosciusko County, 15 year old males and 18 to 24 year old females are the most vulnerable to poverty, with 120 males (26.9%) and 514 females (16.0%) in their respective age groups living below the poverty level.
| Age Bracket | Male | Female |
| Under 5 Years | 268 (11.1%) | 344 (14.1%) |
| 5 Years | 10 (3.2%) | 17 (3.9%) |
| 6 to 11 Years | 285 (9.4%) | 351 (11.3%) |
| 12 to 14 Years | 230 (11.2%) | 181 (11.7%) |
| 15 Years | 120 (26.9%) | 39 (11.3%) |
| 16 and 17 Years | 161 (13.5%) | 77 (5.7%) |
| 18 to 24 Years | 167 (4.7%) | 514 (16.0%) |
| 25 to 34 Years | 165 (3.2%) | 628 (12.8%) |
| 35 to 44 Years | 565 (11.4%) | 351 (7.7%) |
| 45 to 54 Years | 262 (5.7%) | 375 (8.2%) |
| 55 to 64 Years | 306 (5.6%) | 658 (12.1%) |
| 65 to 74 Years | 224 (5.5%) | 304 (7.2%) |
| 75 Years and over | 167 (7.4%) | 254 (8.4%) |
| Total | 2,930 (7.4%) | 4,093 (10.4%) |
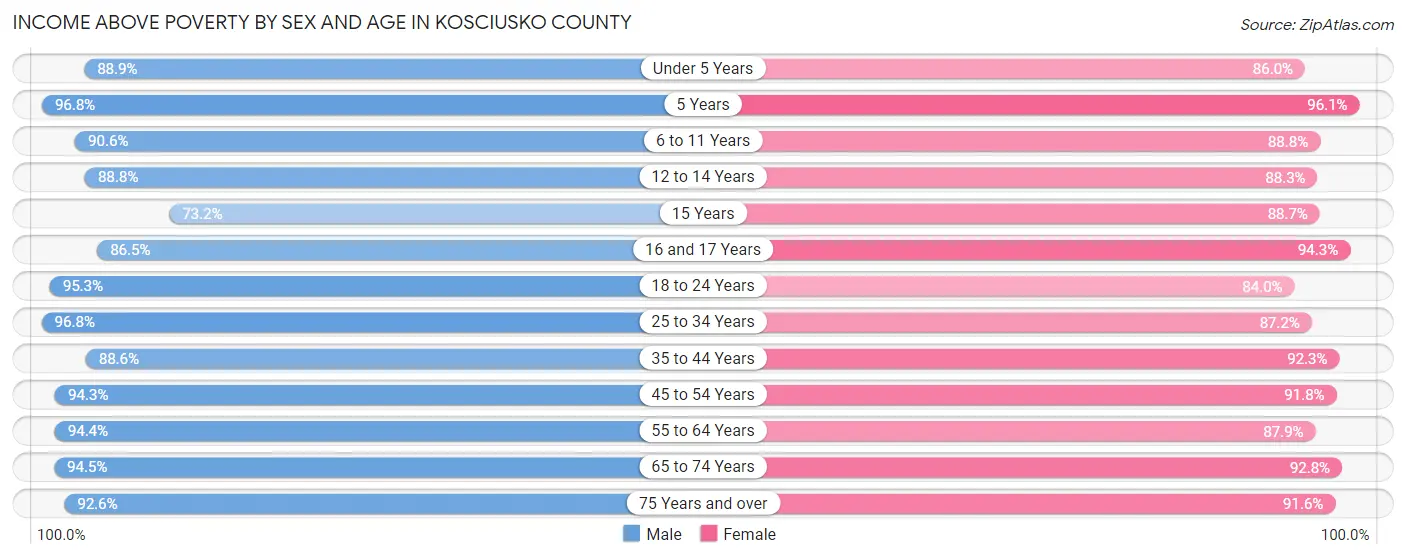
Income Above Poverty by Sex and Age in Kosciusko County
According to the poverty statistics in Kosciusko County, males aged 25 to 34 years and females aged 5 years are the age groups that are most secure financially, with 96.8% of males and 96.1% of females in these age groups living above the poverty line.
| Age Bracket | Male | Female |
| Under 5 Years | 2,152 (88.9%) | 2,105 (86.0%) |
| 5 Years | 300 (96.8%) | 416 (96.1%) |
| 6 to 11 Years | 2,751 (90.6%) | 2,768 (88.7%) |
| 12 to 14 Years | 1,822 (88.8%) | 1,363 (88.3%) |
| 15 Years | 327 (73.2%) | 306 (88.7%) |
| 16 and 17 Years | 1,033 (86.5%) | 1,279 (94.3%) |
| 18 to 24 Years | 3,405 (95.3%) | 2,700 (84.0%) |
| 25 to 34 Years | 5,043 (96.8%) | 4,284 (87.2%) |
| 35 to 44 Years | 4,403 (88.6%) | 4,227 (92.3%) |
| 45 to 54 Years | 4,356 (94.3%) | 4,196 (91.8%) |
| 55 to 64 Years | 5,140 (94.4%) | 4,784 (87.9%) |
| 65 to 74 Years | 3,860 (94.5%) | 3,934 (92.8%) |
| 75 Years and over | 2,099 (92.6%) | 2,758 (91.6%) |
| Total | 36,691 (92.6%) | 35,120 (89.6%) |
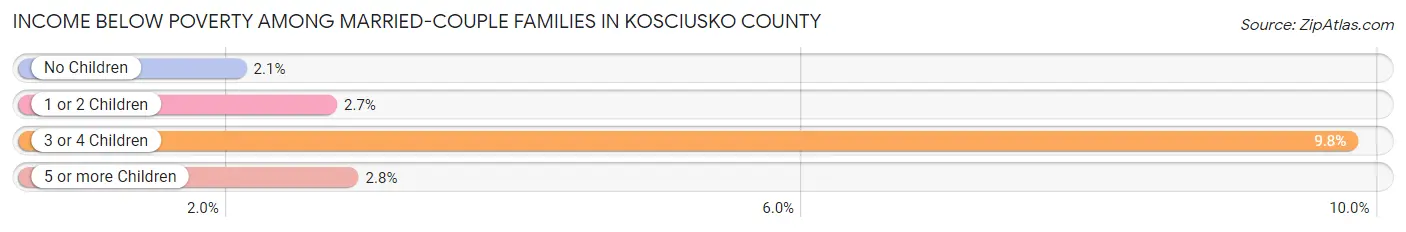
Income Below Poverty Among Married-Couple Families in Kosciusko County
The poverty statistics for married-couple families in Kosciusko County show that 3.0% or 494 of the total 16,221 families live below the poverty line. Families with 3 or 4 children have the highest poverty rate of 9.8%, comprising of 168 families. On the other hand, families with no children have the lowest poverty rate of 2.1%, which includes 211 families.
| Children | Above Poverty | Below Poverty |
| No Children | 10,035 (97.9%) | 211 (2.1%) |
| 1 or 2 Children | 3,975 (97.3%) | 110 (2.7%) |
| 3 or 4 Children | 1,546 (90.2%) | 168 (9.8%) |
| 5 or more Children | 171 (97.2%) | 5 (2.8%) |
| Total | 15,727 (97.0%) | 494 (3.0%) |
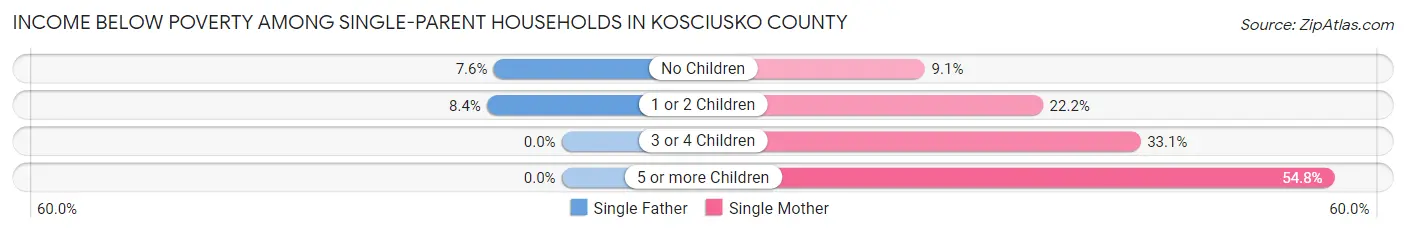
Income Below Poverty Among Single-Parent Households in Kosciusko County
According to the poverty data in Kosciusko County, 7.4% or 130 single-father households and 20.2% or 587 single-mother households are living below the poverty line. Among single-father households, those with 1 or 2 children have the highest poverty rate, with 80 households (8.4%) experiencing poverty. Likewise, among single-mother households, those with 5 or more children have the highest poverty rate, with 17 households (54.8%) falling below the poverty line.
| Children | Single Father | Single Mother |
| No Children | 50 (7.6%) | 73 (9.0%) |
| 1 or 2 Children | 80 (8.4%) | 381 (22.2%) |
| 3 or 4 Children | 0 (0.0%) | 116 (33.1%) |
| 5 or more Children | 0 (0.0%) | 17 (54.8%) |
| Total | 130 (7.4%) | 587 (20.2%) |
Income Below Poverty Among Married-Couple vs Single-Parent Households in Kosciusko County
The poverty data for Kosciusko County shows that 494 of the married-couple family households (3.0%) and 717 of the single-parent households (15.4%) are living below the poverty level. Within the married-couple family households, those with 3 or 4 children have the highest poverty rate, with 168 households (9.8%) falling below the poverty line. Among the single-parent households, those with 5 or more children have the highest poverty rate, with 17 household (54.8%) living below poverty.
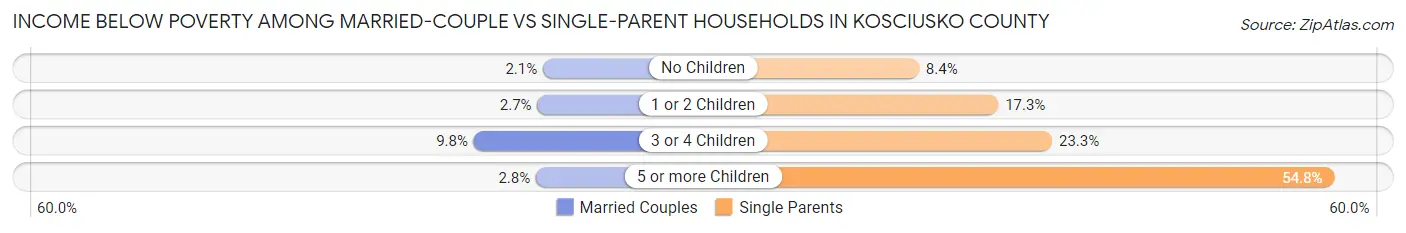
| Children | Married-Couple Families | Single-Parent Households |
| No Children | 211 (2.1%) | 123 (8.4%) |
| 1 or 2 Children | 110 (2.7%) | 461 (17.3%) |
| 3 or 4 Children | 168 (9.8%) | 116 (23.3%) |
| 5 or more Children | 5 (2.8%) | 17 (54.8%) |
| Total | 494 (3.0%) | 717 (15.4%) |
Employment Characteristics in Kosciusko County
Employment by Class of Employer in Kosciusko County
Among the 39,179 employed individuals in Kosciusko County, private company employees (29,565 | 75.5%), not-for-profit organizations (2,858 | 7.3%), and self-employed (not incorporated) (2,272 | 5.8%) make up the most common classes of employment.
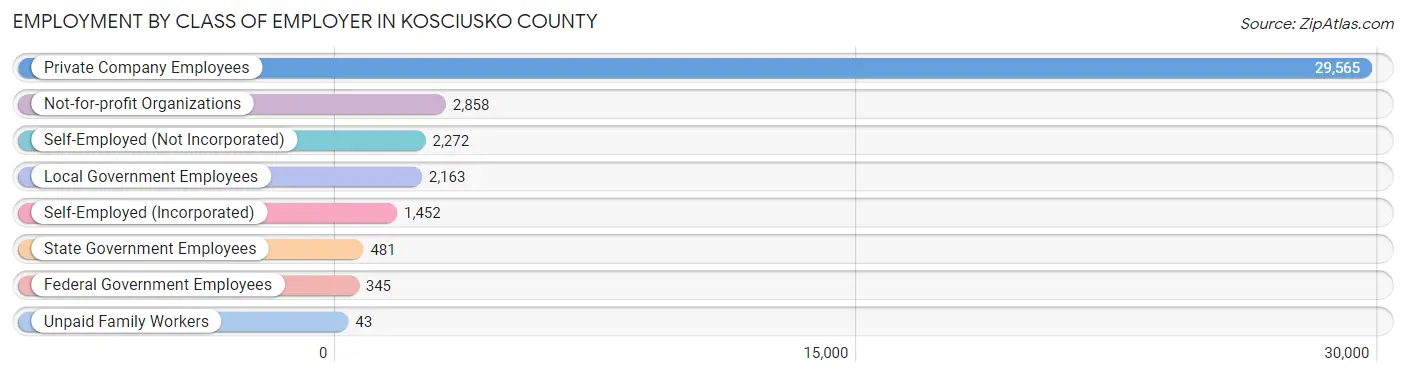
| Employer Class | # Employees | % Employees |
| Private Company Employees | 29,565 | 75.5% |
| Self-Employed (Incorporated) | 1,452 | 3.7% |
| Self-Employed (Not Incorporated) | 2,272 | 5.8% |
| Not-for-profit Organizations | 2,858 | 7.3% |
| Local Government Employees | 2,163 | 5.5% |
| State Government Employees | 481 | 1.2% |
| Federal Government Employees | 345 | 0.9% |
| Unpaid Family Workers | 43 | 0.1% |
| Total | 39,179 | 100.0% |
Employment Status by Age in Kosciusko County
According to the labor force statistics for Kosciusko County, out of the total population over 16 years of age (64,055), 65.8% or 42,148 individuals are in the labor force, with 3.3% or 1,391 of them unemployed. The age group with the highest labor force participation rate is 25 to 29 years, with 87.0% or 4,546 individuals in the labor force. Within the labor force, the 16 to 19 years age range has the highest percentage of unemployed individuals, with 7.8% or 189 of them being unemployed.
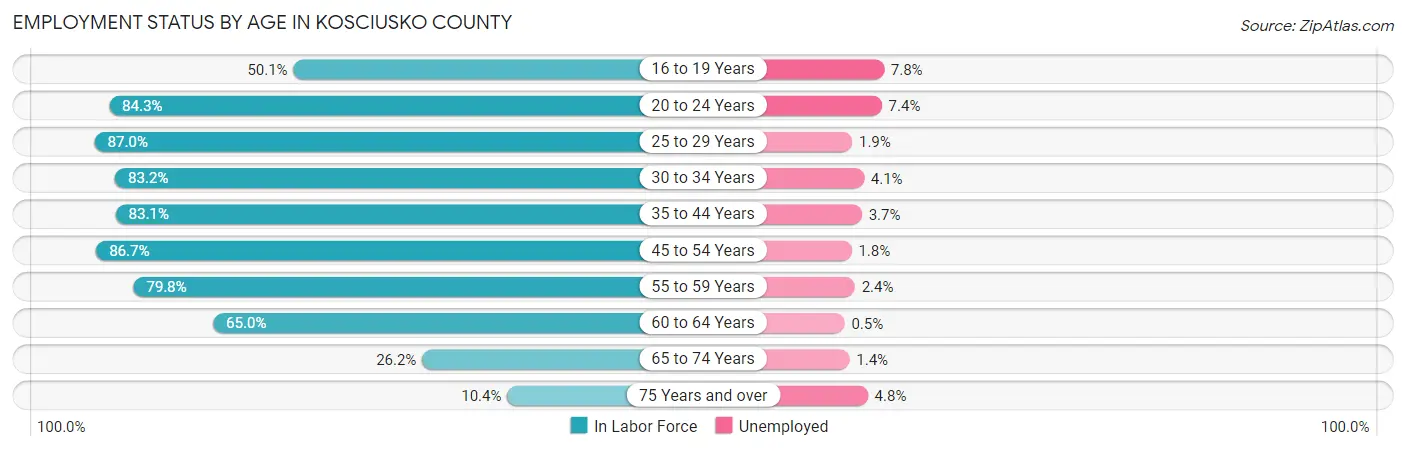
| Age Bracket | In Labor Force | Unemployed |
| 16 to 19 Years | 2,426 (50.1%) | 189 (7.8%) |
| 20 to 24 Years | 4,375 (84.3%) | 324 (7.4%) |
| 25 to 29 Years | 4,546 (87.0%) | 86 (1.9%) |
| 30 to 34 Years | 4,188 (83.2%) | 172 (4.1%) |
| 35 to 44 Years | 7,988 (83.1%) | 296 (3.7%) |
| 45 to 54 Years | 8,007 (86.7%) | 144 (1.8%) |
| 55 to 59 Years | 3,927 (79.8%) | 94 (2.4%) |
| 60 to 64 Years | 3,919 (65.0%) | 20 (0.5%) |
| 65 to 74 Years | 2,194 (26.2%) | 31 (1.4%) |
| 75 Years and over | 581 (10.4%) | 28 (4.8%) |
| Total | 42,148 (65.8%) | 1,391 (3.3%) |
Employment Status by Educational Attainment in Kosciusko County
According to labor force statistics for Kosciusko County, 81.3% of individuals (32,566) out of the total population between 25 and 64 years of age (40,057) are in the labor force, with 2.5% or 814 of them being unemployed. The group with the highest labor force participation rate are those with the educational attainment of bachelor's degree or higher, with 87.8% or 8,657 individuals in the labor force. Within the labor force, individuals with less than high school education have the highest percentage of unemployment, with 6.9% or 229 of them being unemployed.
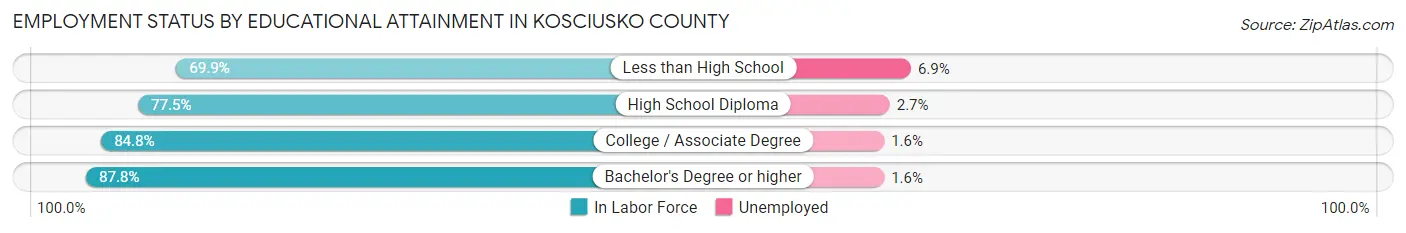
| Educational Attainment | In Labor Force | Unemployed |
| Less than High School | 3,319 (69.9%) | 328 (6.9%) |
| High School Diploma | 10,379 (77.5%) | 362 (2.7%) |
| College / Associate Degree | 10,224 (84.8%) | 193 (1.6%) |
| Bachelor's Degree or higher | 8,657 (87.8%) | 158 (1.6%) |
| Total | 32,566 (81.3%) | 1,001 (2.5%) |
Employment Occupations by Sex in Kosciusko County
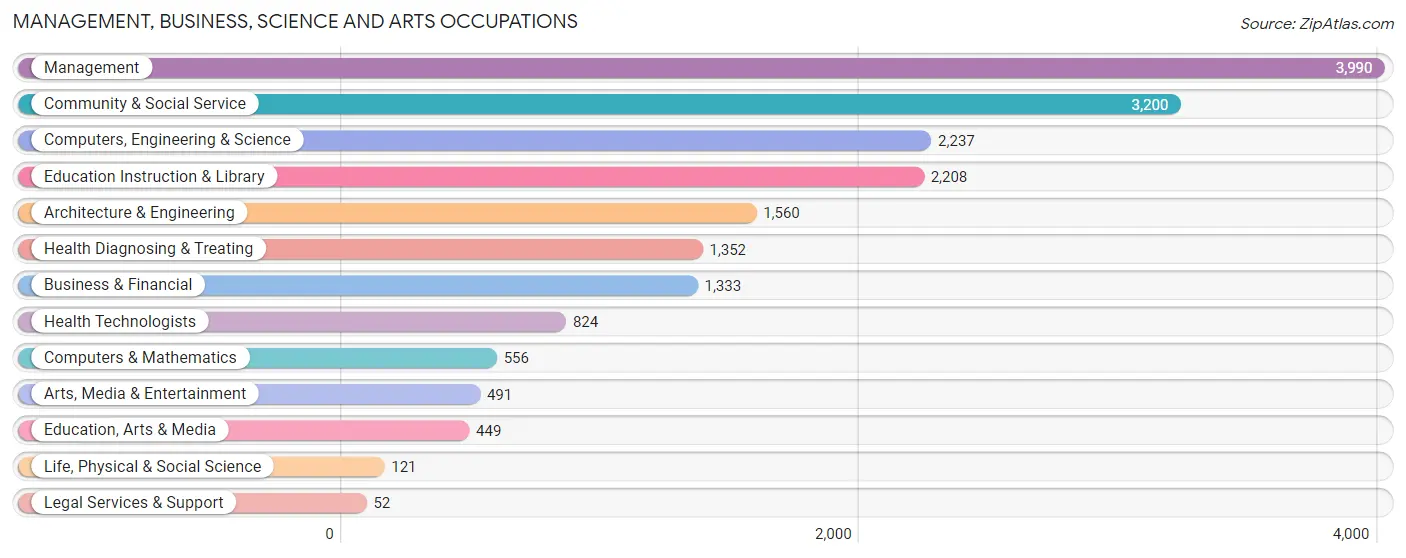
Management, Business, Science and Arts Occupations
The most common Management, Business, Science and Arts occupations in Kosciusko County are Management (3,990 | 9.8%), Community & Social Service (3,200 | 7.9%), Computers, Engineering & Science (2,237 | 5.5%), Education Instruction & Library (2,208 | 5.4%), and Architecture & Engineering (1,560 | 3.8%).
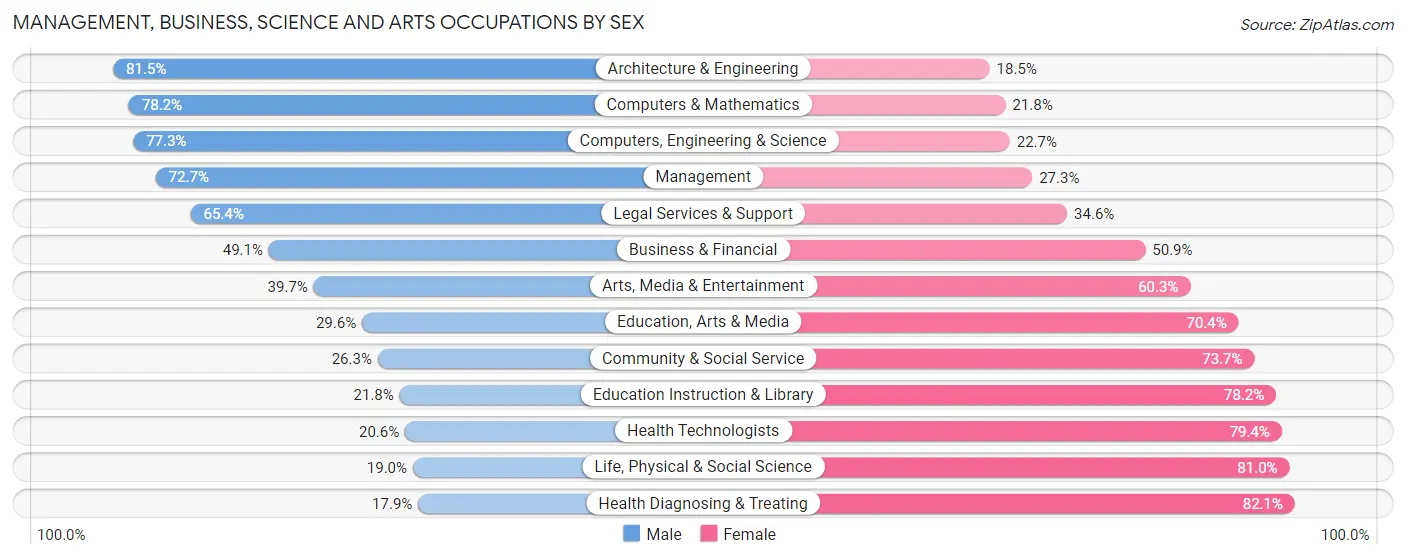
Management, Business, Science and Arts Occupations by Sex
Within the Management, Business, Science and Arts occupations in Kosciusko County, the most male-oriented occupations are Architecture & Engineering (81.5%), Computers & Mathematics (78.2%), and Computers, Engineering & Science (77.3%), while the most female-oriented occupations are Health Diagnosing & Treating (82.1%), Life, Physical & Social Science (81.0%), and Health Technologists (79.4%).
| Occupation | Male | Female |
| Management | 2,899 (72.7%) | 1,091 (27.3%) |
| Business & Financial | 654 (49.1%) | 679 (50.9%) |
| Computers, Engineering & Science | 1,730 (77.3%) | 507 (22.7%) |
| Computers & Mathematics | 435 (78.2%) | 121 (21.8%) |
| Architecture & Engineering | 1,272 (81.5%) | 288 (18.5%) |
| Life, Physical & Social Science | 23 (19.0%) | 98 (81.0%) |
| Community & Social Service | 843 (26.3%) | 2,357 (73.7%) |
| Education, Arts & Media | 133 (29.6%) | 316 (70.4%) |
| Legal Services & Support | 34 (65.4%) | 18 (34.6%) |
| Education Instruction & Library | 481 (21.8%) | 1,727 (78.2%) |
| Arts, Media & Entertainment | 195 (39.7%) | 296 (60.3%) |
| Health Diagnosing & Treating | 242 (17.9%) | 1,110 (82.1%) |
| Health Technologists | 170 (20.6%) | 654 (79.4%) |
| Total (Category) | 6,368 (52.6%) | 5,744 (47.4%) |
| Total (Overall) | 22,225 (54.5%) | 18,523 (45.5%) |
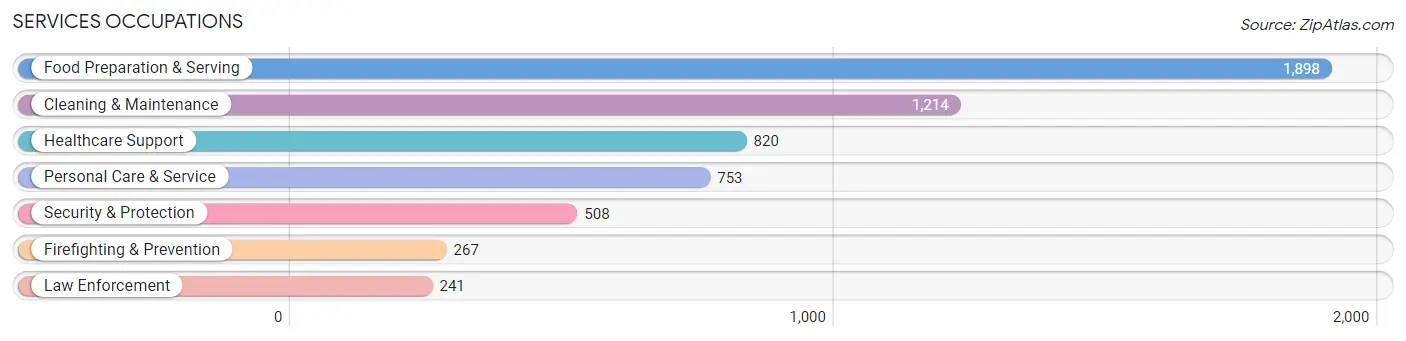
Services Occupations
The most common Services occupations in Kosciusko County are Food Preparation & Serving (1,898 | 4.7%), Cleaning & Maintenance (1,214 | 3.0%), Healthcare Support (820 | 2.0%), Personal Care & Service (753 | 1.8%), and Security & Protection (508 | 1.3%).
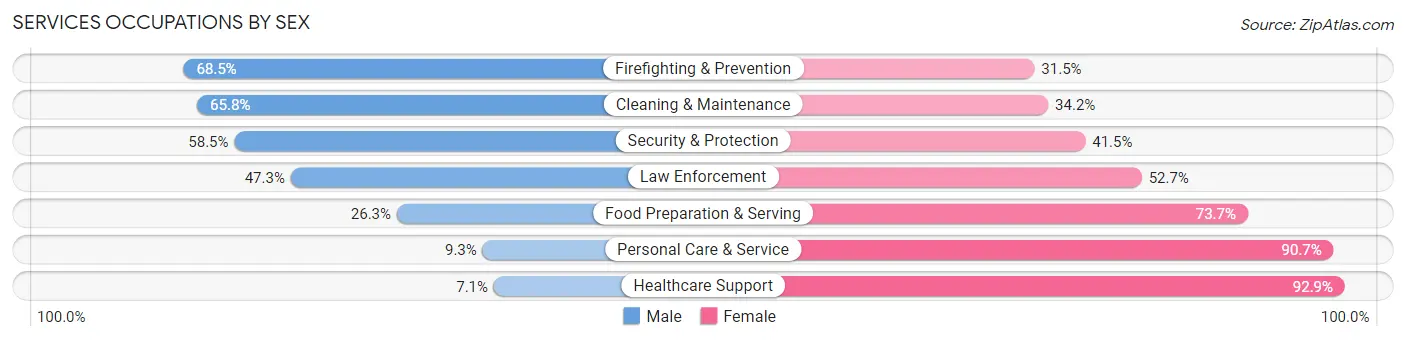
Services Occupations by Sex
Within the Services occupations in Kosciusko County, the most male-oriented occupations are Firefighting & Prevention (68.5%), Cleaning & Maintenance (65.8%), and Security & Protection (58.5%), while the most female-oriented occupations are Healthcare Support (92.9%), Personal Care & Service (90.7%), and Food Preparation & Serving (73.7%).
| Occupation | Male | Female |
| Healthcare Support | 58 (7.1%) | 762 (92.9%) |
| Security & Protection | 297 (58.5%) | 211 (41.5%) |
| Firefighting & Prevention | 183 (68.5%) | 84 (31.5%) |
| Law Enforcement | 114 (47.3%) | 127 (52.7%) |
| Food Preparation & Serving | 499 (26.3%) | 1,399 (73.7%) |
| Cleaning & Maintenance | 799 (65.8%) | 415 (34.2%) |
| Personal Care & Service | 70 (9.3%) | 683 (90.7%) |
| Total (Category) | 1,723 (33.2%) | 3,470 (66.8%) |
| Total (Overall) | 22,225 (54.5%) | 18,523 (45.5%) |
Sales and Office Occupations
The most common Sales and Office occupations in Kosciusko County are Office & Administration (4,301 | 10.6%), and Sales & Related (3,022 | 7.4%).

Sales and Office Occupations by Sex
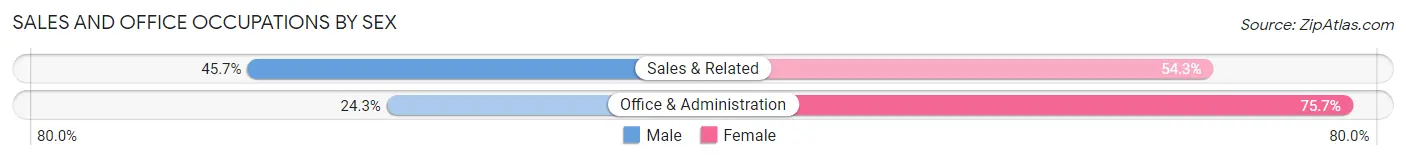
| Occupation | Male | Female |
| Sales & Related | 1,382 (45.7%) | 1,640 (54.3%) |
| Office & Administration | 1,045 (24.3%) | 3,256 (75.7%) |
| Total (Category) | 2,427 (33.1%) | 4,896 (66.9%) |
| Total (Overall) | 22,225 (54.5%) | 18,523 (45.5%) |
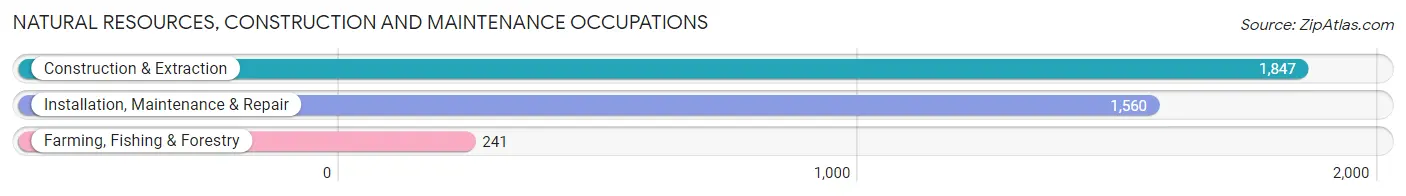
Natural Resources, Construction and Maintenance Occupations
The most common Natural Resources, Construction and Maintenance occupations in Kosciusko County are Construction & Extraction (1,847 | 4.5%), Installation, Maintenance & Repair (1,560 | 3.8%), and Farming, Fishing & Forestry (241 | 0.6%).
Natural Resources, Construction and Maintenance Occupations by Sex
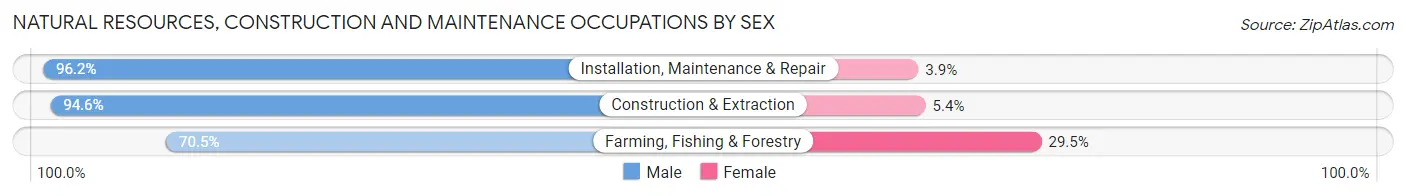
| Occupation | Male | Female |
| Farming, Fishing & Forestry | 170 (70.5%) | 71 (29.5%) |
| Construction & Extraction | 1,748 (94.6%) | 99 (5.4%) |
| Installation, Maintenance & Repair | 1,500 (96.2%) | 60 (3.8%) |
| Total (Category) | 3,418 (93.7%) | 230 (6.3%) |
| Total (Overall) | 22,225 (54.5%) | 18,523 (45.5%) |
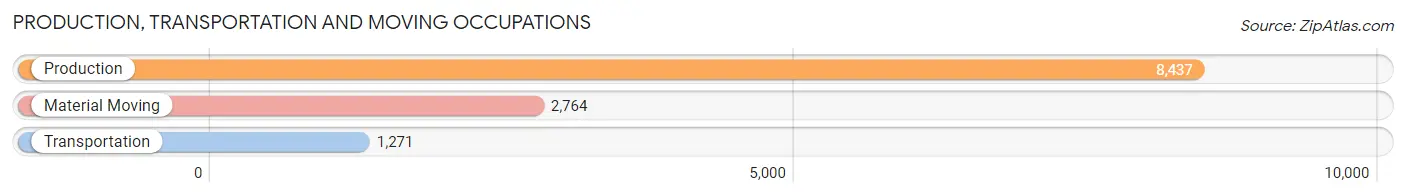
Production, Transportation and Moving Occupations
The most common Production, Transportation and Moving occupations in Kosciusko County are Production (8,437 | 20.7%), Material Moving (2,764 | 6.8%), and Transportation (1,271 | 3.1%).
Production, Transportation and Moving Occupations by Sex
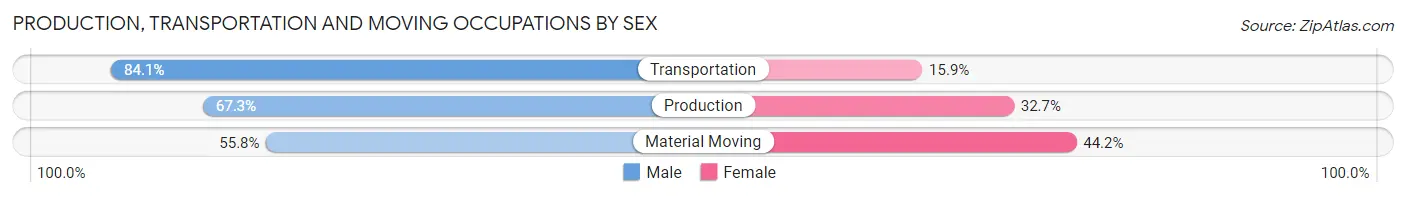
| Occupation | Male | Female |
| Production | 5,677 (67.3%) | 2,760 (32.7%) |
| Transportation | 1,069 (84.1%) | 202 (15.9%) |
| Material Moving | 1,543 (55.8%) | 1,221 (44.2%) |
| Total (Category) | 8,289 (66.5%) | 4,183 (33.5%) |
| Total (Overall) | 22,225 (54.5%) | 18,523 (45.5%) |
Employment Industries by Sex in Kosciusko County
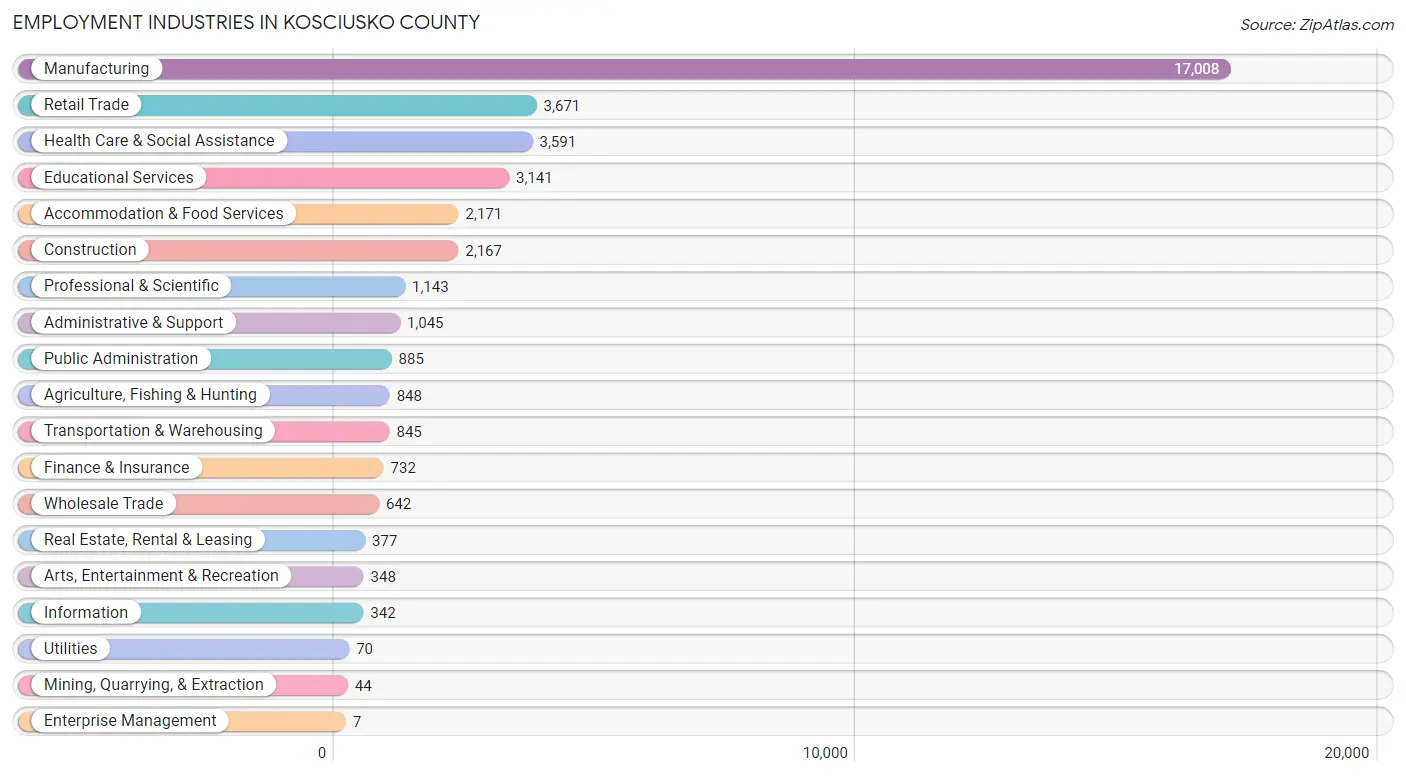
Employment Industries in Kosciusko County
The major employment industries in Kosciusko County include Manufacturing (17,008 | 41.7%), Retail Trade (3,671 | 9.0%), Health Care & Social Assistance (3,591 | 8.8%), Educational Services (3,141 | 7.7%), and Accommodation & Food Services (2,171 | 5.3%).
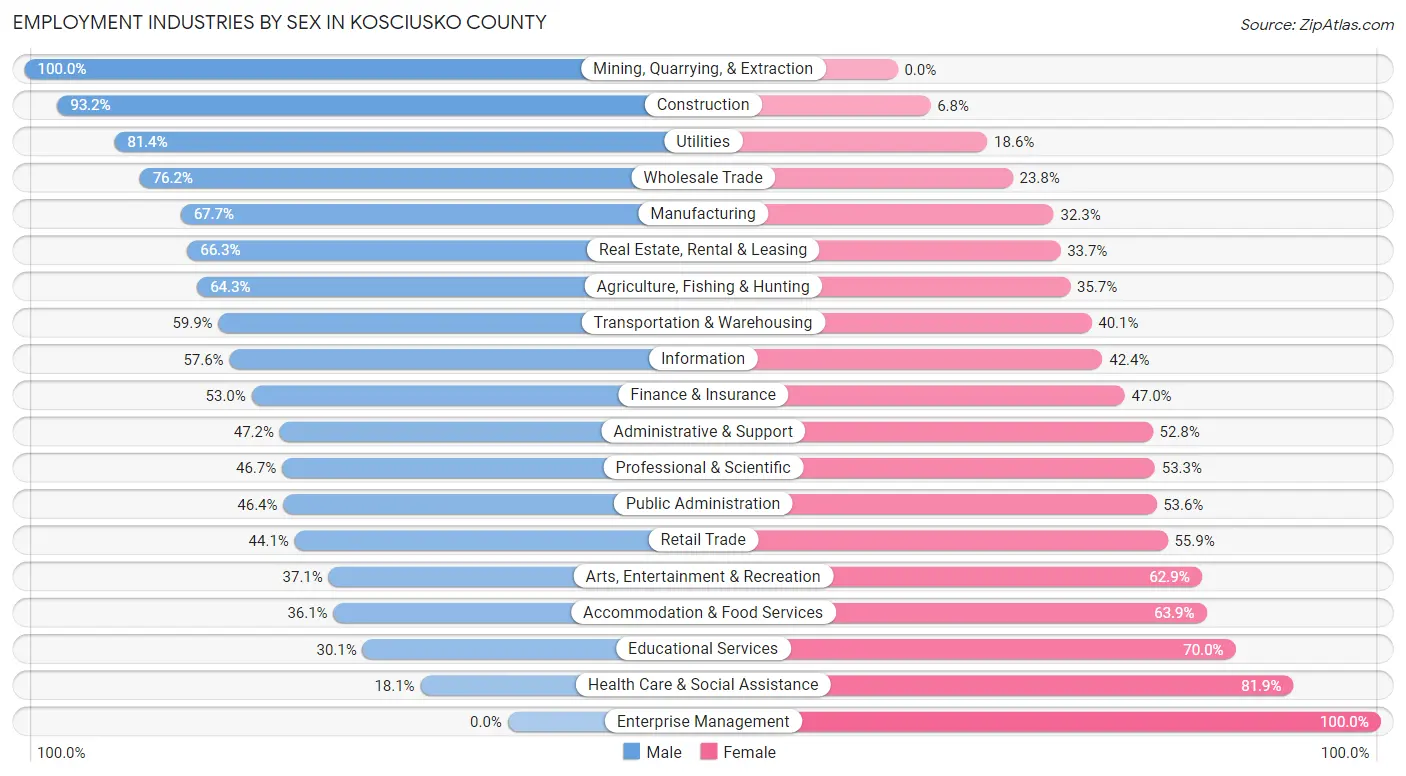
Employment Industries by Sex in Kosciusko County
The Kosciusko County industries that see more men than women are Mining, Quarrying, & Extraction (100.0%), Construction (93.2%), and Utilities (81.4%), whereas the industries that tend to have a higher number of women are Enterprise Management (100.0%), Health Care & Social Assistance (81.9%), and Educational Services (70.0%).
| Industry | Male | Female |
| Agriculture, Fishing & Hunting | 545 (64.3%) | 303 (35.7%) |
| Mining, Quarrying, & Extraction | 44 (100.0%) | 0 (0.0%) |
| Construction | 2,020 (93.2%) | 147 (6.8%) |
| Manufacturing | 11,511 (67.7%) | 5,497 (32.3%) |
| Wholesale Trade | 489 (76.2%) | 153 (23.8%) |
| Retail Trade | 1,619 (44.1%) | 2,052 (55.9%) |
| Transportation & Warehousing | 506 (59.9%) | 339 (40.1%) |
| Utilities | 57 (81.4%) | 13 (18.6%) |
| Information | 197 (57.6%) | 145 (42.4%) |
| Finance & Insurance | 388 (53.0%) | 344 (47.0%) |
| Real Estate, Rental & Leasing | 250 (66.3%) | 127 (33.7%) |
| Professional & Scientific | 534 (46.7%) | 609 (53.3%) |
| Enterprise Management | 0 (0.0%) | 7 (100.0%) |
| Administrative & Support | 493 (47.2%) | 552 (52.8%) |
| Educational Services | 944 (30.0%) | 2,197 (70.0%) |
| Health Care & Social Assistance | 649 (18.1%) | 2,942 (81.9%) |
| Arts, Entertainment & Recreation | 129 (37.1%) | 219 (62.9%) |
| Accommodation & Food Services | 783 (36.1%) | 1,388 (63.9%) |
| Public Administration | 411 (46.4%) | 474 (53.6%) |
| Total | 22,225 (54.5%) | 18,523 (45.5%) |
Education in Kosciusko County
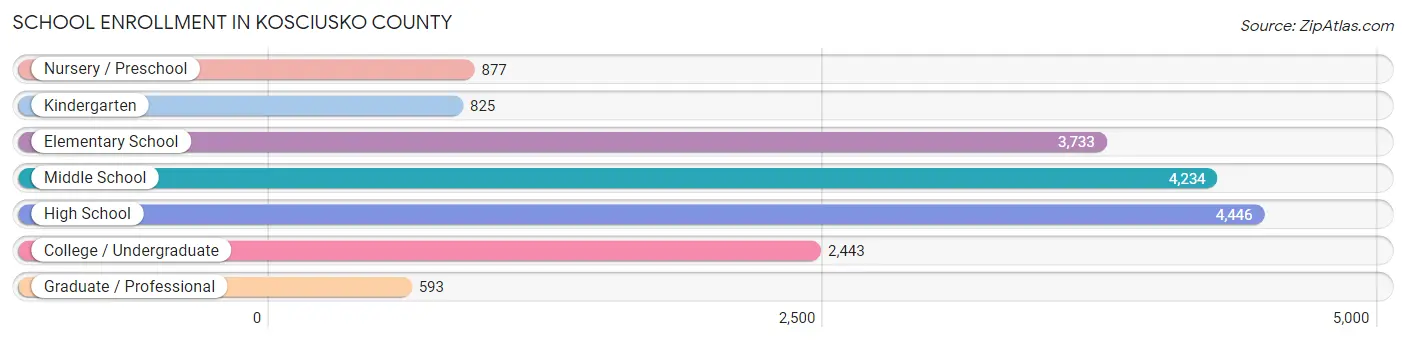
School Enrollment in Kosciusko County
The most common levels of schooling among the 17,151 students in Kosciusko County are high school (4,446 | 25.9%), middle school (4,234 | 24.7%), and elementary school (3,733 | 21.8%).
| School Level | # Students | % Students |
| Nursery / Preschool | 877 | 5.1% |
| Kindergarten | 825 | 4.8% |
| Elementary School | 3,733 | 21.8% |
| Middle School | 4,234 | 24.7% |
| High School | 4,446 | 25.9% |
| College / Undergraduate | 2,443 | 14.2% |
| Graduate / Professional | 593 | 3.5% |
| Total | 17,151 | 100.0% |
School Enrollment by Age by Funding Source in Kosciusko County
Out of a total of 17,151 students who are enrolled in schools in Kosciusko County, 3,053 (17.8%) attend a private institution, while the remaining 14,098 (82.2%) are enrolled in public schools. The age group of 25 to 34 year olds has the highest likelihood of being enrolled in private schools, with 278 (46.0% in the age bracket) enrolled. Conversely, the age group of 10 to 14 year olds has the lowest likelihood of being enrolled in a private school, with 5,050 (91.7% in the age bracket) attending a public institution.
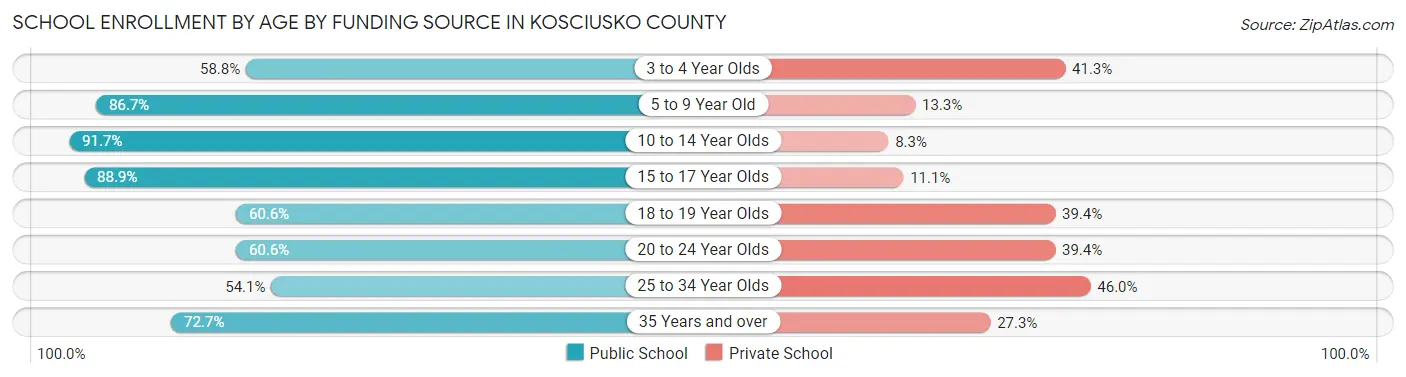
| Age Bracket | Public School | Private School |
| 3 to 4 Year Olds | 356 (58.8%) | 250 (41.2%) |
| 5 to 9 Year Old | 3,592 (86.7%) | 551 (13.3%) |
| 10 to 14 Year Olds | 5,050 (91.7%) | 457 (8.3%) |
| 15 to 17 Year Olds | 2,799 (88.9%) | 349 (11.1%) |
| 18 to 19 Year Olds | 918 (60.6%) | 596 (39.4%) |
| 20 to 24 Year Olds | 656 (60.6%) | 426 (39.4%) |
| 25 to 34 Year Olds | 327 (54.0%) | 278 (46.0%) |
| 35 Years and over | 397 (72.7%) | 149 (27.3%) |
| Total | 14,098 (82.2%) | 3,053 (17.8%) |
Educational Attainment by Field of Study in Kosciusko County
Business (2,871 | 20.1%), education (2,620 | 18.3%), engineering (1,485 | 10.4%), science & technology (1,454 | 10.2%), and visual & performing arts (877 | 6.1%) are the most common fields of study among 14,275 individuals in Kosciusko County who have obtained a bachelor's degree or higher.
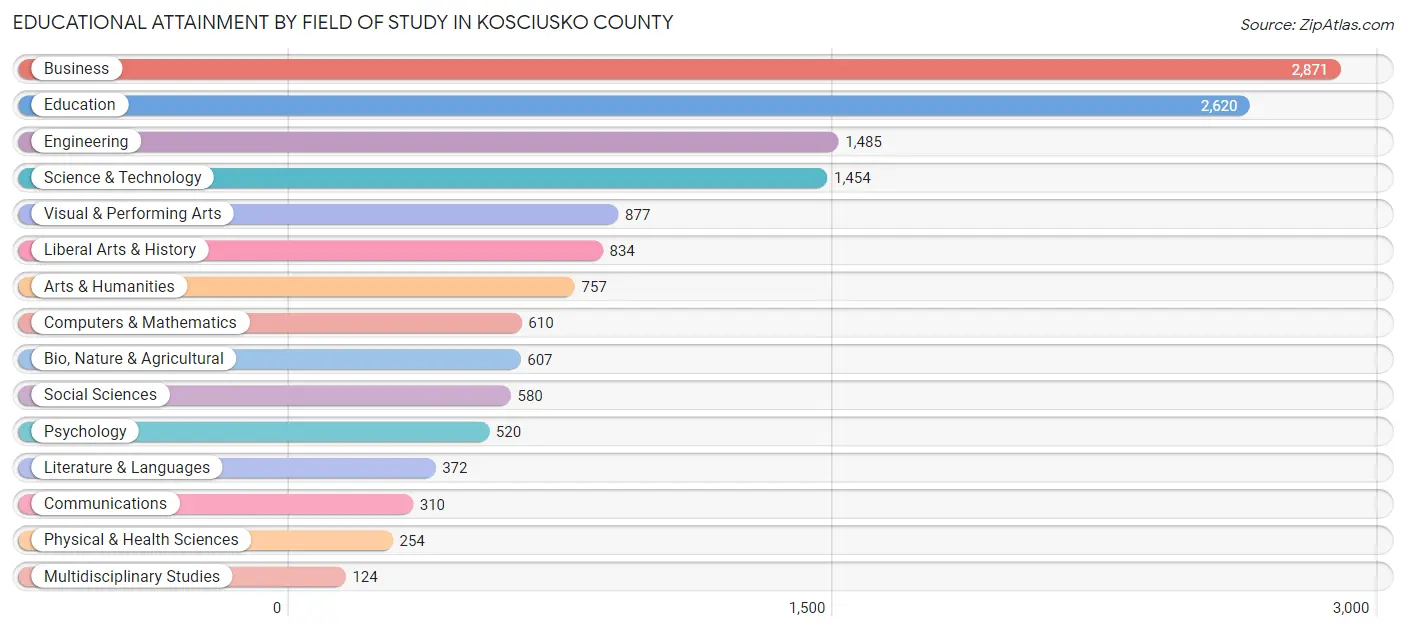
| Field of Study | # Graduates | % Graduates |
| Computers & Mathematics | 610 | 4.3% |
| Bio, Nature & Agricultural | 607 | 4.3% |
| Physical & Health Sciences | 254 | 1.8% |
| Psychology | 520 | 3.6% |
| Social Sciences | 580 | 4.1% |
| Engineering | 1,485 | 10.4% |
| Multidisciplinary Studies | 124 | 0.9% |
| Science & Technology | 1,454 | 10.2% |
| Business | 2,871 | 20.1% |
| Education | 2,620 | 18.3% |
| Literature & Languages | 372 | 2.6% |
| Liberal Arts & History | 834 | 5.8% |
| Visual & Performing Arts | 877 | 6.1% |
| Communications | 310 | 2.2% |
| Arts & Humanities | 757 | 5.3% |
| Total | 14,275 | 100.0% |
Transportation & Commute in Kosciusko County
Vehicle Availability by Sex in Kosciusko County
The most prevalent vehicle ownership categories in Kosciusko County are males with 2 vehicles (8,836, accounting for 41.5%) and females with 2 vehicles (6,646, making up 50.3%).
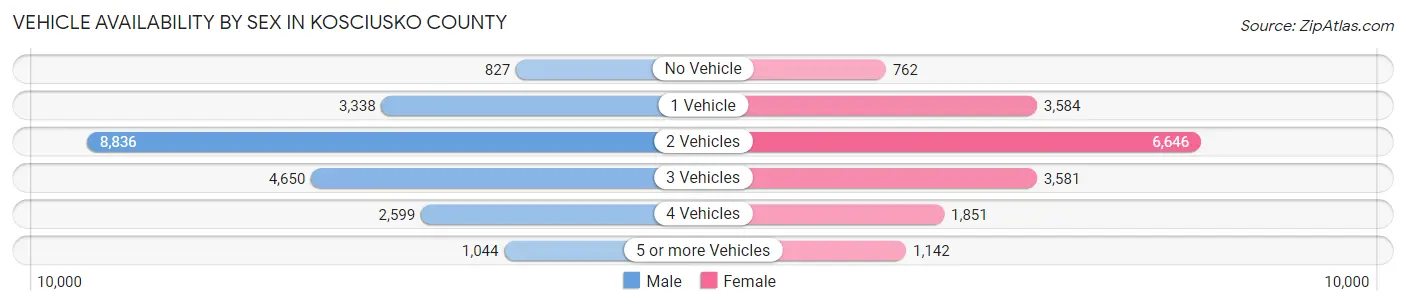
| Vehicles Available | Male | Female |
| No Vehicle | 827 (3.9%) | 762 (4.3%) |
| 1 Vehicle | 3,338 (15.7%) | 3,584 (20.4%) |
| 2 Vehicles | 8,836 (41.5%) | 6,646 (37.8%) |
| 3 Vehicles | 4,650 (21.8%) | 3,581 (20.4%) |
| 4 Vehicles | 2,599 (12.2%) | 1,851 (10.5%) |
| 5 or more Vehicles | 1,044 (4.9%) | 1,142 (6.5%) |
| Total | 21,294 (100.0%) | 17,566 (100.0%) |
Commute Time in Kosciusko County
The most frequently occuring commute durations in Kosciusko County are 15 to 19 minutes (6,856 commuters, 18.8%), 10 to 14 minutes (6,810 commuters, 18.7%), and 5 to 9 minutes (5,327 commuters, 14.6%).
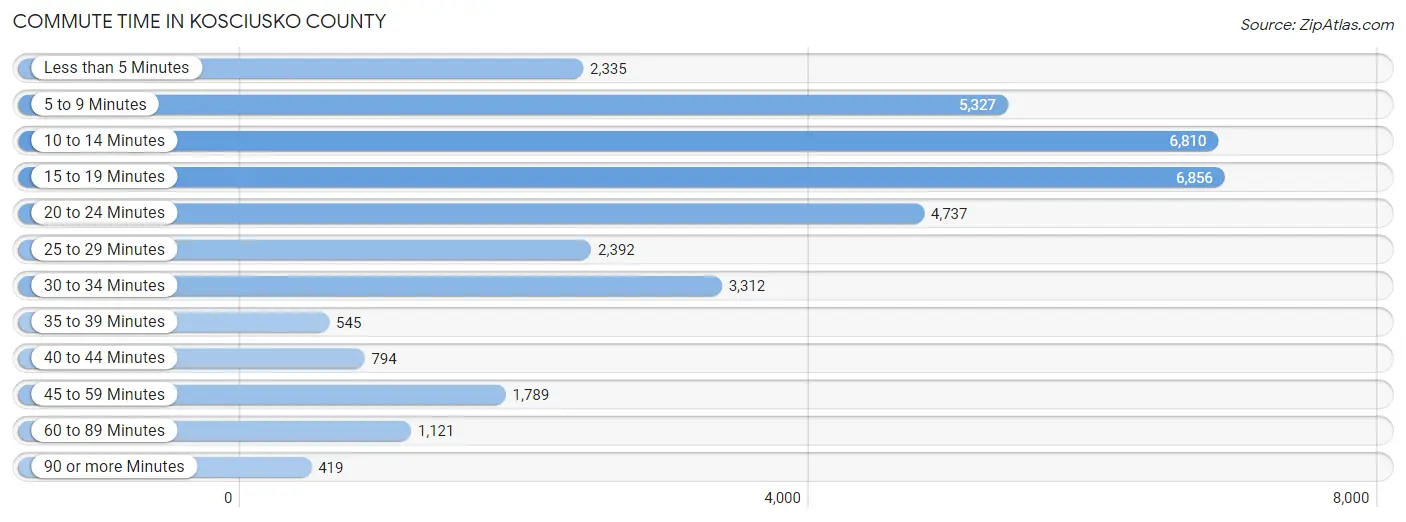
| Commute Time | # Commuters | % Commuters |
| Less than 5 Minutes | 2,335 | 6.4% |
| 5 to 9 Minutes | 5,327 | 14.6% |
| 10 to 14 Minutes | 6,810 | 18.7% |
| 15 to 19 Minutes | 6,856 | 18.8% |
| 20 to 24 Minutes | 4,737 | 13.0% |
| 25 to 29 Minutes | 2,392 | 6.6% |
| 30 to 34 Minutes | 3,312 | 9.1% |
| 35 to 39 Minutes | 545 | 1.5% |
| 40 to 44 Minutes | 794 | 2.2% |
| 45 to 59 Minutes | 1,789 | 4.9% |
| 60 to 89 Minutes | 1,121 | 3.1% |
| 90 or more Minutes | 419 | 1.1% |
Commute Time by Sex in Kosciusko County
The most common commute times in Kosciusko County are 15 to 19 minutes (3,821 commuters, 19.1%) for males and 10 to 14 minutes (3,426 commuters, 20.9%) for females.
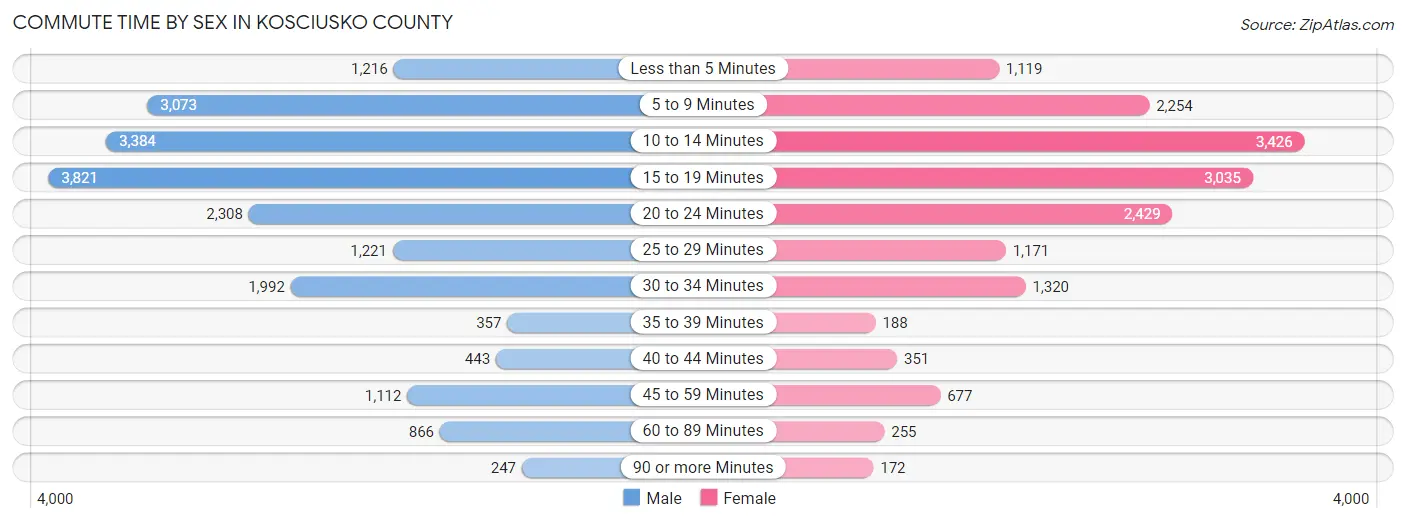
| Commute Time | Male | Female |
| Less than 5 Minutes | 1,216 (6.1%) | 1,119 (6.8%) |
| 5 to 9 Minutes | 3,073 (15.3%) | 2,254 (13.8%) |
| 10 to 14 Minutes | 3,384 (16.9%) | 3,426 (20.9%) |
| 15 to 19 Minutes | 3,821 (19.1%) | 3,035 (18.5%) |
| 20 to 24 Minutes | 2,308 (11.5%) | 2,429 (14.8%) |
| 25 to 29 Minutes | 1,221 (6.1%) | 1,171 (7.1%) |
| 30 to 34 Minutes | 1,992 (9.9%) | 1,320 (8.1%) |
| 35 to 39 Minutes | 357 (1.8%) | 188 (1.1%) |
| 40 to 44 Minutes | 443 (2.2%) | 351 (2.1%) |
| 45 to 59 Minutes | 1,112 (5.6%) | 677 (4.1%) |
| 60 to 89 Minutes | 866 (4.3%) | 255 (1.6%) |
| 90 or more Minutes | 247 (1.2%) | 172 (1.1%) |
Time of Departure to Work by Sex in Kosciusko County
The most frequent times of departure to work in Kosciusko County are 12:00 AM to 4:59 AM (3,254, 16.2%) for males and 7:00 AM to 7:29 AM (2,523, 15.4%) for females.
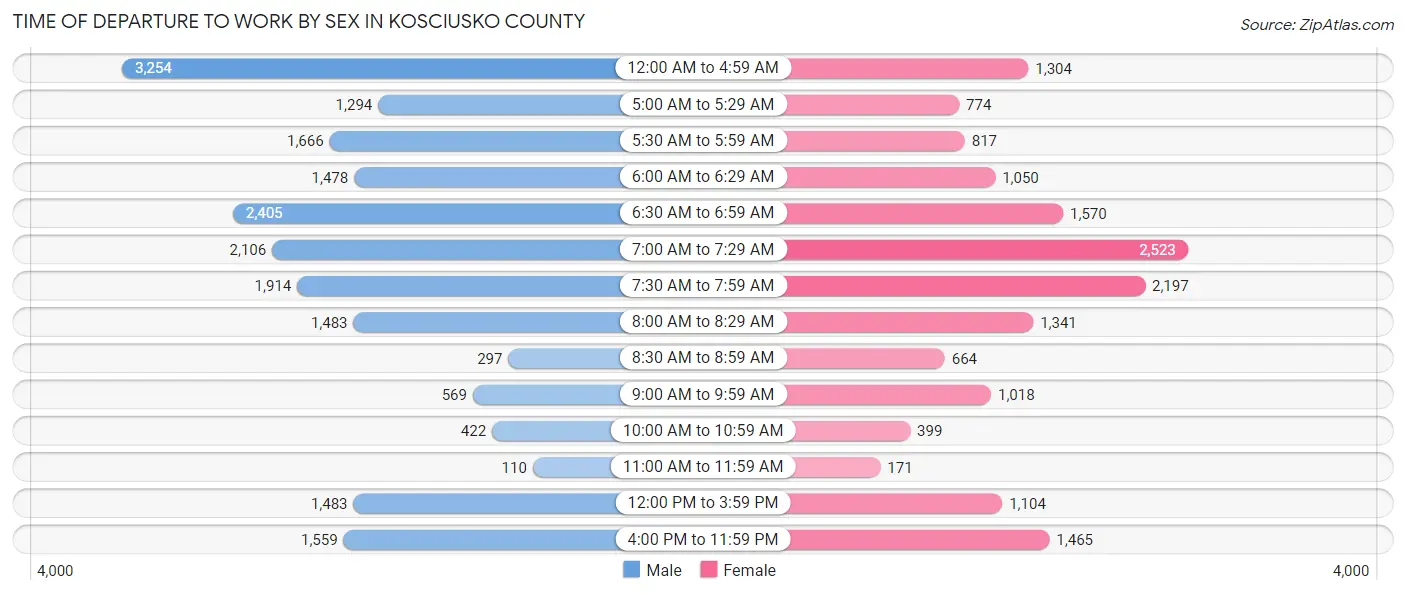
| Time of Departure | Male | Female |
| 12:00 AM to 4:59 AM | 3,254 (16.2%) | 1,304 (8.0%) |
| 5:00 AM to 5:29 AM | 1,294 (6.5%) | 774 (4.7%) |
| 5:30 AM to 5:59 AM | 1,666 (8.3%) | 817 (5.0%) |
| 6:00 AM to 6:29 AM | 1,478 (7.4%) | 1,050 (6.4%) |
| 6:30 AM to 6:59 AM | 2,405 (12.0%) | 1,570 (9.6%) |
| 7:00 AM to 7:29 AM | 2,106 (10.5%) | 2,523 (15.4%) |
| 7:30 AM to 7:59 AM | 1,914 (9.6%) | 2,197 (13.4%) |
| 8:00 AM to 8:29 AM | 1,483 (7.4%) | 1,341 (8.2%) |
| 8:30 AM to 8:59 AM | 297 (1.5%) | 664 (4.1%) |
| 9:00 AM to 9:59 AM | 569 (2.8%) | 1,018 (6.2%) |
| 10:00 AM to 10:59 AM | 422 (2.1%) | 399 (2.4%) |
| 11:00 AM to 11:59 AM | 110 (0.5%) | 171 (1.0%) |
| 12:00 PM to 3:59 PM | 1,483 (7.4%) | 1,104 (6.7%) |
| 4:00 PM to 11:59 PM | 1,559 (7.8%) | 1,465 (8.9%) |
| Total | 20,040 (100.0%) | 16,397 (100.0%) |
Housing Occupancy in Kosciusko County
Occupancy by Ownership in Kosciusko County
Of the total 31,325 dwellings in Kosciusko County, owner-occupied units account for 23,852 (76.1%), while renter-occupied units make up 7,473 (23.9%).
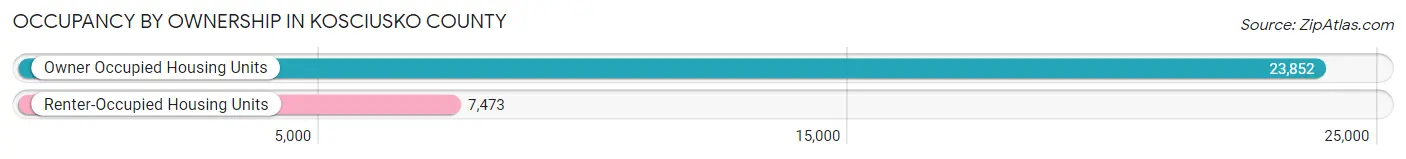
| Occupancy | # Housing Units | % Housing Units |
| Owner Occupied Housing Units | 23,852 | 76.1% |
| Renter-Occupied Housing Units | 7,473 | 23.9% |
| Total Occupied Housing Units | 31,325 | 100.0% |
Occupancy by Household Size in Kosciusko County
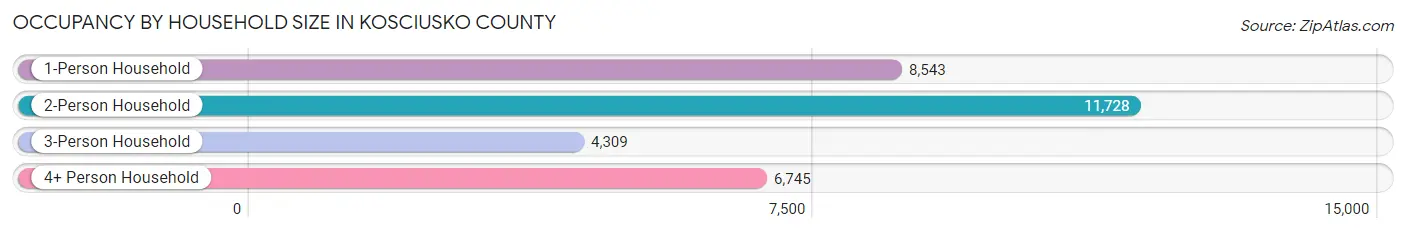
| Household Size | # Housing Units | % Housing Units |
| 1-Person Household | 8,543 | 27.3% |
| 2-Person Household | 11,728 | 37.4% |
| 3-Person Household | 4,309 | 13.8% |
| 4+ Person Household | 6,745 | 21.5% |
| Total Housing Units | 31,325 | 100.0% |
Occupancy by Ownership by Household Size in Kosciusko County
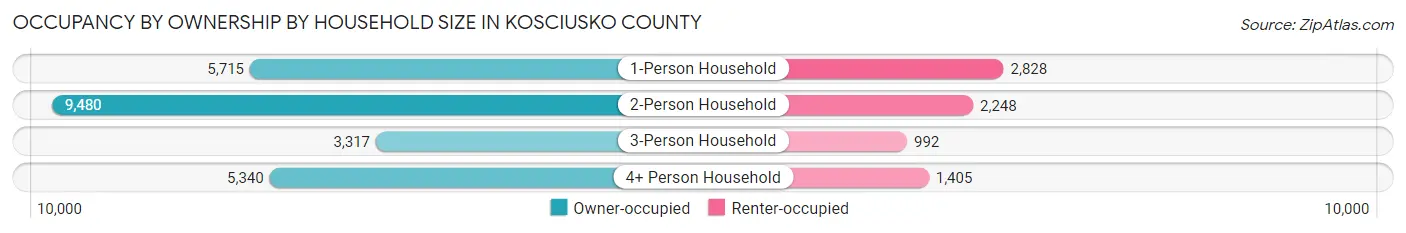
| Household Size | Owner-occupied | Renter-occupied |
| 1-Person Household | 5,715 (66.9%) | 2,828 (33.1%) |
| 2-Person Household | 9,480 (80.8%) | 2,248 (19.2%) |
| 3-Person Household | 3,317 (77.0%) | 992 (23.0%) |
| 4+ Person Household | 5,340 (79.2%) | 1,405 (20.8%) |
| Total Housing Units | 23,852 (76.1%) | 7,473 (23.9%) |
Occupancy by Educational Attainment in Kosciusko County
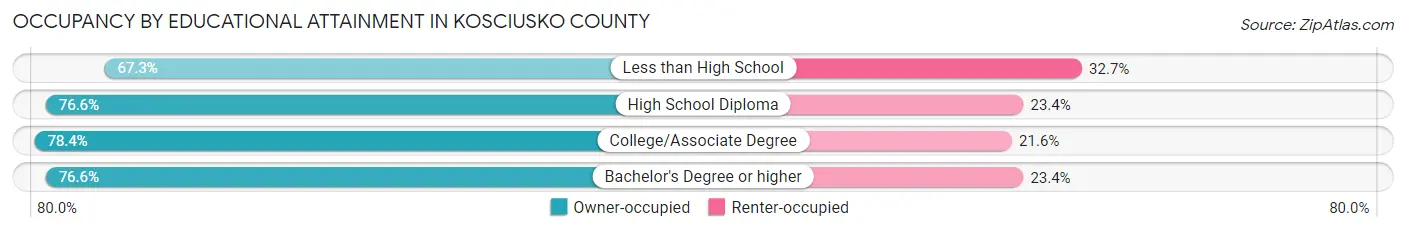
| Household Size | Owner-occupied | Renter-occupied |
| Less than High School | 2,294 (67.3%) | 1,113 (32.7%) |
| High School Diploma | 8,095 (76.6%) | 2,470 (23.4%) |
| College/Associate Degree | 7,183 (78.4%) | 1,976 (21.6%) |
| Bachelor's Degree or higher | 6,280 (76.6%) | 1,914 (23.4%) |
Occupancy by Age of Householder in Kosciusko County
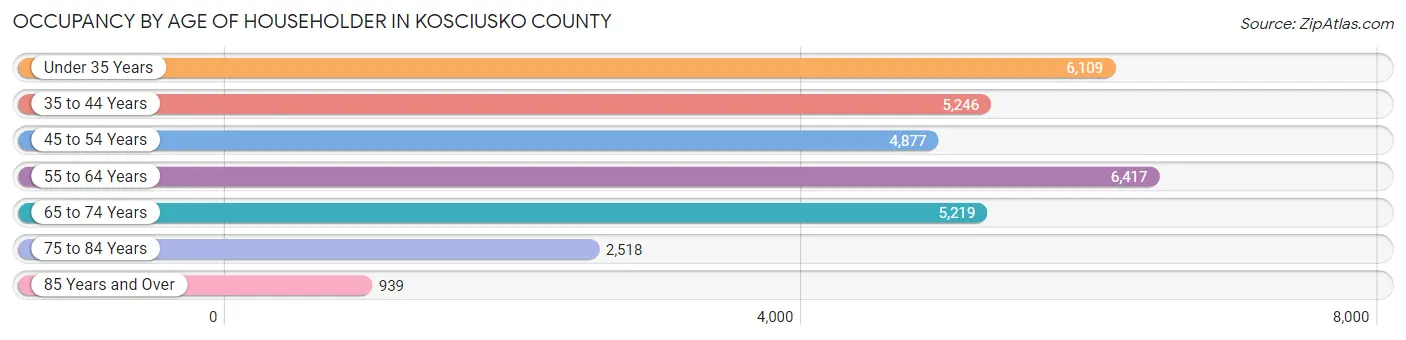
| Age Bracket | # Households | % Households |
| Under 35 Years | 6,109 | 19.5% |
| 35 to 44 Years | 5,246 | 16.8% |
| 45 to 54 Years | 4,877 | 15.6% |
| 55 to 64 Years | 6,417 | 20.5% |
| 65 to 74 Years | 5,219 | 16.7% |
| 75 to 84 Years | 2,518 | 8.0% |
| 85 Years and Over | 939 | 3.0% |
| Total | 31,325 | 100.0% |
Housing Finances in Kosciusko County
Median Income by Occupancy in Kosciusko County
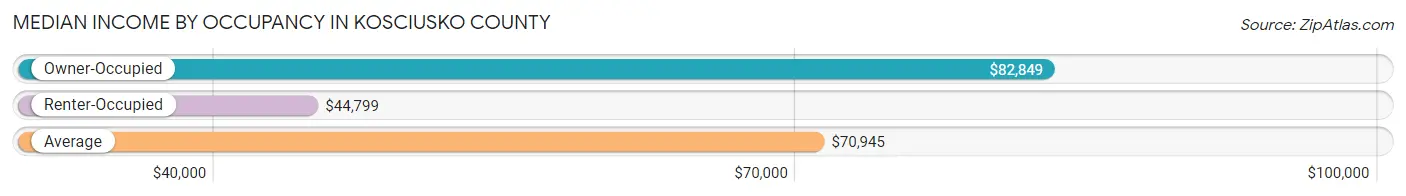
| Occupancy Type | # Households | Median Income |
| Owner-Occupied | 23,852 (76.1%) | $82,849 |
| Renter-Occupied | 7,473 (23.9%) | $44,799 |
| Average | 31,325 (100.0%) | $70,945 |
Occupancy by Householder Income Bracket in Kosciusko County
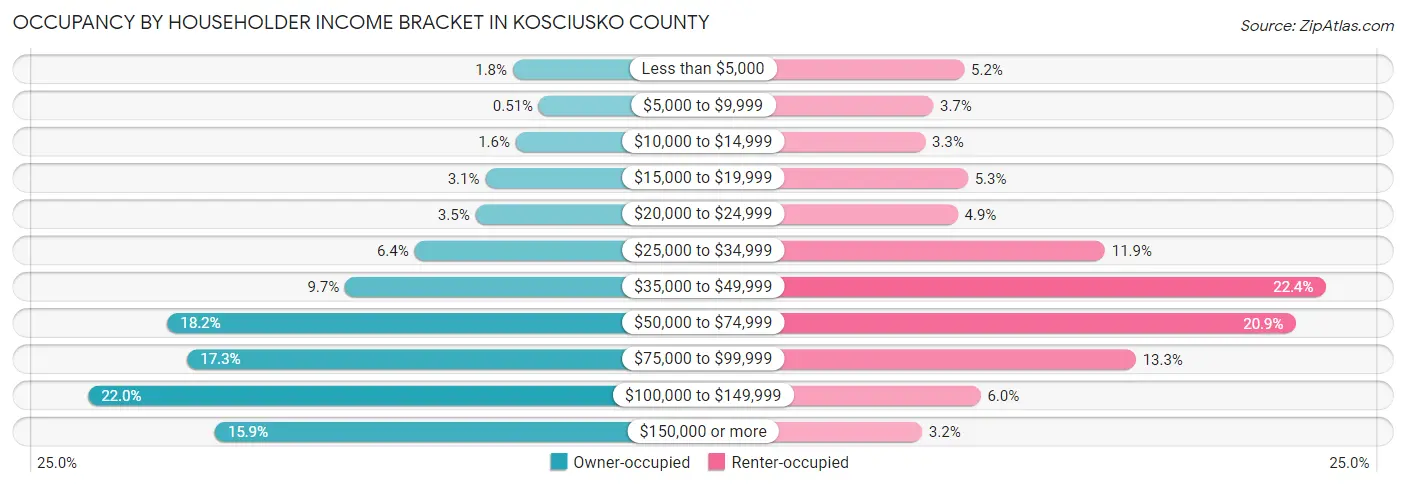
| Income Bracket | Owner-occupied | Renter-occupied |
| Less than $5,000 | 417 (1.8%) | 386 (5.2%) |
| $5,000 to $9,999 | 122 (0.5%) | 276 (3.7%) |
| $10,000 to $14,999 | 385 (1.6%) | 247 (3.3%) |
| $15,000 to $19,999 | 731 (3.1%) | 399 (5.3%) |
| $20,000 to $24,999 | 843 (3.5%) | 363 (4.9%) |
| $25,000 to $34,999 | 1,534 (6.4%) | 887 (11.9%) |
| $35,000 to $49,999 | 2,322 (9.7%) | 1,672 (22.4%) |
| $50,000 to $74,999 | 4,341 (18.2%) | 1,565 (20.9%) |
| $75,000 to $99,999 | 4,114 (17.2%) | 997 (13.3%) |
| $100,000 to $149,999 | 5,240 (22.0%) | 445 (5.9%) |
| $150,000 or more | 3,803 (15.9%) | 236 (3.2%) |
| Total | 23,852 (100.0%) | 7,473 (100.0%) |
Monthly Housing Cost Tiers in Kosciusko County
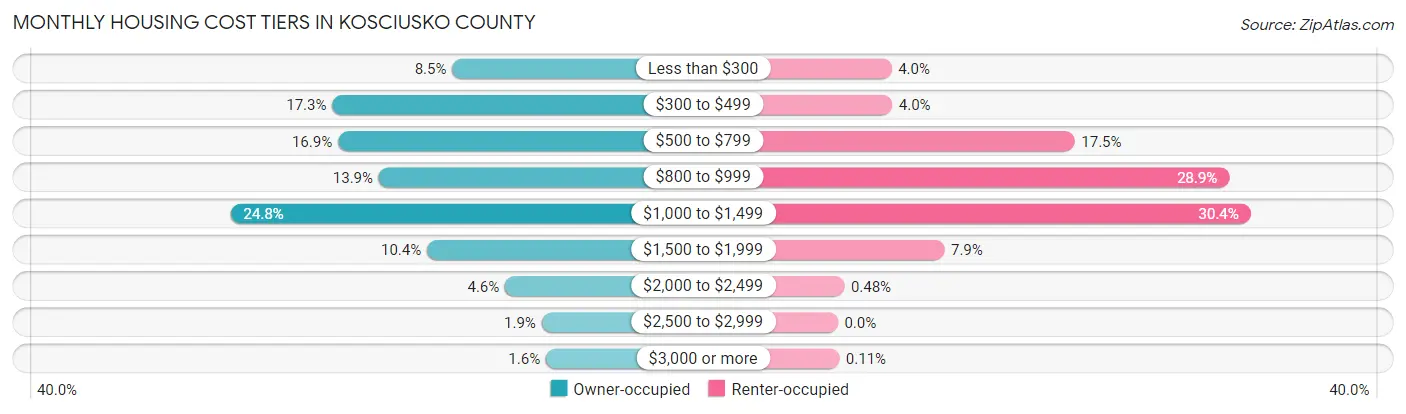
| Monthly Cost | Owner-occupied | Renter-occupied |
| Less than $300 | 2,028 (8.5%) | 296 (4.0%) |
| $300 to $499 | 4,135 (17.3%) | 300 (4.0%) |
| $500 to $799 | 4,036 (16.9%) | 1,304 (17.4%) |
| $800 to $999 | 3,317 (13.9%) | 2,156 (28.8%) |
| $1,000 to $1,499 | 5,925 (24.8%) | 2,274 (30.4%) |
| $1,500 to $1,999 | 2,472 (10.4%) | 587 (7.9%) |
| $2,000 to $2,499 | 1,099 (4.6%) | 36 (0.5%) |
| $2,500 to $2,999 | 459 (1.9%) | 0 (0.0%) |
| $3,000 or more | 381 (1.6%) | 8 (0.1%) |
| Total | 23,852 (100.0%) | 7,473 (100.0%) |
Physical Housing Characteristics in Kosciusko County
Housing Structures in Kosciusko County
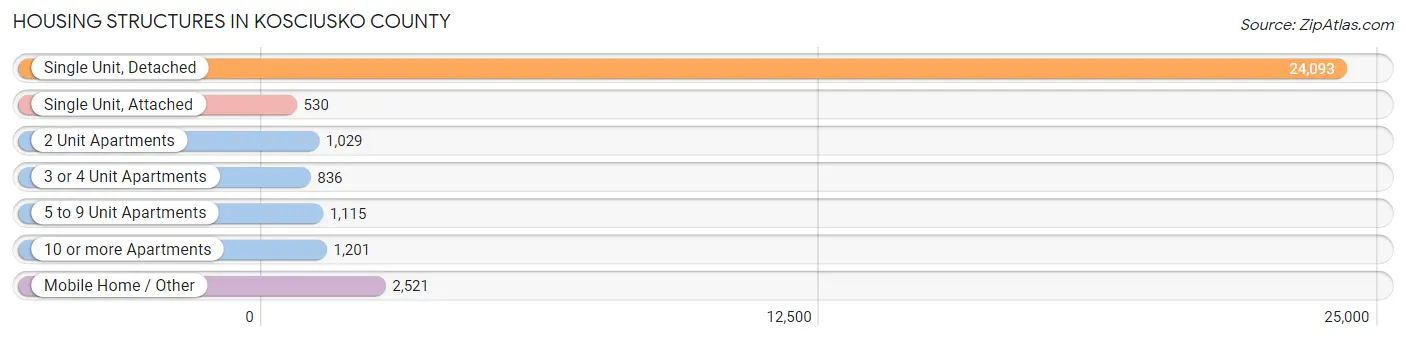
| Structure Type | # Housing Units | % Housing Units |
| Single Unit, Detached | 24,093 | 76.9% |
| Single Unit, Attached | 530 | 1.7% |
| 2 Unit Apartments | 1,029 | 3.3% |
| 3 or 4 Unit Apartments | 836 | 2.7% |
| 5 to 9 Unit Apartments | 1,115 | 3.6% |
| 10 or more Apartments | 1,201 | 3.8% |
| Mobile Home / Other | 2,521 | 8.1% |
| Total | 31,325 | 100.0% |
Housing Structures by Occupancy in Kosciusko County
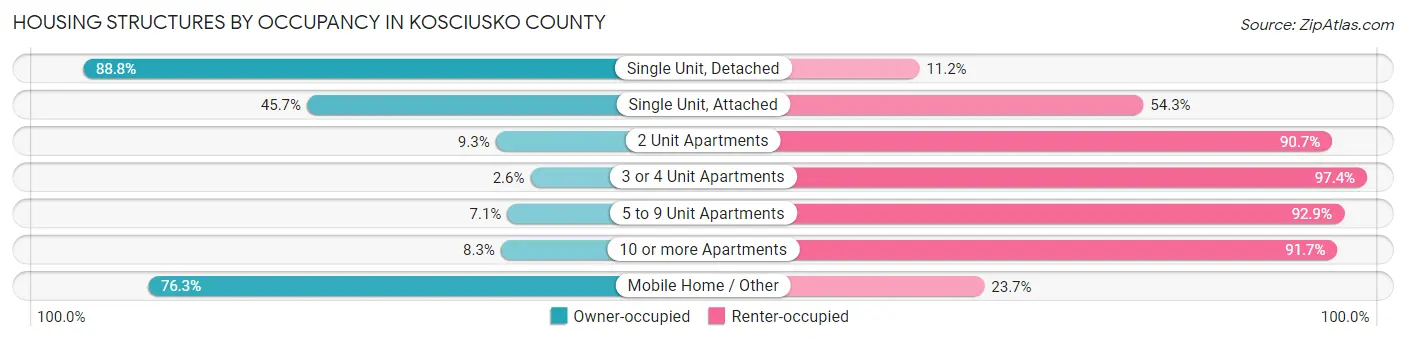
| Structure Type | Owner-occupied | Renter-occupied |
| Single Unit, Detached | 21,390 (88.8%) | 2,703 (11.2%) |
| Single Unit, Attached | 242 (45.7%) | 288 (54.3%) |
| 2 Unit Apartments | 96 (9.3%) | 933 (90.7%) |
| 3 or 4 Unit Apartments | 22 (2.6%) | 814 (97.4%) |
| 5 to 9 Unit Apartments | 79 (7.1%) | 1,036 (92.9%) |
| 10 or more Apartments | 100 (8.3%) | 1,101 (91.7%) |
| Mobile Home / Other | 1,923 (76.3%) | 598 (23.7%) |
| Total | 23,852 (76.1%) | 7,473 (23.9%) |
Housing Structures by Number of Rooms in Kosciusko County
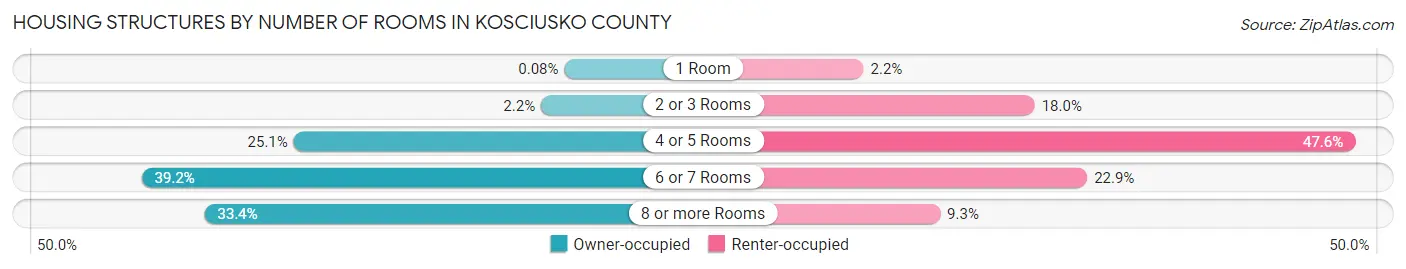
| Number of Rooms | Owner-occupied | Renter-occupied |
| 1 Room | 19 (0.1%) | 164 (2.2%) |
| 2 or 3 Rooms | 535 (2.2%) | 1,347 (18.0%) |
| 4 or 5 Rooms | 5,991 (25.1%) | 3,560 (47.6%) |
| 6 or 7 Rooms | 9,348 (39.2%) | 1,709 (22.9%) |
| 8 or more Rooms | 7,959 (33.4%) | 693 (9.3%) |
| Total | 23,852 (100.0%) | 7,473 (100.0%) |
Housing Structure by Heating Type in Kosciusko County
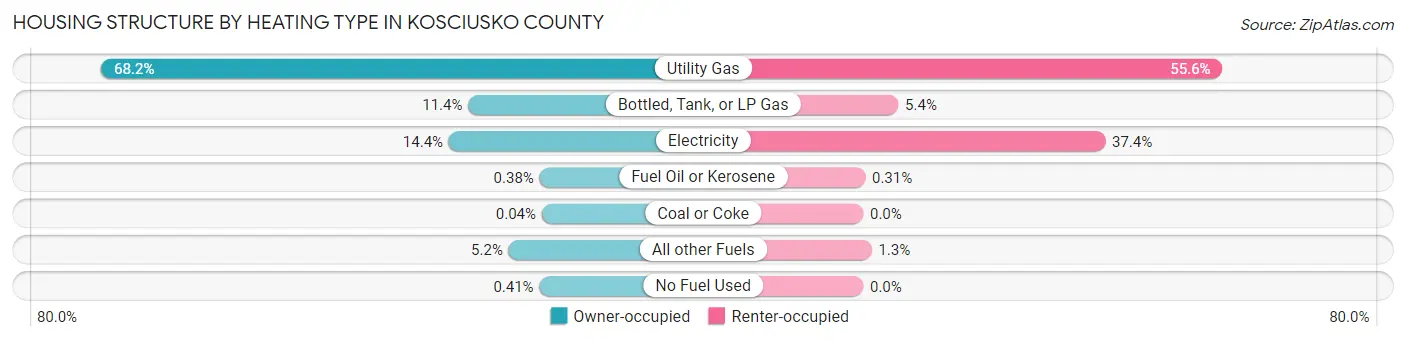
| Heating Type | Owner-occupied | Renter-occupied |
| Utility Gas | 16,263 (68.2%) | 4,151 (55.5%) |
| Bottled, Tank, or LP Gas | 2,721 (11.4%) | 406 (5.4%) |
| Electricity | 3,438 (14.4%) | 2,796 (37.4%) |
| Fuel Oil or Kerosene | 91 (0.4%) | 23 (0.3%) |
| Coal or Coke | 10 (0.0%) | 0 (0.0%) |
| All other Fuels | 1,231 (5.2%) | 97 (1.3%) |
| No Fuel Used | 98 (0.4%) | 0 (0.0%) |
| Total | 23,852 (100.0%) | 7,473 (100.0%) |
Household Vehicle Usage in Kosciusko County
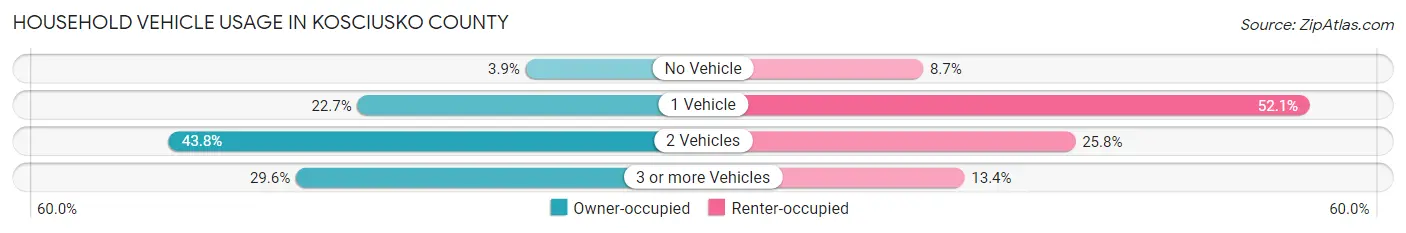
| Vehicles per Household | Owner-occupied | Renter-occupied |
| No Vehicle | 922 (3.9%) | 653 (8.7%) |
| 1 Vehicle | 5,416 (22.7%) | 3,892 (52.1%) |
| 2 Vehicles | 10,454 (43.8%) | 1,928 (25.8%) |
| 3 or more Vehicles | 7,060 (29.6%) | 1,000 (13.4%) |
| Total | 23,852 (100.0%) | 7,473 (100.0%) |
Real Estate & Mortgages in Kosciusko County
Real Estate and Mortgage Overview in Kosciusko County
| Characteristic | Without Mortgage | With Mortgage |
| Housing Units | 9,366 | 14,486 |
| Median Property Value | $161,600 | $196,100 |
| Median Household Income | $60,903 | $2,828 |
| Monthly Housing Costs | $436 | $381 |
| Real Estate Taxes | $1,042 | $484 |
Property Value by Mortgage Status in Kosciusko County
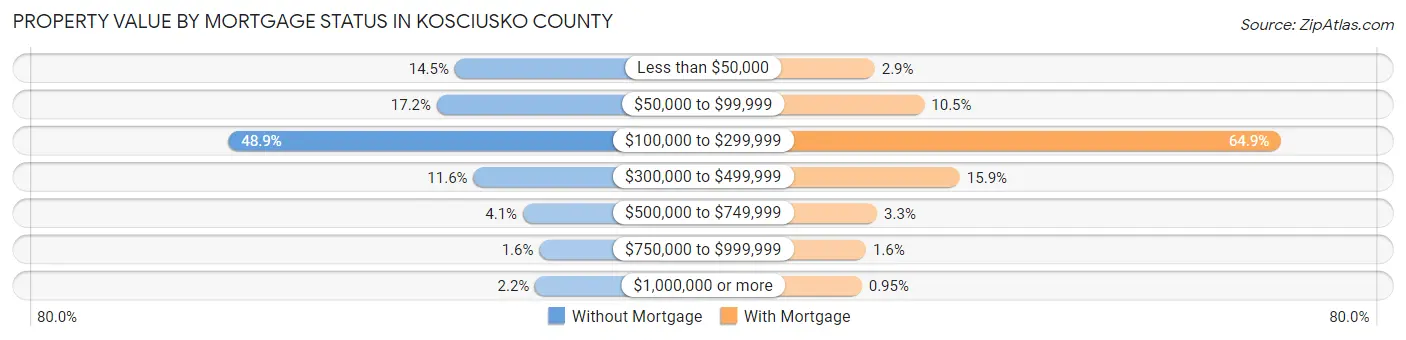
| Property Value | Without Mortgage | With Mortgage |
| Less than $50,000 | 1,353 (14.4%) | 425 (2.9%) |
| $50,000 to $99,999 | 1,609 (17.2%) | 1,519 (10.5%) |
| $100,000 to $299,999 | 4,584 (48.9%) | 9,394 (64.8%) |
| $300,000 to $499,999 | 1,087 (11.6%) | 2,303 (15.9%) |
| $500,000 to $749,999 | 380 (4.1%) | 476 (3.3%) |
| $750,000 to $999,999 | 147 (1.6%) | 231 (1.6%) |
| $1,000,000 or more | 206 (2.2%) | 138 (0.9%) |
| Total | 9,366 (100.0%) | 14,486 (100.0%) |
Household Income by Mortgage Status in Kosciusko County
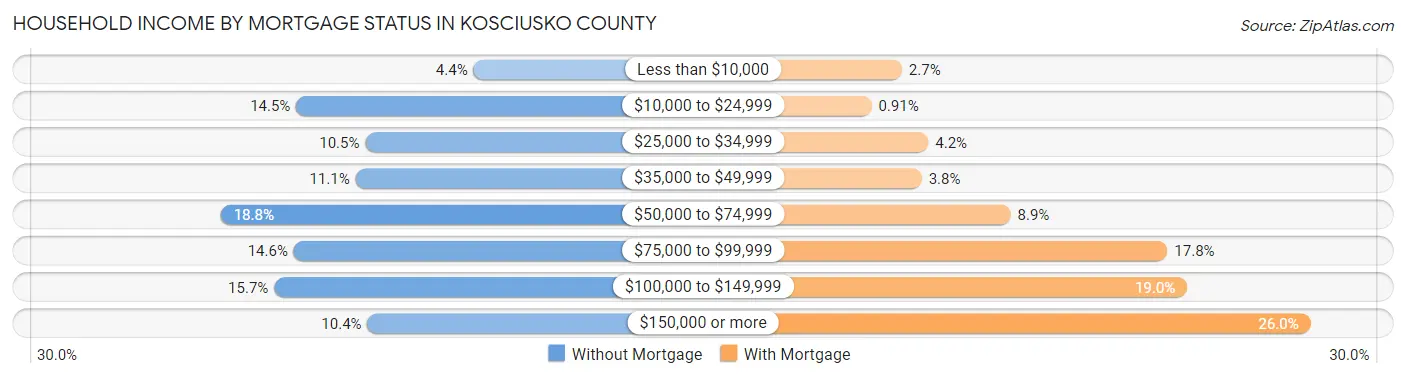
| Household Income | Without Mortgage | With Mortgage |
| Less than $10,000 | 407 (4.3%) | 384 (2.6%) |
| $10,000 to $24,999 | 1,356 (14.5%) | 132 (0.9%) |
| $25,000 to $34,999 | 986 (10.5%) | 603 (4.2%) |
| $35,000 to $49,999 | 1,039 (11.1%) | 548 (3.8%) |
| $50,000 to $74,999 | 1,760 (18.8%) | 1,283 (8.9%) |
| $75,000 to $99,999 | 1,369 (14.6%) | 2,581 (17.8%) |
| $100,000 to $149,999 | 1,474 (15.7%) | 2,745 (19.0%) |
| $150,000 or more | 975 (10.4%) | 3,766 (26.0%) |
| Total | 9,366 (100.0%) | 14,486 (100.0%) |
Property Value to Household Income Ratio in Kosciusko County
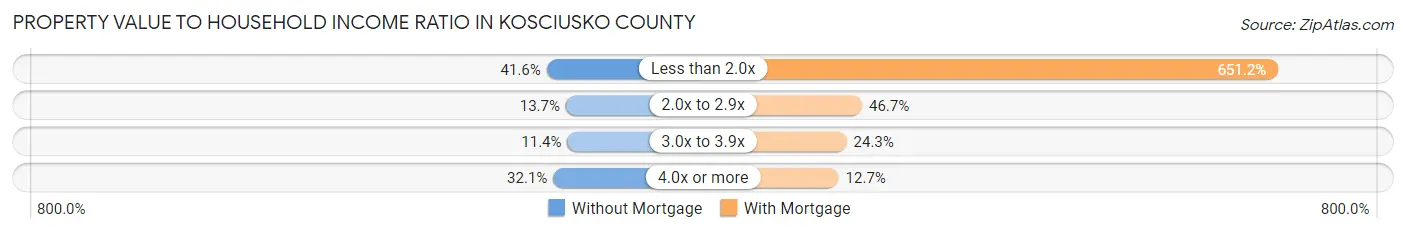
| Value-to-Income Ratio | Without Mortgage | With Mortgage |
| Less than 2.0x | 3,898 (41.6%) | 94,332 (651.2%) |
| 2.0x to 2.9x | 1,281 (13.7%) | 6,769 (46.7%) |
| 3.0x to 3.9x | 1,067 (11.4%) | 3,515 (24.3%) |
| 4.0x or more | 3,003 (32.1%) | 1,840 (12.7%) |
| Total | 9,366 (100.0%) | 14,486 (100.0%) |
Real Estate Taxes by Mortgage Status in Kosciusko County
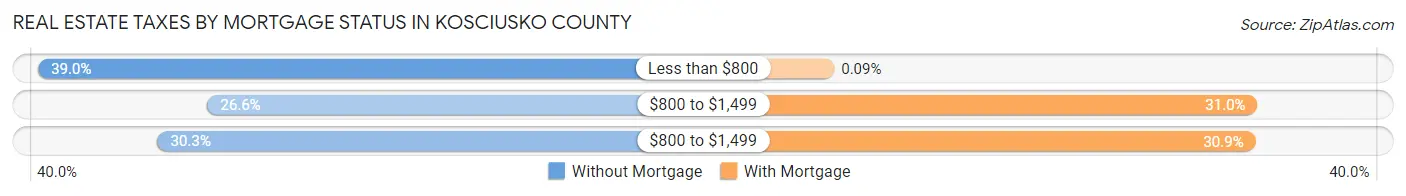
| Property Taxes | Without Mortgage | With Mortgage |
| Less than $800 | 3,654 (39.0%) | 13 (0.1%) |
| $800 to $1,499 | 2,495 (26.6%) | 4,491 (31.0%) |
| $800 to $1,499 | 2,837 (30.3%) | 4,471 (30.9%) |
| Total | 9,366 (100.0%) | 14,486 (100.0%) |
Health & Disability in Kosciusko County
Health Insurance Coverage by Age in Kosciusko County
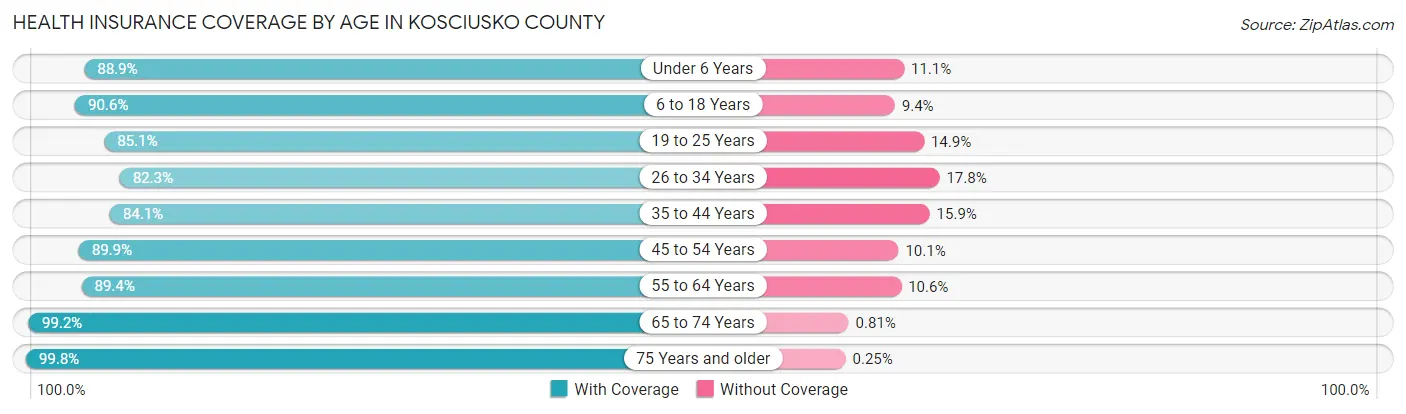
| Age Bracket | With Coverage | Without Coverage |
| Under 6 Years | 5,008 (88.9%) | 628 (11.1%) |
| 6 to 18 Years | 13,132 (90.6%) | 1,365 (9.4%) |
| 19 to 25 Years | 6,104 (85.1%) | 1,065 (14.9%) |
| 26 to 34 Years | 7,583 (82.3%) | 1,636 (17.7%) |
| 35 to 44 Years | 8,026 (84.1%) | 1,520 (15.9%) |
| 45 to 54 Years | 8,249 (89.9%) | 928 (10.1%) |
| 55 to 64 Years | 9,733 (89.4%) | 1,155 (10.6%) |
| 65 to 74 Years | 8,255 (99.2%) | 67 (0.8%) |
| 75 Years and older | 5,265 (99.8%) | 13 (0.3%) |
| Total | 71,355 (89.5%) | 8,377 (10.5%) |
Health Insurance Coverage by Citizenship Status in Kosciusko County
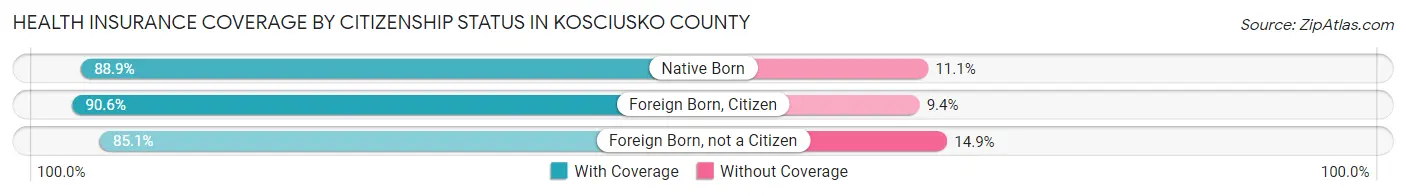
| Citizenship Status | With Coverage | Without Coverage |
| Native Born | 5,008 (88.9%) | 628 (11.1%) |
| Foreign Born, Citizen | 13,132 (90.6%) | 1,365 (9.4%) |
| Foreign Born, not a Citizen | 6,104 (85.1%) | 1,065 (14.9%) |
Health Insurance Coverage by Household Income in Kosciusko County
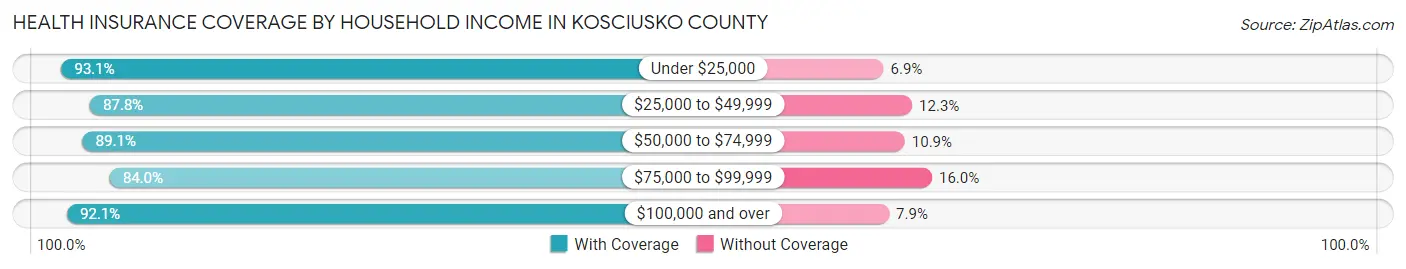
| Household Income | With Coverage | Without Coverage |
| Under $25,000 | 6,192 (93.1%) | 458 (6.9%) |
| $25,000 to $49,999 | 11,019 (87.7%) | 1,538 (12.2%) |
| $50,000 to $74,999 | 12,600 (89.1%) | 1,538 (10.9%) |
| $75,000 to $99,999 | 12,525 (84.0%) | 2,380 (16.0%) |
| $100,000 and over | 28,225 (92.1%) | 2,434 (7.9%) |
Public vs Private Health Insurance Coverage by Age in Kosciusko County
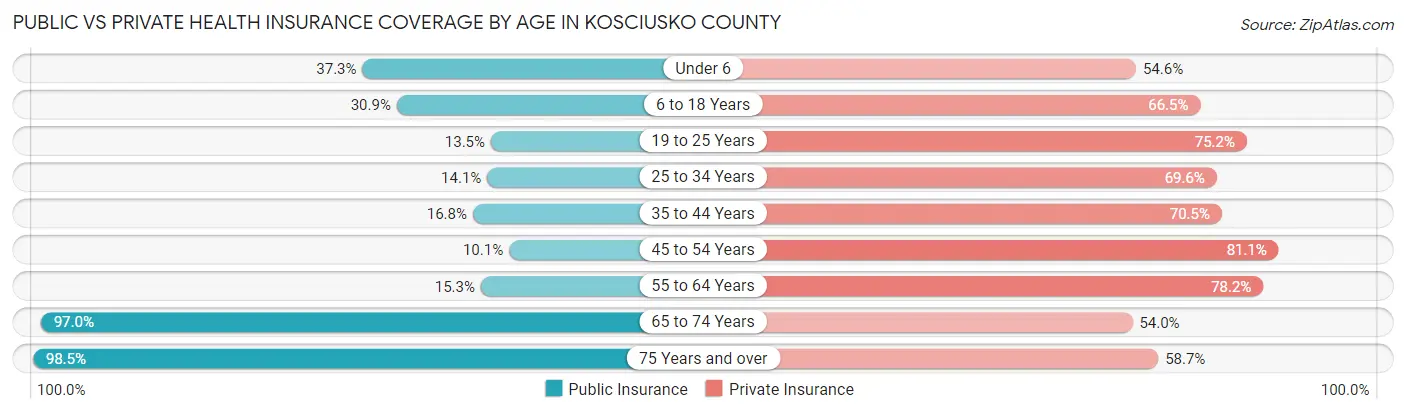
| Age Bracket | Public Insurance | Private Insurance |
| Under 6 | 2,103 (37.3%) | 3,078 (54.6%) |
| 6 to 18 Years | 4,484 (30.9%) | 9,645 (66.5%) |
| 19 to 25 Years | 965 (13.5%) | 5,389 (75.2%) |
| 25 to 34 Years | 1,304 (14.1%) | 6,415 (69.6%) |
| 35 to 44 Years | 1,605 (16.8%) | 6,733 (70.5%) |
| 45 to 54 Years | 926 (10.1%) | 7,442 (81.1%) |
| 55 to 64 Years | 1,668 (15.3%) | 8,516 (78.2%) |
| 65 to 74 Years | 8,072 (97.0%) | 4,490 (53.9%) |
| 75 Years and over | 5,197 (98.5%) | 3,100 (58.7%) |
| Total | 26,324 (33.0%) | 54,808 (68.7%) |
Disability Status by Sex by Age in Kosciusko County
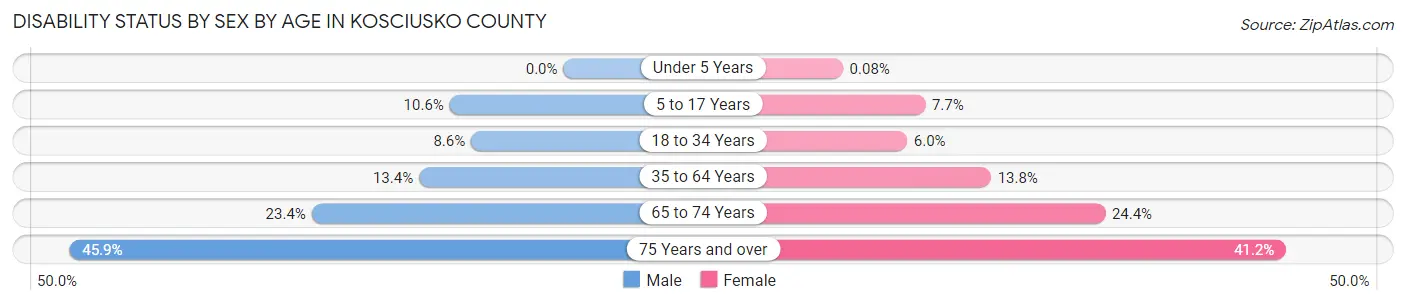
| Age Bracket | Male | Female |
| Under 5 Years | 0 (0.0%) | 2 (0.1%) |
| 5 to 17 Years | 756 (10.5%) | 531 (7.7%) |
| 18 to 34 Years | 768 (8.6%) | 521 (6.0%) |
| 35 to 64 Years | 2,012 (13.4%) | 2,016 (13.8%) |
| 65 to 74 Years | 954 (23.4%) | 1,035 (24.4%) |
| 75 Years and over | 1,039 (45.9%) | 1,242 (41.2%) |
Disability Class by Sex by Age in Kosciusko County
Disability Class: Hearing Difficulty
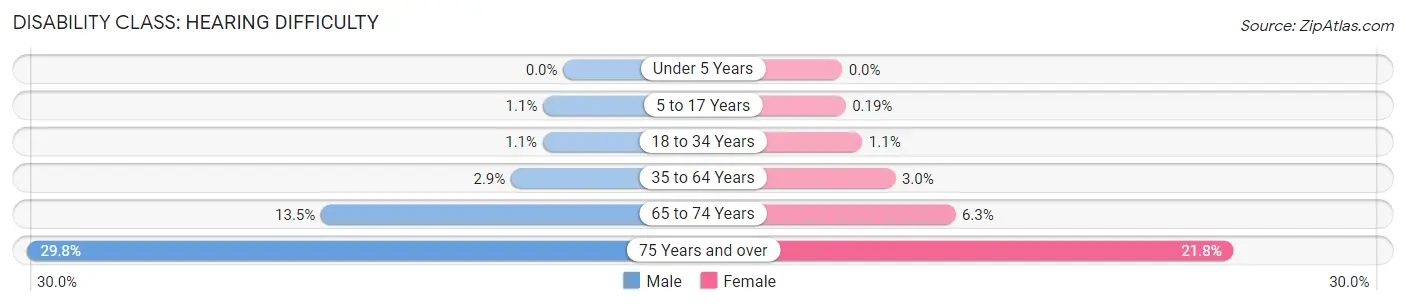
| Age Bracket | Male | Female |
| Under 5 Years | 0 (0.0%) | 0 (0.0%) |
| 5 to 17 Years | 80 (1.1%) | 13 (0.2%) |
| 18 to 34 Years | 102 (1.1%) | 97 (1.1%) |
| 35 to 64 Years | 437 (2.9%) | 432 (3.0%) |
| 65 to 74 Years | 551 (13.5%) | 267 (6.3%) |
| 75 Years and over | 676 (29.8%) | 657 (21.8%) |
Disability Class: Vision Difficulty
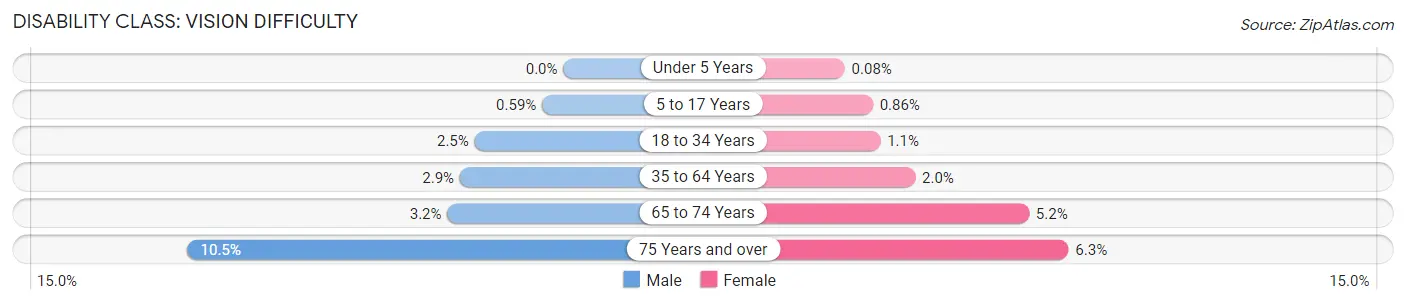
| Age Bracket | Male | Female |
| Under 5 Years | 0 (0.0%) | 2 (0.1%) |
| 5 to 17 Years | 42 (0.6%) | 59 (0.9%) |
| 18 to 34 Years | 221 (2.5%) | 92 (1.1%) |
| 35 to 64 Years | 432 (2.9%) | 298 (2.0%) |
| 65 to 74 Years | 132 (3.2%) | 221 (5.2%) |
| 75 Years and over | 237 (10.5%) | 190 (6.3%) |
Disability Class: Cognitive Difficulty
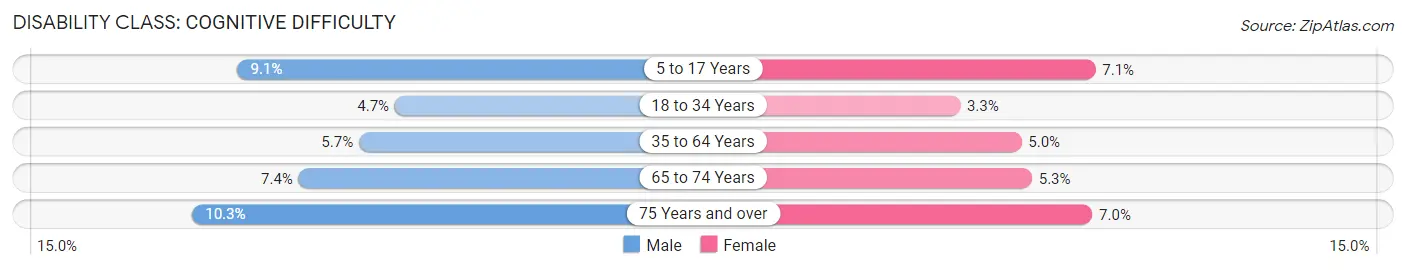
| Age Bracket | Male | Female |
| 5 to 17 Years | 650 (9.1%) | 486 (7.1%) |
| 18 to 34 Years | 420 (4.7%) | 284 (3.3%) |
| 35 to 64 Years | 855 (5.7%) | 729 (5.0%) |
| 65 to 74 Years | 301 (7.4%) | 224 (5.3%) |
| 75 Years and over | 234 (10.3%) | 210 (7.0%) |
Disability Class: Ambulatory Difficulty
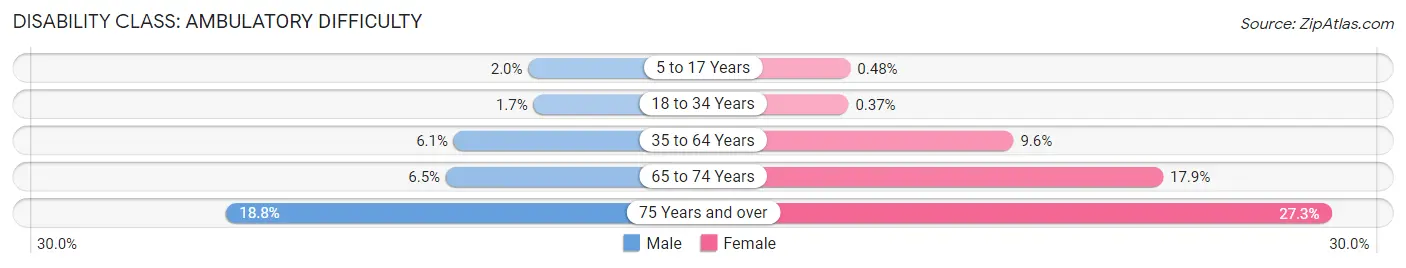
| Age Bracket | Male | Female |
| 5 to 17 Years | 140 (1.9%) | 33 (0.5%) |
| 18 to 34 Years | 149 (1.7%) | 32 (0.4%) |
| 35 to 64 Years | 916 (6.1%) | 1,395 (9.6%) |
| 65 to 74 Years | 267 (6.5%) | 758 (17.9%) |
| 75 Years and over | 425 (18.8%) | 821 (27.3%) |
Disability Class: Self-Care Difficulty
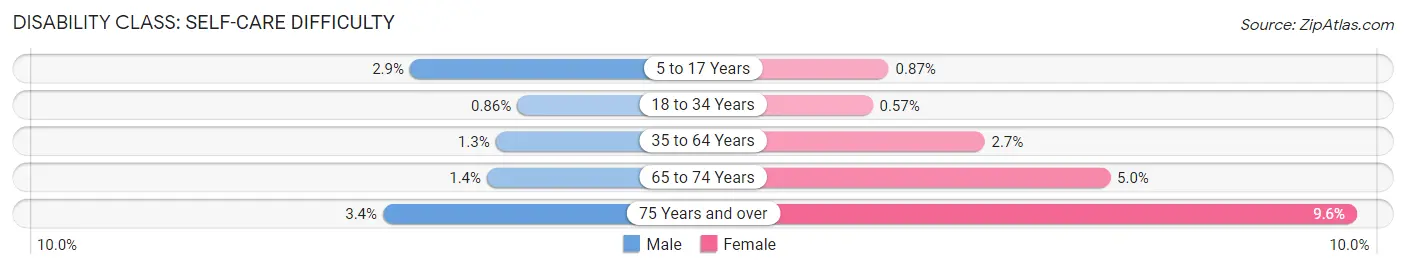
| Age Bracket | Male | Female |
| 5 to 17 Years | 204 (2.9%) | 60 (0.9%) |
| 18 to 34 Years | 77 (0.9%) | 49 (0.6%) |
| 35 to 64 Years | 190 (1.3%) | 387 (2.6%) |
| 65 to 74 Years | 58 (1.4%) | 211 (5.0%) |
| 75 Years and over | 76 (3.4%) | 288 (9.6%) |
Technology Access in Kosciusko County
Computing Device Access in Kosciusko County
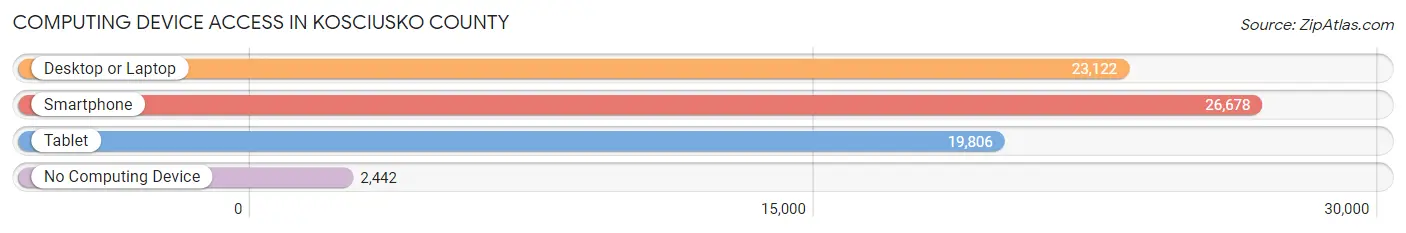
| Device Type | # Households | % Households |
| Desktop or Laptop | 23,122 | 73.8% |
| Smartphone | 26,678 | 85.2% |
| Tablet | 19,806 | 63.2% |
| No Computing Device | 2,442 | 7.8% |
| Total | 31,325 | 100.0% |
Internet Access in Kosciusko County
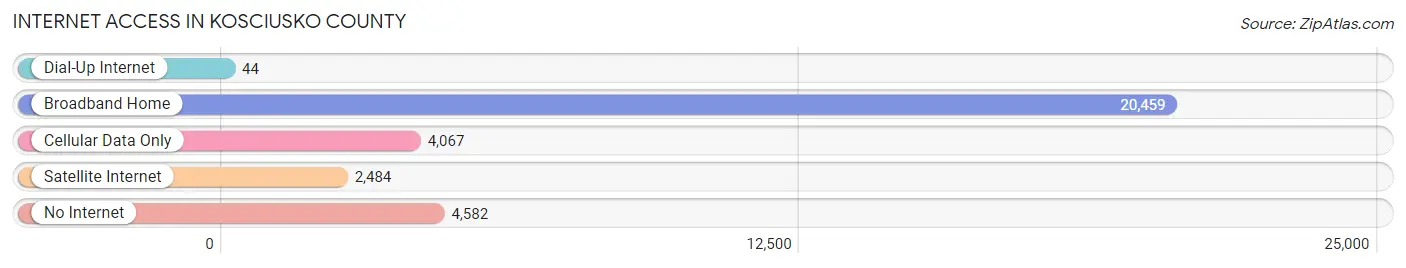
| Internet Type | # Households | % Households |
| Dial-Up Internet | 44 | 0.1% |
| Broadband Home | 20,459 | 65.3% |
| Cellular Data Only | 4,067 | 13.0% |
| Satellite Internet | 2,484 | 7.9% |
| No Internet | 4,582 | 14.6% |
| Total | 31,325 | 100.0% |
Kosciusko County Summary
Kosciusko County is located in the northern part of the state of Indiana, in the United States. It is part of the Wabash Valley region and is bordered by Elkhart, Marshall, Fulton, and Whitley counties. The county seat is Warsaw, and the county was named after the Polish military leader Tadeusz Kościuszko.
Geography
Kosciusko County is located in the northern part of Indiana, in the United States. It is part of the Wabash Valley region and is bordered by Elkhart, Marshall, Fulton, and Whitley counties. The county has a total area of 517 square miles, of which 514 square miles is land and 3 square miles is water. The county is mostly flat, with some rolling hills in the northern part. The highest point in the county is located in the northwest corner, at an elevation of 1,065 feet.
The county is drained by the Tippecanoe River, which flows through the center of the county from north to south. Other major waterways include the Elkhart River, which flows through the eastern part of the county, and the Eel River, which flows through the western part.
History
Kosciusko County was formed in 1836 from parts of Elkhart and Whitley counties. It was named after the Polish military leader Tadeusz Kościuszko, who fought in the American Revolutionary War. The county seat is Warsaw, which was founded in 1836 and named after the Polish capital.
The first settlers in the county were mostly of German and Dutch descent, and they established small farms and businesses. The county was largely agricultural, with corn, wheat, and oats being the main crops. In the late 19th century, the county began to industrialize, with the establishment of several factories and mills.
Economy
Kosciusko County has a diverse economy, with a mix of manufacturing, agriculture, and services. The county is home to several large employers, including Zimmer Biomet, a medical device manufacturer, and Zimmer Holdings, a medical device company. Other major employers include DePuy Synthes, a medical device manufacturer, and Zimmer Dental, a dental products manufacturer.
Agriculture is also an important part of the county’s economy. The main crops are corn, soybeans, wheat, and hay. Livestock production is also important, with beef cattle, dairy cattle, and hogs being the main animals raised.
Demographics
As of the 2010 census, the population of Kosciusko County was 77,358. The population is mostly white (94.3%), with small percentages of African Americans (2.2%), Hispanics (1.7%), and Asians (0.9%). The median household income is $50,945, and the median home value is $133,400.
The county is served by several school districts, including Warsaw Community Schools, Wawasee Community Schools, and Whitko Community Schools. The county is also home to several colleges and universities, including Grace College and Seminary, Indiana Wesleyan University, and Manchester University.
Conclusion
Kosciusko County is a diverse county located in the northern part of Indiana. It has a mix of manufacturing, agriculture, and services, and is home to several large employers. The population is mostly white, with small percentages of African Americans, Hispanics, and Asians. The county is served by several school districts and is home to several colleges and universities.
Common Questions
What is the Total Population of Kosciusko County?
Total Population of Kosciusko County is 80,442.
What is the Total Male Population of Kosciusko County?
Total Male Population of Kosciusko County is 40,282.
What is the Total Female Population of Kosciusko County?
Total Female Population of Kosciusko County is 40,160.
What is the Ratio of Males per 100 Females in Kosciusko County?
There are 100.30 Males per 100 Females in Kosciusko County.
What is the Ratio of Females per 100 Males in Kosciusko County?
There are 99.70 Females per 100 Males in Kosciusko County.
What is the Median Population Age in Kosciusko County?
Median Population Age in Kosciusko County is 39.0 Years.
What is the Average Family Size in Kosciusko County
Average Family Size in Kosciusko County is 3.1 People.
What is the Average Household Size in Kosciusko County
Average Household Size in Kosciusko County is 2.5 People.
What is Per Capita Income in Kosciusko County?
Per Capita income in Kosciusko County is $35,297.
What is the Median Family Income in Kosciusko County?
Median Family Income in Kosciusko County is $87,637.
What is the Median Household income in Kosciusko County?
Median Household Income in Kosciusko County is $70,945.
What is Income or Wage Gap in Kosciusko County?
Income or Wage Gap in Kosciusko County is 43.5%.
Women in Kosciusko County earn 56.5 cents for every dollar earned by a man.
What is Family Income Deficit in Kosciusko County?
Family Income Deficit in Kosciusko County is $10,130.
Families that are below poverty line in Kosciusko County earn $10,130 less on average than the poverty threshold level.
What is Inequality or Gini Index in Kosciusko County?
Inequality or Gini Index in Kosciusko County is 0.41.
How Large is the Labor Force in Kosciusko County?
There are 42,148 People in the Labor Forcein in Kosciusko County.
What is the Percentage of People in the Labor Force in Kosciusko County?
65.8% of People are in the Labor Force in Kosciusko County.
What is the Unemployment Rate in Kosciusko County?
Unemployment Rate in Kosciusko County is 3.3%.