Knox County, IN
Knox County Map
Knox County Overview
36,148
TOTAL POPULATION
18,385
MALE POPULATION
17,763
FEMALE POPULATION
103.50
MALES / 100 FEMALES
96.62
FEMALES / 100 MALES
38.9
MEDIAN AGE
2.9
AVG FAMILY SIZE
2.3
AVG HOUSEHOLD SIZE
$33,052
PER CAPITA INCOME
$76,970
AVG FAMILY INCOME
$58,173
AVG HOUSEHOLD INCOME
26.1%
WAGE / INCOME GAP [ % ]
73.9¢/ $1
WAGE / INCOME GAP [ $ ]
$9,922
FAMILY INCOME DEFICIT
0.45
INEQUALITY / GINI INDEX
18,493
LABOR FORCE [ PEOPLE ]
63.3%
PERCENT IN LABOR FORCE
3.2%
UNEMPLOYMENT RATE
Knox County Area Codes
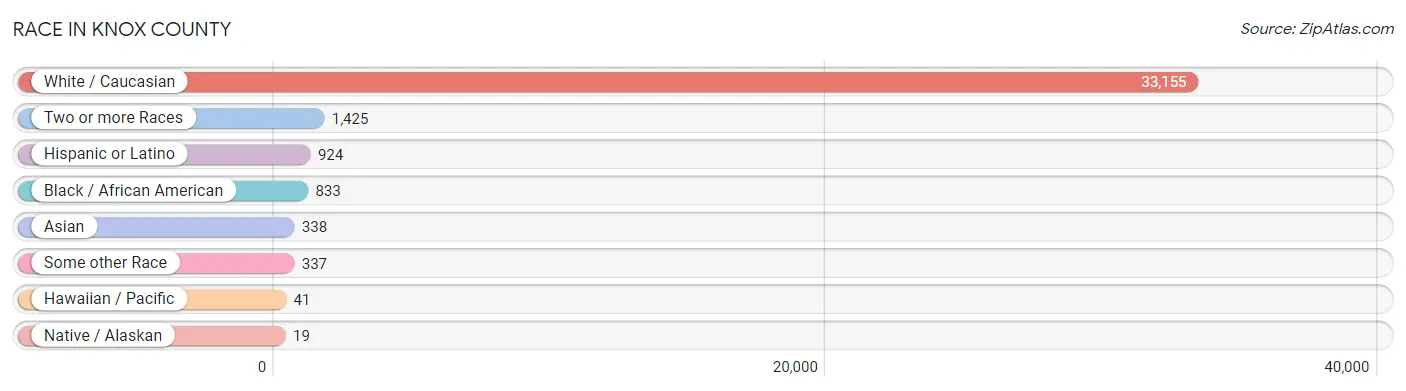
Race in Knox County
The most populous races in Knox County are White / Caucasian (33,155 | 91.7%), Two or more Races (1,425 | 3.9%), and Hispanic or Latino (924 | 2.6%).
| Race | # Population | % Population |
| Asian | 338 | 0.9% |
| Black / African American | 833 | 2.3% |
| Hawaiian / Pacific | 41 | 0.1% |
| Hispanic or Latino | 924 | 2.6% |
| Native / Alaskan | 19 | 0.1% |
| White / Caucasian | 33,155 | 91.7% |
| Two or more Races | 1,425 | 3.9% |
| Some other Race | 337 | 0.9% |
| Total | 36,148 | 100.0% |
Ancestry in Knox County
The most populous ancestries reported in Knox County are German (7,634 | 21.1%), English (3,457 | 9.6%), Irish (3,301 | 9.1%), American (3,213 | 8.9%), and French (1,099 | 3.0%), together accounting for 51.7% of all Knox County residents.

| Ancestry | # Population | % Population |
| African | 31 | 0.1% |
| American | 3,213 | 8.9% |
| Arab | 24 | 0.1% |
| Austrian | 38 | 0.1% |
| Belgian | 45 | 0.1% |
| Bhutanese | 8 | 0.0% |
| Blackfeet | 10 | 0.0% |
| British | 95 | 0.3% |
| Cajun | 3 | 0.0% |
| Cambodian | 2 | 0.0% |
| Canadian | 2 | 0.0% |
| Central American | 156 | 0.4% |
| Cherokee | 49 | 0.1% |
| Chickasaw | 5 | 0.0% |
| Choctaw | 5 | 0.0% |
| Creek | 2 | 0.0% |
| Croatian | 44 | 0.1% |
| Crow | 8 | 0.0% |
| Czechoslovakian | 26 | 0.1% |
| Danish | 62 | 0.2% |
| Dutch | 336 | 0.9% |
| Eastern European | 4 | 0.0% |
| English | 3,457 | 9.6% |
| European | 359 | 1.0% |
| French | 1,099 | 3.0% |
| French Canadian | 40 | 0.1% |
| German | 7,634 | 21.1% |
| Greek | 47 | 0.1% |
| Guatemalan | 156 | 0.4% |
| Haitian | 245 | 0.7% |
| Hungarian | 120 | 0.3% |
| Icelander | 1 | 0.0% |
| Indian (Asian) | 252 | 0.7% |
| Irish | 3,301 | 9.1% |
| Iroquois | 14 | 0.0% |
| Italian | 279 | 0.8% |
| Jordanian | 22 | 0.1% |
| Korean | 133 | 0.4% |
| Mexican | 555 | 1.5% |
| Native Hawaiian | 41 | 0.1% |
| Nigerian | 20 | 0.1% |
| Northern European | 3 | 0.0% |
| Norwegian | 81 | 0.2% |
| Pennsylvania German | 13 | 0.0% |
| Polish | 580 | 1.6% |
| Portuguese | 8 | 0.0% |
| Puerto Rican | 191 | 0.5% |
| Romanian | 102 | 0.3% |
| Russian | 6 | 0.0% |
| Scandinavian | 30 | 0.1% |
| Scotch-Irish | 297 | 0.8% |
| Scottish | 639 | 1.8% |
| Slovak | 69 | 0.2% |
| Spanish | 2 | 0.0% |
| Subsaharan African | 125 | 0.4% |
| Swedish | 33 | 0.1% |
| Swiss | 37 | 0.1% |
| Ukrainian | 3 | 0.0% |
| Welsh | 283 | 0.8% | View All 59 Rows |
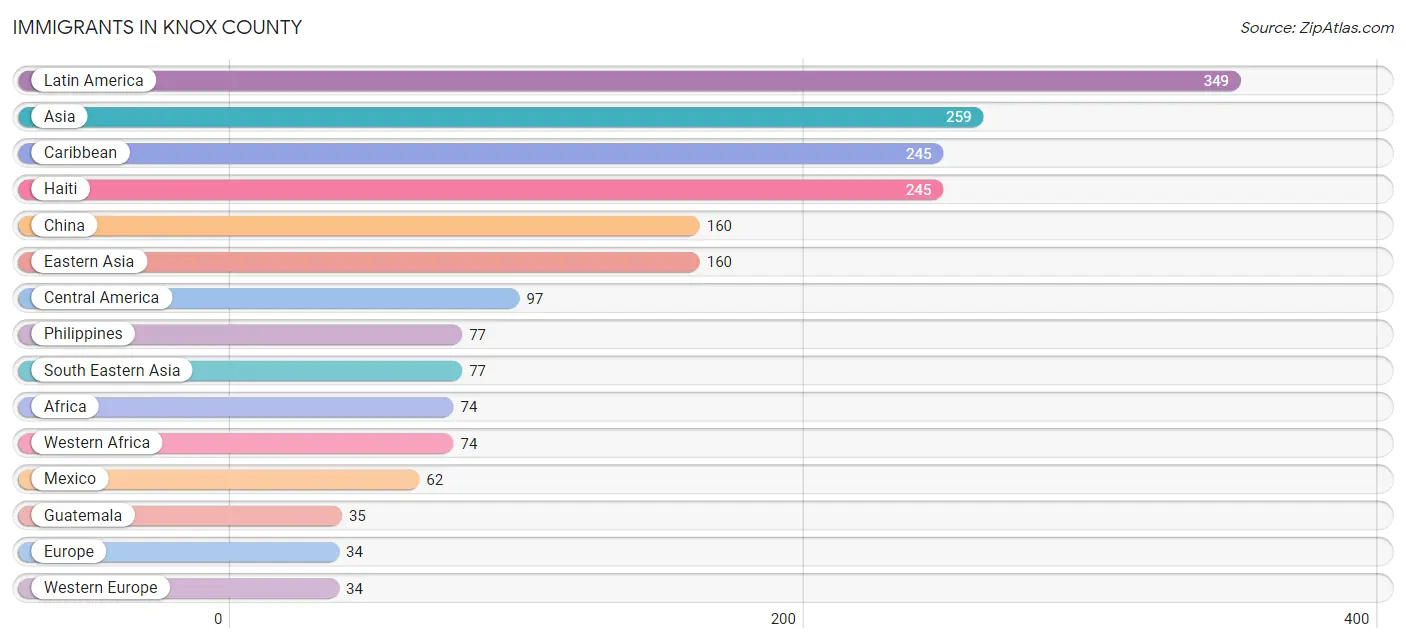
Immigrants in Knox County
The most numerous immigrant groups reported in Knox County came from Latin America (349 | 1.0%), Asia (259 | 0.7%), Caribbean (245 | 0.7%), Haiti (245 | 0.7%), and China (160 | 0.4%), together accounting for 3.5% of all Knox County residents.
| Immigration Origin | # Population | % Population |
| Africa | 74 | 0.2% |
| Asia | 259 | 0.7% |
| Brazil | 7 | 0.0% |
| Canada | 4 | 0.0% |
| Caribbean | 245 | 0.7% |
| Central America | 97 | 0.3% |
| China | 160 | 0.4% |
| Eastern Asia | 160 | 0.4% |
| Europe | 34 | 0.1% |
| France | 17 | 0.1% |
| Germany | 17 | 0.1% |
| Guatemala | 35 | 0.1% |
| Haiti | 245 | 0.7% |
| Jordan | 22 | 0.1% |
| Latin America | 349 | 1.0% |
| Mexico | 62 | 0.2% |
| Philippines | 77 | 0.2% |
| South America | 7 | 0.0% |
| South Eastern Asia | 77 | 0.2% |
| Western Africa | 74 | 0.2% |
| Western Asia | 22 | 0.1% |
| Western Europe | 34 | 0.1% | View All 22 Rows |
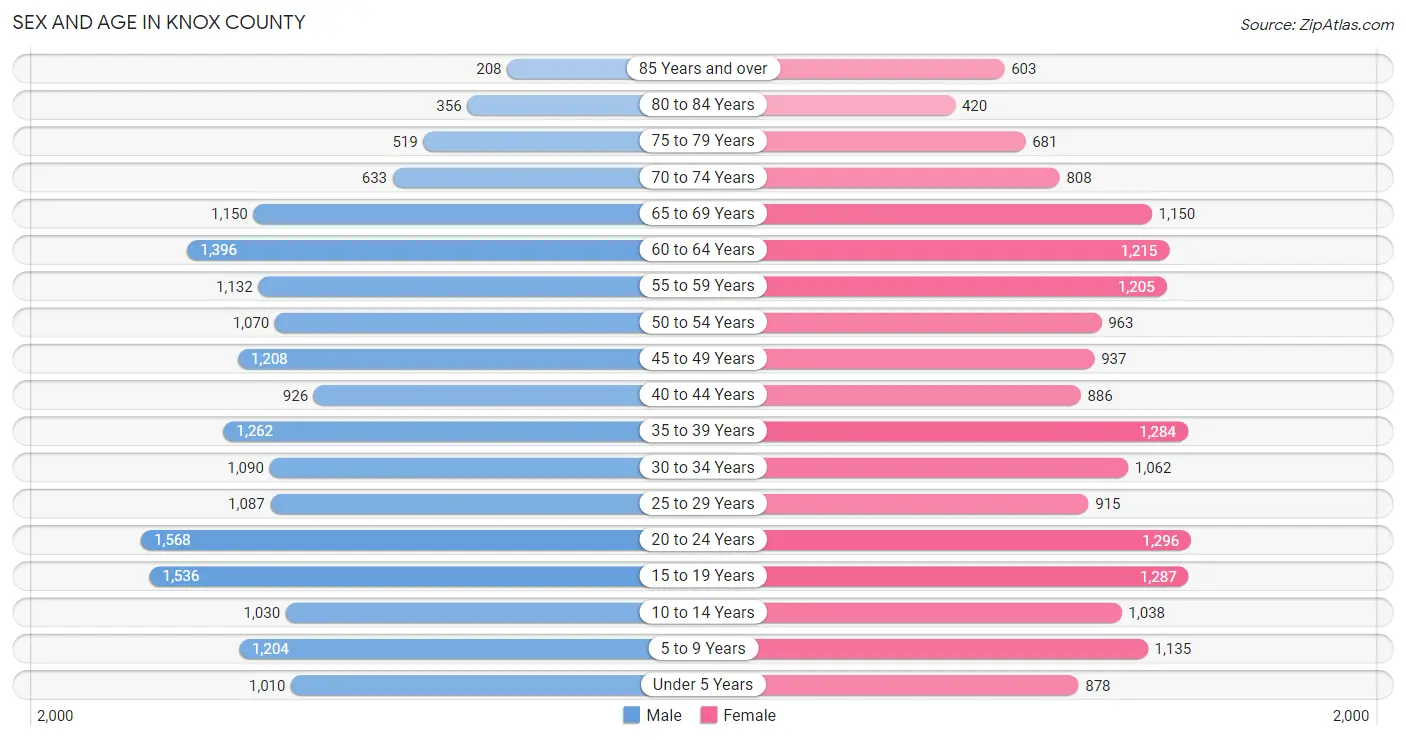
Sex and Age in Knox County
Sex and Age in Knox County
The most populous age groups in Knox County are 20 to 24 Years (1,568 | 8.5%) for men and 20 to 24 Years (1,296 | 7.3%) for women.
| Age Bracket | Male | Female |
| Under 5 Years | 1,010 (5.5%) | 878 (4.9%) |
| 5 to 9 Years | 1,204 (6.6%) | 1,135 (6.4%) |
| 10 to 14 Years | 1,030 (5.6%) | 1,038 (5.8%) |
| 15 to 19 Years | 1,536 (8.4%) | 1,287 (7.2%) |
| 20 to 24 Years | 1,568 (8.5%) | 1,296 (7.3%) |
| 25 to 29 Years | 1,087 (5.9%) | 915 (5.1%) |
| 30 to 34 Years | 1,090 (5.9%) | 1,062 (6.0%) |
| 35 to 39 Years | 1,262 (6.9%) | 1,284 (7.2%) |
| 40 to 44 Years | 926 (5.0%) | 886 (5.0%) |
| 45 to 49 Years | 1,208 (6.6%) | 937 (5.3%) |
| 50 to 54 Years | 1,070 (5.8%) | 963 (5.4%) |
| 55 to 59 Years | 1,132 (6.2%) | 1,205 (6.8%) |
| 60 to 64 Years | 1,396 (7.6%) | 1,215 (6.8%) |
| 65 to 69 Years | 1,150 (6.3%) | 1,150 (6.5%) |
| 70 to 74 Years | 633 (3.4%) | 808 (4.5%) |
| 75 to 79 Years | 519 (2.8%) | 681 (3.8%) |
| 80 to 84 Years | 356 (1.9%) | 420 (2.4%) |
| 85 Years and over | 208 (1.1%) | 603 (3.4%) |
| Total | 18,385 (100.0%) | 17,763 (100.0%) |
Families and Households in Knox County
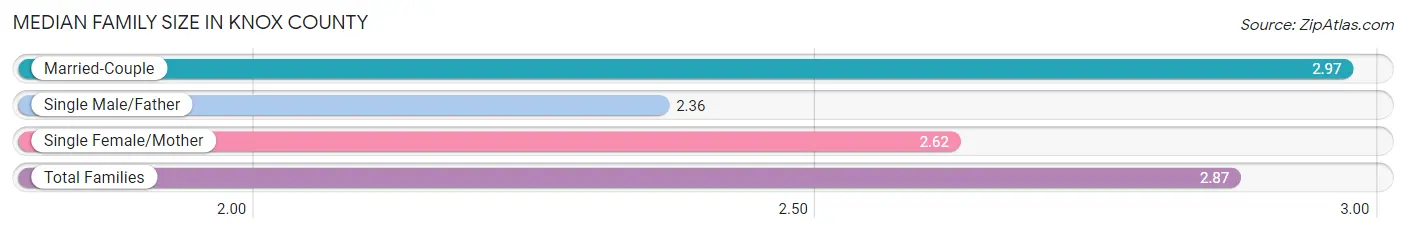
Median Family Size in Knox County
The median family size in Knox County is 2.87 persons per family, with married-couple families (7,427 | 78.2%) accounting for the largest median family size of 2.97 persons per family. On the other hand, single male/father families (843 | 8.9%) represent the smallest median family size with 2.36 persons per family.
| Family Type | # Families | Family Size |
| Married-Couple | 7,427 (78.2%) | 2.97 |
| Single Male/Father | 843 (8.9%) | 2.36 |
| Single Female/Mother | 1,229 (12.9%) | 2.62 |
| Total Families | 9,499 (100.0%) | 2.87 |
Median Household Size in Knox County
The median household size in Knox County is 2.29 persons per household, with married-couple households (7,427 | 49.7%) accounting for the largest median household size of 2.99 persons per household. non-family households (5,444 | 36.4%) represent the smallest median household size with 1.17 persons per household.

| Household Type | # Households | Household Size |
| Married-Couple | 7,427 (49.7%) | 2.99 |
| Single Male/Father | 843 (5.6%) | 2.69 |
| Single Female/Mother | 1,229 (8.2%) | 2.84 |
| Non-family | 5,444 (36.4%) | 1.17 |
| Total Households | 14,943 (100.0%) | 2.29 |
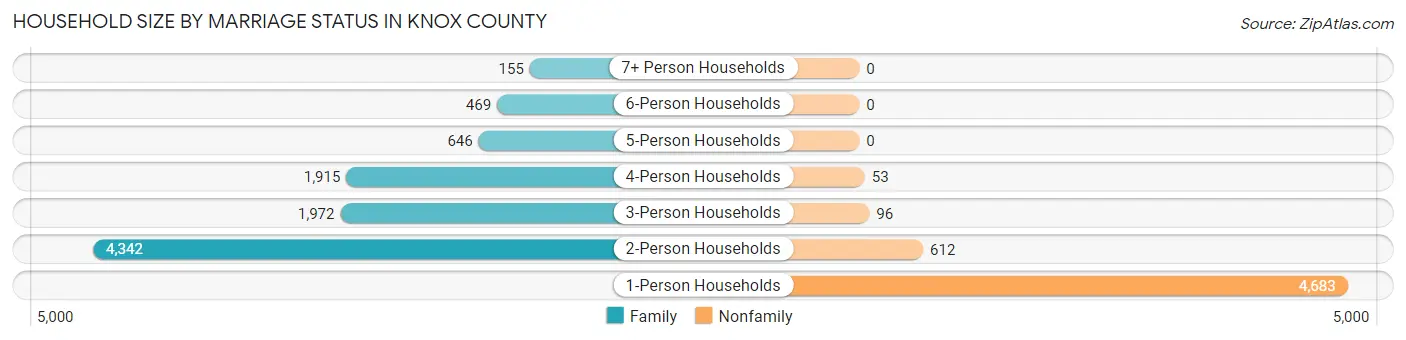
Household Size by Marriage Status in Knox County
Out of a total of 14,943 households in Knox County, 9,499 (63.6%) are family households, while 5,444 (36.4%) are nonfamily households. The most numerous type of family households are 2-person households, comprising 4,342, and the most common type of nonfamily households are 1-person households, comprising 4,683.
| Household Size | Family Households | Nonfamily Households |
| 1-Person Households | - | 4,683 (31.3%) |
| 2-Person Households | 4,342 (29.1%) | 612 (4.1%) |
| 3-Person Households | 1,972 (13.2%) | 96 (0.6%) |
| 4-Person Households | 1,915 (12.8%) | 53 (0.4%) |
| 5-Person Households | 646 (4.3%) | 0 (0.0%) |
| 6-Person Households | 469 (3.1%) | 0 (0.0%) |
| 7+ Person Households | 155 (1.0%) | 0 (0.0%) |
| Total | 9,499 (63.6%) | 5,444 (36.4%) |
Female Fertility in Knox County
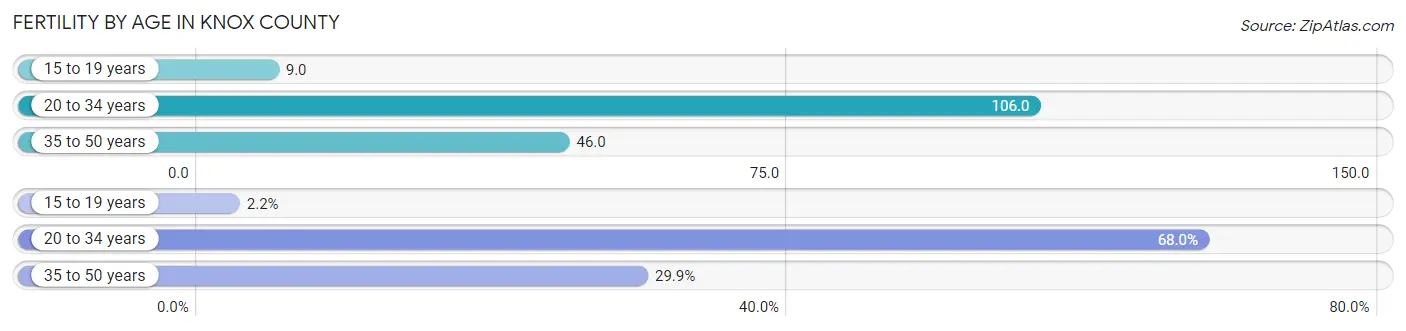
Fertility by Age in Knox County
Average fertility rate in Knox County is 65.0 births per 1,000 women. Women in the age bracket of 20 to 34 years have the highest fertility rate with 106.0 births per 1,000 women. Women in the age bracket of 20 to 34 years acount for 68.0% of all women with births.
| Age Bracket | Women with Births | Births / 1,000 Women |
| 15 to 19 years | 11 (2.2%) | 9.0 |
| 20 to 34 years | 346 (68.0%) | 106.0 |
| 35 to 50 years | 152 (29.9%) | 46.0 |
| Total | 509 (100.0%) | 65.0 |
Fertility by Age by Marriage Status in Knox County
64.0% of women with births (509) in Knox County are married. The highest percentage of unmarried women with births falls into 15 to 19 years age bracket with 100.0% of them unmarried at the time of birth, while the lowest percentage of unmarried women with births belong to 35 to 50 years age bracket with 12.5% of them unmarried.

| Age Bracket | Married | Unmarried |
| 15 to 19 years | 0 (0.0%) | 11 (100.0%) |
| 20 to 34 years | 193 (55.8%) | 153 (44.2%) |
| 35 to 50 years | 133 (87.5%) | 19 (12.5%) |
| Total | 326 (64.0%) | 183 (35.9%) |
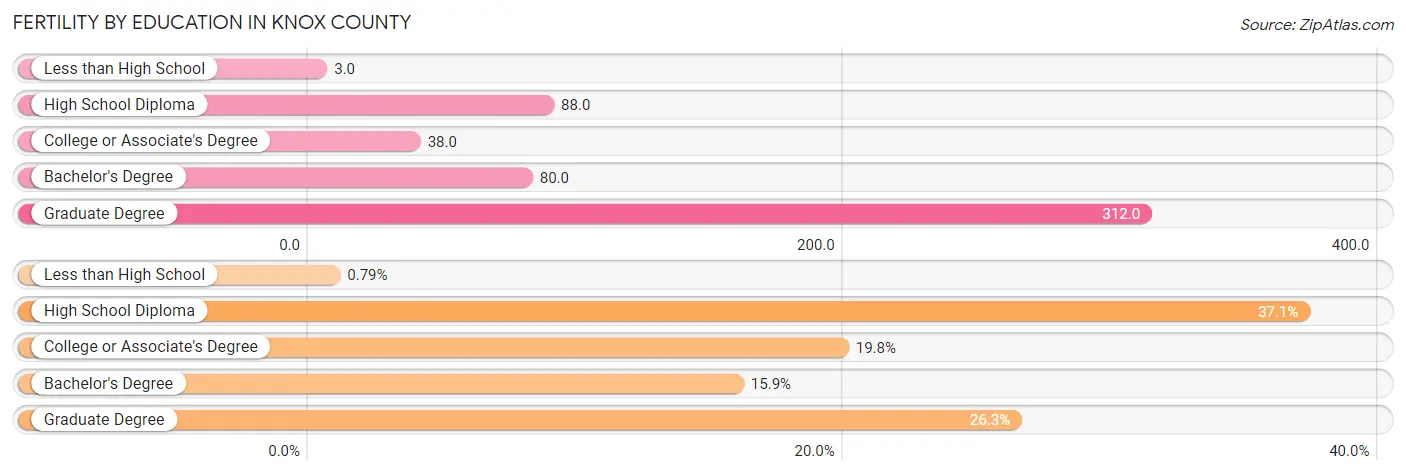
Fertility by Education in Knox County
Average fertility rate in Knox County is 65.0 births per 1,000 women. Women with the education attainment of graduate degree have the highest fertility rate of 312.0 births per 1,000 women, while women with the education attainment of less than high school have the lowest fertility at 3.0 births per 1,000 women. Women with the education attainment of high school diploma represent 37.1% of all women with births.
| Educational Attainment | Women with Births | Births / 1,000 Women |
| Less than High School | 4 (0.8%) | 3.0 |
| High School Diploma | 189 (37.1%) | 88.0 |
| College or Associate's Degree | 101 (19.8%) | 38.0 |
| Bachelor's Degree | 81 (15.9%) | 80.0 |
| Graduate Degree | 134 (26.3%) | 312.0 |
| Total | 509 (100.0%) | 65.0 |
Fertility by Education by Marriage Status in Knox County
35.9% of women with births in Knox County are unmarried. Women with the educational attainment of less than high school are most likely to be married with 100.0% of them married at childbirth, while women with the educational attainment of high school diploma are least likely to be married with 60.9% of them unmarried at childbirth.

| Educational Attainment | Married | Unmarried |
| Less than High School | 4 (100.0%) | 0 (0.0%) |
| High School Diploma | 74 (39.2%) | 115 (60.9%) |
| College or Associate's Degree | 55 (54.5%) | 46 (45.5%) |
| Bachelor's Degree | 59 (72.8%) | 22 (27.2%) |
| Graduate Degree | 134 (100.0%) | 0 (0.0%) |
| Total | 326 (64.0%) | 183 (35.9%) |
Income in Knox County
Income Overview in Knox County
Per Capita Income in Knox County is $33,052, while median incomes of families and households are $76,970 and $58,173 respectively.
| Characteristic | Number | Measure |
| Per Capita Income | 36,148 | $33,052 |
| Median Family Income | 9,499 | $76,970 |
| Mean Family Income | 9,499 | $94,420 |
| Median Household Income | 14,943 | $58,173 |
| Mean Household Income | 14,943 | $79,399 |
| Income Deficit | 9,499 | $9,922 |
| Wage / Income Gap (%) | 36,148 | 26.08% |
| Wage / Income Gap ($) | 36,148 | 73.92¢ per $1 |
| Gini / Inequality Index | 36,148 | 0.45 |
Earnings by Sex in Knox County
Average Earnings in Knox County are $37,069, $41,923 for men and $30,989 for women, a difference of 26.1%.
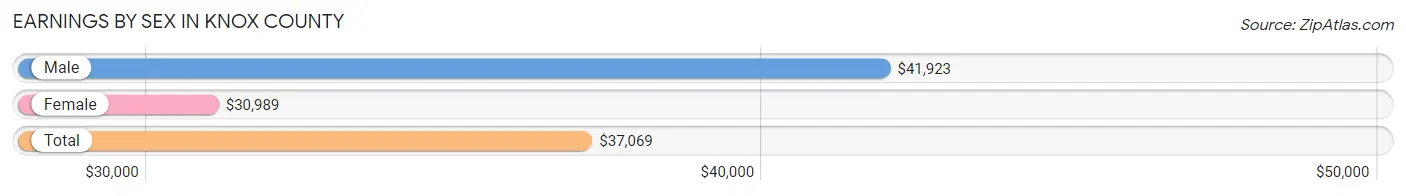
| Sex | Number | Average Earnings |
| Male | 10,609 (54.7%) | $41,923 |
| Female | 8,788 (45.3%) | $30,989 |
| Total | 19,397 (100.0%) | $37,069 |
Earnings by Sex by Income Bracket in Knox County
The most common earnings brackets in Knox County are $75,000 to $99,999 for men (1,383 | 13.0%) and $30,000 to $34,999 for women (862 | 9.8%).
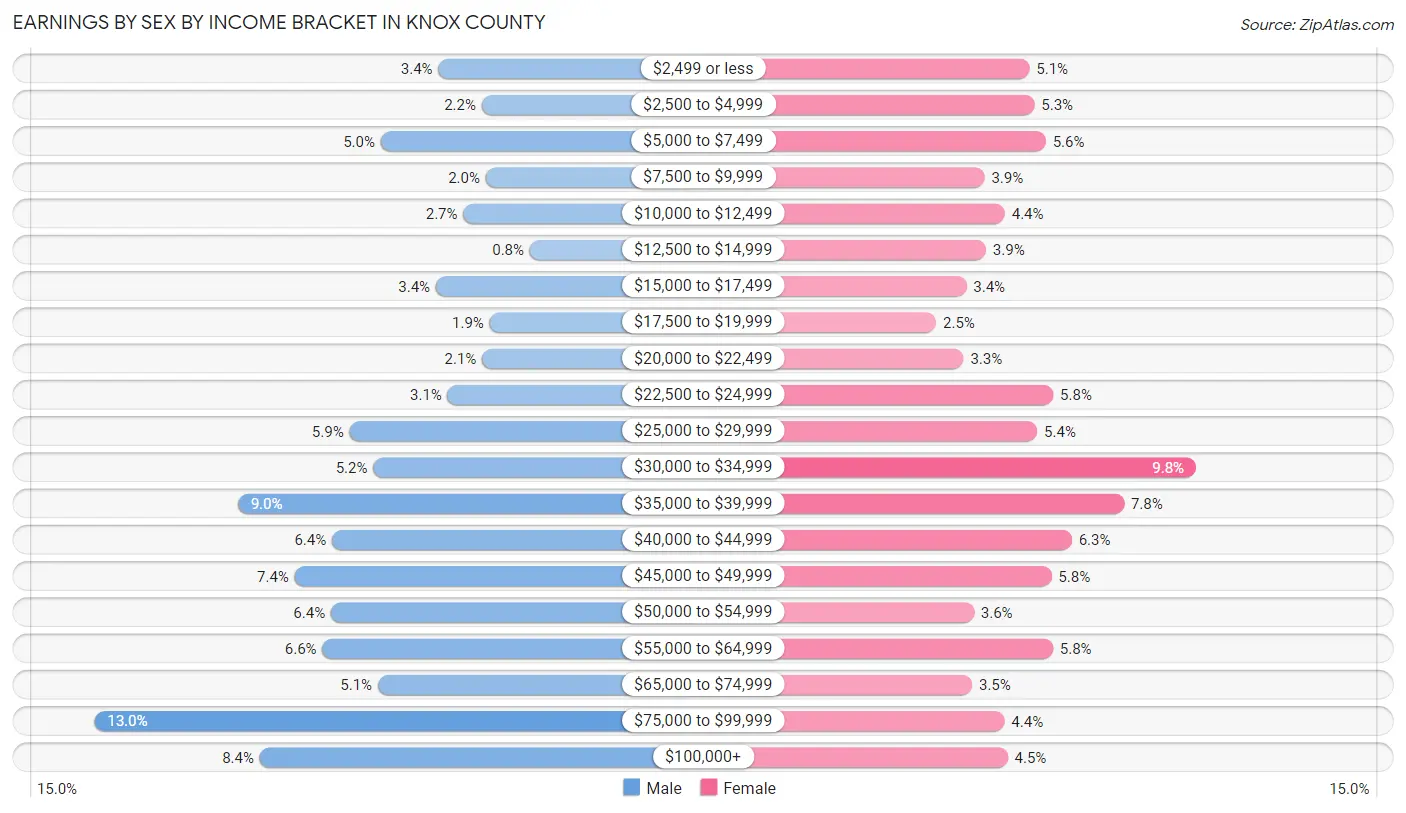
| Income | Male | Female |
| $2,499 or less | 357 (3.4%) | 451 (5.1%) |
| $2,500 to $4,999 | 228 (2.1%) | 463 (5.3%) |
| $5,000 to $7,499 | 529 (5.0%) | 491 (5.6%) |
| $7,500 to $9,999 | 216 (2.0%) | 340 (3.9%) |
| $10,000 to $12,499 | 283 (2.7%) | 390 (4.4%) |
| $12,500 to $14,999 | 85 (0.8%) | 344 (3.9%) |
| $15,000 to $17,499 | 365 (3.4%) | 295 (3.4%) |
| $17,500 to $19,999 | 205 (1.9%) | 221 (2.5%) |
| $20,000 to $22,499 | 227 (2.1%) | 288 (3.3%) |
| $22,500 to $24,999 | 330 (3.1%) | 510 (5.8%) |
| $25,000 to $29,999 | 623 (5.9%) | 470 (5.3%) |
| $30,000 to $34,999 | 552 (5.2%) | 862 (9.8%) |
| $35,000 to $39,999 | 956 (9.0%) | 685 (7.8%) |
| $40,000 to $44,999 | 675 (6.4%) | 555 (6.3%) |
| $45,000 to $49,999 | 786 (7.4%) | 505 (5.8%) |
| $50,000 to $54,999 | 678 (6.4%) | 314 (3.6%) |
| $55,000 to $64,999 | 703 (6.6%) | 509 (5.8%) |
| $65,000 to $74,999 | 538 (5.1%) | 309 (3.5%) |
| $75,000 to $99,999 | 1,383 (13.0%) | 389 (4.4%) |
| $100,000+ | 890 (8.4%) | 397 (4.5%) |
| Total | 10,609 (100.0%) | 8,788 (100.0%) |
Earnings by Sex by Educational Attainment in Knox County
Average earnings in Knox County are $47,946 for men and $34,340 for women, a difference of 28.4%. Men with an educational attainment of bachelor's degree enjoy the highest average annual earnings of $65,000, while those with less than high school education earn the least with $35,000. Women with an educational attainment of graduate degree earn the most with the average annual earnings of $80,392, while those with less than high school education have the smallest earnings of $23,562.
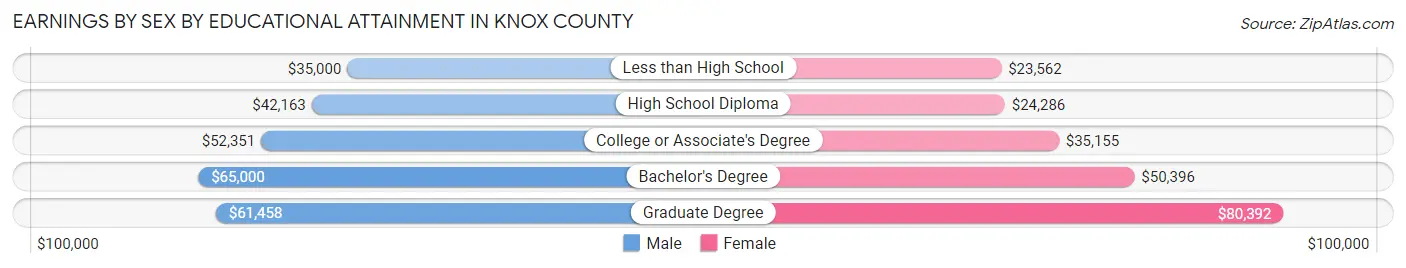
| Educational Attainment | Male Income | Female Income |
| Less than High School | $35,000 | $23,562 |
| High School Diploma | $42,163 | $24,286 |
| College or Associate's Degree | $52,351 | $35,155 |
| Bachelor's Degree | $65,000 | $50,396 |
| Graduate Degree | $61,458 | $80,392 |
| Total | $47,946 | $34,340 |
Family Income in Knox County
Family Income Brackets in Knox County
According to the Knox County family income data, there are 1,928 families falling into the $100,000 to $149,999 income range, which is the most common income bracket and makes up 20.3% of all families. Conversely, the $10,000 to $14,999 income bracket is the least frequent group with only 228 families (2.4%) belonging to this category.

| Income Bracket | # Families | % Families |
| Less than $10,000 | 256 | 2.7% |
| $10,000 to $14,999 | 228 | 2.4% |
| $15,000 to $24,999 | 598 | 6.3% |
| $25,000 to $34,999 | 446 | 4.7% |
| $35,000 to $49,999 | 1,216 | 12.8% |
| $50,000 to $74,999 | 1,843 | 19.4% |
| $75,000 to $99,999 | 1,558 | 16.4% |
| $100,000 to $149,999 | 1,928 | 20.3% |
| $150,000 to $199,999 | 655 | 6.9% |
| $200,000+ | 760 | 8.0% |
Family Income by Famaliy Size in Knox County
7+ person families (103 | 1.1%) account for the highest median family income in Knox County with $120,469 per family, while 2-person families (4,652 | 49.0%) have the highest median income of $32,928 per family member.
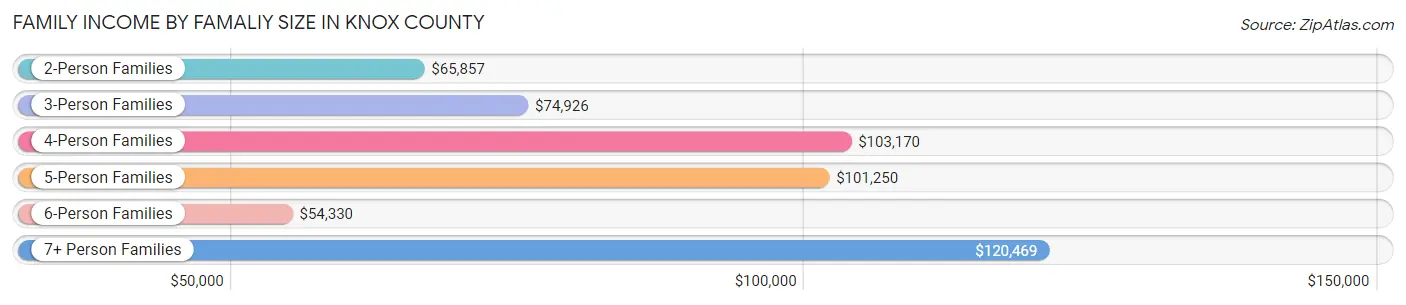
| Income Bracket | # Families | Median Income |
| 2-Person Families | 4,652 (49.0%) | $65,857 |
| 3-Person Families | 1,793 (18.9%) | $74,926 |
| 4-Person Families | 1,854 (19.5%) | $103,170 |
| 5-Person Families | 670 (7.0%) | $101,250 |
| 6-Person Families | 427 (4.5%) | $54,330 |
| 7+ Person Families | 103 (1.1%) | $120,469 |
| Total | 9,499 (100.0%) | $76,970 |
Family Income by Number of Earners in Knox County
The median family income in Knox County is $76,970, with families comprising 3+ earners (1,145) having the highest median family income of $137,054, while families with no earners (1,517) have the lowest median family income of $39,670, accounting for 12.0% and 16.0% of families, respectively.

| Number of Earners | # Families | Median Income |
| No Earners | 1,517 (16.0%) | $39,670 |
| 1 Earner | 2,870 (30.2%) | $53,896 |
| 2 Earners | 3,967 (41.8%) | $98,683 |
| 3+ Earners | 1,145 (12.0%) | $137,054 |
| Total | 9,499 (100.0%) | $76,970 |
Household Income in Knox County
Household Income Brackets in Knox County
With 2,630 households falling in the category, the $50,000 to $74,999 income range is the most frequent in Knox County, accounting for 17.6% of all households. In contrast, only 702 households (4.7%) fall into the $10,000 to $14,999 income bracket, making it the least populous group.

| Income Bracket | # Households | % Households |
| Less than $10,000 | 822 | 5.5% |
| $10,000 to $14,999 | 702 | 4.7% |
| $15,000 to $24,999 | 1,644 | 11.0% |
| $25,000 to $34,999 | 986 | 6.6% |
| $35,000 to $49,999 | 2,227 | 14.9% |
| $50,000 to $74,999 | 2,630 | 17.6% |
| $75,000 to $99,999 | 1,972 | 13.2% |
| $100,000 to $149,999 | 2,271 | 15.2% |
| $150,000 to $199,999 | 717 | 4.8% |
| $200,000+ | 956 | 6.4% |
Household Income by Householder Age in Knox County
The median household income in Knox County is $58,173, with the highest median household income of $73,294 found in the 45 to 64 years age bracket for the primary householder. A total of 5,405 households (36.2%) fall into this category. Meanwhile, the 15 to 24 years age bracket for the primary householder has the lowest median household income of $40,034, with 826 households (5.5%) in this group.

| Income Bracket | # Households | Median Income |
| 15 to 24 Years | 826 (5.5%) | $40,034 |
| 25 to 44 Years | 4,403 (29.5%) | $67,274 |
| 45 to 64 Years | 5,405 (36.2%) | $73,294 |
| 65+ Years | 4,309 (28.8%) | $46,203 |
| Total | 14,943 (100.0%) | $58,173 |
Poverty in Knox County
Income Below Poverty by Sex and Age in Knox County
With 9.7% poverty level for males and 16.8% for females among the residents of Knox County, under 5 year old males and 15 year old females are the most vulnerable to poverty, with 274 males (27.6%) and 84 females (28.4%) in their respective age groups living below the poverty level.

| Age Bracket | Male | Female |
| Under 5 Years | 274 (27.6%) | 154 (18.1%) |
| 5 Years | 27 (9.3%) | 13 (12.1%) |
| 6 to 11 Years | 74 (5.6%) | 239 (18.8%) |
| 12 to 14 Years | 96 (17.4%) | 149 (21.4%) |
| 15 Years | 15 (4.4%) | 84 (28.4%) |
| 16 and 17 Years | 3 (0.9%) | 107 (26.8%) |
| 18 to 24 Years | 285 (16.2%) | 359 (24.6%) |
| 25 to 34 Years | 242 (11.6%) | 276 (14.0%) |
| 35 to 44 Years | 88 (4.2%) | 568 (26.3%) |
| 45 to 54 Years | 192 (8.6%) | 218 (11.6%) |
| 55 to 64 Years | 278 (11.1%) | 263 (10.9%) |
| 65 to 74 Years | 55 (3.2%) | 240 (12.5%) |
| 75 Years and over | 42 (4.3%) | 179 (11.5%) |
| Total | 1,671 (9.7%) | 2,849 (16.8%) |
Income Above Poverty by Sex and Age in Knox County
According to the poverty statistics in Knox County, males aged 16 and 17 years and females aged 55 to 64 years are the age groups that are most secure financially, with 99.1% of males and 89.1% of females in these age groups living above the poverty line.

| Age Bracket | Male | Female |
| Under 5 Years | 718 (72.4%) | 696 (81.9%) |
| 5 Years | 263 (90.7%) | 94 (87.8%) |
| 6 to 11 Years | 1,259 (94.5%) | 1,030 (81.2%) |
| 12 to 14 Years | 457 (82.6%) | 546 (78.6%) |
| 15 Years | 323 (95.6%) | 212 (71.6%) |
| 16 and 17 Years | 317 (99.1%) | 292 (73.2%) |
| 18 to 24 Years | 1,476 (83.8%) | 1,102 (75.4%) |
| 25 to 34 Years | 1,838 (88.4%) | 1,701 (86.0%) |
| 35 to 44 Years | 2,030 (95.9%) | 1,593 (73.7%) |
| 45 to 54 Years | 2,045 (91.4%) | 1,668 (88.4%) |
| 55 to 64 Years | 2,220 (88.9%) | 2,148 (89.1%) |
| 65 to 74 Years | 1,683 (96.8%) | 1,675 (87.5%) |
| 75 Years and over | 934 (95.7%) | 1,384 (88.5%) |
| Total | 15,563 (90.3%) | 14,141 (83.2%) |
Income Below Poverty Among Married-Couple Families in Knox County
The poverty statistics for married-couple families in Knox County show that 3.1% or 232 of the total 7,427 families live below the poverty line. Families with 3 or 4 children have the highest poverty rate of 8.9%, comprising of 50 families. On the other hand, families with 5 or more children have the lowest poverty rate of 0.0%, which includes 0 families.

| Children | Above Poverty | Below Poverty |
| No Children | 4,496 (98.7%) | 58 (1.3%) |
| 1 or 2 Children | 2,156 (94.6%) | 124 (5.4%) |
| 3 or 4 Children | 514 (91.1%) | 50 (8.9%) |
| 5 or more Children | 29 (100.0%) | 0 (0.0%) |
| Total | 7,195 (96.9%) | 232 (3.1%) |
Income Below Poverty Among Single-Parent Households in Knox County
According to the poverty data in Knox County, 9.9% or 83 single-father households and 44.9% or 552 single-mother households are living below the poverty line. Among single-father households, those with 3 or 4 children have the highest poverty rate, with 21 households (30.9%) experiencing poverty. Likewise, among single-mother households, those with 1 or 2 children have the highest poverty rate, with 469 households (57.8%) falling below the poverty line.

| Children | Single Father | Single Mother |
| No Children | 30 (14.1%) | 35 (12.6%) |
| 1 or 2 Children | 32 (8.6%) | 469 (57.8%) |
| 3 or 4 Children | 21 (30.9%) | 48 (34.5%) |
| 5 or more Children | 0 (0.0%) | 0 (0.0%) |
| Total | 83 (9.9%) | 552 (44.9%) |
Income Below Poverty Among Married-Couple vs Single-Parent Households in Knox County
The poverty data for Knox County shows that 232 of the married-couple family households (3.1%) and 635 of the single-parent households (30.6%) are living below the poverty level. Within the married-couple family households, those with 3 or 4 children have the highest poverty rate, with 50 households (8.9%) falling below the poverty line. Among the single-parent households, those with 1 or 2 children have the highest poverty rate, with 501 household (42.3%) living below poverty.
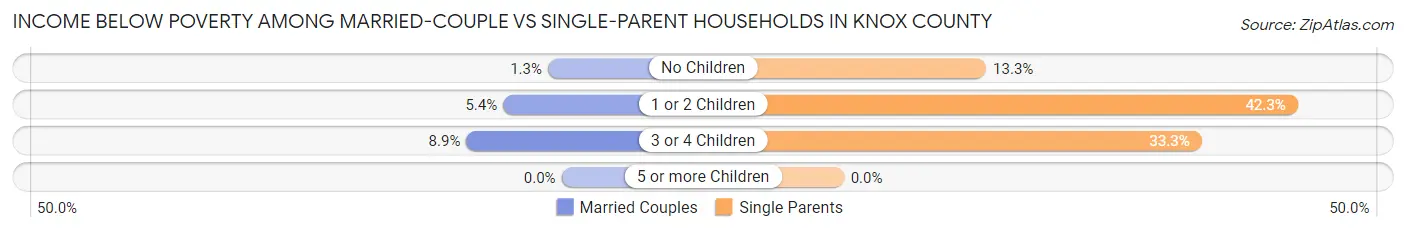
| Children | Married-Couple Families | Single-Parent Households |
| No Children | 58 (1.3%) | 65 (13.3%) |
| 1 or 2 Children | 124 (5.4%) | 501 (42.3%) |
| 3 or 4 Children | 50 (8.9%) | 69 (33.3%) |
| 5 or more Children | 0 (0.0%) | 0 (0.0%) |
| Total | 232 (3.1%) | 635 (30.6%) |
Employment Characteristics in Knox County
Employment by Class of Employer in Knox County
Among the 17,699 employed individuals in Knox County, private company employees (11,514 | 65.0%), not-for-profit organizations (2,496 | 14.1%), and local government employees (1,145 | 6.5%) make up the most common classes of employment.
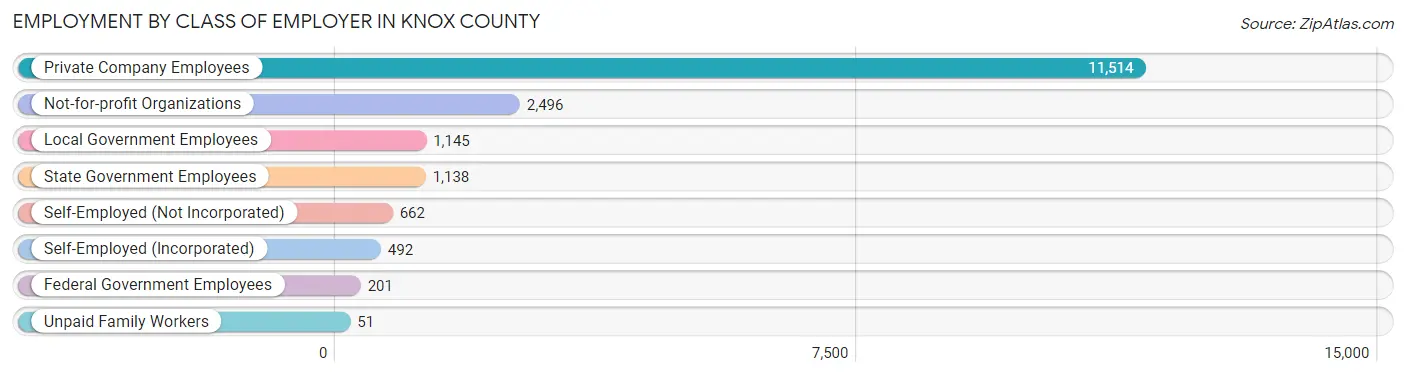
| Employer Class | # Employees | % Employees |
| Private Company Employees | 11,514 | 65.0% |
| Self-Employed (Incorporated) | 492 | 2.8% |
| Self-Employed (Not Incorporated) | 662 | 3.7% |
| Not-for-profit Organizations | 2,496 | 14.1% |
| Local Government Employees | 1,145 | 6.5% |
| State Government Employees | 1,138 | 6.4% |
| Federal Government Employees | 201 | 1.1% |
| Unpaid Family Workers | 51 | 0.3% |
| Total | 17,699 | 100.0% |
Employment Status by Age in Knox County
According to the labor force statistics for Knox County, out of the total population over 16 years of age (29,215), 63.3% or 18,493 individuals are in the labor force, with 3.2% or 592 of them unemployed. The age group with the highest labor force participation rate is 25 to 29 years, with 84.5% or 1,692 individuals in the labor force. Within the labor force, the 45 to 54 years age range has the highest percentage of unemployed individuals, with 6.3% or 217 of them being unemployed.
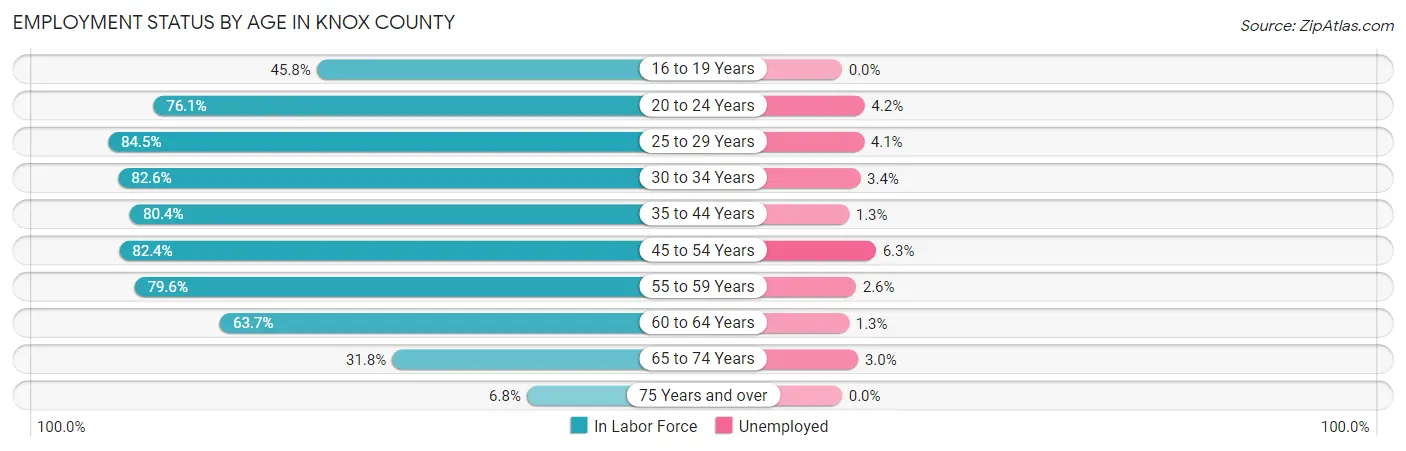
| Age Bracket | In Labor Force | Unemployed |
| 16 to 19 Years | 1,001 (45.8%) | 0 (0.0%) |
| 20 to 24 Years | 2,180 (76.1%) | 92 (4.2%) |
| 25 to 29 Years | 1,692 (84.5%) | 69 (4.1%) |
| 30 to 34 Years | 1,778 (82.6%) | 60 (3.4%) |
| 35 to 44 Years | 3,504 (80.4%) | 46 (1.3%) |
| 45 to 54 Years | 3,443 (82.4%) | 217 (6.3%) |
| 55 to 59 Years | 1,860 (79.6%) | 48 (2.6%) |
| 60 to 64 Years | 1,663 (63.7%) | 22 (1.3%) |
| 65 to 74 Years | 1,190 (31.8%) | 36 (3.0%) |
| 75 Years and over | 190 (6.8%) | 0 (0.0%) |
| Total | 18,493 (63.3%) | 592 (3.2%) |
Employment Status by Educational Attainment in Knox County
According to labor force statistics for Knox County, 79.0% of individuals (13,934) out of the total population between 25 and 64 years of age (17,638) are in the labor force, with 3.3% or 460 of them being unemployed. The group with the highest labor force participation rate are those with the educational attainment of bachelor's degree or higher, with 88.9% or 3,017 individuals in the labor force. Within the labor force, individuals with high school diploma education have the highest percentage of unemployment, with 6.8% or 301 of them being unemployed.

| Educational Attainment | In Labor Force | Unemployed |
| Less than High School | 983 (50.1%) | 118 (6.0%) |
| High School Diploma | 4,424 (77.8%) | 387 (6.8%) |
| College / Associate Degree | 5,513 (83.6%) | 66 (1.0%) |
| Bachelor's Degree or higher | 3,017 (88.9%) | 54 (1.6%) |
| Total | 13,934 (79.0%) | 582 (3.3%) |
Employment Occupations by Sex in Knox County
Management, Business, Science and Arts Occupations
The most common Management, Business, Science and Arts occupations in Knox County are Management (1,758 | 9.8%), Community & Social Service (1,637 | 9.1%), Health Diagnosing & Treating (1,417 | 7.9%), Education Instruction & Library (1,105 | 6.2%), and Health Technologists (937 | 5.2%).

Management, Business, Science and Arts Occupations by Sex
Within the Management, Business, Science and Arts occupations in Knox County, the most male-oriented occupations are Architecture & Engineering (98.5%), Computers, Engineering & Science (82.6%), and Computers & Mathematics (71.1%), while the most female-oriented occupations are Health Technologists (86.0%), Arts, Media & Entertainment (82.6%), and Health Diagnosing & Treating (77.0%).

| Occupation | Male | Female |
| Management | 1,022 (58.1%) | 736 (41.9%) |
| Business & Financial | 207 (42.3%) | 282 (57.7%) |
| Computers, Engineering & Science | 485 (82.6%) | 102 (17.4%) |
| Computers & Mathematics | 118 (71.1%) | 48 (28.9%) |
| Architecture & Engineering | 322 (98.5%) | 5 (1.5%) |
| Life, Physical & Social Science | 45 (47.9%) | 49 (52.1%) |
| Community & Social Service | 676 (41.3%) | 961 (58.7%) |
| Education, Arts & Media | 172 (44.0%) | 219 (56.0%) |
| Legal Services & Support | 30 (61.2%) | 19 (38.8%) |
| Education Instruction & Library | 458 (41.4%) | 647 (58.6%) |
| Arts, Media & Entertainment | 16 (17.4%) | 76 (82.6%) |
| Health Diagnosing & Treating | 326 (23.0%) | 1,091 (77.0%) |
| Health Technologists | 131 (14.0%) | 806 (86.0%) |
| Total (Category) | 2,716 (46.1%) | 3,172 (53.9%) |
| Total (Overall) | 9,728 (54.3%) | 8,184 (45.7%) |
Services Occupations
The most common Services occupations in Knox County are Food Preparation & Serving (1,089 | 6.1%), Cleaning & Maintenance (1,026 | 5.7%), Healthcare Support (685 | 3.8%), Security & Protection (468 | 2.6%), and Personal Care & Service (414 | 2.3%).

Services Occupations by Sex
Within the Services occupations in Knox County, the most male-oriented occupations are Law Enforcement (89.8%), Security & Protection (75.0%), and Cleaning & Maintenance (72.8%), while the most female-oriented occupations are Healthcare Support (80.0%), Personal Care & Service (66.2%), and Food Preparation & Serving (54.0%).

| Occupation | Male | Female |
| Healthcare Support | 137 (20.0%) | 548 (80.0%) |
| Security & Protection | 351 (75.0%) | 117 (25.0%) |
| Firefighting & Prevention | 184 (65.2%) | 98 (34.7%) |
| Law Enforcement | 167 (89.8%) | 19 (10.2%) |
| Food Preparation & Serving | 501 (46.0%) | 588 (54.0%) |
| Cleaning & Maintenance | 747 (72.8%) | 279 (27.2%) |
| Personal Care & Service | 140 (33.8%) | 274 (66.2%) |
| Total (Category) | 1,876 (50.9%) | 1,806 (49.0%) |
| Total (Overall) | 9,728 (54.3%) | 8,184 (45.7%) |
Sales and Office Occupations
The most common Sales and Office occupations in Knox County are Office & Administration (1,743 | 9.7%), and Sales & Related (1,530 | 8.5%).

Sales and Office Occupations by Sex

| Occupation | Male | Female |
| Sales & Related | 534 (34.9%) | 996 (65.1%) |
| Office & Administration | 349 (20.0%) | 1,394 (80.0%) |
| Total (Category) | 883 (27.0%) | 2,390 (73.0%) |
| Total (Overall) | 9,728 (54.3%) | 8,184 (45.7%) |
Natural Resources, Construction and Maintenance Occupations
The most common Natural Resources, Construction and Maintenance occupations in Knox County are Construction & Extraction (832 | 4.6%), Installation, Maintenance & Repair (566 | 3.2%), and Farming, Fishing & Forestry (216 | 1.2%).
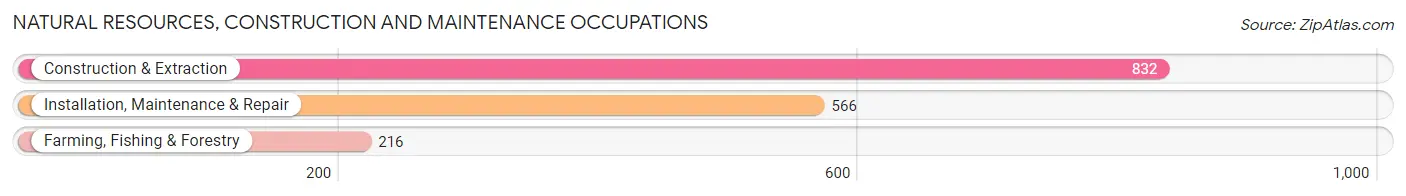
Natural Resources, Construction and Maintenance Occupations by Sex
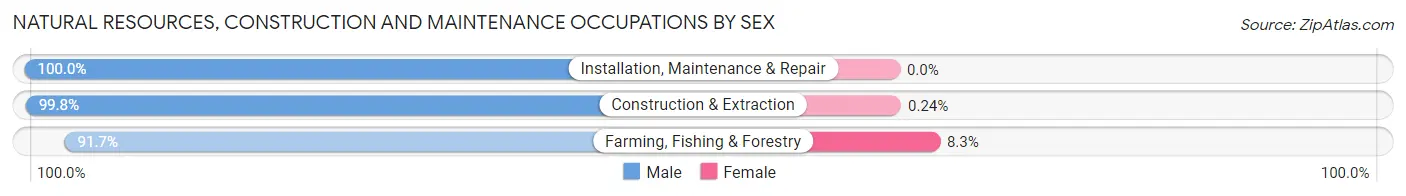
| Occupation | Male | Female |
| Farming, Fishing & Forestry | 198 (91.7%) | 18 (8.3%) |
| Construction & Extraction | 830 (99.8%) | 2 (0.2%) |
| Installation, Maintenance & Repair | 566 (100.0%) | 0 (0.0%) |
| Total (Category) | 1,594 (98.8%) | 20 (1.2%) |
| Total (Overall) | 9,728 (54.3%) | 8,184 (45.7%) |
Production, Transportation and Moving Occupations
The most common Production, Transportation and Moving occupations in Knox County are Production (1,854 | 10.3%), Material Moving (900 | 5.0%), and Transportation (701 | 3.9%).

Production, Transportation and Moving Occupations by Sex
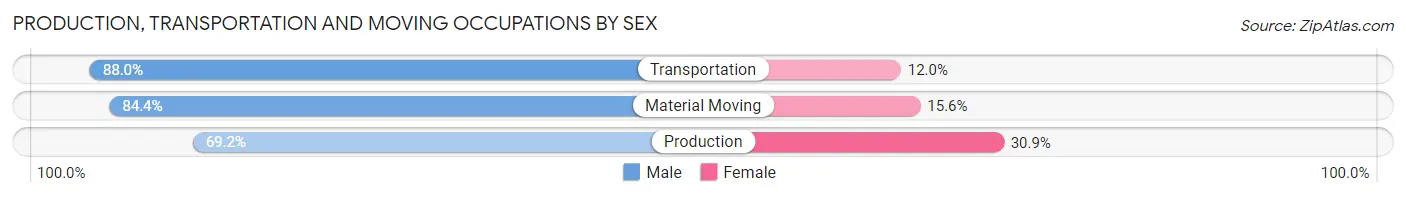
| Occupation | Male | Female |
| Production | 1,282 (69.2%) | 572 (30.8%) |
| Transportation | 617 (88.0%) | 84 (12.0%) |
| Material Moving | 760 (84.4%) | 140 (15.6%) |
| Total (Category) | 2,659 (77.0%) | 796 (23.0%) |
| Total (Overall) | 9,728 (54.3%) | 8,184 (45.7%) |
Employment Industries by Sex in Knox County
Employment Industries in Knox County
The major employment industries in Knox County include Manufacturing (3,277 | 18.3%), Health Care & Social Assistance (2,970 | 16.6%), Retail Trade (2,324 | 13.0%), Educational Services (2,015 | 11.3%), and Accommodation & Food Services (1,269 | 7.1%).

Employment Industries by Sex in Knox County
The Knox County industries that see more men than women are Mining, Quarrying, & Extraction (99.4%), Agriculture, Fishing & Hunting (95.7%), and Construction (92.1%), whereas the industries that tend to have a higher number of women are Enterprise Management (100.0%), Health Care & Social Assistance (77.7%), and Finance & Insurance (75.9%).
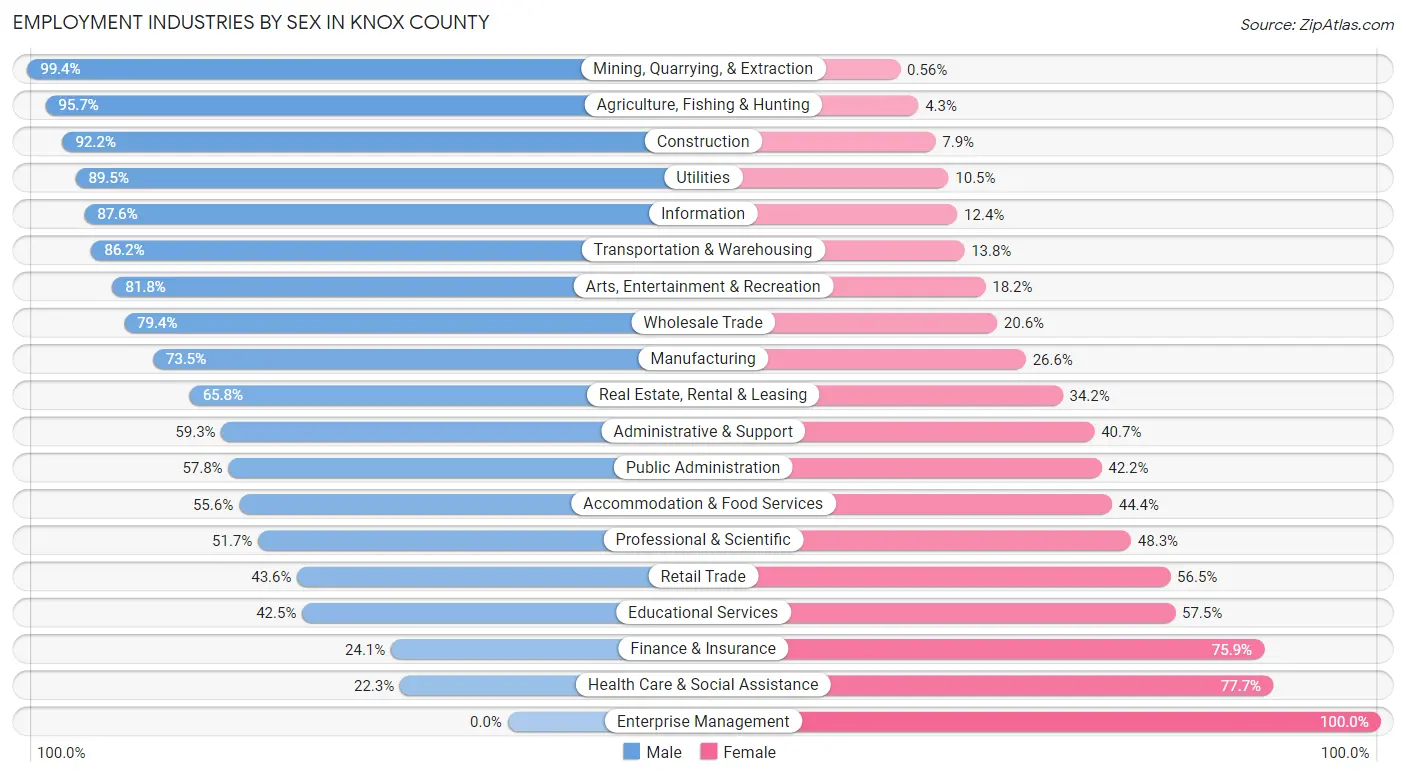
| Industry | Male | Female |
| Agriculture, Fishing & Hunting | 422 (95.7%) | 19 (4.3%) |
| Mining, Quarrying, & Extraction | 352 (99.4%) | 2 (0.6%) |
| Construction | 552 (92.1%) | 47 (7.9%) |
| Manufacturing | 2,407 (73.5%) | 870 (26.6%) |
| Wholesale Trade | 216 (79.4%) | 56 (20.6%) |
| Retail Trade | 1,012 (43.5%) | 1,312 (56.5%) |
| Transportation & Warehousing | 505 (86.2%) | 81 (13.8%) |
| Utilities | 297 (89.5%) | 35 (10.5%) |
| Information | 78 (87.6%) | 11 (12.4%) |
| Finance & Insurance | 98 (24.1%) | 308 (75.9%) |
| Real Estate, Rental & Leasing | 129 (65.8%) | 67 (34.2%) |
| Professional & Scientific | 186 (51.7%) | 174 (48.3%) |
| Enterprise Management | 0 (0.0%) | 33 (100.0%) |
| Administrative & Support | 304 (59.3%) | 209 (40.7%) |
| Educational Services | 857 (42.5%) | 1,158 (57.5%) |
| Health Care & Social Assistance | 662 (22.3%) | 2,308 (77.7%) |
| Arts, Entertainment & Recreation | 63 (81.8%) | 14 (18.2%) |
| Accommodation & Food Services | 706 (55.6%) | 563 (44.4%) |
| Public Administration | 570 (57.8%) | 416 (42.2%) |
| Total | 9,728 (54.3%) | 8,184 (45.7%) |
Education in Knox County
School Enrollment in Knox County
The most common levels of schooling among the 8,724 students in Knox County are college / undergraduate (2,364 | 27.1%), elementary school (1,969 | 22.6%), and high school (1,758 | 20.2%).
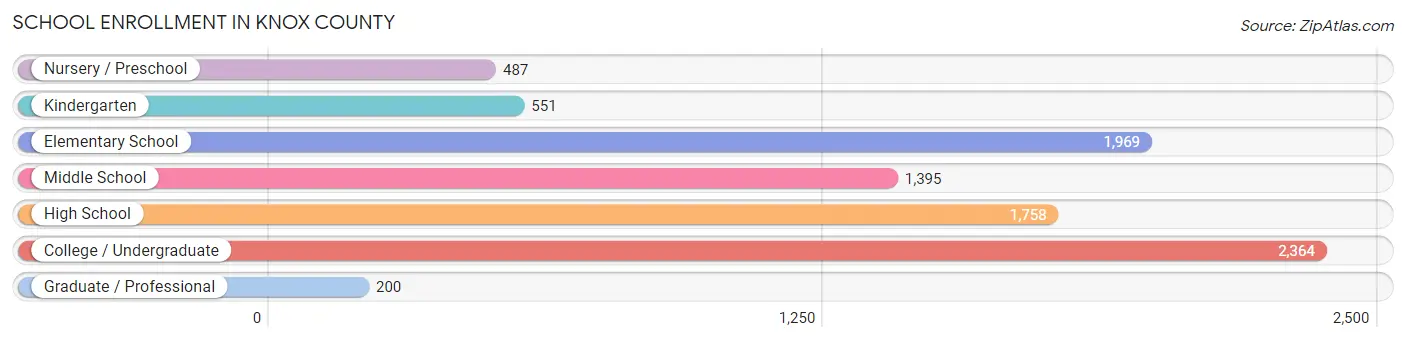
| School Level | # Students | % Students |
| Nursery / Preschool | 487 | 5.6% |
| Kindergarten | 551 | 6.3% |
| Elementary School | 1,969 | 22.6% |
| Middle School | 1,395 | 16.0% |
| High School | 1,758 | 20.2% |
| College / Undergraduate | 2,364 | 27.1% |
| Graduate / Professional | 200 | 2.3% |
| Total | 8,724 | 100.0% |
School Enrollment by Age by Funding Source in Knox County
Out of a total of 8,724 students who are enrolled in schools in Knox County, 759 (8.7%) attend a private institution, while the remaining 7,965 (91.3%) are enrolled in public schools. The age group of 3 to 4 year olds has the highest likelihood of being enrolled in private schools, with 111 (34.4% in the age bracket) enrolled. Conversely, the age group of 25 to 34 year olds has the lowest likelihood of being enrolled in a private school, with 420 (99.5% in the age bracket) attending a public institution.

| Age Bracket | Public School | Private School |
| 3 to 4 Year Olds | 212 (65.6%) | 111 (34.4%) |
| 5 to 9 Year Old | 2,125 (93.3%) | 152 (6.7%) |
| 10 to 14 Year Olds | 1,787 (88.5%) | 233 (11.5%) |
| 15 to 17 Year Olds | 1,082 (84.3%) | 201 (15.7%) |
| 18 to 19 Year Olds | 1,249 (98.7%) | 17 (1.3%) |
| 20 to 24 Year Olds | 858 (95.1%) | 44 (4.9%) |
| 25 to 34 Year Olds | 420 (99.5%) | 2 (0.5%) |
| 35 Years and over | 229 (99.1%) | 2 (0.9%) |
| Total | 7,965 (91.3%) | 759 (8.7%) |
Educational Attainment by Field of Study in Knox County
Education (1,013 | 21.9%), science & technology (819 | 17.7%), business (668 | 14.4%), social sciences (354 | 7.6%), and arts & humanities (303 | 6.5%) are the most common fields of study among 4,634 individuals in Knox County who have obtained a bachelor's degree or higher.

| Field of Study | # Graduates | % Graduates |
| Computers & Mathematics | 170 | 3.7% |
| Bio, Nature & Agricultural | 282 | 6.1% |
| Physical & Health Sciences | 104 | 2.2% |
| Psychology | 168 | 3.6% |
| Social Sciences | 354 | 7.6% |
| Engineering | 253 | 5.5% |
| Multidisciplinary Studies | 0 | 0.0% |
| Science & Technology | 819 | 17.7% |
| Business | 668 | 14.4% |
| Education | 1,013 | 21.9% |
| Literature & Languages | 82 | 1.8% |
| Liberal Arts & History | 164 | 3.5% |
| Visual & Performing Arts | 68 | 1.5% |
| Communications | 186 | 4.0% |
| Arts & Humanities | 303 | 6.5% |
| Total | 4,634 | 100.0% |
Transportation & Commute in Knox County
Vehicle Availability by Sex in Knox County
The most prevalent vehicle ownership categories in Knox County are males with 2 vehicles (3,736, accounting for 39.9%) and females with 2 vehicles (2,973, making up 48.0%).

| Vehicles Available | Male | Female |
| No Vehicle | 173 (1.8%) | 119 (1.5%) |
| 1 Vehicle | 1,264 (13.5%) | 1,419 (18.2%) |
| 2 Vehicles | 3,736 (39.9%) | 2,973 (38.2%) |
| 3 Vehicles | 2,645 (28.2%) | 1,881 (24.1%) |
| 4 Vehicles | 1,239 (13.2%) | 1,111 (14.3%) |
| 5 or more Vehicles | 319 (3.4%) | 286 (3.7%) |
| Total | 9,376 (100.0%) | 7,789 (100.0%) |
Commute Time in Knox County
The most frequently occuring commute durations in Knox County are 10 to 14 minutes (4,010 commuters, 23.2%), 5 to 9 minutes (3,213 commuters, 18.5%), and 15 to 19 minutes (2,270 commuters, 13.1%).
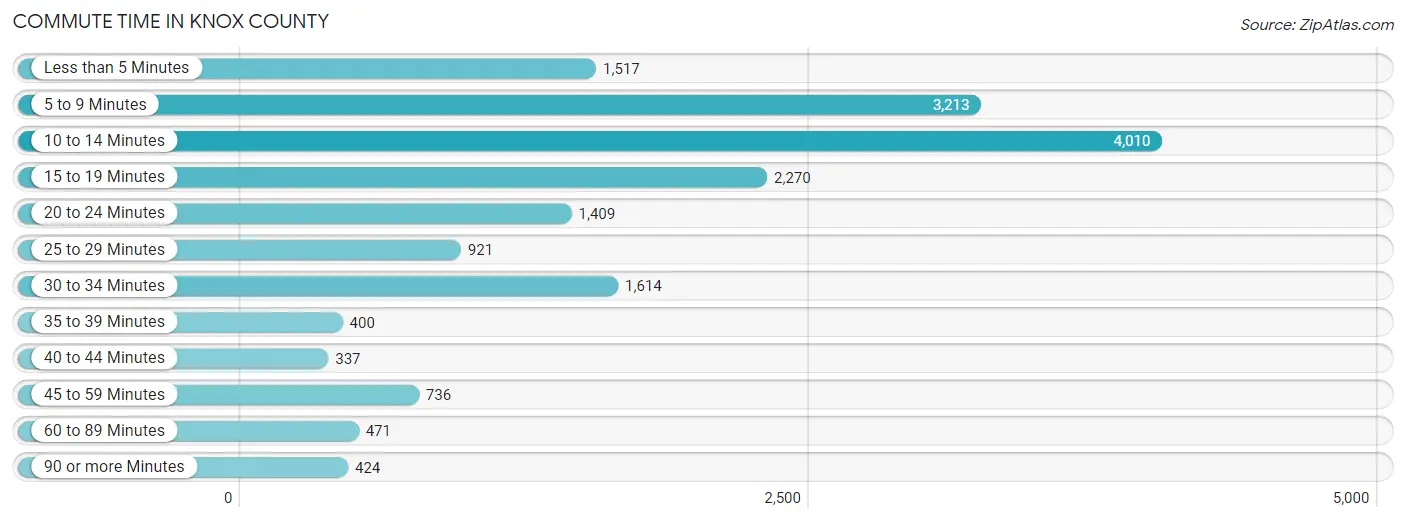
| Commute Time | # Commuters | % Commuters |
| Less than 5 Minutes | 1,517 | 8.8% |
| 5 to 9 Minutes | 3,213 | 18.5% |
| 10 to 14 Minutes | 4,010 | 23.2% |
| 15 to 19 Minutes | 2,270 | 13.1% |
| 20 to 24 Minutes | 1,409 | 8.1% |
| 25 to 29 Minutes | 921 | 5.3% |
| 30 to 34 Minutes | 1,614 | 9.3% |
| 35 to 39 Minutes | 400 | 2.3% |
| 40 to 44 Minutes | 337 | 1.9% |
| 45 to 59 Minutes | 736 | 4.3% |
| 60 to 89 Minutes | 471 | 2.7% |
| 90 or more Minutes | 424 | 2.5% |
Commute Time by Sex in Knox County
The most common commute times in Knox County are 10 to 14 minutes (1,884 commuters, 20.0%) for males and 10 to 14 minutes (2,126 commuters, 26.9%) for females.

| Commute Time | Male | Female |
| Less than 5 Minutes | 810 (8.6%) | 707 (8.9%) |
| 5 to 9 Minutes | 1,761 (18.7%) | 1,452 (18.3%) |
| 10 to 14 Minutes | 1,884 (20.0%) | 2,126 (26.9%) |
| 15 to 19 Minutes | 1,145 (12.2%) | 1,125 (14.2%) |
| 20 to 24 Minutes | 620 (6.6%) | 789 (10.0%) |
| 25 to 29 Minutes | 534 (5.7%) | 387 (4.9%) |
| 30 to 34 Minutes | 962 (10.2%) | 652 (8.2%) |
| 35 to 39 Minutes | 298 (3.2%) | 102 (1.3%) |
| 40 to 44 Minutes | 224 (2.4%) | 113 (1.4%) |
| 45 to 59 Minutes | 629 (6.7%) | 107 (1.3%) |
| 60 to 89 Minutes | 250 (2.7%) | 221 (2.8%) |
| 90 or more Minutes | 291 (3.1%) | 133 (1.7%) |
Time of Departure to Work by Sex in Knox County
The most frequent times of departure to work in Knox County are 6:30 AM to 6:59 AM (1,598, 17.0%) for males and 7:30 AM to 7:59 AM (1,763, 22.3%) for females.
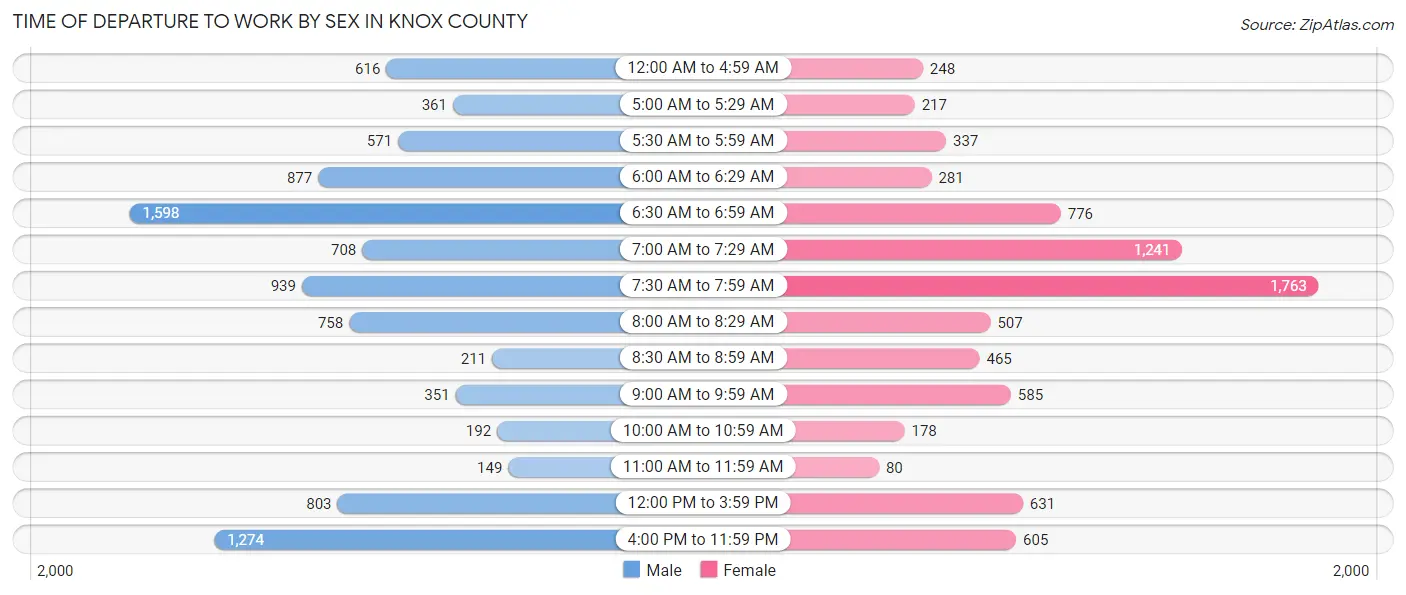
| Time of Departure | Male | Female |
| 12:00 AM to 4:59 AM | 616 (6.6%) | 248 (3.1%) |
| 5:00 AM to 5:29 AM | 361 (3.8%) | 217 (2.7%) |
| 5:30 AM to 5:59 AM | 571 (6.1%) | 337 (4.3%) |
| 6:00 AM to 6:29 AM | 877 (9.3%) | 281 (3.5%) |
| 6:30 AM to 6:59 AM | 1,598 (17.0%) | 776 (9.8%) |
| 7:00 AM to 7:29 AM | 708 (7.5%) | 1,241 (15.7%) |
| 7:30 AM to 7:59 AM | 939 (10.0%) | 1,763 (22.3%) |
| 8:00 AM to 8:29 AM | 758 (8.1%) | 507 (6.4%) |
| 8:30 AM to 8:59 AM | 211 (2.2%) | 465 (5.9%) |
| 9:00 AM to 9:59 AM | 351 (3.7%) | 585 (7.4%) |
| 10:00 AM to 10:59 AM | 192 (2.0%) | 178 (2.2%) |
| 11:00 AM to 11:59 AM | 149 (1.6%) | 80 (1.0%) |
| 12:00 PM to 3:59 PM | 803 (8.5%) | 631 (8.0%) |
| 4:00 PM to 11:59 PM | 1,274 (13.5%) | 605 (7.6%) |
| Total | 9,408 (100.0%) | 7,914 (100.0%) |
Housing Occupancy in Knox County
Occupancy by Ownership in Knox County
Of the total 14,943 dwellings in Knox County, owner-occupied units account for 9,787 (65.5%), while renter-occupied units make up 5,156 (34.5%).

| Occupancy | # Housing Units | % Housing Units |
| Owner Occupied Housing Units | 9,787 | 65.5% |
| Renter-Occupied Housing Units | 5,156 | 34.5% |
| Total Occupied Housing Units | 14,943 | 100.0% |
Occupancy by Household Size in Knox County

| Household Size | # Housing Units | % Housing Units |
| 1-Person Household | 4,683 | 31.3% |
| 2-Person Household | 4,954 | 33.2% |
| 3-Person Household | 2,068 | 13.8% |
| 4+ Person Household | 3,238 | 21.7% |
| Total Housing Units | 14,943 | 100.0% |
Occupancy by Ownership by Household Size in Knox County
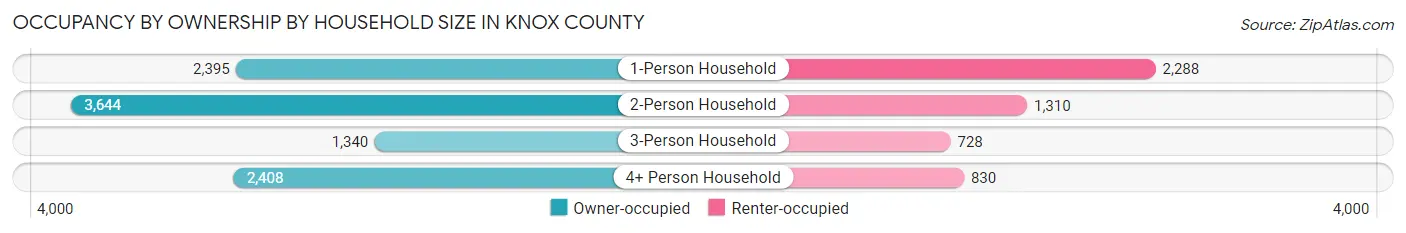
| Household Size | Owner-occupied | Renter-occupied |
| 1-Person Household | 2,395 (51.1%) | 2,288 (48.9%) |
| 2-Person Household | 3,644 (73.6%) | 1,310 (26.4%) |
| 3-Person Household | 1,340 (64.8%) | 728 (35.2%) |
| 4+ Person Household | 2,408 (74.4%) | 830 (25.6%) |
| Total Housing Units | 9,787 (65.5%) | 5,156 (34.5%) |
Occupancy by Educational Attainment in Knox County

| Household Size | Owner-occupied | Renter-occupied |
| Less than High School | 775 (43.6%) | 1,003 (56.4%) |
| High School Diploma | 2,839 (57.3%) | 2,118 (42.7%) |
| College/Associate Degree | 3,802 (69.7%) | 1,656 (30.3%) |
| Bachelor's Degree or higher | 2,371 (86.2%) | 379 (13.8%) |
Occupancy by Age of Householder in Knox County
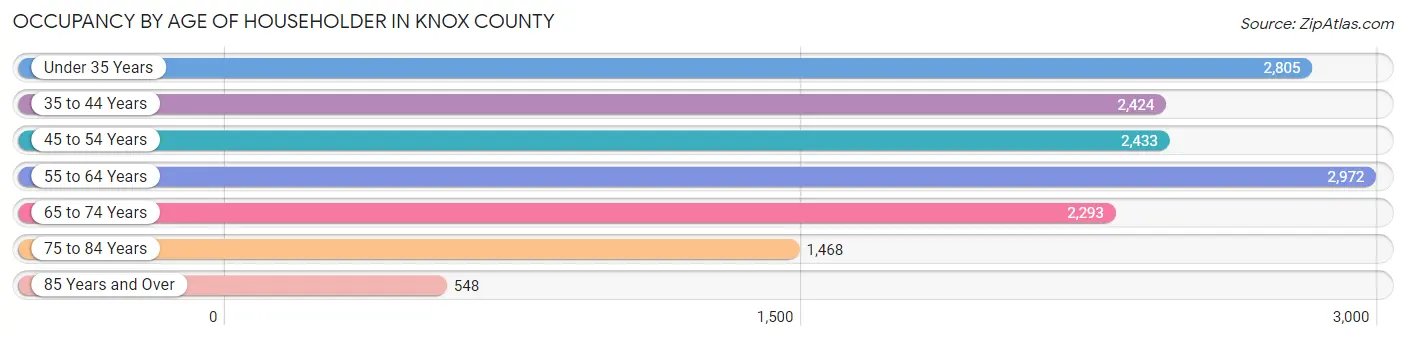
| Age Bracket | # Households | % Households |
| Under 35 Years | 2,805 | 18.8% |
| 35 to 44 Years | 2,424 | 16.2% |
| 45 to 54 Years | 2,433 | 16.3% |
| 55 to 64 Years | 2,972 | 19.9% |
| 65 to 74 Years | 2,293 | 15.3% |
| 75 to 84 Years | 1,468 | 9.8% |
| 85 Years and Over | 548 | 3.7% |
| Total | 14,943 | 100.0% |
Housing Finances in Knox County
Median Income by Occupancy in Knox County

| Occupancy Type | # Households | Median Income |
| Owner-Occupied | 9,787 (65.5%) | $77,124 |
| Renter-Occupied | 5,156 (34.5%) | $36,222 |
| Average | 14,943 (100.0%) | $58,173 |
Occupancy by Householder Income Bracket in Knox County

| Income Bracket | Owner-occupied | Renter-occupied |
| Less than $5,000 | 217 (2.2%) | 275 (5.3%) |
| $5,000 to $9,999 | 117 (1.2%) | 218 (4.2%) |
| $10,000 to $14,999 | 120 (1.2%) | 588 (11.4%) |
| $15,000 to $19,999 | 144 (1.5%) | 403 (7.8%) |
| $20,000 to $24,999 | 481 (4.9%) | 613 (11.9%) |
| $25,000 to $34,999 | 551 (5.6%) | 438 (8.5%) |
| $35,000 to $49,999 | 1,204 (12.3%) | 1,028 (19.9%) |
| $50,000 to $74,999 | 1,910 (19.5%) | 726 (14.1%) |
| $75,000 to $99,999 | 1,596 (16.3%) | 372 (7.2%) |
| $100,000 to $149,999 | 2,053 (21.0%) | 217 (4.2%) |
| $150,000 or more | 1,394 (14.2%) | 278 (5.4%) |
| Total | 9,787 (100.0%) | 5,156 (100.0%) |
Monthly Housing Cost Tiers in Knox County
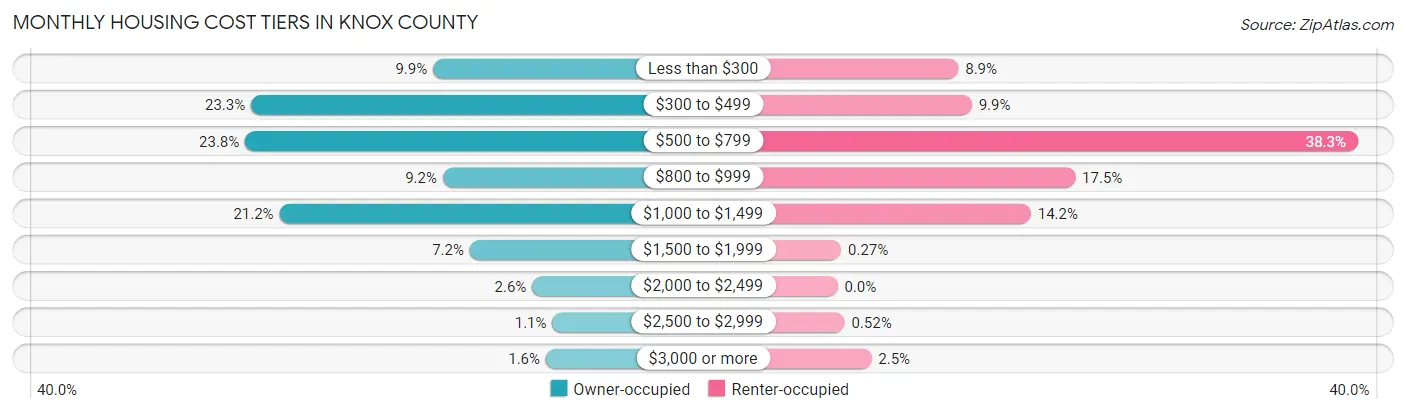
| Monthly Cost | Owner-occupied | Renter-occupied |
| Less than $300 | 971 (9.9%) | 459 (8.9%) |
| $300 to $499 | 2,282 (23.3%) | 510 (9.9%) |
| $500 to $799 | 2,325 (23.8%) | 1,976 (38.3%) |
| $800 to $999 | 900 (9.2%) | 903 (17.5%) |
| $1,000 to $1,499 | 2,078 (21.2%) | 734 (14.2%) |
| $1,500 to $1,999 | 706 (7.2%) | 14 (0.3%) |
| $2,000 to $2,499 | 256 (2.6%) | 0 (0.0%) |
| $2,500 to $2,999 | 111 (1.1%) | 27 (0.5%) |
| $3,000 or more | 158 (1.6%) | 129 (2.5%) |
| Total | 9,787 (100.0%) | 5,156 (100.0%) |
Physical Housing Characteristics in Knox County
Housing Structures in Knox County

| Structure Type | # Housing Units | % Housing Units |
| Single Unit, Detached | 11,190 | 74.9% |
| Single Unit, Attached | 158 | 1.1% |
| 2 Unit Apartments | 1,085 | 7.3% |
| 3 or 4 Unit Apartments | 583 | 3.9% |
| 5 to 9 Unit Apartments | 428 | 2.9% |
| 10 or more Apartments | 764 | 5.1% |
| Mobile Home / Other | 735 | 4.9% |
| Total | 14,943 | 100.0% |
Housing Structures by Occupancy in Knox County
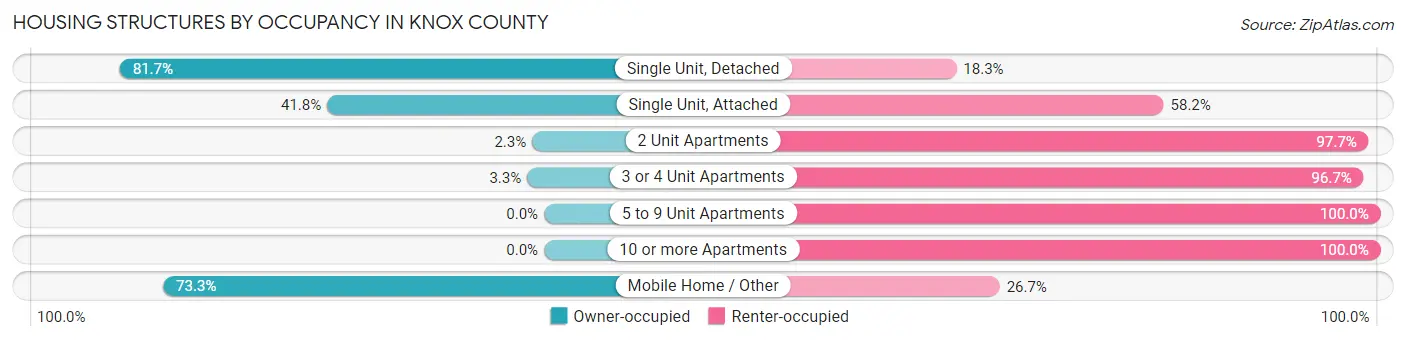
| Structure Type | Owner-occupied | Renter-occupied |
| Single Unit, Detached | 9,138 (81.7%) | 2,052 (18.3%) |
| Single Unit, Attached | 66 (41.8%) | 92 (58.2%) |
| 2 Unit Apartments | 25 (2.3%) | 1,060 (97.7%) |
| 3 or 4 Unit Apartments | 19 (3.3%) | 564 (96.7%) |
| 5 to 9 Unit Apartments | 0 (0.0%) | 428 (100.0%) |
| 10 or more Apartments | 0 (0.0%) | 764 (100.0%) |
| Mobile Home / Other | 539 (73.3%) | 196 (26.7%) |
| Total | 9,787 (65.5%) | 5,156 (34.5%) |
Housing Structures by Number of Rooms in Knox County
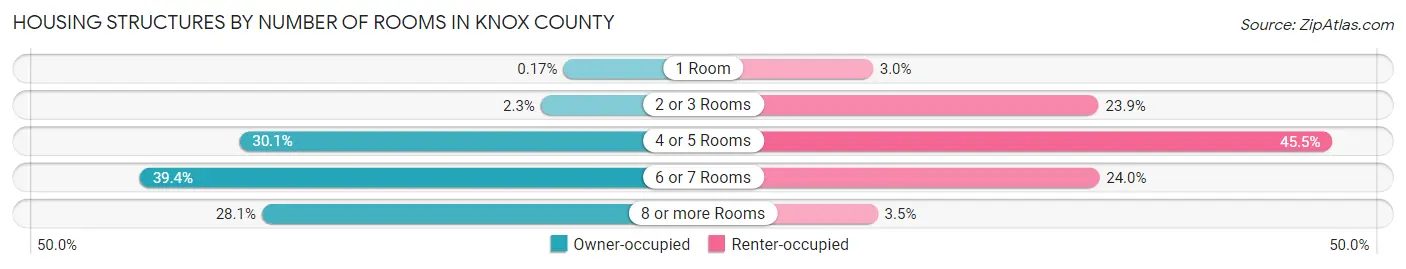
| Number of Rooms | Owner-occupied | Renter-occupied |
| 1 Room | 17 (0.2%) | 157 (3.0%) |
| 2 or 3 Rooms | 222 (2.3%) | 1,234 (23.9%) |
| 4 or 5 Rooms | 2,950 (30.1%) | 2,348 (45.5%) |
| 6 or 7 Rooms | 3,851 (39.4%) | 1,237 (24.0%) |
| 8 or more Rooms | 2,747 (28.1%) | 180 (3.5%) |
| Total | 9,787 (100.0%) | 5,156 (100.0%) |
Housing Structure by Heating Type in Knox County

| Heating Type | Owner-occupied | Renter-occupied |
| Utility Gas | 5,696 (58.2%) | 2,075 (40.2%) |
| Bottled, Tank, or LP Gas | 1,302 (13.3%) | 290 (5.6%) |
| Electricity | 2,546 (26.0%) | 2,661 (51.6%) |
| Fuel Oil or Kerosene | 77 (0.8%) | 10 (0.2%) |
| Coal or Coke | 0 (0.0%) | 0 (0.0%) |
| All other Fuels | 141 (1.4%) | 79 (1.5%) |
| No Fuel Used | 25 (0.3%) | 41 (0.8%) |
| Total | 9,787 (100.0%) | 5,156 (100.0%) |
Household Vehicle Usage in Knox County

| Vehicles per Household | Owner-occupied | Renter-occupied |
| No Vehicle | 197 (2.0%) | 847 (16.4%) |
| 1 Vehicle | 2,182 (22.3%) | 2,409 (46.7%) |
| 2 Vehicles | 3,977 (40.6%) | 1,361 (26.4%) |
| 3 or more Vehicles | 3,431 (35.1%) | 539 (10.4%) |
| Total | 9,787 (100.0%) | 5,156 (100.0%) |
Real Estate & Mortgages in Knox County
Real Estate and Mortgage Overview in Knox County
| Characteristic | Without Mortgage | With Mortgage |
| Housing Units | 4,397 | 5,390 |
| Median Property Value | $93,100 | $141,600 |
| Median Household Income | $61,791 | $868 |
| Monthly Housing Costs | $420 | $158 |
| Real Estate Taxes | $753 | $190 |
Property Value by Mortgage Status in Knox County

| Property Value | Without Mortgage | With Mortgage |
| Less than $50,000 | 1,139 (25.9%) | 442 (8.2%) |
| $50,000 to $99,999 | 1,192 (27.1%) | 1,412 (26.2%) |
| $100,000 to $299,999 | 1,854 (42.2%) | 2,913 (54.0%) |
| $300,000 to $499,999 | 139 (3.2%) | 482 (8.9%) |
| $500,000 to $749,999 | 57 (1.3%) | 112 (2.1%) |
| $750,000 to $999,999 | 3 (0.1%) | 0 (0.0%) |
| $1,000,000 or more | 13 (0.3%) | 29 (0.5%) |
| Total | 4,397 (100.0%) | 5,390 (100.0%) |
Household Income by Mortgage Status in Knox County
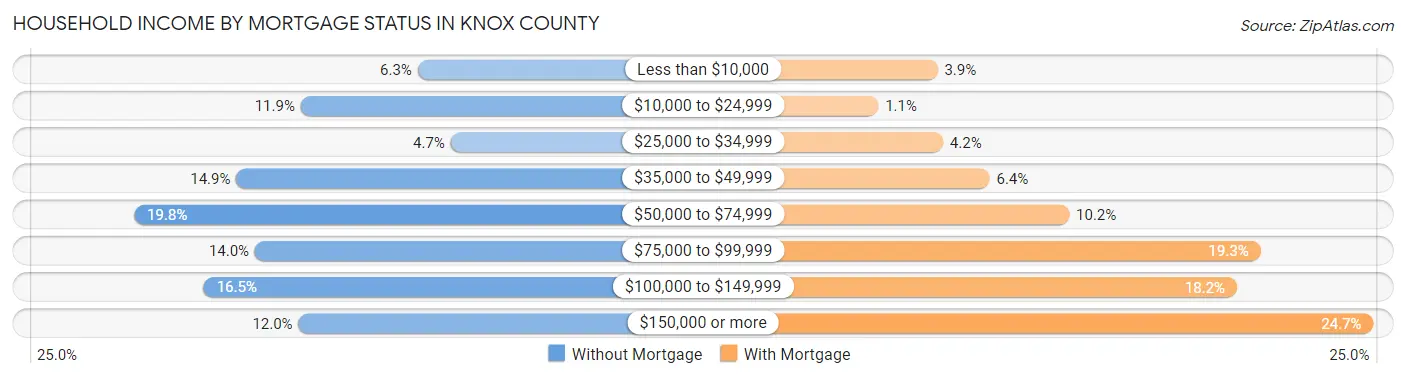
| Household Income | Without Mortgage | With Mortgage |
| Less than $10,000 | 276 (6.3%) | 210 (3.9%) |
| $10,000 to $24,999 | 521 (11.8%) | 58 (1.1%) |
| $25,000 to $34,999 | 207 (4.7%) | 224 (4.2%) |
| $35,000 to $49,999 | 656 (14.9%) | 344 (6.4%) |
| $50,000 to $74,999 | 870 (19.8%) | 548 (10.2%) |
| $75,000 to $99,999 | 617 (14.0%) | 1,040 (19.3%) |
| $100,000 to $149,999 | 724 (16.5%) | 979 (18.2%) |
| $150,000 or more | 526 (12.0%) | 1,329 (24.7%) |
| Total | 4,397 (100.0%) | 5,390 (100.0%) |
Property Value to Household Income Ratio in Knox County
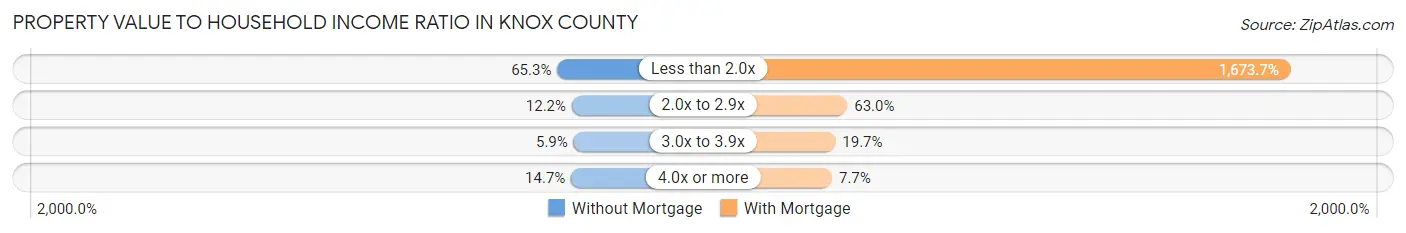
| Value-to-Income Ratio | Without Mortgage | With Mortgage |
| Less than 2.0x | 2,870 (65.3%) | 90,213 (1,673.7%) |
| 2.0x to 2.9x | 537 (12.2%) | 3,396 (63.0%) |
| 3.0x to 3.9x | 259 (5.9%) | 1,060 (19.7%) |
| 4.0x or more | 647 (14.7%) | 417 (7.7%) |
| Total | 4,397 (100.0%) | 5,390 (100.0%) |
Real Estate Taxes by Mortgage Status in Knox County

| Property Taxes | Without Mortgage | With Mortgage |
| Less than $800 | 2,190 (49.8%) | 14 (0.3%) |
| $800 to $1,499 | 1,036 (23.6%) | 1,941 (36.0%) |
| $800 to $1,499 | 950 (21.6%) | 1,731 (32.1%) |
| Total | 4,397 (100.0%) | 5,390 (100.0%) |
Health & Disability in Knox County
Health Insurance Coverage by Age in Knox County
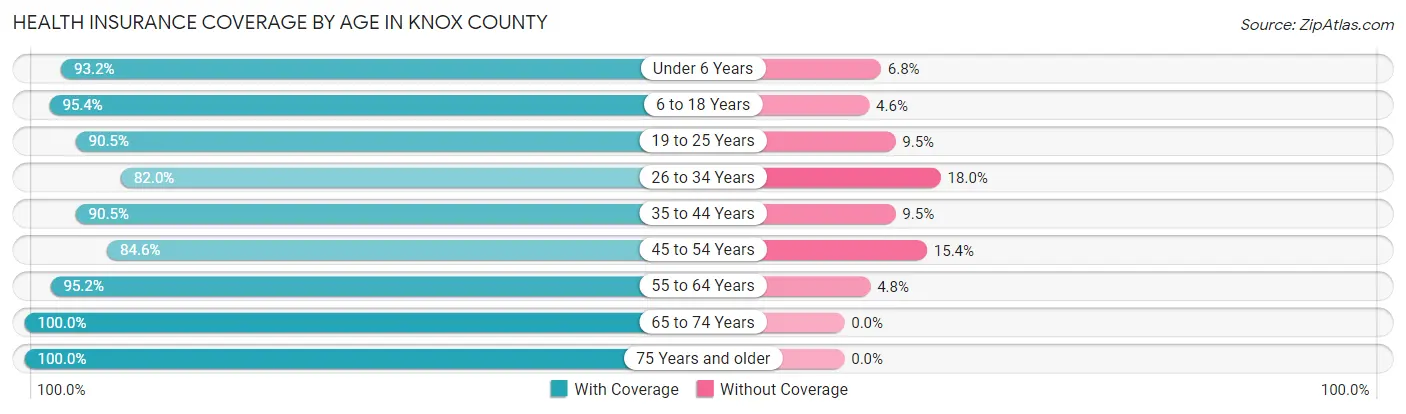
| Age Bracket | With Coverage | Without Coverage |
| Under 6 Years | 2,131 (93.2%) | 156 (6.8%) |
| 6 to 18 Years | 5,675 (95.4%) | 276 (4.6%) |
| 19 to 25 Years | 3,677 (90.5%) | 387 (9.5%) |
| 26 to 34 Years | 2,972 (82.0%) | 651 (18.0%) |
| 35 to 44 Years | 3,871 (90.5%) | 408 (9.5%) |
| 45 to 54 Years | 3,488 (84.6%) | 635 (15.4%) |
| 55 to 64 Years | 4,672 (95.2%) | 237 (4.8%) |
| 65 to 74 Years | 3,653 (100.0%) | 0 (0.0%) |
| 75 Years and older | 2,539 (100.0%) | 0 (0.0%) |
| Total | 32,678 (92.2%) | 2,750 (7.8%) |
Health Insurance Coverage by Citizenship Status in Knox County
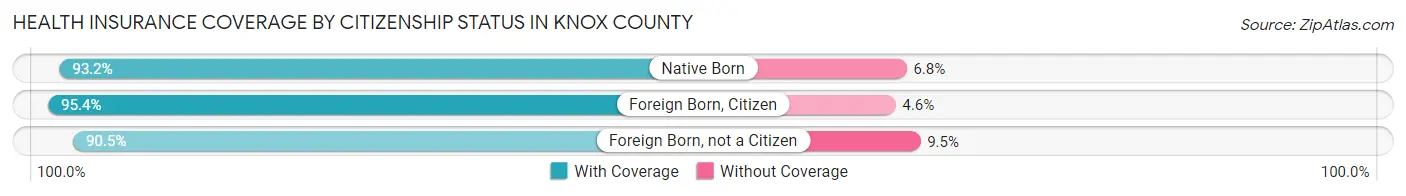
| Citizenship Status | With Coverage | Without Coverage |
| Native Born | 2,131 (93.2%) | 156 (6.8%) |
| Foreign Born, Citizen | 5,675 (95.4%) | 276 (4.6%) |
| Foreign Born, not a Citizen | 3,677 (90.5%) | 387 (9.5%) |
Health Insurance Coverage by Household Income in Knox County
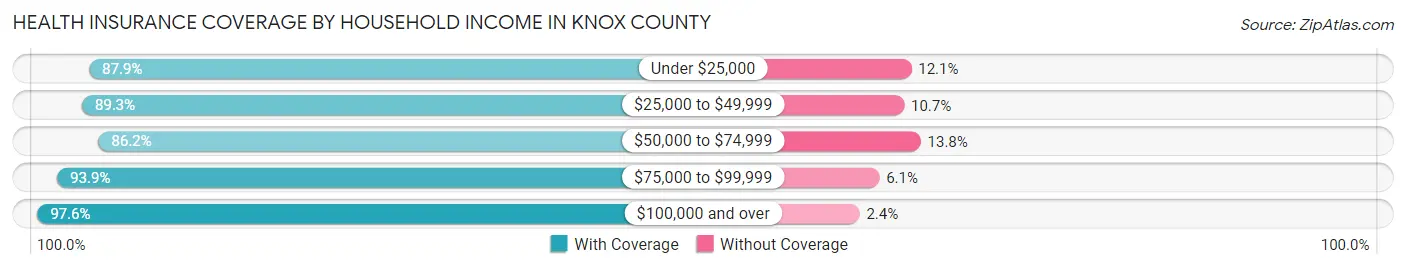
| Household Income | With Coverage | Without Coverage |
| Under $25,000 | 4,285 (87.9%) | 589 (12.1%) |
| $25,000 to $49,999 | 5,590 (89.3%) | 672 (10.7%) |
| $50,000 to $74,999 | 5,294 (86.2%) | 850 (13.8%) |
| $75,000 to $99,999 | 5,128 (93.9%) | 332 (6.1%) |
| $100,000 and over | 11,268 (97.6%) | 274 (2.4%) |
Public vs Private Health Insurance Coverage by Age in Knox County
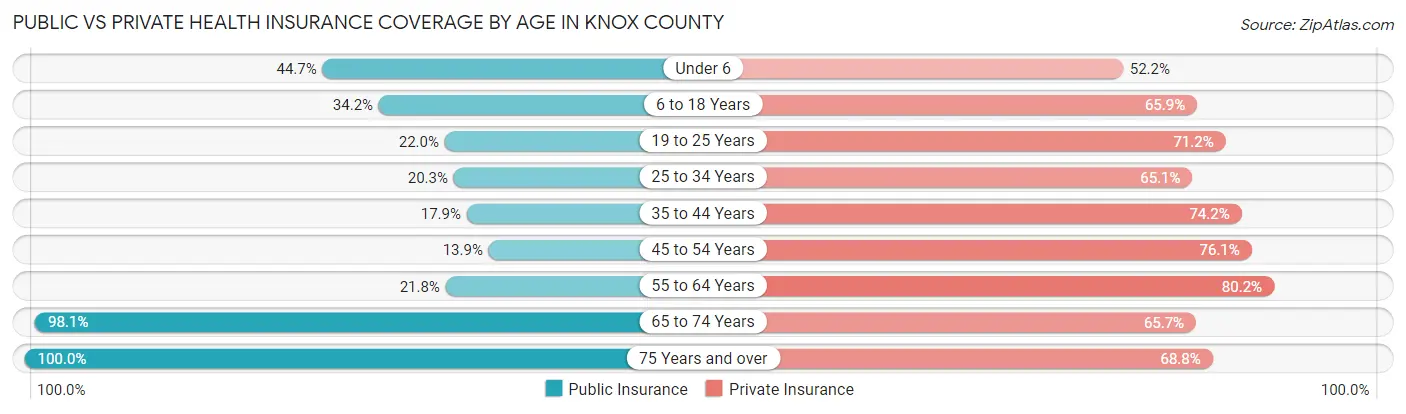
| Age Bracket | Public Insurance | Private Insurance |
| Under 6 | 1,022 (44.7%) | 1,193 (52.2%) |
| 6 to 18 Years | 2,037 (34.2%) | 3,923 (65.9%) |
| 19 to 25 Years | 894 (22.0%) | 2,894 (71.2%) |
| 25 to 34 Years | 737 (20.3%) | 2,357 (65.1%) |
| 35 to 44 Years | 767 (17.9%) | 3,174 (74.2%) |
| 45 to 54 Years | 571 (13.9%) | 3,136 (76.1%) |
| 55 to 64 Years | 1,072 (21.8%) | 3,937 (80.2%) |
| 65 to 74 Years | 3,582 (98.1%) | 2,401 (65.7%) |
| 75 Years and over | 2,539 (100.0%) | 1,747 (68.8%) |
| Total | 13,221 (37.3%) | 24,762 (69.9%) |
Disability Status by Sex by Age in Knox County
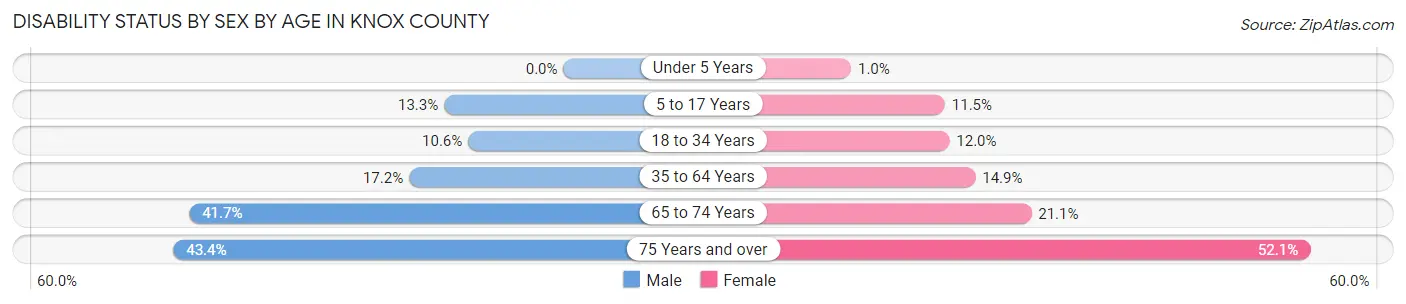
| Age Bracket | Male | Female |
| Under 5 Years | 0 (0.0%) | 9 (1.0%) |
| 5 to 17 Years | 381 (13.3%) | 329 (11.5%) |
| 18 to 34 Years | 472 (10.6%) | 462 (12.0%) |
| 35 to 64 Years | 1,178 (17.2%) | 960 (14.9%) |
| 65 to 74 Years | 724 (41.7%) | 404 (21.1%) |
| 75 Years and over | 424 (43.4%) | 815 (52.1%) |
Disability Class by Sex by Age in Knox County
Disability Class: Hearing Difficulty

| Age Bracket | Male | Female |
| Under 5 Years | 0 (0.0%) | 9 (1.0%) |
| 5 to 17 Years | 53 (1.8%) | 28 (1.0%) |
| 18 to 34 Years | 73 (1.6%) | 51 (1.3%) |
| 35 to 64 Years | 267 (3.9%) | 108 (1.7%) |
| 65 to 74 Years | 358 (20.6%) | 181 (9.5%) |
| 75 Years and over | 259 (26.5%) | 272 (17.4%) |
Disability Class: Vision Difficulty
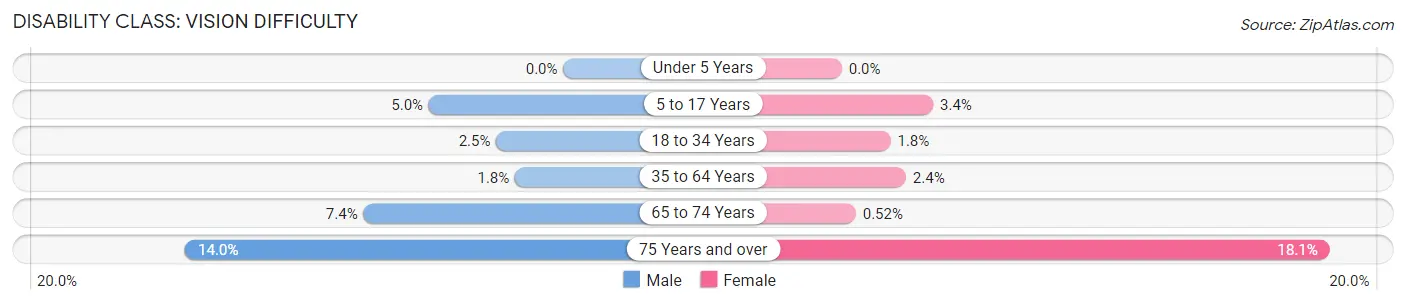
| Age Bracket | Male | Female |
| Under 5 Years | 0 (0.0%) | 0 (0.0%) |
| 5 to 17 Years | 143 (5.0%) | 97 (3.4%) |
| 18 to 34 Years | 111 (2.5%) | 70 (1.8%) |
| 35 to 64 Years | 123 (1.8%) | 154 (2.4%) |
| 65 to 74 Years | 129 (7.4%) | 10 (0.5%) |
| 75 Years and over | 137 (14.0%) | 283 (18.1%) |
Disability Class: Cognitive Difficulty
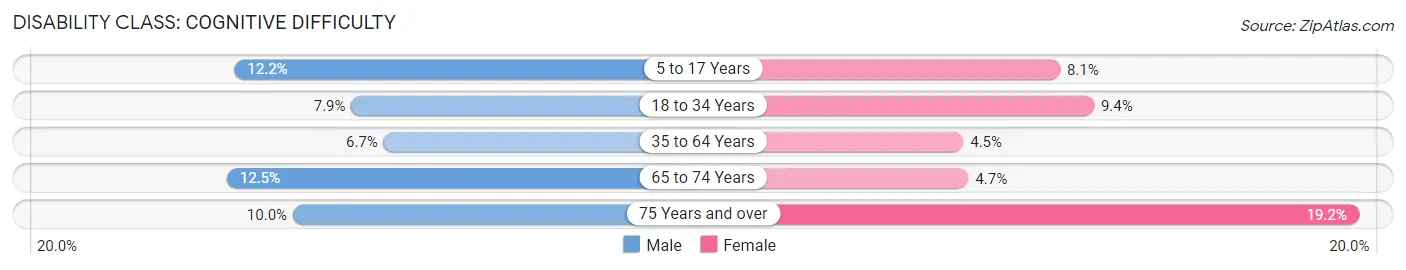
| Age Bracket | Male | Female |
| 5 to 17 Years | 350 (12.2%) | 232 (8.1%) |
| 18 to 34 Years | 350 (7.9%) | 361 (9.4%) |
| 35 to 64 Years | 457 (6.7%) | 291 (4.5%) |
| 65 to 74 Years | 217 (12.5%) | 90 (4.7%) |
| 75 Years and over | 98 (10.0%) | 300 (19.2%) |
Disability Class: Ambulatory Difficulty

| Age Bracket | Male | Female |
| 5 to 17 Years | 70 (2.4%) | 0 (0.0%) |
| 18 to 34 Years | 104 (2.3%) | 62 (1.6%) |
| 35 to 64 Years | 591 (8.6%) | 716 (11.1%) |
| 65 to 74 Years | 290 (16.7%) | 274 (14.3%) |
| 75 Years and over | 193 (19.8%) | 502 (32.1%) |
Disability Class: Self-Care Difficulty

| Age Bracket | Male | Female |
| 5 to 17 Years | 92 (3.2%) | 0 (0.0%) |
| 18 to 34 Years | 98 (2.2%) | 14 (0.4%) |
| 35 to 64 Years | 152 (2.2%) | 90 (1.4%) |
| 65 to 74 Years | 164 (9.4%) | 87 (4.5%) |
| 75 Years and over | 60 (6.1%) | 215 (13.8%) |
Technology Access in Knox County
Computing Device Access in Knox County

| Device Type | # Households | % Households |
| Desktop or Laptop | 10,130 | 67.8% |
| Smartphone | 12,559 | 84.1% |
| Tablet | 8,482 | 56.8% |
| No Computing Device | 1,419 | 9.5% |
| Total | 14,943 | 100.0% |
Internet Access in Knox County

| Internet Type | # Households | % Households |
| Dial-Up Internet | 19 | 0.1% |
| Broadband Home | 9,633 | 64.5% |
| Cellular Data Only | 2,247 | 15.0% |
| Satellite Internet | 953 | 6.4% |
| No Internet | 2,231 | 14.9% |
| Total | 14,943 | 100.0% |
Knox County Summary
Knox County, Indiana is located in the southwestern part of the state, and is part of the Wabash Valley region. It is bordered by Daviess County to the north, Sullivan County to the east, Greene County to the south, and Gibson County to the west. The county seat is Vincennes, which is also the largest city in the county. The county was established in 1790 and named after Henry Knox, the first Secretary of War under President George Washington.
Geography
Knox County covers an area of 545 square miles, making it the 33rd largest county in Indiana. The terrain is mostly flat, with some rolling hills in the northern part of the county. The Wabash River forms the western border of the county, and the White River forms the eastern border. The county is home to several small lakes, including Lake Freeman, Lake Shafer, and Lake Lemon. The highest point in the county is located in the northern part of the county, near the town of Bruceville, and is 890 feet above sea level.
The climate of Knox County is humid continental, with hot, humid summers and cold, snowy winters. The average annual temperature is around 50 degrees Fahrenheit, and the average annual precipitation is around 40 inches.
Economy
The economy of Knox County is largely based on agriculture and manufacturing. The county is home to several large farms, which produce corn, soybeans, wheat, and other crops. The county is also home to several manufacturing companies, including a steel mill, a paper mill, and a plastics factory.
The county is also home to several large employers, including Vincennes University, Good Samaritan Hospital, and the Indiana Army National Guard. The county is also home to several small businesses, including restaurants, retail stores, and service providers.
Demographics
As of the 2010 census, the population of Knox County was 25,719, making it the 33rd most populous county in Indiana. The population density was 47 people per square mile. The racial makeup of the county was 95.3% White, 1.7% African American, 0.3% Native American, 0.5% Asian, 0.1% Pacific Islander, 1.2% from other races, and 1.0% from two or more races. Hispanic or Latino of any race were 2.7% of the population.
The median income for a household in the county was $41,945, and the median income for a family was $50,945. The per capita income for the county was $20,845. About 11.2% of families and 14.7% of the population were below the poverty line, including 19.2% of those under age 18 and 8.2% of those age 65 or over.
Knox County is served by several school districts, including Vincennes Community Schools, North Knox School Corporation, and South Knox School Corporation. The county is also home to several higher education institutions, including Vincennes University, Ivy Tech Community College, and the University of Southern Indiana.
Knox County is home to several attractions, including the George Rogers Clark National Historical Park, the Indiana Military Museum, and the Vincennes State Historic Sites. The county is also home to several annual events, including the Knox County Fair, the Vincennes Rendezvous, and the Knox County 4-H Fair.
Common Questions
What is the Total Population of Knox County?
Total Population of Knox County is 36,148.
What is the Total Male Population of Knox County?
Total Male Population of Knox County is 18,385.
What is the Total Female Population of Knox County?
Total Female Population of Knox County is 17,763.
What is the Ratio of Males per 100 Females in Knox County?
There are 103.50 Males per 100 Females in Knox County.
What is the Ratio of Females per 100 Males in Knox County?
There are 96.62 Females per 100 Males in Knox County.
What is the Median Population Age in Knox County?
Median Population Age in Knox County is 38.9 Years.
What is the Average Family Size in Knox County
Average Family Size in Knox County is 2.9 People.
What is the Average Household Size in Knox County
Average Household Size in Knox County is 2.3 People.
What is Per Capita Income in Knox County?
Per Capita income in Knox County is $33,052.
What is the Median Family Income in Knox County?
Median Family Income in Knox County is $76,970.
What is the Median Household income in Knox County?
Median Household Income in Knox County is $58,173.
What is Income or Wage Gap in Knox County?
Income or Wage Gap in Knox County is 26.1%.
Women in Knox County earn 73.9 cents for every dollar earned by a man.
What is Family Income Deficit in Knox County?
Family Income Deficit in Knox County is $9,922.
Families that are below poverty line in Knox County earn $9,922 less on average than the poverty threshold level.
What is Inequality or Gini Index in Knox County?
Inequality or Gini Index in Knox County is 0.45.
How Large is the Labor Force in Knox County?
There are 18,493 People in the Labor Forcein in Knox County.
What is the Percentage of People in the Labor Force in Knox County?
63.3% of People are in the Labor Force in Knox County.
What is the Unemployment Rate in Knox County?
Unemployment Rate in Knox County is 3.2%.