Johnson County, IN
Johnson County Map
Johnson County Overview
161,952
TOTAL POPULATION
80,197
MALE POPULATION
81,755
FEMALE POPULATION
98.09
MALES / 100 FEMALES
101.94
FEMALES / 100 MALES
37.9
MEDIAN AGE
3.1
AVG FAMILY SIZE
2.6
AVG HOUSEHOLD SIZE
$40,055
PER CAPITA INCOME
$95,959
AVG FAMILY INCOME
$82,730
AVG HOUSEHOLD INCOME
31.5%
WAGE / INCOME GAP [ % ]
68.5¢/ $1
WAGE / INCOME GAP [ $ ]
$10,770
FAMILY INCOME DEFICIT
0.43
INEQUALITY / GINI INDEX
84,946
LABOR FORCE [ PEOPLE ]
66.8%
PERCENT IN LABOR FORCE
3.4%
UNEMPLOYMENT RATE
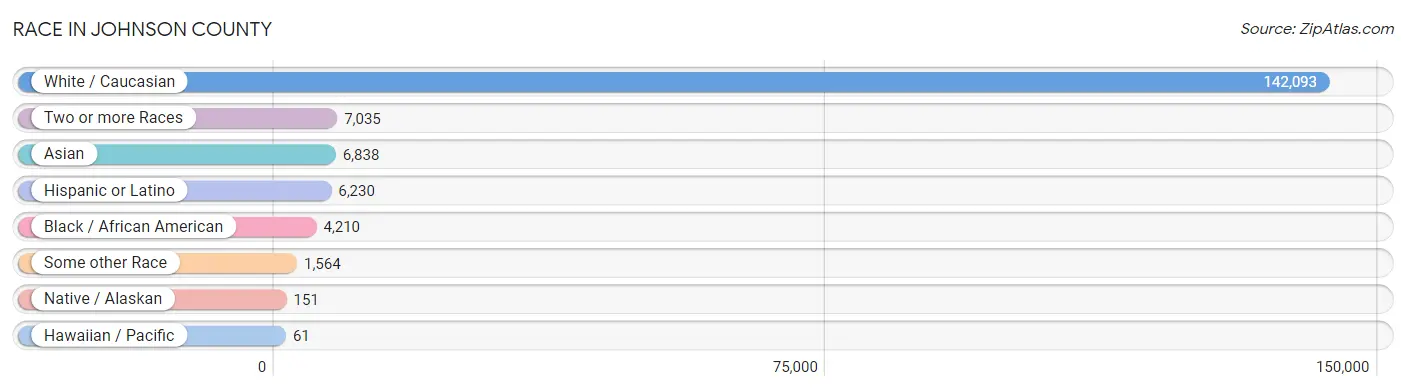
Race in Johnson County
The most populous races in Johnson County are White / Caucasian (142,093 | 87.7%), Two or more Races (7,035 | 4.3%), and Asian (6,838 | 4.2%).
| Race | # Population | % Population |
| Asian | 6,838 | 4.2% |
| Black / African American | 4,210 | 2.6% |
| Hawaiian / Pacific | 61 | 0.0% |
| Hispanic or Latino | 6,230 | 3.8% |
| Native / Alaskan | 151 | 0.1% |
| White / Caucasian | 142,093 | 87.7% |
| Two or more Races | 7,035 | 4.3% |
| Some other Race | 1,564 | 1.0% |
| Total | 161,952 | 100.0% |
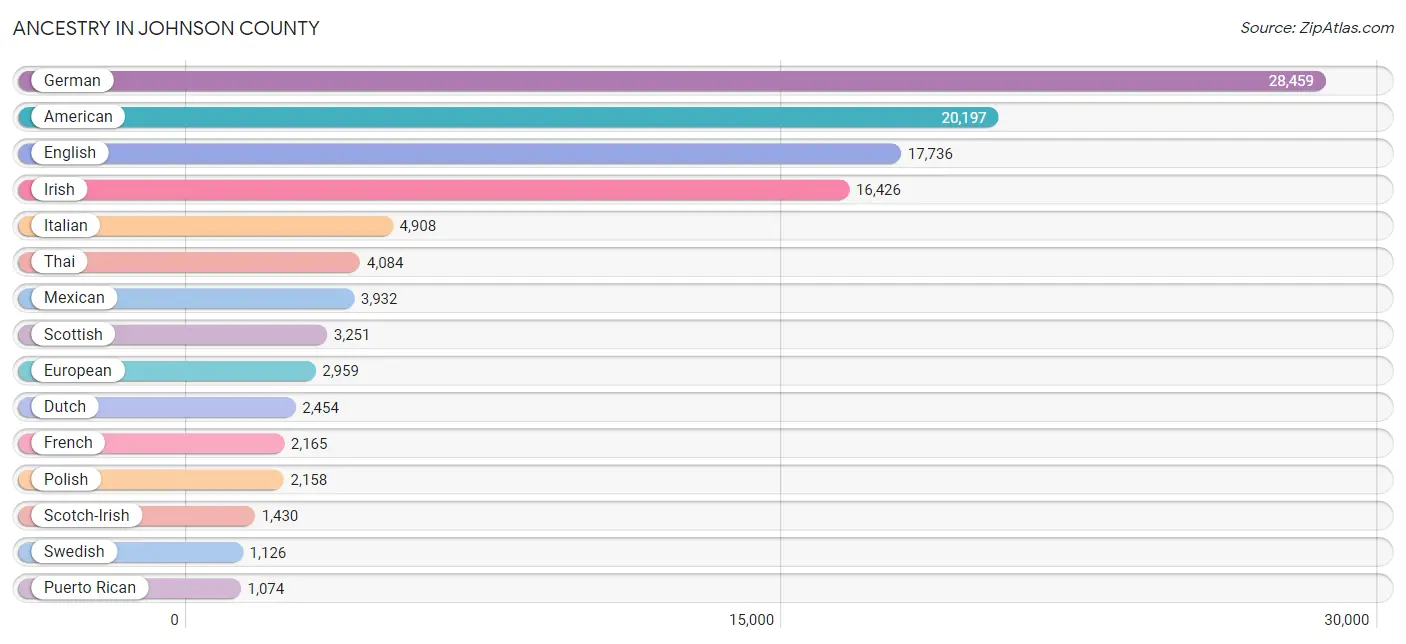
Ancestry in Johnson County
The most populous ancestries reported in Johnson County are German (28,459 | 17.6%), American (20,197 | 12.5%), English (17,736 | 11.0%), Irish (16,426 | 10.1%), and Italian (4,908 | 3.0%), together accounting for 54.2% of all Johnson County residents.
| Ancestry | # Population | % Population |
| African | 455 | 0.3% |
| American | 20,197 | 12.5% |
| Apache | 45 | 0.0% |
| Arab | 468 | 0.3% |
| Argentinean | 98 | 0.1% |
| Austrian | 252 | 0.2% |
| Basque | 34 | 0.0% |
| Belgian | 79 | 0.1% |
| Bhutanese | 796 | 0.5% |
| Blackfeet | 34 | 0.0% |
| Brazilian | 70 | 0.0% |
| British | 866 | 0.5% |
| Bulgarian | 29 | 0.0% |
| Burmese | 296 | 0.2% |
| Canadian | 74 | 0.1% |
| Celtic | 15 | 0.0% |
| Central American | 281 | 0.2% |
| Central American Indian | 44 | 0.0% |
| Cherokee | 364 | 0.2% |
| Choctaw | 43 | 0.0% |
| Colombian | 137 | 0.1% |
| Croatian | 107 | 0.1% |
| Cuban | 300 | 0.2% |
| Czech | 112 | 0.1% |
| Czechoslovakian | 25 | 0.0% |
| Danish | 388 | 0.2% |
| Delaware | 1 | 0.0% |
| Dominican | 76 | 0.1% |
| Dutch | 2,454 | 1.5% |
| Eastern European | 265 | 0.2% |
| Egyptian | 35 | 0.0% |
| English | 17,736 | 11.0% |
| European | 2,959 | 1.8% |
| Filipino | 4 | 0.0% |
| Finnish | 299 | 0.2% |
| French | 2,165 | 1.3% |
| French Canadian | 543 | 0.3% |
| German | 28,459 | 17.6% |
| Greek | 246 | 0.2% |
| Guamanian / Chamorro | 18 | 0.0% |
| Guatemalan | 80 | 0.1% |
| Haitian | 24 | 0.0% |
| Hungarian | 413 | 0.3% |
| Indian (Asian) | 542 | 0.3% |
| Indonesian | 940 | 0.6% |
| Iranian | 113 | 0.1% |
| Irish | 16,426 | 10.1% |
| Israeli | 46 | 0.0% |
| Italian | 4,908 | 3.0% |
| Japanese | 69 | 0.0% |
| Jordanian | 31 | 0.0% |
| Korean | 805 | 0.5% |
| Latvian | 57 | 0.0% |
| Lebanese | 76 | 0.1% |
| Liberian | 46 | 0.0% |
| Lithuanian | 235 | 0.2% |
| Luxembourger | 42 | 0.0% |
| Mexican | 3,932 | 2.4% |
| Mexican American Indian | 113 | 0.1% |
| Mongolian | 19 | 0.0% |
| Native Hawaiian | 93 | 0.1% |
| Nicaraguan | 108 | 0.1% |
| Nigerian | 3 | 0.0% |
| Northern European | 328 | 0.2% |
| Norwegian | 912 | 0.6% |
| Pakistani | 295 | 0.2% |
| Panamanian | 27 | 0.0% |
| Pennsylvania German | 14 | 0.0% |
| Peruvian | 55 | 0.0% |
| Polish | 2,158 | 1.3% |
| Portuguese | 121 | 0.1% |
| Puerto Rican | 1,074 | 0.7% |
| Romanian | 164 | 0.1% |
| Russian | 380 | 0.2% |
| Salvadoran | 66 | 0.0% |
| Samoan | 91 | 0.1% |
| Scandinavian | 413 | 0.3% |
| Scotch-Irish | 1,430 | 0.9% |
| Scottish | 3,251 | 2.0% |
| Serbian | 36 | 0.0% |
| Slavic | 13 | 0.0% |
| Slovak | 290 | 0.2% |
| Slovene | 15 | 0.0% |
| South African | 55 | 0.0% |
| South American | 290 | 0.2% |
| Spaniard | 34 | 0.0% |
| Spanish | 63 | 0.0% |
| Sri Lankan | 309 | 0.2% |
| Subsaharan African | 571 | 0.4% |
| Swedish | 1,126 | 0.7% |
| Swiss | 432 | 0.3% |
| Syrian | 27 | 0.0% |
| Thai | 4,084 | 2.5% |
| Ukrainian | 278 | 0.2% |
| Vietnamese | 10 | 0.0% |
| Welsh | 844 | 0.5% |
| Yugoslavian | 27 | 0.0% | View All 97 Rows |
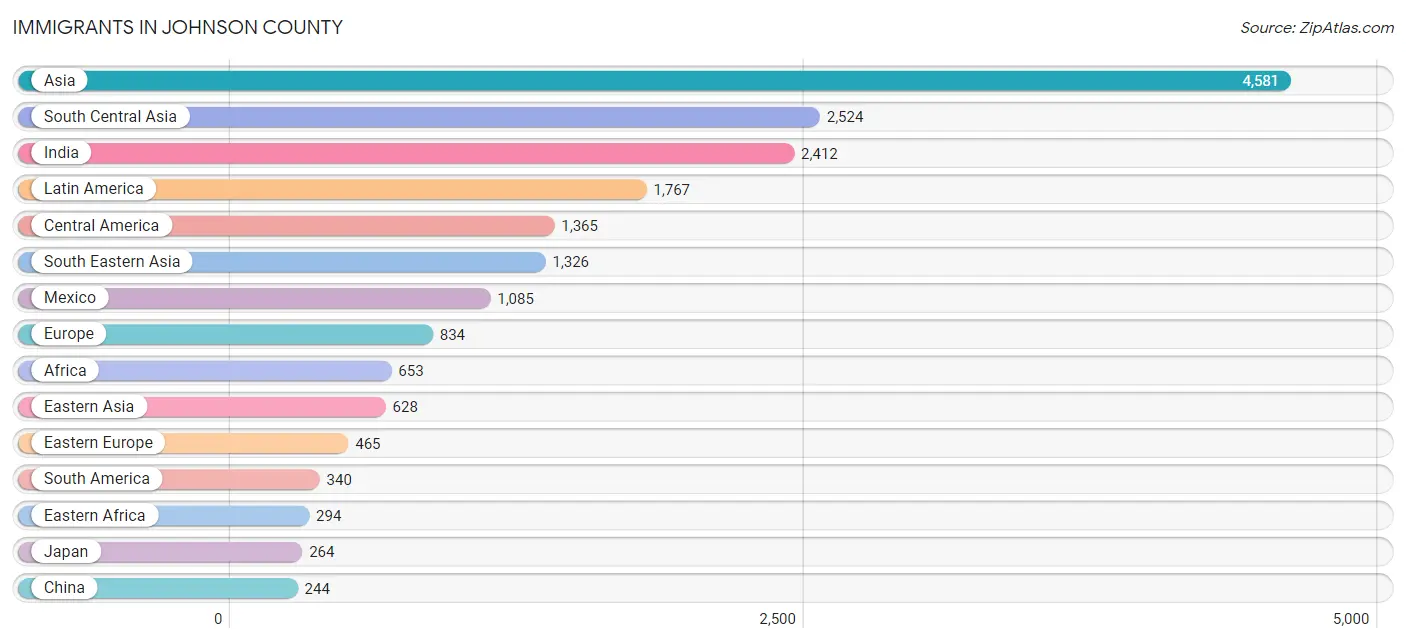
Immigrants in Johnson County
The most numerous immigrant groups reported in Johnson County came from Asia (4,581 | 2.8%), South Central Asia (2,524 | 1.6%), India (2,412 | 1.5%), Latin America (1,767 | 1.1%), and Central America (1,365 | 0.8%), together accounting for 7.8% of all Johnson County residents.
| Immigration Origin | # Population | % Population |
| Africa | 653 | 0.4% |
| Argentina | 93 | 0.1% |
| Asia | 4,581 | 2.8% |
| Bangladesh | 18 | 0.0% |
| Bosnia and Herzegovina | 53 | 0.0% |
| Brazil | 61 | 0.0% |
| Bulgaria | 32 | 0.0% |
| Cambodia | 19 | 0.0% |
| Canada | 74 | 0.1% |
| Caribbean | 62 | 0.0% |
| Central America | 1,365 | 0.8% |
| China | 244 | 0.2% |
| Colombia | 131 | 0.1% |
| Cuba | 32 | 0.0% |
| Dominican Republic | 6 | 0.0% |
| Eastern Africa | 294 | 0.2% |
| Eastern Asia | 628 | 0.4% |
| Eastern Europe | 465 | 0.3% |
| Egypt | 9 | 0.0% |
| El Salvador | 66 | 0.0% |
| England | 53 | 0.0% |
| Ethiopia | 77 | 0.1% |
| Europe | 834 | 0.5% |
| France | 26 | 0.0% |
| Germany | 124 | 0.1% |
| Guatemala | 57 | 0.0% |
| Haiti | 24 | 0.0% |
| Honduras | 4 | 0.0% |
| Hong Kong | 26 | 0.0% |
| Hungary | 58 | 0.0% |
| India | 2,412 | 1.5% |
| Indonesia | 122 | 0.1% |
| Iran | 94 | 0.1% |
| Ireland | 23 | 0.0% |
| Japan | 264 | 0.2% |
| Jordan | 10 | 0.0% |
| Kenya | 204 | 0.1% |
| Korea | 120 | 0.1% |
| Latin America | 1,767 | 1.1% |
| Lebanon | 3 | 0.0% |
| Liberia | 46 | 0.0% |
| Lithuania | 50 | 0.0% |
| Mexico | 1,085 | 0.7% |
| Netherlands | 42 | 0.0% |
| Nicaragua | 108 | 0.1% |
| Nigeria | 104 | 0.1% |
| Northern Africa | 70 | 0.0% |
| Northern Europe | 130 | 0.1% |
| Norway | 9 | 0.0% |
| Oceania | 8 | 0.0% |
| Panama | 45 | 0.0% |
| Peru | 55 | 0.0% |
| Philippines | 205 | 0.1% |
| Romania | 35 | 0.0% |
| Russia | 88 | 0.1% |
| Saudi Arabia | 64 | 0.0% |
| Senegal | 69 | 0.0% |
| Serbia | 14 | 0.0% |
| South Africa | 55 | 0.0% |
| South America | 340 | 0.2% |
| South Central Asia | 2,524 | 1.6% |
| South Eastern Asia | 1,326 | 0.8% |
| Southern Europe | 34 | 0.0% |
| Spain | 34 | 0.0% |
| Sweden | 13 | 0.0% |
| Switzerland | 13 | 0.0% |
| Taiwan | 4 | 0.0% |
| Thailand | 204 | 0.1% |
| Ukraine | 114 | 0.1% |
| Vietnam | 198 | 0.1% |
| Western Africa | 219 | 0.1% |
| Western Asia | 103 | 0.1% |
| Western Europe | 205 | 0.1% | View All 73 Rows |
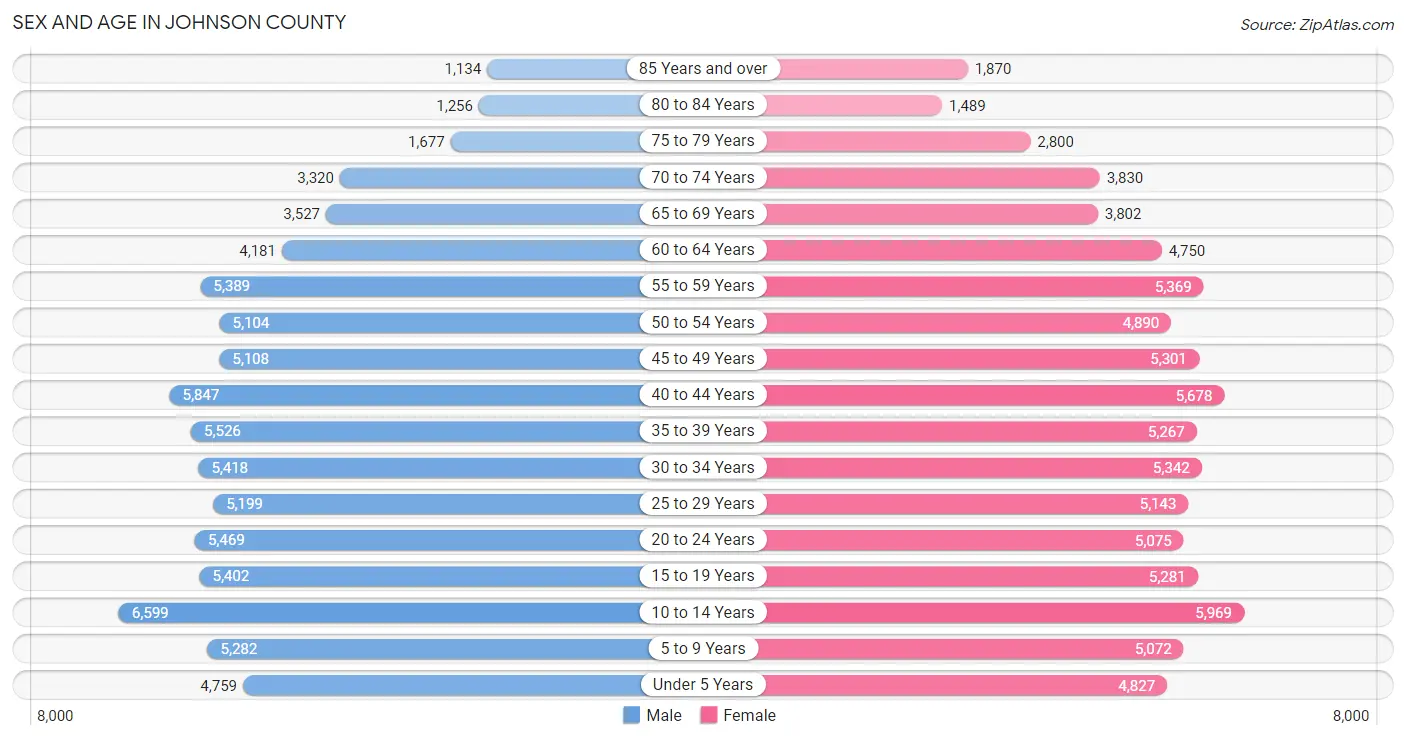
Sex and Age in Johnson County
Sex and Age in Johnson County
The most populous age groups in Johnson County are 10 to 14 Years (6,599 | 8.2%) for men and 10 to 14 Years (5,969 | 7.3%) for women.
| Age Bracket | Male | Female |
| Under 5 Years | 4,759 (5.9%) | 4,827 (5.9%) |
| 5 to 9 Years | 5,282 (6.6%) | 5,072 (6.2%) |
| 10 to 14 Years | 6,599 (8.2%) | 5,969 (7.3%) |
| 15 to 19 Years | 5,402 (6.7%) | 5,281 (6.5%) |
| 20 to 24 Years | 5,469 (6.8%) | 5,075 (6.2%) |
| 25 to 29 Years | 5,199 (6.5%) | 5,143 (6.3%) |
| 30 to 34 Years | 5,418 (6.8%) | 5,342 (6.5%) |
| 35 to 39 Years | 5,526 (6.9%) | 5,267 (6.4%) |
| 40 to 44 Years | 5,847 (7.3%) | 5,678 (7.0%) |
| 45 to 49 Years | 5,108 (6.4%) | 5,301 (6.5%) |
| 50 to 54 Years | 5,104 (6.4%) | 4,890 (6.0%) |
| 55 to 59 Years | 5,389 (6.7%) | 5,369 (6.6%) |
| 60 to 64 Years | 4,181 (5.2%) | 4,750 (5.8%) |
| 65 to 69 Years | 3,527 (4.4%) | 3,802 (4.6%) |
| 70 to 74 Years | 3,320 (4.1%) | 3,830 (4.7%) |
| 75 to 79 Years | 1,677 (2.1%) | 2,800 (3.4%) |
| 80 to 84 Years | 1,256 (1.6%) | 1,489 (1.8%) |
| 85 Years and over | 1,134 (1.4%) | 1,870 (2.3%) |
| Total | 80,197 (100.0%) | 81,755 (100.0%) |
Families and Households in Johnson County
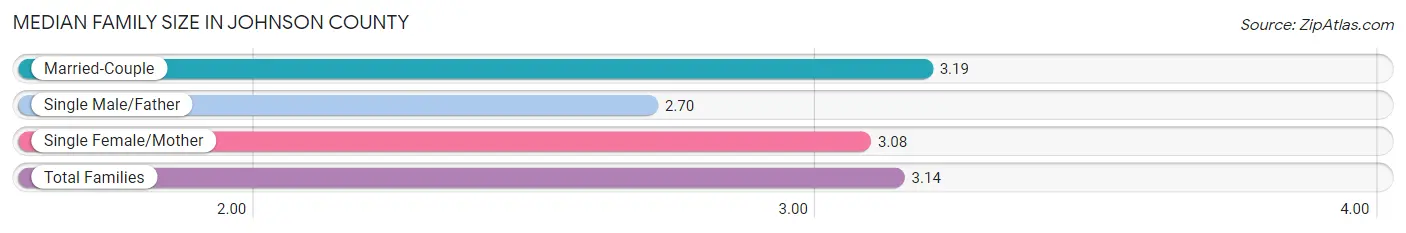
Median Family Size in Johnson County
The median family size in Johnson County is 3.14 persons per family, with married-couple families (33,790 | 79.7%) accounting for the largest median family size of 3.19 persons per family. On the other hand, single male/father families (3,336 | 7.9%) represent the smallest median family size with 2.70 persons per family.
| Family Type | # Families | Family Size |
| Married-Couple | 33,790 (79.7%) | 3.19 |
| Single Male/Father | 3,336 (7.9%) | 2.70 |
| Single Female/Mother | 5,271 (12.4%) | 3.08 |
| Total Families | 42,397 (100.0%) | 3.14 |
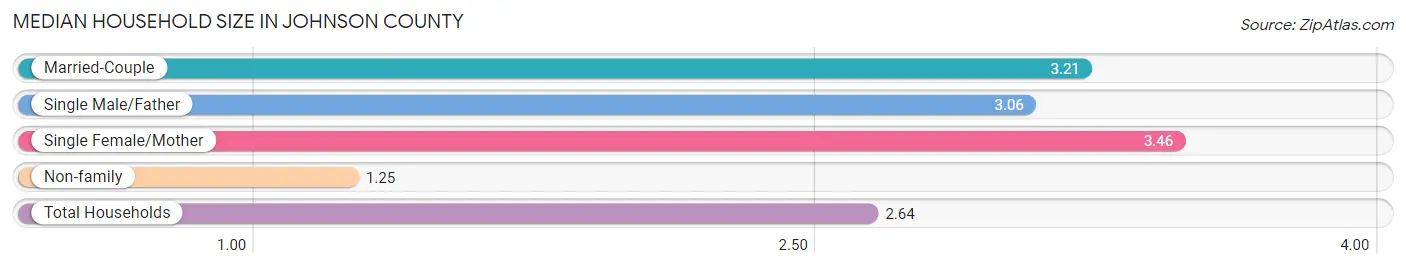
Median Household Size in Johnson County
The median household size in Johnson County is 2.64 persons per household, with single female/mother households (5,271 | 8.7%) accounting for the largest median household size of 3.46 persons per household. non-family households (17,877 | 29.7%) represent the smallest median household size with 1.25 persons per household.
| Household Type | # Households | Household Size |
| Married-Couple | 33,790 (56.1%) | 3.21 |
| Single Male/Father | 3,336 (5.5%) | 3.06 |
| Single Female/Mother | 5,271 (8.7%) | 3.46 |
| Non-family | 17,877 (29.7%) | 1.25 |
| Total Households | 60,274 (100.0%) | 2.64 |
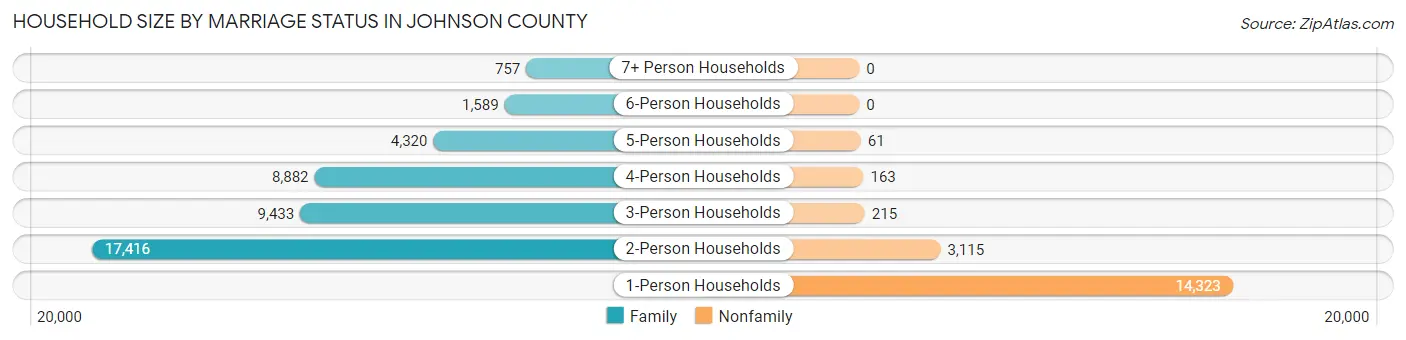
Household Size by Marriage Status in Johnson County
Out of a total of 60,274 households in Johnson County, 42,397 (70.3%) are family households, while 17,877 (29.7%) are nonfamily households. The most numerous type of family households are 2-person households, comprising 17,416, and the most common type of nonfamily households are 1-person households, comprising 14,323.
| Household Size | Family Households | Nonfamily Households |
| 1-Person Households | - | 14,323 (23.8%) |
| 2-Person Households | 17,416 (28.9%) | 3,115 (5.2%) |
| 3-Person Households | 9,433 (15.7%) | 215 (0.4%) |
| 4-Person Households | 8,882 (14.7%) | 163 (0.3%) |
| 5-Person Households | 4,320 (7.2%) | 61 (0.1%) |
| 6-Person Households | 1,589 (2.6%) | 0 (0.0%) |
| 7+ Person Households | 757 (1.3%) | 0 (0.0%) |
| Total | 42,397 (70.3%) | 17,877 (29.7%) |
Female Fertility in Johnson County
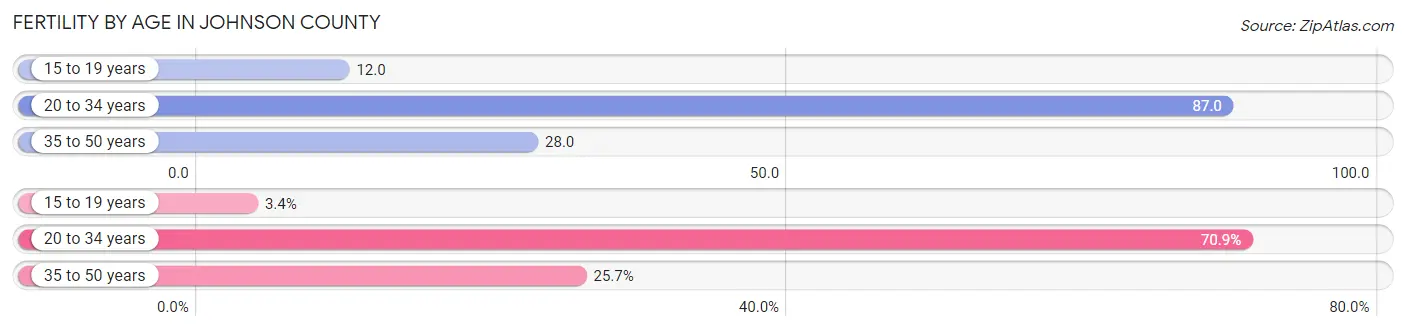
Fertility by Age in Johnson County
Average fertility rate in Johnson County is 50.0 births per 1,000 women. Women in the age bracket of 20 to 34 years have the highest fertility rate with 87.0 births per 1,000 women. Women in the age bracket of 20 to 34 years acount for 70.9% of all women with births.
| Age Bracket | Women with Births | Births / 1,000 Women |
| 15 to 19 years | 65 (3.4%) | 12.0 |
| 20 to 34 years | 1,361 (70.9%) | 87.0 |
| 35 to 50 years | 493 (25.7%) | 28.0 |
| Total | 1,919 (100.0%) | 50.0 |
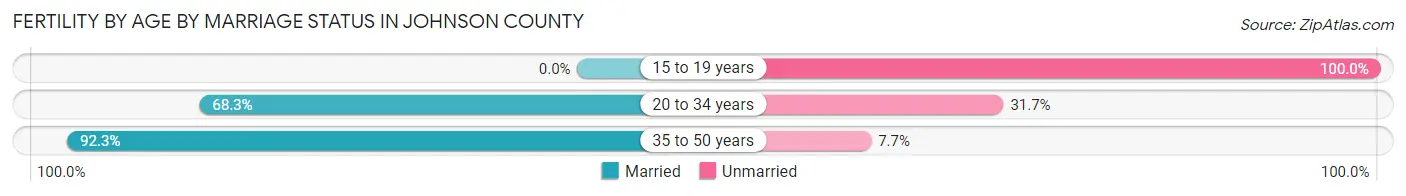
Fertility by Age by Marriage Status in Johnson County
72.2% of women with births (1,919) in Johnson County are married. The highest percentage of unmarried women with births falls into 15 to 19 years age bracket with 100.0% of them unmarried at the time of birth, while the lowest percentage of unmarried women with births belong to 35 to 50 years age bracket with 7.7% of them unmarried.
| Age Bracket | Married | Unmarried |
| 15 to 19 years | 0 (0.0%) | 65 (100.0%) |
| 20 to 34 years | 930 (68.3%) | 431 (31.7%) |
| 35 to 50 years | 455 (92.3%) | 38 (7.7%) |
| Total | 1,386 (72.2%) | 533 (27.8%) |
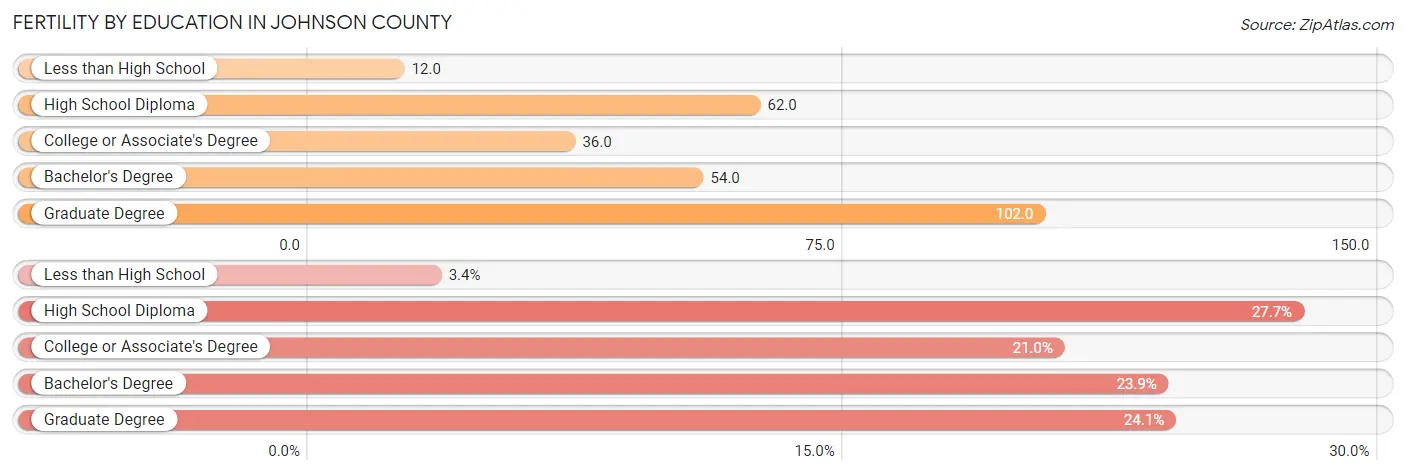
Fertility by Education in Johnson County
Average fertility rate in Johnson County is 50.0 births per 1,000 women. Women with the education attainment of graduate degree have the highest fertility rate of 102.0 births per 1,000 women, while women with the education attainment of less than high school have the lowest fertility at 12.0 births per 1,000 women. Women with the education attainment of high school diploma represent 27.7% of all women with births.
| Educational Attainment | Women with Births | Births / 1,000 Women |
| Less than High School | 66 (3.4%) | 12.0 |
| High School Diploma | 531 (27.7%) | 62.0 |
| College or Associate's Degree | 402 (20.9%) | 36.0 |
| Bachelor's Degree | 458 (23.9%) | 54.0 |
| Graduate Degree | 462 (24.1%) | 102.0 |
| Total | 1,919 (100.0%) | 50.0 |
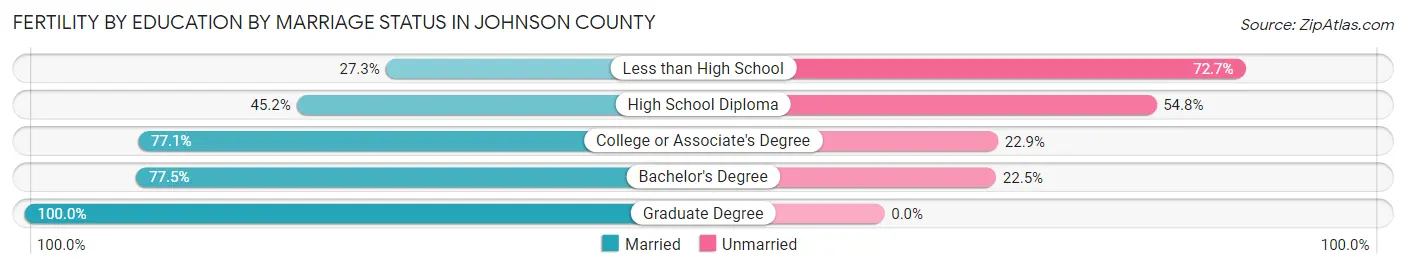
Fertility by Education by Marriage Status in Johnson County
27.8% of women with births in Johnson County are unmarried. Women with the educational attainment of graduate degree are most likely to be married with 100.0% of them married at childbirth, while women with the educational attainment of less than high school are least likely to be married with 72.7% of them unmarried at childbirth.
| Educational Attainment | Married | Unmarried |
| Less than High School | 18 (27.3%) | 48 (72.7%) |
| High School Diploma | 240 (45.2%) | 291 (54.8%) |
| College or Associate's Degree | 310 (77.1%) | 92 (22.9%) |
| Bachelor's Degree | 355 (77.5%) | 103 (22.5%) |
| Graduate Degree | 462 (100.0%) | 0 (0.0%) |
| Total | 1,386 (72.2%) | 533 (27.8%) |
Income in Johnson County
Income Overview in Johnson County
Per Capita Income in Johnson County is $40,055, while median incomes of families and households are $95,959 and $82,730 respectively.
| Characteristic | Number | Measure |
| Per Capita Income | 161,952 | $40,055 |
| Median Family Income | 42,397 | $95,959 |
| Mean Family Income | 42,397 | $121,226 |
| Median Household Income | 60,274 | $82,730 |
| Mean Household Income | 60,274 | $104,666 |
| Income Deficit | 42,397 | $10,770 |
| Wage / Income Gap (%) | 161,952 | 31.54% |
| Wage / Income Gap ($) | 161,952 | 68.46¢ per $1 |
| Gini / Inequality Index | 161,952 | 0.43 |
Earnings by Sex in Johnson County
Average Earnings in Johnson County are $45,037, $54,435 for men and $37,264 for women, a difference of 31.5%.
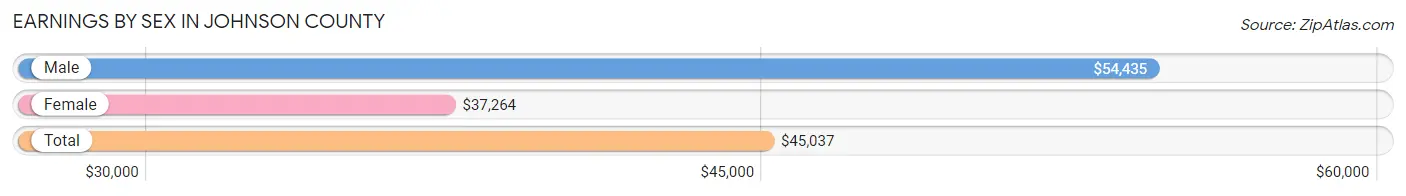
| Sex | Number | Average Earnings |
| Male | 47,089 (53.2%) | $54,435 |
| Female | 41,342 (46.8%) | $37,264 |
| Total | 88,431 (100.0%) | $45,037 |
Earnings by Sex by Income Bracket in Johnson County
The most common earnings brackets in Johnson County are $100,000+ for men (8,929 | 19.0%) and $100,000+ for women (3,973 | 9.6%).
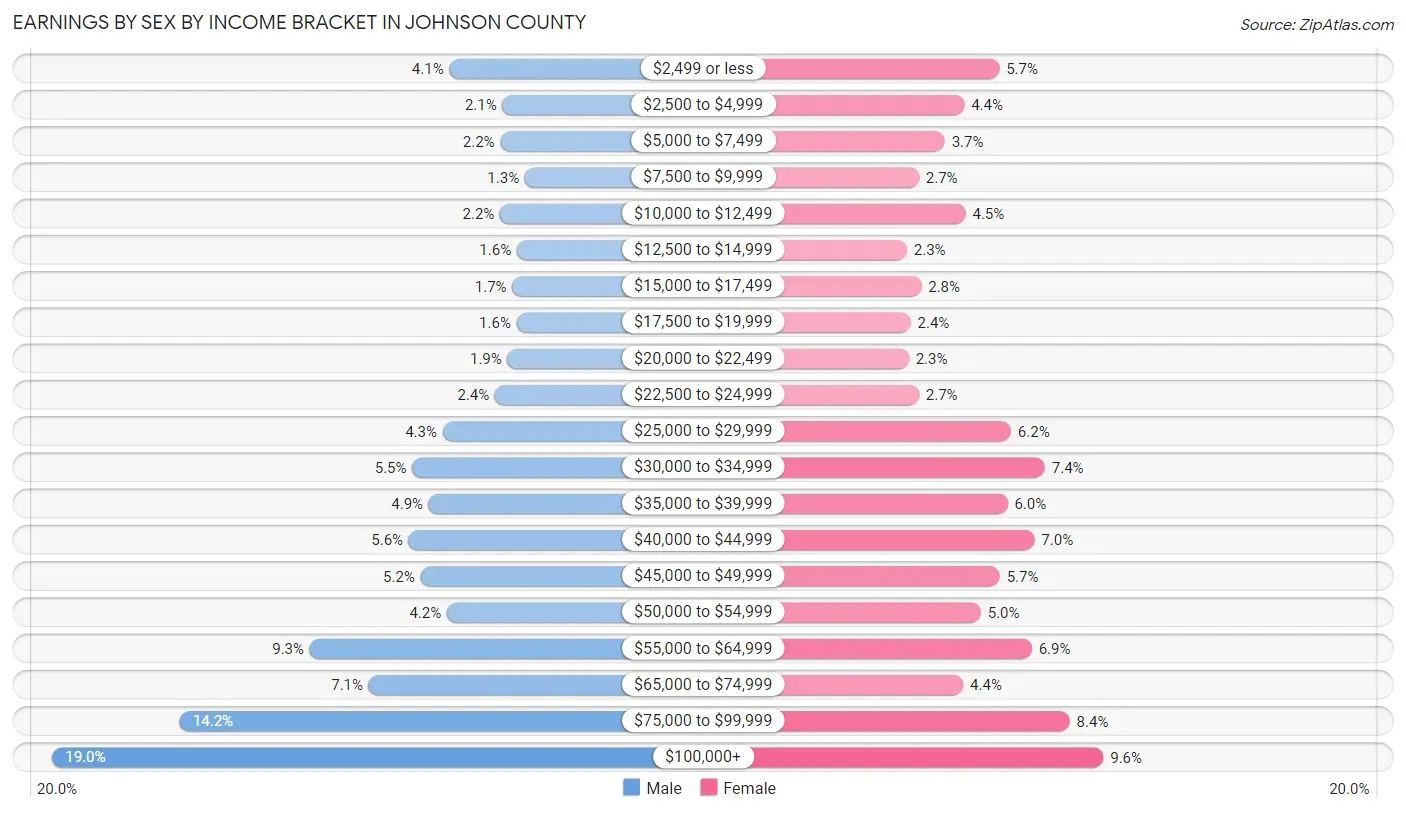
| Income | Male | Female |
| $2,499 or less | 1,923 (4.1%) | 2,360 (5.7%) |
| $2,500 to $4,999 | 985 (2.1%) | 1,818 (4.4%) |
| $5,000 to $7,499 | 1,022 (2.2%) | 1,519 (3.7%) |
| $7,500 to $9,999 | 587 (1.3%) | 1,118 (2.7%) |
| $10,000 to $12,499 | 1,025 (2.2%) | 1,838 (4.4%) |
| $12,500 to $14,999 | 729 (1.5%) | 932 (2.2%) |
| $15,000 to $17,499 | 812 (1.7%) | 1,153 (2.8%) |
| $17,500 to $19,999 | 736 (1.6%) | 988 (2.4%) |
| $20,000 to $22,499 | 894 (1.9%) | 961 (2.3%) |
| $22,500 to $24,999 | 1,116 (2.4%) | 1,118 (2.7%) |
| $25,000 to $29,999 | 2,037 (4.3%) | 2,541 (6.1%) |
| $30,000 to $34,999 | 2,575 (5.5%) | 3,067 (7.4%) |
| $35,000 to $39,999 | 2,282 (4.9%) | 2,489 (6.0%) |
| $40,000 to $44,999 | 2,638 (5.6%) | 2,906 (7.0%) |
| $45,000 to $49,999 | 2,428 (5.2%) | 2,370 (5.7%) |
| $50,000 to $54,999 | 1,965 (4.2%) | 2,074 (5.0%) |
| $55,000 to $64,999 | 4,383 (9.3%) | 2,866 (6.9%) |
| $65,000 to $74,999 | 3,344 (7.1%) | 1,801 (4.4%) |
| $75,000 to $99,999 | 6,679 (14.2%) | 3,450 (8.4%) |
| $100,000+ | 8,929 (19.0%) | 3,973 (9.6%) |
| Total | 47,089 (100.0%) | 41,342 (100.0%) |
Earnings by Sex by Educational Attainment in Johnson County
Average earnings in Johnson County are $61,255 for men and $42,394 for women, a difference of 30.8%. Men with an educational attainment of graduate degree enjoy the highest average annual earnings of $90,625, while those with less than high school education earn the least with $37,042. Women with an educational attainment of graduate degree earn the most with the average annual earnings of $62,901, while those with less than high school education have the smallest earnings of $19,815.
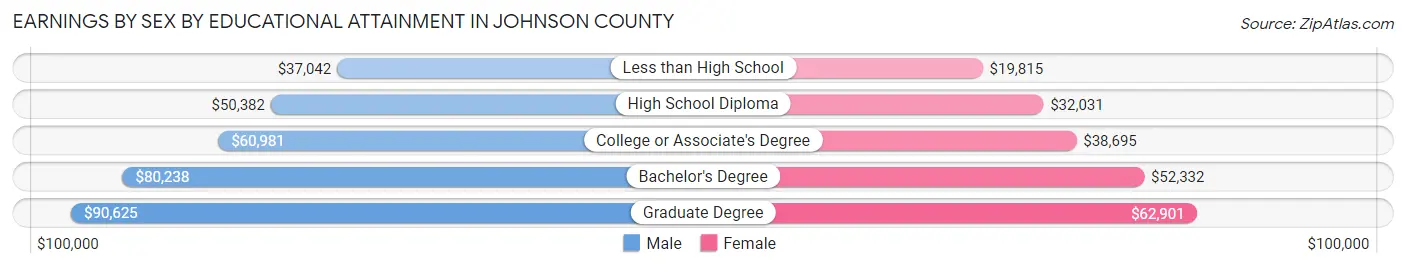
| Educational Attainment | Male Income | Female Income |
| Less than High School | $37,042 | $19,815 |
| High School Diploma | $50,382 | $32,031 |
| College or Associate's Degree | $60,981 | $38,695 |
| Bachelor's Degree | $80,238 | $52,332 |
| Graduate Degree | $90,625 | $62,901 |
| Total | $61,255 | $42,394 |
Family Income in Johnson County
Family Income Brackets in Johnson County
According to the Johnson County family income data, there are 9,582 families falling into the $100,000 to $149,999 income range, which is the most common income bracket and makes up 22.6% of all families. Conversely, the $10,000 to $14,999 income bracket is the least frequent group with only 339 families (0.8%) belonging to this category.
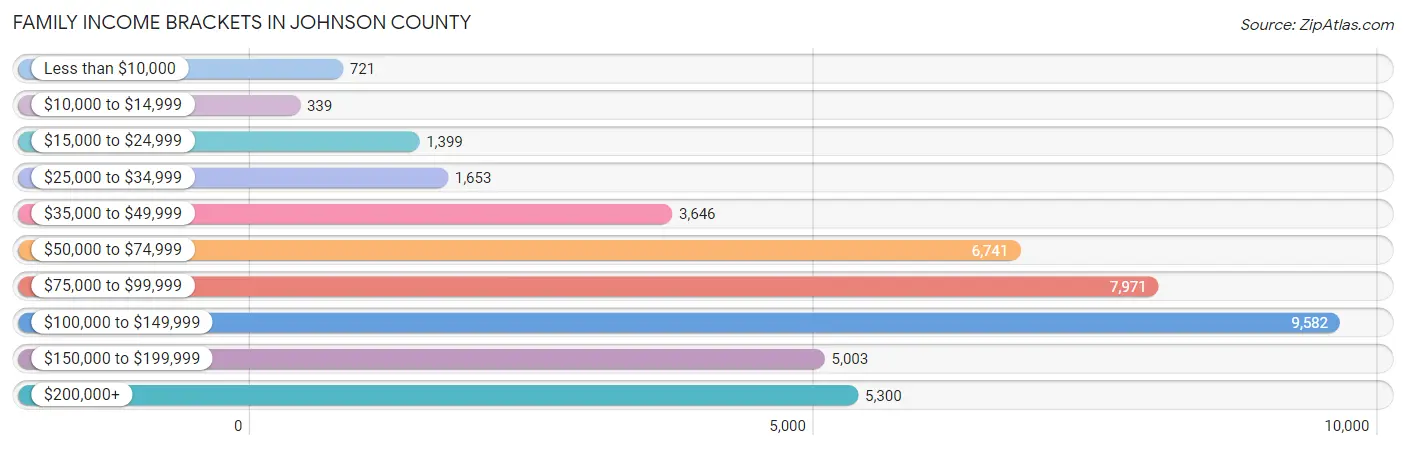
| Income Bracket | # Families | % Families |
| Less than $10,000 | 721 | 1.7% |
| $10,000 to $14,999 | 339 | 0.8% |
| $15,000 to $24,999 | 1,399 | 3.3% |
| $25,000 to $34,999 | 1,653 | 3.9% |
| $35,000 to $49,999 | 3,646 | 8.6% |
| $50,000 to $74,999 | 6,741 | 15.9% |
| $75,000 to $99,999 | 7,971 | 18.8% |
| $100,000 to $149,999 | 9,582 | 22.6% |
| $150,000 to $199,999 | 5,003 | 11.8% |
| $200,000+ | 5,300 | 12.5% |
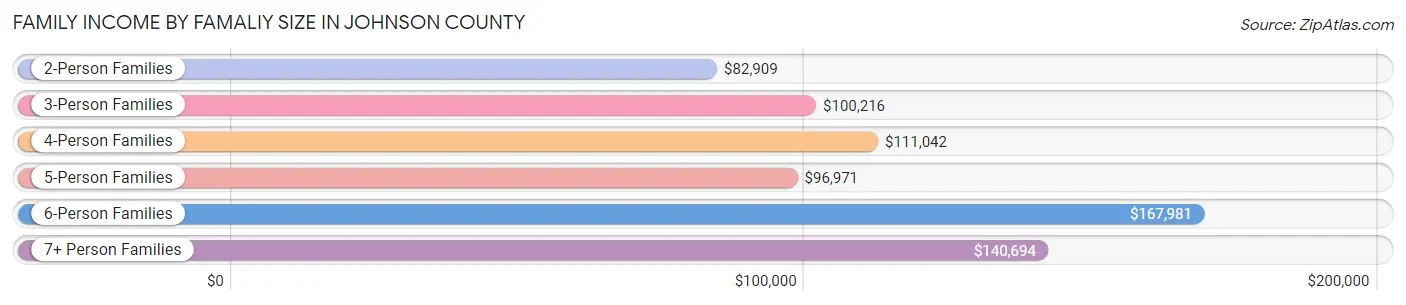
Family Income by Famaliy Size in Johnson County
6-person families (1,268 | 3.0%) account for the highest median family income in Johnson County with $167,981 per family, while 2-person families (18,564 | 43.8%) have the highest median income of $41,454 per family member.
| Income Bracket | # Families | Median Income |
| 2-Person Families | 18,564 (43.8%) | $82,909 |
| 3-Person Families | 9,521 (22.5%) | $100,216 |
| 4-Person Families | 8,586 (20.3%) | $111,042 |
| 5-Person Families | 3,789 (8.9%) | $96,971 |
| 6-Person Families | 1,268 (3.0%) | $167,981 |
| 7+ Person Families | 669 (1.6%) | $140,694 |
| Total | 42,397 (100.0%) | $95,959 |
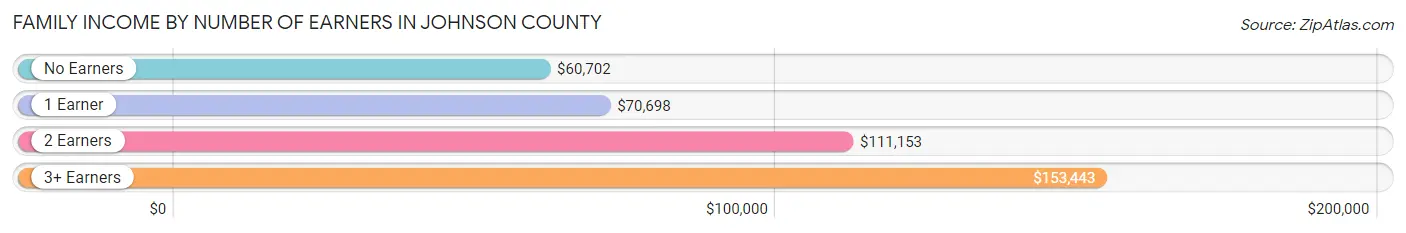
Family Income by Number of Earners in Johnson County
The median family income in Johnson County is $95,959, with families comprising 3+ earners (5,210) having the highest median family income of $153,443, while families with no earners (5,287) have the lowest median family income of $60,702, accounting for 12.3% and 12.5% of families, respectively.
| Number of Earners | # Families | Median Income |
| No Earners | 5,287 (12.5%) | $60,702 |
| 1 Earner | 13,051 (30.8%) | $70,698 |
| 2 Earners | 18,849 (44.5%) | $111,153 |
| 3+ Earners | 5,210 (12.3%) | $153,443 |
| Total | 42,397 (100.0%) | $95,959 |
Household Income in Johnson County
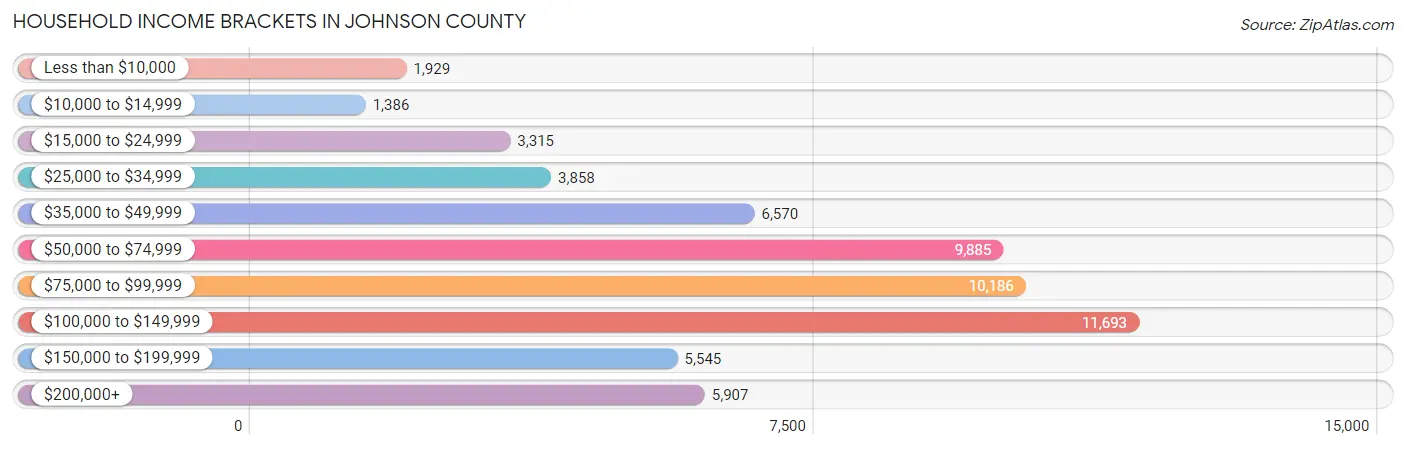
Household Income Brackets in Johnson County
With 11,693 households falling in the category, the $100,000 to $149,999 income range is the most frequent in Johnson County, accounting for 19.4% of all households. In contrast, only 1,386 households (2.3%) fall into the $10,000 to $14,999 income bracket, making it the least populous group.
| Income Bracket | # Households | % Households |
| Less than $10,000 | 1,929 | 3.2% |
| $10,000 to $14,999 | 1,386 | 2.3% |
| $15,000 to $24,999 | 3,315 | 5.5% |
| $25,000 to $34,999 | 3,858 | 6.4% |
| $35,000 to $49,999 | 6,570 | 10.9% |
| $50,000 to $74,999 | 9,885 | 16.4% |
| $75,000 to $99,999 | 10,186 | 16.9% |
| $100,000 to $149,999 | 11,693 | 19.4% |
| $150,000 to $199,999 | 5,545 | 9.2% |
| $200,000+ | 5,907 | 9.8% |
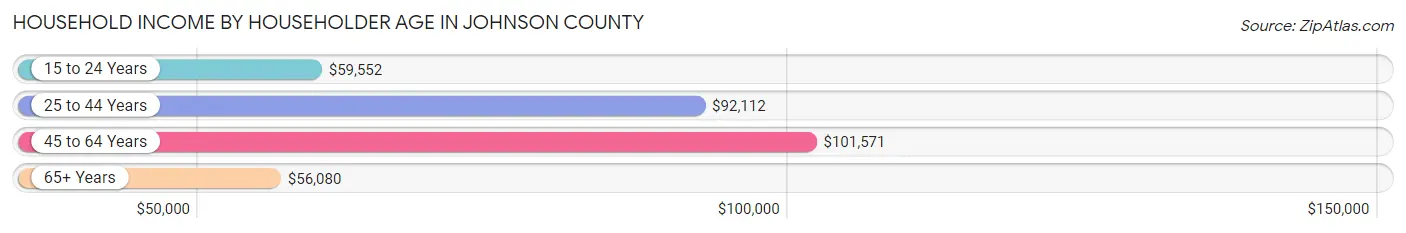
Household Income by Householder Age in Johnson County
The median household income in Johnson County is $82,730, with the highest median household income of $101,571 found in the 45 to 64 years age bracket for the primary householder. A total of 21,972 households (36.4%) fall into this category. Meanwhile, the 65+ years age bracket for the primary householder has the lowest median household income of $56,080, with 14,578 households (24.2%) in this group.
| Income Bracket | # Households | Median Income |
| 15 to 24 Years | 2,224 (3.7%) | $59,552 |
| 25 to 44 Years | 21,500 (35.7%) | $92,112 |
| 45 to 64 Years | 21,972 (36.4%) | $101,571 |
| 65+ Years | 14,578 (24.2%) | $56,080 |
| Total | 60,274 (100.0%) | $82,730 |
Poverty in Johnson County
Income Below Poverty by Sex and Age in Johnson County
With 6.9% poverty level for males and 8.1% for females among the residents of Johnson County, 15 year old males and 25 to 34 year old females are the most vulnerable to poverty, with 273 males (22.9%) and 1,367 females (13.1%) in their respective age groups living below the poverty level.
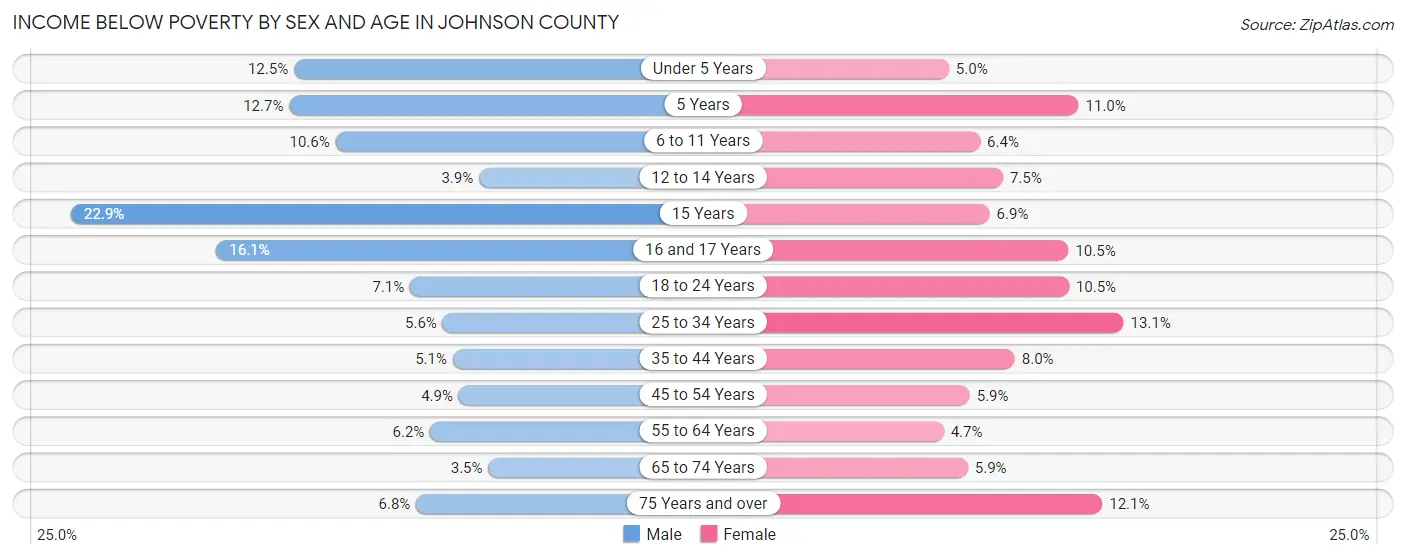
| Age Bracket | Male | Female |
| Under 5 Years | 595 (12.5%) | 232 (5.0%) |
| 5 Years | 122 (12.7%) | 126 (11.0%) |
| 6 to 11 Years | 675 (10.6%) | 393 (6.4%) |
| 12 to 14 Years | 162 (3.9%) | 261 (7.5%) |
| 15 Years | 273 (22.9%) | 74 (6.9%) |
| 16 and 17 Years | 358 (16.1%) | 251 (10.5%) |
| 18 to 24 Years | 497 (7.1%) | 700 (10.5%) |
| 25 to 34 Years | 585 (5.6%) | 1,367 (13.1%) |
| 35 to 44 Years | 577 (5.1%) | 877 (8.0%) |
| 45 to 54 Years | 490 (4.9%) | 605 (5.9%) |
| 55 to 64 Years | 584 (6.2%) | 474 (4.7%) |
| 65 to 74 Years | 233 (3.5%) | 440 (5.9%) |
| 75 Years and over | 264 (6.8%) | 671 (12.1%) |
| Total | 5,415 (6.9%) | 6,471 (8.1%) |
Income Above Poverty by Sex and Age in Johnson County
According to the poverty statistics in Johnson County, males aged 65 to 74 years and females aged 55 to 64 years are the age groups that are most secure financially, with 96.5% of males and 95.3% of females in these age groups living above the poverty line.
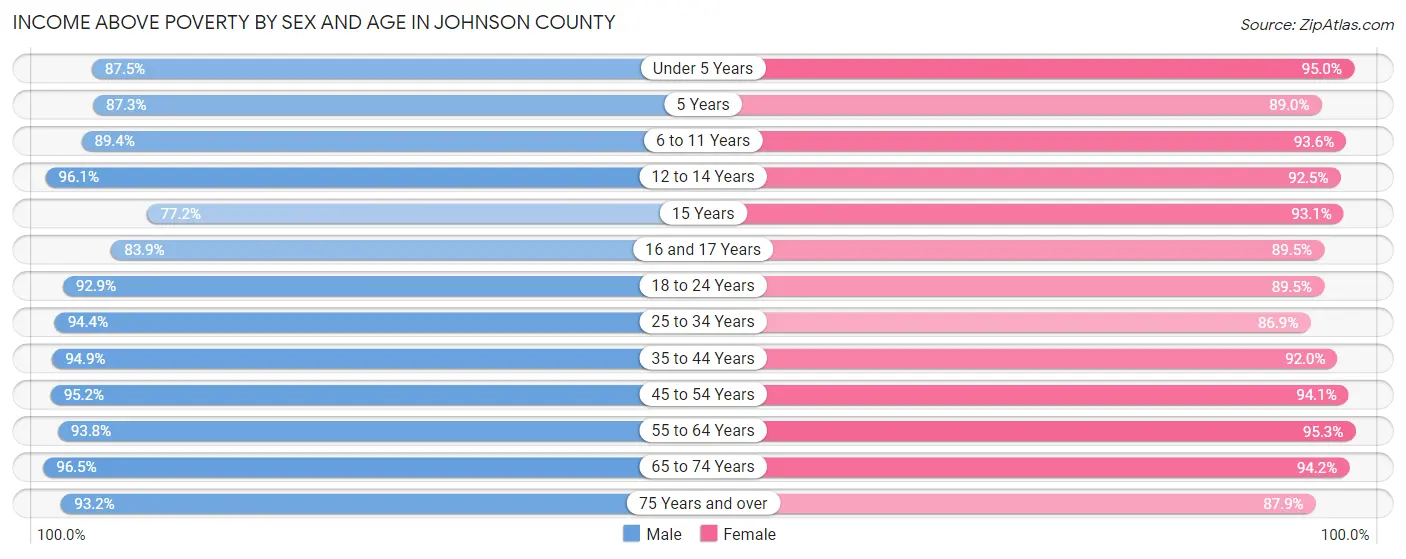
| Age Bracket | Male | Female |
| Under 5 Years | 4,164 (87.5%) | 4,438 (95.0%) |
| 5 Years | 837 (87.3%) | 1,020 (89.0%) |
| 6 to 11 Years | 5,708 (89.4%) | 5,727 (93.6%) |
| 12 to 14 Years | 3,978 (96.1%) | 3,227 (92.5%) |
| 15 Years | 922 (77.1%) | 1,004 (93.1%) |
| 16 and 17 Years | 1,865 (83.9%) | 2,136 (89.5%) |
| 18 to 24 Years | 6,496 (92.9%) | 5,941 (89.5%) |
| 25 to 34 Years | 9,864 (94.4%) | 9,088 (86.9%) |
| 35 to 44 Years | 10,674 (94.9%) | 10,050 (92.0%) |
| 45 to 54 Years | 9,610 (95.2%) | 9,586 (94.1%) |
| 55 to 64 Years | 8,871 (93.8%) | 9,551 (95.3%) |
| 65 to 74 Years | 6,454 (96.5%) | 7,087 (94.2%) |
| 75 Years and over | 3,604 (93.2%) | 4,877 (87.9%) |
| Total | 73,047 (93.1%) | 73,732 (91.9%) |
Income Below Poverty Among Married-Couple Families in Johnson County
The poverty statistics for married-couple families in Johnson County show that 2.4% or 803 of the total 33,790 families live below the poverty line. Families with 5 or more children have the highest poverty rate of 15.2%, comprising of 46 families. On the other hand, families with no children have the lowest poverty rate of 1.3%, which includes 240 families.
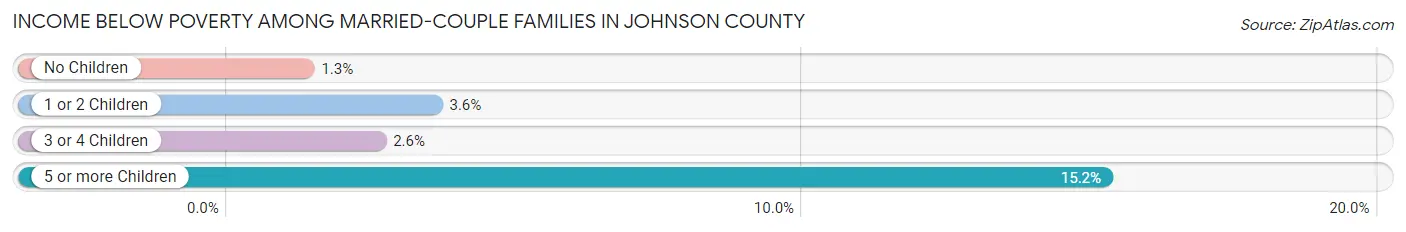
| Children | Above Poverty | Below Poverty |
| No Children | 17,818 (98.7%) | 240 (1.3%) |
| 1 or 2 Children | 11,773 (96.4%) | 434 (3.6%) |
| 3 or 4 Children | 3,140 (97.4%) | 83 (2.6%) |
| 5 or more Children | 256 (84.8%) | 46 (15.2%) |
| Total | 32,987 (97.6%) | 803 (2.4%) |
Income Below Poverty Among Single-Parent Households in Johnson County
According to the poverty data in Johnson County, 6.0% or 199 single-father households and 23.4% or 1,236 single-mother households are living below the poverty line. Among single-father households, those with 1 or 2 children have the highest poverty rate, with 134 households (7.6%) experiencing poverty. Likewise, among single-mother households, those with 3 or 4 children have the highest poverty rate, with 235 households (47.1%) falling below the poverty line.
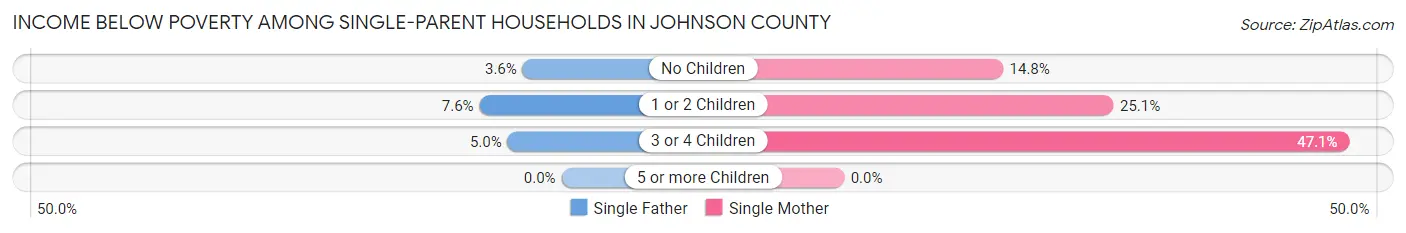
| Children | Single Father | Single Mother |
| No Children | 37 (3.6%) | 282 (14.8%) |
| 1 or 2 Children | 134 (7.6%) | 719 (25.1%) |
| 3 or 4 Children | 28 (5.0%) | 235 (47.1%) |
| 5 or more Children | 0 (0.0%) | 0 (0.0%) |
| Total | 199 (6.0%) | 1,236 (23.4%) |
Income Below Poverty Among Married-Couple vs Single-Parent Households in Johnson County
The poverty data for Johnson County shows that 803 of the married-couple family households (2.4%) and 1,435 of the single-parent households (16.7%) are living below the poverty level. Within the married-couple family households, those with 5 or more children have the highest poverty rate, with 46 households (15.2%) falling below the poverty line. Among the single-parent households, those with 3 or 4 children have the highest poverty rate, with 263 household (24.9%) living below poverty.
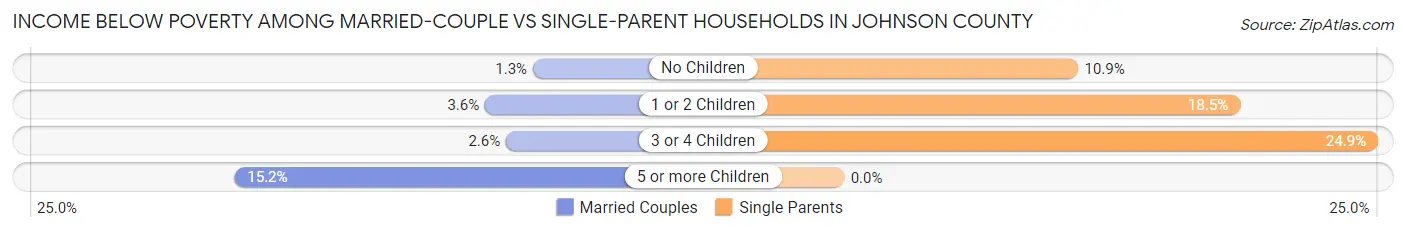
| Children | Married-Couple Families | Single-Parent Households |
| No Children | 240 (1.3%) | 319 (10.9%) |
| 1 or 2 Children | 434 (3.6%) | 853 (18.5%) |
| 3 or 4 Children | 83 (2.6%) | 263 (24.9%) |
| 5 or more Children | 46 (15.2%) | 0 (0.0%) |
| Total | 803 (2.4%) | 1,435 (16.7%) |
Employment Characteristics in Johnson County
Employment by Class of Employer in Johnson County
Among the 81,130 employed individuals in Johnson County, private company employees (55,894 | 68.9%), not-for-profit organizations (7,350 | 9.1%), and local government employees (5,573 | 6.9%) make up the most common classes of employment.
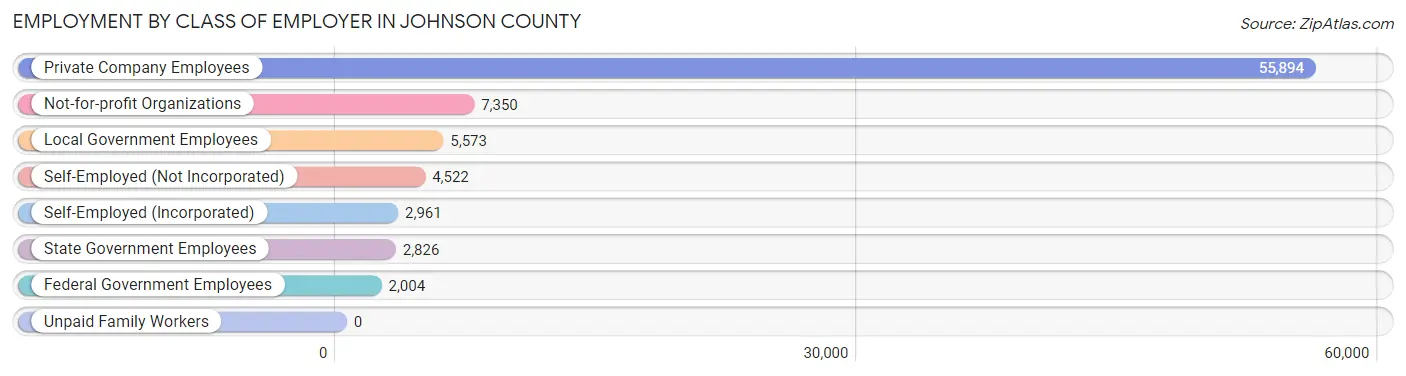
| Employer Class | # Employees | % Employees |
| Private Company Employees | 55,894 | 68.9% |
| Self-Employed (Incorporated) | 2,961 | 3.6% |
| Self-Employed (Not Incorporated) | 4,522 | 5.6% |
| Not-for-profit Organizations | 7,350 | 9.1% |
| Local Government Employees | 5,573 | 6.9% |
| State Government Employees | 2,826 | 3.5% |
| Federal Government Employees | 2,004 | 2.5% |
| Unpaid Family Workers | 0 | 0.0% |
| Total | 81,130 | 100.0% |
Employment Status by Age in Johnson County
According to the labor force statistics for Johnson County, out of the total population over 16 years of age (127,165), 66.8% or 84,946 individuals are in the labor force, with 3.4% or 2,888 of them unemployed. The age group with the highest labor force participation rate is 35 to 44 years, with 88.2% or 19,684 individuals in the labor force. Within the labor force, the 20 to 24 years age range has the highest percentage of unemployed individuals, with 8.2% or 730 of them being unemployed.
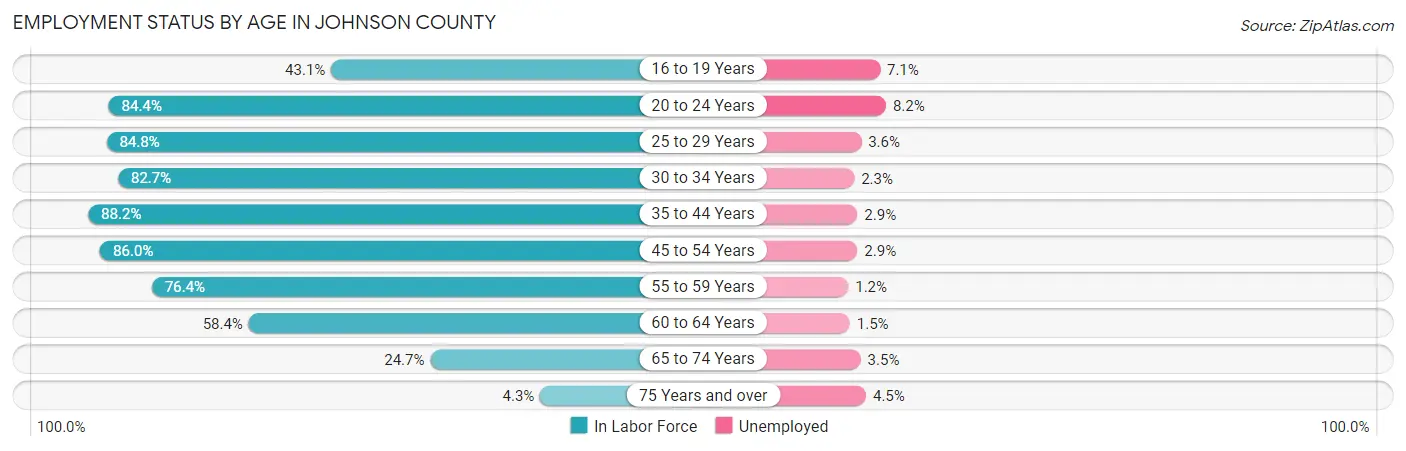
| Age Bracket | In Labor Force | Unemployed |
| 16 to 19 Years | 3,622 (43.1%) | 257 (7.1%) |
| 20 to 24 Years | 8,899 (84.4%) | 730 (8.2%) |
| 25 to 29 Years | 8,770 (84.8%) | 316 (3.6%) |
| 30 to 34 Years | 8,899 (82.7%) | 205 (2.3%) |
| 35 to 44 Years | 19,684 (88.2%) | 571 (2.9%) |
| 45 to 54 Years | 17,547 (86.0%) | 509 (2.9%) |
| 55 to 59 Years | 8,219 (76.4%) | 99 (1.2%) |
| 60 to 64 Years | 5,216 (58.4%) | 78 (1.5%) |
| 65 to 74 Years | 3,576 (24.7%) | 125 (3.5%) |
| 75 Years and over | 440 (4.3%) | 20 (4.5%) |
| Total | 84,946 (66.8%) | 2,888 (3.4%) |
Employment Status by Educational Attainment in Johnson County
According to labor force statistics for Johnson County, 81.8% of individuals (68,313) out of the total population between 25 and 64 years of age (83,512) are in the labor force, with 2.6% or 1,776 of them being unemployed. The group with the highest labor force participation rate are those with the educational attainment of bachelor's degree or higher, with 88.1% or 26,312 individuals in the labor force. Within the labor force, individuals with high school diploma education have the highest percentage of unemployment, with 5.3% or 917 of them being unemployed.
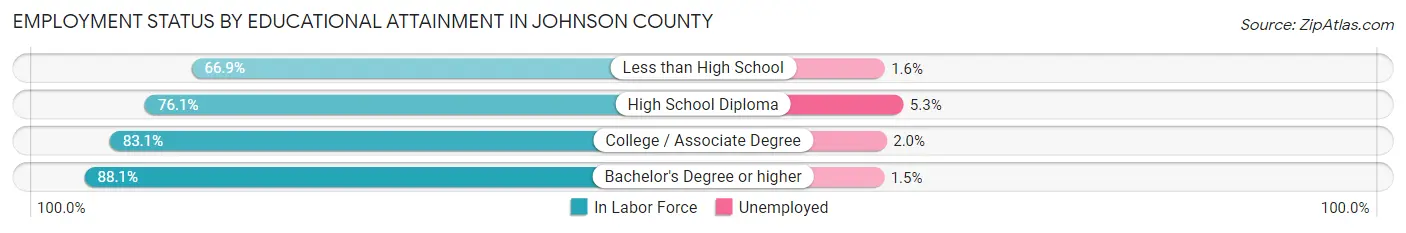
| Educational Attainment | In Labor Force | Unemployed |
| Less than High School | 3,951 (66.9%) | 94 (1.6%) |
| High School Diploma | 17,304 (76.1%) | 1,205 (5.3%) |
| College / Associate Degree | 20,777 (83.1%) | 500 (2.0%) |
| Bachelor's Degree or higher | 26,312 (88.1%) | 448 (1.5%) |
| Total | 68,313 (81.8%) | 2,171 (2.6%) |
Employment Occupations by Sex in Johnson County
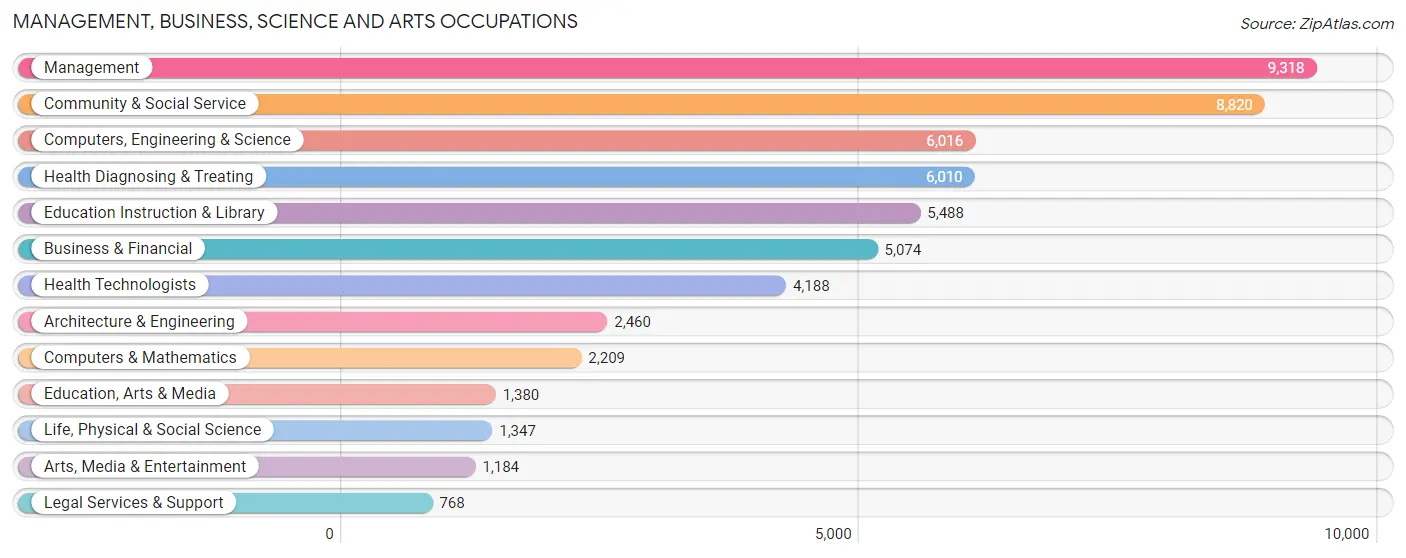
Management, Business, Science and Arts Occupations
The most common Management, Business, Science and Arts occupations in Johnson County are Management (9,318 | 11.4%), Community & Social Service (8,820 | 10.8%), Computers, Engineering & Science (6,016 | 7.4%), Health Diagnosing & Treating (6,010 | 7.4%), and Education Instruction & Library (5,488 | 6.7%).
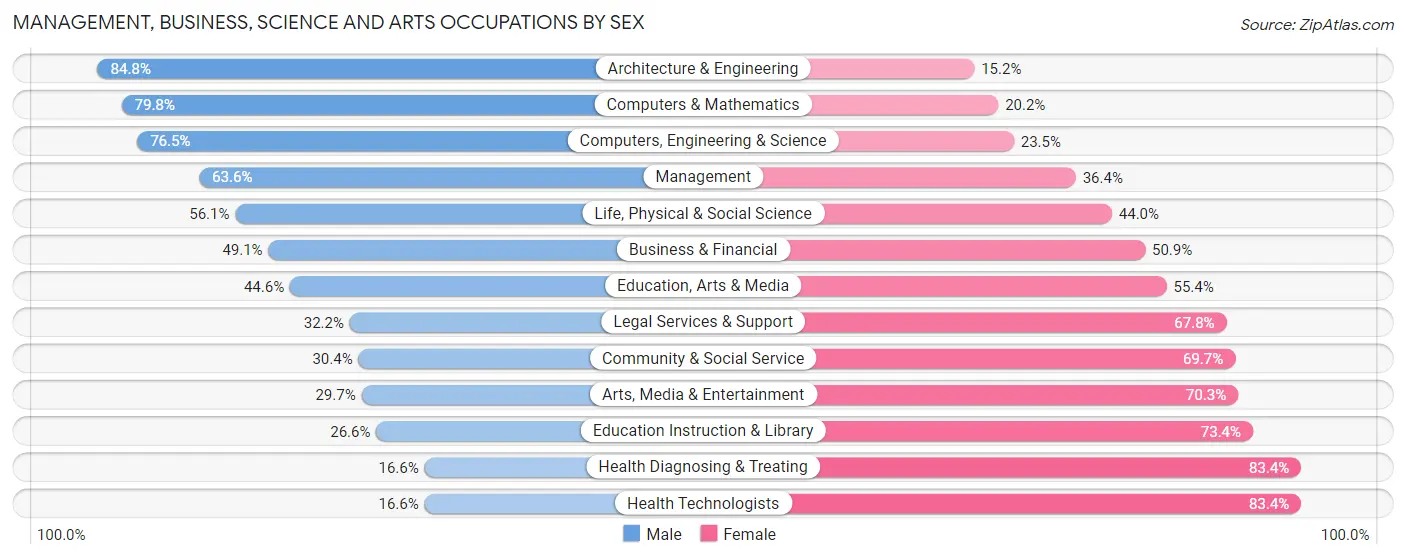
Management, Business, Science and Arts Occupations by Sex
Within the Management, Business, Science and Arts occupations in Johnson County, the most male-oriented occupations are Architecture & Engineering (84.8%), Computers & Mathematics (79.8%), and Computers, Engineering & Science (76.5%), while the most female-oriented occupations are Health Diagnosing & Treating (83.4%), Health Technologists (83.4%), and Education Instruction & Library (73.4%).
| Occupation | Male | Female |
| Management | 5,924 (63.6%) | 3,394 (36.4%) |
| Business & Financial | 2,493 (49.1%) | 2,581 (50.9%) |
| Computers, Engineering & Science | 4,602 (76.5%) | 1,414 (23.5%) |
| Computers & Mathematics | 1,762 (79.8%) | 447 (20.2%) |
| Architecture & Engineering | 2,085 (84.8%) | 375 (15.2%) |
| Life, Physical & Social Science | 755 (56.0%) | 592 (44.0%) |
| Community & Social Service | 2,677 (30.3%) | 6,143 (69.7%) |
| Education, Arts & Media | 616 (44.6%) | 764 (55.4%) |
| Legal Services & Support | 247 (32.2%) | 521 (67.8%) |
| Education Instruction & Library | 1,462 (26.6%) | 4,026 (73.4%) |
| Arts, Media & Entertainment | 352 (29.7%) | 832 (70.3%) |
| Health Diagnosing & Treating | 996 (16.6%) | 5,014 (83.4%) |
| Health Technologists | 694 (16.6%) | 3,494 (83.4%) |
| Total (Category) | 16,692 (47.4%) | 18,546 (52.6%) |
| Total (Overall) | 43,486 (53.3%) | 38,131 (46.7%) |
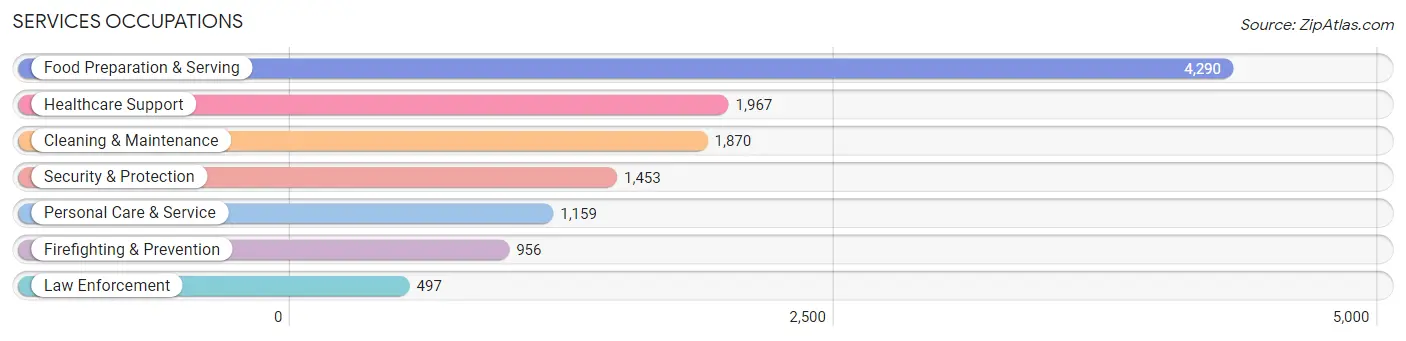
Services Occupations
The most common Services occupations in Johnson County are Food Preparation & Serving (4,290 | 5.3%), Healthcare Support (1,967 | 2.4%), Cleaning & Maintenance (1,870 | 2.3%), Security & Protection (1,453 | 1.8%), and Personal Care & Service (1,159 | 1.4%).
Services Occupations by Sex
Within the Services occupations in Johnson County, the most male-oriented occupations are Firefighting & Prevention (89.2%), Security & Protection (89.2%), and Law Enforcement (89.1%), while the most female-oriented occupations are Healthcare Support (92.6%), Personal Care & Service (85.6%), and Food Preparation & Serving (61.2%).

| Occupation | Male | Female |
| Healthcare Support | 145 (7.4%) | 1,822 (92.6%) |
| Security & Protection | 1,296 (89.2%) | 157 (10.8%) |
| Firefighting & Prevention | 853 (89.2%) | 103 (10.8%) |
| Law Enforcement | 443 (89.1%) | 54 (10.9%) |
| Food Preparation & Serving | 1,664 (38.8%) | 2,626 (61.2%) |
| Cleaning & Maintenance | 942 (50.4%) | 928 (49.6%) |
| Personal Care & Service | 167 (14.4%) | 992 (85.6%) |
| Total (Category) | 4,214 (39.2%) | 6,525 (60.8%) |
| Total (Overall) | 43,486 (53.3%) | 38,131 (46.7%) |
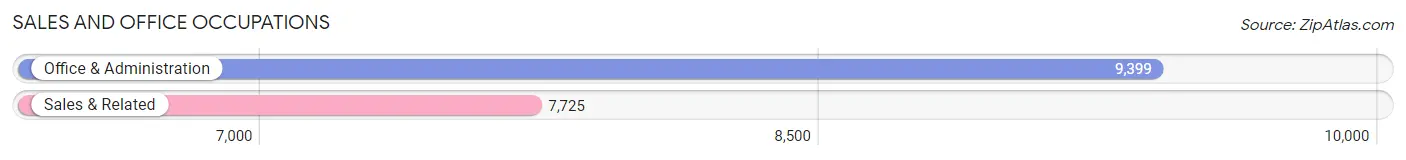
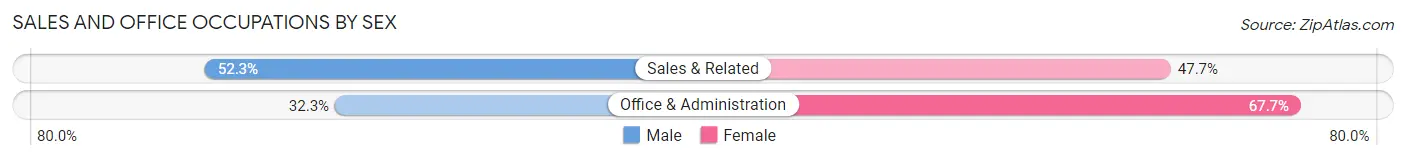
Sales and Office Occupations
The most common Sales and Office occupations in Johnson County are Office & Administration (9,399 | 11.5%), and Sales & Related (7,725 | 9.5%).
Sales and Office Occupations by Sex
| Occupation | Male | Female |
| Sales & Related | 4,037 (52.3%) | 3,688 (47.7%) |
| Office & Administration | 3,032 (32.3%) | 6,367 (67.7%) |
| Total (Category) | 7,069 (41.3%) | 10,055 (58.7%) |
| Total (Overall) | 43,486 (53.3%) | 38,131 (46.7%) |
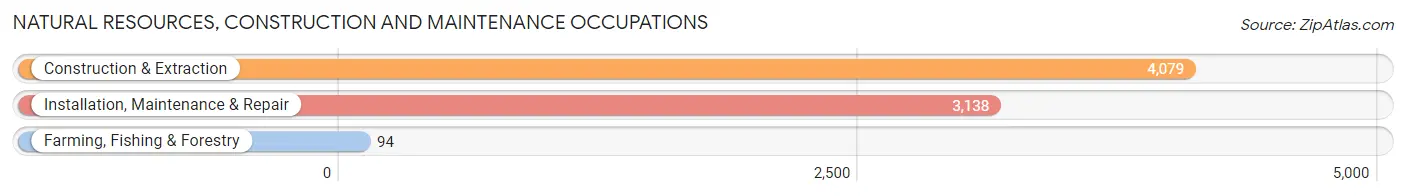
Natural Resources, Construction and Maintenance Occupations
The most common Natural Resources, Construction and Maintenance occupations in Johnson County are Construction & Extraction (4,079 | 5.0%), Installation, Maintenance & Repair (3,138 | 3.8%), and Farming, Fishing & Forestry (94 | 0.1%).
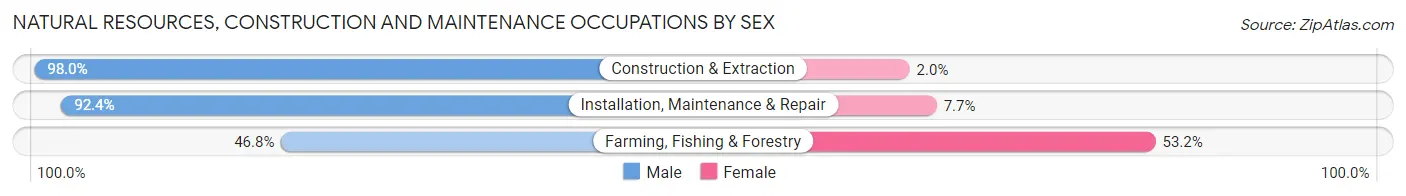
Natural Resources, Construction and Maintenance Occupations by Sex
| Occupation | Male | Female |
| Farming, Fishing & Forestry | 44 (46.8%) | 50 (53.2%) |
| Construction & Extraction | 3,996 (98.0%) | 83 (2.0%) |
| Installation, Maintenance & Repair | 2,898 (92.3%) | 240 (7.6%) |
| Total (Category) | 6,938 (94.9%) | 373 (5.1%) |
| Total (Overall) | 43,486 (53.3%) | 38,131 (46.7%) |
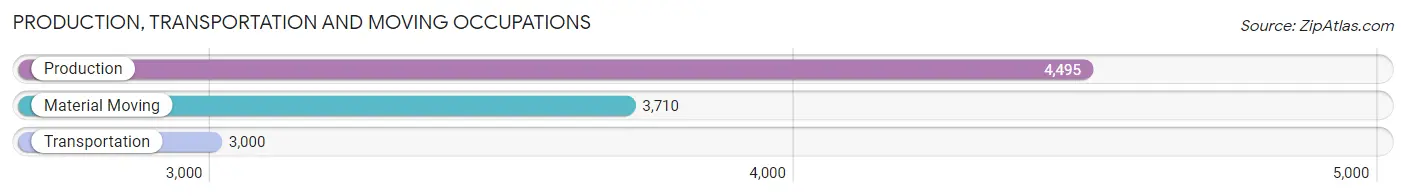
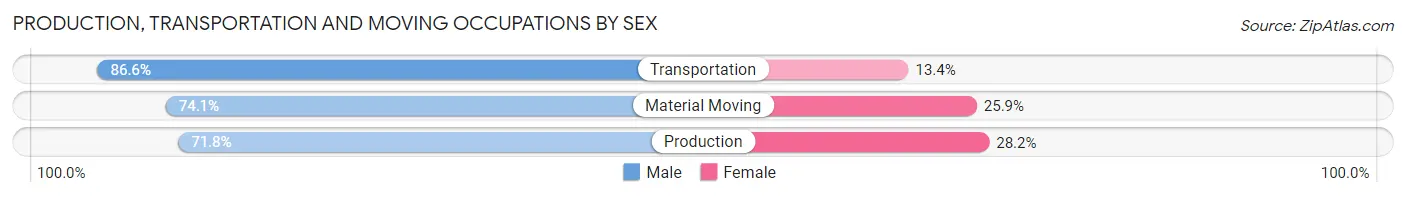
Production, Transportation and Moving Occupations
The most common Production, Transportation and Moving occupations in Johnson County are Production (4,495 | 5.5%), Material Moving (3,710 | 4.5%), and Transportation (3,000 | 3.7%).
Production, Transportation and Moving Occupations by Sex
| Occupation | Male | Female |
| Production | 3,227 (71.8%) | 1,268 (28.2%) |
| Transportation | 2,598 (86.6%) | 402 (13.4%) |
| Material Moving | 2,748 (74.1%) | 962 (25.9%) |
| Total (Category) | 8,573 (76.5%) | 2,632 (23.5%) |
| Total (Overall) | 43,486 (53.3%) | 38,131 (46.7%) |
Employment Industries by Sex in Johnson County
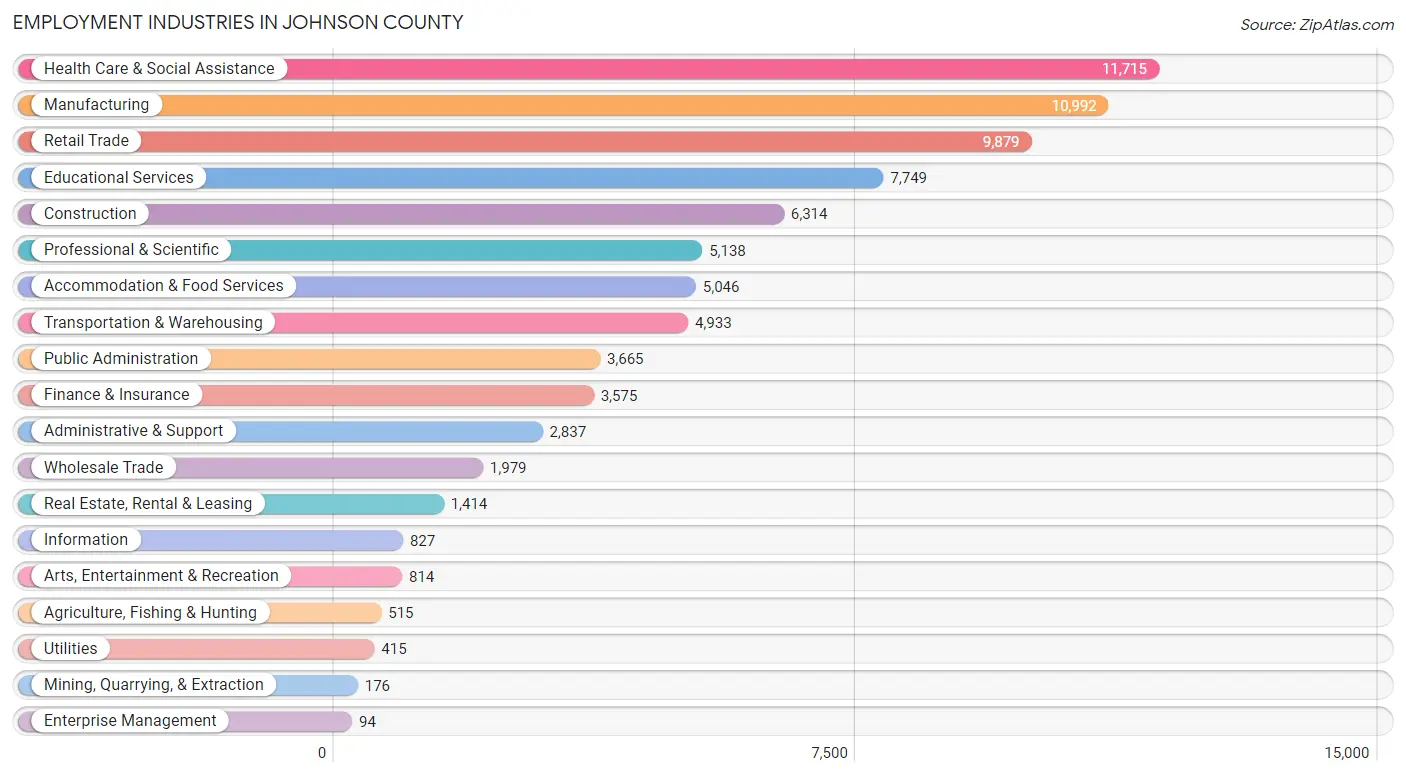
Employment Industries in Johnson County
The major employment industries in Johnson County include Health Care & Social Assistance (11,715 | 14.3%), Manufacturing (10,992 | 13.5%), Retail Trade (9,879 | 12.1%), Educational Services (7,749 | 9.5%), and Construction (6,314 | 7.7%).
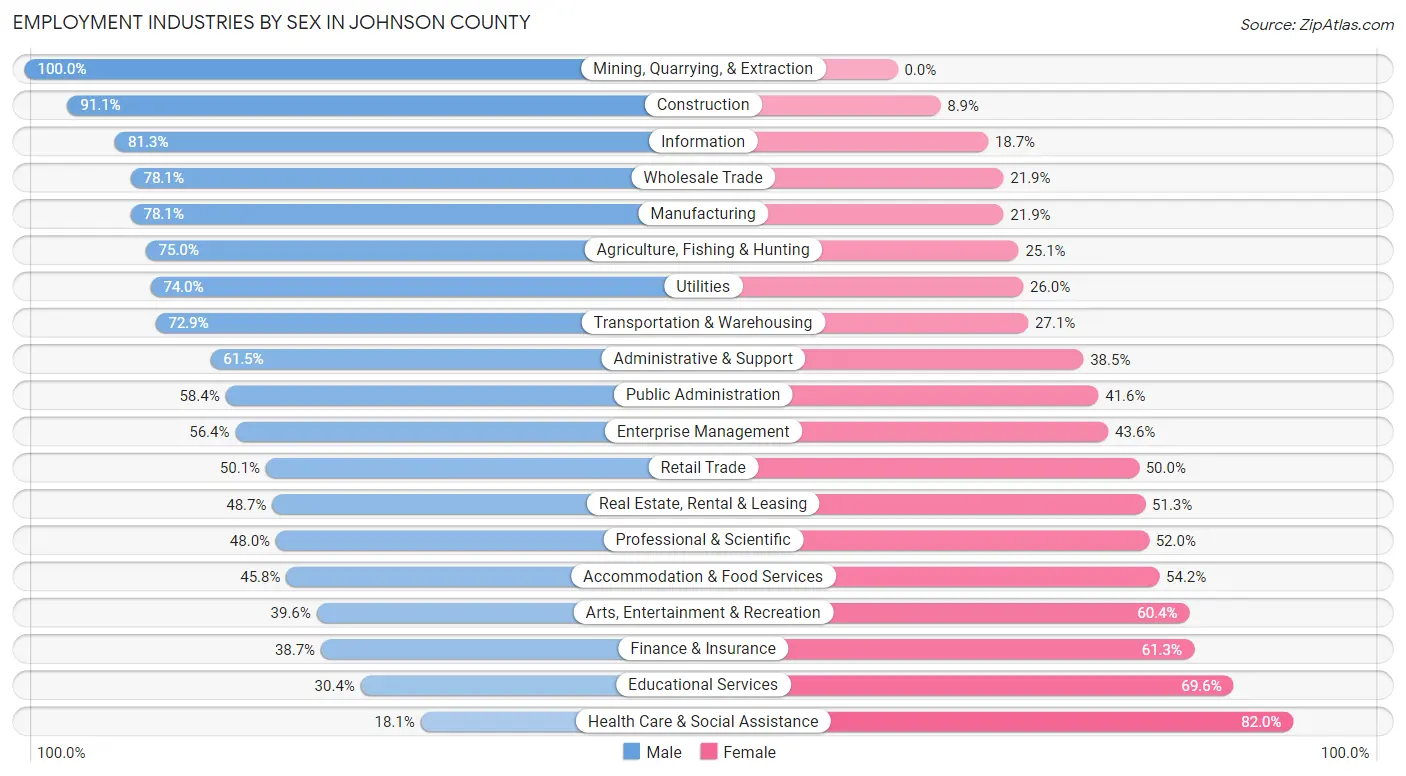
Employment Industries by Sex in Johnson County
The Johnson County industries that see more men than women are Mining, Quarrying, & Extraction (100.0%), Construction (91.1%), and Information (81.3%), whereas the industries that tend to have a higher number of women are Health Care & Social Assistance (82.0%), Educational Services (69.6%), and Finance & Insurance (61.3%).
| Industry | Male | Female |
| Agriculture, Fishing & Hunting | 386 (75.0%) | 129 (25.1%) |
| Mining, Quarrying, & Extraction | 176 (100.0%) | 0 (0.0%) |
| Construction | 5,754 (91.1%) | 560 (8.9%) |
| Manufacturing | 8,580 (78.1%) | 2,412 (21.9%) |
| Wholesale Trade | 1,545 (78.1%) | 434 (21.9%) |
| Retail Trade | 4,944 (50.0%) | 4,935 (49.9%) |
| Transportation & Warehousing | 3,598 (72.9%) | 1,335 (27.1%) |
| Utilities | 307 (74.0%) | 108 (26.0%) |
| Information | 672 (81.3%) | 155 (18.7%) |
| Finance & Insurance | 1,382 (38.7%) | 2,193 (61.3%) |
| Real Estate, Rental & Leasing | 689 (48.7%) | 725 (51.3%) |
| Professional & Scientific | 2,465 (48.0%) | 2,673 (52.0%) |
| Enterprise Management | 53 (56.4%) | 41 (43.6%) |
| Administrative & Support | 1,746 (61.5%) | 1,091 (38.5%) |
| Educational Services | 2,359 (30.4%) | 5,390 (69.6%) |
| Health Care & Social Assistance | 2,115 (18.0%) | 9,600 (82.0%) |
| Arts, Entertainment & Recreation | 322 (39.6%) | 492 (60.4%) |
| Accommodation & Food Services | 2,313 (45.8%) | 2,733 (54.2%) |
| Public Administration | 2,141 (58.4%) | 1,524 (41.6%) |
| Total | 43,486 (53.3%) | 38,131 (46.7%) |
Education in Johnson County
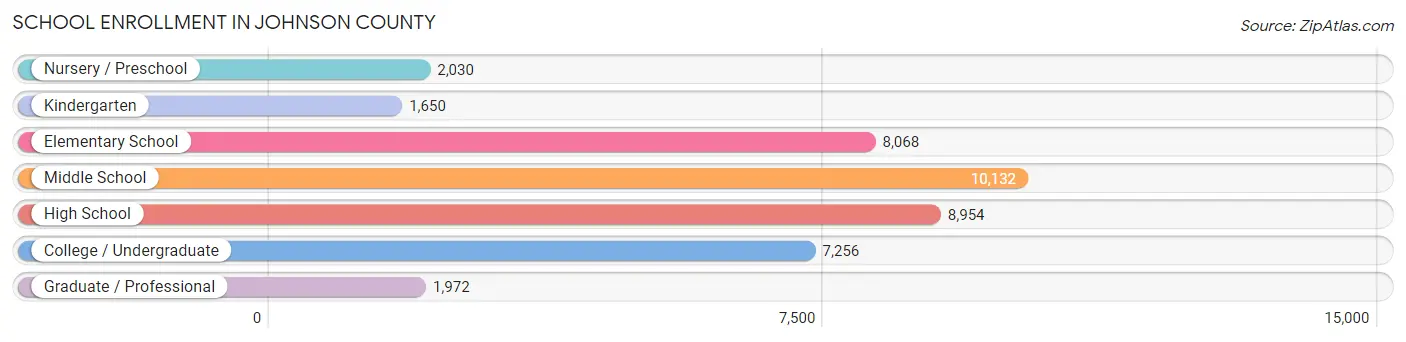
School Enrollment in Johnson County
The most common levels of schooling among the 40,062 students in Johnson County are middle school (10,132 | 25.3%), high school (8,954 | 22.4%), and elementary school (8,068 | 20.1%).
| School Level | # Students | % Students |
| Nursery / Preschool | 2,030 | 5.1% |
| Kindergarten | 1,650 | 4.1% |
| Elementary School | 8,068 | 20.1% |
| Middle School | 10,132 | 25.3% |
| High School | 8,954 | 22.4% |
| College / Undergraduate | 7,256 | 18.1% |
| Graduate / Professional | 1,972 | 4.9% |
| Total | 40,062 | 100.0% |
School Enrollment by Age by Funding Source in Johnson County
Out of a total of 40,062 students who are enrolled in schools in Johnson County, 7,652 (19.1%) attend a private institution, while the remaining 32,410 (80.9%) are enrolled in public schools. The age group of 3 to 4 year olds has the highest likelihood of being enrolled in private schools, with 820 (63.9% in the age bracket) enrolled. Conversely, the age group of 10 to 14 year olds has the lowest likelihood of being enrolled in a private school, with 10,640 (87.9% in the age bracket) attending a public institution.
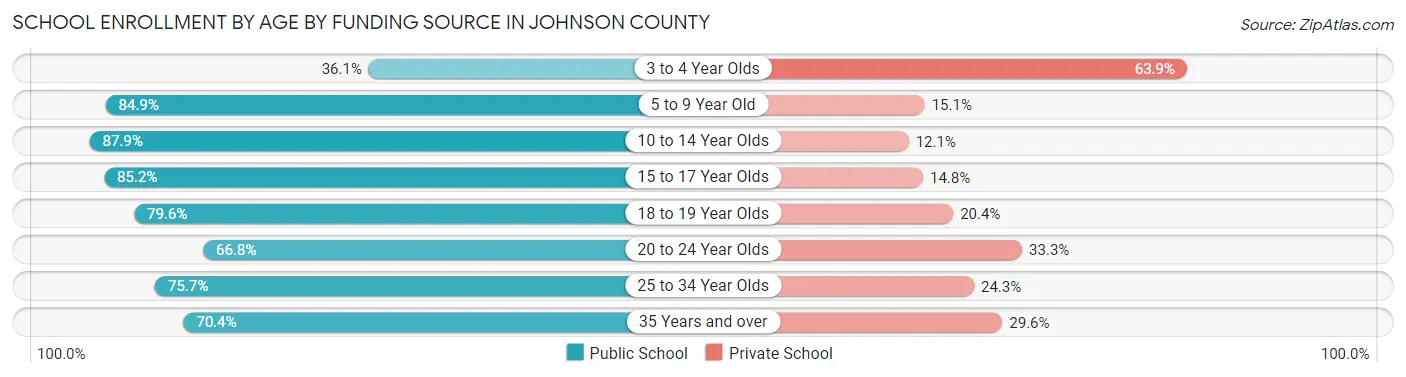
| Age Bracket | Public School | Private School |
| 3 to 4 Year Olds | 463 (36.1%) | 820 (63.9%) |
| 5 to 9 Year Old | 7,945 (84.9%) | 1,413 (15.1%) |
| 10 to 14 Year Olds | 10,640 (87.9%) | 1,466 (12.1%) |
| 15 to 17 Year Olds | 5,745 (85.2%) | 997 (14.8%) |
| 18 to 19 Year Olds | 1,928 (79.6%) | 494 (20.4%) |
| 20 to 24 Year Olds | 2,981 (66.7%) | 1,485 (33.3%) |
| 25 to 34 Year Olds | 1,471 (75.7%) | 472 (24.3%) |
| 35 Years and over | 1,227 (70.4%) | 515 (29.6%) |
| Total | 32,410 (80.9%) | 7,652 (19.1%) |
Educational Attainment by Field of Study in Johnson County
Business (7,134 | 18.9%), education (5,405 | 14.3%), science & technology (5,221 | 13.8%), engineering (2,955 | 7.8%), and bio, nature & agricultural (2,933 | 7.8%) are the most common fields of study among 37,728 individuals in Johnson County who have obtained a bachelor's degree or higher.
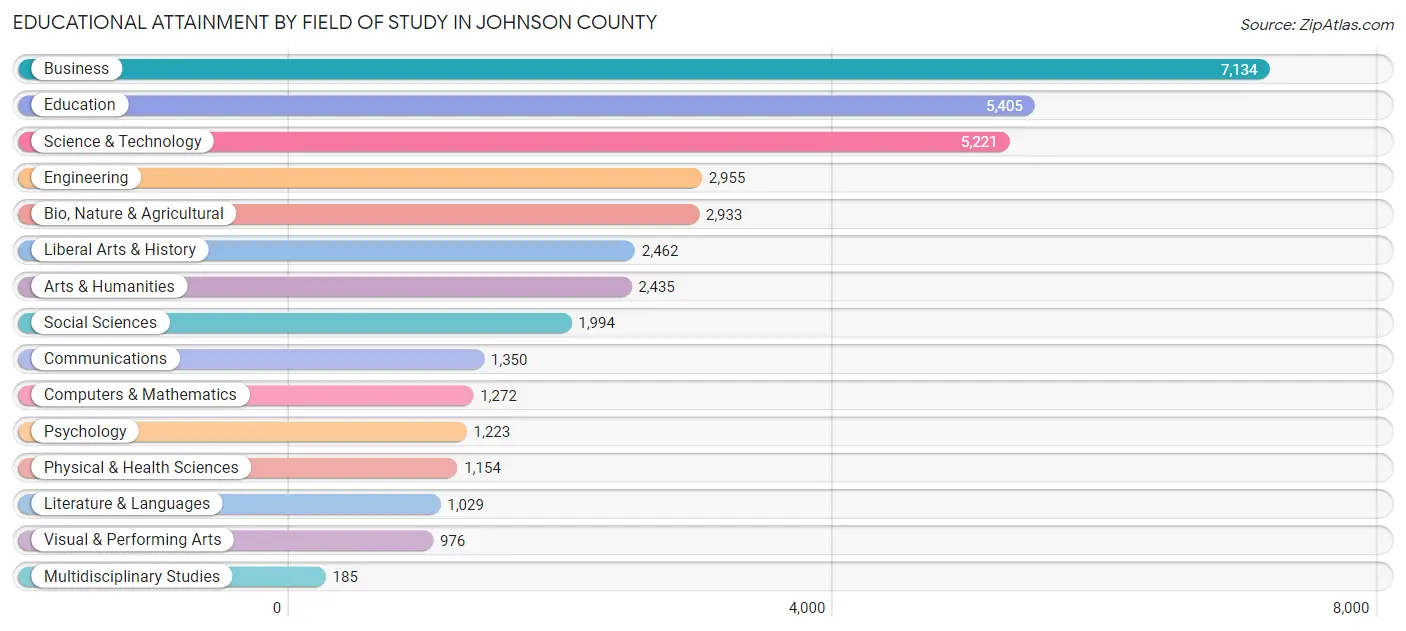
| Field of Study | # Graduates | % Graduates |
| Computers & Mathematics | 1,272 | 3.4% |
| Bio, Nature & Agricultural | 2,933 | 7.8% |
| Physical & Health Sciences | 1,154 | 3.1% |
| Psychology | 1,223 | 3.2% |
| Social Sciences | 1,994 | 5.3% |
| Engineering | 2,955 | 7.8% |
| Multidisciplinary Studies | 185 | 0.5% |
| Science & Technology | 5,221 | 13.8% |
| Business | 7,134 | 18.9% |
| Education | 5,405 | 14.3% |
| Literature & Languages | 1,029 | 2.7% |
| Liberal Arts & History | 2,462 | 6.5% |
| Visual & Performing Arts | 976 | 2.6% |
| Communications | 1,350 | 3.6% |
| Arts & Humanities | 2,435 | 6.5% |
| Total | 37,728 | 100.0% |
Transportation & Commute in Johnson County
Vehicle Availability by Sex in Johnson County
The most prevalent vehicle ownership categories in Johnson County are males with 2 vehicles (20,085, accounting for 46.5%) and females with 2 vehicles (16,217, making up 53.3%).
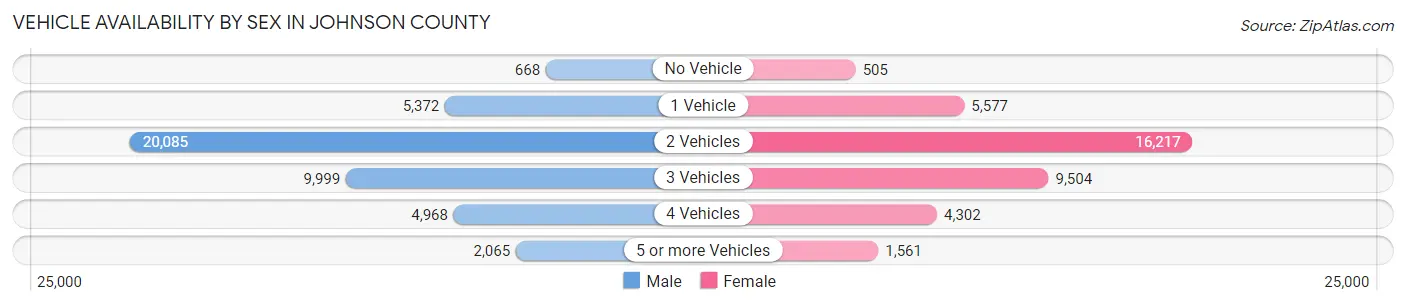
| Vehicles Available | Male | Female |
| No Vehicle | 668 (1.5%) | 505 (1.3%) |
| 1 Vehicle | 5,372 (12.4%) | 5,577 (14.8%) |
| 2 Vehicles | 20,085 (46.5%) | 16,217 (43.0%) |
| 3 Vehicles | 9,999 (23.2%) | 9,504 (25.2%) |
| 4 Vehicles | 4,968 (11.5%) | 4,302 (11.4%) |
| 5 or more Vehicles | 2,065 (4.8%) | 1,561 (4.1%) |
| Total | 43,157 (100.0%) | 37,666 (100.0%) |
Commute Time in Johnson County
The most frequently occuring commute durations in Johnson County are 15 to 19 minutes (10,298 commuters, 14.3%), 30 to 34 minutes (9,785 commuters, 13.6%), and 10 to 14 minutes (9,758 commuters, 13.6%).
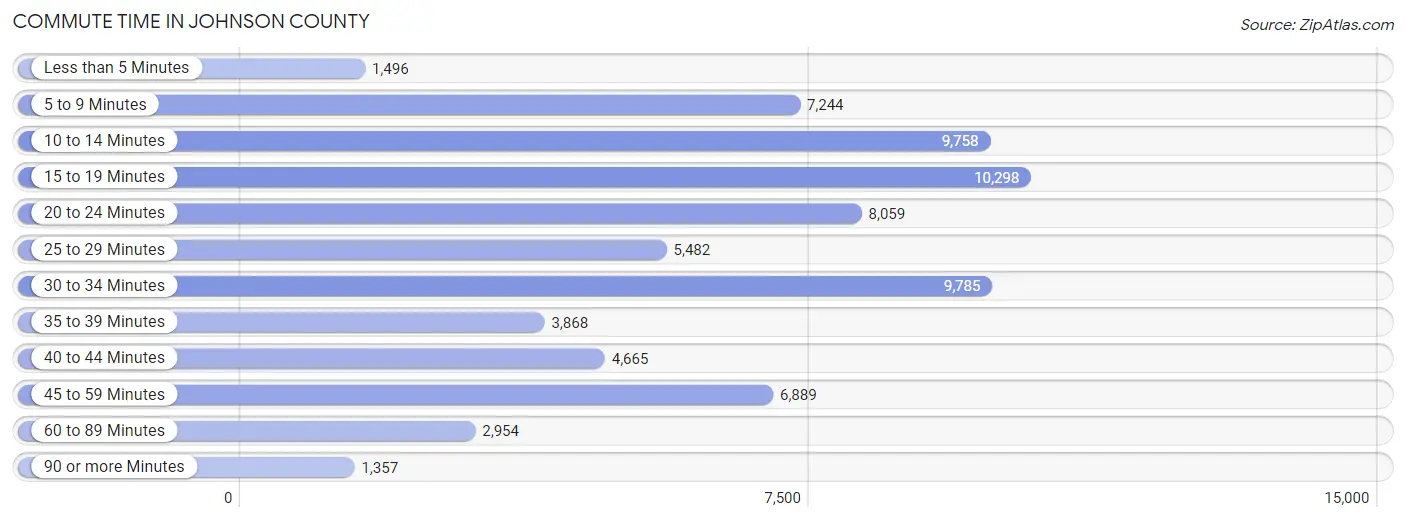
| Commute Time | # Commuters | % Commuters |
| Less than 5 Minutes | 1,496 | 2.1% |
| 5 to 9 Minutes | 7,244 | 10.1% |
| 10 to 14 Minutes | 9,758 | 13.6% |
| 15 to 19 Minutes | 10,298 | 14.3% |
| 20 to 24 Minutes | 8,059 | 11.2% |
| 25 to 29 Minutes | 5,482 | 7.6% |
| 30 to 34 Minutes | 9,785 | 13.6% |
| 35 to 39 Minutes | 3,868 | 5.4% |
| 40 to 44 Minutes | 4,665 | 6.5% |
| 45 to 59 Minutes | 6,889 | 9.6% |
| 60 to 89 Minutes | 2,954 | 4.1% |
| 90 or more Minutes | 1,357 | 1.9% |
Commute Time by Sex in Johnson County
The most common commute times in Johnson County are 30 to 34 minutes (6,081 commuters, 15.6%) for males and 15 to 19 minutes (5,158 commuters, 15.7%) for females.
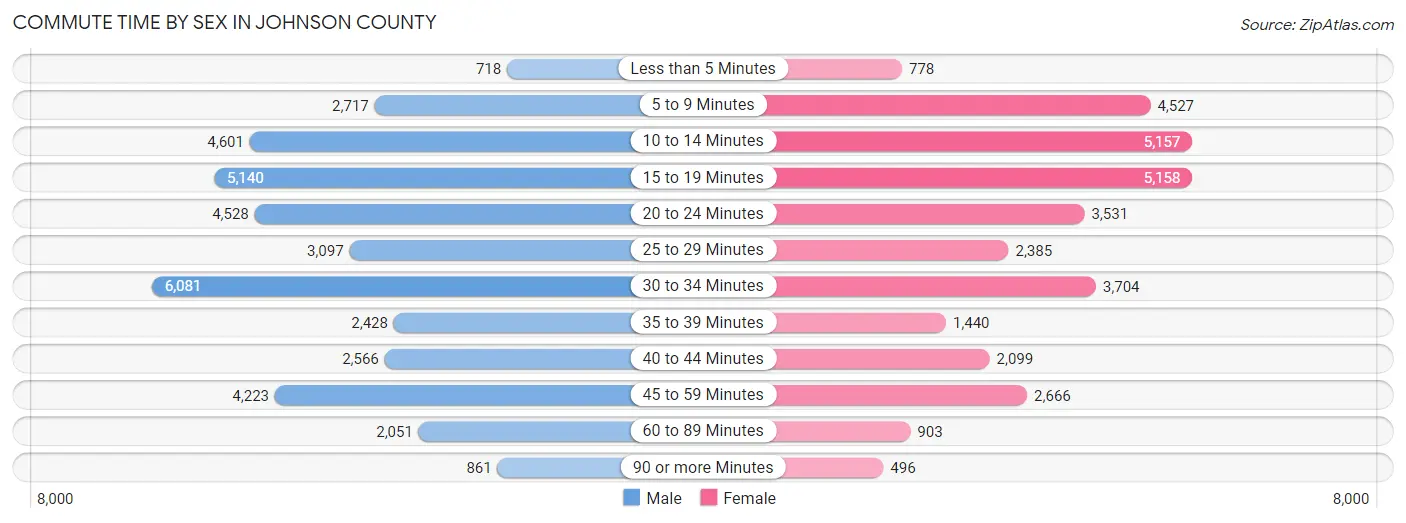
| Commute Time | Male | Female |
| Less than 5 Minutes | 718 (1.8%) | 778 (2.4%) |
| 5 to 9 Minutes | 2,717 (7.0%) | 4,527 (13.8%) |
| 10 to 14 Minutes | 4,601 (11.8%) | 5,157 (15.7%) |
| 15 to 19 Minutes | 5,140 (13.2%) | 5,158 (15.7%) |
| 20 to 24 Minutes | 4,528 (11.6%) | 3,531 (10.7%) |
| 25 to 29 Minutes | 3,097 (7.9%) | 2,385 (7.3%) |
| 30 to 34 Minutes | 6,081 (15.6%) | 3,704 (11.3%) |
| 35 to 39 Minutes | 2,428 (6.2%) | 1,440 (4.4%) |
| 40 to 44 Minutes | 2,566 (6.6%) | 2,099 (6.4%) |
| 45 to 59 Minutes | 4,223 (10.8%) | 2,666 (8.1%) |
| 60 to 89 Minutes | 2,051 (5.3%) | 903 (2.8%) |
| 90 or more Minutes | 861 (2.2%) | 496 (1.5%) |
Time of Departure to Work by Sex in Johnson County
The most frequent times of departure to work in Johnson County are 7:00 AM to 7:29 AM (6,784, 17.4%) for males and 7:00 AM to 7:29 AM (5,804, 17.7%) for females.
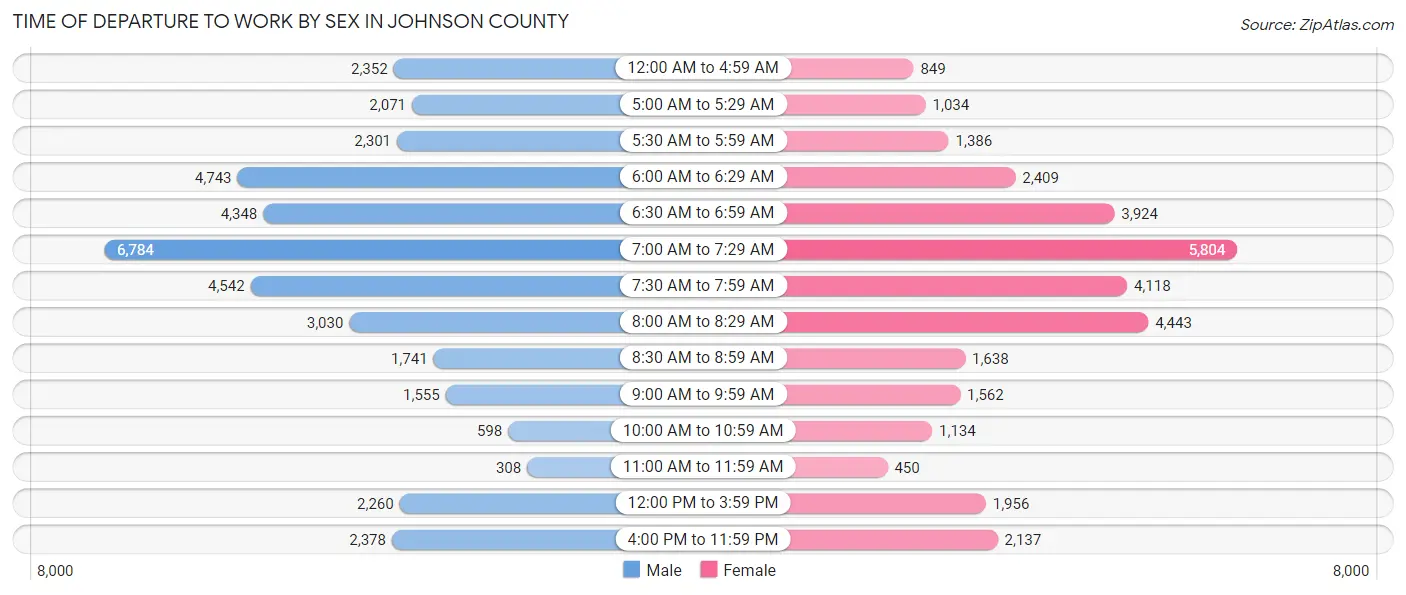
| Time of Departure | Male | Female |
| 12:00 AM to 4:59 AM | 2,352 (6.0%) | 849 (2.6%) |
| 5:00 AM to 5:29 AM | 2,071 (5.3%) | 1,034 (3.2%) |
| 5:30 AM to 5:59 AM | 2,301 (5.9%) | 1,386 (4.2%) |
| 6:00 AM to 6:29 AM | 4,743 (12.2%) | 2,409 (7.3%) |
| 6:30 AM to 6:59 AM | 4,348 (11.2%) | 3,924 (11.9%) |
| 7:00 AM to 7:29 AM | 6,784 (17.4%) | 5,804 (17.7%) |
| 7:30 AM to 7:59 AM | 4,542 (11.6%) | 4,118 (12.5%) |
| 8:00 AM to 8:29 AM | 3,030 (7.8%) | 4,443 (13.5%) |
| 8:30 AM to 8:59 AM | 1,741 (4.5%) | 1,638 (5.0%) |
| 9:00 AM to 9:59 AM | 1,555 (4.0%) | 1,562 (4.8%) |
| 10:00 AM to 10:59 AM | 598 (1.5%) | 1,134 (3.5%) |
| 11:00 AM to 11:59 AM | 308 (0.8%) | 450 (1.4%) |
| 12:00 PM to 3:59 PM | 2,260 (5.8%) | 1,956 (6.0%) |
| 4:00 PM to 11:59 PM | 2,378 (6.1%) | 2,137 (6.5%) |
| Total | 39,011 (100.0%) | 32,844 (100.0%) |
Housing Occupancy in Johnson County
Occupancy by Ownership in Johnson County
Of the total 60,274 dwellings in Johnson County, owner-occupied units account for 44,610 (74.0%), while renter-occupied units make up 15,664 (26.0%).
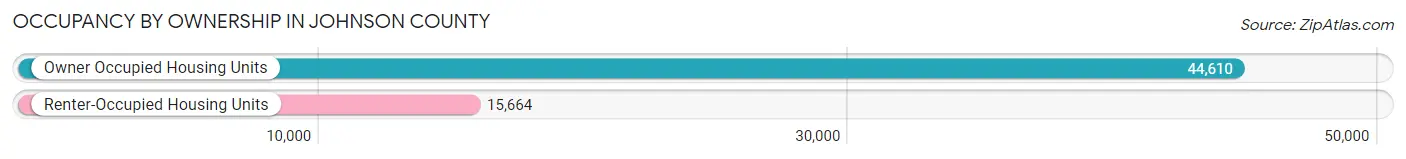
| Occupancy | # Housing Units | % Housing Units |
| Owner Occupied Housing Units | 44,610 | 74.0% |
| Renter-Occupied Housing Units | 15,664 | 26.0% |
| Total Occupied Housing Units | 60,274 | 100.0% |
Occupancy by Household Size in Johnson County
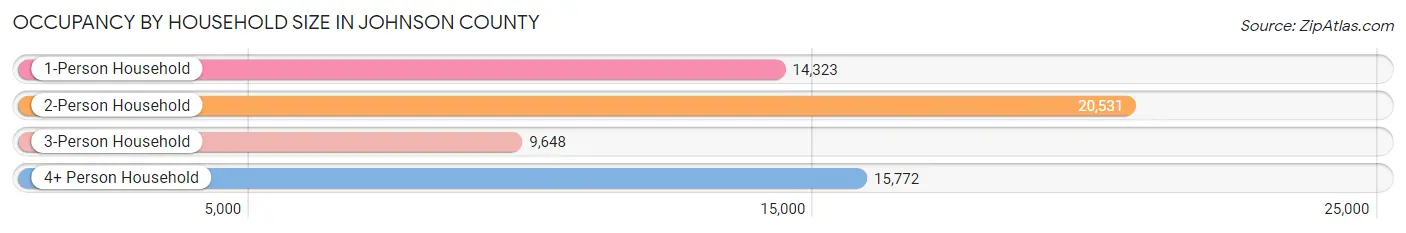
| Household Size | # Housing Units | % Housing Units |
| 1-Person Household | 14,323 | 23.8% |
| 2-Person Household | 20,531 | 34.1% |
| 3-Person Household | 9,648 | 16.0% |
| 4+ Person Household | 15,772 | 26.2% |
| Total Housing Units | 60,274 | 100.0% |
Occupancy by Ownership by Household Size in Johnson County
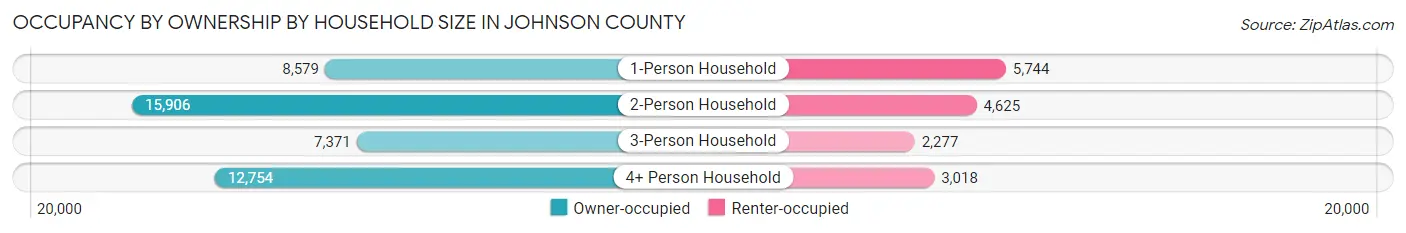
| Household Size | Owner-occupied | Renter-occupied |
| 1-Person Household | 8,579 (59.9%) | 5,744 (40.1%) |
| 2-Person Household | 15,906 (77.5%) | 4,625 (22.5%) |
| 3-Person Household | 7,371 (76.4%) | 2,277 (23.6%) |
| 4+ Person Household | 12,754 (80.9%) | 3,018 (19.1%) |
| Total Housing Units | 44,610 (74.0%) | 15,664 (26.0%) |
Occupancy by Educational Attainment in Johnson County
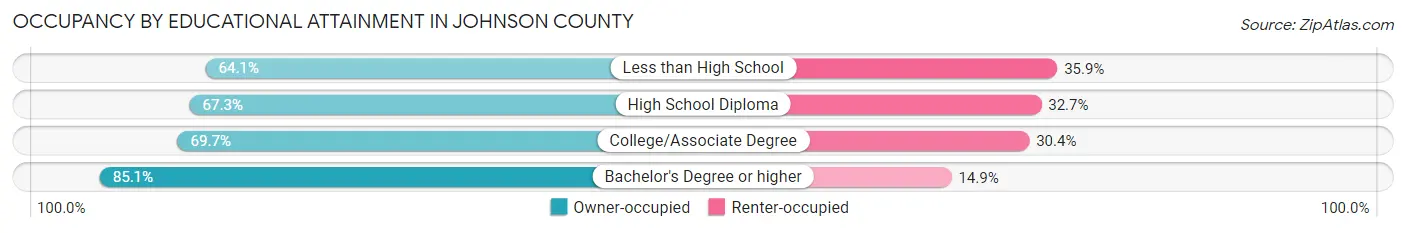
| Household Size | Owner-occupied | Renter-occupied |
| Less than High School | 2,533 (64.1%) | 1,418 (35.9%) |
| High School Diploma | 10,992 (67.3%) | 5,347 (32.7%) |
| College/Associate Degree | 13,223 (69.7%) | 5,763 (30.3%) |
| Bachelor's Degree or higher | 17,862 (85.1%) | 3,136 (14.9%) |
Occupancy by Age of Householder in Johnson County
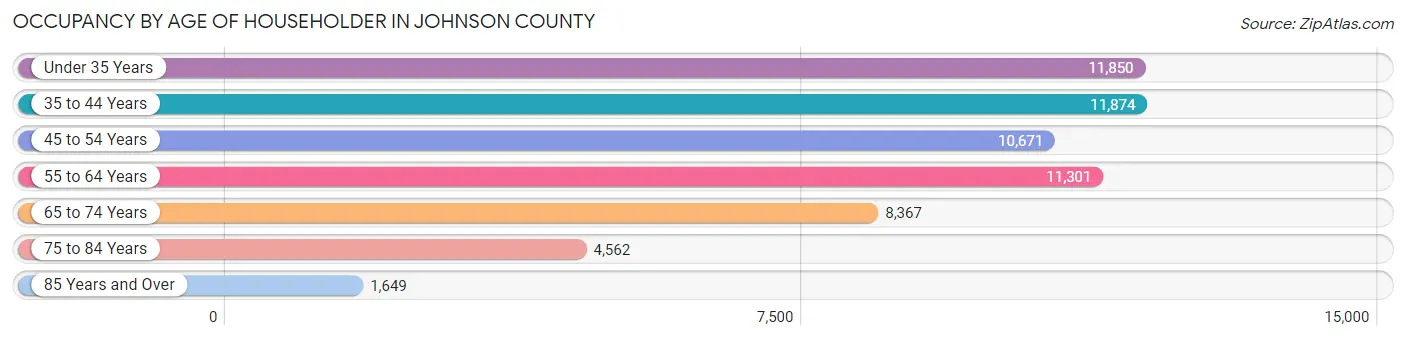
| Age Bracket | # Households | % Households |
| Under 35 Years | 11,850 | 19.7% |
| 35 to 44 Years | 11,874 | 19.7% |
| 45 to 54 Years | 10,671 | 17.7% |
| 55 to 64 Years | 11,301 | 18.8% |
| 65 to 74 Years | 8,367 | 13.9% |
| 75 to 84 Years | 4,562 | 7.6% |
| 85 Years and Over | 1,649 | 2.7% |
| Total | 60,274 | 100.0% |
Housing Finances in Johnson County
Median Income by Occupancy in Johnson County
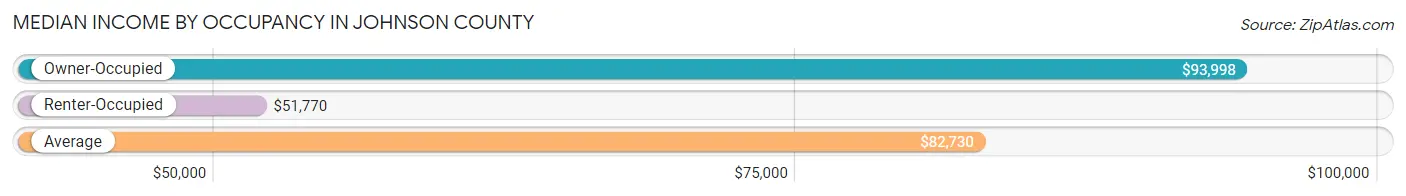
| Occupancy Type | # Households | Median Income |
| Owner-Occupied | 44,610 (74.0%) | $93,998 |
| Renter-Occupied | 15,664 (26.0%) | $51,770 |
| Average | 60,274 (100.0%) | $82,730 |
Occupancy by Householder Income Bracket in Johnson County
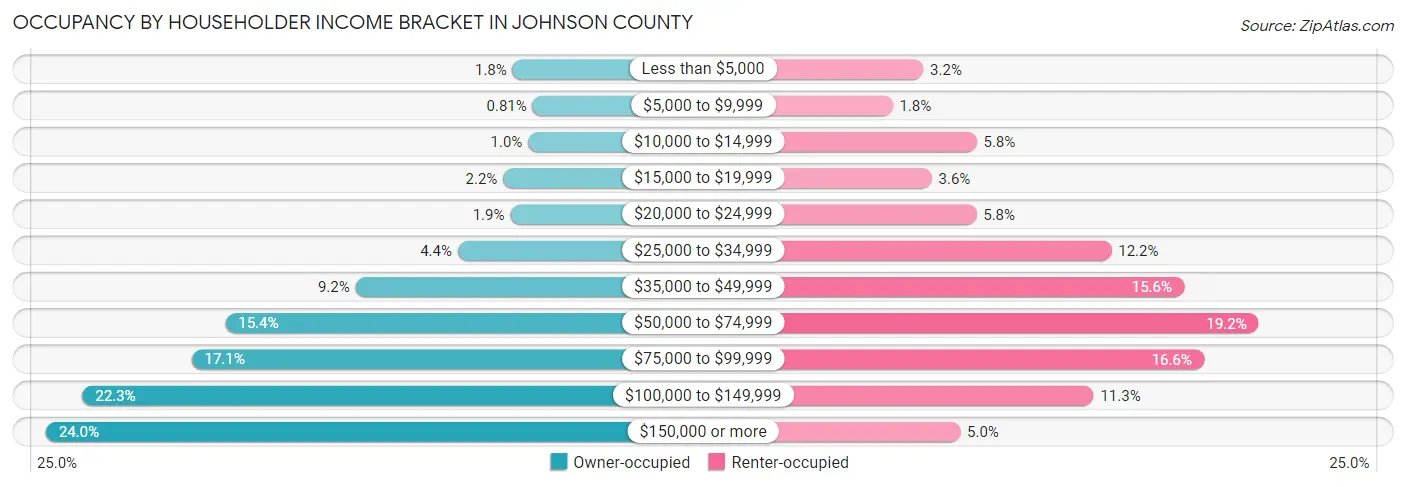
| Income Bracket | Owner-occupied | Renter-occupied |
| Less than $5,000 | 785 (1.8%) | 505 (3.2%) |
| $5,000 to $9,999 | 360 (0.8%) | 276 (1.8%) |
| $10,000 to $14,999 | 455 (1.0%) | 902 (5.8%) |
| $15,000 to $19,999 | 986 (2.2%) | 567 (3.6%) |
| $20,000 to $24,999 | 833 (1.9%) | 901 (5.8%) |
| $25,000 to $34,999 | 1,949 (4.4%) | 1,908 (12.2%) |
| $35,000 to $49,999 | 4,121 (9.2%) | 2,448 (15.6%) |
| $50,000 to $74,999 | 6,887 (15.4%) | 3,006 (19.2%) |
| $75,000 to $99,999 | 7,604 (17.1%) | 2,597 (16.6%) |
| $100,000 to $149,999 | 9,927 (22.3%) | 1,774 (11.3%) |
| $150,000 or more | 10,703 (24.0%) | 780 (5.0%) |
| Total | 44,610 (100.0%) | 15,664 (100.0%) |
Monthly Housing Cost Tiers in Johnson County
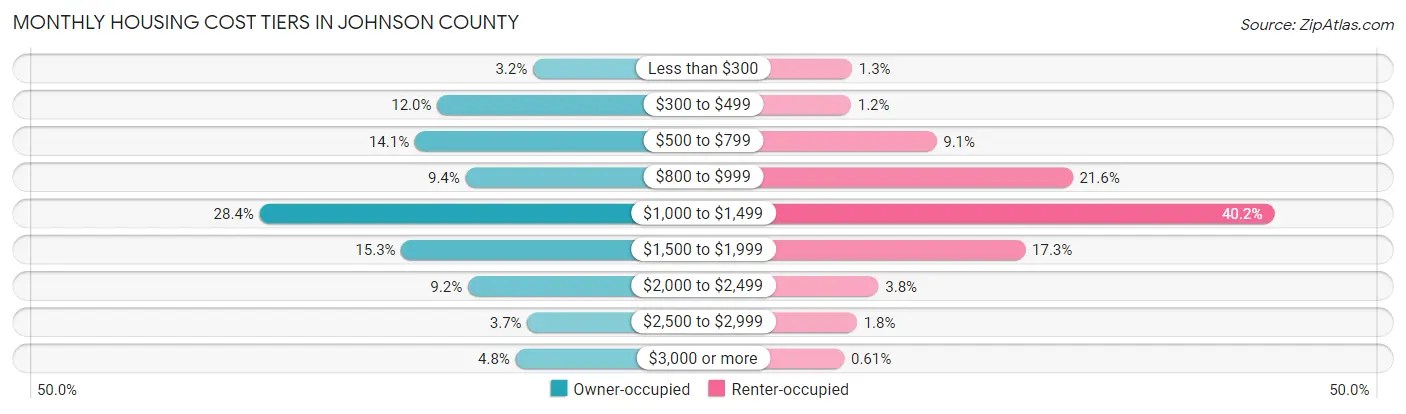
| Monthly Cost | Owner-occupied | Renter-occupied |
| Less than $300 | 1,422 (3.2%) | 208 (1.3%) |
| $300 to $499 | 5,357 (12.0%) | 192 (1.2%) |
| $500 to $799 | 6,273 (14.1%) | 1,426 (9.1%) |
| $800 to $999 | 4,192 (9.4%) | 3,390 (21.6%) |
| $1,000 to $1,499 | 12,653 (28.4%) | 6,299 (40.2%) |
| $1,500 to $1,999 | 6,828 (15.3%) | 2,706 (17.3%) |
| $2,000 to $2,499 | 4,094 (9.2%) | 591 (3.8%) |
| $2,500 to $2,999 | 1,655 (3.7%) | 279 (1.8%) |
| $3,000 or more | 2,136 (4.8%) | 95 (0.6%) |
| Total | 44,610 (100.0%) | 15,664 (100.0%) |
Physical Housing Characteristics in Johnson County
Housing Structures in Johnson County
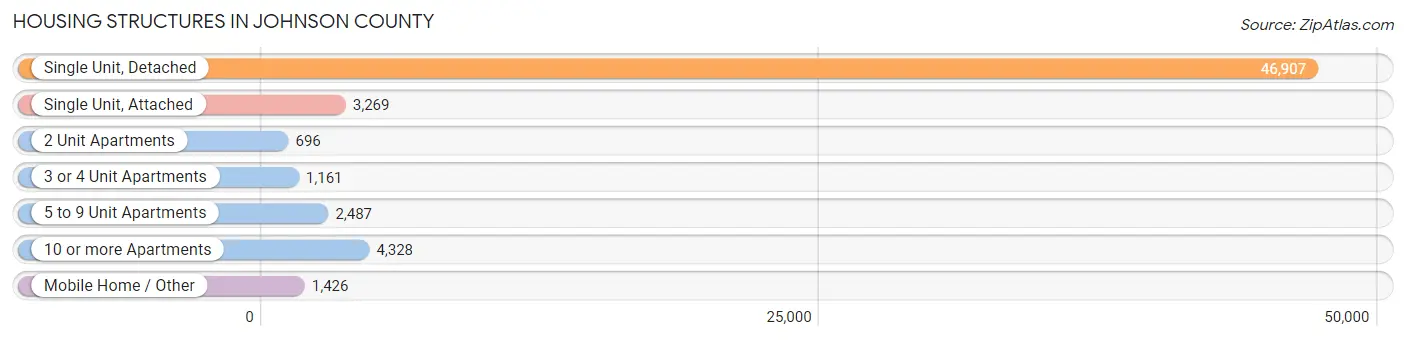
| Structure Type | # Housing Units | % Housing Units |
| Single Unit, Detached | 46,907 | 77.8% |
| Single Unit, Attached | 3,269 | 5.4% |
| 2 Unit Apartments | 696 | 1.1% |
| 3 or 4 Unit Apartments | 1,161 | 1.9% |
| 5 to 9 Unit Apartments | 2,487 | 4.1% |
| 10 or more Apartments | 4,328 | 7.2% |
| Mobile Home / Other | 1,426 | 2.4% |
| Total | 60,274 | 100.0% |
Housing Structures by Occupancy in Johnson County
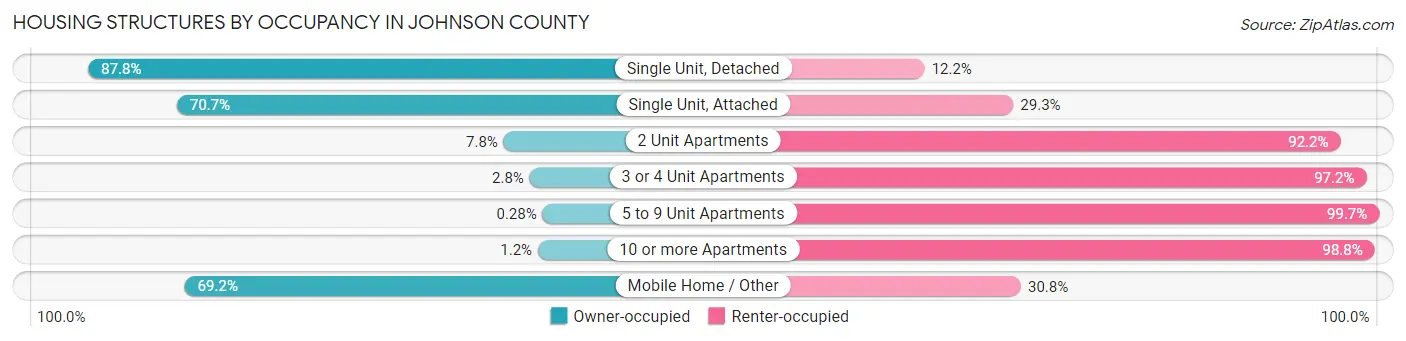
| Structure Type | Owner-occupied | Renter-occupied |
| Single Unit, Detached | 41,169 (87.8%) | 5,738 (12.2%) |
| Single Unit, Attached | 2,311 (70.7%) | 958 (29.3%) |
| 2 Unit Apartments | 54 (7.8%) | 642 (92.2%) |
| 3 or 4 Unit Apartments | 32 (2.8%) | 1,129 (97.2%) |
| 5 to 9 Unit Apartments | 7 (0.3%) | 2,480 (99.7%) |
| 10 or more Apartments | 50 (1.2%) | 4,278 (98.8%) |
| Mobile Home / Other | 987 (69.2%) | 439 (30.8%) |
| Total | 44,610 (74.0%) | 15,664 (26.0%) |
Housing Structures by Number of Rooms in Johnson County
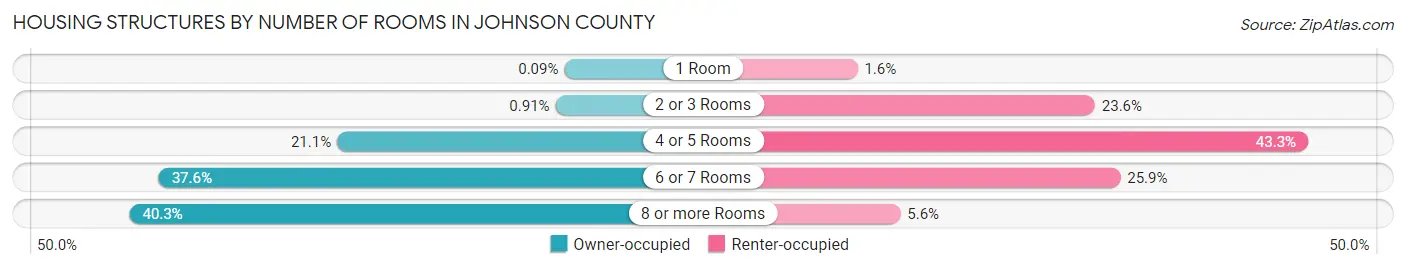
| Number of Rooms | Owner-occupied | Renter-occupied |
| 1 Room | 38 (0.1%) | 254 (1.6%) |
| 2 or 3 Rooms | 406 (0.9%) | 3,694 (23.6%) |
| 4 or 5 Rooms | 9,416 (21.1%) | 6,779 (43.3%) |
| 6 or 7 Rooms | 16,770 (37.6%) | 4,061 (25.9%) |
| 8 or more Rooms | 17,980 (40.3%) | 876 (5.6%) |
| Total | 44,610 (100.0%) | 15,664 (100.0%) |
Housing Structure by Heating Type in Johnson County
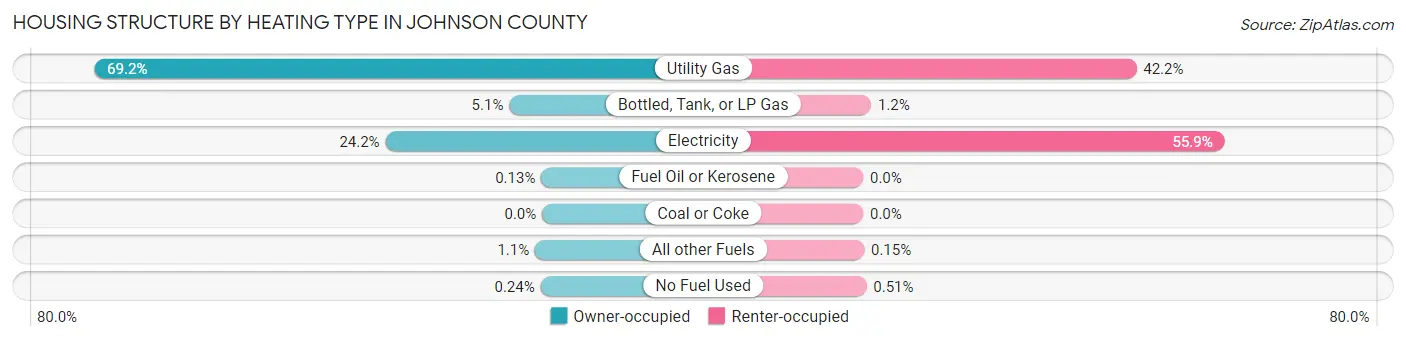
| Heating Type | Owner-occupied | Renter-occupied |
| Utility Gas | 30,888 (69.2%) | 6,616 (42.2%) |
| Bottled, Tank, or LP Gas | 2,268 (5.1%) | 191 (1.2%) |
| Electricity | 10,805 (24.2%) | 8,753 (55.9%) |
| Fuel Oil or Kerosene | 56 (0.1%) | 0 (0.0%) |
| Coal or Coke | 0 (0.0%) | 0 (0.0%) |
| All other Fuels | 486 (1.1%) | 24 (0.2%) |
| No Fuel Used | 107 (0.2%) | 80 (0.5%) |
| Total | 44,610 (100.0%) | 15,664 (100.0%) |
Household Vehicle Usage in Johnson County
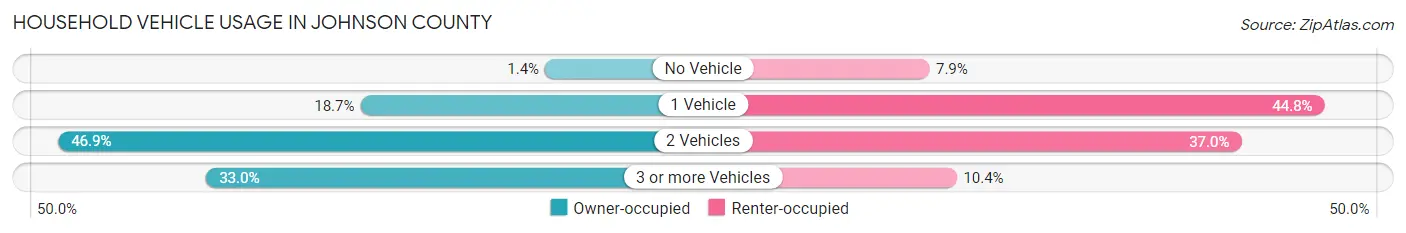
| Vehicles per Household | Owner-occupied | Renter-occupied |
| No Vehicle | 640 (1.4%) | 1,229 (7.9%) |
| 1 Vehicle | 8,325 (18.7%) | 7,011 (44.8%) |
| 2 Vehicles | 20,904 (46.9%) | 5,794 (37.0%) |
| 3 or more Vehicles | 14,741 (33.0%) | 1,630 (10.4%) |
| Total | 44,610 (100.0%) | 15,664 (100.0%) |
Real Estate & Mortgages in Johnson County
Real Estate and Mortgage Overview in Johnson County
| Characteristic | Without Mortgage | With Mortgage |
| Housing Units | 12,714 | 31,896 |
| Median Property Value | $227,700 | $247,100 |
| Median Household Income | $74,797 | $8,745 |
| Monthly Housing Costs | $502 | $2,021 |
| Real Estate Taxes | $1,715 | $862 |
Property Value by Mortgage Status in Johnson County
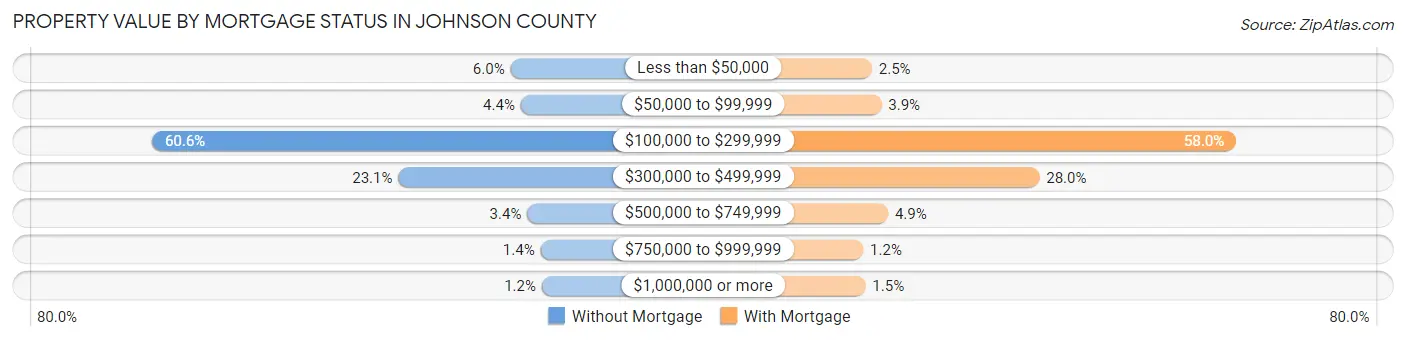
| Property Value | Without Mortgage | With Mortgage |
| Less than $50,000 | 758 (6.0%) | 791 (2.5%) |
| $50,000 to $99,999 | 559 (4.4%) | 1,255 (3.9%) |
| $100,000 to $299,999 | 7,703 (60.6%) | 18,495 (58.0%) |
| $300,000 to $499,999 | 2,932 (23.1%) | 8,932 (28.0%) |
| $500,000 to $749,999 | 434 (3.4%) | 1,575 (4.9%) |
| $750,000 to $999,999 | 177 (1.4%) | 369 (1.2%) |
| $1,000,000 or more | 151 (1.2%) | 479 (1.5%) |
| Total | 12,714 (100.0%) | 31,896 (100.0%) |
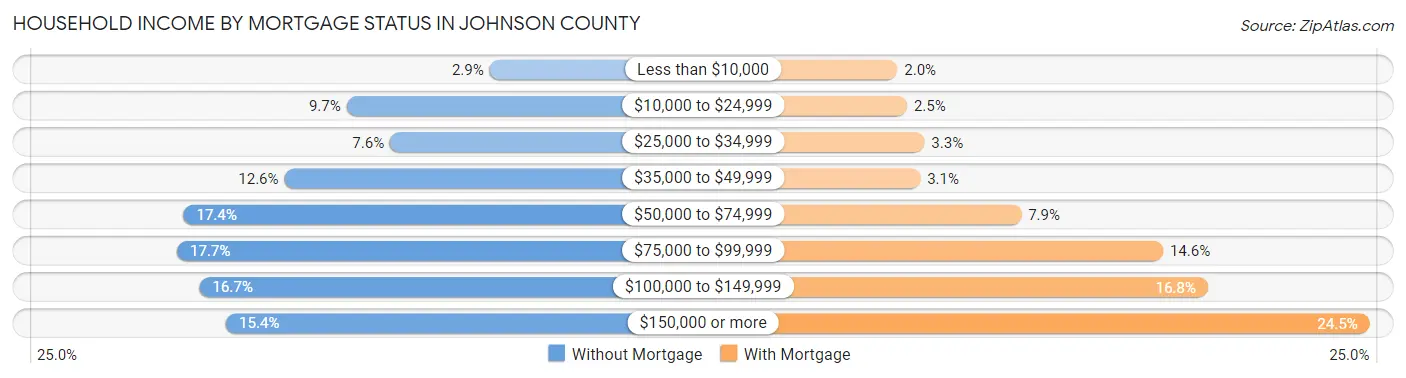
Household Income by Mortgage Status in Johnson County
| Household Income | Without Mortgage | With Mortgage |
| Less than $10,000 | 364 (2.9%) | 636 (2.0%) |
| $10,000 to $24,999 | 1,229 (9.7%) | 781 (2.5%) |
| $25,000 to $34,999 | 966 (7.6%) | 1,045 (3.3%) |
| $35,000 to $49,999 | 1,606 (12.6%) | 983 (3.1%) |
| $50,000 to $74,999 | 2,216 (17.4%) | 2,515 (7.9%) |
| $75,000 to $99,999 | 2,256 (17.7%) | 4,671 (14.6%) |
| $100,000 to $149,999 | 2,119 (16.7%) | 5,348 (16.8%) |
| $150,000 or more | 1,958 (15.4%) | 7,808 (24.5%) |
| Total | 12,714 (100.0%) | 31,896 (100.0%) |
Property Value to Household Income Ratio in Johnson County
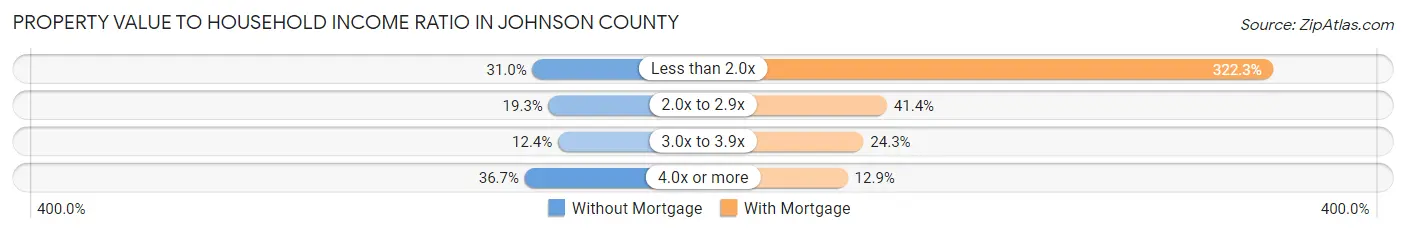
| Value-to-Income Ratio | Without Mortgage | With Mortgage |
| Less than 2.0x | 3,942 (31.0%) | 102,791 (322.3%) |
| 2.0x to 2.9x | 2,454 (19.3%) | 13,205 (41.4%) |
| 3.0x to 3.9x | 1,580 (12.4%) | 7,759 (24.3%) |
| 4.0x or more | 4,660 (36.6%) | 4,105 (12.9%) |
| Total | 12,714 (100.0%) | 31,896 (100.0%) |
Real Estate Taxes by Mortgage Status in Johnson County
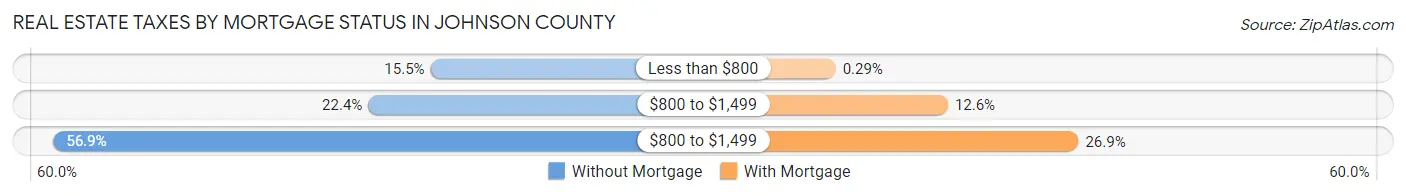
| Property Taxes | Without Mortgage | With Mortgage |
| Less than $800 | 1,975 (15.5%) | 91 (0.3%) |
| $800 to $1,499 | 2,841 (22.4%) | 4,015 (12.6%) |
| $800 to $1,499 | 7,228 (56.9%) | 8,580 (26.9%) |
| Total | 12,714 (100.0%) | 31,896 (100.0%) |
Health & Disability in Johnson County
Health Insurance Coverage by Age in Johnson County
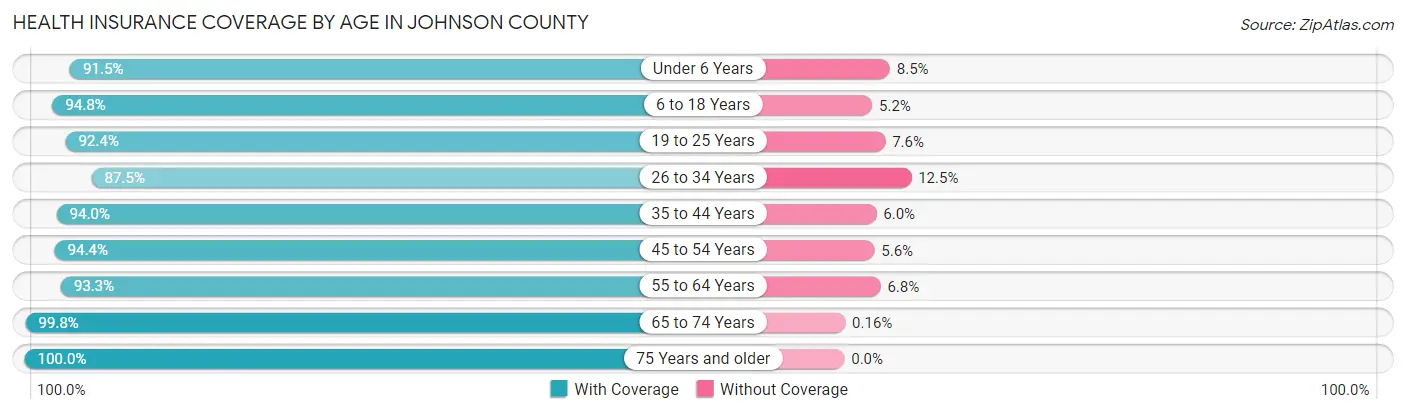
| Age Bracket | With Coverage | Without Coverage |
| Under 6 Years | 10,741 (91.5%) | 998 (8.5%) |
| 6 to 18 Years | 28,138 (94.8%) | 1,540 (5.2%) |
| 19 to 25 Years | 13,066 (92.4%) | 1,079 (7.6%) |
| 26 to 34 Years | 16,484 (87.5%) | 2,350 (12.5%) |
| 35 to 44 Years | 20,735 (94.0%) | 1,318 (6.0%) |
| 45 to 54 Years | 19,099 (94.4%) | 1,133 (5.6%) |
| 55 to 64 Years | 18,166 (93.2%) | 1,314 (6.8%) |
| 65 to 74 Years | 14,191 (99.8%) | 23 (0.2%) |
| 75 Years and older | 9,416 (100.0%) | 0 (0.0%) |
| Total | 150,036 (93.9%) | 9,755 (6.1%) |
Health Insurance Coverage by Citizenship Status in Johnson County
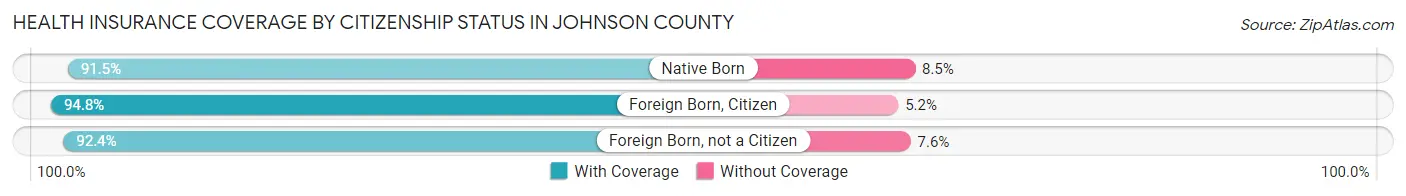
| Citizenship Status | With Coverage | Without Coverage |
| Native Born | 10,741 (91.5%) | 998 (8.5%) |
| Foreign Born, Citizen | 28,138 (94.8%) | 1,540 (5.2%) |
| Foreign Born, not a Citizen | 13,066 (92.4%) | 1,079 (7.6%) |
Health Insurance Coverage by Household Income in Johnson County
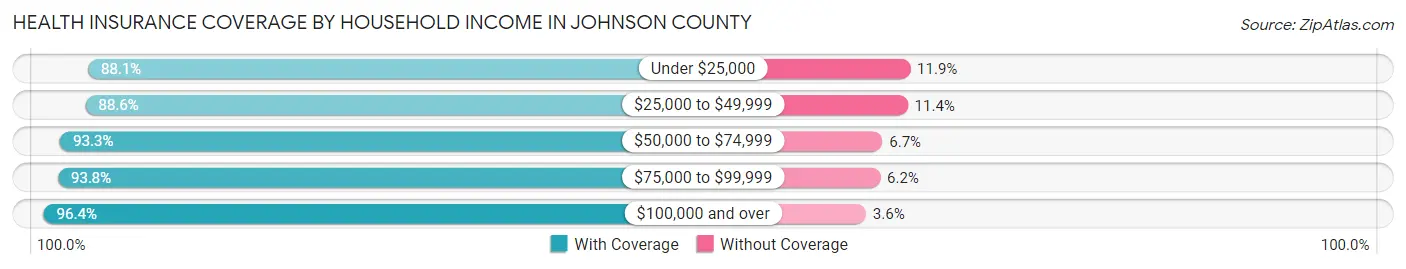
| Household Income | With Coverage | Without Coverage |
| Under $25,000 | 9,205 (88.1%) | 1,240 (11.9%) |
| $25,000 to $49,999 | 19,254 (88.6%) | 2,477 (11.4%) |
| $50,000 to $74,999 | 21,109 (93.3%) | 1,506 (6.7%) |
| $75,000 to $99,999 | 27,264 (93.8%) | 1,816 (6.2%) |
| $100,000 and over | 72,382 (96.4%) | 2,686 (3.6%) |
Public vs Private Health Insurance Coverage by Age in Johnson County
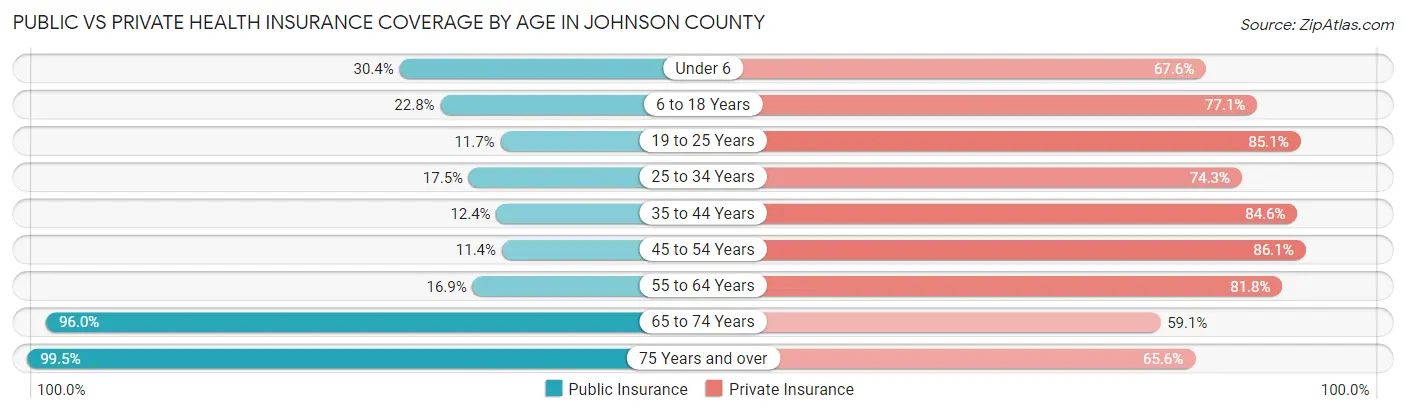
| Age Bracket | Public Insurance | Private Insurance |
| Under 6 | 3,570 (30.4%) | 7,934 (67.6%) |
| 6 to 18 Years | 6,772 (22.8%) | 22,878 (77.1%) |
| 19 to 25 Years | 1,652 (11.7%) | 12,043 (85.1%) |
| 25 to 34 Years | 3,301 (17.5%) | 13,985 (74.3%) |
| 35 to 44 Years | 2,739 (12.4%) | 18,647 (84.6%) |
| 45 to 54 Years | 2,308 (11.4%) | 17,414 (86.1%) |
| 55 to 64 Years | 3,282 (16.9%) | 15,927 (81.8%) |
| 65 to 74 Years | 13,650 (96.0%) | 8,400 (59.1%) |
| 75 Years and over | 9,369 (99.5%) | 6,174 (65.6%) |
| Total | 46,643 (29.2%) | 123,402 (77.2%) |
Disability Status by Sex by Age in Johnson County
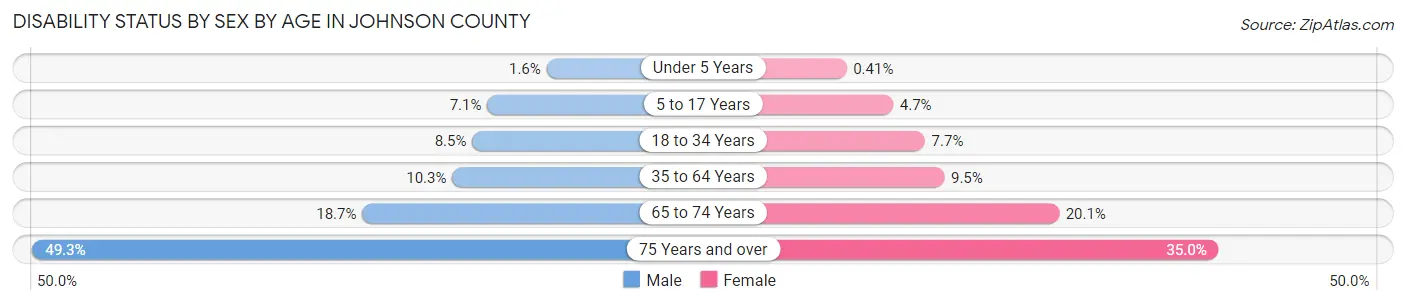
| Age Bracket | Male | Female |
| Under 5 Years | 74 (1.5%) | 20 (0.4%) |
| 5 to 17 Years | 1,079 (7.1%) | 688 (4.7%) |
| 18 to 34 Years | 1,495 (8.5%) | 1,332 (7.7%) |
| 35 to 64 Years | 3,160 (10.3%) | 2,953 (9.5%) |
| 65 to 74 Years | 1,248 (18.7%) | 1,515 (20.1%) |
| 75 Years and over | 1,906 (49.3%) | 1,940 (35.0%) |
Disability Class by Sex by Age in Johnson County
Disability Class: Hearing Difficulty
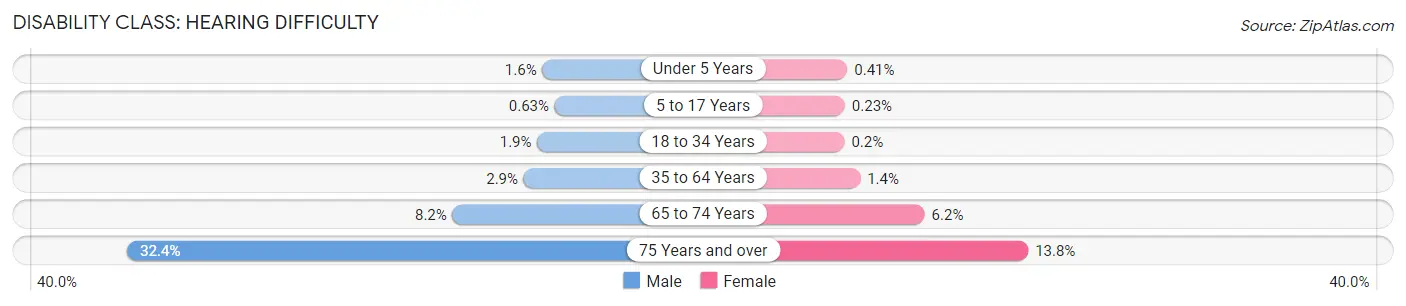
| Age Bracket | Male | Female |
| Under 5 Years | 74 (1.5%) | 20 (0.4%) |
| 5 to 17 Years | 96 (0.6%) | 33 (0.2%) |
| 18 to 34 Years | 341 (1.9%) | 34 (0.2%) |
| 35 to 64 Years | 897 (2.9%) | 426 (1.4%) |
| 65 to 74 Years | 550 (8.2%) | 463 (6.1%) |
| 75 Years and over | 1,253 (32.4%) | 768 (13.8%) |
Disability Class: Vision Difficulty
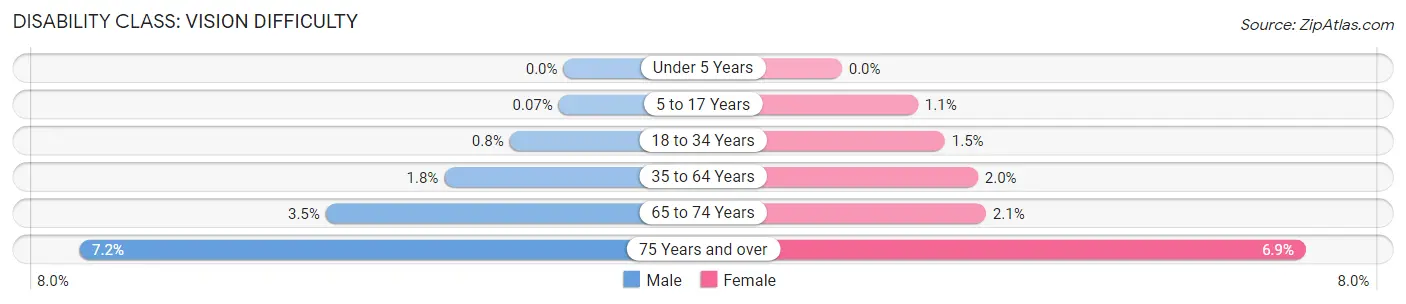
| Age Bracket | Male | Female |
| Under 5 Years | 0 (0.0%) | 0 (0.0%) |
| 5 to 17 Years | 11 (0.1%) | 164 (1.1%) |
| 18 to 34 Years | 142 (0.8%) | 265 (1.5%) |
| 35 to 64 Years | 544 (1.8%) | 629 (2.0%) |
| 65 to 74 Years | 236 (3.5%) | 161 (2.1%) |
| 75 Years and over | 278 (7.2%) | 382 (6.9%) |
Disability Class: Cognitive Difficulty
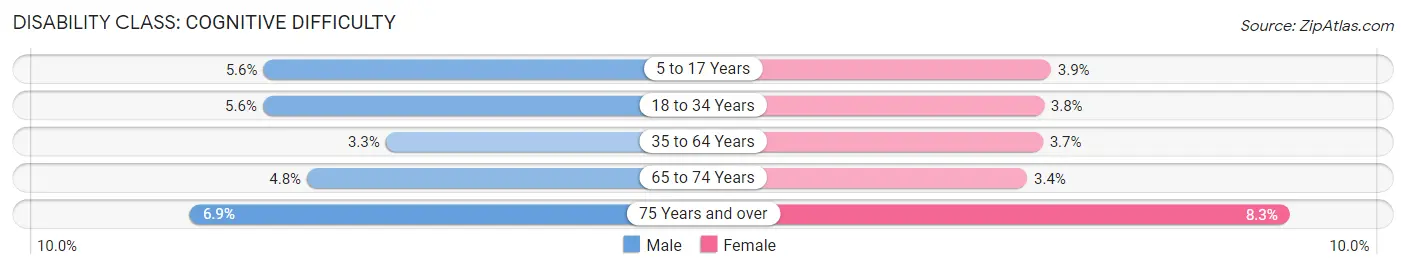
| Age Bracket | Male | Female |
| 5 to 17 Years | 851 (5.6%) | 563 (3.9%) |
| 18 to 34 Years | 987 (5.6%) | 650 (3.7%) |
| 35 to 64 Years | 1,013 (3.3%) | 1,162 (3.7%) |
| 65 to 74 Years | 318 (4.8%) | 259 (3.4%) |
| 75 Years and over | 268 (6.9%) | 461 (8.3%) |
Disability Class: Ambulatory Difficulty
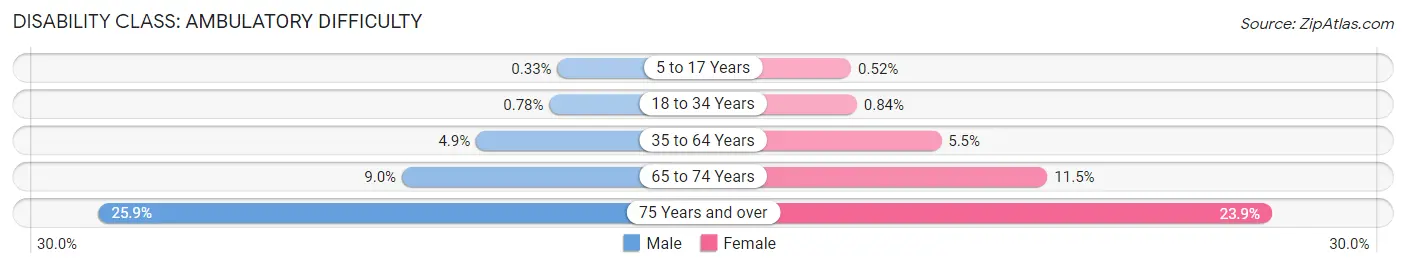
| Age Bracket | Male | Female |
| 5 to 17 Years | 51 (0.3%) | 76 (0.5%) |
| 18 to 34 Years | 138 (0.8%) | 146 (0.8%) |
| 35 to 64 Years | 1,491 (4.9%) | 1,724 (5.5%) |
| 65 to 74 Years | 601 (9.0%) | 862 (11.5%) |
| 75 Years and over | 1,001 (25.9%) | 1,328 (23.9%) |
Disability Class: Self-Care Difficulty
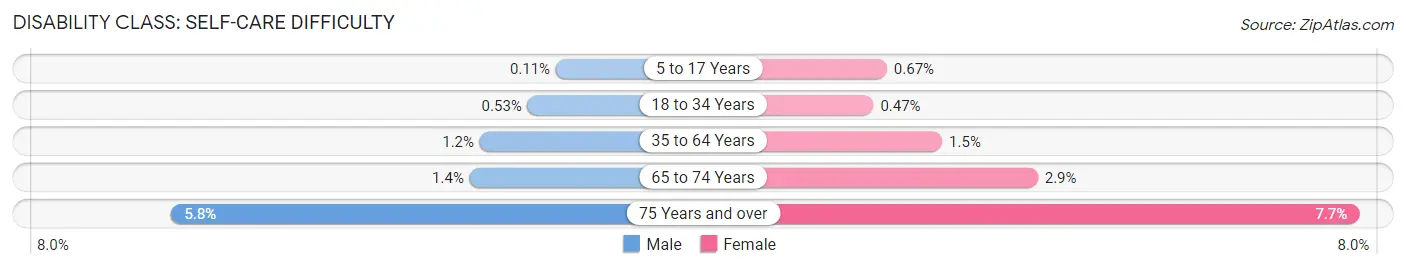
| Age Bracket | Male | Female |
| 5 to 17 Years | 17 (0.1%) | 97 (0.7%) |
| 18 to 34 Years | 93 (0.5%) | 82 (0.5%) |
| 35 to 64 Years | 379 (1.2%) | 463 (1.5%) |
| 65 to 74 Years | 93 (1.4%) | 219 (2.9%) |
| 75 Years and over | 225 (5.8%) | 426 (7.7%) |
Technology Access in Johnson County
Computing Device Access in Johnson County
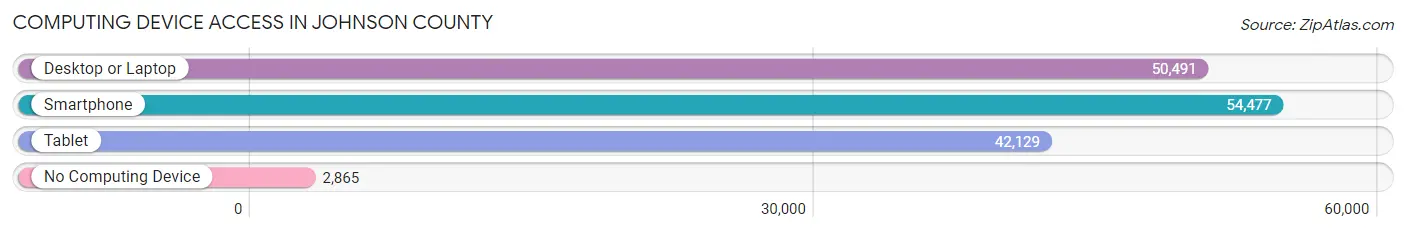
| Device Type | # Households | % Households |
| Desktop or Laptop | 50,491 | 83.8% |
| Smartphone | 54,477 | 90.4% |
| Tablet | 42,129 | 69.9% |
| No Computing Device | 2,865 | 4.8% |
| Total | 60,274 | 100.0% |
Internet Access in Johnson County
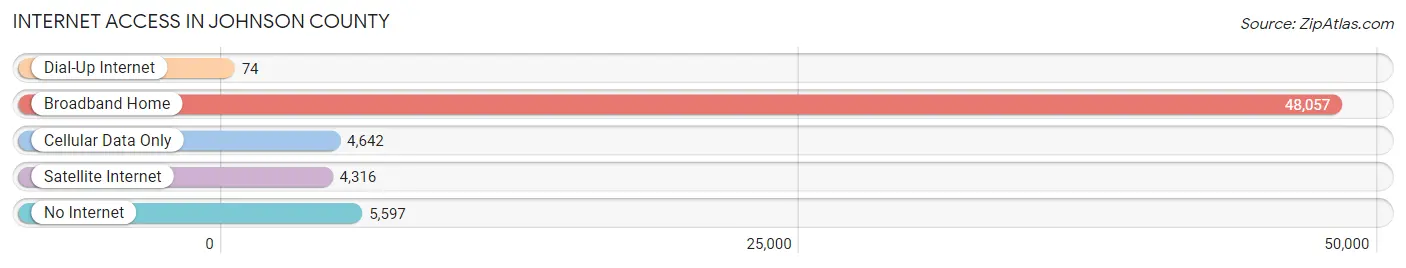
| Internet Type | # Households | % Households |
| Dial-Up Internet | 74 | 0.1% |
| Broadband Home | 48,057 | 79.7% |
| Cellular Data Only | 4,642 | 7.7% |
| Satellite Internet | 4,316 | 7.2% |
| No Internet | 5,597 | 9.3% |
| Total | 60,274 | 100.0% |
Johnson County Summary
Johnson County, Indiana is located in the central part of the state, just south of Indianapolis. It is bordered by Marion, Morgan, Shelby, Bartholomew, and Brown counties. The county seat is Franklin, and the largest city is Greenwood. The county was established in 1823 and named for John Johnson, a Revolutionary War veteran.
History
The area that is now Johnson County was originally inhabited by the Miami, Delaware, and Potawatomi Native American tribes. The first European settlers arrived in the area in the early 1800s. The county was officially established in 1823 and named for John Johnson, a Revolutionary War veteran.
In the early 19th century, the county was largely agricultural, with the main crops being corn, wheat, and oats. The first railroad line was built in 1852, connecting Franklin to Indianapolis. This allowed for the development of industry in the county, including the manufacture of furniture, wagons, and other goods.
In the late 19th century, the county experienced a population boom, with many people moving to the area from other parts of the state and country. This led to the development of several small towns, including Franklin, Greenwood, and Whiteland.
Geography
Johnson County is located in the central part of Indiana, just south of Indianapolis. It is bordered by Marion, Morgan, Shelby, Bartholomew, and Brown counties. The county covers an area of 437 square miles and has a population of 144,845 (as of 2020).
The terrain of the county is mostly flat, with some rolling hills in the northern and western parts. The White River runs through the county, and there are several small lakes and ponds. The county is home to several state parks, including Fort Harrison State Park and White River State Park.
Economy
Johnson County has a diverse economy, with a mix of manufacturing, retail, and service industries. The county is home to several large employers, including Community Health Network, Johnson Memorial Hospital, and the Johnson County School Corporation.
The county is also home to several major shopping centers, including Greenwood Park Mall and The Shops at Perry Crossing. The county is also home to several large companies, including Cummins, Inc., Eli Lilly and Company, and Rolls-Royce.
Demographics
As of the 2020 census, Johnson County had a population of 144,845. The racial makeup of the county was 87.3% White, 8.2% Black or African American, 0.7% Native American, 1.7% Asian, 0.2% Pacific Islander, 0.9% from other races, and 1.2% from two or more races. Hispanic or Latino of any race were 3.2% of the population.
The median household income in the county was $62,945, and the median family income was $76,945. The per capita income was $30,945. About 8.2% of the population was below the poverty line.
Johnson County is a diverse and vibrant community, with a mix of rural and urban areas. The county has a strong economy and is home to several large employers. It is also home to several state parks and recreational areas, making it a great place to live and work.
Common Questions
What is the Total Population of Johnson County?
Total Population of Johnson County is 161,952.
What is the Total Male Population of Johnson County?
Total Male Population of Johnson County is 80,197.
What is the Total Female Population of Johnson County?
Total Female Population of Johnson County is 81,755.
What is the Ratio of Males per 100 Females in Johnson County?
There are 98.09 Males per 100 Females in Johnson County.
What is the Ratio of Females per 100 Males in Johnson County?
There are 101.94 Females per 100 Males in Johnson County.
What is the Median Population Age in Johnson County?
Median Population Age in Johnson County is 37.9 Years.
What is the Average Family Size in Johnson County
Average Family Size in Johnson County is 3.1 People.
What is the Average Household Size in Johnson County
Average Household Size in Johnson County is 2.6 People.
What is Per Capita Income in Johnson County?
Per Capita income in Johnson County is $40,055.
What is the Median Family Income in Johnson County?
Median Family Income in Johnson County is $95,959.
What is the Median Household income in Johnson County?
Median Household Income in Johnson County is $82,730.
What is Income or Wage Gap in Johnson County?
Income or Wage Gap in Johnson County is 31.5%.
Women in Johnson County earn 68.5 cents for every dollar earned by a man.
What is Family Income Deficit in Johnson County?
Family Income Deficit in Johnson County is $10,770.
Families that are below poverty line in Johnson County earn $10,770 less on average than the poverty threshold level.
What is Inequality or Gini Index in Johnson County?
Inequality or Gini Index in Johnson County is 0.43.
How Large is the Labor Force in Johnson County?
There are 84,946 People in the Labor Forcein in Johnson County.
What is the Percentage of People in the Labor Force in Johnson County?
66.8% of People are in the Labor Force in Johnson County.
What is the Unemployment Rate in Johnson County?
Unemployment Rate in Johnson County is 3.4%.