Jennings County, IN
Jennings County Map
Jennings County Overview
27,610
TOTAL POPULATION
14,060
MALE POPULATION
13,550
FEMALE POPULATION
103.76
MALES / 100 FEMALES
96.37
FEMALES / 100 MALES
39.6
MEDIAN AGE
3.0
AVG FAMILY SIZE
2.6
AVG HOUSEHOLD SIZE
$30,254
PER CAPITA INCOME
$76,742
AVG FAMILY INCOME
$66,892
AVG HOUSEHOLD INCOME
32.1%
WAGE / INCOME GAP [ % ]
67.9¢/ $1
WAGE / INCOME GAP [ $ ]
$10,162
FAMILY INCOME DEFICIT
0.39
INEQUALITY / GINI INDEX
13,843
LABOR FORCE [ PEOPLE ]
62.8%
PERCENT IN LABOR FORCE
5.0%
UNEMPLOYMENT RATE
Jennings County Area Codes
Race in Jennings County
The most populous races in Jennings County are White / Caucasian (26,300 | 95.3%), Hispanic or Latino (808 | 2.9%), and Two or more Races (651 | 2.4%).

| Race | # Population | % Population |
| Asian | 65 | 0.2% |
| Black / African American | 218 | 0.8% |
| Hawaiian / Pacific | 0 | 0.0% |
| Hispanic or Latino | 808 | 2.9% |
| Native / Alaskan | 38 | 0.1% |
| White / Caucasian | 26,300 | 95.3% |
| Two or more Races | 651 | 2.4% |
| Some other Race | 338 | 1.2% |
| Total | 27,610 | 100.0% |
Ancestry in Jennings County
The most populous ancestries reported in Jennings County are German (5,665 | 20.5%), English (3,714 | 13.5%), American (3,571 | 12.9%), Irish (3,432 | 12.4%), and Mexican (749 | 2.7%), together accounting for 62.0% of all Jennings County residents.

| Ancestry | # Population | % Population |
| African | 11 | 0.0% |
| American | 3,571 | 12.9% |
| Apache | 8 | 0.0% |
| Arab | 53 | 0.2% |
| Bhutanese | 74 | 0.3% |
| Blackfeet | 27 | 0.1% |
| British | 85 | 0.3% |
| Burmese | 16 | 0.1% |
| Canadian | 14 | 0.1% |
| Cherokee | 184 | 0.7% |
| Danish | 3 | 0.0% |
| Dutch | 319 | 1.2% |
| Eastern European | 63 | 0.2% |
| English | 3,714 | 13.5% |
| European | 314 | 1.1% |
| French | 484 | 1.8% |
| French Canadian | 38 | 0.1% |
| German | 5,665 | 20.5% |
| Greek | 20 | 0.1% |
| Indian (Asian) | 47 | 0.2% |
| Iraqi | 47 | 0.2% |
| Irish | 3,432 | 12.4% |
| Iroquois | 2 | 0.0% |
| Italian | 471 | 1.7% |
| Korean | 2 | 0.0% |
| Lithuanian | 15 | 0.1% |
| Macedonian | 22 | 0.1% |
| Mexican | 749 | 2.7% |
| Northern European | 6 | 0.0% |
| Norwegian | 96 | 0.4% |
| Polish | 573 | 2.1% |
| Portuguese | 46 | 0.2% |
| Puerto Rican | 10 | 0.0% |
| Scandinavian | 19 | 0.1% |
| Scotch-Irish | 399 | 1.5% |
| Scottish | 397 | 1.4% |
| Serbian | 142 | 0.5% |
| Spaniard | 3 | 0.0% |
| Spanish | 35 | 0.1% |
| Subsaharan African | 16 | 0.1% |
| Swedish | 133 | 0.5% |
| Swiss | 22 | 0.1% |
| Welsh | 114 | 0.4% | View All 43 Rows |
Immigrants in Jennings County
The most numerous immigrant groups reported in Jennings County came from Central America (261 | 0.9%), Latin America (261 | 0.9%), Mexico (250 | 0.9%), Europe (37 | 0.1%), and Asia (27 | 0.1%), together accounting for 3.0% of all Jennings County residents.

| Immigration Origin | # Population | % Population |
| Asia | 27 | 0.1% |
| Central America | 261 | 0.9% |
| China | 27 | 0.1% |
| Denmark | 3 | 0.0% |
| Eastern Asia | 27 | 0.1% |
| Europe | 37 | 0.1% |
| Germany | 17 | 0.1% |
| Latin America | 261 | 0.9% |
| Mexico | 250 | 0.9% |
| Nicaragua | 11 | 0.0% |
| Northern Europe | 20 | 0.1% |
| Scotland | 17 | 0.1% |
| Western Europe | 17 | 0.1% | View All 13 Rows |
Sex and Age in Jennings County
Sex and Age in Jennings County
The most populous age groups in Jennings County are 10 to 14 Years (1,216 | 8.6%) for men and 60 to 64 Years (1,019 | 7.5%) for women.

| Age Bracket | Male | Female |
| Under 5 Years | 832 (5.9%) | 794 (5.9%) |
| 5 to 9 Years | 704 (5.0%) | 867 (6.4%) |
| 10 to 14 Years | 1,216 (8.6%) | 819 (6.0%) |
| 15 to 19 Years | 848 (6.0%) | 850 (6.3%) |
| 20 to 24 Years | 869 (6.2%) | 789 (5.8%) |
| 25 to 29 Years | 945 (6.7%) | 937 (6.9%) |
| 30 to 34 Years | 772 (5.5%) | 798 (5.9%) |
| 35 to 39 Years | 885 (6.3%) | 992 (7.3%) |
| 40 to 44 Years | 800 (5.7%) | 546 (4.0%) |
| 45 to 49 Years | 1,002 (7.1%) | 877 (6.5%) |
| 50 to 54 Years | 1,005 (7.1%) | 948 (7.0%) |
| 55 to 59 Years | 1,042 (7.4%) | 846 (6.2%) |
| 60 to 64 Years | 995 (7.1%) | 1,019 (7.5%) |
| 65 to 69 Years | 852 (6.1%) | 800 (5.9%) |
| 70 to 74 Years | 459 (3.3%) | 647 (4.8%) |
| 75 to 79 Years | 493 (3.5%) | 525 (3.9%) |
| 80 to 84 Years | 233 (1.7%) | 281 (2.1%) |
| 85 Years and over | 108 (0.8%) | 215 (1.6%) |
| Total | 14,060 (100.0%) | 13,550 (100.0%) |
Families and Households in Jennings County
Median Family Size in Jennings County
The median family size in Jennings County is 2.99 persons per family, with single female/mother families (1,306 | 17.8%) accounting for the largest median family size of 3.24 persons per family. On the other hand, single male/father families (868 | 11.8%) represent the smallest median family size with 2.47 persons per family.

| Family Type | # Families | Family Size |
| Married-Couple | 5,148 (70.3%) | 3.01 |
| Single Male/Father | 868 (11.8%) | 2.47 |
| Single Female/Mother | 1,306 (17.8%) | 3.24 |
| Total Families | 7,322 (100.0%) | 2.99 |
Median Household Size in Jennings County
The median household size in Jennings County is 2.60 persons per household, with single female/mother households (1,306 | 12.5%) accounting for the largest median household size of 3.69 persons per household. non-family households (3,139 | 30.0%) represent the smallest median household size with 1.24 persons per household.

| Household Type | # Households | Household Size |
| Married-Couple | 5,148 (49.2%) | 3.09 |
| Single Male/Father | 868 (8.3%) | 3.03 |
| Single Female/Mother | 1,306 (12.5%) | 3.69 |
| Non-family | 3,139 (30.0%) | 1.24 |
| Total Households | 10,461 (100.0%) | 2.60 |
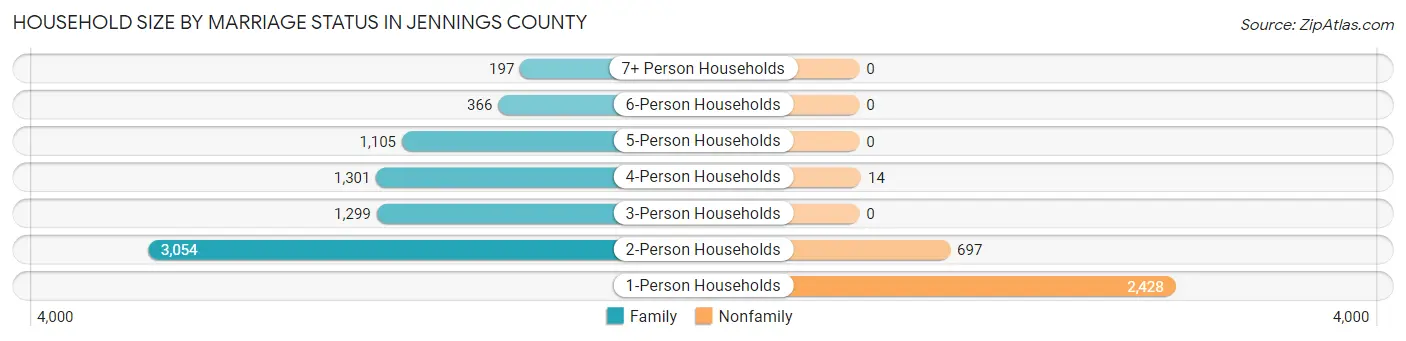
Household Size by Marriage Status in Jennings County
Out of a total of 10,461 households in Jennings County, 7,322 (70.0%) are family households, while 3,139 (30.0%) are nonfamily households. The most numerous type of family households are 2-person households, comprising 3,054, and the most common type of nonfamily households are 1-person households, comprising 2,428.
| Household Size | Family Households | Nonfamily Households |
| 1-Person Households | - | 2,428 (23.2%) |
| 2-Person Households | 3,054 (29.2%) | 697 (6.7%) |
| 3-Person Households | 1,299 (12.4%) | 0 (0.0%) |
| 4-Person Households | 1,301 (12.4%) | 14 (0.1%) |
| 5-Person Households | 1,105 (10.6%) | 0 (0.0%) |
| 6-Person Households | 366 (3.5%) | 0 (0.0%) |
| 7+ Person Households | 197 (1.9%) | 0 (0.0%) |
| Total | 7,322 (70.0%) | 3,139 (30.0%) |
Female Fertility in Jennings County
Fertility by Age in Jennings County
Average fertility rate in Jennings County is 52.0 births per 1,000 women. Women in the age bracket of 20 to 34 years have the highest fertility rate with 85.0 births per 1,000 women. Women in the age bracket of 20 to 34 years acount for 69.5% of all women with births.

| Age Bracket | Women with Births | Births / 1,000 Women |
| 15 to 19 years | 0 (0.0%) | 0.0 |
| 20 to 34 years | 214 (69.5%) | 85.0 |
| 35 to 50 years | 94 (30.5%) | 36.0 |
| Total | 308 (100.0%) | 52.0 |
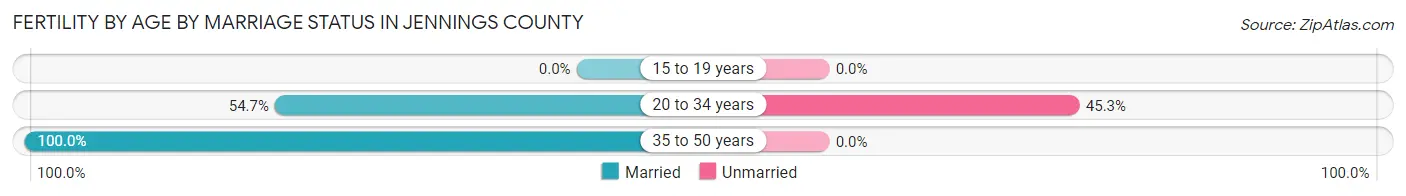
Fertility by Age by Marriage Status in Jennings County
68.5% of women with births (308) in Jennings County are married. The highest percentage of unmarried women with births falls into 20 to 34 years age bracket with 45.3% of them unmarried at the time of birth, while the lowest percentage of unmarried women with births belong to 35 to 50 years age bracket with 0.0% of them unmarried.
| Age Bracket | Married | Unmarried |
| 15 to 19 years | 0 (0.0%) | 0 (0.0%) |
| 20 to 34 years | 117 (54.7%) | 97 (45.3%) |
| 35 to 50 years | 94 (100.0%) | 0 (0.0%) |
| Total | 211 (68.5%) | 97 (31.5%) |
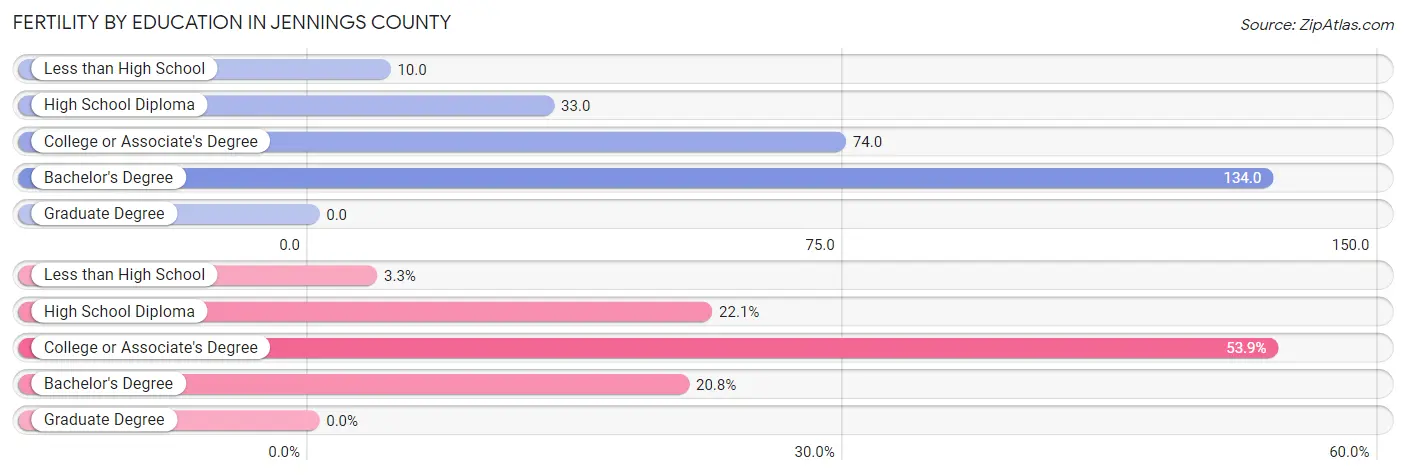
Fertility by Education in Jennings County
| Educational Attainment | Women with Births | Births / 1,000 Women |
| Less than High School | 10 (3.3%) | 10.0 |
| High School Diploma | 68 (22.1%) | 33.0 |
| College or Associate's Degree | 166 (53.9%) | 74.0 |
| Bachelor's Degree | 64 (20.8%) | 134.0 |
| Graduate Degree | 0 (0.0%) | 0.0 |
| Total | 308 (100.0%) | 52.0 |
Fertility by Education by Marriage Status in Jennings County
31.5% of women with births in Jennings County are unmarried. Women with the educational attainment of less than high school are most likely to be married with 100.0% of them married at childbirth, while women with the educational attainment of high school diploma are least likely to be married with 66.2% of them unmarried at childbirth.

| Educational Attainment | Married | Unmarried |
| Less than High School | 10 (100.0%) | 0 (0.0%) |
| High School Diploma | 23 (33.8%) | 45 (66.2%) |
| College or Associate's Degree | 148 (89.2%) | 18 (10.8%) |
| Bachelor's Degree | 30 (46.9%) | 34 (53.1%) |
| Graduate Degree | 0 (0.0%) | 0 (0.0%) |
| Total | 211 (68.5%) | 97 (31.5%) |
Income in Jennings County
Income Overview in Jennings County
Per Capita Income in Jennings County is $30,254, while median incomes of families and households are $76,742 and $66,892 respectively.
| Characteristic | Number | Measure |
| Per Capita Income | 27,610 | $30,254 |
| Median Family Income | 7,322 | $76,742 |
| Mean Family Income | 7,322 | $88,321 |
| Median Household Income | 10,461 | $66,892 |
| Mean Household Income | 10,461 | $77,901 |
| Income Deficit | 7,322 | $10,162 |
| Wage / Income Gap (%) | 27,610 | 32.09% |
| Wage / Income Gap ($) | 27,610 | 67.91¢ per $1 |
| Gini / Inequality Index | 27,610 | 0.39 |
Earnings by Sex in Jennings County
Average Earnings in Jennings County are $39,169, $45,513 for men and $30,907 for women, a difference of 32.1%.
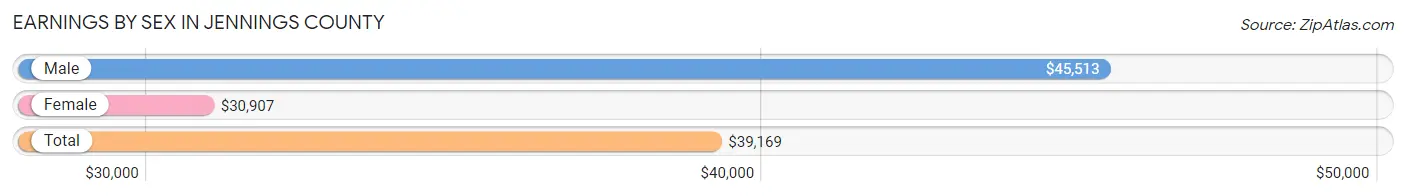
| Sex | Number | Average Earnings |
| Male | 7,931 (54.4%) | $45,513 |
| Female | 6,649 (45.6%) | $30,907 |
| Total | 14,580 (100.0%) | $39,169 |
Earnings by Sex by Income Bracket in Jennings County
The most common earnings brackets in Jennings County are $75,000 to $99,999 for men (1,073 | 13.5%) and $35,000 to $39,999 for women (538 | 8.1%).

| Income | Male | Female |
| $2,499 or less | 400 (5.0%) | 384 (5.8%) |
| $2,500 to $4,999 | 120 (1.5%) | 355 (5.3%) |
| $5,000 to $7,499 | 182 (2.3%) | 222 (3.3%) |
| $7,500 to $9,999 | 156 (2.0%) | 251 (3.8%) |
| $10,000 to $12,499 | 298 (3.8%) | 380 (5.7%) |
| $12,500 to $14,999 | 46 (0.6%) | 223 (3.4%) |
| $15,000 to $17,499 | 181 (2.3%) | 404 (6.1%) |
| $17,500 to $19,999 | 77 (1.0%) | 349 (5.2%) |
| $20,000 to $22,499 | 166 (2.1%) | 180 (2.7%) |
| $22,500 to $24,999 | 138 (1.7%) | 157 (2.4%) |
| $25,000 to $29,999 | 526 (6.6%) | 303 (4.6%) |
| $30,000 to $34,999 | 358 (4.5%) | 482 (7.2%) |
| $35,000 to $39,999 | 625 (7.9%) | 538 (8.1%) |
| $40,000 to $44,999 | 617 (7.8%) | 397 (6.0%) |
| $45,000 to $49,999 | 492 (6.2%) | 509 (7.7%) |
| $50,000 to $54,999 | 371 (4.7%) | 166 (2.5%) |
| $55,000 to $64,999 | 900 (11.4%) | 468 (7.0%) |
| $65,000 to $74,999 | 548 (6.9%) | 397 (6.0%) |
| $75,000 to $99,999 | 1,073 (13.5%) | 316 (4.8%) |
| $100,000+ | 657 (8.3%) | 168 (2.5%) |
| Total | 7,931 (100.0%) | 6,649 (100.0%) |
Earnings by Sex by Educational Attainment in Jennings County
Average earnings in Jennings County are $47,415 for men and $35,266 for women, a difference of 25.6%. Men with an educational attainment of graduate degree enjoy the highest average annual earnings of $88,929, while those with less than high school education earn the least with $38,195. Women with an educational attainment of graduate degree earn the most with the average annual earnings of $68,140, while those with less than high school education have the smallest earnings of $18,875.
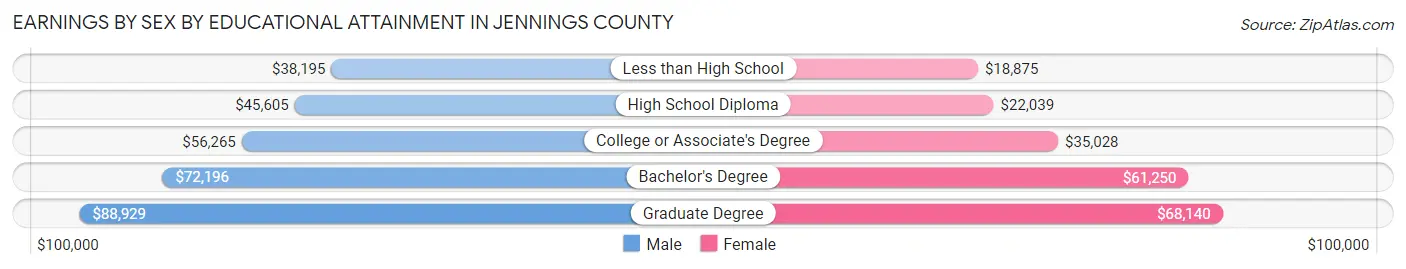
| Educational Attainment | Male Income | Female Income |
| Less than High School | $38,195 | $18,875 |
| High School Diploma | $45,605 | $22,039 |
| College or Associate's Degree | $56,265 | $35,028 |
| Bachelor's Degree | $72,196 | $61,250 |
| Graduate Degree | $88,929 | $68,140 |
| Total | $47,415 | $35,266 |
Family Income in Jennings County
Family Income Brackets in Jennings County
According to the Jennings County family income data, there are 1,677 families falling into the $100,000 to $149,999 income range, which is the most common income bracket and makes up 22.9% of all families. Conversely, the $10,000 to $14,999 income bracket is the least frequent group with only 95 families (1.3%) belonging to this category.

| Income Bracket | # Families | % Families |
| Less than $10,000 | 190 | 2.6% |
| $10,000 to $14,999 | 95 | 1.3% |
| $15,000 to $24,999 | 381 | 5.2% |
| $25,000 to $34,999 | 564 | 7.7% |
| $35,000 to $49,999 | 1,010 | 13.8% |
| $50,000 to $74,999 | 1,355 | 18.5% |
| $75,000 to $99,999 | 1,259 | 17.2% |
| $100,000 to $149,999 | 1,677 | 22.9% |
| $150,000 to $199,999 | 556 | 7.6% |
| $200,000+ | 242 | 3.3% |
Family Income by Famaliy Size in Jennings County
7+ person families (173 | 2.4%) account for the highest median family income in Jennings County with $129,141 per family, while 3-person families (1,281 | 17.5%) have the highest median income of $30,985 per family member.
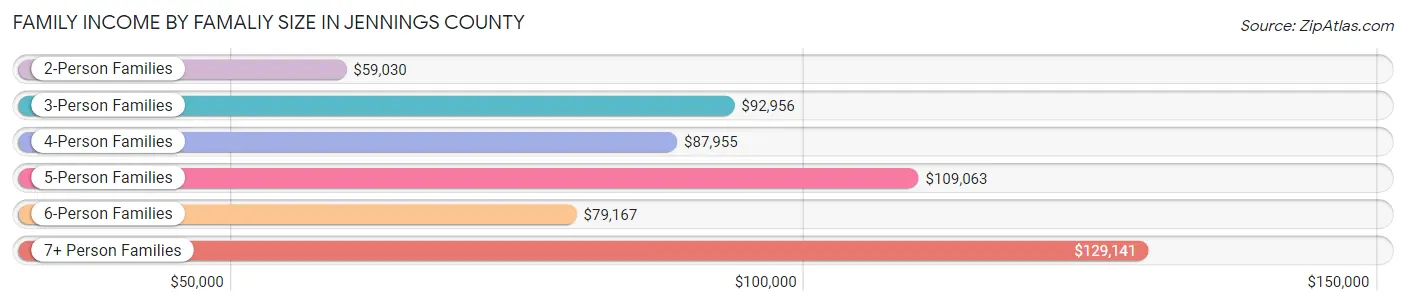
| Income Bracket | # Families | Median Income |
| 2-Person Families | 3,523 (48.1%) | $59,030 |
| 3-Person Families | 1,281 (17.5%) | $92,956 |
| 4-Person Families | 1,242 (17.0%) | $87,955 |
| 5-Person Families | 879 (12.0%) | $109,063 |
| 6-Person Families | 224 (3.1%) | $79,167 |
| 7+ Person Families | 173 (2.4%) | $129,141 |
| Total | 7,322 (100.0%) | $76,742 |
Family Income by Number of Earners in Jennings County
The median family income in Jennings County is $76,742, with families comprising 3+ earners (862) having the highest median family income of $124,148, while families with no earners (898) have the lowest median family income of $40,677, accounting for 11.8% and 12.3% of families, respectively.

| Number of Earners | # Families | Median Income |
| No Earners | 898 (12.3%) | $40,677 |
| 1 Earner | 2,716 (37.1%) | $56,488 |
| 2 Earners | 2,846 (38.9%) | $104,799 |
| 3+ Earners | 862 (11.8%) | $124,148 |
| Total | 7,322 (100.0%) | $76,742 |
Household Income in Jennings County
Household Income Brackets in Jennings County
With 2,155 households falling in the category, the $50,000 to $74,999 income range is the most frequent in Jennings County, accounting for 20.6% of all households. In contrast, only 241 households (2.3%) fall into the $200,000+ income bracket, making it the least populous group.

| Income Bracket | # Households | % Households |
| Less than $10,000 | 418 | 4.0% |
| $10,000 to $14,999 | 450 | 4.3% |
| $15,000 to $24,999 | 889 | 8.5% |
| $25,000 to $34,999 | 785 | 7.5% |
| $35,000 to $49,999 | 1,287 | 12.3% |
| $50,000 to $74,999 | 2,155 | 20.6% |
| $75,000 to $99,999 | 1,726 | 16.5% |
| $100,000 to $149,999 | 1,883 | 18.0% |
| $150,000 to $199,999 | 638 | 6.1% |
| $200,000+ | 241 | 2.3% |
Household Income by Householder Age in Jennings County
The median household income in Jennings County is $66,892, with the highest median household income of $72,222 found in the 25 to 44 years age bracket for the primary householder. A total of 3,114 households (29.8%) fall into this category. Meanwhile, the 65+ years age bracket for the primary householder has the lowest median household income of $54,727, with 2,845 households (27.2%) in this group.
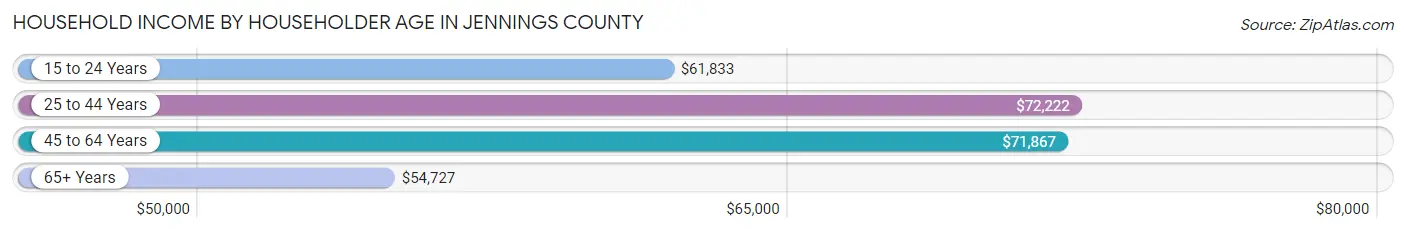
| Income Bracket | # Households | Median Income |
| 15 to 24 Years | 448 (4.3%) | $61,833 |
| 25 to 44 Years | 3,114 (29.8%) | $72,222 |
| 45 to 64 Years | 4,054 (38.8%) | $71,867 |
| 65+ Years | 2,845 (27.2%) | $54,727 |
| Total | 10,461 (100.0%) | $66,892 |
Poverty in Jennings County
Income Below Poverty by Sex and Age in Jennings County
With 13.0% poverty level for males and 14.8% for females among the residents of Jennings County, 15 year old males and 6 to 11 year old females are the most vulnerable to poverty, with 44 males (34.9%) and 230 females (27.7%) in their respective age groups living below the poverty level.

| Age Bracket | Male | Female |
| Under 5 Years | 71 (10.0%) | 155 (19.5%) |
| 5 Years | 0 (0.0%) | 49 (26.3%) |
| 6 to 11 Years | 211 (21.5%) | 230 (27.7%) |
| 12 to 14 Years | 175 (26.5%) | 53 (10.8%) |
| 15 Years | 44 (34.9%) | 18 (8.6%) |
| 16 and 17 Years | 50 (11.6%) | 77 (21.0%) |
| 18 to 24 Years | 97 (8.5%) | 201 (18.9%) |
| 25 to 34 Years | 197 (11.8%) | 350 (20.3%) |
| 35 to 44 Years | 215 (13.0%) | 229 (14.9%) |
| 45 to 54 Years | 301 (15.1%) | 183 (10.1%) |
| 55 to 64 Years | 184 (9.1%) | 281 (15.1%) |
| 65 to 74 Years | 144 (11.1%) | 130 (9.1%) |
| 75 Years and over | 88 (11.0%) | 12 (1.3%) |
| Total | 1,777 (13.0%) | 1,968 (14.8%) |
Income Above Poverty by Sex and Age in Jennings County
According to the poverty statistics in Jennings County, males aged 5 years and females aged 75 years and over are the age groups that are most secure financially, with 100.0% of males and 98.8% of females in these age groups living above the poverty line.
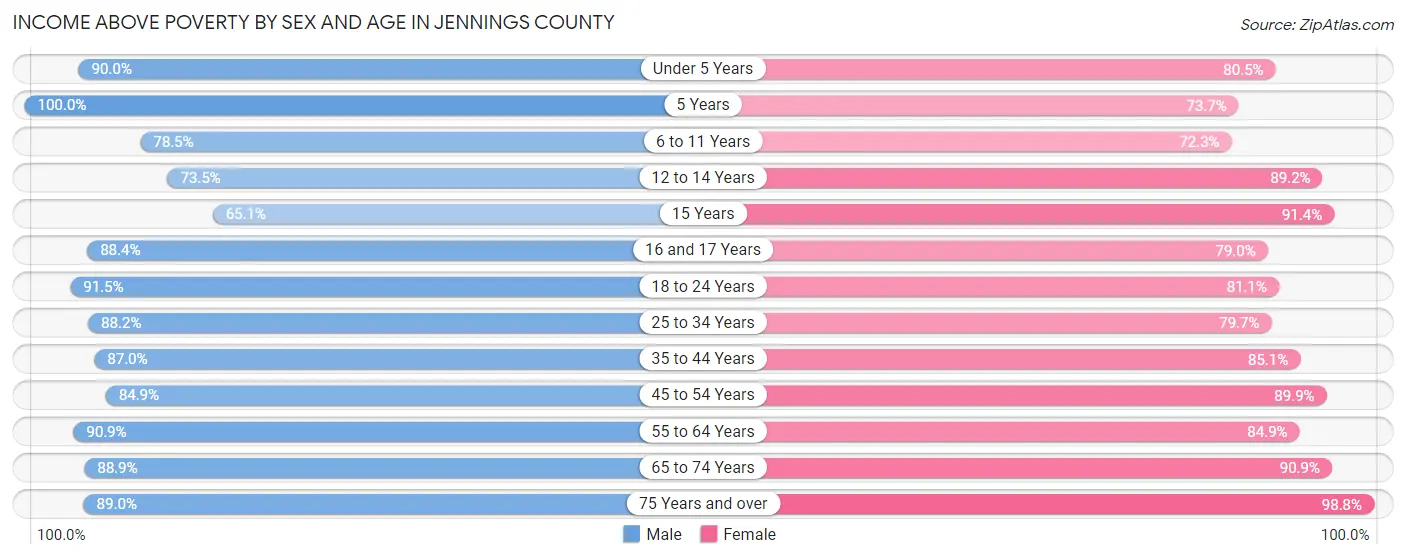
| Age Bracket | Male | Female |
| Under 5 Years | 638 (90.0%) | 639 (80.5%) |
| 5 Years | 118 (100.0%) | 137 (73.7%) |
| 6 to 11 Years | 771 (78.5%) | 601 (72.3%) |
| 12 to 14 Years | 485 (73.5%) | 438 (89.2%) |
| 15 Years | 82 (65.1%) | 190 (91.3%) |
| 16 and 17 Years | 380 (88.4%) | 290 (79.0%) |
| 18 to 24 Years | 1,047 (91.5%) | 863 (81.1%) |
| 25 to 34 Years | 1,476 (88.2%) | 1,375 (79.7%) |
| 35 to 44 Years | 1,444 (87.0%) | 1,304 (85.1%) |
| 45 to 54 Years | 1,695 (84.9%) | 1,636 (89.9%) |
| 55 to 64 Years | 1,847 (90.9%) | 1,584 (84.9%) |
| 65 to 74 Years | 1,155 (88.9%) | 1,305 (90.9%) |
| 75 Years and over | 714 (89.0%) | 948 (98.8%) |
| Total | 11,852 (87.0%) | 11,310 (85.2%) |
Income Below Poverty Among Married-Couple Families in Jennings County
The poverty statistics for married-couple families in Jennings County show that 8.0% or 411 of the total 5,148 families live below the poverty line. Families with 3 or 4 children have the highest poverty rate of 29.1%, comprising of 200 families. On the other hand, families with 5 or more children have the lowest poverty rate of 0.0%, which includes 0 families.
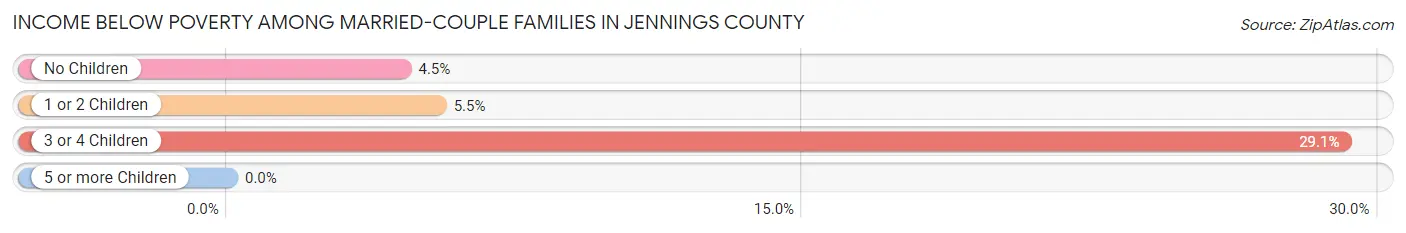
| Children | Above Poverty | Below Poverty |
| No Children | 2,995 (95.5%) | 142 (4.5%) |
| 1 or 2 Children | 1,198 (94.6%) | 69 (5.4%) |
| 3 or 4 Children | 488 (70.9%) | 200 (29.1%) |
| 5 or more Children | 56 (100.0%) | 0 (0.0%) |
| Total | 4,737 (92.0%) | 411 (8.0%) |
Income Below Poverty Among Single-Parent Households in Jennings County
According to the poverty data in Jennings County, 7.4% or 64 single-father households and 20.4% or 266 single-mother households are living below the poverty line. Among single-father households, those with 1 or 2 children have the highest poverty rate, with 64 households (13.9%) experiencing poverty. Likewise, among single-mother households, those with 3 or 4 children have the highest poverty rate, with 99 households (68.8%) falling below the poverty line.

| Children | Single Father | Single Mother |
| No Children | 0 (0.0%) | 17 (4.0%) |
| 1 or 2 Children | 64 (13.9%) | 150 (21.9%) |
| 3 or 4 Children | 0 (0.0%) | 99 (68.8%) |
| 5 or more Children | 0 (0.0%) | 0 (0.0%) |
| Total | 64 (7.4%) | 266 (20.4%) |
Income Below Poverty Among Married-Couple vs Single-Parent Households in Jennings County
The poverty data for Jennings County shows that 411 of the married-couple family households (8.0%) and 330 of the single-parent households (15.2%) are living below the poverty level. Within the married-couple family households, those with 3 or 4 children have the highest poverty rate, with 200 households (29.1%) falling below the poverty line. Among the single-parent households, those with 3 or 4 children have the highest poverty rate, with 99 household (28.6%) living below poverty.

| Children | Married-Couple Families | Single-Parent Households |
| No Children | 142 (4.5%) | 17 (2.7%) |
| 1 or 2 Children | 69 (5.4%) | 214 (18.7%) |
| 3 or 4 Children | 200 (29.1%) | 99 (28.6%) |
| 5 or more Children | 0 (0.0%) | 0 (0.0%) |
| Total | 411 (8.0%) | 330 (15.2%) |
Employment Characteristics in Jennings County
Employment by Class of Employer in Jennings County
Among the 12,758 employed individuals in Jennings County, private company employees (9,108 | 71.4%), not-for-profit organizations (1,095 | 8.6%), and local government employees (1,093 | 8.6%) make up the most common classes of employment.

| Employer Class | # Employees | % Employees |
| Private Company Employees | 9,108 | 71.4% |
| Self-Employed (Incorporated) | 470 | 3.7% |
| Self-Employed (Not Incorporated) | 599 | 4.7% |
| Not-for-profit Organizations | 1,095 | 8.6% |
| Local Government Employees | 1,093 | 8.6% |
| State Government Employees | 244 | 1.9% |
| Federal Government Employees | 107 | 0.8% |
| Unpaid Family Workers | 42 | 0.3% |
| Total | 12,758 | 100.0% |
Employment Status by Age in Jennings County
According to the labor force statistics for Jennings County, out of the total population over 16 years of age (22,043), 62.8% or 13,843 individuals are in the labor force, with 5.0% or 692 of them unemployed. The age group with the highest labor force participation rate is 35 to 44 years, with 87.6% or 2,823 individuals in the labor force. Within the labor force, the 20 to 24 years age range has the highest percentage of unemployed individuals, with 18.1% or 249 of them being unemployed.

| Age Bracket | In Labor Force | Unemployed |
| 16 to 19 Years | 586 (43.0%) | 101 (17.2%) |
| 20 to 24 Years | 1,376 (83.0%) | 249 (18.1%) |
| 25 to 29 Years | 1,406 (74.7%) | 169 (12.0%) |
| 30 to 34 Years | 1,334 (85.0%) | 24 (1.8%) |
| 35 to 44 Years | 2,823 (87.6%) | 59 (2.1%) |
| 45 to 54 Years | 2,885 (75.3%) | 46 (1.6%) |
| 55 to 59 Years | 1,267 (67.1%) | 32 (2.5%) |
| 60 to 64 Years | 1,168 (58.0%) | 0 (0.0%) |
| 65 to 74 Years | 819 (29.7%) | 14 (1.7%) |
| 75 Years and over | 173 (9.3%) | 5 (2.9%) |
| Total | 13,843 (62.8%) | 692 (5.0%) |
Employment Status by Educational Attainment in Jennings County
According to labor force statistics for Jennings County, 75.5% of individuals (10,879) out of the total population between 25 and 64 years of age (14,409) are in the labor force, with 3.0% or 326 of them being unemployed. The group with the highest labor force participation rate are those with the educational attainment of bachelor's degree or higher, with 91.8% or 1,840 individuals in the labor force. Within the labor force, individuals with less than high school education have the highest percentage of unemployment, with 7.9% or 66 of them being unemployed.

| Educational Attainment | In Labor Force | Unemployed |
| Less than High School | 830 (59.4%) | 110 (7.9%) |
| High School Diploma | 4,353 (70.5%) | 148 (2.4%) |
| College / Associate Degree | 3,861 (79.9%) | 130 (2.7%) |
| Bachelor's Degree or higher | 1,840 (91.8%) | 60 (3.0%) |
| Total | 10,879 (75.5%) | 432 (3.0%) |
Employment Occupations by Sex in Jennings County
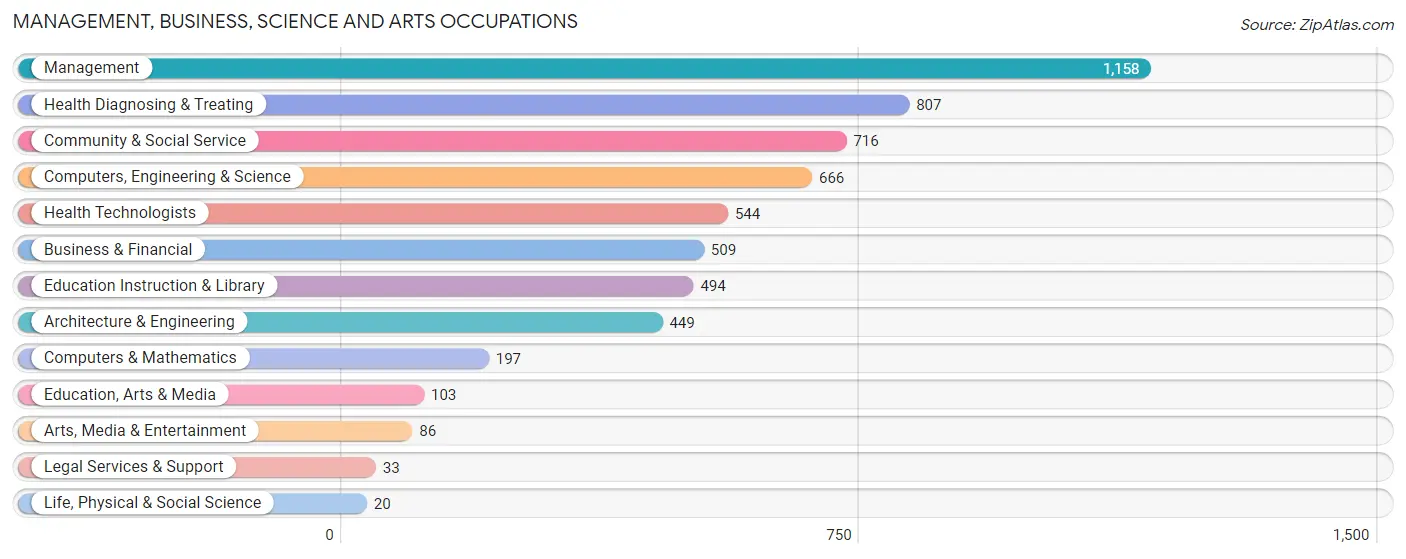
Management, Business, Science and Arts Occupations
The most common Management, Business, Science and Arts occupations in Jennings County are Management (1,158 | 8.8%), Health Diagnosing & Treating (807 | 6.2%), Community & Social Service (716 | 5.5%), Computers, Engineering & Science (666 | 5.1%), and Health Technologists (544 | 4.2%).
Management, Business, Science and Arts Occupations by Sex
Within the Management, Business, Science and Arts occupations in Jennings County, the most male-oriented occupations are Life, Physical & Social Science (100.0%), Architecture & Engineering (95.8%), and Computers, Engineering & Science (89.8%), while the most female-oriented occupations are Legal Services & Support (100.0%), Health Technologists (94.5%), and Health Diagnosing & Treating (91.8%).
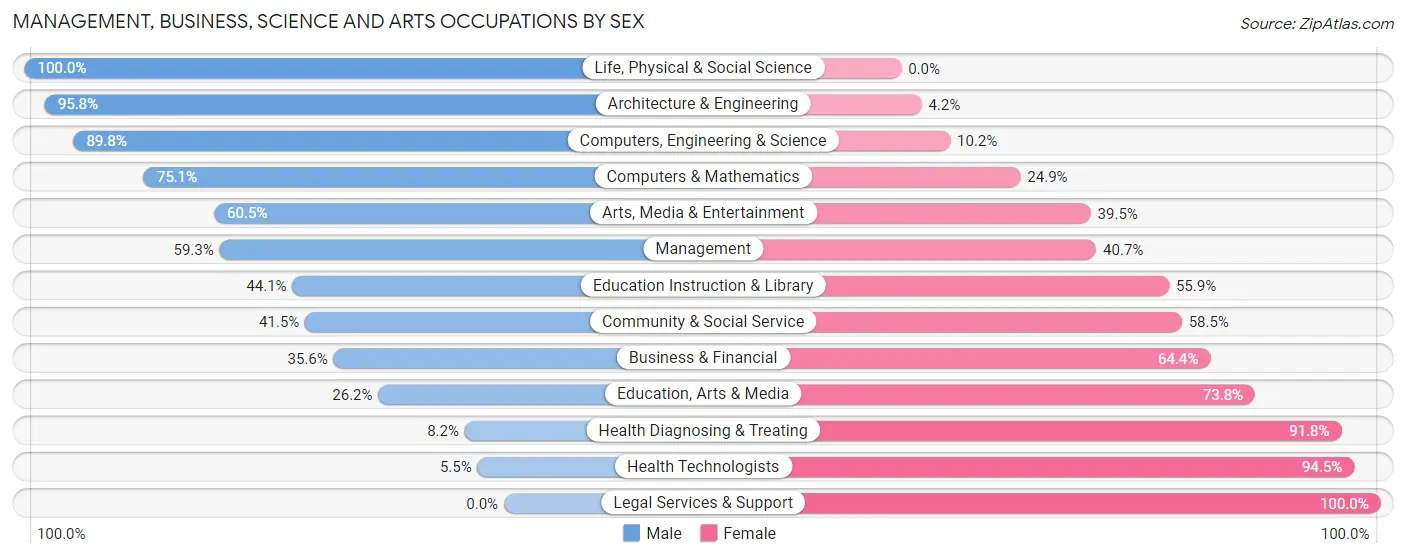
| Occupation | Male | Female |
| Management | 687 (59.3%) | 471 (40.7%) |
| Business & Financial | 181 (35.6%) | 328 (64.4%) |
| Computers, Engineering & Science | 598 (89.8%) | 68 (10.2%) |
| Computers & Mathematics | 148 (75.1%) | 49 (24.9%) |
| Architecture & Engineering | 430 (95.8%) | 19 (4.2%) |
| Life, Physical & Social Science | 20 (100.0%) | 0 (0.0%) |
| Community & Social Service | 297 (41.5%) | 419 (58.5%) |
| Education, Arts & Media | 27 (26.2%) | 76 (73.8%) |
| Legal Services & Support | 0 (0.0%) | 33 (100.0%) |
| Education Instruction & Library | 218 (44.1%) | 276 (55.9%) |
| Arts, Media & Entertainment | 52 (60.5%) | 34 (39.5%) |
| Health Diagnosing & Treating | 66 (8.2%) | 741 (91.8%) |
| Health Technologists | 30 (5.5%) | 514 (94.5%) |
| Total (Category) | 1,829 (47.4%) | 2,027 (52.6%) |
| Total (Overall) | 7,077 (54.0%) | 6,033 (46.0%) |
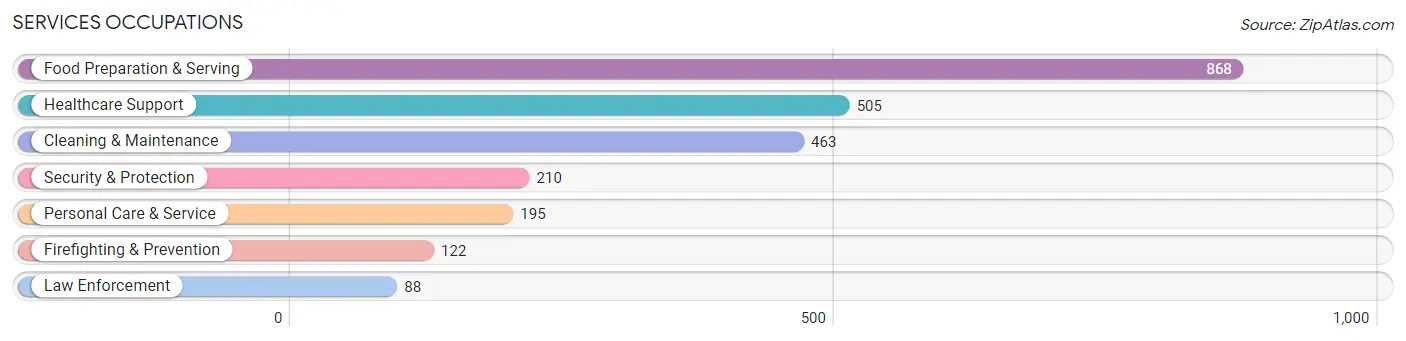
Services Occupations
The most common Services occupations in Jennings County are Food Preparation & Serving (868 | 6.6%), Healthcare Support (505 | 3.8%), Cleaning & Maintenance (463 | 3.5%), Security & Protection (210 | 1.6%), and Personal Care & Service (195 | 1.5%).
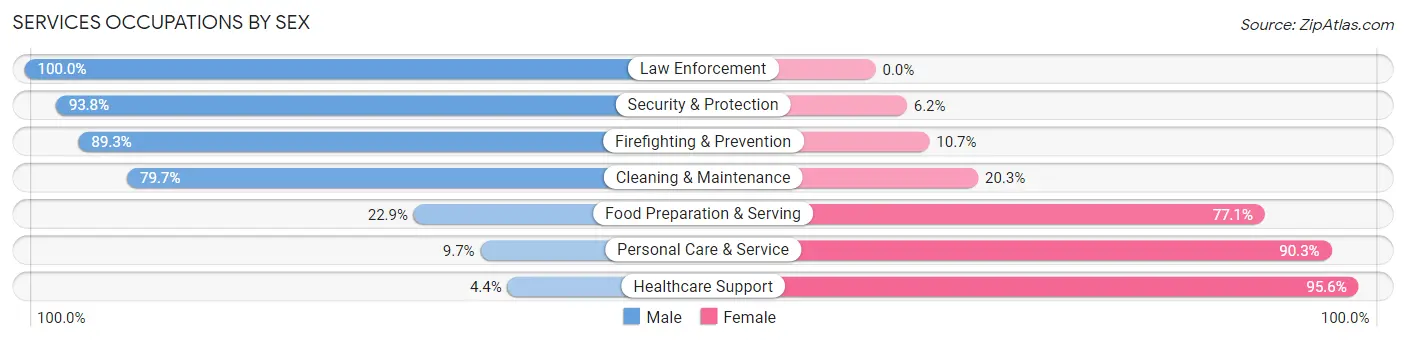
Services Occupations by Sex
Within the Services occupations in Jennings County, the most male-oriented occupations are Law Enforcement (100.0%), Security & Protection (93.8%), and Firefighting & Prevention (89.3%), while the most female-oriented occupations are Healthcare Support (95.6%), Personal Care & Service (90.3%), and Food Preparation & Serving (77.1%).
| Occupation | Male | Female |
| Healthcare Support | 22 (4.4%) | 483 (95.6%) |
| Security & Protection | 197 (93.8%) | 13 (6.2%) |
| Firefighting & Prevention | 109 (89.3%) | 13 (10.7%) |
| Law Enforcement | 88 (100.0%) | 0 (0.0%) |
| Food Preparation & Serving | 199 (22.9%) | 669 (77.1%) |
| Cleaning & Maintenance | 369 (79.7%) | 94 (20.3%) |
| Personal Care & Service | 19 (9.7%) | 176 (90.3%) |
| Total (Category) | 806 (36.0%) | 1,435 (64.0%) |
| Total (Overall) | 7,077 (54.0%) | 6,033 (46.0%) |
Sales and Office Occupations
The most common Sales and Office occupations in Jennings County are Office & Administration (1,327 | 10.1%), and Sales & Related (806 | 6.1%).

Sales and Office Occupations by Sex

| Occupation | Male | Female |
| Sales & Related | 328 (40.7%) | 478 (59.3%) |
| Office & Administration | 260 (19.6%) | 1,067 (80.4%) |
| Total (Category) | 588 (27.6%) | 1,545 (72.4%) |
| Total (Overall) | 7,077 (54.0%) | 6,033 (46.0%) |
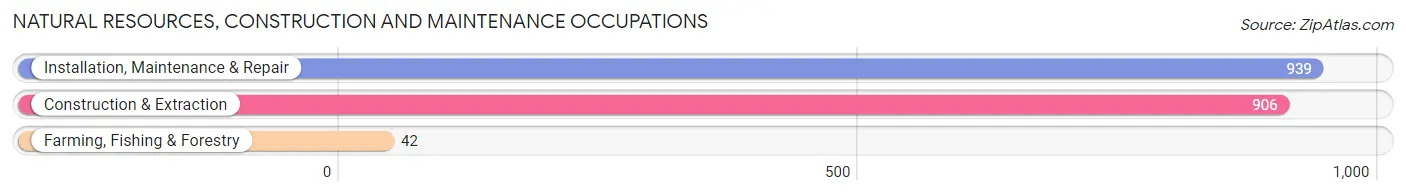
Natural Resources, Construction and Maintenance Occupations
The most common Natural Resources, Construction and Maintenance occupations in Jennings County are Installation, Maintenance & Repair (939 | 7.2%), Construction & Extraction (906 | 6.9%), and Farming, Fishing & Forestry (42 | 0.3%).
Natural Resources, Construction and Maintenance Occupations by Sex

| Occupation | Male | Female |
| Farming, Fishing & Forestry | 42 (100.0%) | 0 (0.0%) |
| Construction & Extraction | 860 (94.9%) | 46 (5.1%) |
| Installation, Maintenance & Repair | 939 (100.0%) | 0 (0.0%) |
| Total (Category) | 1,841 (97.6%) | 46 (2.4%) |
| Total (Overall) | 7,077 (54.0%) | 6,033 (46.0%) |
Production, Transportation and Moving Occupations
The most common Production, Transportation and Moving occupations in Jennings County are Production (1,709 | 13.0%), Material Moving (743 | 5.7%), and Transportation (541 | 4.1%).

Production, Transportation and Moving Occupations by Sex
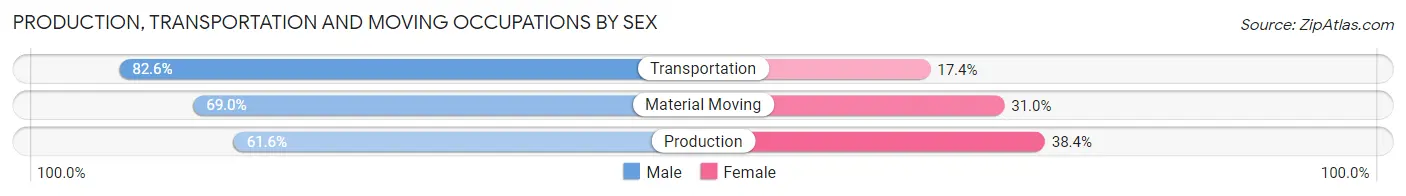
| Occupation | Male | Female |
| Production | 1,053 (61.6%) | 656 (38.4%) |
| Transportation | 447 (82.6%) | 94 (17.4%) |
| Material Moving | 513 (69.0%) | 230 (31.0%) |
| Total (Category) | 2,013 (67.3%) | 980 (32.7%) |
| Total (Overall) | 7,077 (54.0%) | 6,033 (46.0%) |
Employment Industries by Sex in Jennings County
Employment Industries in Jennings County
The major employment industries in Jennings County include Manufacturing (3,494 | 26.7%), Health Care & Social Assistance (1,894 | 14.4%), Retail Trade (1,694 | 12.9%), Construction (1,108 | 8.5%), and Accommodation & Food Services (805 | 6.1%).

Employment Industries by Sex in Jennings County
The Jennings County industries that see more men than women are Mining, Quarrying, & Extraction (100.0%), Information (94.3%), and Construction (93.1%), whereas the industries that tend to have a higher number of women are Enterprise Management (100.0%), Health Care & Social Assistance (90.2%), and Finance & Insurance (85.3%).

| Industry | Male | Female |
| Agriculture, Fishing & Hunting | 142 (80.2%) | 35 (19.8%) |
| Mining, Quarrying, & Extraction | 36 (100.0%) | 0 (0.0%) |
| Construction | 1,032 (93.1%) | 76 (6.9%) |
| Manufacturing | 2,429 (69.5%) | 1,065 (30.5%) |
| Wholesale Trade | 35 (28.2%) | 89 (71.8%) |
| Retail Trade | 773 (45.6%) | 921 (54.4%) |
| Transportation & Warehousing | 593 (91.8%) | 53 (8.2%) |
| Utilities | 49 (74.2%) | 17 (25.8%) |
| Information | 82 (94.3%) | 5 (5.8%) |
| Finance & Insurance | 40 (14.7%) | 232 (85.3%) |
| Real Estate, Rental & Leasing | 24 (45.3%) | 29 (54.7%) |
| Professional & Scientific | 128 (48.8%) | 134 (51.1%) |
| Enterprise Management | 0 (0.0%) | 4 (100.0%) |
| Administrative & Support | 469 (71.2%) | 190 (28.8%) |
| Educational Services | 264 (33.9%) | 515 (66.1%) |
| Health Care & Social Assistance | 185 (9.8%) | 1,709 (90.2%) |
| Arts, Entertainment & Recreation | 76 (58.0%) | 55 (42.0%) |
| Accommodation & Food Services | 259 (32.2%) | 546 (67.8%) |
| Public Administration | 220 (49.4%) | 225 (50.6%) |
| Total | 7,077 (54.0%) | 6,033 (46.0%) |
Education in Jennings County
School Enrollment in Jennings County
The most common levels of schooling among the 5,743 students in Jennings County are middle school (1,561 | 27.2%), high school (1,509 | 26.3%), and elementary school (1,258 | 21.9%).
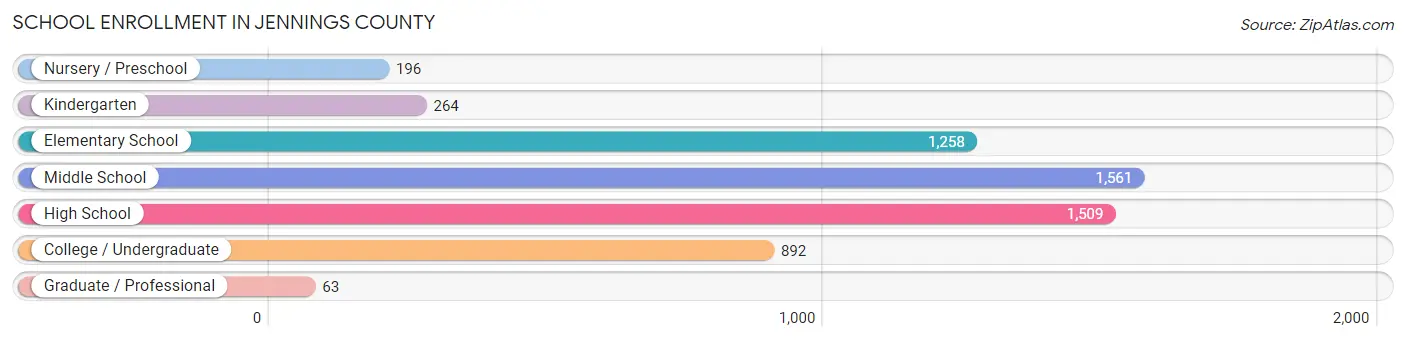
| School Level | # Students | % Students |
| Nursery / Preschool | 196 | 3.4% |
| Kindergarten | 264 | 4.6% |
| Elementary School | 1,258 | 21.9% |
| Middle School | 1,561 | 27.2% |
| High School | 1,509 | 26.3% |
| College / Undergraduate | 892 | 15.5% |
| Graduate / Professional | 63 | 1.1% |
| Total | 5,743 | 100.0% |
School Enrollment by Age by Funding Source in Jennings County
Out of a total of 5,743 students who are enrolled in schools in Jennings County, 632 (11.0%) attend a private institution, while the remaining 5,111 (89.0%) are enrolled in public schools. The age group of 15 to 17 year olds has the highest likelihood of being enrolled in private schools, with 215 (19.3% in the age bracket) enrolled. Conversely, the age group of 10 to 14 year olds has the lowest likelihood of being enrolled in a private school, with 1,855 (93.0% in the age bracket) attending a public institution.

| Age Bracket | Public School | Private School |
| 3 to 4 Year Olds | 114 (85.1%) | 20 (14.9%) |
| 5 to 9 Year Old | 1,246 (92.6%) | 100 (7.4%) |
| 10 to 14 Year Olds | 1,855 (93.0%) | 139 (7.0%) |
| 15 to 17 Year Olds | 902 (80.7%) | 215 (19.3%) |
| 18 to 19 Year Olds | 221 (89.5%) | 26 (10.5%) |
| 20 to 24 Year Olds | 262 (82.1%) | 57 (17.9%) |
| 25 to 34 Year Olds | 241 (90.9%) | 24 (9.1%) |
| 35 Years and over | 270 (84.1%) | 51 (15.9%) |
| Total | 5,111 (89.0%) | 632 (11.0%) |
Educational Attainment by Field of Study in Jennings County
Science & technology (654 | 22.8%), education (592 | 20.6%), business (446 | 15.5%), arts & humanities (233 | 8.1%), and liberal arts & history (197 | 6.9%) are the most common fields of study among 2,868 individuals in Jennings County who have obtained a bachelor's degree or higher.
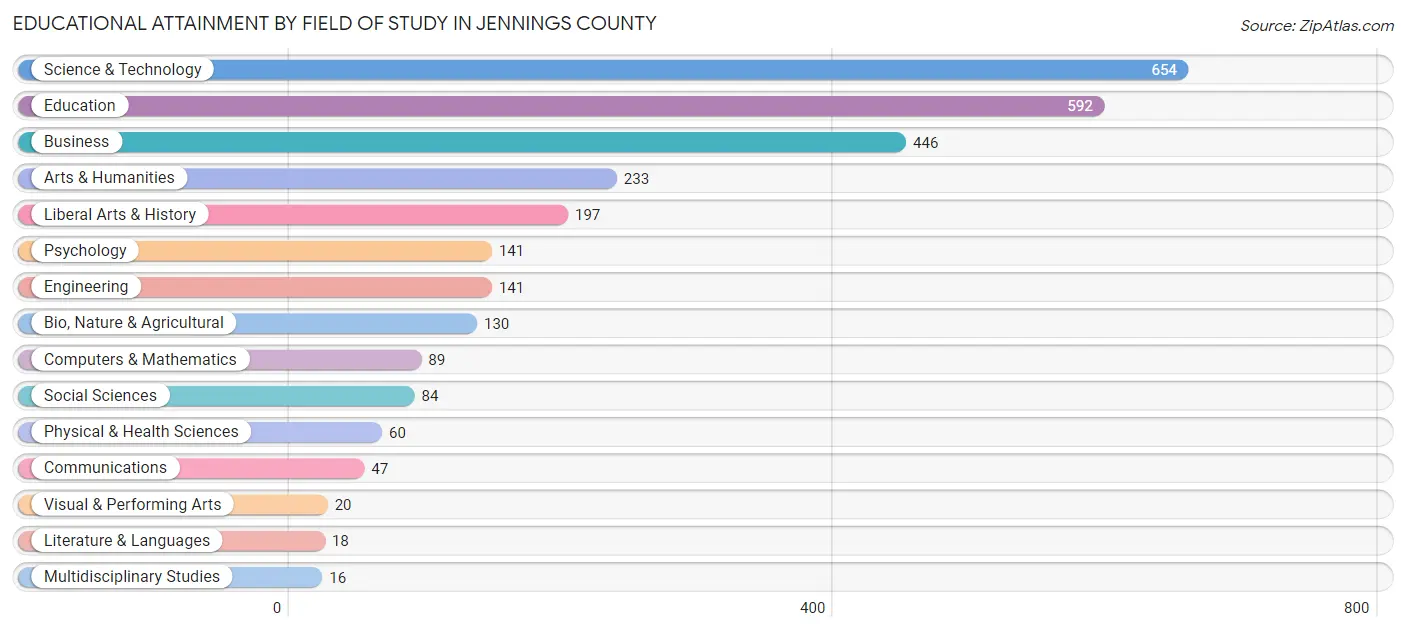
| Field of Study | # Graduates | % Graduates |
| Computers & Mathematics | 89 | 3.1% |
| Bio, Nature & Agricultural | 130 | 4.5% |
| Physical & Health Sciences | 60 | 2.1% |
| Psychology | 141 | 4.9% |
| Social Sciences | 84 | 2.9% |
| Engineering | 141 | 4.9% |
| Multidisciplinary Studies | 16 | 0.6% |
| Science & Technology | 654 | 22.8% |
| Business | 446 | 15.5% |
| Education | 592 | 20.6% |
| Literature & Languages | 18 | 0.6% |
| Liberal Arts & History | 197 | 6.9% |
| Visual & Performing Arts | 20 | 0.7% |
| Communications | 47 | 1.6% |
| Arts & Humanities | 233 | 8.1% |
| Total | 2,868 | 100.0% |
Transportation & Commute in Jennings County
Vehicle Availability by Sex in Jennings County
The most prevalent vehicle ownership categories in Jennings County are males with 2 vehicles (2,747, accounting for 39.3%) and females with 2 vehicles (2,098, making up 47.8%).

| Vehicles Available | Male | Female |
| No Vehicle | 96 (1.4%) | 67 (1.2%) |
| 1 Vehicle | 621 (8.9%) | 728 (12.7%) |
| 2 Vehicles | 2,747 (39.3%) | 2,098 (36.5%) |
| 3 Vehicles | 1,654 (23.7%) | 1,277 (22.2%) |
| 4 Vehicles | 1,041 (14.9%) | 906 (15.8%) |
| 5 or more Vehicles | 831 (11.9%) | 665 (11.6%) |
| Total | 6,990 (100.0%) | 5,741 (100.0%) |
Commute Time in Jennings County
The most frequently occuring commute durations in Jennings County are 10 to 14 minutes (2,405 commuters, 19.6%), 20 to 24 minutes (2,025 commuters, 16.5%), and 30 to 34 minutes (1,822 commuters, 14.8%).
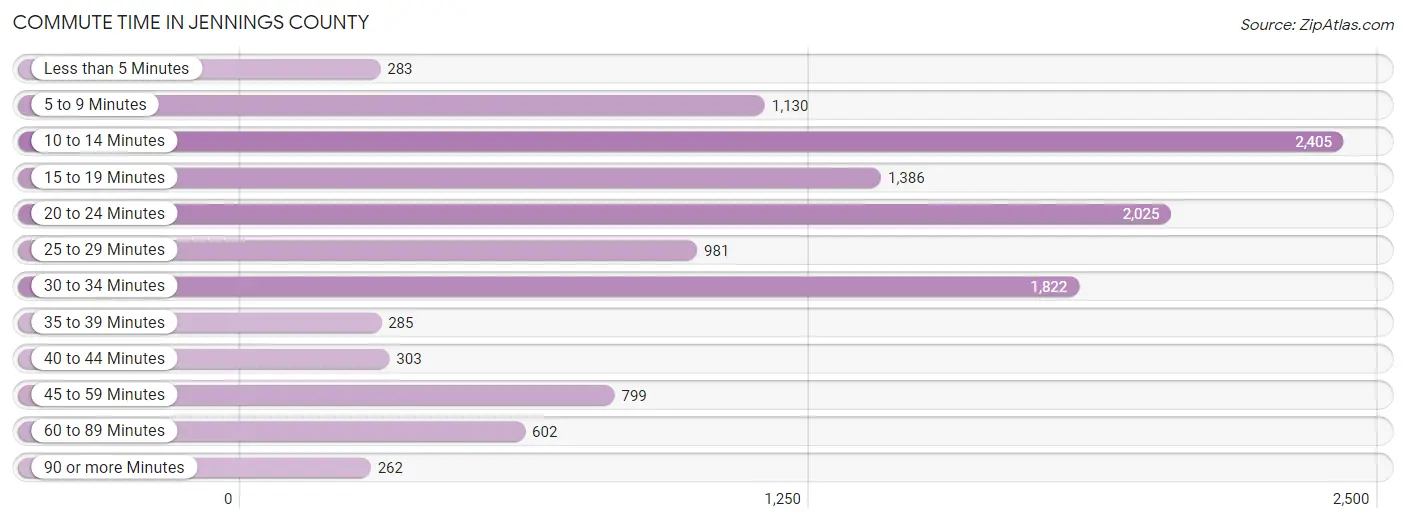
| Commute Time | # Commuters | % Commuters |
| Less than 5 Minutes | 283 | 2.3% |
| 5 to 9 Minutes | 1,130 | 9.2% |
| 10 to 14 Minutes | 2,405 | 19.6% |
| 15 to 19 Minutes | 1,386 | 11.3% |
| 20 to 24 Minutes | 2,025 | 16.5% |
| 25 to 29 Minutes | 981 | 8.0% |
| 30 to 34 Minutes | 1,822 | 14.8% |
| 35 to 39 Minutes | 285 | 2.3% |
| 40 to 44 Minutes | 303 | 2.5% |
| 45 to 59 Minutes | 799 | 6.5% |
| 60 to 89 Minutes | 602 | 4.9% |
| 90 or more Minutes | 262 | 2.1% |
Commute Time by Sex in Jennings County
The most common commute times in Jennings County are 30 to 34 minutes (1,159 commuters, 17.2%) for males and 10 to 14 minutes (1,315 commuters, 23.7%) for females.
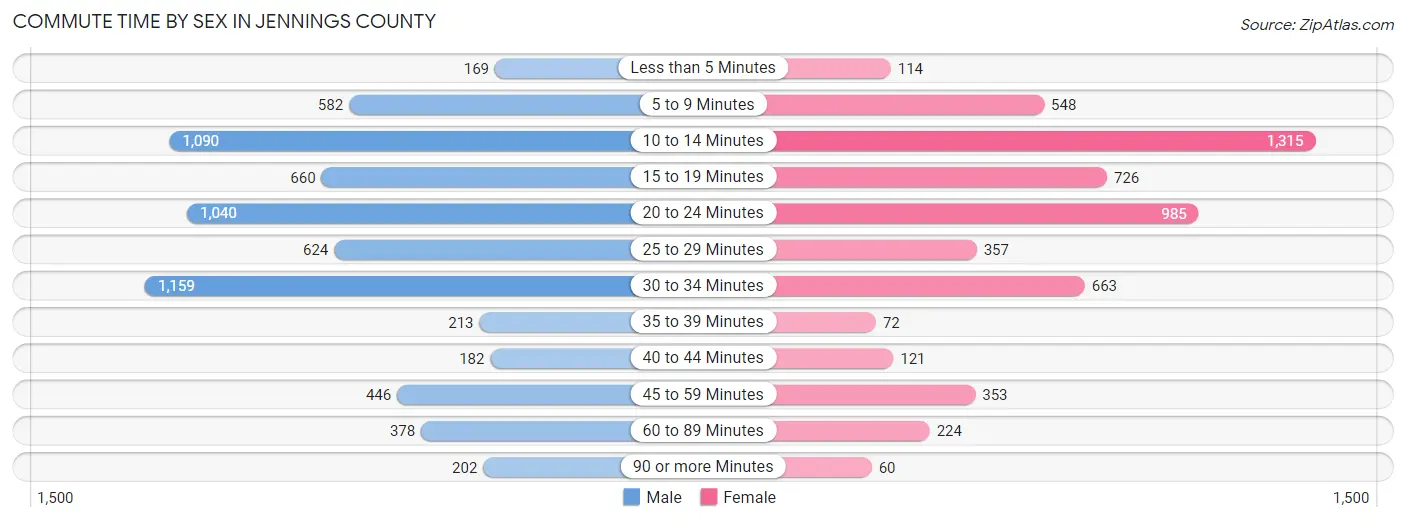
| Commute Time | Male | Female |
| Less than 5 Minutes | 169 (2.5%) | 114 (2.1%) |
| 5 to 9 Minutes | 582 (8.6%) | 548 (9.9%) |
| 10 to 14 Minutes | 1,090 (16.2%) | 1,315 (23.7%) |
| 15 to 19 Minutes | 660 (9.8%) | 726 (13.1%) |
| 20 to 24 Minutes | 1,040 (15.4%) | 985 (17.8%) |
| 25 to 29 Minutes | 624 (9.2%) | 357 (6.5%) |
| 30 to 34 Minutes | 1,159 (17.2%) | 663 (12.0%) |
| 35 to 39 Minutes | 213 (3.2%) | 72 (1.3%) |
| 40 to 44 Minutes | 182 (2.7%) | 121 (2.2%) |
| 45 to 59 Minutes | 446 (6.6%) | 353 (6.4%) |
| 60 to 89 Minutes | 378 (5.6%) | 224 (4.0%) |
| 90 or more Minutes | 202 (3.0%) | 60 (1.1%) |
Time of Departure to Work by Sex in Jennings County
The most frequent times of departure to work in Jennings County are 6:00 AM to 6:29 AM (1,053, 15.6%) for males and 7:30 AM to 7:59 AM (884, 16.0%) for females.

| Time of Departure | Male | Female |
| 12:00 AM to 4:59 AM | 916 (13.6%) | 355 (6.4%) |
| 5:00 AM to 5:29 AM | 498 (7.4%) | 250 (4.5%) |
| 5:30 AM to 5:59 AM | 730 (10.8%) | 208 (3.8%) |
| 6:00 AM to 6:29 AM | 1,053 (15.6%) | 424 (7.7%) |
| 6:30 AM to 6:59 AM | 589 (8.7%) | 595 (10.7%) |
| 7:00 AM to 7:29 AM | 570 (8.5%) | 711 (12.8%) |
| 7:30 AM to 7:59 AM | 789 (11.7%) | 884 (16.0%) |
| 8:00 AM to 8:29 AM | 335 (5.0%) | 529 (9.6%) |
| 8:30 AM to 8:59 AM | 84 (1.3%) | 209 (3.8%) |
| 9:00 AM to 9:59 AM | 166 (2.5%) | 162 (2.9%) |
| 10:00 AM to 10:59 AM | 40 (0.6%) | 71 (1.3%) |
| 11:00 AM to 11:59 AM | 0 (0.0%) | 54 (1.0%) |
| 12:00 PM to 3:59 PM | 534 (7.9%) | 434 (7.8%) |
| 4:00 PM to 11:59 PM | 441 (6.5%) | 652 (11.8%) |
| Total | 6,745 (100.0%) | 5,538 (100.0%) |
Housing Occupancy in Jennings County
Occupancy by Ownership in Jennings County
Of the total 10,461 dwellings in Jennings County, owner-occupied units account for 8,469 (81.0%), while renter-occupied units make up 1,992 (19.0%).

| Occupancy | # Housing Units | % Housing Units |
| Owner Occupied Housing Units | 8,469 | 81.0% |
| Renter-Occupied Housing Units | 1,992 | 19.0% |
| Total Occupied Housing Units | 10,461 | 100.0% |
Occupancy by Household Size in Jennings County
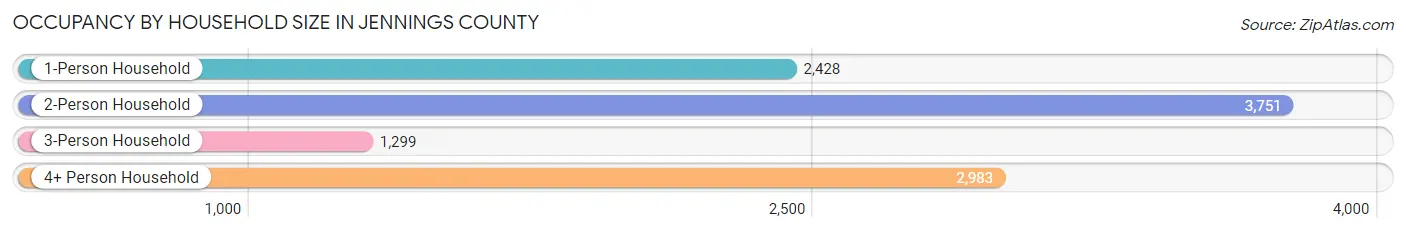
| Household Size | # Housing Units | % Housing Units |
| 1-Person Household | 2,428 | 23.2% |
| 2-Person Household | 3,751 | 35.9% |
| 3-Person Household | 1,299 | 12.4% |
| 4+ Person Household | 2,983 | 28.5% |
| Total Housing Units | 10,461 | 100.0% |
Occupancy by Ownership by Household Size in Jennings County

| Household Size | Owner-occupied | Renter-occupied |
| 1-Person Household | 1,640 (67.5%) | 788 (32.5%) |
| 2-Person Household | 3,167 (84.4%) | 584 (15.6%) |
| 3-Person Household | 1,177 (90.6%) | 122 (9.4%) |
| 4+ Person Household | 2,485 (83.3%) | 498 (16.7%) |
| Total Housing Units | 8,469 (81.0%) | 1,992 (19.0%) |
Occupancy by Educational Attainment in Jennings County
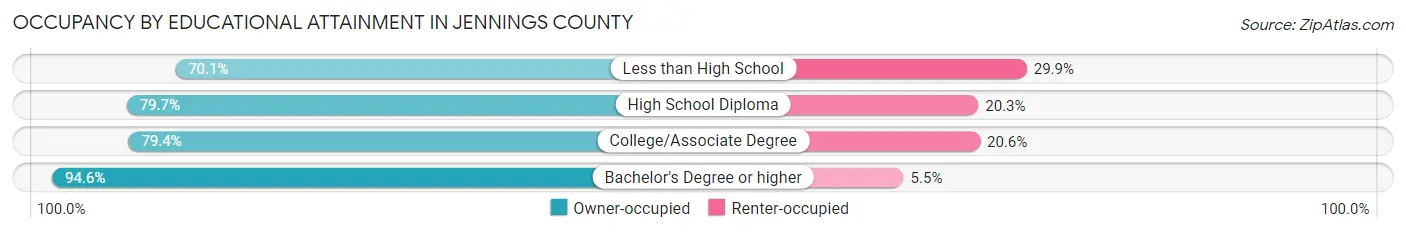
| Household Size | Owner-occupied | Renter-occupied |
| Less than High School | 775 (70.1%) | 330 (29.9%) |
| High School Diploma | 3,562 (79.7%) | 905 (20.3%) |
| College/Associate Degree | 2,571 (79.4%) | 667 (20.6%) |
| Bachelor's Degree or higher | 1,561 (94.6%) | 90 (5.4%) |
Occupancy by Age of Householder in Jennings County
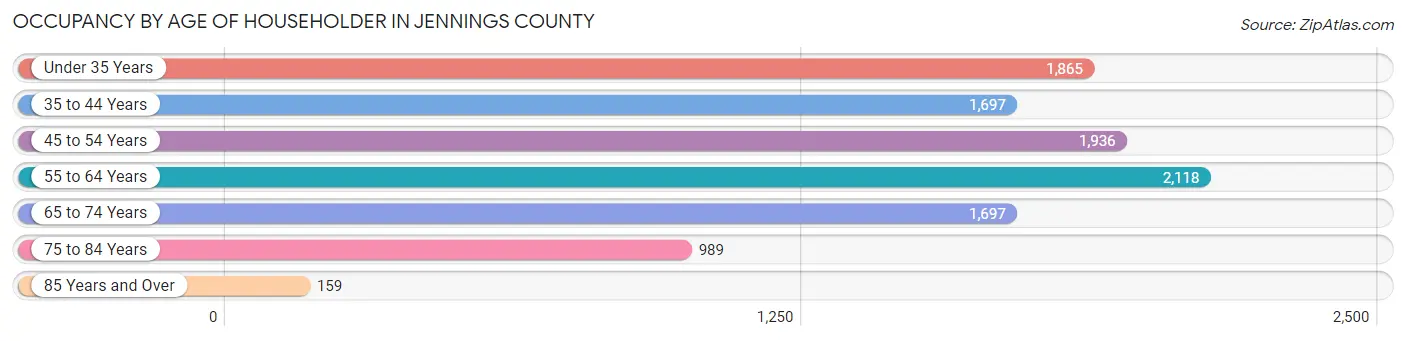
| Age Bracket | # Households | % Households |
| Under 35 Years | 1,865 | 17.8% |
| 35 to 44 Years | 1,697 | 16.2% |
| 45 to 54 Years | 1,936 | 18.5% |
| 55 to 64 Years | 2,118 | 20.3% |
| 65 to 74 Years | 1,697 | 16.2% |
| 75 to 84 Years | 989 | 9.5% |
| 85 Years and Over | 159 | 1.5% |
| Total | 10,461 | 100.0% |
Housing Finances in Jennings County
Median Income by Occupancy in Jennings County
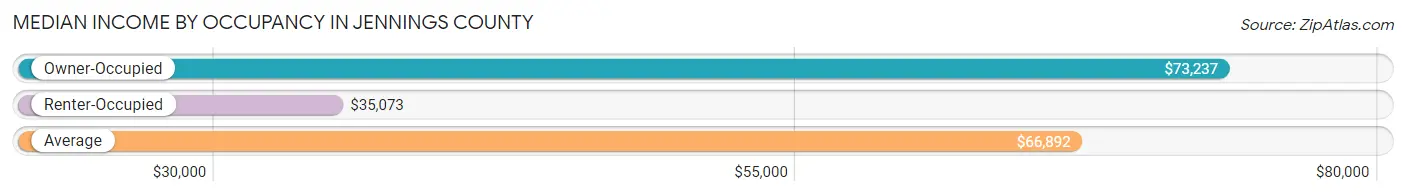
| Occupancy Type | # Households | Median Income |
| Owner-Occupied | 8,469 (81.0%) | $73,237 |
| Renter-Occupied | 1,992 (19.0%) | $35,073 |
| Average | 10,461 (100.0%) | $66,892 |
Occupancy by Householder Income Bracket in Jennings County

| Income Bracket | Owner-occupied | Renter-occupied |
| Less than $5,000 | 128 (1.5%) | 153 (7.7%) |
| $5,000 to $9,999 | 81 (1.0%) | 60 (3.0%) |
| $10,000 to $14,999 | 220 (2.6%) | 227 (11.4%) |
| $15,000 to $19,999 | 279 (3.3%) | 149 (7.5%) |
| $20,000 to $24,999 | 315 (3.7%) | 141 (7.1%) |
| $25,000 to $34,999 | 520 (6.1%) | 262 (13.2%) |
| $35,000 to $49,999 | 970 (11.5%) | 315 (15.8%) |
| $50,000 to $74,999 | 1,804 (21.3%) | 348 (17.5%) |
| $75,000 to $99,999 | 1,582 (18.7%) | 147 (7.4%) |
| $100,000 to $149,999 | 1,807 (21.3%) | 71 (3.6%) |
| $150,000 or more | 763 (9.0%) | 119 (6.0%) |
| Total | 8,469 (100.0%) | 1,992 (100.0%) |
Monthly Housing Cost Tiers in Jennings County

| Monthly Cost | Owner-occupied | Renter-occupied |
| Less than $300 | 715 (8.4%) | 115 (5.8%) |
| $300 to $499 | 1,531 (18.1%) | 84 (4.2%) |
| $500 to $799 | 1,698 (20.1%) | 543 (27.3%) |
| $800 to $999 | 1,125 (13.3%) | 437 (21.9%) |
| $1,000 to $1,499 | 2,335 (27.6%) | 565 (28.4%) |
| $1,500 to $1,999 | 727 (8.6%) | 6 (0.3%) |
| $2,000 to $2,499 | 195 (2.3%) | 0 (0.0%) |
| $2,500 to $2,999 | 48 (0.6%) | 0 (0.0%) |
| $3,000 or more | 95 (1.1%) | 0 (0.0%) |
| Total | 8,469 (100.0%) | 1,992 (100.0%) |
Physical Housing Characteristics in Jennings County
Housing Structures in Jennings County
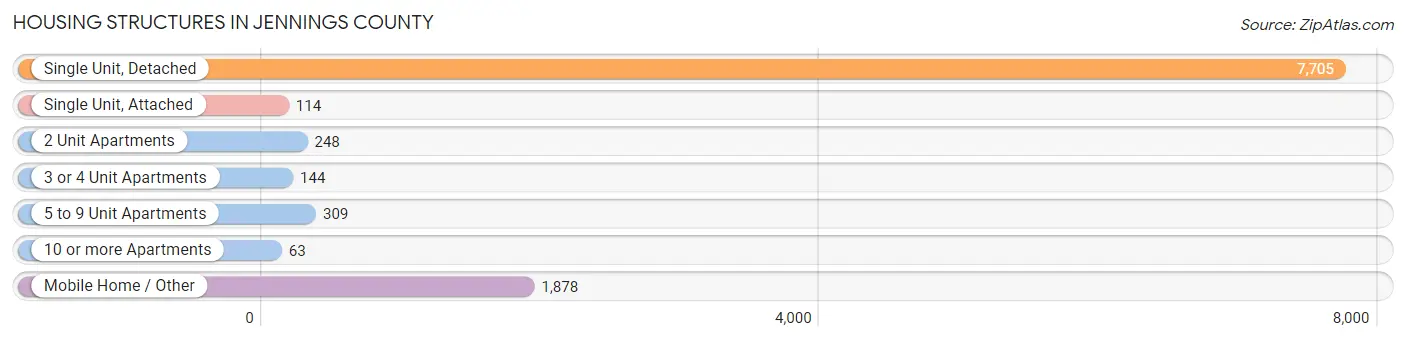
| Structure Type | # Housing Units | % Housing Units |
| Single Unit, Detached | 7,705 | 73.7% |
| Single Unit, Attached | 114 | 1.1% |
| 2 Unit Apartments | 248 | 2.4% |
| 3 or 4 Unit Apartments | 144 | 1.4% |
| 5 to 9 Unit Apartments | 309 | 2.9% |
| 10 or more Apartments | 63 | 0.6% |
| Mobile Home / Other | 1,878 | 17.9% |
| Total | 10,461 | 100.0% |
Housing Structures by Occupancy in Jennings County
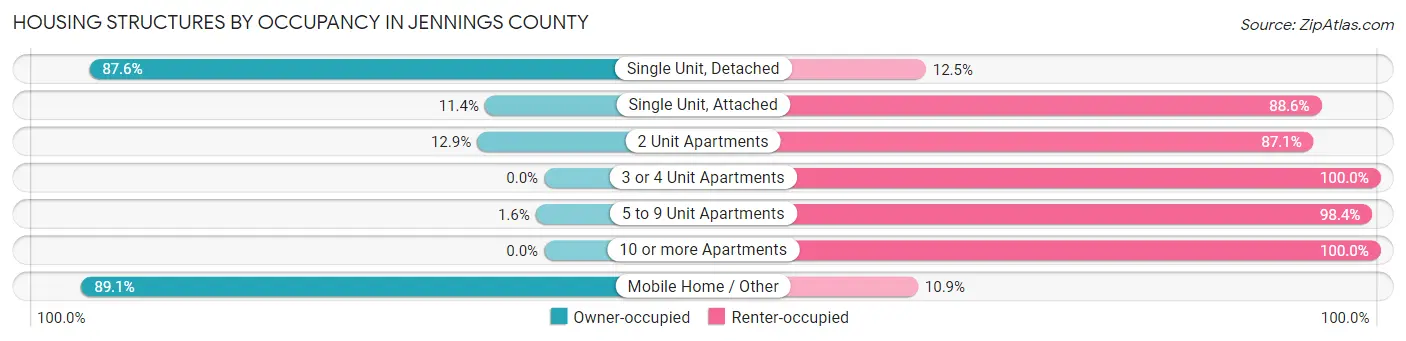
| Structure Type | Owner-occupied | Renter-occupied |
| Single Unit, Detached | 6,746 (87.5%) | 959 (12.4%) |
| Single Unit, Attached | 13 (11.4%) | 101 (88.6%) |
| 2 Unit Apartments | 32 (12.9%) | 216 (87.1%) |
| 3 or 4 Unit Apartments | 0 (0.0%) | 144 (100.0%) |
| 5 to 9 Unit Apartments | 5 (1.6%) | 304 (98.4%) |
| 10 or more Apartments | 0 (0.0%) | 63 (100.0%) |
| Mobile Home / Other | 1,673 (89.1%) | 205 (10.9%) |
| Total | 8,469 (81.0%) | 1,992 (19.0%) |
Housing Structures by Number of Rooms in Jennings County
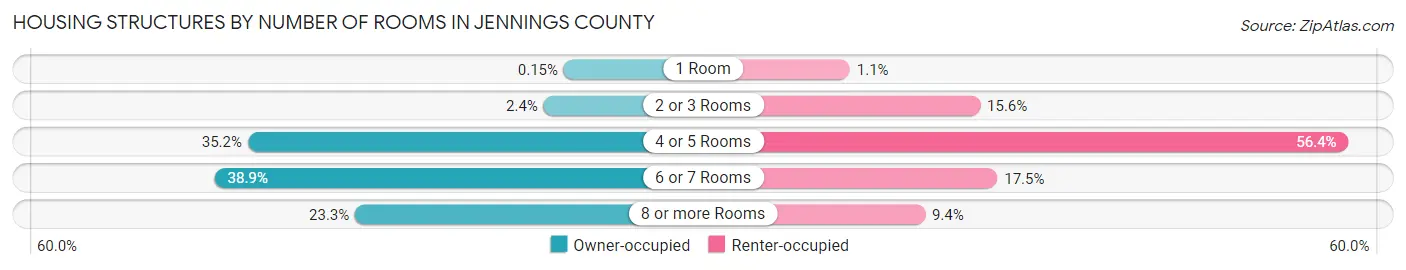
| Number of Rooms | Owner-occupied | Renter-occupied |
| 1 Room | 13 (0.2%) | 22 (1.1%) |
| 2 or 3 Rooms | 202 (2.4%) | 310 (15.6%) |
| 4 or 5 Rooms | 2,984 (35.2%) | 1,124 (56.4%) |
| 6 or 7 Rooms | 3,295 (38.9%) | 348 (17.5%) |
| 8 or more Rooms | 1,975 (23.3%) | 188 (9.4%) |
| Total | 8,469 (100.0%) | 1,992 (100.0%) |
Housing Structure by Heating Type in Jennings County
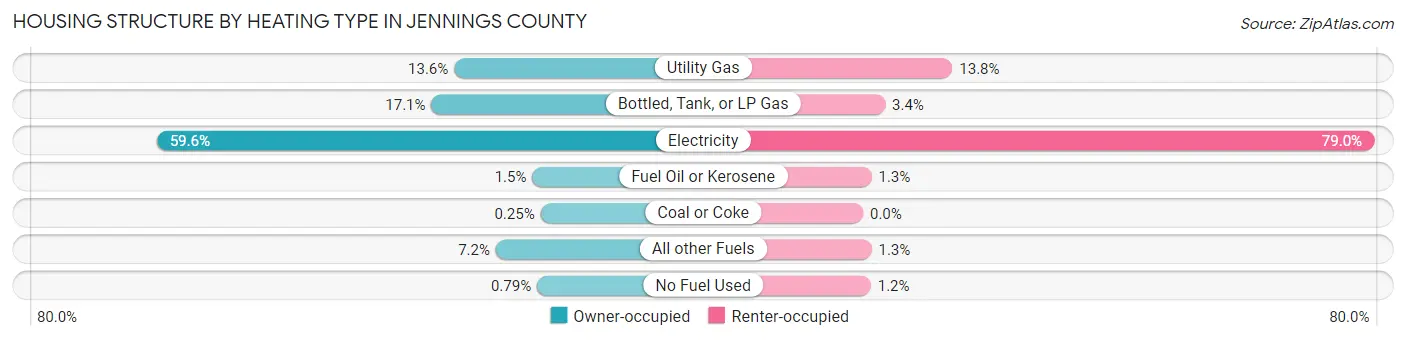
| Heating Type | Owner-occupied | Renter-occupied |
| Utility Gas | 1,152 (13.6%) | 275 (13.8%) |
| Bottled, Tank, or LP Gas | 1,450 (17.1%) | 68 (3.4%) |
| Electricity | 5,045 (59.6%) | 1,573 (79.0%) |
| Fuel Oil or Kerosene | 128 (1.5%) | 26 (1.3%) |
| Coal or Coke | 21 (0.3%) | 0 (0.0%) |
| All other Fuels | 606 (7.2%) | 26 (1.3%) |
| No Fuel Used | 67 (0.8%) | 24 (1.2%) |
| Total | 8,469 (100.0%) | 1,992 (100.0%) |
Household Vehicle Usage in Jennings County
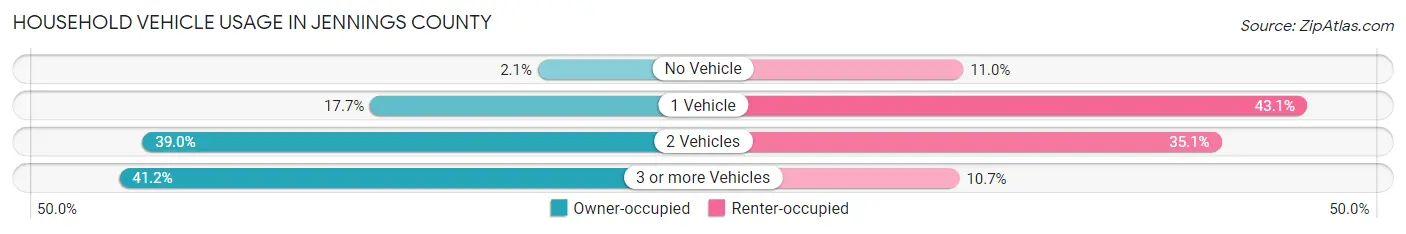
| Vehicles per Household | Owner-occupied | Renter-occupied |
| No Vehicle | 177 (2.1%) | 220 (11.0%) |
| 1 Vehicle | 1,502 (17.7%) | 859 (43.1%) |
| 2 Vehicles | 3,304 (39.0%) | 700 (35.1%) |
| 3 or more Vehicles | 3,486 (41.2%) | 213 (10.7%) |
| Total | 8,469 (100.0%) | 1,992 (100.0%) |
Real Estate & Mortgages in Jennings County
Real Estate and Mortgage Overview in Jennings County
| Characteristic | Without Mortgage | With Mortgage |
| Housing Units | 3,305 | 5,164 |
| Median Property Value | $112,300 | $142,100 |
| Median Household Income | $63,335 | $579 |
| Monthly Housing Costs | $440 | $95 |
| Real Estate Taxes | $758 | $134 |
Property Value by Mortgage Status in Jennings County
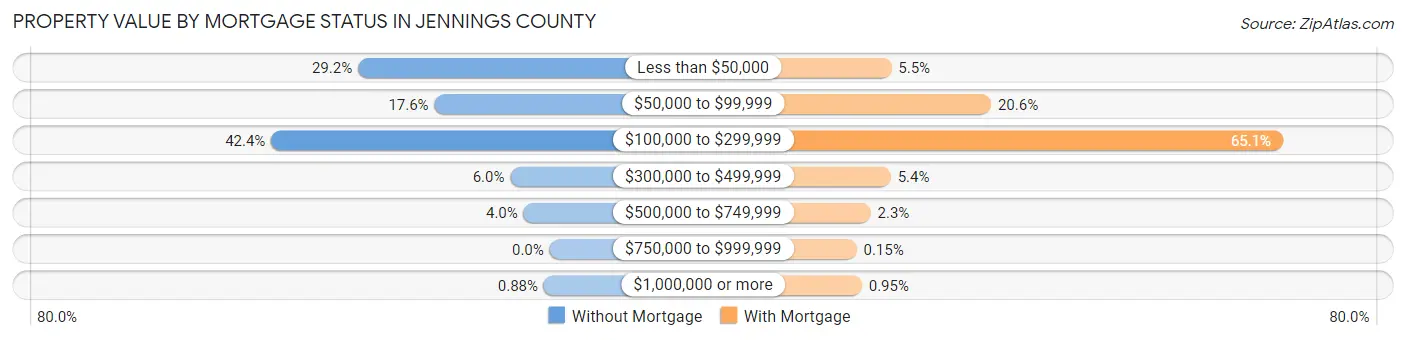
| Property Value | Without Mortgage | With Mortgage |
| Less than $50,000 | 965 (29.2%) | 282 (5.5%) |
| $50,000 to $99,999 | 580 (17.5%) | 1,066 (20.6%) |
| $100,000 to $299,999 | 1,402 (42.4%) | 3,363 (65.1%) |
| $300,000 to $499,999 | 198 (6.0%) | 277 (5.4%) |
| $500,000 to $749,999 | 131 (4.0%) | 119 (2.3%) |
| $750,000 to $999,999 | 0 (0.0%) | 8 (0.2%) |
| $1,000,000 or more | 29 (0.9%) | 49 (0.9%) |
| Total | 3,305 (100.0%) | 5,164 (100.0%) |
Household Income by Mortgage Status in Jennings County

| Household Income | Without Mortgage | With Mortgage |
| Less than $10,000 | 150 (4.5%) | 182 (3.5%) |
| $10,000 to $24,999 | 353 (10.7%) | 59 (1.1%) |
| $25,000 to $34,999 | 361 (10.9%) | 461 (8.9%) |
| $35,000 to $49,999 | 491 (14.9%) | 159 (3.1%) |
| $50,000 to $74,999 | 712 (21.5%) | 479 (9.3%) |
| $75,000 to $99,999 | 385 (11.7%) | 1,092 (21.1%) |
| $100,000 to $149,999 | 669 (20.2%) | 1,197 (23.2%) |
| $150,000 or more | 184 (5.6%) | 1,138 (22.0%) |
| Total | 3,305 (100.0%) | 5,164 (100.0%) |
Property Value to Household Income Ratio in Jennings County
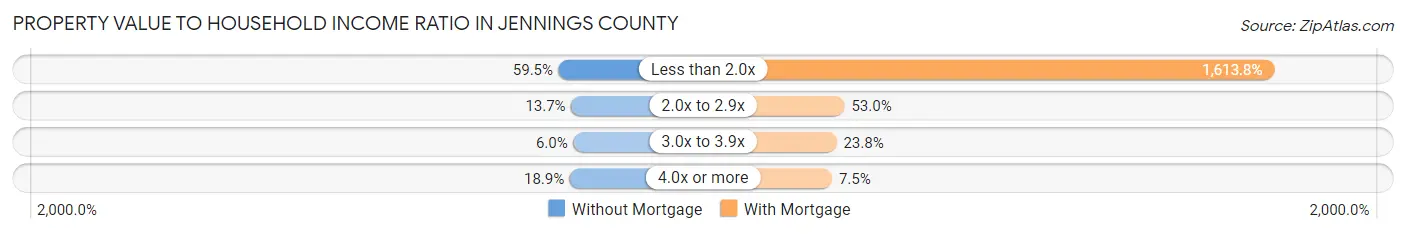
| Value-to-Income Ratio | Without Mortgage | With Mortgage |
| Less than 2.0x | 1,966 (59.5%) | 83,338 (1,613.8%) |
| 2.0x to 2.9x | 453 (13.7%) | 2,735 (53.0%) |
| 3.0x to 3.9x | 199 (6.0%) | 1,231 (23.8%) |
| 4.0x or more | 624 (18.9%) | 387 (7.5%) |
| Total | 3,305 (100.0%) | 5,164 (100.0%) |
Real Estate Taxes by Mortgage Status in Jennings County

| Property Taxes | Without Mortgage | With Mortgage |
| Less than $800 | 1,619 (49.0%) | 13 (0.3%) |
| $800 to $1,499 | 748 (22.6%) | 2,248 (43.5%) |
| $800 to $1,499 | 737 (22.3%) | 1,506 (29.2%) |
| Total | 3,305 (100.0%) | 5,164 (100.0%) |
Health & Disability in Jennings County
Health Insurance Coverage by Age in Jennings County
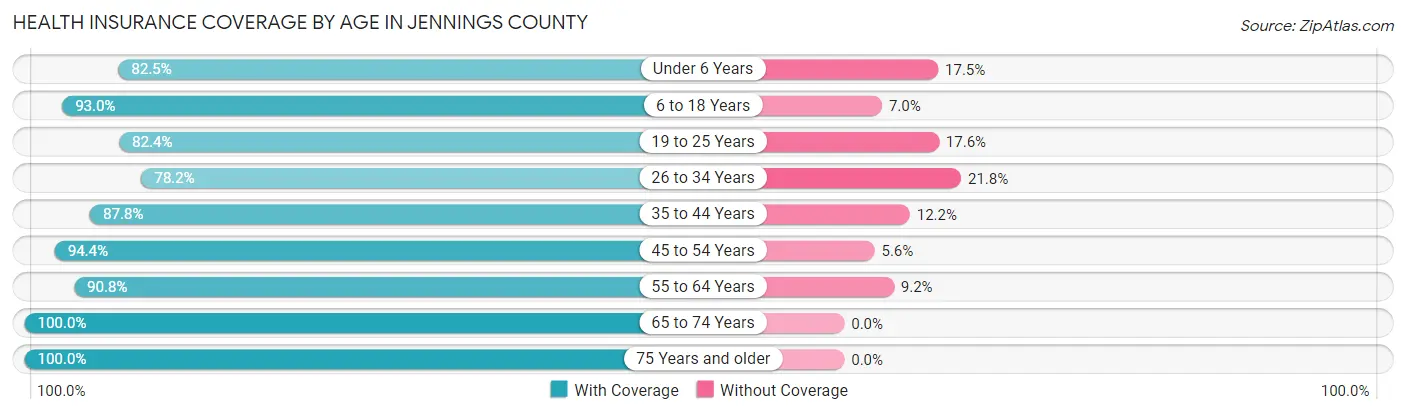
| Age Bracket | With Coverage | Without Coverage |
| Under 6 Years | 1,642 (82.5%) | 348 (17.5%) |
| 6 to 18 Years | 4,292 (93.0%) | 324 (7.0%) |
| 19 to 25 Years | 2,017 (82.4%) | 432 (17.6%) |
| 26 to 34 Years | 2,260 (78.2%) | 629 (21.8%) |
| 35 to 44 Years | 2,794 (87.8%) | 389 (12.2%) |
| 45 to 54 Years | 3,600 (94.4%) | 215 (5.6%) |
| 55 to 64 Years | 3,536 (90.8%) | 360 (9.2%) |
| 65 to 74 Years | 2,734 (100.0%) | 0 (0.0%) |
| 75 Years and older | 1,762 (100.0%) | 0 (0.0%) |
| Total | 24,637 (90.1%) | 2,697 (9.9%) |
Health Insurance Coverage by Citizenship Status in Jennings County
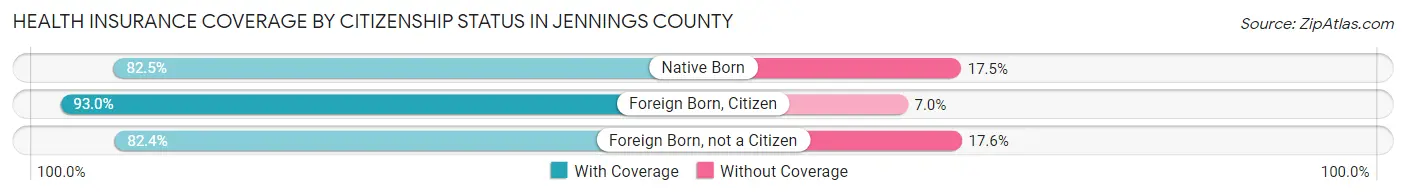
| Citizenship Status | With Coverage | Without Coverage |
| Native Born | 1,642 (82.5%) | 348 (17.5%) |
| Foreign Born, Citizen | 4,292 (93.0%) | 324 (7.0%) |
| Foreign Born, not a Citizen | 2,017 (82.4%) | 432 (17.6%) |
Health Insurance Coverage by Household Income in Jennings County

| Household Income | With Coverage | Without Coverage |
| Under $25,000 | 2,698 (89.5%) | 318 (10.5%) |
| $25,000 to $49,999 | 3,685 (83.8%) | 713 (16.2%) |
| $50,000 to $74,999 | 4,394 (82.8%) | 911 (17.2%) |
| $75,000 to $99,999 | 4,656 (89.4%) | 550 (10.6%) |
| $100,000 and over | 9,086 (97.8%) | 205 (2.2%) |
Public vs Private Health Insurance Coverage by Age in Jennings County
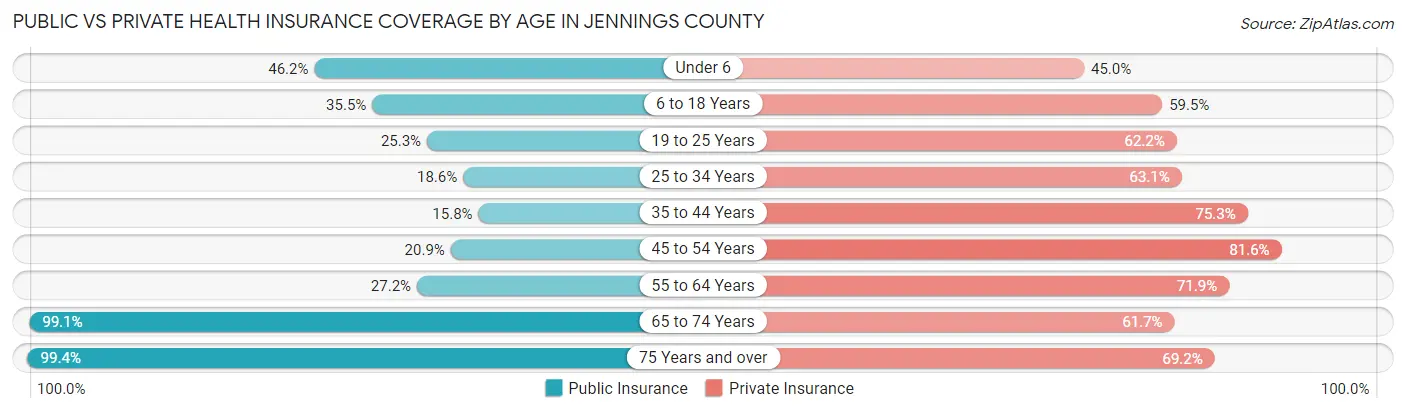
| Age Bracket | Public Insurance | Private Insurance |
| Under 6 | 920 (46.2%) | 895 (45.0%) |
| 6 to 18 Years | 1,638 (35.5%) | 2,745 (59.5%) |
| 19 to 25 Years | 620 (25.3%) | 1,522 (62.2%) |
| 25 to 34 Years | 538 (18.6%) | 1,822 (63.1%) |
| 35 to 44 Years | 502 (15.8%) | 2,397 (75.3%) |
| 45 to 54 Years | 798 (20.9%) | 3,113 (81.6%) |
| 55 to 64 Years | 1,059 (27.2%) | 2,800 (71.9%) |
| 65 to 74 Years | 2,710 (99.1%) | 1,688 (61.7%) |
| 75 Years and over | 1,752 (99.4%) | 1,219 (69.2%) |
| Total | 10,537 (38.6%) | 18,201 (66.6%) |
Disability Status by Sex by Age in Jennings County

| Age Bracket | Male | Female |
| Under 5 Years | 30 (3.6%) | 13 (1.6%) |
| 5 to 17 Years | 239 (9.7%) | 146 (6.5%) |
| 18 to 34 Years | 336 (12.0%) | 450 (16.1%) |
| 35 to 64 Years | 1,292 (22.8%) | 1,079 (20.7%) |
| 65 to 74 Years | 243 (18.7%) | 422 (29.4%) |
| 75 Years and over | 433 (54.0%) | 537 (55.9%) |
Disability Class by Sex by Age in Jennings County
Disability Class: Hearing Difficulty

| Age Bracket | Male | Female |
| Under 5 Years | 30 (3.6%) | 0 (0.0%) |
| 5 to 17 Years | 28 (1.1%) | 0 (0.0%) |
| 18 to 34 Years | 24 (0.9%) | 20 (0.7%) |
| 35 to 64 Years | 448 (7.9%) | 227 (4.3%) |
| 65 to 74 Years | 125 (9.6%) | 146 (10.2%) |
| 75 Years and over | 195 (24.3%) | 189 (19.7%) |
Disability Class: Vision Difficulty
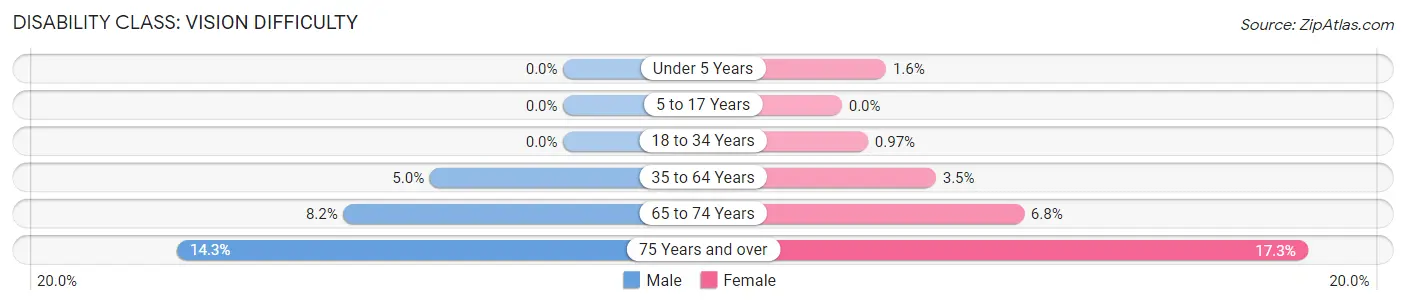
| Age Bracket | Male | Female |
| Under 5 Years | 0 (0.0%) | 13 (1.6%) |
| 5 to 17 Years | 0 (0.0%) | 0 (0.0%) |
| 18 to 34 Years | 0 (0.0%) | 27 (1.0%) |
| 35 to 64 Years | 281 (5.0%) | 182 (3.5%) |
| 65 to 74 Years | 106 (8.2%) | 97 (6.8%) |
| 75 Years and over | 115 (14.3%) | 166 (17.3%) |
Disability Class: Cognitive Difficulty
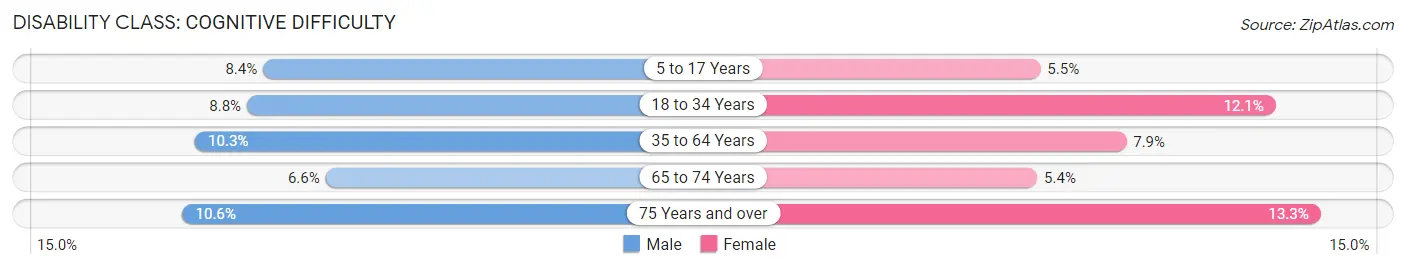
| Age Bracket | Male | Female |
| 5 to 17 Years | 207 (8.4%) | 125 (5.5%) |
| 18 to 34 Years | 246 (8.8%) | 337 (12.1%) |
| 35 to 64 Years | 582 (10.2%) | 413 (7.9%) |
| 65 to 74 Years | 86 (6.6%) | 78 (5.4%) |
| 75 Years and over | 85 (10.6%) | 128 (13.3%) |
Disability Class: Ambulatory Difficulty

| Age Bracket | Male | Female |
| 5 to 17 Years | 0 (0.0%) | 27 (1.2%) |
| 18 to 34 Years | 34 (1.2%) | 53 (1.9%) |
| 35 to 64 Years | 615 (10.8%) | 717 (13.7%) |
| 65 to 74 Years | 114 (8.8%) | 224 (15.6%) |
| 75 Years and over | 203 (25.3%) | 417 (43.4%) |
Disability Class: Self-Care Difficulty
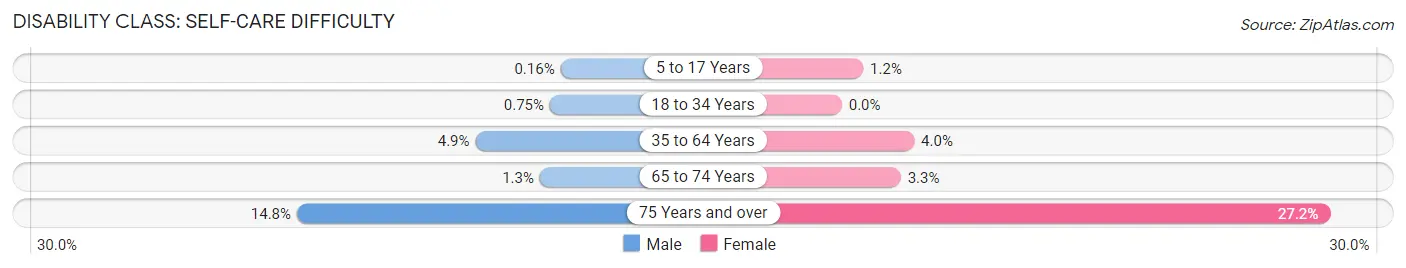
| Age Bracket | Male | Female |
| 5 to 17 Years | 4 (0.2%) | 27 (1.2%) |
| 18 to 34 Years | 21 (0.7%) | 0 (0.0%) |
| 35 to 64 Years | 278 (4.9%) | 210 (4.0%) |
| 65 to 74 Years | 17 (1.3%) | 47 (3.3%) |
| 75 Years and over | 119 (14.8%) | 261 (27.2%) |
Technology Access in Jennings County
Computing Device Access in Jennings County

| Device Type | # Households | % Households |
| Desktop or Laptop | 7,479 | 71.5% |
| Smartphone | 8,866 | 84.8% |
| Tablet | 5,867 | 56.1% |
| No Computing Device | 789 | 7.5% |
| Total | 10,461 | 100.0% |
Internet Access in Jennings County
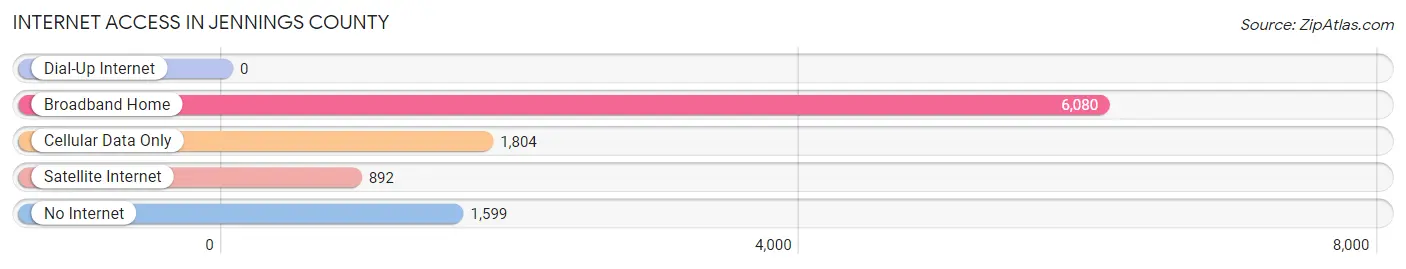
| Internet Type | # Households | % Households |
| Dial-Up Internet | 0 | 0.0% |
| Broadband Home | 6,080 | 58.1% |
| Cellular Data Only | 1,804 | 17.2% |
| Satellite Internet | 892 | 8.5% |
| No Internet | 1,599 | 15.3% |
| Total | 10,461 | 100.0% |
Jennings County Summary
Jennings County, Indiana is located in the southeastern part of the state, and is part of the larger Columbus, Indiana metropolitan area. It is bordered by Bartholomew, Jackson, Jefferson, Ripley, and Scott counties. The county seat is Vernon, and the county was named after Jonathan Jennings, the first governor of Indiana.
Geography
Jennings County is located in the southeastern part of Indiana, and is part of the larger Columbus, Indiana metropolitan area. It is bordered by Bartholomew, Jackson, Jefferson, Ripley, and Scott counties. The county has a total area of 437 square miles, of which 434 square miles is land and 3 square miles is water. The terrain is mostly flat, with some rolling hills in the northern part of the county. The highest point in the county is located in the northern part of the county, at an elevation of 890 feet.
The county is home to several bodies of water, including the Muscatatuck River, which flows through the county from north to south, and the Driftwood River, which flows through the county from east to west. Other bodies of water in the county include the Flatrock River, the East Fork of the White River, and the Big Blue River.
Demographics
As of the 2010 census, there were 28,525 people, 11,093 households, and 7,845 families living in the county. The population density was 65.7 people per square mile. The racial makeup of the county was 97.3% White, 0.7% African American, 0.3% Native American, 0.3% Asian, 0.2% from other races, and 1.2% from two or more races. Hispanic or Latino of any race were 1.2% of the population.
The median income for a household in the county was $41,945, and the median income for a family was $50,945. The per capita income for the county was $20,845. About 10.3% of families and 13.2% of the population were below the poverty line, including 17.2% of those under age 18 and 8.2% of those age 65 or over.
Economy
The economy of Jennings County is largely based on agriculture and manufacturing. The county is home to several large agricultural operations, including the Muscatatuck Farms, which produces corn, soybeans, and wheat. Other agricultural products produced in the county include hay, beef, pork, and poultry.
The county is also home to several manufacturing companies, including Cummins, Inc., which produces engines and other powertrain components, and ArvinMeritor, which produces automotive components. Other major employers in the county include the Jennings County School Corporation, the Jennings County Health Department, and the Jennings County Sheriff's Office.
History
Jennings County was formed in 1817 from parts of Jefferson and Ripley counties. It was named after Jonathan Jennings, the first governor of Indiana. The county seat was originally located in Vernon, but was moved to Vernon in 1821.
The county was largely agricultural in its early years, with the main crops being corn, wheat, and oats. The county also had several sawmills and gristmills, which provided lumber and grain for the local population.
In the late 19th century, the county began to industrialize, with the construction of several factories, including a paper mill, a flour mill, and a woolen mill. The county also had several railroads, which connected it to other parts of the state.
In the 20th century, the county continued to grow and develop. The county's population increased steadily, and new businesses and industries were established. The county also saw the construction of several new schools, hospitals, and other public facilities.
Today, Jennings County is a thriving community with a diverse economy. The county is home to several large agricultural operations, manufacturing companies, and other businesses. The county also has several parks, museums, and other attractions.
Common Questions
What is the Total Population of Jennings County?
Total Population of Jennings County is 27,610.
What is the Total Male Population of Jennings County?
Total Male Population of Jennings County is 14,060.
What is the Total Female Population of Jennings County?
Total Female Population of Jennings County is 13,550.
What is the Ratio of Males per 100 Females in Jennings County?
There are 103.76 Males per 100 Females in Jennings County.
What is the Ratio of Females per 100 Males in Jennings County?
There are 96.37 Females per 100 Males in Jennings County.
What is the Median Population Age in Jennings County?
Median Population Age in Jennings County is 39.6 Years.
What is the Average Family Size in Jennings County
Average Family Size in Jennings County is 3.0 People.
What is the Average Household Size in Jennings County
Average Household Size in Jennings County is 2.6 People.
What is Per Capita Income in Jennings County?
Per Capita income in Jennings County is $30,254.
What is the Median Family Income in Jennings County?
Median Family Income in Jennings County is $76,742.
What is the Median Household income in Jennings County?
Median Household Income in Jennings County is $66,892.
What is Income or Wage Gap in Jennings County?
Income or Wage Gap in Jennings County is 32.1%.
Women in Jennings County earn 67.9 cents for every dollar earned by a man.
What is Family Income Deficit in Jennings County?
Family Income Deficit in Jennings County is $10,162.
Families that are below poverty line in Jennings County earn $10,162 less on average than the poverty threshold level.
What is Inequality or Gini Index in Jennings County?
Inequality or Gini Index in Jennings County is 0.39.
How Large is the Labor Force in Jennings County?
There are 13,843 People in the Labor Forcein in Jennings County.
What is the Percentage of People in the Labor Force in Jennings County?
62.8% of People are in the Labor Force in Jennings County.
What is the Unemployment Rate in Jennings County?
Unemployment Rate in Jennings County is 5.0%.