Jay County, IN
Jay County Map

Jay County Overview
20,451
TOTAL POPULATION
10,298
MALE POPULATION
10,153
FEMALE POPULATION
101.43
MALES / 100 FEMALES
98.59
FEMALES / 100 MALES
39.6
MEDIAN AGE
3.1
AVG FAMILY SIZE
2.5
AVG HOUSEHOLD SIZE
$27,794
PER CAPITA INCOME
$65,719
AVG FAMILY INCOME
$52,231
AVG HOUSEHOLD INCOME
37.3%
WAGE / INCOME GAP [ % ]
62.7¢/ $1
WAGE / INCOME GAP [ $ ]
$13,344
FAMILY INCOME DEFICIT
0.44
INEQUALITY / GINI INDEX
9,564
LABOR FORCE [ PEOPLE ]
60.6%
PERCENT IN LABOR FORCE
4.4%
UNEMPLOYMENT RATE
Race in Jay County
The most populous races in Jay County are White / Caucasian (19,428 | 95.0%), Two or more Races (705 | 3.5%), and Hispanic or Latino (702 | 3.4%).

| Race | # Population | % Population |
| Asian | 87 | 0.4% |
| Black / African American | 59 | 0.3% |
| Hawaiian / Pacific | 0 | 0.0% |
| Hispanic or Latino | 702 | 3.4% |
| Native / Alaskan | 24 | 0.1% |
| White / Caucasian | 19,428 | 95.0% |
| Two or more Races | 705 | 3.5% |
| Some other Race | 148 | 0.7% |
| Total | 20,451 | 100.0% |
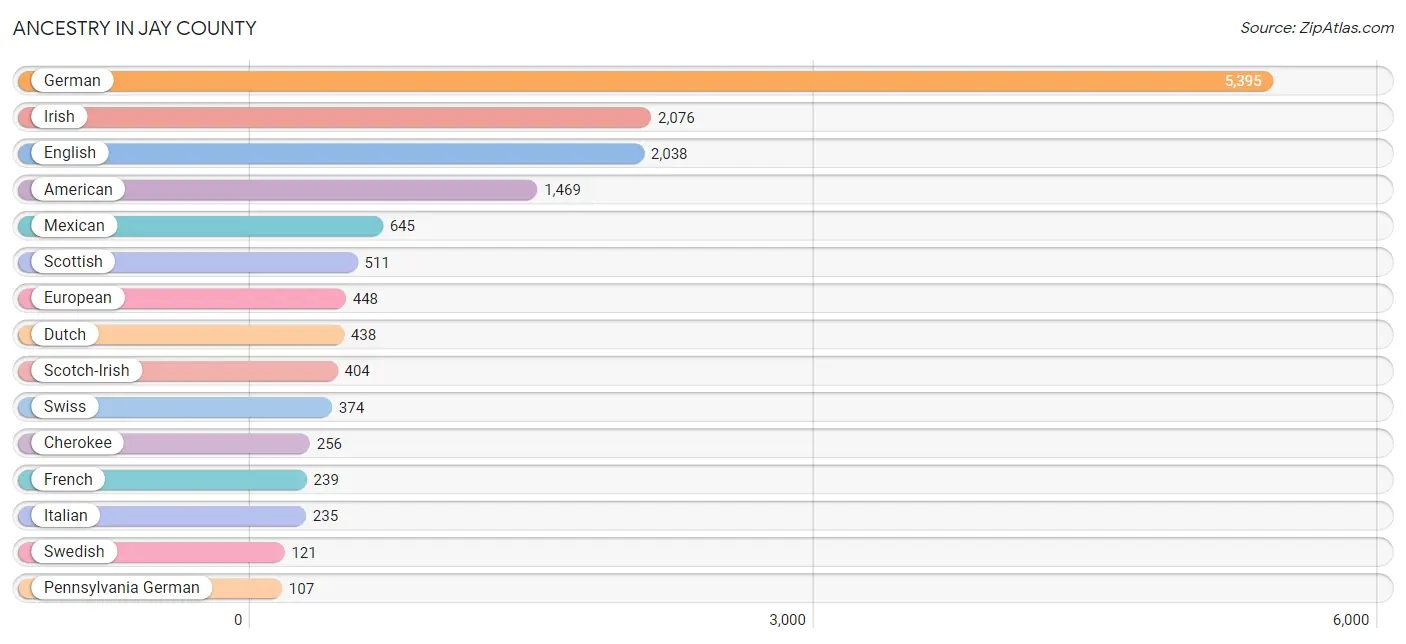
Ancestry in Jay County
The most populous ancestries reported in Jay County are German (5,395 | 26.4%), Irish (2,076 | 10.2%), English (2,038 | 10.0%), American (1,469 | 7.2%), and Mexican (645 | 3.2%), together accounting for 56.8% of all Jay County residents.
| Ancestry | # Population | % Population |
| American | 1,469 | 7.2% |
| Austrian | 14 | 0.1% |
| Belgian | 18 | 0.1% |
| Bhutanese | 7 | 0.0% |
| Blackfeet | 1 | 0.0% |
| British | 56 | 0.3% |
| Burmese | 13 | 0.1% |
| Canadian | 23 | 0.1% |
| Central American Indian | 7 | 0.0% |
| Cherokee | 256 | 1.3% |
| Colombian | 19 | 0.1% |
| Czech | 18 | 0.1% |
| Danish | 17 | 0.1% |
| Dutch | 438 | 2.1% |
| Eastern European | 10 | 0.1% |
| English | 2,038 | 10.0% |
| European | 448 | 2.2% |
| Finnish | 14 | 0.1% |
| French | 239 | 1.2% |
| French Canadian | 64 | 0.3% |
| German | 5,395 | 26.4% |
| Greek | 2 | 0.0% |
| Hungarian | 2 | 0.0% |
| Indian (Asian) | 16 | 0.1% |
| Indonesian | 57 | 0.3% |
| Irish | 2,076 | 10.2% |
| Italian | 235 | 1.1% |
| Korean | 4 | 0.0% |
| Mexican | 645 | 3.2% |
| Norwegian | 45 | 0.2% |
| Pennsylvania German | 107 | 0.5% |
| Peruvian | 3 | 0.0% |
| Pima | 17 | 0.1% |
| Polish | 103 | 0.5% |
| Puerto Rican | 18 | 0.1% |
| Russian | 52 | 0.3% |
| Scandinavian | 68 | 0.3% |
| Scotch-Irish | 404 | 2.0% |
| Scottish | 511 | 2.5% |
| Sioux | 33 | 0.2% |
| South African | 24 | 0.1% |
| South American | 22 | 0.1% |
| South American Indian | 3 | 0.0% |
| Spanish | 17 | 0.1% |
| Sri Lankan | 11 | 0.1% |
| Subsaharan African | 24 | 0.1% |
| Swedish | 121 | 0.6% |
| Swiss | 374 | 1.8% |
| Thai | 13 | 0.1% |
| Ukrainian | 8 | 0.0% |
| Welsh | 83 | 0.4% | View All 51 Rows |
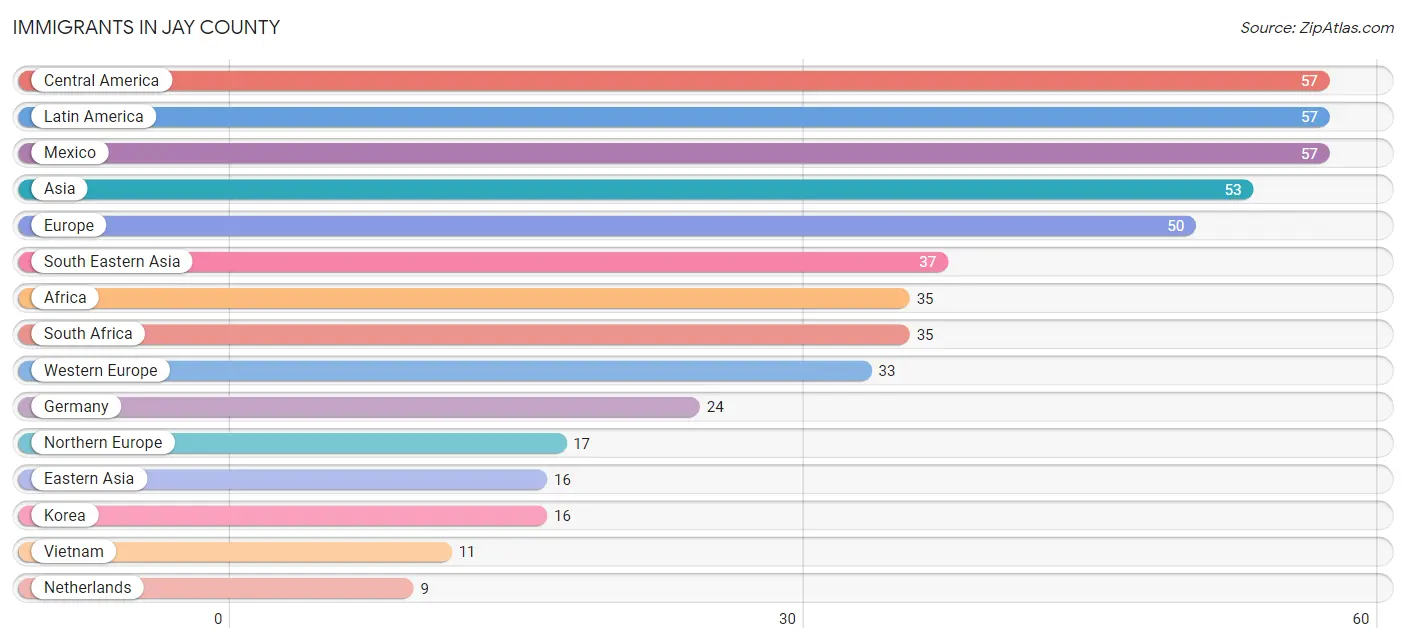
Immigrants in Jay County
The most numerous immigrant groups reported in Jay County came from Central America (57 | 0.3%), Latin America (57 | 0.3%), Mexico (57 | 0.3%), Asia (53 | 0.3%), and Europe (50 | 0.2%), together accounting for 1.3% of all Jay County residents.
| Immigration Origin | # Population | % Population |
| Africa | 35 | 0.2% |
| Asia | 53 | 0.3% |
| Central America | 57 | 0.3% |
| Eastern Asia | 16 | 0.1% |
| Europe | 50 | 0.2% |
| Germany | 24 | 0.1% |
| Korea | 16 | 0.1% |
| Latin America | 57 | 0.3% |
| Mexico | 57 | 0.3% |
| Netherlands | 9 | 0.0% |
| Northern Europe | 17 | 0.1% |
| Philippines | 4 | 0.0% |
| South Africa | 35 | 0.2% |
| South Eastern Asia | 37 | 0.2% |
| Vietnam | 11 | 0.1% |
| Western Europe | 33 | 0.2% | View All 16 Rows |
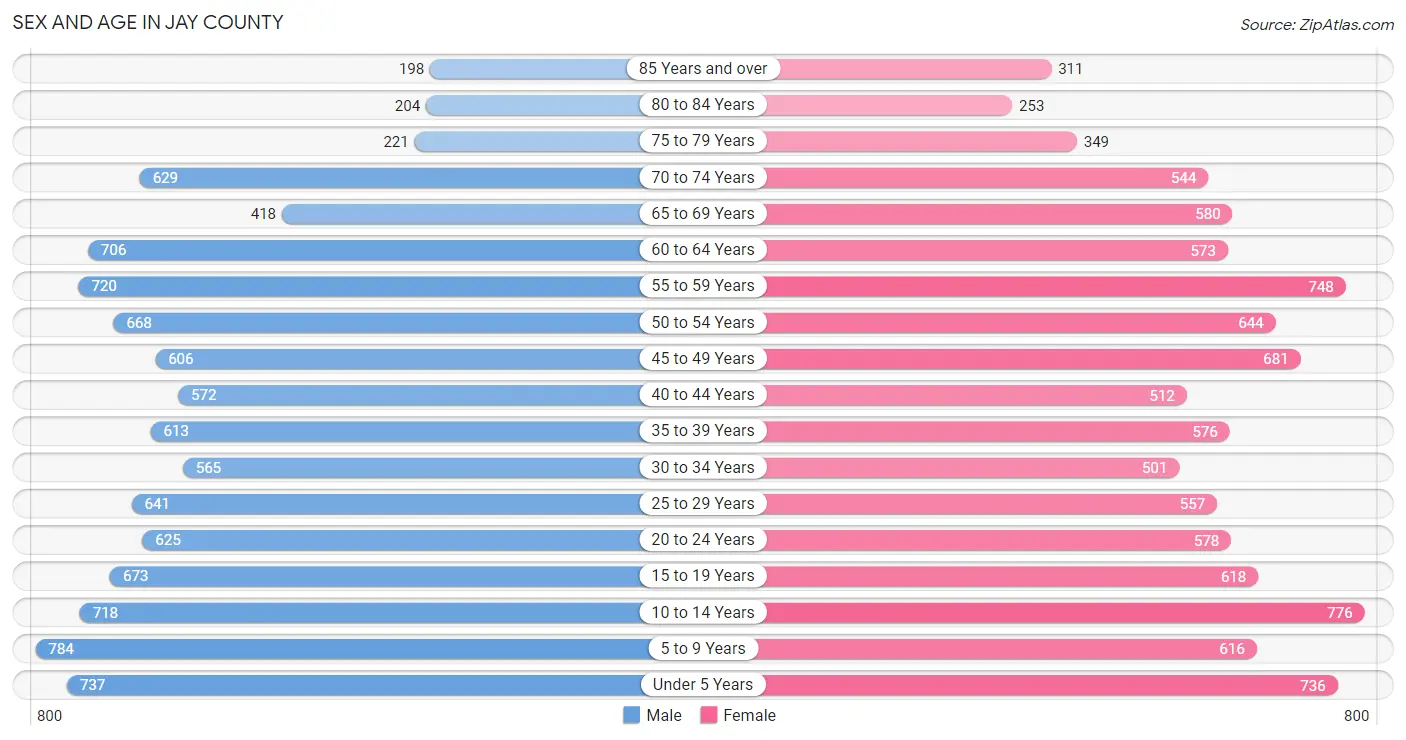
Sex and Age in Jay County
Sex and Age in Jay County
The most populous age groups in Jay County are 5 to 9 Years (784 | 7.6%) for men and 10 to 14 Years (776 | 7.6%) for women.
| Age Bracket | Male | Female |
| Under 5 Years | 737 (7.2%) | 736 (7.2%) |
| 5 to 9 Years | 784 (7.6%) | 616 (6.1%) |
| 10 to 14 Years | 718 (7.0%) | 776 (7.6%) |
| 15 to 19 Years | 673 (6.5%) | 618 (6.1%) |
| 20 to 24 Years | 625 (6.1%) | 578 (5.7%) |
| 25 to 29 Years | 641 (6.2%) | 557 (5.5%) |
| 30 to 34 Years | 565 (5.5%) | 501 (4.9%) |
| 35 to 39 Years | 613 (5.9%) | 576 (5.7%) |
| 40 to 44 Years | 572 (5.6%) | 512 (5.0%) |
| 45 to 49 Years | 606 (5.9%) | 681 (6.7%) |
| 50 to 54 Years | 668 (6.5%) | 644 (6.3%) |
| 55 to 59 Years | 720 (7.0%) | 748 (7.4%) |
| 60 to 64 Years | 706 (6.9%) | 573 (5.6%) |
| 65 to 69 Years | 418 (4.1%) | 580 (5.7%) |
| 70 to 74 Years | 629 (6.1%) | 544 (5.4%) |
| 75 to 79 Years | 221 (2.1%) | 349 (3.4%) |
| 80 to 84 Years | 204 (2.0%) | 253 (2.5%) |
| 85 Years and over | 198 (1.9%) | 311 (3.1%) |
| Total | 10,298 (100.0%) | 10,153 (100.0%) |
Families and Households in Jay County
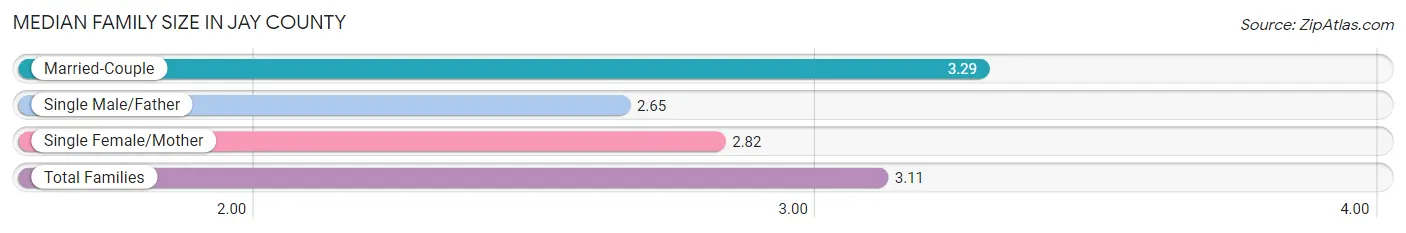
Median Family Size in Jay County
The median family size in Jay County is 3.11 persons per family, with married-couple families (3,509 | 68.4%) accounting for the largest median family size of 3.29 persons per family. On the other hand, single male/father families (844 | 16.5%) represent the smallest median family size with 2.65 persons per family.
| Family Type | # Families | Family Size |
| Married-Couple | 3,509 (68.4%) | 3.29 |
| Single Male/Father | 844 (16.5%) | 2.65 |
| Single Female/Mother | 777 (15.1%) | 2.82 |
| Total Families | 5,130 (100.0%) | 3.11 |
Median Household Size in Jay County
The median household size in Jay County is 2.50 persons per household, with married-couple households (3,509 | 43.4%) accounting for the largest median household size of 3.29 persons per household. non-family households (2,961 | 36.6%) represent the smallest median household size with 1.16 persons per household.

| Household Type | # Households | Household Size |
| Married-Couple | 3,509 (43.4%) | 3.29 |
| Single Male/Father | 844 (10.4%) | 3.24 |
| Single Female/Mother | 777 (9.6%) | 3.18 |
| Non-family | 2,961 (36.6%) | 1.16 |
| Total Households | 8,091 (100.0%) | 2.50 |
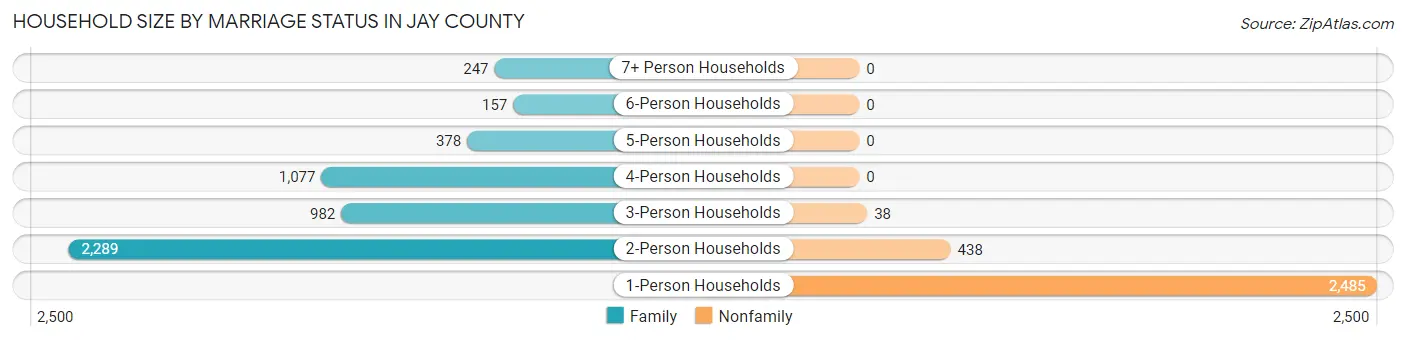
Household Size by Marriage Status in Jay County
Out of a total of 8,091 households in Jay County, 5,130 (63.4%) are family households, while 2,961 (36.6%) are nonfamily households. The most numerous type of family households are 2-person households, comprising 2,289, and the most common type of nonfamily households are 1-person households, comprising 2,485.
| Household Size | Family Households | Nonfamily Households |
| 1-Person Households | - | 2,485 (30.7%) |
| 2-Person Households | 2,289 (28.3%) | 438 (5.4%) |
| 3-Person Households | 982 (12.1%) | 38 (0.5%) |
| 4-Person Households | 1,077 (13.3%) | 0 (0.0%) |
| 5-Person Households | 378 (4.7%) | 0 (0.0%) |
| 6-Person Households | 157 (1.9%) | 0 (0.0%) |
| 7+ Person Households | 247 (3.0%) | 0 (0.0%) |
| Total | 5,130 (63.4%) | 2,961 (36.6%) |
Female Fertility in Jay County
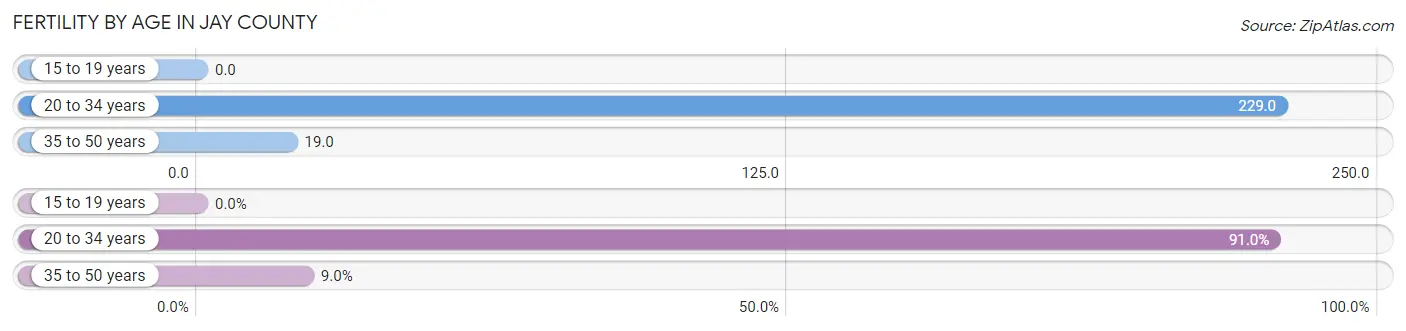
Fertility by Age in Jay County
Average fertility rate in Jay County is 97.0 births per 1,000 women. Women in the age bracket of 20 to 34 years have the highest fertility rate with 229.0 births per 1,000 women. Women in the age bracket of 20 to 34 years acount for 91.0% of all women with births.
| Age Bracket | Women with Births | Births / 1,000 Women |
| 15 to 19 years | 0 (0.0%) | 0.0 |
| 20 to 34 years | 375 (91.0%) | 229.0 |
| 35 to 50 years | 37 (9.0%) | 19.0 |
| Total | 412 (100.0%) | 97.0 |
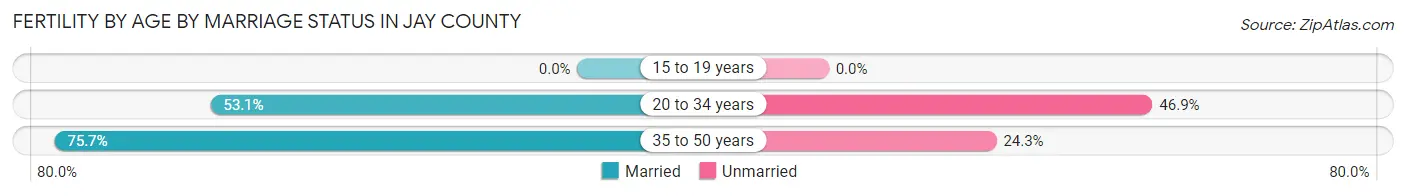
Fertility by Age by Marriage Status in Jay County
55.1% of women with births (412) in Jay County are married. The highest percentage of unmarried women with births falls into 20 to 34 years age bracket with 46.9% of them unmarried at the time of birth, while the lowest percentage of unmarried women with births belong to 35 to 50 years age bracket with 24.3% of them unmarried.
| Age Bracket | Married | Unmarried |
| 15 to 19 years | 0 (0.0%) | 0 (0.0%) |
| 20 to 34 years | 199 (53.1%) | 176 (46.9%) |
| 35 to 50 years | 28 (75.7%) | 9 (24.3%) |
| Total | 227 (55.1%) | 185 (44.9%) |
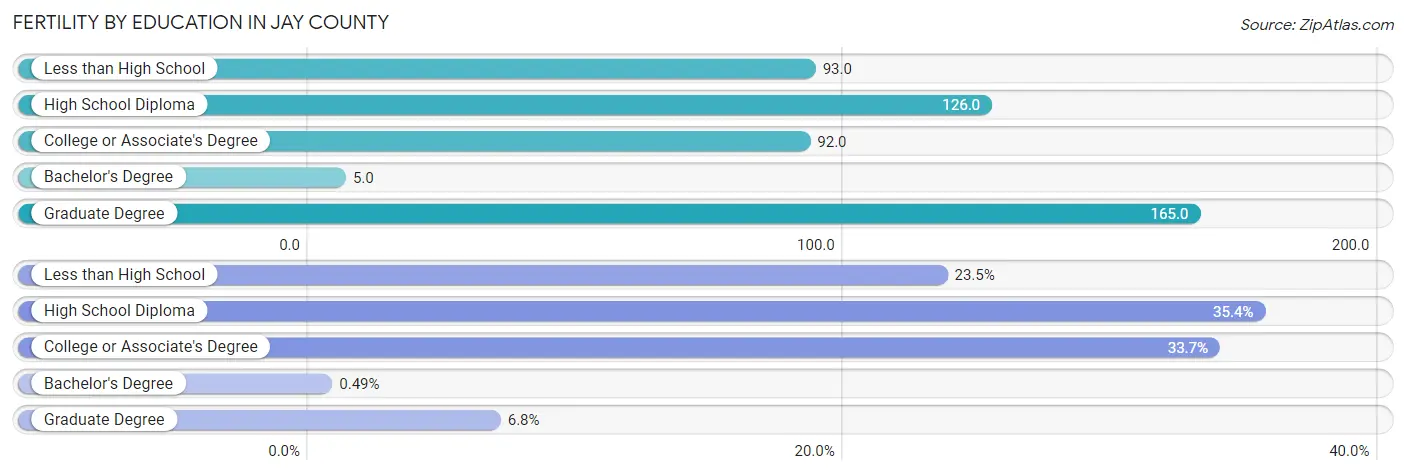
Fertility by Education in Jay County
Average fertility rate in Jay County is 97.0 births per 1,000 women. Women with the education attainment of graduate degree have the highest fertility rate of 165.0 births per 1,000 women, while women with the education attainment of bachelor's degree have the lowest fertility at 5.0 births per 1,000 women. Women with the education attainment of high school diploma represent 35.4% of all women with births.
| Educational Attainment | Women with Births | Births / 1,000 Women |
| Less than High School | 97 (23.5%) | 93.0 |
| High School Diploma | 146 (35.4%) | 126.0 |
| College or Associate's Degree | 139 (33.7%) | 92.0 |
| Bachelor's Degree | 2 (0.5%) | 5.0 |
| Graduate Degree | 28 (6.8%) | 165.0 |
| Total | 412 (100.0%) | 97.0 |
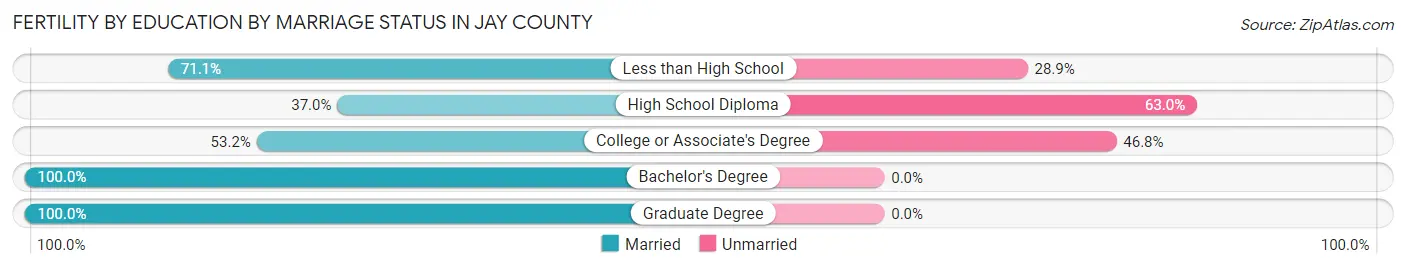
Fertility by Education by Marriage Status in Jay County
44.9% of women with births in Jay County are unmarried. Women with the educational attainment of bachelor's degree are most likely to be married with 100.0% of them married at childbirth, while women with the educational attainment of high school diploma are least likely to be married with 63.0% of them unmarried at childbirth.
| Educational Attainment | Married | Unmarried |
| Less than High School | 69 (71.1%) | 28 (28.9%) |
| High School Diploma | 54 (37.0%) | 92 (63.0%) |
| College or Associate's Degree | 74 (53.2%) | 65 (46.8%) |
| Bachelor's Degree | 2 (100.0%) | 0 (0.0%) |
| Graduate Degree | 28 (100.0%) | 0 (0.0%) |
| Total | 227 (55.1%) | 185 (44.9%) |
Income in Jay County
Income Overview in Jay County
Per Capita Income in Jay County is $27,794, while median incomes of families and households are $65,719 and $52,231 respectively.
| Characteristic | Number | Measure |
| Per Capita Income | 20,451 | $27,794 |
| Median Family Income | 5,130 | $65,719 |
| Mean Family Income | 5,130 | $84,945 |
| Median Household Income | 8,091 | $52,231 |
| Mean Household Income | 8,091 | $71,116 |
| Income Deficit | 5,130 | $13,344 |
| Wage / Income Gap (%) | 20,451 | 37.31% |
| Wage / Income Gap ($) | 20,451 | 62.69¢ per $1 |
| Gini / Inequality Index | 20,451 | 0.44 |
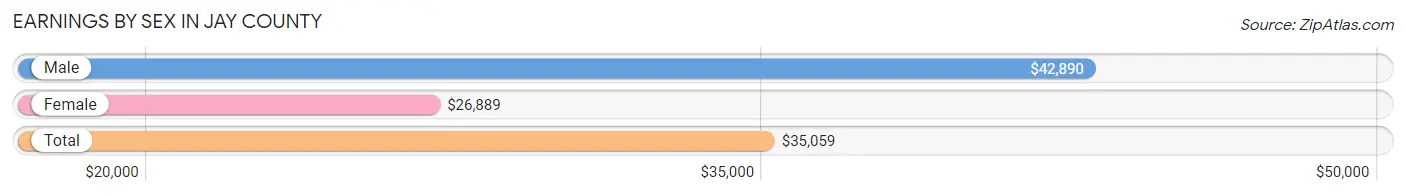
Earnings by Sex in Jay County
Average Earnings in Jay County are $35,059, $42,890 for men and $26,889 for women, a difference of 37.3%.
| Sex | Number | Average Earnings |
| Male | 5,663 (55.9%) | $42,890 |
| Female | 4,469 (44.1%) | $26,889 |
| Total | 10,132 (100.0%) | $35,059 |
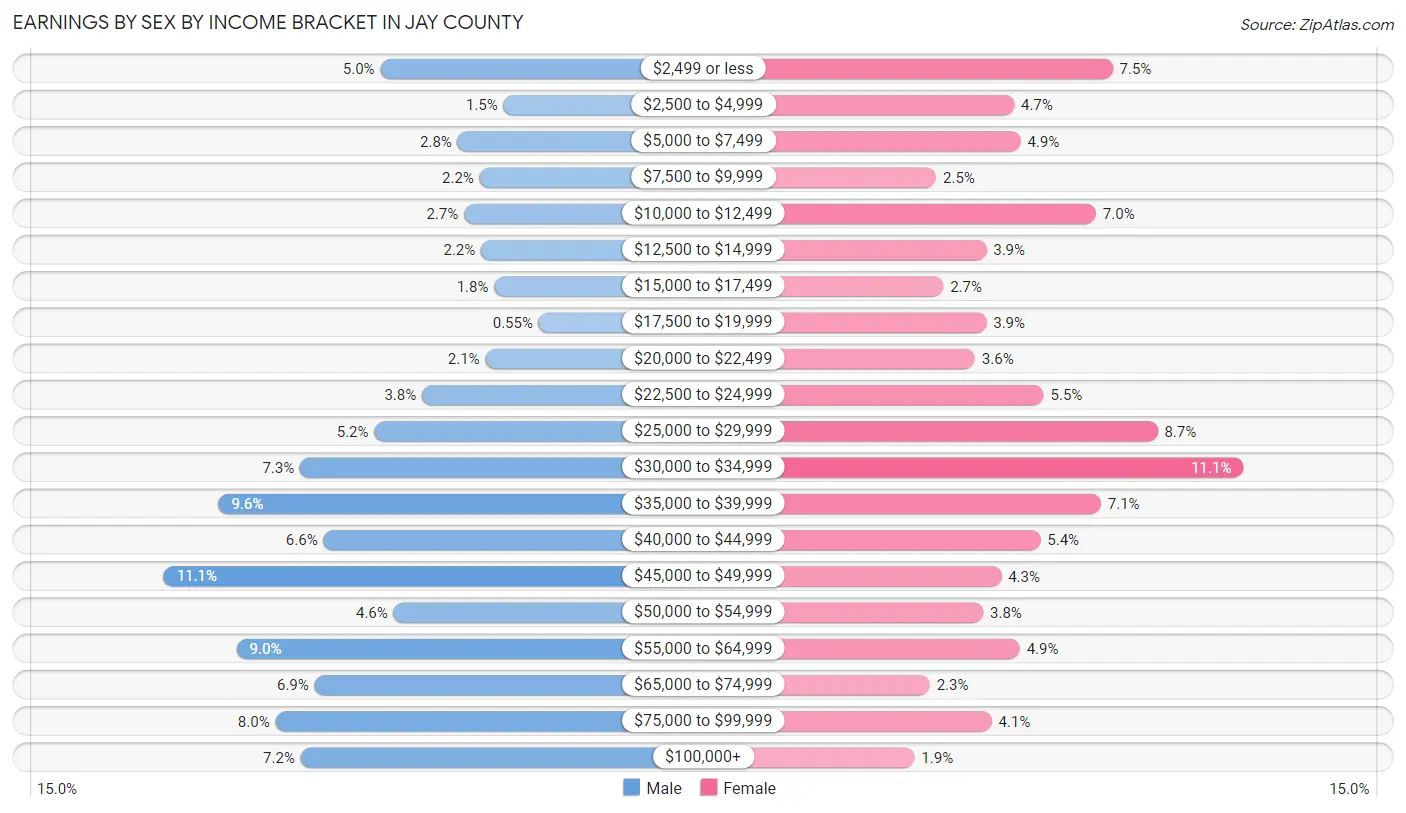
Earnings by Sex by Income Bracket in Jay County
The most common earnings brackets in Jay County are $45,000 to $49,999 for men (628 | 11.1%) and $30,000 to $34,999 for women (498 | 11.1%).
| Income | Male | Female |
| $2,499 or less | 283 (5.0%) | 334 (7.5%) |
| $2,500 to $4,999 | 87 (1.5%) | 210 (4.7%) |
| $5,000 to $7,499 | 160 (2.8%) | 218 (4.9%) |
| $7,500 to $9,999 | 125 (2.2%) | 112 (2.5%) |
| $10,000 to $12,499 | 150 (2.6%) | 313 (7.0%) |
| $12,500 to $14,999 | 123 (2.2%) | 175 (3.9%) |
| $15,000 to $17,499 | 102 (1.8%) | 121 (2.7%) |
| $17,500 to $19,999 | 31 (0.5%) | 175 (3.9%) |
| $20,000 to $22,499 | 116 (2.1%) | 161 (3.6%) |
| $22,500 to $24,999 | 217 (3.8%) | 247 (5.5%) |
| $25,000 to $29,999 | 293 (5.2%) | 390 (8.7%) |
| $30,000 to $34,999 | 411 (7.3%) | 498 (11.1%) |
| $35,000 to $39,999 | 541 (9.6%) | 319 (7.1%) |
| $40,000 to $44,999 | 374 (6.6%) | 243 (5.4%) |
| $45,000 to $49,999 | 628 (11.1%) | 194 (4.3%) |
| $50,000 to $54,999 | 262 (4.6%) | 171 (3.8%) |
| $55,000 to $64,999 | 512 (9.0%) | 217 (4.9%) |
| $65,000 to $74,999 | 388 (6.9%) | 104 (2.3%) |
| $75,000 to $99,999 | 450 (8.0%) | 182 (4.1%) |
| $100,000+ | 410 (7.2%) | 85 (1.9%) |
| Total | 5,663 (100.0%) | 4,469 (100.0%) |
Earnings by Sex by Educational Attainment in Jay County
Average earnings in Jay County are $46,148 for men and $30,758 for women, a difference of 33.4%. Men with an educational attainment of graduate degree enjoy the highest average annual earnings of $71,653, while those with less than high school education earn the least with $34,777. Women with an educational attainment of graduate degree earn the most with the average annual earnings of $60,344, while those with high school diploma education have the smallest earnings of $23,682.

| Educational Attainment | Male Income | Female Income |
| Less than High School | $34,777 | $30,417 |
| High School Diploma | $44,161 | $23,682 |
| College or Associate's Degree | $48,108 | $29,509 |
| Bachelor's Degree | $59,821 | $50,865 |
| Graduate Degree | $71,653 | $60,344 |
| Total | $46,148 | $30,758 |
Family Income in Jay County
Family Income Brackets in Jay County
According to the Jay County family income data, there are 1,108 families falling into the $50,000 to $74,999 income range, which is the most common income bracket and makes up 21.6% of all families. Conversely, the $10,000 to $14,999 income bracket is the least frequent group with only 77 families (1.5%) belonging to this category.

| Income Bracket | # Families | % Families |
| Less than $10,000 | 180 | 3.5% |
| $10,000 to $14,999 | 77 | 1.5% |
| $15,000 to $24,999 | 303 | 5.9% |
| $25,000 to $34,999 | 323 | 6.3% |
| $35,000 to $49,999 | 898 | 17.5% |
| $50,000 to $74,999 | 1,108 | 21.6% |
| $75,000 to $99,999 | 908 | 17.7% |
| $100,000 to $149,999 | 882 | 17.2% |
| $150,000 to $199,999 | 298 | 5.8% |
| $200,000+ | 154 | 3.0% |
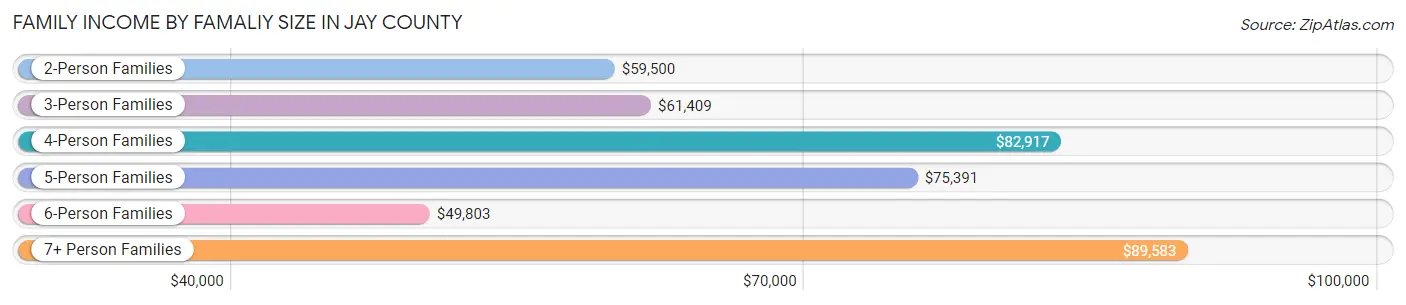
Family Income by Famaliy Size in Jay County
7+ person families (213 | 4.2%) account for the highest median family income in Jay County with $89,583 per family, while 2-person families (2,476 | 48.3%) have the highest median income of $29,750 per family member.
| Income Bracket | # Families | Median Income |
| 2-Person Families | 2,476 (48.3%) | $59,500 |
| 3-Person Families | 1,130 (22.0%) | $61,409 |
| 4-Person Families | 855 (16.7%) | $82,917 |
| 5-Person Families | 313 (6.1%) | $75,391 |
| 6-Person Families | 143 (2.8%) | $49,803 |
| 7+ Person Families | 213 (4.2%) | $89,583 |
| Total | 5,130 (100.0%) | $65,719 |
Family Income by Number of Earners in Jay County
The median family income in Jay County is $65,719, with families comprising 3+ earners (590) having the highest median family income of $110,833, while families with no earners (881) have the lowest median family income of $39,269, accounting for 11.5% and 17.2% of families, respectively.

| Number of Earners | # Families | Median Income |
| No Earners | 881 (17.2%) | $39,269 |
| 1 Earner | 1,786 (34.8%) | $51,228 |
| 2 Earners | 1,873 (36.5%) | $90,352 |
| 3+ Earners | 590 (11.5%) | $110,833 |
| Total | 5,130 (100.0%) | $65,719 |
Household Income in Jay County
Household Income Brackets in Jay County
With 1,707 households falling in the category, the $50,000 to $74,999 income range is the most frequent in Jay County, accounting for 21.1% of all households. In contrast, only 210 households (2.6%) fall into the $200,000+ income bracket, making it the least populous group.
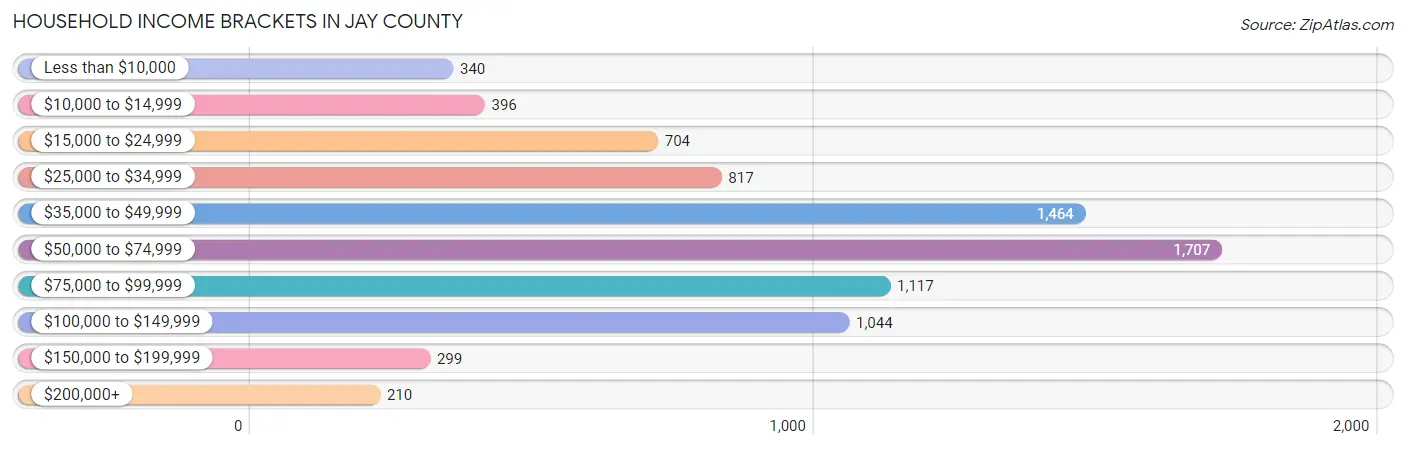
| Income Bracket | # Households | % Households |
| Less than $10,000 | 340 | 4.2% |
| $10,000 to $14,999 | 396 | 4.9% |
| $15,000 to $24,999 | 704 | 8.7% |
| $25,000 to $34,999 | 817 | 10.1% |
| $35,000 to $49,999 | 1,464 | 18.1% |
| $50,000 to $74,999 | 1,707 | 21.1% |
| $75,000 to $99,999 | 1,117 | 13.8% |
| $100,000 to $149,999 | 1,044 | 12.9% |
| $150,000 to $199,999 | 299 | 3.7% |
| $200,000+ | 210 | 2.6% |
Household Income by Householder Age in Jay County
The median household income in Jay County is $52,231, with the highest median household income of $64,544 found in the 45 to 64 years age bracket for the primary householder. A total of 3,193 households (39.5%) fall into this category. Meanwhile, the 15 to 24 years age bracket for the primary householder has the lowest median household income of $40,078, with 279 households (3.5%) in this group.
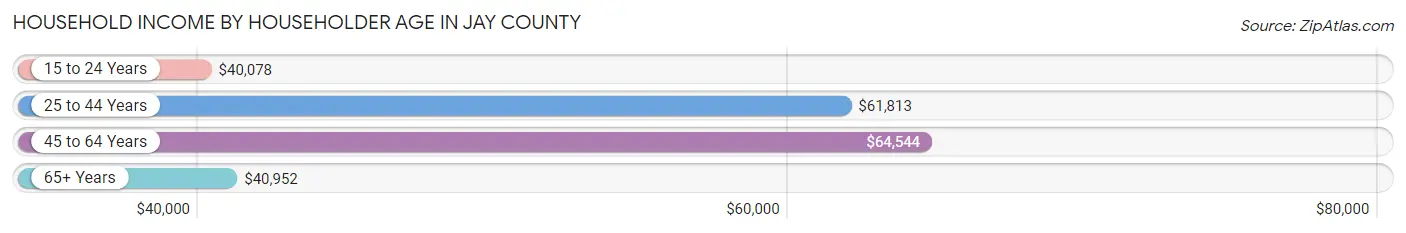
| Income Bracket | # Households | Median Income |
| 15 to 24 Years | 279 (3.5%) | $40,078 |
| 25 to 44 Years | 2,273 (28.1%) | $61,813 |
| 45 to 64 Years | 3,193 (39.5%) | $64,544 |
| 65+ Years | 2,346 (29.0%) | $40,952 |
| Total | 8,091 (100.0%) | $52,231 |
Poverty in Jay County
Income Below Poverty by Sex and Age in Jay County
With 9.8% poverty level for males and 17.3% for females among the residents of Jay County, 5 year old males and 5 year old females are the most vulnerable to poverty, with 121 males (63.7%) and 49 females (61.3%) in their respective age groups living below the poverty level.
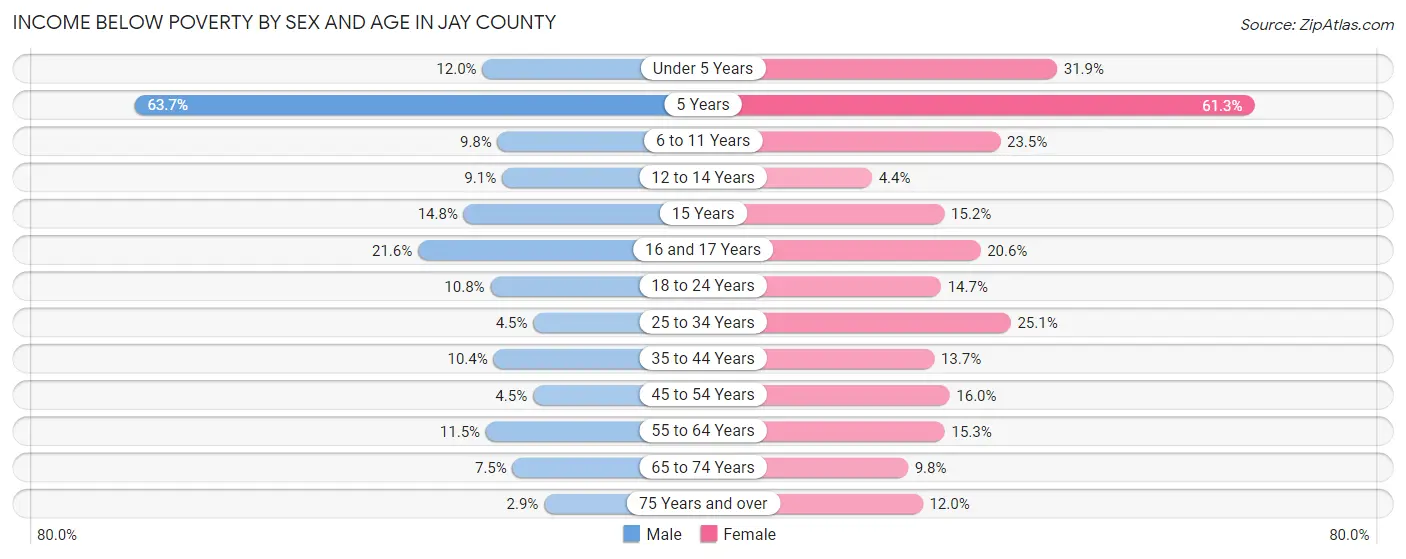
| Age Bracket | Male | Female |
| Under 5 Years | 88 (12.0%) | 234 (31.9%) |
| 5 Years | 121 (63.7%) | 49 (61.3%) |
| 6 to 11 Years | 85 (9.8%) | 200 (23.5%) |
| 12 to 14 Years | 38 (9.1%) | 18 (4.4%) |
| 15 Years | 21 (14.8%) | 24 (15.2%) |
| 16 and 17 Years | 63 (21.6%) | 52 (20.5%) |
| 18 to 24 Years | 93 (10.8%) | 115 (14.7%) |
| 25 to 34 Years | 53 (4.5%) | 265 (25.1%) |
| 35 to 44 Years | 121 (10.4%) | 148 (13.7%) |
| 45 to 54 Years | 57 (4.5%) | 211 (16.0%) |
| 55 to 64 Years | 164 (11.5%) | 201 (15.3%) |
| 65 to 74 Years | 78 (7.5%) | 109 (9.8%) |
| 75 Years and over | 17 (2.9%) | 100 (12.0%) |
| Total | 999 (9.8%) | 1,726 (17.3%) |
Income Above Poverty by Sex and Age in Jay County
According to the poverty statistics in Jay County, males aged 75 years and over and females aged 12 to 14 years are the age groups that are most secure financially, with 97.2% of males and 95.6% of females in these age groups living above the poverty line.
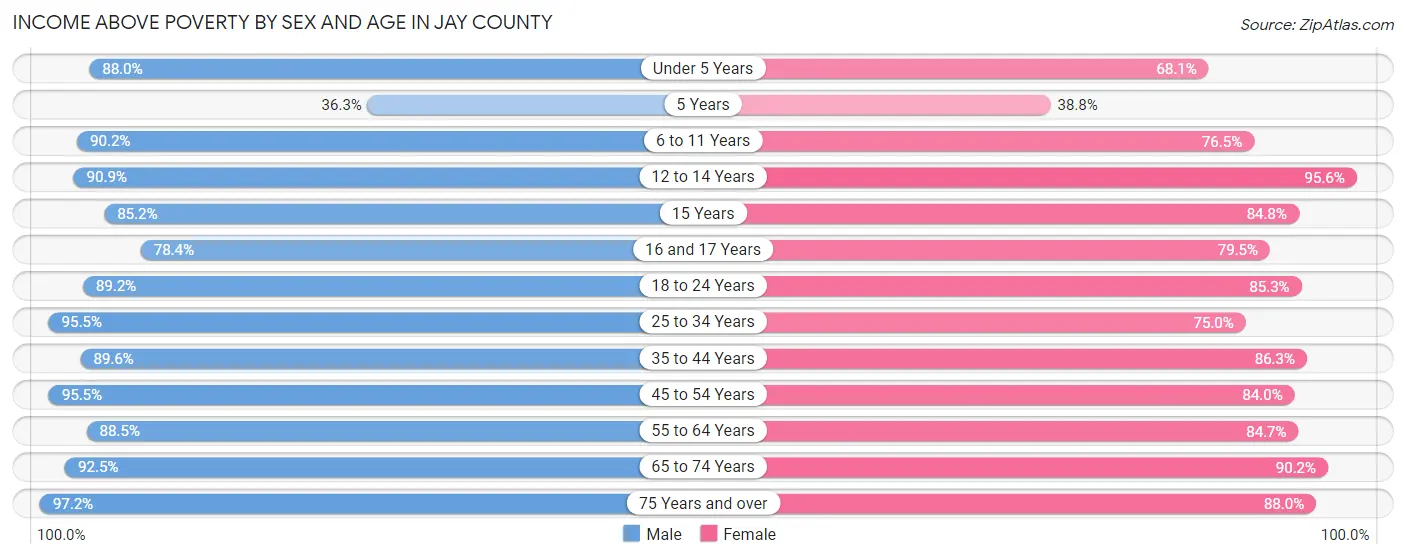
| Age Bracket | Male | Female |
| Under 5 Years | 644 (88.0%) | 499 (68.1%) |
| 5 Years | 69 (36.3%) | 31 (38.8%) |
| 6 to 11 Years | 786 (90.2%) | 651 (76.5%) |
| 12 to 14 Years | 379 (90.9%) | 387 (95.6%) |
| 15 Years | 121 (85.2%) | 134 (84.8%) |
| 16 and 17 Years | 229 (78.4%) | 201 (79.4%) |
| 18 to 24 Years | 766 (89.2%) | 668 (85.3%) |
| 25 to 34 Years | 1,135 (95.5%) | 793 (75.0%) |
| 35 to 44 Years | 1,046 (89.6%) | 933 (86.3%) |
| 45 to 54 Years | 1,208 (95.5%) | 1,110 (84.0%) |
| 55 to 64 Years | 1,262 (88.5%) | 1,116 (84.7%) |
| 65 to 74 Years | 958 (92.5%) | 1,004 (90.2%) |
| 75 Years and over | 580 (97.2%) | 735 (88.0%) |
| Total | 9,183 (90.2%) | 8,262 (82.7%) |
Income Below Poverty Among Married-Couple Families in Jay County
The poverty statistics for married-couple families in Jay County show that 3.8% or 134 of the total 3,509 families live below the poverty line. Families with 3 or 4 children have the highest poverty rate of 20.8%, comprising of 71 families. On the other hand, families with 5 or more children have the lowest poverty rate of 0.0%, which includes 0 families.
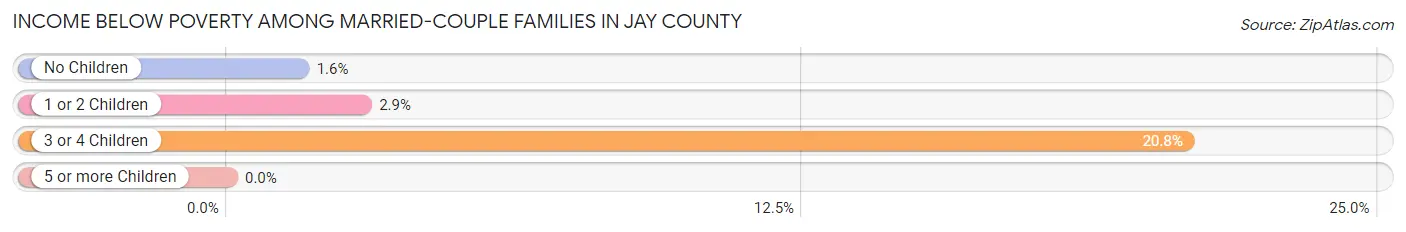
| Children | Above Poverty | Below Poverty |
| No Children | 2,087 (98.4%) | 33 (1.6%) |
| 1 or 2 Children | 996 (97.1%) | 30 (2.9%) |
| 3 or 4 Children | 270 (79.2%) | 71 (20.8%) |
| 5 or more Children | 22 (100.0%) | 0 (0.0%) |
| Total | 3,375 (96.2%) | 134 (3.8%) |
Income Below Poverty Among Single-Parent Households in Jay County
According to the poverty data in Jay County, 11.7% or 99 single-father households and 29.1% or 226 single-mother households are living below the poverty line. Among single-father households, those with 5 or more children have the highest poverty rate, with 4 households (80.0%) experiencing poverty. Likewise, among single-mother households, those with 5 or more children have the highest poverty rate, with 11 households (100.0%) falling below the poverty line.

| Children | Single Father | Single Mother |
| No Children | 8 (2.4%) | 13 (5.1%) |
| 1 or 2 Children | 74 (18.3%) | 177 (37.4%) |
| 3 or 4 Children | 13 (13.1%) | 25 (64.1%) |
| 5 or more Children | 4 (80.0%) | 11 (100.0%) |
| Total | 99 (11.7%) | 226 (29.1%) |
Income Below Poverty Among Married-Couple vs Single-Parent Households in Jay County
The poverty data for Jay County shows that 134 of the married-couple family households (3.8%) and 325 of the single-parent households (20.1%) are living below the poverty level. Within the married-couple family households, those with 3 or 4 children have the highest poverty rate, with 71 households (20.8%) falling below the poverty line. Among the single-parent households, those with 5 or more children have the highest poverty rate, with 15 household (93.8%) living below poverty.
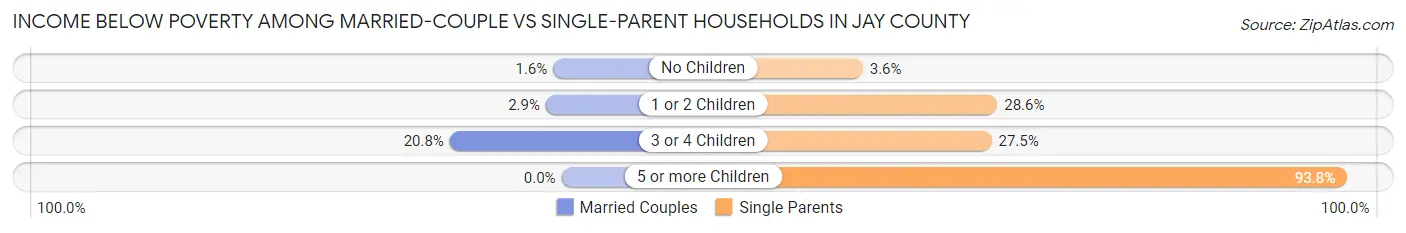
| Children | Married-Couple Families | Single-Parent Households |
| No Children | 33 (1.6%) | 21 (3.6%) |
| 1 or 2 Children | 30 (2.9%) | 251 (28.6%) |
| 3 or 4 Children | 71 (20.8%) | 38 (27.5%) |
| 5 or more Children | 0 (0.0%) | 15 (93.8%) |
| Total | 134 (3.8%) | 325 (20.1%) |
Employment Characteristics in Jay County
Employment by Class of Employer in Jay County
Among the 8,776 employed individuals in Jay County, private company employees (6,416 | 73.1%), local government employees (683 | 7.8%), and self-employed (not incorporated) (561 | 6.4%) make up the most common classes of employment.
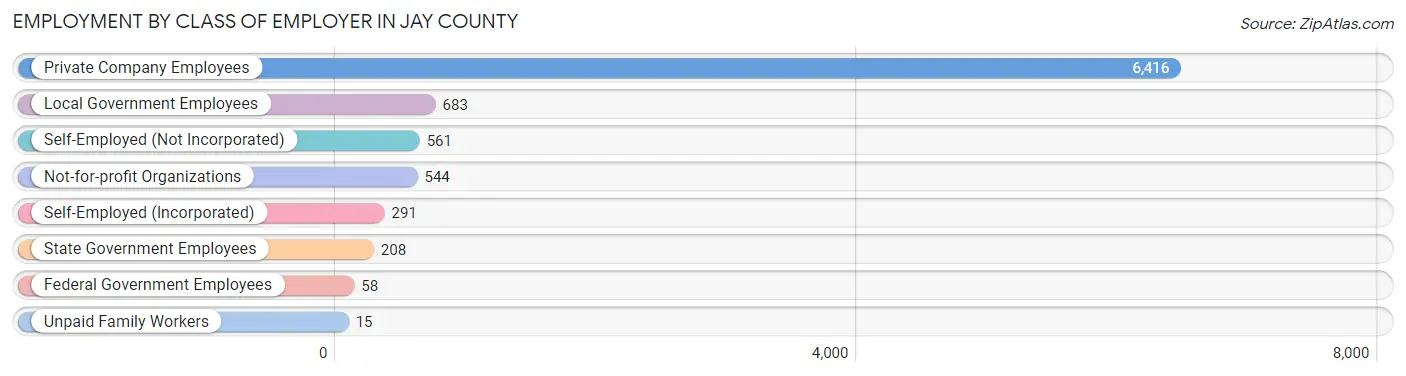
| Employer Class | # Employees | % Employees |
| Private Company Employees | 6,416 | 73.1% |
| Self-Employed (Incorporated) | 291 | 3.3% |
| Self-Employed (Not Incorporated) | 561 | 6.4% |
| Not-for-profit Organizations | 544 | 6.2% |
| Local Government Employees | 683 | 7.8% |
| State Government Employees | 208 | 2.4% |
| Federal Government Employees | 58 | 0.7% |
| Unpaid Family Workers | 15 | 0.2% |
| Total | 8,776 | 100.0% |
Employment Status by Age in Jay County
According to the labor force statistics for Jay County, out of the total population over 16 years of age (15,783), 60.6% or 9,564 individuals are in the labor force, with 4.4% or 421 of them unemployed. The age group with the highest labor force participation rate is 30 to 34 years, with 90.3% or 963 individuals in the labor force. Within the labor force, the 16 to 19 years age range has the highest percentage of unemployed individuals, with 24.5% or 133 of them being unemployed.
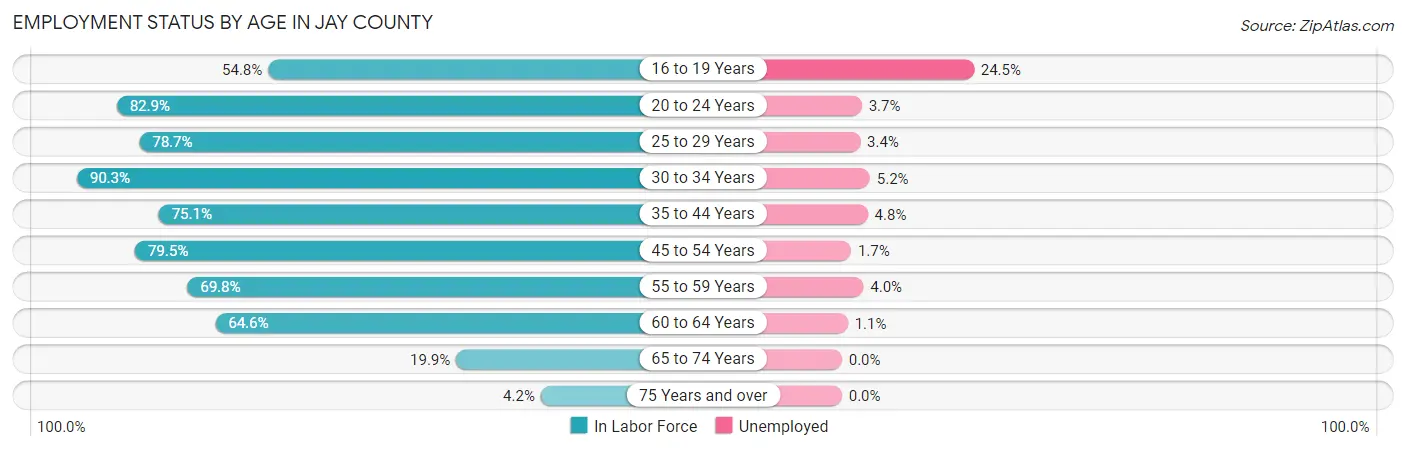
| Age Bracket | In Labor Force | Unemployed |
| 16 to 19 Years | 543 (54.8%) | 133 (24.5%) |
| 20 to 24 Years | 997 (82.9%) | 37 (3.7%) |
| 25 to 29 Years | 943 (78.7%) | 32 (3.4%) |
| 30 to 34 Years | 963 (90.3%) | 50 (5.2%) |
| 35 to 44 Years | 1,707 (75.1%) | 82 (4.8%) |
| 45 to 54 Years | 2,066 (79.5%) | 35 (1.7%) |
| 55 to 59 Years | 1,025 (69.8%) | 41 (4.0%) |
| 60 to 64 Years | 826 (64.6%) | 9 (1.1%) |
| 65 to 74 Years | 432 (19.9%) | 0 (0.0%) |
| 75 Years and over | 65 (4.2%) | 0 (0.0%) |
| Total | 9,564 (60.6%) | 421 (4.4%) |
Employment Status by Educational Attainment in Jay County
According to labor force statistics for Jay County, 76.2% of individuals (7,531) out of the total population between 25 and 64 years of age (9,883) are in the labor force, with 3.3% or 249 of them being unemployed. The group with the highest labor force participation rate are those with the educational attainment of bachelor's degree or higher, with 90.7% or 1,224 individuals in the labor force. Within the labor force, individuals with less than high school education have the highest percentage of unemployment, with 9.8% or 55 of them being unemployed.
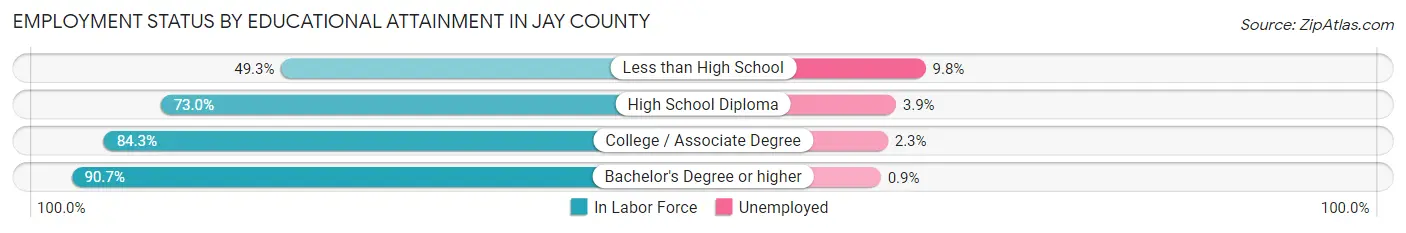
| Educational Attainment | In Labor Force | Unemployed |
| Less than High School | 559 (49.3%) | 111 (9.8%) |
| High School Diploma | 3,165 (73.0%) | 169 (3.9%) |
| College / Associate Degree | 2,585 (84.3%) | 71 (2.3%) |
| Bachelor's Degree or higher | 1,224 (90.7%) | 12 (0.9%) |
| Total | 7,531 (76.2%) | 326 (3.3%) |
Employment Occupations by Sex in Jay County
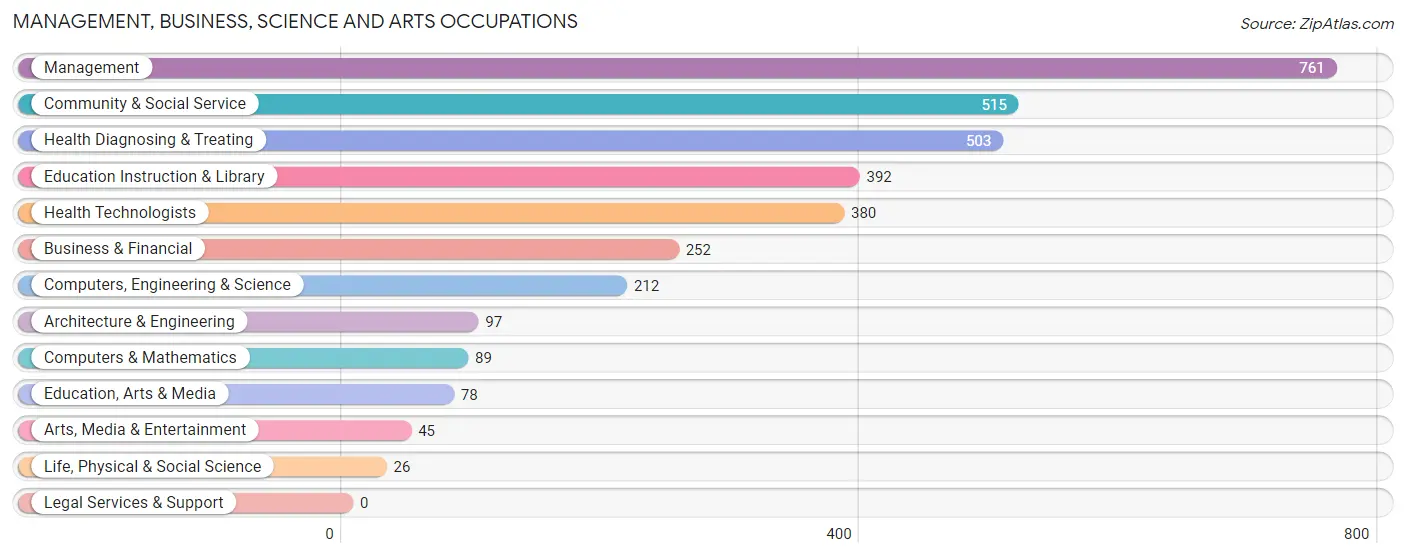
Management, Business, Science and Arts Occupations
The most common Management, Business, Science and Arts occupations in Jay County are Management (761 | 8.3%), Community & Social Service (515 | 5.6%), Health Diagnosing & Treating (503 | 5.5%), Education Instruction & Library (392 | 4.3%), and Health Technologists (380 | 4.2%).
Management, Business, Science and Arts Occupations by Sex
Within the Management, Business, Science and Arts occupations in Jay County, the most male-oriented occupations are Computers & Mathematics (91.0%), Architecture & Engineering (76.3%), and Computers, Engineering & Science (73.1%), while the most female-oriented occupations are Life, Physical & Social Science (100.0%), Health Diagnosing & Treating (79.5%), and Health Technologists (75.8%).

| Occupation | Male | Female |
| Management | 534 (70.2%) | 227 (29.8%) |
| Business & Financial | 111 (44.1%) | 141 (55.9%) |
| Computers, Engineering & Science | 155 (73.1%) | 57 (26.9%) |
| Computers & Mathematics | 81 (91.0%) | 8 (9.0%) |
| Architecture & Engineering | 74 (76.3%) | 23 (23.7%) |
| Life, Physical & Social Science | 0 (0.0%) | 26 (100.0%) |
| Community & Social Service | 178 (34.6%) | 337 (65.4%) |
| Education, Arts & Media | 35 (44.9%) | 43 (55.1%) |
| Legal Services & Support | 0 (0.0%) | 0 (0.0%) |
| Education Instruction & Library | 123 (31.4%) | 269 (68.6%) |
| Arts, Media & Entertainment | 20 (44.4%) | 25 (55.6%) |
| Health Diagnosing & Treating | 103 (20.5%) | 400 (79.5%) |
| Health Technologists | 92 (24.2%) | 288 (75.8%) |
| Total (Category) | 1,081 (48.2%) | 1,162 (51.8%) |
| Total (Overall) | 5,313 (58.1%) | 3,836 (41.9%) |
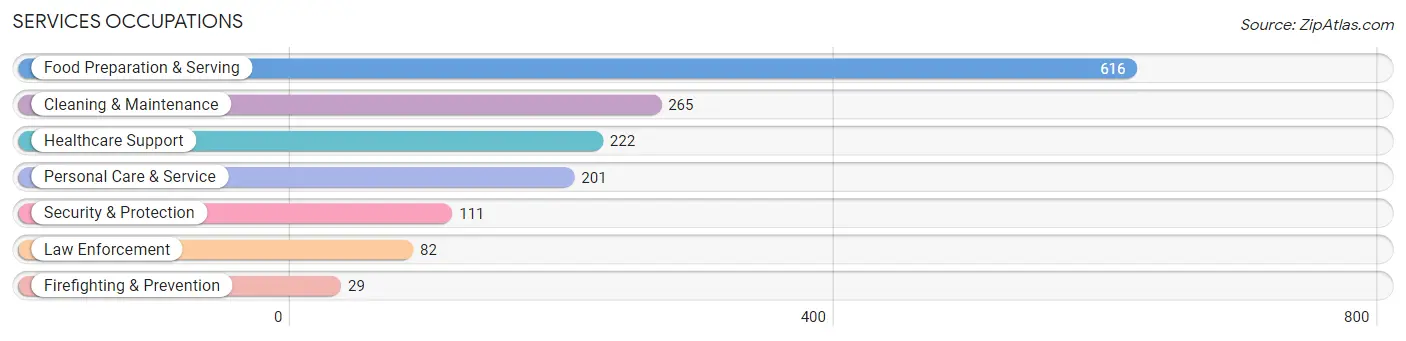
Services Occupations
The most common Services occupations in Jay County are Food Preparation & Serving (616 | 6.7%), Cleaning & Maintenance (265 | 2.9%), Healthcare Support (222 | 2.4%), Personal Care & Service (201 | 2.2%), and Security & Protection (111 | 1.2%).
Services Occupations by Sex
Within the Services occupations in Jay County, the most male-oriented occupations are Security & Protection (100.0%), Firefighting & Prevention (100.0%), and Law Enforcement (100.0%), while the most female-oriented occupations are Personal Care & Service (89.5%), Food Preparation & Serving (73.9%), and Healthcare Support (55.9%).
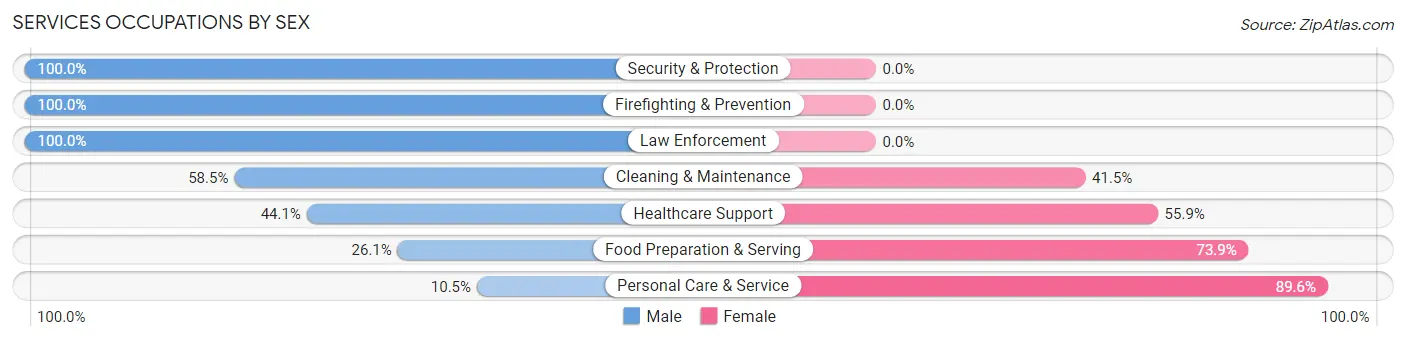
| Occupation | Male | Female |
| Healthcare Support | 98 (44.1%) | 124 (55.9%) |
| Security & Protection | 111 (100.0%) | 0 (0.0%) |
| Firefighting & Prevention | 29 (100.0%) | 0 (0.0%) |
| Law Enforcement | 82 (100.0%) | 0 (0.0%) |
| Food Preparation & Serving | 161 (26.1%) | 455 (73.9%) |
| Cleaning & Maintenance | 155 (58.5%) | 110 (41.5%) |
| Personal Care & Service | 21 (10.4%) | 180 (89.5%) |
| Total (Category) | 546 (38.6%) | 869 (61.4%) |
| Total (Overall) | 5,313 (58.1%) | 3,836 (41.9%) |
Sales and Office Occupations
The most common Sales and Office occupations in Jay County are Office & Administration (827 | 9.0%), and Sales & Related (615 | 6.7%).

Sales and Office Occupations by Sex
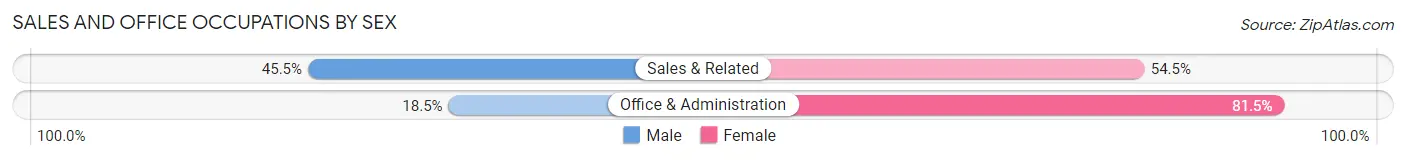
| Occupation | Male | Female |
| Sales & Related | 280 (45.5%) | 335 (54.5%) |
| Office & Administration | 153 (18.5%) | 674 (81.5%) |
| Total (Category) | 433 (30.0%) | 1,009 (70.0%) |
| Total (Overall) | 5,313 (58.1%) | 3,836 (41.9%) |
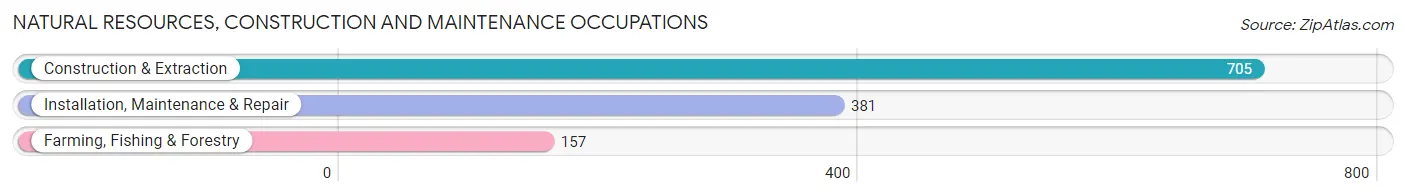
Natural Resources, Construction and Maintenance Occupations
The most common Natural Resources, Construction and Maintenance occupations in Jay County are Construction & Extraction (705 | 7.7%), Installation, Maintenance & Repair (381 | 4.2%), and Farming, Fishing & Forestry (157 | 1.7%).
Natural Resources, Construction and Maintenance Occupations by Sex
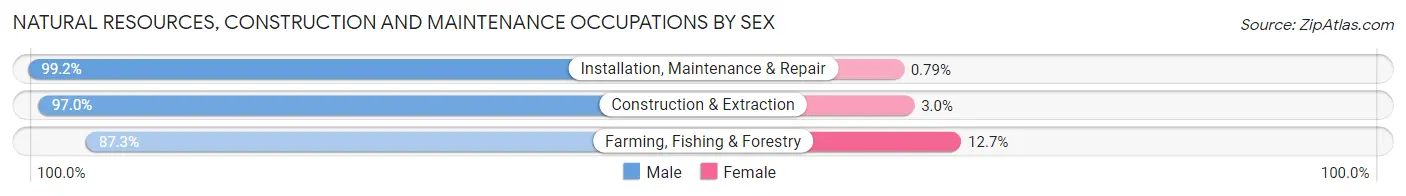
| Occupation | Male | Female |
| Farming, Fishing & Forestry | 137 (87.3%) | 20 (12.7%) |
| Construction & Extraction | 684 (97.0%) | 21 (3.0%) |
| Installation, Maintenance & Repair | 378 (99.2%) | 3 (0.8%) |
| Total (Category) | 1,199 (96.5%) | 44 (3.5%) |
| Total (Overall) | 5,313 (58.1%) | 3,836 (41.9%) |
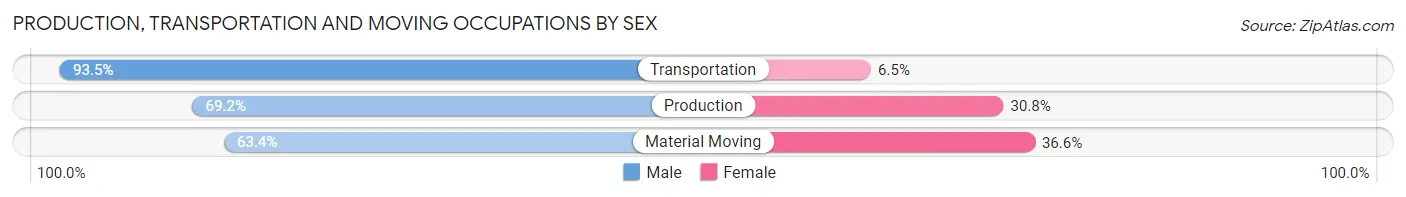
Production, Transportation and Moving Occupations
The most common Production, Transportation and Moving occupations in Jay County are Production (1,492 | 16.3%), Material Moving (686 | 7.5%), and Transportation (628 | 6.9%).
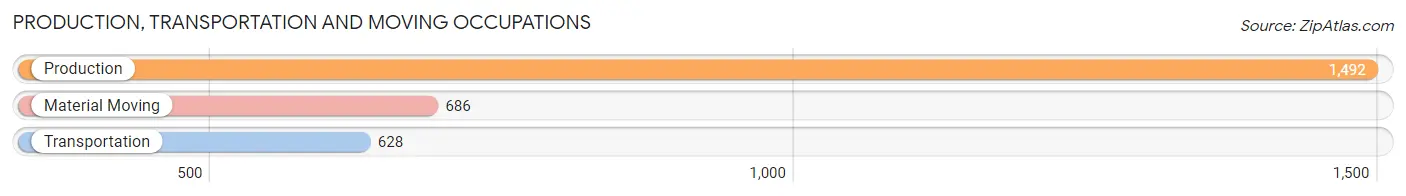
Production, Transportation and Moving Occupations by Sex
| Occupation | Male | Female |
| Production | 1,032 (69.2%) | 460 (30.8%) |
| Transportation | 587 (93.5%) | 41 (6.5%) |
| Material Moving | 435 (63.4%) | 251 (36.6%) |
| Total (Category) | 2,054 (73.2%) | 752 (26.8%) |
| Total (Overall) | 5,313 (58.1%) | 3,836 (41.9%) |
Employment Industries by Sex in Jay County
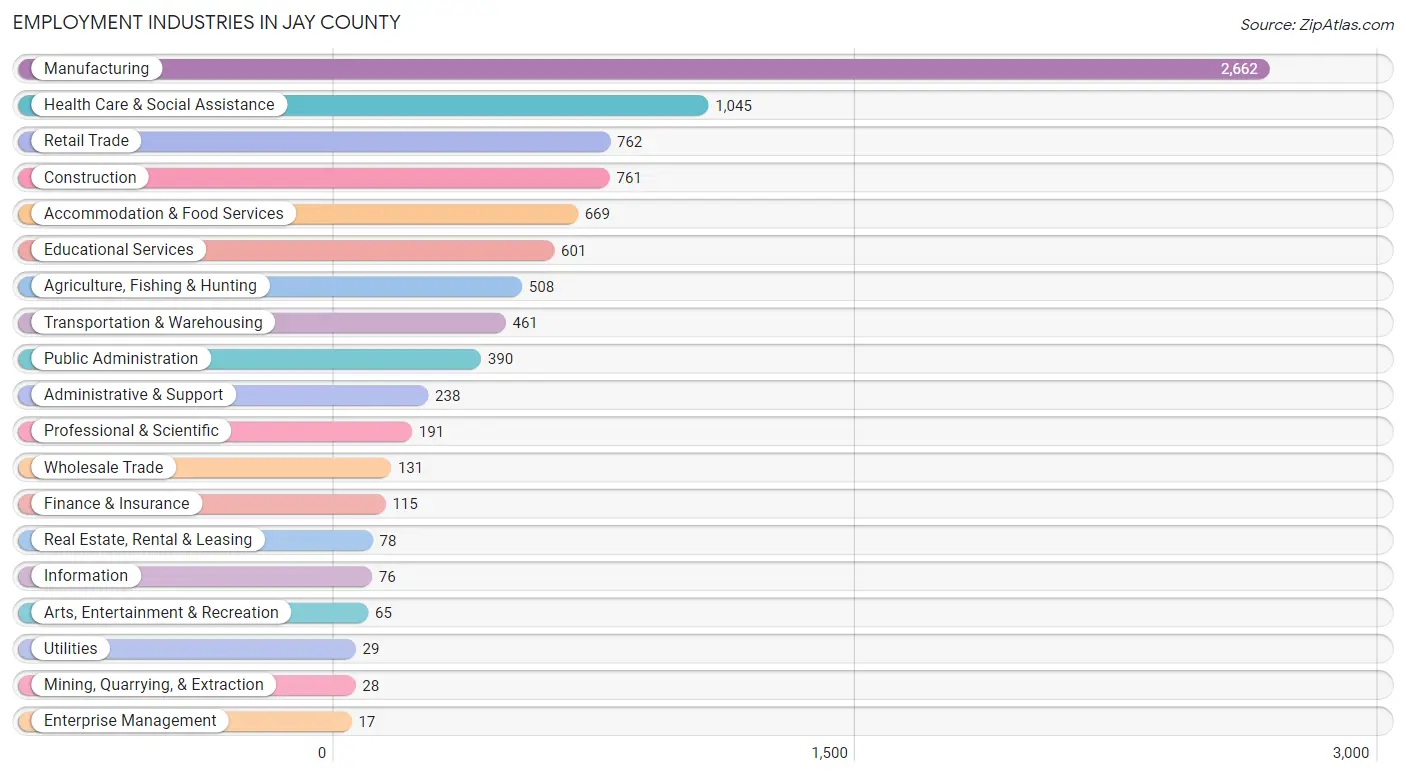
Employment Industries in Jay County
The major employment industries in Jay County include Manufacturing (2,662 | 29.1%), Health Care & Social Assistance (1,045 | 11.4%), Retail Trade (762 | 8.3%), Construction (761 | 8.3%), and Accommodation & Food Services (669 | 7.3%).
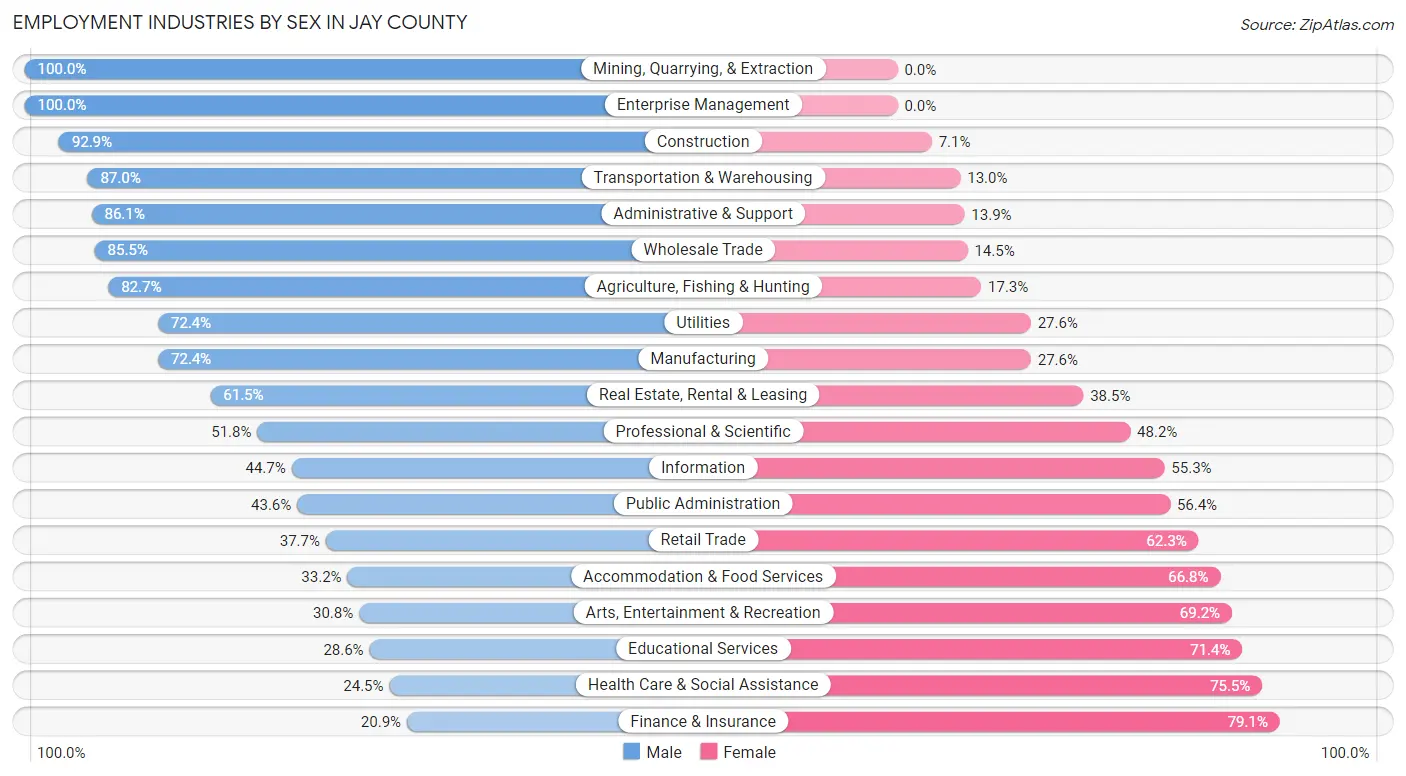
Employment Industries by Sex in Jay County
The Jay County industries that see more men than women are Mining, Quarrying, & Extraction (100.0%), Enterprise Management (100.0%), and Construction (92.9%), whereas the industries that tend to have a higher number of women are Finance & Insurance (79.1%), Health Care & Social Assistance (75.5%), and Educational Services (71.4%).
| Industry | Male | Female |
| Agriculture, Fishing & Hunting | 420 (82.7%) | 88 (17.3%) |
| Mining, Quarrying, & Extraction | 28 (100.0%) | 0 (0.0%) |
| Construction | 707 (92.9%) | 54 (7.1%) |
| Manufacturing | 1,927 (72.4%) | 735 (27.6%) |
| Wholesale Trade | 112 (85.5%) | 19 (14.5%) |
| Retail Trade | 287 (37.7%) | 475 (62.3%) |
| Transportation & Warehousing | 401 (87.0%) | 60 (13.0%) |
| Utilities | 21 (72.4%) | 8 (27.6%) |
| Information | 34 (44.7%) | 42 (55.3%) |
| Finance & Insurance | 24 (20.9%) | 91 (79.1%) |
| Real Estate, Rental & Leasing | 48 (61.5%) | 30 (38.5%) |
| Professional & Scientific | 99 (51.8%) | 92 (48.2%) |
| Enterprise Management | 17 (100.0%) | 0 (0.0%) |
| Administrative & Support | 205 (86.1%) | 33 (13.9%) |
| Educational Services | 172 (28.6%) | 429 (71.4%) |
| Health Care & Social Assistance | 256 (24.5%) | 789 (75.5%) |
| Arts, Entertainment & Recreation | 20 (30.8%) | 45 (69.2%) |
| Accommodation & Food Services | 222 (33.2%) | 447 (66.8%) |
| Public Administration | 170 (43.6%) | 220 (56.4%) |
| Total | 5,313 (58.1%) | 3,836 (41.9%) |
Education in Jay County
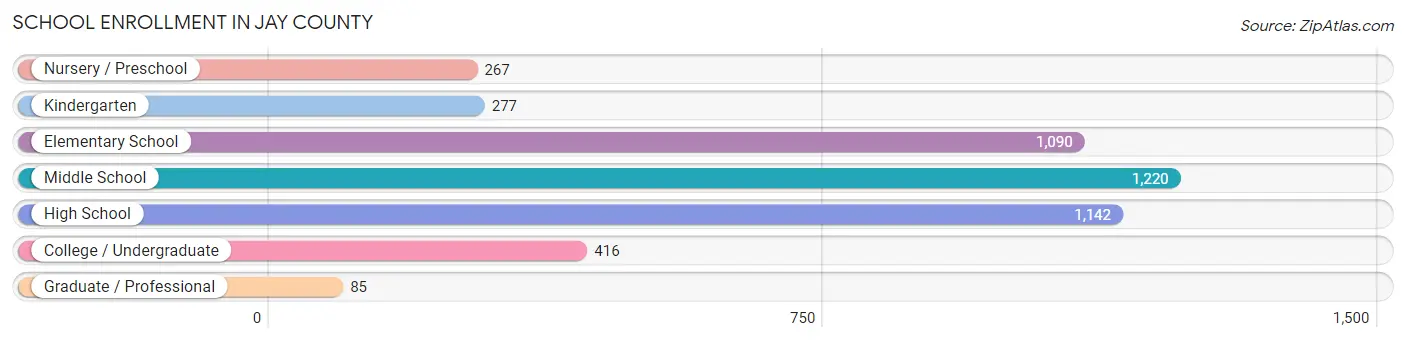
School Enrollment in Jay County
The most common levels of schooling among the 4,497 students in Jay County are middle school (1,220 | 27.1%), high school (1,142 | 25.4%), and elementary school (1,090 | 24.2%).
| School Level | # Students | % Students |
| Nursery / Preschool | 267 | 5.9% |
| Kindergarten | 277 | 6.2% |
| Elementary School | 1,090 | 24.2% |
| Middle School | 1,220 | 27.1% |
| High School | 1,142 | 25.4% |
| College / Undergraduate | 416 | 9.2% |
| Graduate / Professional | 85 | 1.9% |
| Total | 4,497 | 100.0% |
School Enrollment by Age by Funding Source in Jay County
Out of a total of 4,497 students who are enrolled in schools in Jay County, 432 (9.6%) attend a private institution, while the remaining 4,065 (90.4%) are enrolled in public schools. The age group of 3 to 4 year olds has the highest likelihood of being enrolled in private schools, with 51 (26.3% in the age bracket) enrolled. Conversely, the age group of 18 to 19 year olds has the lowest likelihood of being enrolled in a private school, with 245 (98.8% in the age bracket) attending a public institution.
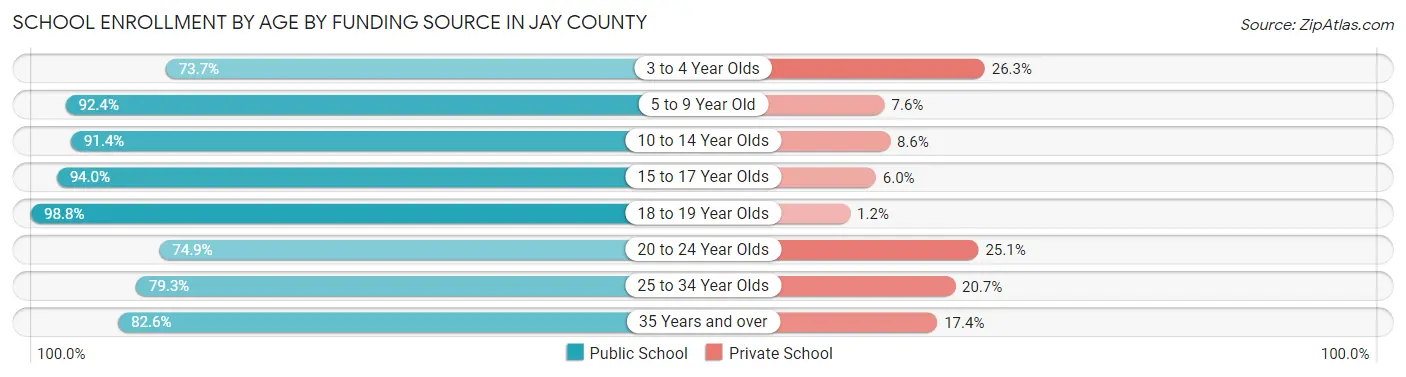
| Age Bracket | Public School | Private School |
| 3 to 4 Year Olds | 143 (73.7%) | 51 (26.3%) |
| 5 to 9 Year Old | 1,151 (92.4%) | 95 (7.6%) |
| 10 to 14 Year Olds | 1,365 (91.4%) | 129 (8.6%) |
| 15 to 17 Year Olds | 801 (94.0%) | 51 (6.0%) |
| 18 to 19 Year Olds | 245 (98.8%) | 3 (1.2%) |
| 20 to 24 Year Olds | 164 (74.9%) | 55 (25.1%) |
| 25 to 34 Year Olds | 107 (79.3%) | 28 (20.7%) |
| 35 Years and over | 90 (82.6%) | 19 (17.4%) |
| Total | 4,065 (90.4%) | 432 (9.6%) |
Educational Attainment by Field of Study in Jay County
Business (467 | 24.4%), education (419 | 21.9%), science & technology (237 | 12.4%), liberal arts & history (173 | 9.0%), and bio, nature & agricultural (150 | 7.8%) are the most common fields of study among 1,913 individuals in Jay County who have obtained a bachelor's degree or higher.
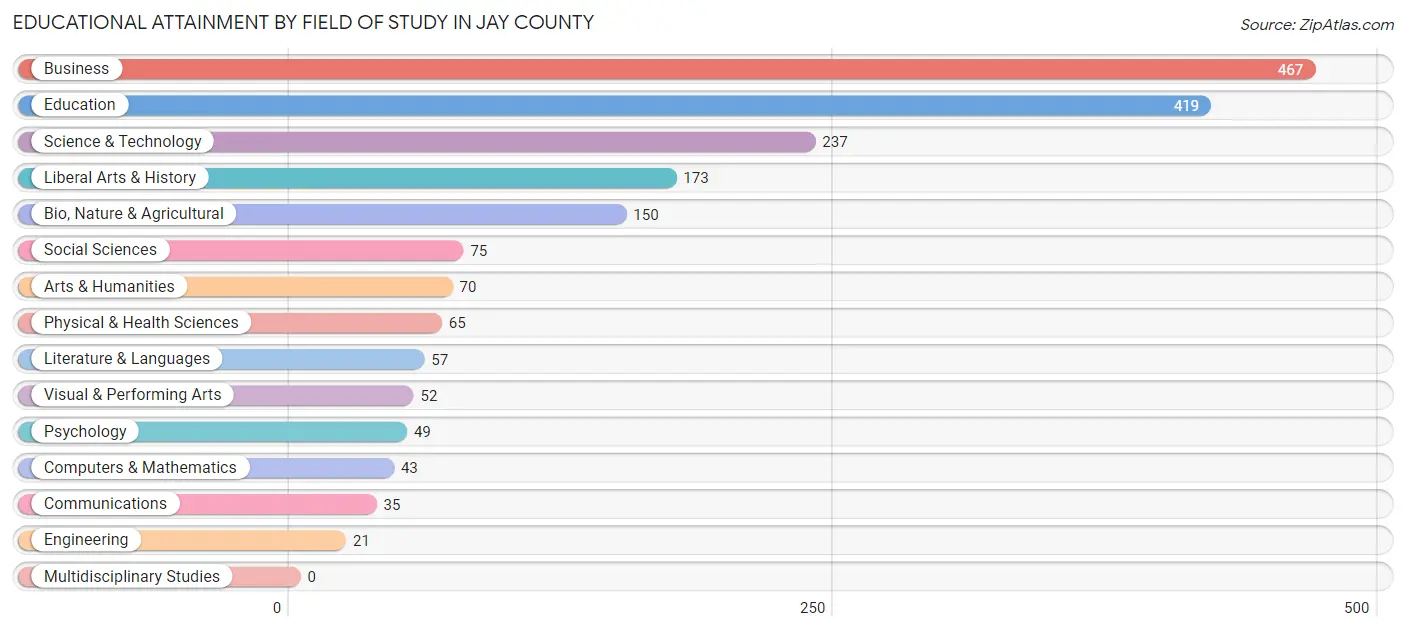
| Field of Study | # Graduates | % Graduates |
| Computers & Mathematics | 43 | 2.2% |
| Bio, Nature & Agricultural | 150 | 7.8% |
| Physical & Health Sciences | 65 | 3.4% |
| Psychology | 49 | 2.6% |
| Social Sciences | 75 | 3.9% |
| Engineering | 21 | 1.1% |
| Multidisciplinary Studies | 0 | 0.0% |
| Science & Technology | 237 | 12.4% |
| Business | 467 | 24.4% |
| Education | 419 | 21.9% |
| Literature & Languages | 57 | 3.0% |
| Liberal Arts & History | 173 | 9.0% |
| Visual & Performing Arts | 52 | 2.7% |
| Communications | 35 | 1.8% |
| Arts & Humanities | 70 | 3.7% |
| Total | 1,913 | 100.0% |
Transportation & Commute in Jay County
Vehicle Availability by Sex in Jay County
The most prevalent vehicle ownership categories in Jay County are males with 2 vehicles (1,664, accounting for 32.6%) and females with 2 vehicles (1,272, making up 45.4%).
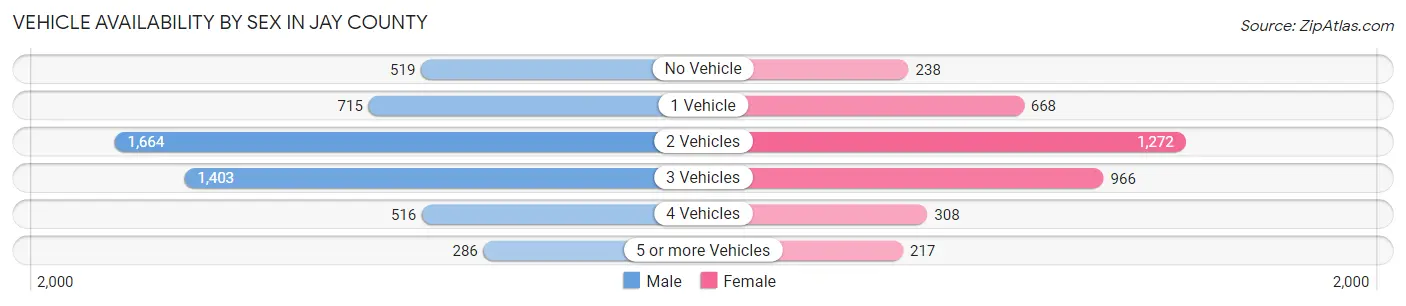
| Vehicles Available | Male | Female |
| No Vehicle | 519 (10.2%) | 238 (6.5%) |
| 1 Vehicle | 715 (14.0%) | 668 (18.2%) |
| 2 Vehicles | 1,664 (32.6%) | 1,272 (34.7%) |
| 3 Vehicles | 1,403 (27.5%) | 966 (26.3%) |
| 4 Vehicles | 516 (10.1%) | 308 (8.4%) |
| 5 or more Vehicles | 286 (5.6%) | 217 (5.9%) |
| Total | 5,103 (100.0%) | 3,669 (100.0%) |
Commute Time in Jay County
The most frequently occuring commute durations in Jay County are 5 to 9 minutes (1,494 commuters, 18.0%), 10 to 14 minutes (1,422 commuters, 17.2%), and 15 to 19 minutes (1,076 commuters, 13.0%).
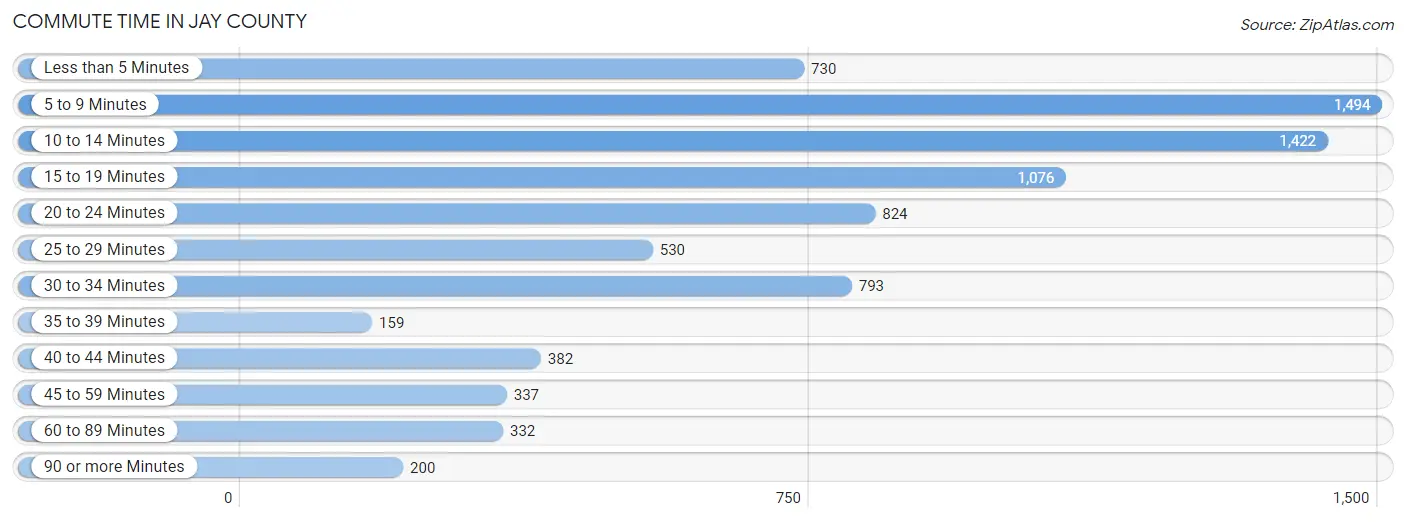
| Commute Time | # Commuters | % Commuters |
| Less than 5 Minutes | 730 | 8.8% |
| 5 to 9 Minutes | 1,494 | 18.0% |
| 10 to 14 Minutes | 1,422 | 17.2% |
| 15 to 19 Minutes | 1,076 | 13.0% |
| 20 to 24 Minutes | 824 | 10.0% |
| 25 to 29 Minutes | 530 | 6.4% |
| 30 to 34 Minutes | 793 | 9.6% |
| 35 to 39 Minutes | 159 | 1.9% |
| 40 to 44 Minutes | 382 | 4.6% |
| 45 to 59 Minutes | 337 | 4.1% |
| 60 to 89 Minutes | 332 | 4.0% |
| 90 or more Minutes | 200 | 2.4% |
Commute Time by Sex in Jay County
The most common commute times in Jay County are 10 to 14 minutes (793 commuters, 16.3%) for males and 5 to 9 minutes (838 commuters, 24.6%) for females.

| Commute Time | Male | Female |
| Less than 5 Minutes | 492 (10.1%) | 238 (7.0%) |
| 5 to 9 Minutes | 656 (13.5%) | 838 (24.6%) |
| 10 to 14 Minutes | 793 (16.3%) | 629 (18.4%) |
| 15 to 19 Minutes | 520 (10.7%) | 556 (16.3%) |
| 20 to 24 Minutes | 581 (11.9%) | 243 (7.1%) |
| 25 to 29 Minutes | 386 (7.9%) | 144 (4.2%) |
| 30 to 34 Minutes | 465 (9.6%) | 328 (9.6%) |
| 35 to 39 Minutes | 97 (2.0%) | 62 (1.8%) |
| 40 to 44 Minutes | 308 (6.3%) | 74 (2.2%) |
| 45 to 59 Minutes | 201 (4.1%) | 136 (4.0%) |
| 60 to 89 Minutes | 240 (4.9%) | 92 (2.7%) |
| 90 or more Minutes | 128 (2.6%) | 72 (2.1%) |
Time of Departure to Work by Sex in Jay County
The most frequent times of departure to work in Jay County are 6:30 AM to 6:59 AM (736, 15.1%) for males and 7:00 AM to 7:29 AM (546, 16.0%) for females.
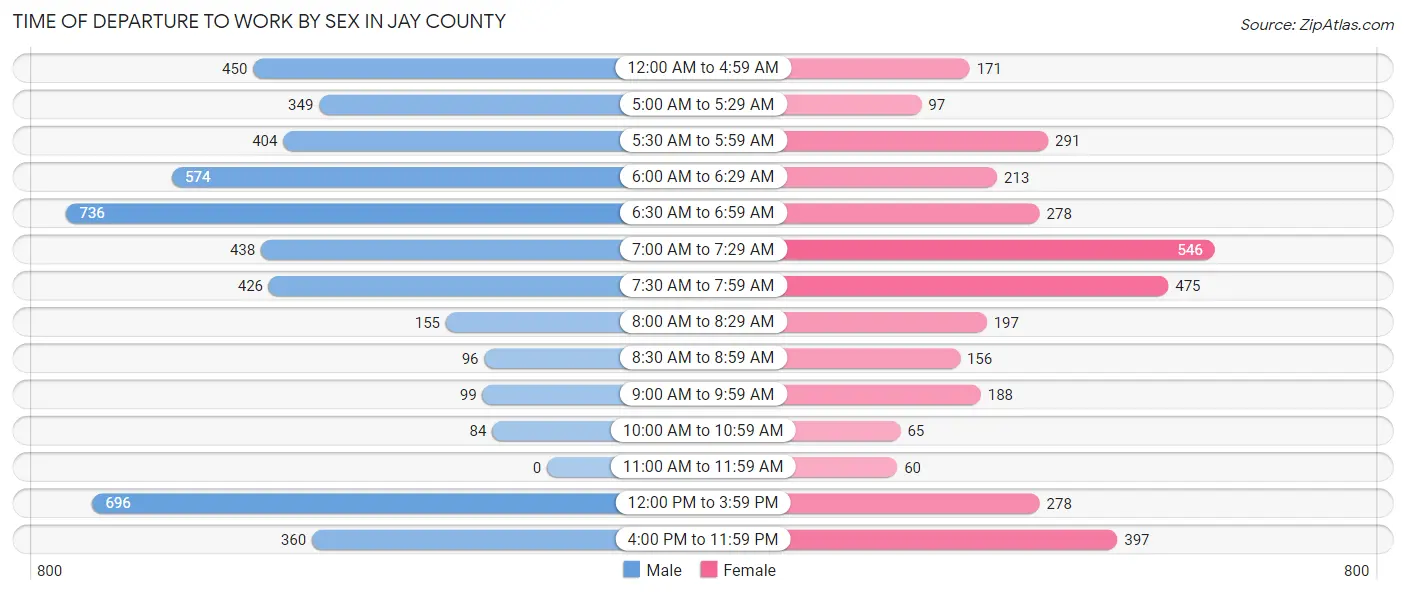
| Time of Departure | Male | Female |
| 12:00 AM to 4:59 AM | 450 (9.2%) | 171 (5.0%) |
| 5:00 AM to 5:29 AM | 349 (7.2%) | 97 (2.8%) |
| 5:30 AM to 5:59 AM | 404 (8.3%) | 291 (8.5%) |
| 6:00 AM to 6:29 AM | 574 (11.8%) | 213 (6.2%) |
| 6:30 AM to 6:59 AM | 736 (15.1%) | 278 (8.2%) |
| 7:00 AM to 7:29 AM | 438 (9.0%) | 546 (16.0%) |
| 7:30 AM to 7:59 AM | 426 (8.7%) | 475 (13.9%) |
| 8:00 AM to 8:29 AM | 155 (3.2%) | 197 (5.8%) |
| 8:30 AM to 8:59 AM | 96 (2.0%) | 156 (4.6%) |
| 9:00 AM to 9:59 AM | 99 (2.0%) | 188 (5.5%) |
| 10:00 AM to 10:59 AM | 84 (1.7%) | 65 (1.9%) |
| 11:00 AM to 11:59 AM | 0 (0.0%) | 60 (1.8%) |
| 12:00 PM to 3:59 PM | 696 (14.3%) | 278 (8.2%) |
| 4:00 PM to 11:59 PM | 360 (7.4%) | 397 (11.6%) |
| Total | 4,867 (100.0%) | 3,412 (100.0%) |
Housing Occupancy in Jay County
Occupancy by Ownership in Jay County
Of the total 8,091 dwellings in Jay County, owner-occupied units account for 6,197 (76.6%), while renter-occupied units make up 1,894 (23.4%).
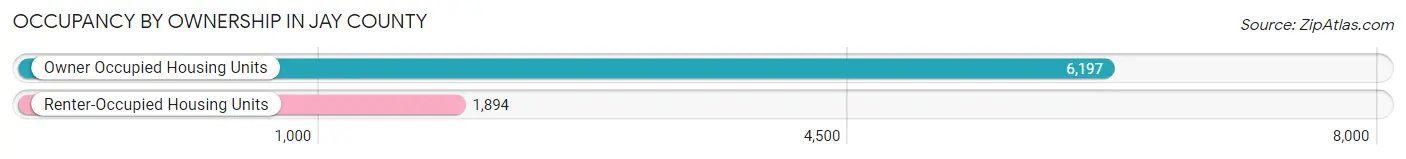
| Occupancy | # Housing Units | % Housing Units |
| Owner Occupied Housing Units | 6,197 | 76.6% |
| Renter-Occupied Housing Units | 1,894 | 23.4% |
| Total Occupied Housing Units | 8,091 | 100.0% |
Occupancy by Household Size in Jay County
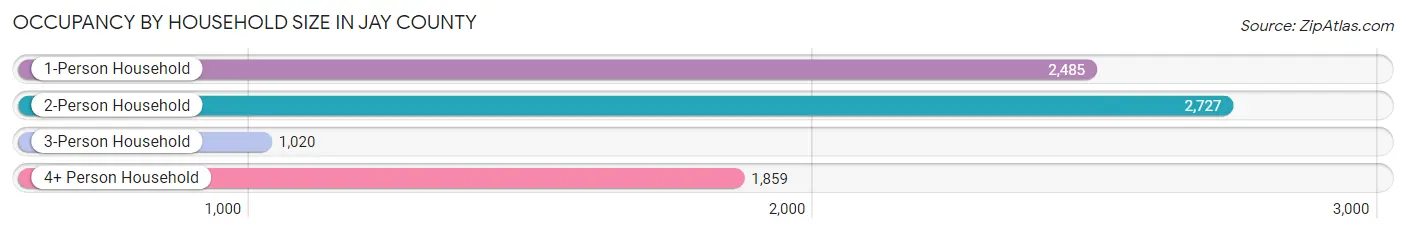
| Household Size | # Housing Units | % Housing Units |
| 1-Person Household | 2,485 | 30.7% |
| 2-Person Household | 2,727 | 33.7% |
| 3-Person Household | 1,020 | 12.6% |
| 4+ Person Household | 1,859 | 23.0% |
| Total Housing Units | 8,091 | 100.0% |
Occupancy by Ownership by Household Size in Jay County
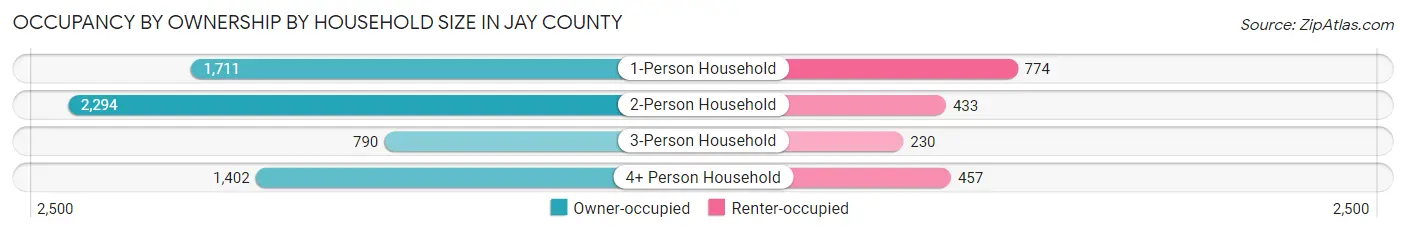
| Household Size | Owner-occupied | Renter-occupied |
| 1-Person Household | 1,711 (68.9%) | 774 (31.1%) |
| 2-Person Household | 2,294 (84.1%) | 433 (15.9%) |
| 3-Person Household | 790 (77.4%) | 230 (22.6%) |
| 4+ Person Household | 1,402 (75.4%) | 457 (24.6%) |
| Total Housing Units | 6,197 (76.6%) | 1,894 (23.4%) |
Occupancy by Educational Attainment in Jay County

| Household Size | Owner-occupied | Renter-occupied |
| Less than High School | 725 (68.7%) | 330 (31.3%) |
| High School Diploma | 2,760 (77.6%) | 798 (22.4%) |
| College/Associate Degree | 1,795 (73.5%) | 648 (26.5%) |
| Bachelor's Degree or higher | 917 (88.6%) | 118 (11.4%) |
Occupancy by Age of Householder in Jay County
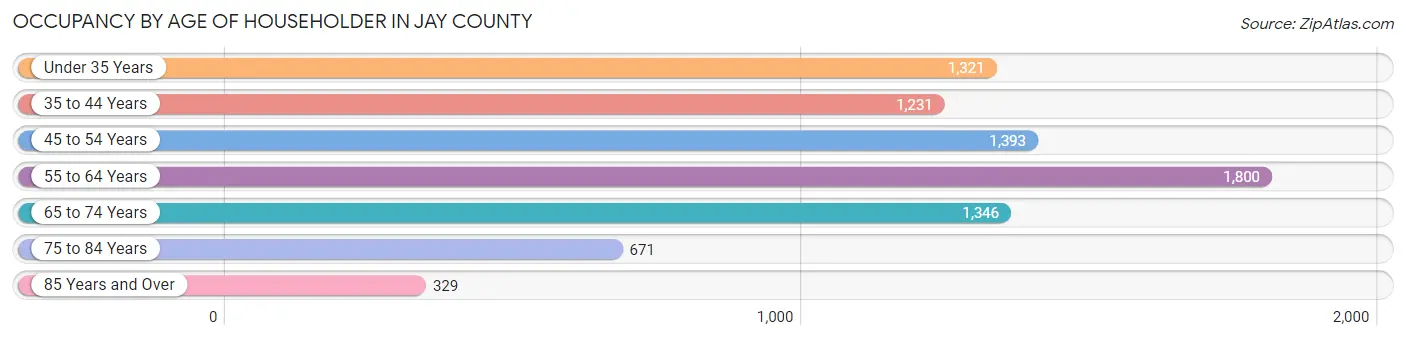
| Age Bracket | # Households | % Households |
| Under 35 Years | 1,321 | 16.3% |
| 35 to 44 Years | 1,231 | 15.2% |
| 45 to 54 Years | 1,393 | 17.2% |
| 55 to 64 Years | 1,800 | 22.3% |
| 65 to 74 Years | 1,346 | 16.6% |
| 75 to 84 Years | 671 | 8.3% |
| 85 Years and Over | 329 | 4.1% |
| Total | 8,091 | 100.0% |
Housing Finances in Jay County
Median Income by Occupancy in Jay County

| Occupancy Type | # Households | Median Income |
| Owner-Occupied | 6,197 (76.6%) | $57,285 |
| Renter-Occupied | 1,894 (23.4%) | $37,115 |
| Average | 8,091 (100.0%) | $52,231 |
Occupancy by Householder Income Bracket in Jay County

| Income Bracket | Owner-occupied | Renter-occupied |
| Less than $5,000 | 70 (1.1%) | 102 (5.4%) |
| $5,000 to $9,999 | 38 (0.6%) | 127 (6.7%) |
| $10,000 to $14,999 | 199 (3.2%) | 200 (10.6%) |
| $15,000 to $19,999 | 286 (4.6%) | 132 (7.0%) |
| $20,000 to $24,999 | 189 (3.0%) | 93 (4.9%) |
| $25,000 to $34,999 | 536 (8.6%) | 282 (14.9%) |
| $35,000 to $49,999 | 1,210 (19.5%) | 254 (13.4%) |
| $50,000 to $74,999 | 1,391 (22.5%) | 313 (16.5%) |
| $75,000 to $99,999 | 856 (13.8%) | 259 (13.7%) |
| $100,000 to $149,999 | 922 (14.9%) | 118 (6.2%) |
| $150,000 or more | 500 (8.1%) | 14 (0.7%) |
| Total | 6,197 (100.0%) | 1,894 (100.0%) |
Monthly Housing Cost Tiers in Jay County
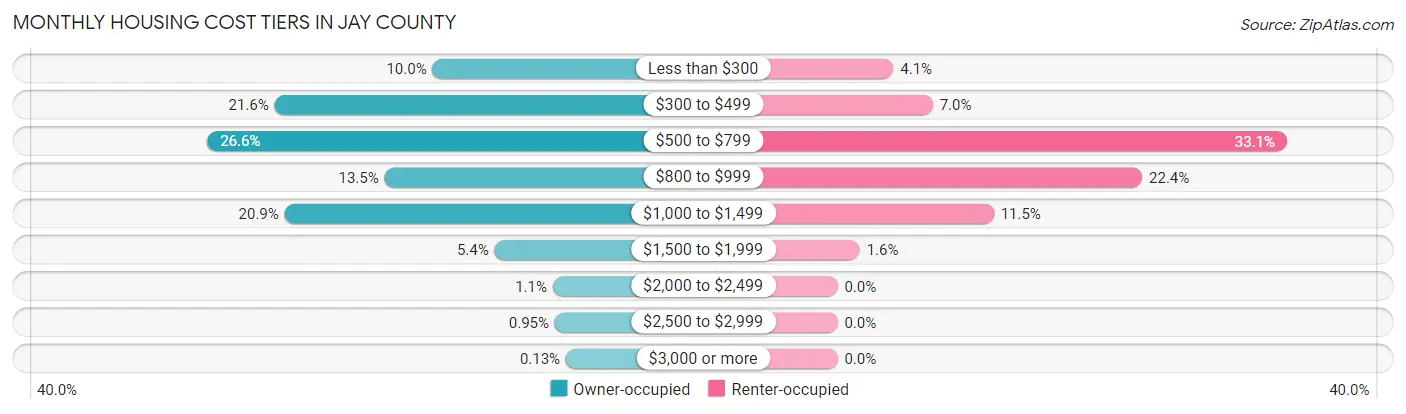
| Monthly Cost | Owner-occupied | Renter-occupied |
| Less than $300 | 617 (10.0%) | 78 (4.1%) |
| $300 to $499 | 1,338 (21.6%) | 133 (7.0%) |
| $500 to $799 | 1,645 (26.6%) | 627 (33.1%) |
| $800 to $999 | 836 (13.5%) | 425 (22.4%) |
| $1,000 to $1,499 | 1,292 (20.8%) | 218 (11.5%) |
| $1,500 to $1,999 | 334 (5.4%) | 31 (1.6%) |
| $2,000 to $2,499 | 68 (1.1%) | 0 (0.0%) |
| $2,500 to $2,999 | 59 (0.9%) | 0 (0.0%) |
| $3,000 or more | 8 (0.1%) | 0 (0.0%) |
| Total | 6,197 (100.0%) | 1,894 (100.0%) |
Physical Housing Characteristics in Jay County
Housing Structures in Jay County
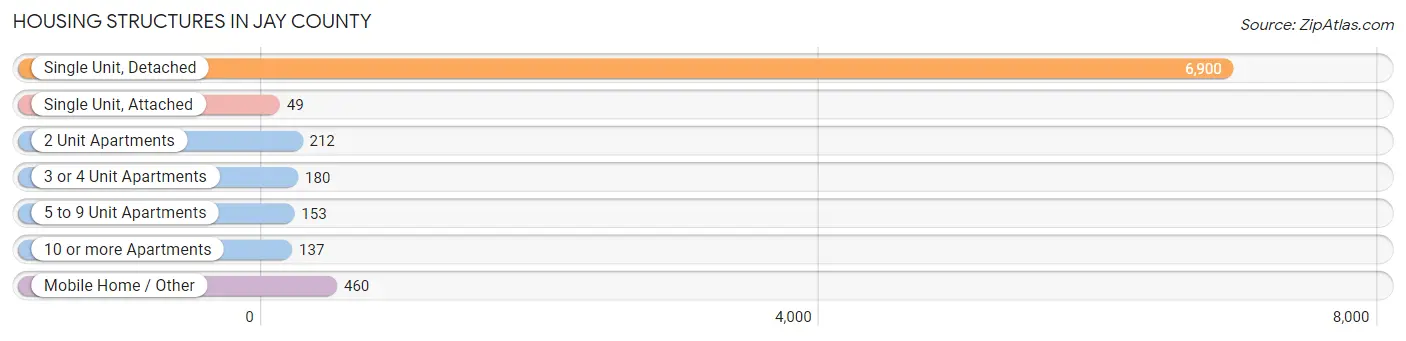
| Structure Type | # Housing Units | % Housing Units |
| Single Unit, Detached | 6,900 | 85.3% |
| Single Unit, Attached | 49 | 0.6% |
| 2 Unit Apartments | 212 | 2.6% |
| 3 or 4 Unit Apartments | 180 | 2.2% |
| 5 to 9 Unit Apartments | 153 | 1.9% |
| 10 or more Apartments | 137 | 1.7% |
| Mobile Home / Other | 460 | 5.7% |
| Total | 8,091 | 100.0% |
Housing Structures by Occupancy in Jay County
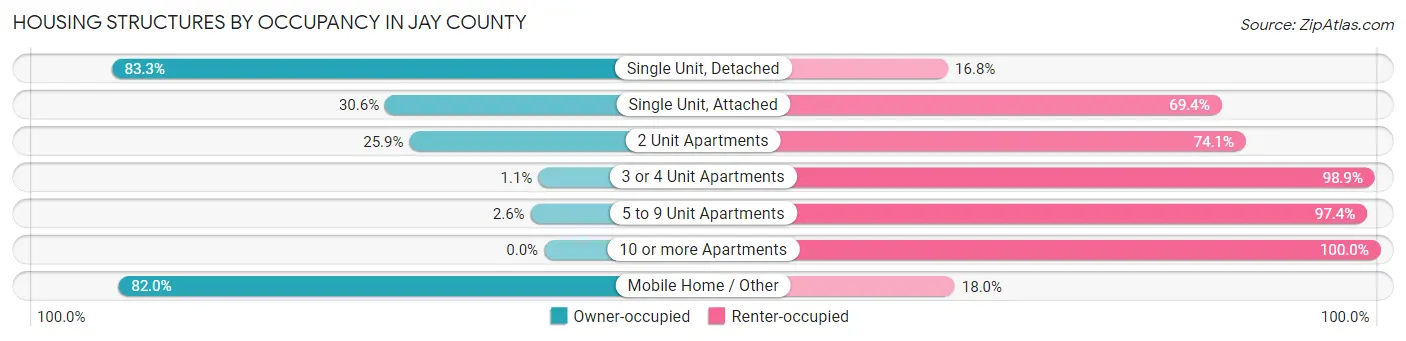
| Structure Type | Owner-occupied | Renter-occupied |
| Single Unit, Detached | 5,744 (83.3%) | 1,156 (16.8%) |
| Single Unit, Attached | 15 (30.6%) | 34 (69.4%) |
| 2 Unit Apartments | 55 (25.9%) | 157 (74.1%) |
| 3 or 4 Unit Apartments | 2 (1.1%) | 178 (98.9%) |
| 5 to 9 Unit Apartments | 4 (2.6%) | 149 (97.4%) |
| 10 or more Apartments | 0 (0.0%) | 137 (100.0%) |
| Mobile Home / Other | 377 (82.0%) | 83 (18.0%) |
| Total | 6,197 (76.6%) | 1,894 (23.4%) |
Housing Structures by Number of Rooms in Jay County

| Number of Rooms | Owner-occupied | Renter-occupied |
| 1 Room | 45 (0.7%) | 71 (3.7%) |
| 2 or 3 Rooms | 54 (0.9%) | 270 (14.3%) |
| 4 or 5 Rooms | 1,871 (30.2%) | 732 (38.7%) |
| 6 or 7 Rooms | 2,602 (42.0%) | 543 (28.7%) |
| 8 or more Rooms | 1,625 (26.2%) | 278 (14.7%) |
| Total | 6,197 (100.0%) | 1,894 (100.0%) |
Housing Structure by Heating Type in Jay County

| Heating Type | Owner-occupied | Renter-occupied |
| Utility Gas | 2,645 (42.7%) | 726 (38.3%) |
| Bottled, Tank, or LP Gas | 1,226 (19.8%) | 237 (12.5%) |
| Electricity | 1,385 (22.4%) | 773 (40.8%) |
| Fuel Oil or Kerosene | 102 (1.7%) | 74 (3.9%) |
| Coal or Coke | 89 (1.4%) | 0 (0.0%) |
| All other Fuels | 687 (11.1%) | 64 (3.4%) |
| No Fuel Used | 63 (1.0%) | 20 (1.1%) |
| Total | 6,197 (100.0%) | 1,894 (100.0%) |
Household Vehicle Usage in Jay County
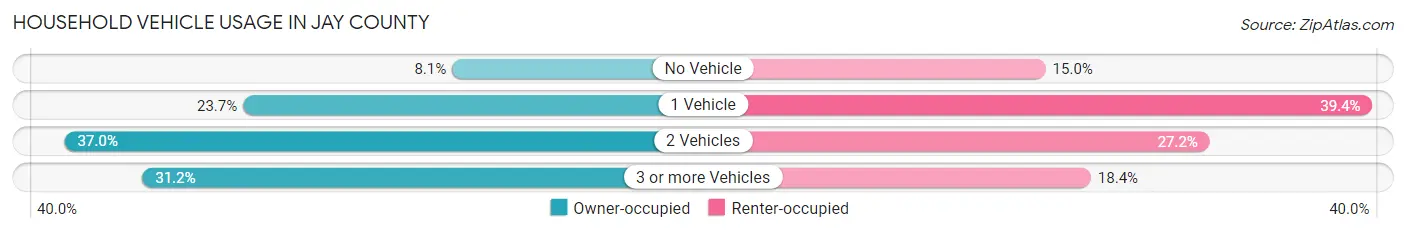
| Vehicles per Household | Owner-occupied | Renter-occupied |
| No Vehicle | 501 (8.1%) | 284 (15.0%) |
| 1 Vehicle | 1,468 (23.7%) | 746 (39.4%) |
| 2 Vehicles | 2,294 (37.0%) | 516 (27.2%) |
| 3 or more Vehicles | 1,934 (31.2%) | 348 (18.4%) |
| Total | 6,197 (100.0%) | 1,894 (100.0%) |
Real Estate & Mortgages in Jay County
Real Estate and Mortgage Overview in Jay County
| Characteristic | Without Mortgage | With Mortgage |
| Housing Units | 2,705 | 3,492 |
| Median Property Value | $94,200 | $108,600 |
| Median Household Income | $47,040 | $295 |
| Monthly Housing Costs | $406 | $8 |
| Real Estate Taxes | $575 | $128 |
Property Value by Mortgage Status in Jay County
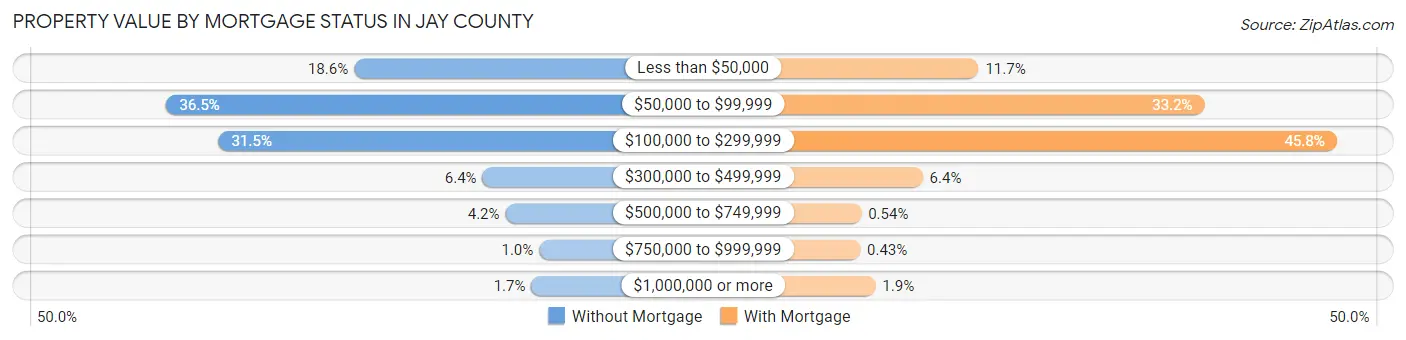
| Property Value | Without Mortgage | With Mortgage |
| Less than $50,000 | 504 (18.6%) | 409 (11.7%) |
| $50,000 to $99,999 | 987 (36.5%) | 1,160 (33.2%) |
| $100,000 to $299,999 | 853 (31.5%) | 1,600 (45.8%) |
| $300,000 to $499,999 | 173 (6.4%) | 223 (6.4%) |
| $500,000 to $749,999 | 114 (4.2%) | 19 (0.5%) |
| $750,000 to $999,999 | 27 (1.0%) | 15 (0.4%) |
| $1,000,000 or more | 47 (1.7%) | 66 (1.9%) |
| Total | 2,705 (100.0%) | 3,492 (100.0%) |
Household Income by Mortgage Status in Jay County
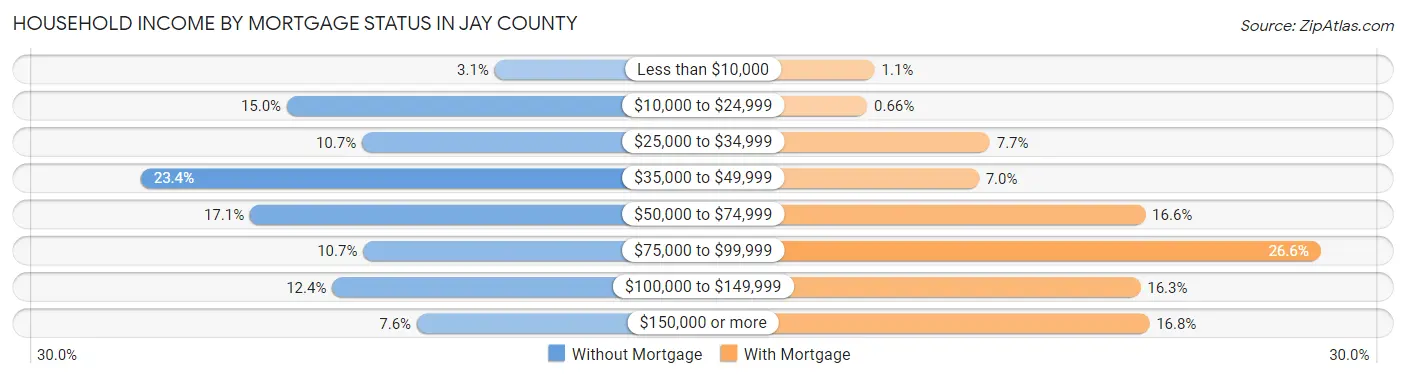
| Household Income | Without Mortgage | With Mortgage |
| Less than $10,000 | 85 (3.1%) | 38 (1.1%) |
| $10,000 to $24,999 | 406 (15.0%) | 23 (0.7%) |
| $25,000 to $34,999 | 290 (10.7%) | 268 (7.7%) |
| $35,000 to $49,999 | 632 (23.4%) | 246 (7.0%) |
| $50,000 to $74,999 | 463 (17.1%) | 578 (16.6%) |
| $75,000 to $99,999 | 288 (10.6%) | 928 (26.6%) |
| $100,000 to $149,999 | 336 (12.4%) | 568 (16.3%) |
| $150,000 or more | 205 (7.6%) | 586 (16.8%) |
| Total | 2,705 (100.0%) | 3,492 (100.0%) |
Property Value to Household Income Ratio in Jay County
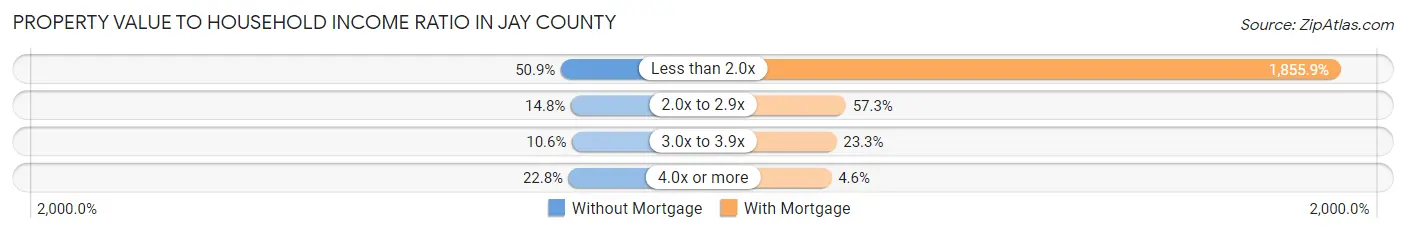
| Value-to-Income Ratio | Without Mortgage | With Mortgage |
| Less than 2.0x | 1,376 (50.9%) | 64,808 (1,855.9%) |
| 2.0x to 2.9x | 399 (14.7%) | 2,000 (57.3%) |
| 3.0x to 3.9x | 287 (10.6%) | 812 (23.3%) |
| 4.0x or more | 617 (22.8%) | 162 (4.6%) |
| Total | 2,705 (100.0%) | 3,492 (100.0%) |
Real Estate Taxes by Mortgage Status in Jay County
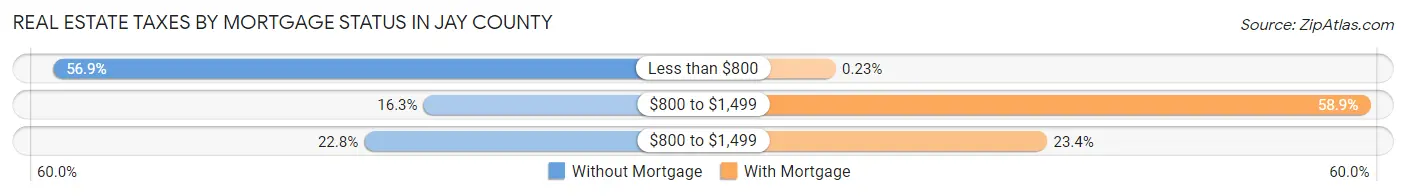
| Property Taxes | Without Mortgage | With Mortgage |
| Less than $800 | 1,538 (56.9%) | 8 (0.2%) |
| $800 to $1,499 | 441 (16.3%) | 2,055 (58.9%) |
| $800 to $1,499 | 617 (22.8%) | 817 (23.4%) |
| Total | 2,705 (100.0%) | 3,492 (100.0%) |
Health & Disability in Jay County
Health Insurance Coverage by Age in Jay County
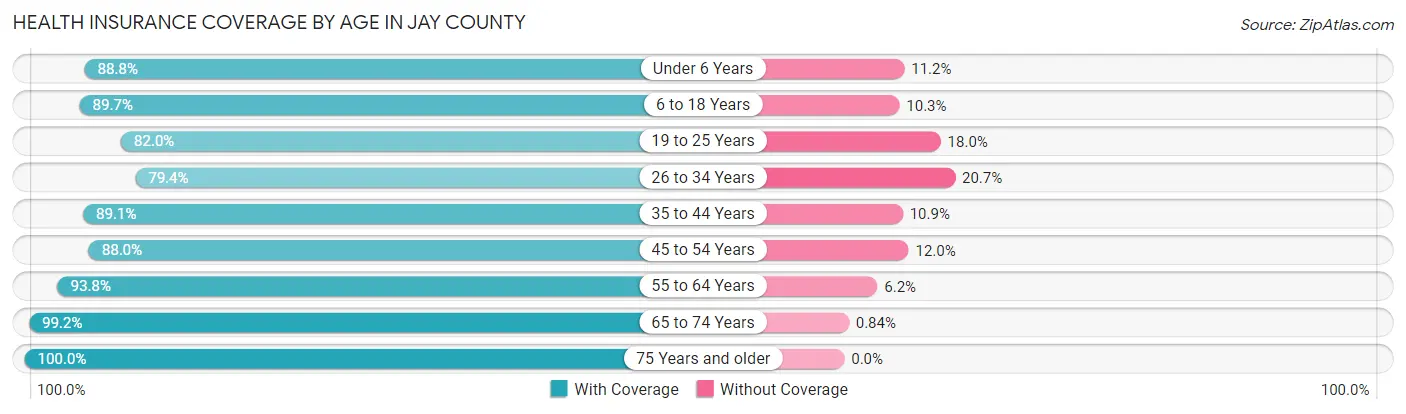
| Age Bracket | With Coverage | Without Coverage |
| Under 6 Years | 1,548 (88.8%) | 195 (11.2%) |
| 6 to 18 Years | 3,356 (89.7%) | 384 (10.3%) |
| 19 to 25 Years | 1,333 (82.0%) | 292 (18.0%) |
| 26 to 34 Years | 1,572 (79.3%) | 409 (20.6%) |
| 35 to 44 Years | 2,003 (89.1%) | 245 (10.9%) |
| 45 to 54 Years | 2,276 (88.0%) | 310 (12.0%) |
| 55 to 64 Years | 2,574 (93.8%) | 169 (6.2%) |
| 65 to 74 Years | 2,131 (99.2%) | 18 (0.8%) |
| 75 Years and older | 1,432 (100.0%) | 0 (0.0%) |
| Total | 18,225 (90.0%) | 2,022 (10.0%) |
Health Insurance Coverage by Citizenship Status in Jay County

| Citizenship Status | With Coverage | Without Coverage |
| Native Born | 1,548 (88.8%) | 195 (11.2%) |
| Foreign Born, Citizen | 3,356 (89.7%) | 384 (10.3%) |
| Foreign Born, not a Citizen | 1,333 (82.0%) | 292 (18.0%) |
Health Insurance Coverage by Household Income in Jay County

| Household Income | With Coverage | Without Coverage |
| Under $25,000 | 2,239 (93.0%) | 169 (7.0%) |
| $25,000 to $49,999 | 4,160 (86.7%) | 640 (13.3%) |
| $50,000 to $74,999 | 3,736 (89.9%) | 418 (10.1%) |
| $75,000 to $99,999 | 3,281 (94.3%) | 199 (5.7%) |
| $100,000 and over | 4,752 (88.9%) | 596 (11.1%) |
Public vs Private Health Insurance Coverage by Age in Jay County
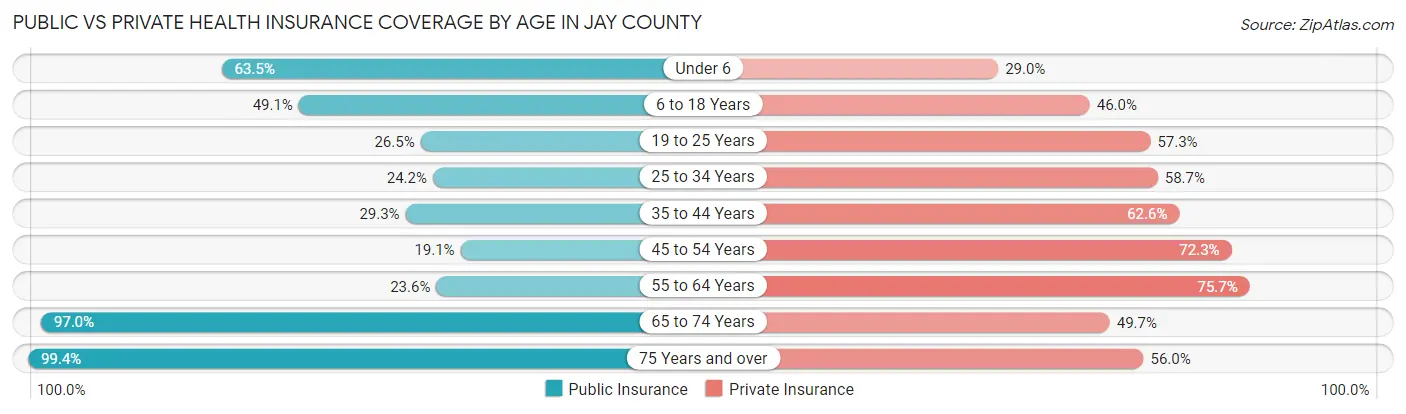
| Age Bracket | Public Insurance | Private Insurance |
| Under 6 | 1,106 (63.4%) | 506 (29.0%) |
| 6 to 18 Years | 1,837 (49.1%) | 1,722 (46.0%) |
| 19 to 25 Years | 431 (26.5%) | 931 (57.3%) |
| 25 to 34 Years | 480 (24.2%) | 1,162 (58.7%) |
| 35 to 44 Years | 659 (29.3%) | 1,408 (62.6%) |
| 45 to 54 Years | 494 (19.1%) | 1,870 (72.3%) |
| 55 to 64 Years | 647 (23.6%) | 2,076 (75.7%) |
| 65 to 74 Years | 2,084 (97.0%) | 1,069 (49.7%) |
| 75 Years and over | 1,423 (99.4%) | 802 (56.0%) |
| Total | 9,161 (45.3%) | 11,546 (57.0%) |
Disability Status by Sex by Age in Jay County

| Age Bracket | Male | Female |
| Under 5 Years | 0 (0.0%) | 9 (1.2%) |
| 5 to 17 Years | 287 (14.8%) | 133 (7.4%) |
| 18 to 34 Years | 243 (11.9%) | 234 (12.7%) |
| 35 to 64 Years | 668 (17.3%) | 698 (18.8%) |
| 65 to 74 Years | 247 (23.8%) | 275 (24.7%) |
| 75 Years and over | 322 (53.9%) | 424 (50.8%) |
Disability Class by Sex by Age in Jay County
Disability Class: Hearing Difficulty
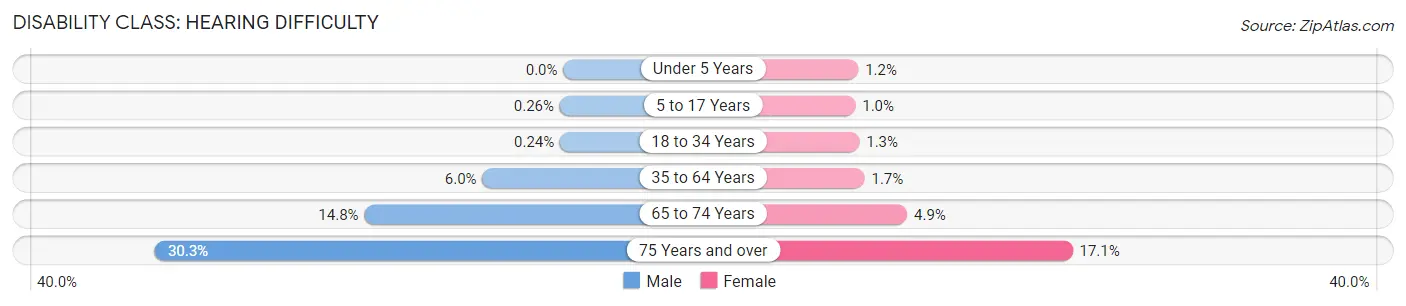
| Age Bracket | Male | Female |
| Under 5 Years | 0 (0.0%) | 9 (1.2%) |
| 5 to 17 Years | 5 (0.3%) | 18 (1.0%) |
| 18 to 34 Years | 5 (0.2%) | 24 (1.3%) |
| 35 to 64 Years | 232 (6.0%) | 63 (1.7%) |
| 65 to 74 Years | 153 (14.8%) | 54 (4.9%) |
| 75 Years and over | 181 (30.3%) | 143 (17.1%) |
Disability Class: Vision Difficulty
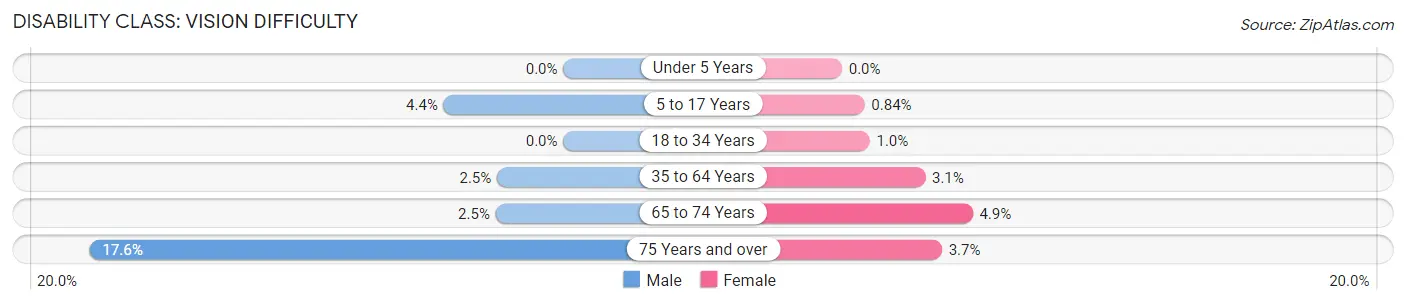
| Age Bracket | Male | Female |
| Under 5 Years | 0 (0.0%) | 0 (0.0%) |
| 5 to 17 Years | 86 (4.4%) | 15 (0.8%) |
| 18 to 34 Years | 0 (0.0%) | 19 (1.0%) |
| 35 to 64 Years | 95 (2.5%) | 115 (3.1%) |
| 65 to 74 Years | 26 (2.5%) | 54 (4.9%) |
| 75 Years and over | 105 (17.6%) | 31 (3.7%) |
Disability Class: Cognitive Difficulty
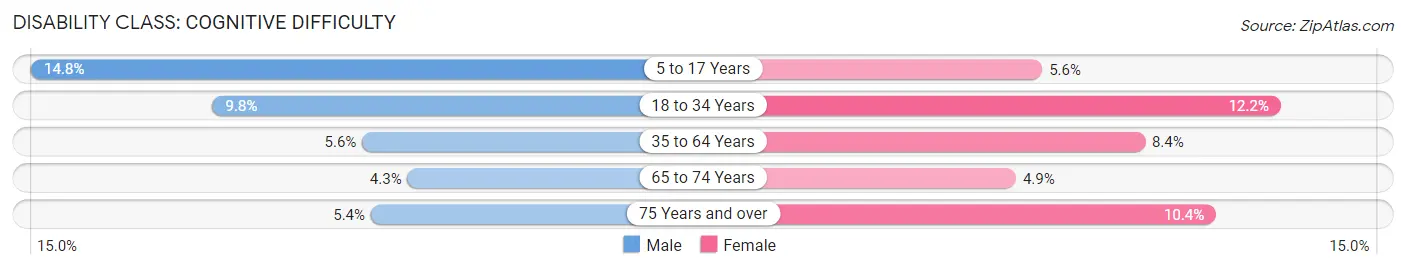
| Age Bracket | Male | Female |
| 5 to 17 Years | 287 (14.8%) | 100 (5.6%) |
| 18 to 34 Years | 200 (9.8%) | 225 (12.2%) |
| 35 to 64 Years | 216 (5.6%) | 314 (8.4%) |
| 65 to 74 Years | 45 (4.3%) | 54 (4.9%) |
| 75 Years and over | 32 (5.4%) | 87 (10.4%) |
Disability Class: Ambulatory Difficulty

| Age Bracket | Male | Female |
| 5 to 17 Years | 24 (1.2%) | 0 (0.0%) |
| 18 to 34 Years | 28 (1.4%) | 24 (1.3%) |
| 35 to 64 Years | 264 (6.8%) | 488 (13.1%) |
| 65 to 74 Years | 109 (10.5%) | 185 (16.6%) |
| 75 Years and over | 169 (28.3%) | 337 (40.4%) |
Disability Class: Self-Care Difficulty
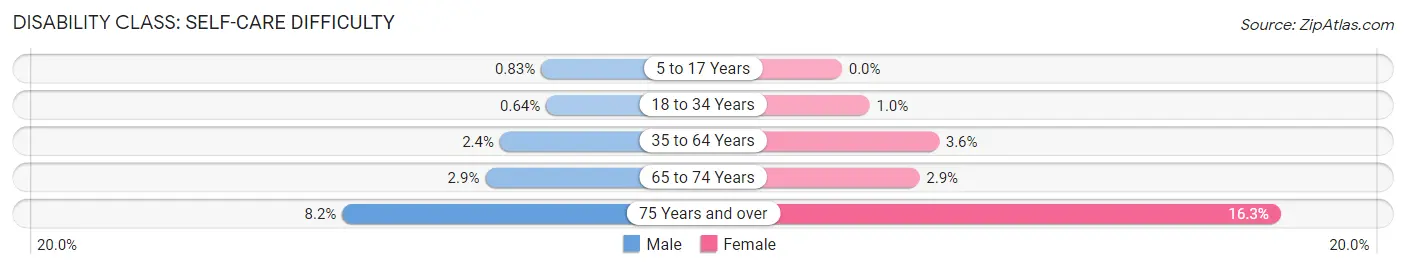
| Age Bracket | Male | Female |
| 5 to 17 Years | 16 (0.8%) | 0 (0.0%) |
| 18 to 34 Years | 13 (0.6%) | 19 (1.0%) |
| 35 to 64 Years | 91 (2.4%) | 134 (3.6%) |
| 65 to 74 Years | 30 (2.9%) | 32 (2.9%) |
| 75 Years and over | 49 (8.2%) | 136 (16.3%) |
Technology Access in Jay County
Computing Device Access in Jay County
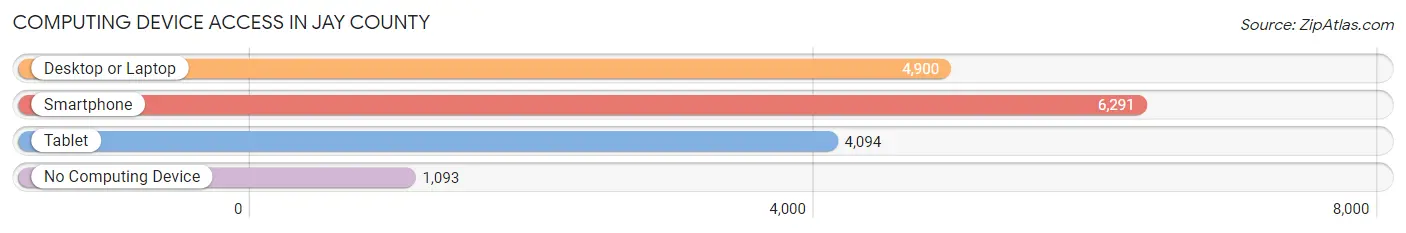
| Device Type | # Households | % Households |
| Desktop or Laptop | 4,900 | 60.6% |
| Smartphone | 6,291 | 77.7% |
| Tablet | 4,094 | 50.6% |
| No Computing Device | 1,093 | 13.5% |
| Total | 8,091 | 100.0% |
Internet Access in Jay County
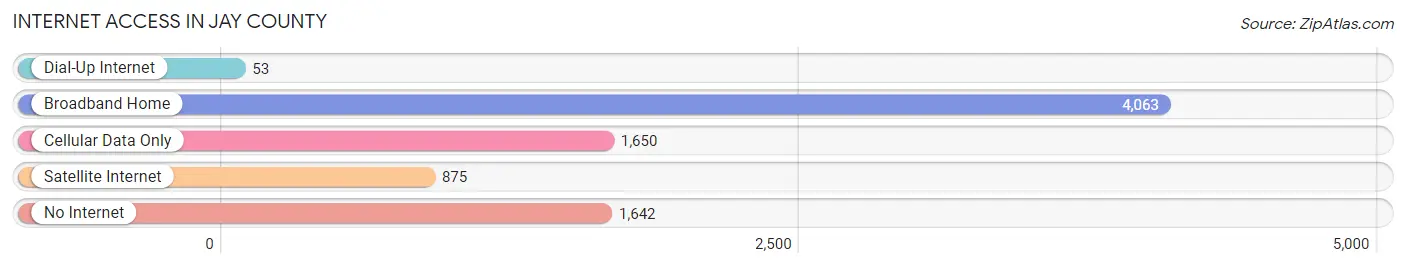
| Internet Type | # Households | % Households |
| Dial-Up Internet | 53 | 0.7% |
| Broadband Home | 4,063 | 50.2% |
| Cellular Data Only | 1,650 | 20.4% |
| Satellite Internet | 875 | 10.8% |
| No Internet | 1,642 | 20.3% |
| Total | 8,091 | 100.0% |
Jay County Summary
John Jay County is located in the east-central part of Indiana, in the United States. It is part of the Fort Wayne metropolitan area and is bordered by Adams, Wells, and Blackford counties. The county seat is Portland, Indiana. The county was named after John Jay, the first Chief Justice of the United States Supreme Court.
Geography
John Jay County is located in the east-central part of Indiana, in the United States. It is part of the Fort Wayne metropolitan area and is bordered by Adams, Wells, and Blackford counties. The county has a total area of 441 square miles, of which 439 square miles is land and 2 square miles (0.5%) is water. The county is drained by the Salamonie River and its tributaries. The highest point in the county is located in the northwest corner, at an elevation of 1,050 feet above sea level.
The county is divided into two distinct regions. The northern part of the county is mostly flat, with some rolling hills. The southern part of the county is more hilly and is part of the Till Plains region. The county is home to several state parks, including Salamonie Lake State Recreation Area, Chain O'Lakes State Park, and Ouabache State Park.
Demographics
As of the 2010 United States Census, there were 21,717 people, 8,541 households, and 6,072 families residing in the county. The population density was 49.3 inhabitants per square mile (19.0/km2). There were 9,541 housing units at an average density of 21.7 per square mile (8.4/km2). The racial makeup of the county was 97.7% white, 0.5% black or African American, 0.3% Asian, 0.2% American Indian, 0.2% from other races, and 1.1% from two or more races. Those of Hispanic or Latino origin made up 0.9% of the population.
In terms of ancestry, 28.2% were German, 14.7% were American, 11.7% were Irish, and 8.7% were English. Of the 8,541 households, 32.3% had children under the age of 18 living with them, 56.2% were married couples living together, 10.2% had a female householder with no husband present, 28.7% were non-families, and 23.7% of all households were made up of individuals. The average household size was 2.53 and the average family size was 2.98.
The median age in the county was 40.3 years. 24.7% of residents were under the age of 18; 7.7% were between the ages of 18 and 24; 24.2% were from 25 to 44; 28.2% were from 45 to 64; and 15.2% were 65 years of age or older. The gender makeup of the county was 48.7% male and 51.3% female.
Economy
John Jay County has a diversified economy, with a mix of manufacturing, agriculture, and services. The county is home to several large employers, including Jayco, Inc., a manufacturer of recreational vehicles; Jay County Hospital; and Jay County Schools.
Agriculture is an important part of the county's economy. The county is home to several large farms, including the Jay County Farm Bureau, which is the largest farm in the county. The county is also home to several small farms, which produce a variety of crops, including corn, soybeans, wheat, and hay.
The county is also home to several small businesses, including restaurants, retail stores, and service providers. The county is also home to several tourist attractions, including the Jay County Historical Museum, the Jay County Fairgrounds, and the Jay County Public Library.
Conclusion
John Jay County is a rural county located in the east-central part of Indiana. It is part of the Fort Wayne metropolitan area and is bordered by Adams, Wells, and Blackford counties. The county has a total area of 441 square miles, of which 439 square miles is land and 2 square miles (0.5%) is water. The county is home to several state parks, including Salamonie Lake State Recreation Area, Chain O'Lakes State Park, and Ouabache State Park. As of the 2010 United States Census, there were 21,717 people, 8,541 households, and 6,072 families residing in the county. The county has a diversified economy, with a mix of manufacturing, agriculture, and services. The county is home to several large employers, including Jayco, Inc., a manufacturer of recreational vehicles; Jay County Hospital; and Jay County Schools. Agriculture is an important part of the county's economy, and the county is also home to several small businesses, including restaurants, retail stores, and service providers.
Common Questions
What is the Total Population of Jay County?
Total Population of Jay County is 20,451.
What is the Total Male Population of Jay County?
Total Male Population of Jay County is 10,298.
What is the Total Female Population of Jay County?
Total Female Population of Jay County is 10,153.
What is the Ratio of Males per 100 Females in Jay County?
There are 101.43 Males per 100 Females in Jay County.
What is the Ratio of Females per 100 Males in Jay County?
There are 98.59 Females per 100 Males in Jay County.
What is the Median Population Age in Jay County?
Median Population Age in Jay County is 39.6 Years.
What is the Average Family Size in Jay County
Average Family Size in Jay County is 3.1 People.
What is the Average Household Size in Jay County
Average Household Size in Jay County is 2.5 People.
What is Per Capita Income in Jay County?
Per Capita income in Jay County is $27,794.
What is the Median Family Income in Jay County?
Median Family Income in Jay County is $65,719.
What is the Median Household income in Jay County?
Median Household Income in Jay County is $52,231.
What is Income or Wage Gap in Jay County?
Income or Wage Gap in Jay County is 37.3%.
Women in Jay County earn 62.7 cents for every dollar earned by a man.
What is Family Income Deficit in Jay County?
Family Income Deficit in Jay County is $13,344.
Families that are below poverty line in Jay County earn $13,344 less on average than the poverty threshold level.
What is Inequality or Gini Index in Jay County?
Inequality or Gini Index in Jay County is 0.44.
How Large is the Labor Force in Jay County?
There are 9,564 People in the Labor Forcein in Jay County.
What is the Percentage of People in the Labor Force in Jay County?
60.6% of People are in the Labor Force in Jay County.
What is the Unemployment Rate in Jay County?
Unemployment Rate in Jay County is 4.4%.