Jasper County, IN
Jasper County Map
Jasper County Overview
33,045
TOTAL POPULATION
16,600
MALE POPULATION
16,445
FEMALE POPULATION
100.94
MALES / 100 FEMALES
99.07
FEMALES / 100 MALES
41.4
MEDIAN AGE
3.1
AVG FAMILY SIZE
2.6
AVG HOUSEHOLD SIZE
$35,793
PER CAPITA INCOME
$90,042
AVG FAMILY INCOME
$77,777
AVG HOUSEHOLD INCOME
51.6%
WAGE / INCOME GAP [ % ]
48.4¢/ $1
WAGE / INCOME GAP [ $ ]
$12,617
FAMILY INCOME DEFICIT
0.41
INEQUALITY / GINI INDEX
16,068
LABOR FORCE [ PEOPLE ]
61.1%
PERCENT IN LABOR FORCE
4.1%
UNEMPLOYMENT RATE
Jasper County Area Codes
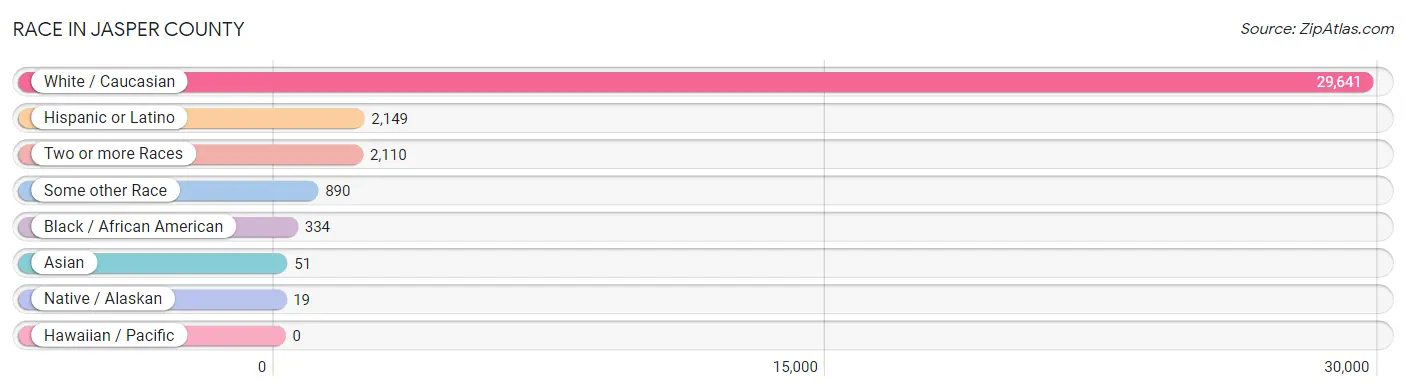
Race in Jasper County
The most populous races in Jasper County are White / Caucasian (29,641 | 89.7%), Hispanic or Latino (2,149 | 6.5%), and Two or more Races (2,110 | 6.4%).
| Race | # Population | % Population |
| Asian | 51 | 0.2% |
| Black / African American | 334 | 1.0% |
| Hawaiian / Pacific | 0 | 0.0% |
| Hispanic or Latino | 2,149 | 6.5% |
| Native / Alaskan | 19 | 0.1% |
| White / Caucasian | 29,641 | 89.7% |
| Two or more Races | 2,110 | 6.4% |
| Some other Race | 890 | 2.7% |
| Total | 33,045 | 100.0% |
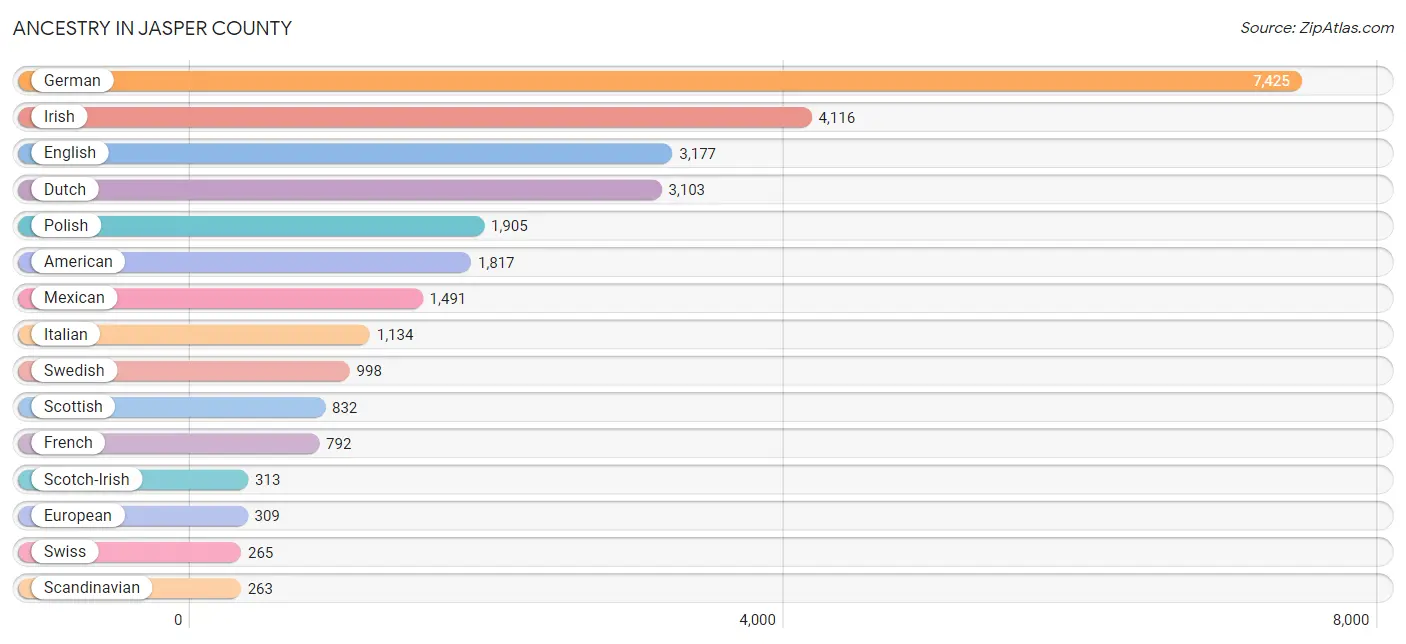
Ancestry in Jasper County
The most populous ancestries reported in Jasper County are German (7,425 | 22.5%), Irish (4,116 | 12.5%), English (3,177 | 9.6%), Dutch (3,103 | 9.4%), and Polish (1,905 | 5.8%), together accounting for 59.7% of all Jasper County residents.
| Ancestry | # Population | % Population |
| African | 9 | 0.0% |
| American | 1,817 | 5.5% |
| Arab | 54 | 0.2% |
| Armenian | 3 | 0.0% |
| Australian | 6 | 0.0% |
| Austrian | 53 | 0.2% |
| Bahamian | 18 | 0.1% |
| Belgian | 48 | 0.2% |
| Belizean | 40 | 0.1% |
| Bhutanese | 4 | 0.0% |
| Blackfeet | 68 | 0.2% |
| Brazilian | 2 | 0.0% |
| British | 97 | 0.3% |
| Burmese | 11 | 0.0% |
| Central American | 243 | 0.7% |
| Cherokee | 161 | 0.5% |
| Chippewa | 38 | 0.1% |
| Colombian | 73 | 0.2% |
| Croatian | 96 | 0.3% |
| Cuban | 8 | 0.0% |
| Czech | 164 | 0.5% |
| Czechoslovakian | 6 | 0.0% |
| Danish | 52 | 0.2% |
| Dominican | 8 | 0.0% |
| Dutch | 3,103 | 9.4% |
| Eastern European | 17 | 0.1% |
| English | 3,177 | 9.6% |
| Ethiopian | 50 | 0.2% |
| European | 309 | 0.9% |
| Filipino | 5 | 0.0% |
| Finnish | 25 | 0.1% |
| French | 792 | 2.4% |
| French American Indian | 5 | 0.0% |
| French Canadian | 56 | 0.2% |
| German | 7,425 | 22.5% |
| Greek | 159 | 0.5% |
| Guatemalan | 1 | 0.0% |
| Honduran | 47 | 0.1% |
| Hungarian | 156 | 0.5% |
| Indian (Asian) | 43 | 0.1% |
| Irish | 4,116 | 12.5% |
| Italian | 1,134 | 3.4% |
| Korean | 29 | 0.1% |
| Laotian | 17 | 0.1% |
| Latvian | 4 | 0.0% |
| Lebanese | 5 | 0.0% |
| Lithuanian | 87 | 0.3% |
| Macedonian | 2 | 0.0% |
| Mexican | 1,491 | 4.5% |
| Mexican American Indian | 35 | 0.1% |
| Norwegian | 155 | 0.5% |
| Pennsylvania German | 39 | 0.1% |
| Polish | 1,905 | 5.8% |
| Puerto Rican | 190 | 0.6% |
| Romanian | 105 | 0.3% |
| Russian | 93 | 0.3% |
| Salvadoran | 195 | 0.6% |
| Scandinavian | 263 | 0.8% |
| Scotch-Irish | 313 | 0.9% |
| Scottish | 832 | 2.5% |
| Serbian | 70 | 0.2% |
| Slovak | 156 | 0.5% |
| Slovene | 51 | 0.2% |
| South American | 73 | 0.2% |
| Spaniard | 17 | 0.1% |
| Spanish | 16 | 0.1% |
| Subsaharan African | 59 | 0.2% |
| Swedish | 998 | 3.0% |
| Swiss | 265 | 0.8% |
| Syrian | 49 | 0.2% |
| Ukrainian | 55 | 0.2% |
| Welsh | 133 | 0.4% |
| Yugoslavian | 13 | 0.0% | View All 73 Rows |
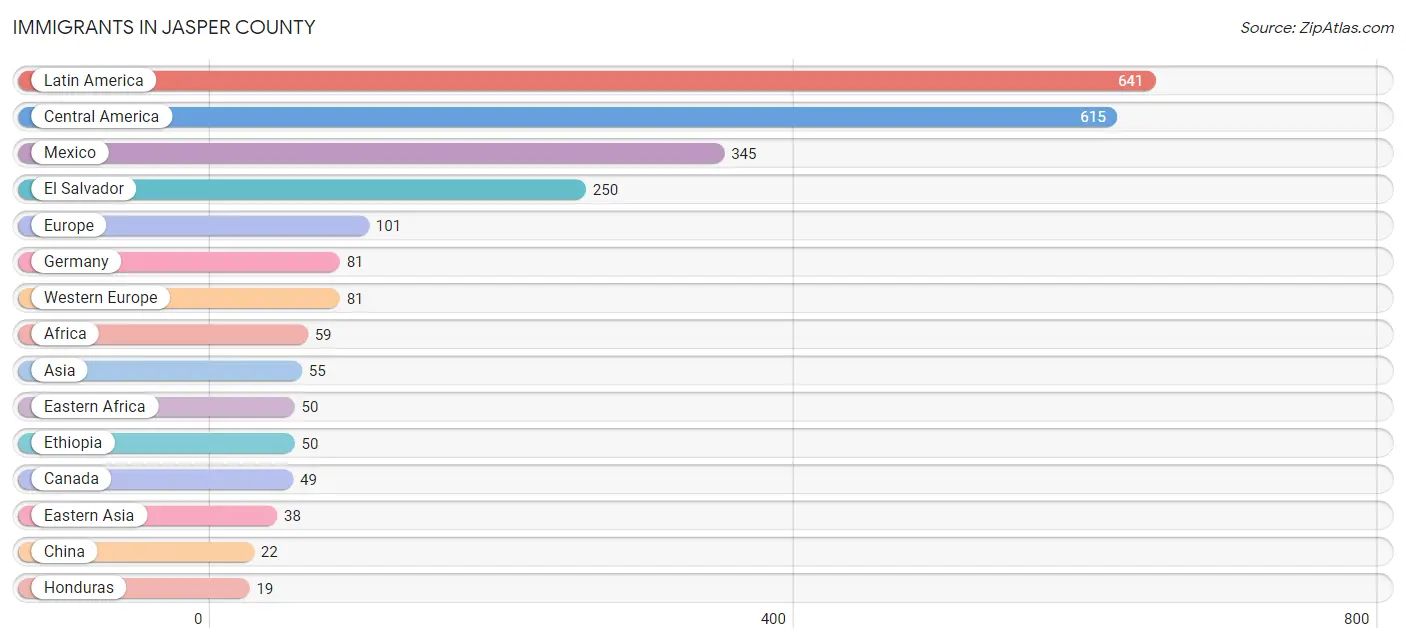
Immigrants in Jasper County
The most numerous immigrant groups reported in Jasper County came from Latin America (641 | 1.9%), Central America (615 | 1.9%), Mexico (345 | 1.0%), El Salvador (250 | 0.8%), and Europe (101 | 0.3%), together accounting for 5.9% of all Jasper County residents.
| Immigration Origin | # Population | % Population |
| Africa | 59 | 0.2% |
| Asia | 55 | 0.2% |
| Brazil | 2 | 0.0% |
| Canada | 49 | 0.2% |
| Caribbean | 8 | 0.0% |
| Central America | 615 | 1.9% |
| China | 22 | 0.1% |
| Colombia | 16 | 0.1% |
| Congo | 9 | 0.0% |
| Dominican Republic | 8 | 0.0% |
| Eastern Africa | 50 | 0.2% |
| Eastern Asia | 38 | 0.1% |
| Eastern Europe | 16 | 0.1% |
| El Salvador | 250 | 0.8% |
| Ethiopia | 50 | 0.2% |
| Europe | 101 | 0.3% |
| Germany | 81 | 0.3% |
| Guatemala | 1 | 0.0% |
| Honduras | 19 | 0.1% |
| Indonesia | 17 | 0.1% |
| Korea | 16 | 0.1% |
| Latin America | 641 | 1.9% |
| Mexico | 345 | 1.0% |
| Middle Africa | 9 | 0.0% |
| Poland | 5 | 0.0% |
| Romania | 11 | 0.0% |
| South America | 18 | 0.1% |
| South Eastern Asia | 17 | 0.1% |
| Southern Europe | 4 | 0.0% |
| Spain | 4 | 0.0% |
| Western Europe | 81 | 0.3% | View All 31 Rows |
Sex and Age in Jasper County
Sex and Age in Jasper County
The most populous age groups in Jasper County are 55 to 59 Years (1,204 | 7.2%) for men and 55 to 59 Years (1,191 | 7.2%) for women.
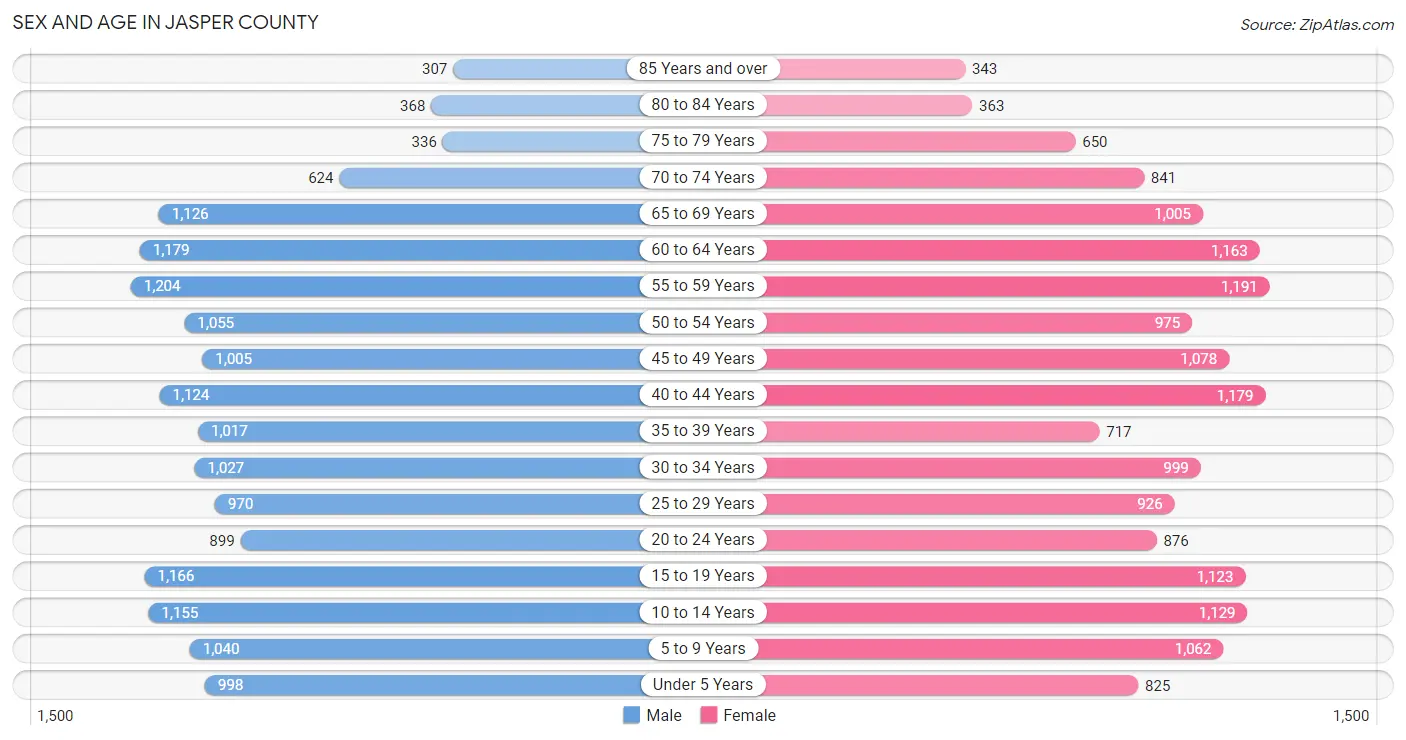
| Age Bracket | Male | Female |
| Under 5 Years | 998 (6.0%) | 825 (5.0%) |
| 5 to 9 Years | 1,040 (6.3%) | 1,062 (6.5%) |
| 10 to 14 Years | 1,155 (7.0%) | 1,129 (6.9%) |
| 15 to 19 Years | 1,166 (7.0%) | 1,123 (6.8%) |
| 20 to 24 Years | 899 (5.4%) | 876 (5.3%) |
| 25 to 29 Years | 970 (5.8%) | 926 (5.6%) |
| 30 to 34 Years | 1,027 (6.2%) | 999 (6.1%) |
| 35 to 39 Years | 1,017 (6.1%) | 717 (4.4%) |
| 40 to 44 Years | 1,124 (6.8%) | 1,179 (7.2%) |
| 45 to 49 Years | 1,005 (6.0%) | 1,078 (6.6%) |
| 50 to 54 Years | 1,055 (6.4%) | 975 (5.9%) |
| 55 to 59 Years | 1,204 (7.2%) | 1,191 (7.2%) |
| 60 to 64 Years | 1,179 (7.1%) | 1,163 (7.1%) |
| 65 to 69 Years | 1,126 (6.8%) | 1,005 (6.1%) |
| 70 to 74 Years | 624 (3.8%) | 841 (5.1%) |
| 75 to 79 Years | 336 (2.0%) | 650 (4.0%) |
| 80 to 84 Years | 368 (2.2%) | 363 (2.2%) |
| 85 Years and over | 307 (1.8%) | 343 (2.1%) |
| Total | 16,600 (100.0%) | 16,445 (100.0%) |
Families and Households in Jasper County
Median Family Size in Jasper County
The median family size in Jasper County is 3.09 persons per family, with married-couple families (6,835 | 78.4%) accounting for the largest median family size of 3.15 persons per family. On the other hand, single female/mother families (1,208 | 13.9%) represent the smallest median family size with 2.82 persons per family.

| Family Type | # Families | Family Size |
| Married-Couple | 6,835 (78.4%) | 3.15 |
| Single Male/Father | 677 (7.8%) | 2.92 |
| Single Female/Mother | 1,208 (13.9%) | 2.82 |
| Total Families | 8,720 (100.0%) | 3.09 |
Median Household Size in Jasper County
The median household size in Jasper County is 2.58 persons per household, with single male/father households (677 | 5.4%) accounting for the largest median household size of 3.78 persons per household. non-family households (3,834 | 30.5%) represent the smallest median household size with 1.15 persons per household.

| Household Type | # Households | Household Size |
| Married-Couple | 6,835 (54.4%) | 3.17 |
| Single Male/Father | 677 (5.4%) | 3.78 |
| Single Female/Mother | 1,208 (9.6%) | 3.11 |
| Non-family | 3,834 (30.5%) | 1.15 |
| Total Households | 12,554 (100.0%) | 2.58 |
Household Size by Marriage Status in Jasper County
Out of a total of 12,554 households in Jasper County, 8,720 (69.5%) are family households, while 3,834 (30.5%) are nonfamily households. The most numerous type of family households are 2-person households, comprising 4,175, and the most common type of nonfamily households are 1-person households, comprising 3,343.
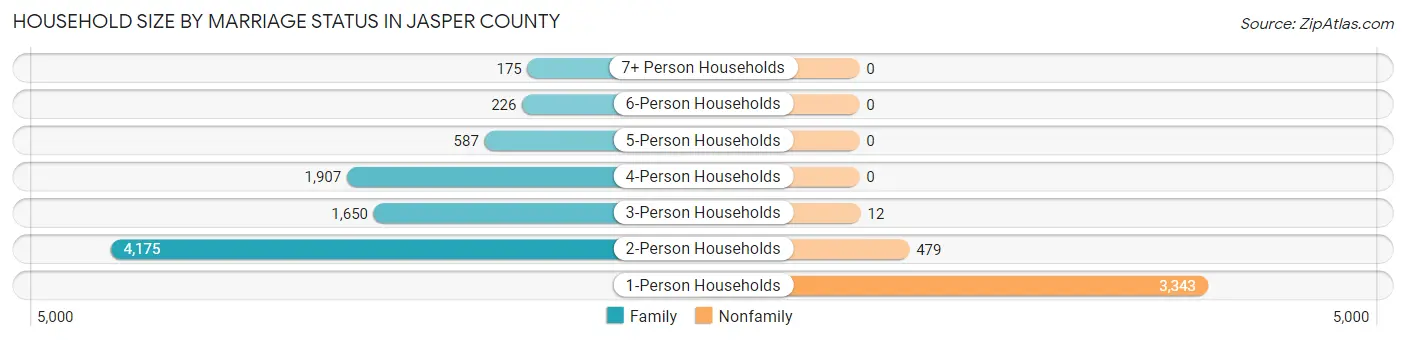
| Household Size | Family Households | Nonfamily Households |
| 1-Person Households | - | 3,343 (26.6%) |
| 2-Person Households | 4,175 (33.3%) | 479 (3.8%) |
| 3-Person Households | 1,650 (13.1%) | 12 (0.1%) |
| 4-Person Households | 1,907 (15.2%) | 0 (0.0%) |
| 5-Person Households | 587 (4.7%) | 0 (0.0%) |
| 6-Person Households | 226 (1.8%) | 0 (0.0%) |
| 7+ Person Households | 175 (1.4%) | 0 (0.0%) |
| Total | 8,720 (69.5%) | 3,834 (30.5%) |
Female Fertility in Jasper County
Fertility by Age in Jasper County
Average fertility rate in Jasper County is 81.0 births per 1,000 women. Women in the age bracket of 20 to 34 years have the highest fertility rate with 162.0 births per 1,000 women. Women in the age bracket of 20 to 34 years acount for 77.6% of all women with births.
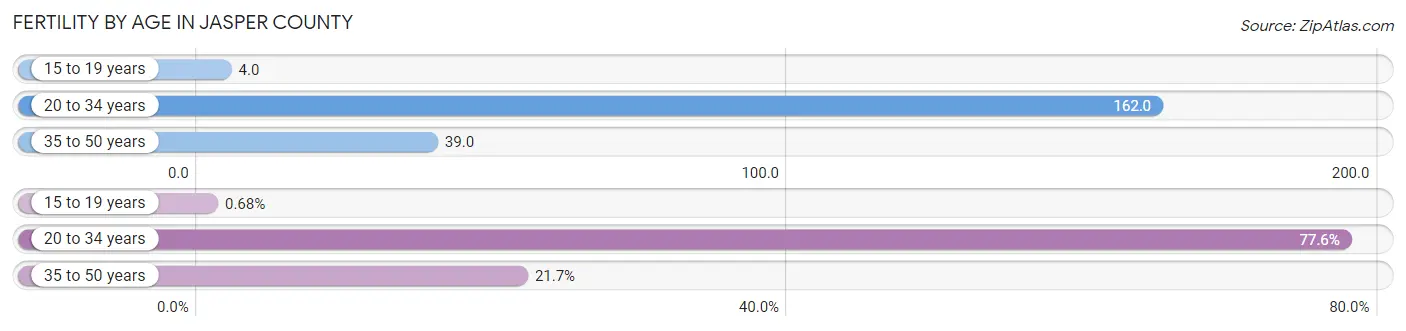
| Age Bracket | Women with Births | Births / 1,000 Women |
| 15 to 19 years | 4 (0.7%) | 4.0 |
| 20 to 34 years | 454 (77.6%) | 162.0 |
| 35 to 50 years | 127 (21.7%) | 39.0 |
| Total | 585 (100.0%) | 81.0 |
Fertility by Age by Marriage Status in Jasper County
69.9% of women with births (585) in Jasper County are married. The highest percentage of unmarried women with births falls into 15 to 19 years age bracket with 100.0% of them unmarried at the time of birth, while the lowest percentage of unmarried women with births belong to 35 to 50 years age bracket with 0.0% of them unmarried.
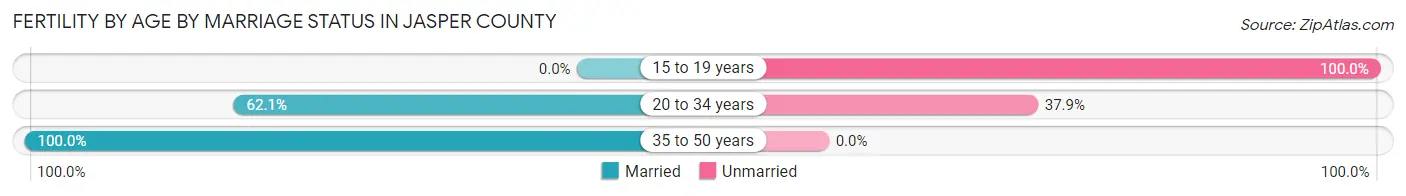
| Age Bracket | Married | Unmarried |
| 15 to 19 years | 0 (0.0%) | 4 (100.0%) |
| 20 to 34 years | 282 (62.1%) | 172 (37.9%) |
| 35 to 50 years | 127 (100.0%) | 0 (0.0%) |
| Total | 409 (69.9%) | 176 (30.1%) |
Fertility by Education in Jasper County
Average fertility rate in Jasper County is 81.0 births per 1,000 women. Women with the education attainment of college or associate's degree have the highest fertility rate of 121.0 births per 1,000 women, while women with the education attainment of less than high school have the lowest fertility at 23.0 births per 1,000 women. Women with the education attainment of college or associate's degree represent 48.2% of all women with births.

| Educational Attainment | Women with Births | Births / 1,000 Women |
| Less than High School | 28 (4.8%) | 23.0 |
| High School Diploma | 143 (24.4%) | 73.0 |
| College or Associate's Degree | 282 (48.2%) | 121.0 |
| Bachelor's Degree | 120 (20.5%) | 88.0 |
| Graduate Degree | 12 (2.1%) | 39.0 |
| Total | 585 (100.0%) | 81.0 |
Fertility by Education by Marriage Status in Jasper County
30.1% of women with births in Jasper County are unmarried. Women with the educational attainment of graduate degree are most likely to be married with 100.0% of them married at childbirth, while women with the educational attainment of high school diploma are least likely to be married with 48.2% of them unmarried at childbirth.

| Educational Attainment | Married | Unmarried |
| Less than High School | 19 (67.9%) | 9 (32.1%) |
| High School Diploma | 74 (51.7%) | 69 (48.2%) |
| College or Associate's Degree | 224 (79.4%) | 58 (20.6%) |
| Bachelor's Degree | 80 (66.7%) | 40 (33.3%) |
| Graduate Degree | 12 (100.0%) | 0 (0.0%) |
| Total | 409 (69.9%) | 176 (30.1%) |
Income in Jasper County
Income Overview in Jasper County
Per Capita Income in Jasper County is $35,793, while median incomes of families and households are $90,042 and $77,777 respectively.
| Characteristic | Number | Measure |
| Per Capita Income | 33,045 | $35,793 |
| Median Family Income | 8,720 | $90,042 |
| Mean Family Income | 8,720 | $107,143 |
| Median Household Income | 12,554 | $77,777 |
| Mean Household Income | 12,554 | $91,528 |
| Income Deficit | 8,720 | $12,617 |
| Wage / Income Gap (%) | 33,045 | 51.65% |
| Wage / Income Gap ($) | 33,045 | 48.35¢ per $1 |
| Gini / Inequality Index | 33,045 | 0.41 |
Earnings by Sex in Jasper County
Average Earnings in Jasper County are $45,076, $58,936 for men and $28,498 for women, a difference of 51.6%.
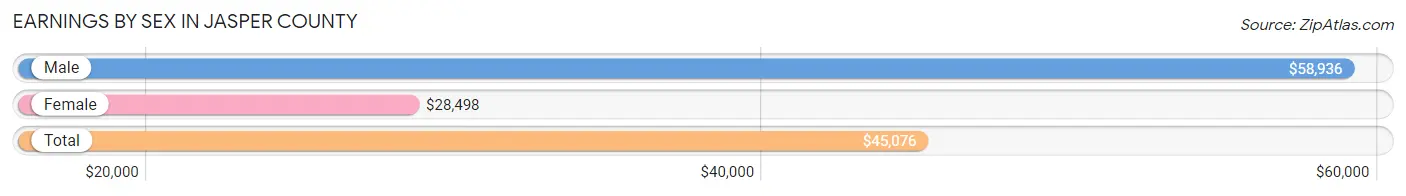
| Sex | Number | Average Earnings |
| Male | 9,240 (54.8%) | $58,936 |
| Female | 7,608 (45.2%) | $28,498 |
| Total | 16,848 (100.0%) | $45,076 |
Earnings by Sex by Income Bracket in Jasper County
The most common earnings brackets in Jasper County are $100,000+ for men (1,802 | 19.5%) and $5,000 to $7,499 for women (629 | 8.3%).
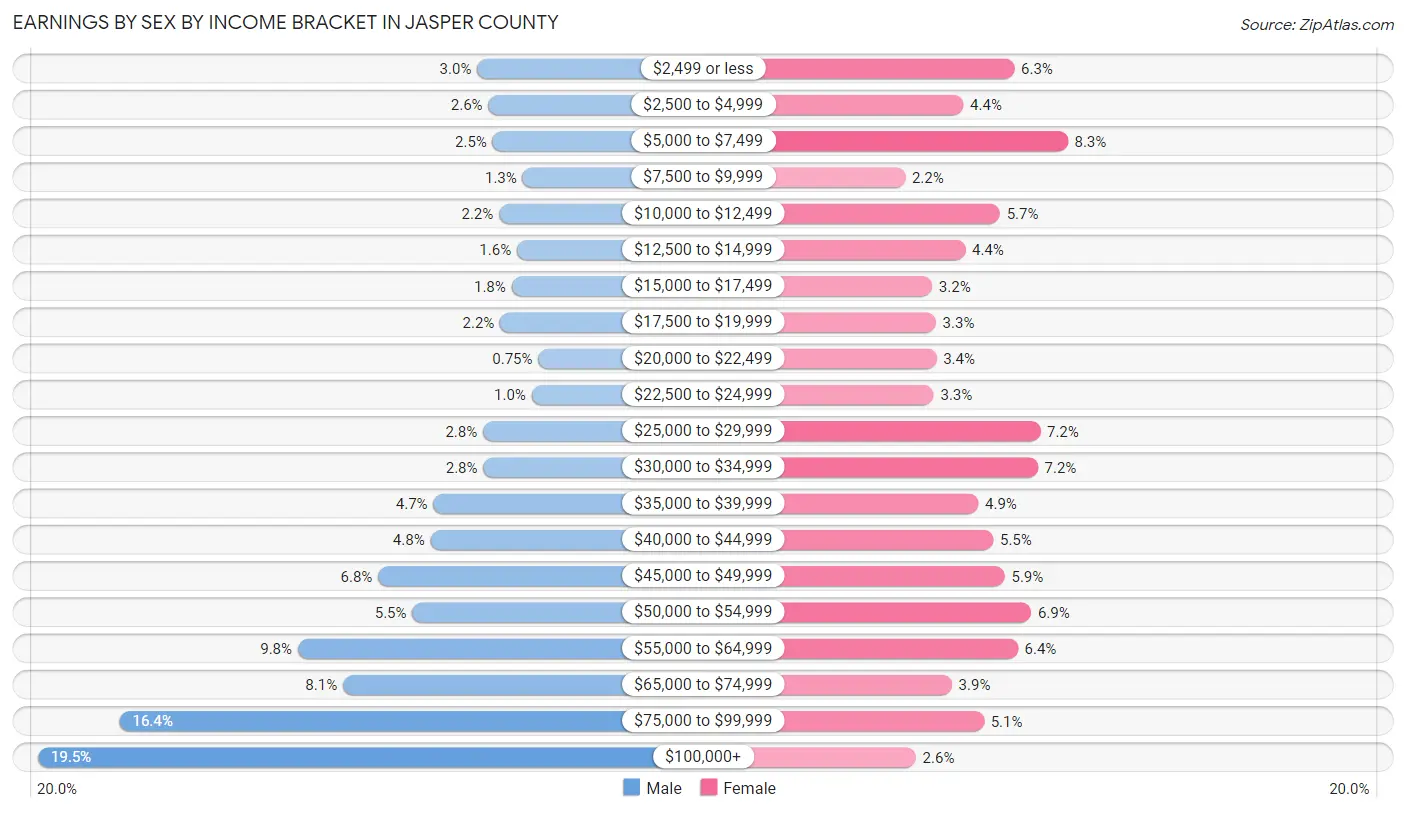
| Income | Male | Female |
| $2,499 or less | 281 (3.0%) | 477 (6.3%) |
| $2,500 to $4,999 | 242 (2.6%) | 332 (4.4%) |
| $5,000 to $7,499 | 227 (2.5%) | 629 (8.3%) |
| $7,500 to $9,999 | 124 (1.3%) | 166 (2.2%) |
| $10,000 to $12,499 | 205 (2.2%) | 436 (5.7%) |
| $12,500 to $14,999 | 143 (1.5%) | 337 (4.4%) |
| $15,000 to $17,499 | 162 (1.8%) | 243 (3.2%) |
| $17,500 to $19,999 | 201 (2.2%) | 253 (3.3%) |
| $20,000 to $22,499 | 69 (0.7%) | 255 (3.4%) |
| $22,500 to $24,999 | 92 (1.0%) | 247 (3.3%) |
| $25,000 to $29,999 | 261 (2.8%) | 551 (7.2%) |
| $30,000 to $34,999 | 260 (2.8%) | 544 (7.1%) |
| $35,000 to $39,999 | 432 (4.7%) | 374 (4.9%) |
| $40,000 to $44,999 | 443 (4.8%) | 417 (5.5%) |
| $45,000 to $49,999 | 624 (6.8%) | 450 (5.9%) |
| $50,000 to $54,999 | 505 (5.5%) | 525 (6.9%) |
| $55,000 to $64,999 | 902 (9.8%) | 487 (6.4%) |
| $65,000 to $74,999 | 746 (8.1%) | 299 (3.9%) |
| $75,000 to $99,999 | 1,519 (16.4%) | 390 (5.1%) |
| $100,000+ | 1,802 (19.5%) | 196 (2.6%) |
| Total | 9,240 (100.0%) | 7,608 (100.0%) |
Earnings by Sex by Educational Attainment in Jasper County
Average earnings in Jasper County are $64,206 for men and $33,000 for women, a difference of 48.6%. Men with an educational attainment of graduate degree enjoy the highest average annual earnings of $78,246, while those with less than high school education earn the least with $43,462. Women with an educational attainment of graduate degree earn the most with the average annual earnings of $55,000, while those with less than high school education have the smallest earnings of $22,807.
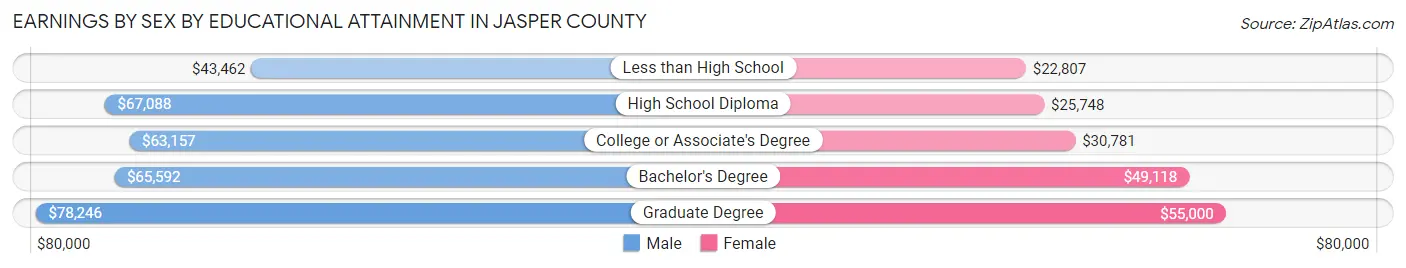
| Educational Attainment | Male Income | Female Income |
| Less than High School | $43,462 | $22,807 |
| High School Diploma | $67,088 | $25,748 |
| College or Associate's Degree | $63,157 | $30,781 |
| Bachelor's Degree | $65,592 | $49,118 |
| Graduate Degree | $78,246 | $55,000 |
| Total | $64,206 | $33,000 |
Family Income in Jasper County
Family Income Brackets in Jasper County
According to the Jasper County family income data, there are 2,328 families falling into the $100,000 to $149,999 income range, which is the most common income bracket and makes up 26.7% of all families. Conversely, the $10,000 to $14,999 income bracket is the least frequent group with only 61 families (0.7%) belonging to this category.
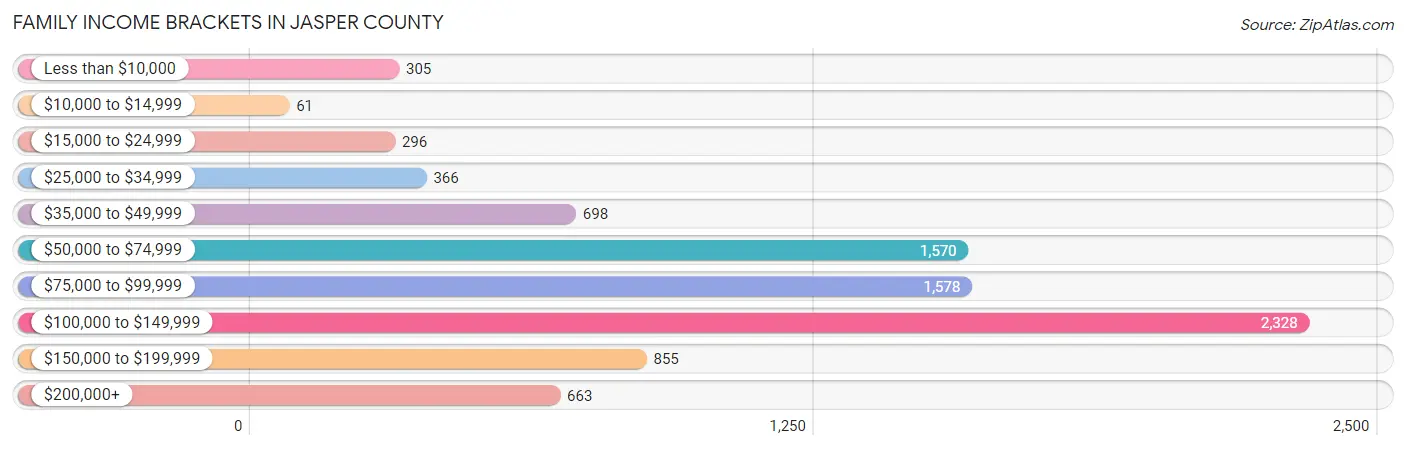
| Income Bracket | # Families | % Families |
| Less than $10,000 | 305 | 3.5% |
| $10,000 to $14,999 | 61 | 0.7% |
| $15,000 to $24,999 | 296 | 3.4% |
| $25,000 to $34,999 | 366 | 4.2% |
| $35,000 to $49,999 | 698 | 8.0% |
| $50,000 to $74,999 | 1,570 | 18.0% |
| $75,000 to $99,999 | 1,578 | 18.1% |
| $100,000 to $149,999 | 2,328 | 26.7% |
| $150,000 to $199,999 | 855 | 9.8% |
| $200,000+ | 663 | 7.6% |
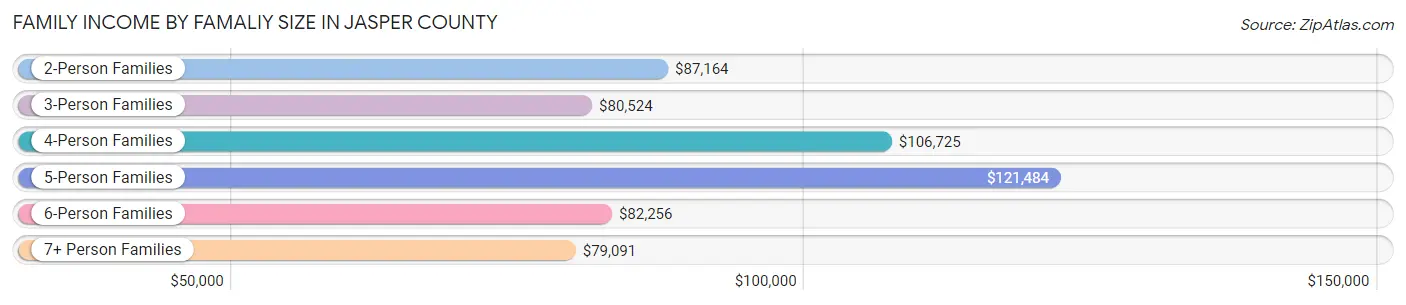
Family Income by Famaliy Size in Jasper County
5-person families (481 | 5.5%) account for the highest median family income in Jasper County with $121,484 per family, while 2-person families (4,397 | 50.4%) have the highest median income of $43,582 per family member.
| Income Bracket | # Families | Median Income |
| 2-Person Families | 4,397 (50.4%) | $87,164 |
| 3-Person Families | 1,797 (20.6%) | $80,524 |
| 4-Person Families | 1,693 (19.4%) | $106,725 |
| 5-Person Families | 481 (5.5%) | $121,484 |
| 6-Person Families | 202 (2.3%) | $82,256 |
| 7+ Person Families | 150 (1.7%) | $79,091 |
| Total | 8,720 (100.0%) | $90,042 |
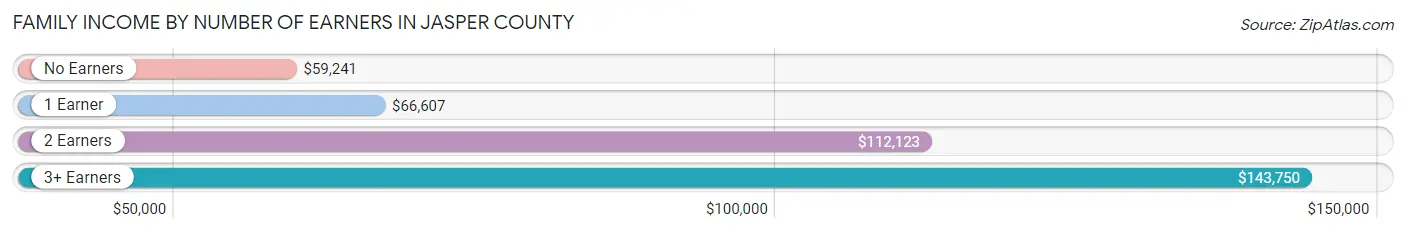
Family Income by Number of Earners in Jasper County
The median family income in Jasper County is $90,042, with families comprising 3+ earners (799) having the highest median family income of $143,750, while families with no earners (1,349) have the lowest median family income of $59,241, accounting for 9.2% and 15.5% of families, respectively.
| Number of Earners | # Families | Median Income |
| No Earners | 1,349 (15.5%) | $59,241 |
| 1 Earner | 2,796 (32.1%) | $66,607 |
| 2 Earners | 3,776 (43.3%) | $112,123 |
| 3+ Earners | 799 (9.2%) | $143,750 |
| Total | 8,720 (100.0%) | $90,042 |
Household Income in Jasper County
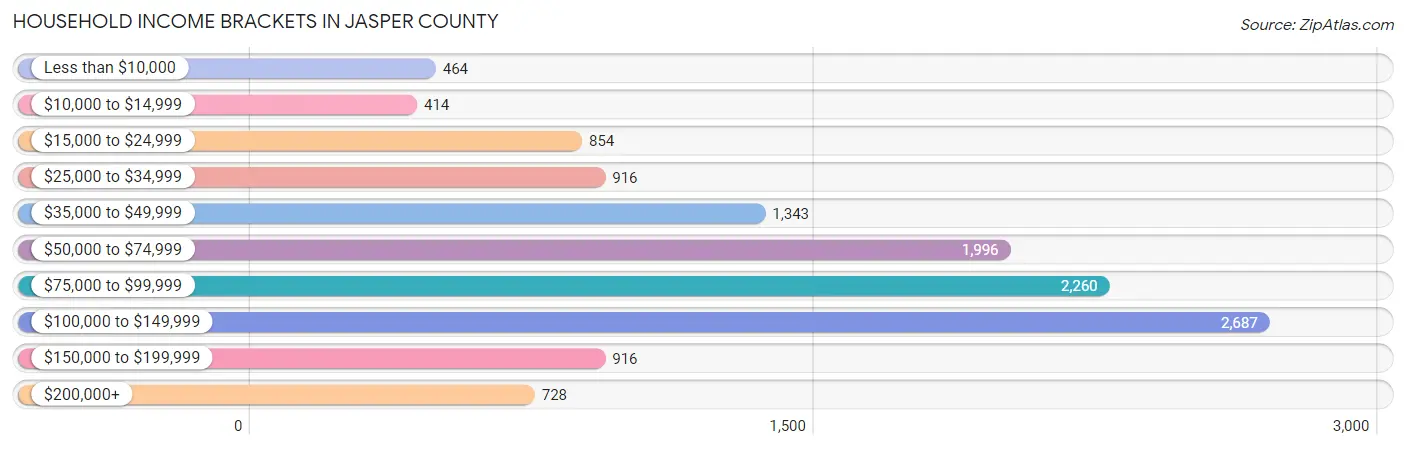
Household Income Brackets in Jasper County
With 2,687 households falling in the category, the $100,000 to $149,999 income range is the most frequent in Jasper County, accounting for 21.4% of all households. In contrast, only 414 households (3.3%) fall into the $10,000 to $14,999 income bracket, making it the least populous group.
| Income Bracket | # Households | % Households |
| Less than $10,000 | 464 | 3.7% |
| $10,000 to $14,999 | 414 | 3.3% |
| $15,000 to $24,999 | 854 | 6.8% |
| $25,000 to $34,999 | 916 | 7.3% |
| $35,000 to $49,999 | 1,343 | 10.7% |
| $50,000 to $74,999 | 1,996 | 15.9% |
| $75,000 to $99,999 | 2,260 | 18.0% |
| $100,000 to $149,999 | 2,687 | 21.4% |
| $150,000 to $199,999 | 916 | 7.3% |
| $200,000+ | 728 | 5.8% |
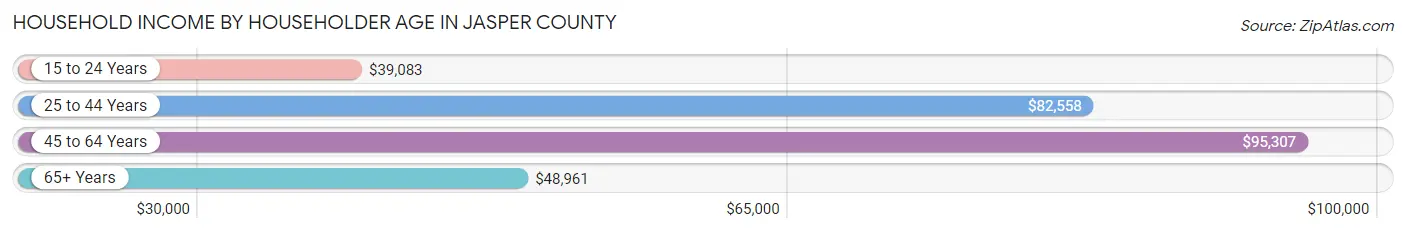
Household Income by Householder Age in Jasper County
The median household income in Jasper County is $77,777, with the highest median household income of $95,307 found in the 45 to 64 years age bracket for the primary householder. A total of 4,823 households (38.4%) fall into this category. Meanwhile, the 15 to 24 years age bracket for the primary householder has the lowest median household income of $39,083, with 262 households (2.1%) in this group.
| Income Bracket | # Households | Median Income |
| 15 to 24 Years | 262 (2.1%) | $39,083 |
| 25 to 44 Years | 3,663 (29.2%) | $82,558 |
| 45 to 64 Years | 4,823 (38.4%) | $95,307 |
| 65+ Years | 3,806 (30.3%) | $48,961 |
| Total | 12,554 (100.0%) | $77,777 |
Poverty in Jasper County
Income Below Poverty by Sex and Age in Jasper County
With 5.0% poverty level for males and 10.0% for females among the residents of Jasper County, 18 to 24 year old males and 15 year old females are the most vulnerable to poverty, with 215 males (18.5%) and 65 females (24.3%) in their respective age groups living below the poverty level.
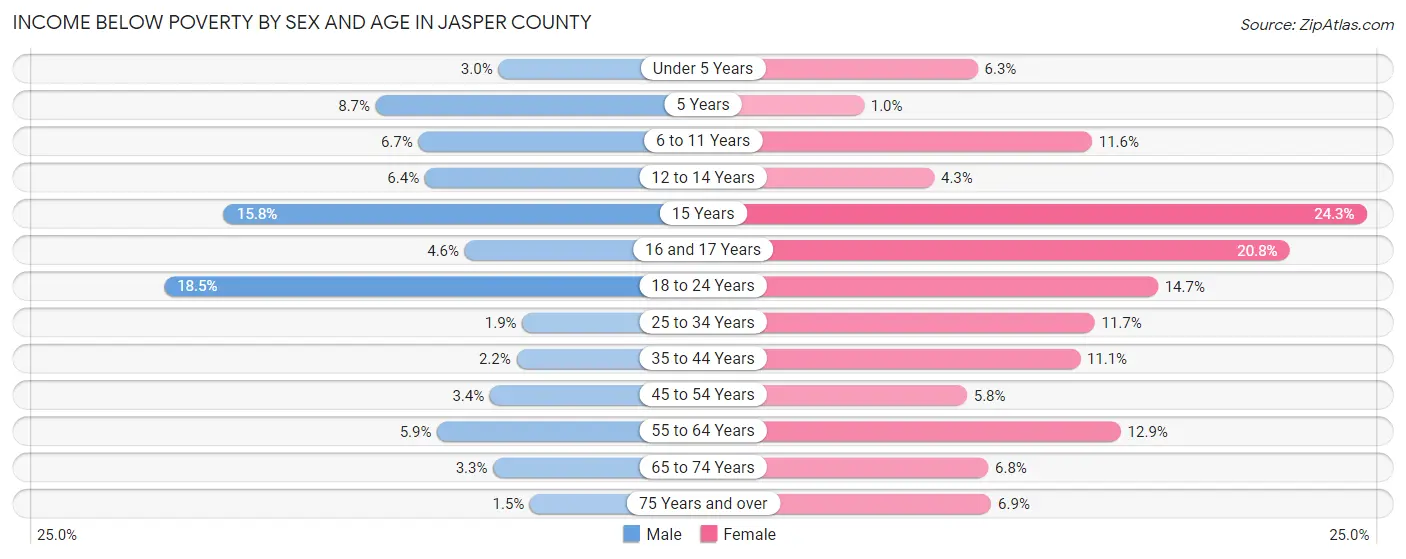
| Age Bracket | Male | Female |
| Under 5 Years | 30 (3.0%) | 52 (6.3%) |
| 5 Years | 14 (8.7%) | 2 (1.0%) |
| 6 to 11 Years | 82 (6.7%) | 141 (11.6%) |
| 12 to 14 Years | 51 (6.4%) | 32 (4.3%) |
| 15 Years | 40 (15.8%) | 65 (24.3%) |
| 16 and 17 Years | 22 (4.6%) | 86 (20.8%) |
| 18 to 24 Years | 215 (18.5%) | 163 (14.7%) |
| 25 to 34 Years | 37 (1.9%) | 225 (11.7%) |
| 35 to 44 Years | 46 (2.2%) | 208 (11.1%) |
| 45 to 54 Years | 70 (3.4%) | 119 (5.8%) |
| 55 to 64 Years | 139 (5.9%) | 304 (12.9%) |
| 65 to 74 Years | 56 (3.3%) | 124 (6.8%) |
| 75 Years and over | 15 (1.5%) | 89 (6.9%) |
| Total | 817 (5.0%) | 1,610 (10.0%) |
Income Above Poverty by Sex and Age in Jasper County
According to the poverty statistics in Jasper County, males aged 75 years and over and females aged 5 years are the age groups that are most secure financially, with 98.5% of males and 99.0% of females in these age groups living above the poverty line.
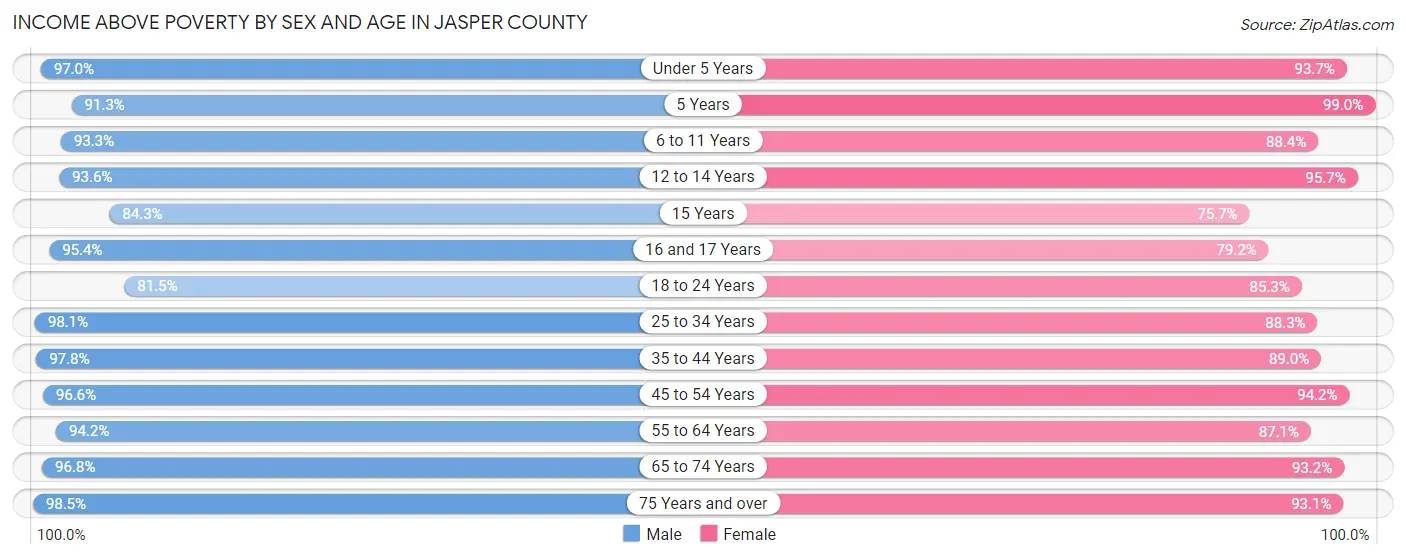
| Age Bracket | Male | Female |
| Under 5 Years | 968 (97.0%) | 773 (93.7%) |
| 5 Years | 147 (91.3%) | 194 (99.0%) |
| 6 to 11 Years | 1,139 (93.3%) | 1,075 (88.4%) |
| 12 to 14 Years | 743 (93.6%) | 715 (95.7%) |
| 15 Years | 214 (84.3%) | 202 (75.7%) |
| 16 and 17 Years | 459 (95.4%) | 328 (79.2%) |
| 18 to 24 Years | 946 (81.5%) | 949 (85.3%) |
| 25 to 34 Years | 1,908 (98.1%) | 1,693 (88.3%) |
| 35 to 44 Years | 2,077 (97.8%) | 1,675 (88.9%) |
| 45 to 54 Years | 1,986 (96.6%) | 1,931 (94.2%) |
| 55 to 64 Years | 2,237 (94.2%) | 2,046 (87.1%) |
| 65 to 74 Years | 1,669 (96.8%) | 1,703 (93.2%) |
| 75 Years and over | 962 (98.5%) | 1,196 (93.1%) |
| Total | 15,455 (95.0%) | 14,480 (90.0%) |
Income Below Poverty Among Married-Couple Families in Jasper County
The poverty statistics for married-couple families in Jasper County show that 2.9% or 195 of the total 6,835 families live below the poverty line. Families with 5 or more children have the highest poverty rate of 13.0%, comprising of 12 families. On the other hand, families with 1 or 2 children have the lowest poverty rate of 1.2%, which includes 26 families.
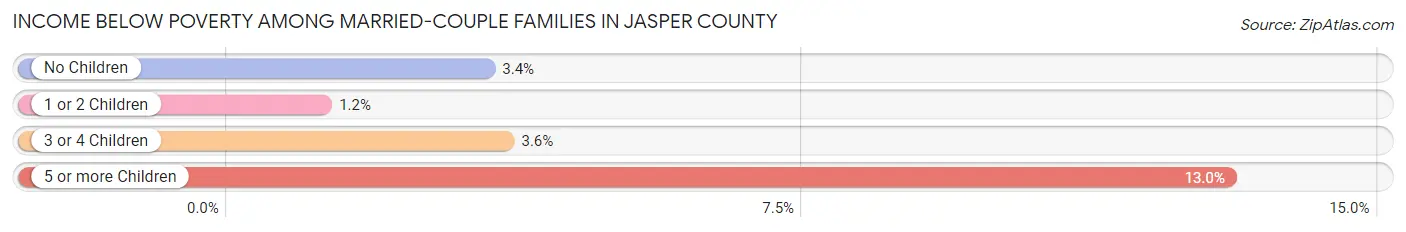
| Children | Above Poverty | Below Poverty |
| No Children | 3,996 (96.6%) | 139 (3.4%) |
| 1 or 2 Children | 2,084 (98.8%) | 26 (1.2%) |
| 3 or 4 Children | 480 (96.4%) | 18 (3.6%) |
| 5 or more Children | 80 (87.0%) | 12 (13.0%) |
| Total | 6,640 (97.2%) | 195 (2.9%) |
Income Below Poverty Among Single-Parent Households in Jasper County
According to the poverty data in Jasper County, 2.8% or 19 single-father households and 23.4% or 283 single-mother households are living below the poverty line. Among single-father households, those with 1 or 2 children have the highest poverty rate, with 11 households (3.0%) experiencing poverty. Likewise, among single-mother households, those with 1 or 2 children have the highest poverty rate, with 277 households (34.7%) falling below the poverty line.
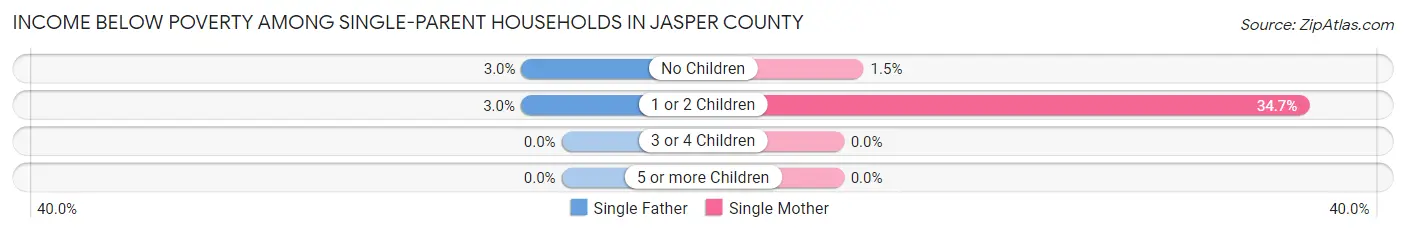
| Children | Single Father | Single Mother |
| No Children | 8 (3.0%) | 6 (1.5%) |
| 1 or 2 Children | 11 (3.0%) | 277 (34.7%) |
| 3 or 4 Children | 0 (0.0%) | 0 (0.0%) |
| 5 or more Children | 0 (0.0%) | 0 (0.0%) |
| Total | 19 (2.8%) | 283 (23.4%) |
Income Below Poverty Among Married-Couple vs Single-Parent Households in Jasper County
The poverty data for Jasper County shows that 195 of the married-couple family households (2.9%) and 302 of the single-parent households (16.0%) are living below the poverty level. Within the married-couple family households, those with 5 or more children have the highest poverty rate, with 12 households (13.0%) falling below the poverty line. Among the single-parent households, those with 1 or 2 children have the highest poverty rate, with 288 household (24.8%) living below poverty.
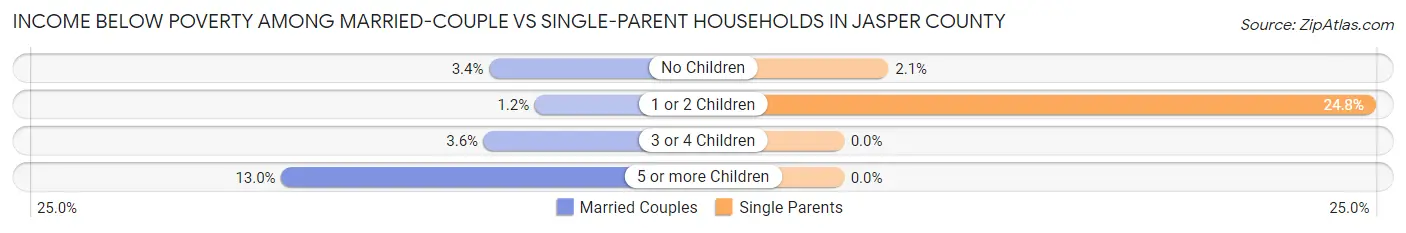
| Children | Married-Couple Families | Single-Parent Households |
| No Children | 139 (3.4%) | 14 (2.1%) |
| 1 or 2 Children | 26 (1.2%) | 288 (24.8%) |
| 3 or 4 Children | 18 (3.6%) | 0 (0.0%) |
| 5 or more Children | 12 (13.0%) | 0 (0.0%) |
| Total | 195 (2.9%) | 302 (16.0%) |
Employment Characteristics in Jasper County
Employment by Class of Employer in Jasper County
Among the 14,923 employed individuals in Jasper County, private company employees (10,604 | 71.1%), not-for-profit organizations (1,185 | 7.9%), and local government employees (942 | 6.3%) make up the most common classes of employment.
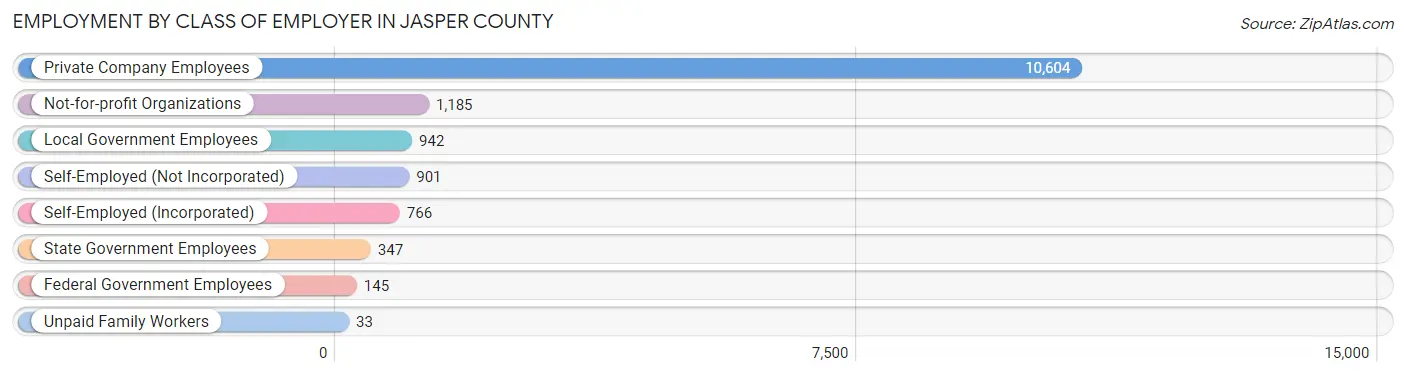
| Employer Class | # Employees | % Employees |
| Private Company Employees | 10,604 | 71.1% |
| Self-Employed (Incorporated) | 766 | 5.1% |
| Self-Employed (Not Incorporated) | 901 | 6.0% |
| Not-for-profit Organizations | 1,185 | 7.9% |
| Local Government Employees | 942 | 6.3% |
| State Government Employees | 347 | 2.3% |
| Federal Government Employees | 145 | 1.0% |
| Unpaid Family Workers | 33 | 0.2% |
| Total | 14,923 | 100.0% |
Employment Status by Age in Jasper County
According to the labor force statistics for Jasper County, out of the total population over 16 years of age (26,298), 61.1% or 16,068 individuals are in the labor force, with 4.1% or 659 of them unemployed. The age group with the highest labor force participation rate is 30 to 34 years, with 84.7% or 1,716 individuals in the labor force. Within the labor force, the 35 to 44 years age range has the highest percentage of unemployed individuals, with 8.5% or 285 of them being unemployed.
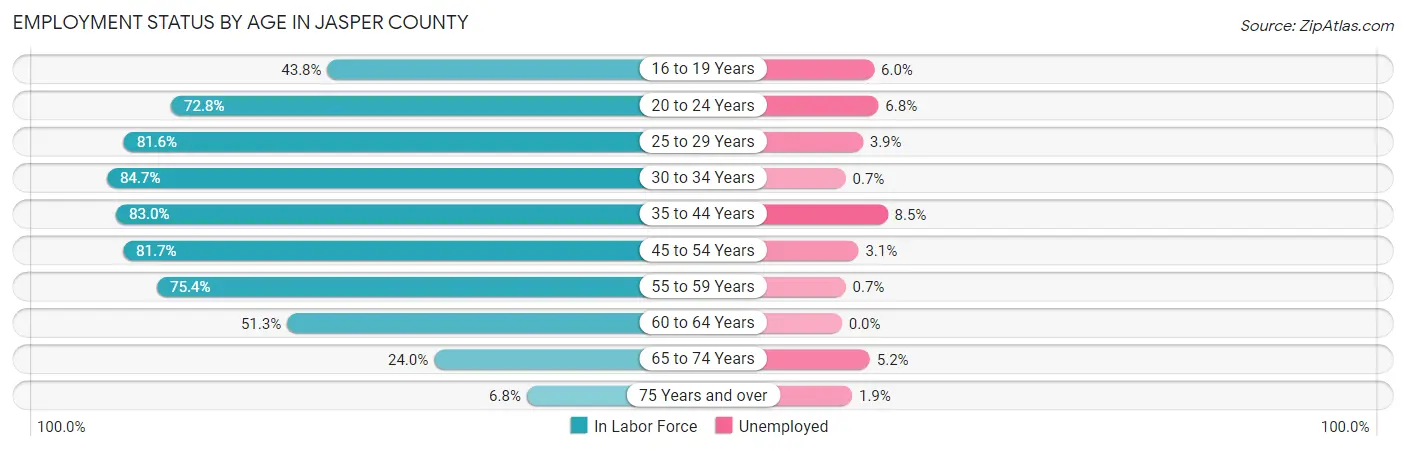
| Age Bracket | In Labor Force | Unemployed |
| 16 to 19 Years | 767 (43.8%) | 46 (6.0%) |
| 20 to 24 Years | 1,292 (72.8%) | 88 (6.8%) |
| 25 to 29 Years | 1,547 (81.6%) | 60 (3.9%) |
| 30 to 34 Years | 1,716 (84.7%) | 12 (0.7%) |
| 35 to 44 Years | 3,351 (83.0%) | 285 (8.5%) |
| 45 to 54 Years | 3,360 (81.7%) | 104 (3.1%) |
| 55 to 59 Years | 1,806 (75.4%) | 13 (0.7%) |
| 60 to 64 Years | 1,201 (51.3%) | 0 (0.0%) |
| 65 to 74 Years | 863 (24.0%) | 45 (5.2%) |
| 75 Years and over | 161 (6.8%) | 3 (1.9%) |
| Total | 16,068 (61.1%) | 659 (4.1%) |
Employment Status by Educational Attainment in Jasper County
According to labor force statistics for Jasper County, 77.2% of individuals (12,977) out of the total population between 25 and 64 years of age (16,809) are in the labor force, with 3.7% or 480 of them being unemployed. The group with the highest labor force participation rate are those with the educational attainment of bachelor's degree or higher, with 88.1% or 2,954 individuals in the labor force. Within the labor force, individuals with high school diploma education have the highest percentage of unemployment, with 7.5% or 370 of them being unemployed.
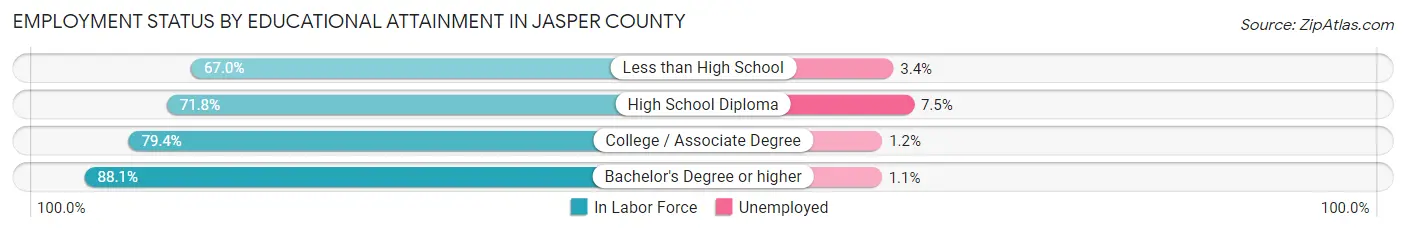
| Educational Attainment | In Labor Force | Unemployed |
| Less than High School | 740 (67.0%) | 38 (3.4%) |
| High School Diploma | 4,931 (71.8%) | 515 (7.5%) |
| College / Associate Degree | 4,354 (79.4%) | 66 (1.2%) |
| Bachelor's Degree or higher | 2,954 (88.1%) | 37 (1.1%) |
| Total | 12,977 (77.2%) | 622 (3.7%) |
Employment Occupations by Sex in Jasper County
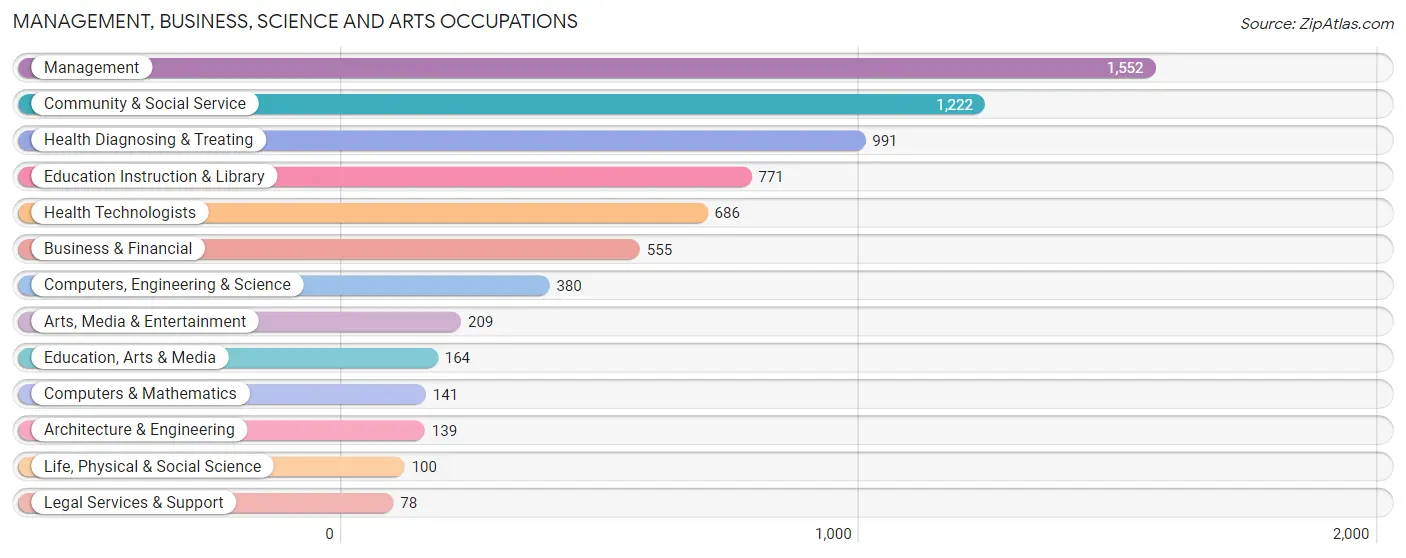
Management, Business, Science and Arts Occupations
The most common Management, Business, Science and Arts occupations in Jasper County are Management (1,552 | 10.1%), Community & Social Service (1,222 | 7.9%), Health Diagnosing & Treating (991 | 6.4%), Education Instruction & Library (771 | 5.0%), and Health Technologists (686 | 4.5%).
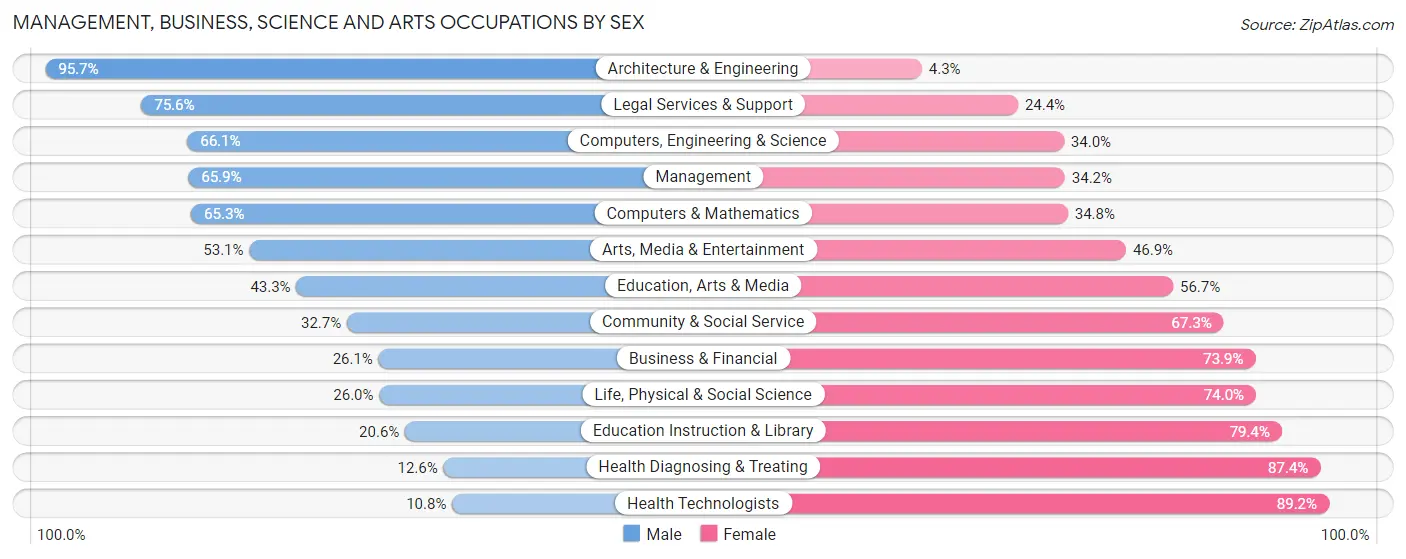
Management, Business, Science and Arts Occupations by Sex
Within the Management, Business, Science and Arts occupations in Jasper County, the most male-oriented occupations are Architecture & Engineering (95.7%), Legal Services & Support (75.6%), and Computers, Engineering & Science (66.0%), while the most female-oriented occupations are Health Technologists (89.2%), Health Diagnosing & Treating (87.4%), and Education Instruction & Library (79.4%).
| Occupation | Male | Female |
| Management | 1,022 (65.8%) | 530 (34.2%) |
| Business & Financial | 145 (26.1%) | 410 (73.9%) |
| Computers, Engineering & Science | 251 (66.0%) | 129 (34.0%) |
| Computers & Mathematics | 92 (65.2%) | 49 (34.7%) |
| Architecture & Engineering | 133 (95.7%) | 6 (4.3%) |
| Life, Physical & Social Science | 26 (26.0%) | 74 (74.0%) |
| Community & Social Service | 400 (32.7%) | 822 (67.3%) |
| Education, Arts & Media | 71 (43.3%) | 93 (56.7%) |
| Legal Services & Support | 59 (75.6%) | 19 (24.4%) |
| Education Instruction & Library | 159 (20.6%) | 612 (79.4%) |
| Arts, Media & Entertainment | 111 (53.1%) | 98 (46.9%) |
| Health Diagnosing & Treating | 125 (12.6%) | 866 (87.4%) |
| Health Technologists | 74 (10.8%) | 612 (89.2%) |
| Total (Category) | 1,943 (41.3%) | 2,757 (58.7%) |
| Total (Overall) | 8,436 (54.8%) | 6,955 (45.2%) |
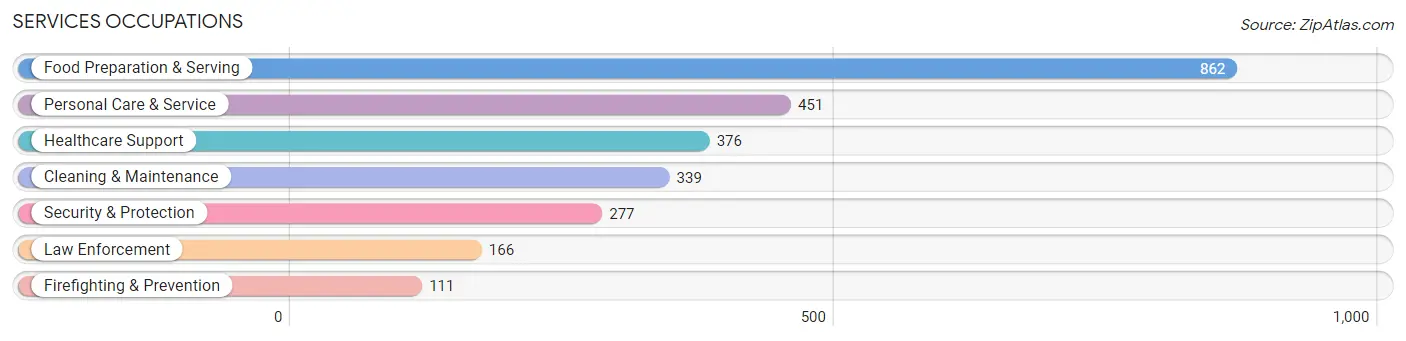
Services Occupations
The most common Services occupations in Jasper County are Food Preparation & Serving (862 | 5.6%), Personal Care & Service (451 | 2.9%), Healthcare Support (376 | 2.4%), Cleaning & Maintenance (339 | 2.2%), and Security & Protection (277 | 1.8%).
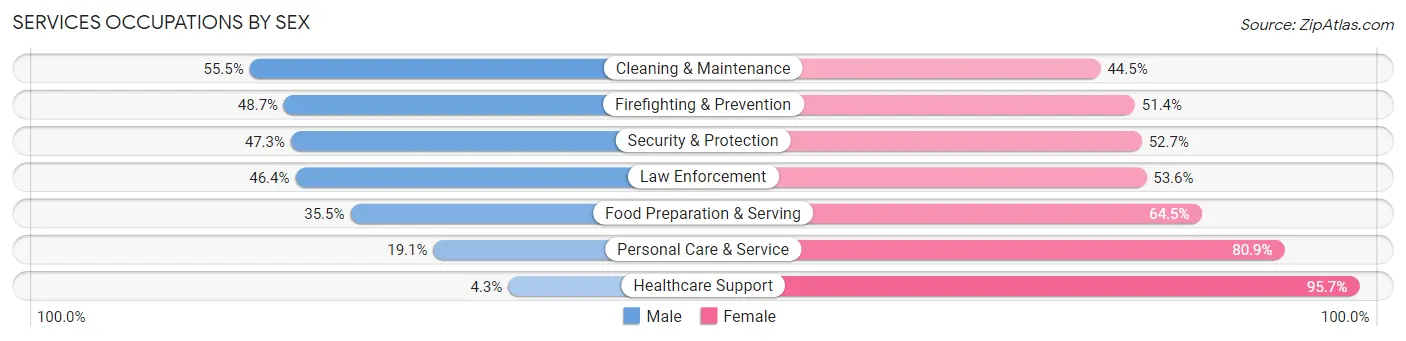
Services Occupations by Sex
Within the Services occupations in Jasper County, the most male-oriented occupations are Cleaning & Maintenance (55.5%), Firefighting & Prevention (48.6%), and Security & Protection (47.3%), while the most female-oriented occupations are Healthcare Support (95.7%), Personal Care & Service (80.9%), and Food Preparation & Serving (64.5%).
| Occupation | Male | Female |
| Healthcare Support | 16 (4.3%) | 360 (95.7%) |
| Security & Protection | 131 (47.3%) | 146 (52.7%) |
| Firefighting & Prevention | 54 (48.6%) | 57 (51.3%) |
| Law Enforcement | 77 (46.4%) | 89 (53.6%) |
| Food Preparation & Serving | 306 (35.5%) | 556 (64.5%) |
| Cleaning & Maintenance | 188 (55.5%) | 151 (44.5%) |
| Personal Care & Service | 86 (19.1%) | 365 (80.9%) |
| Total (Category) | 727 (31.5%) | 1,578 (68.5%) |
| Total (Overall) | 8,436 (54.8%) | 6,955 (45.2%) |
Sales and Office Occupations
The most common Sales and Office occupations in Jasper County are Office & Administration (1,586 | 10.3%), and Sales & Related (1,544 | 10.0%).
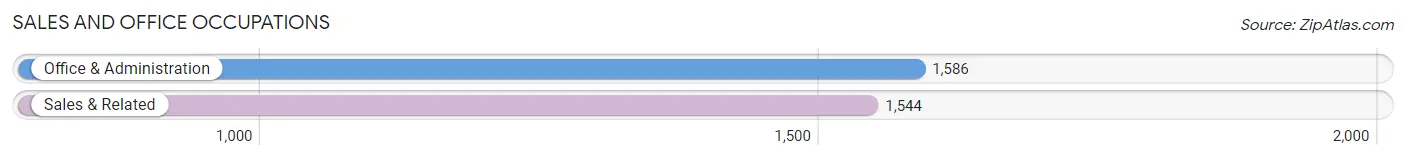
Sales and Office Occupations by Sex

| Occupation | Male | Female |
| Sales & Related | 759 (49.2%) | 785 (50.8%) |
| Office & Administration | 311 (19.6%) | 1,275 (80.4%) |
| Total (Category) | 1,070 (34.2%) | 2,060 (65.8%) |
| Total (Overall) | 8,436 (54.8%) | 6,955 (45.2%) |
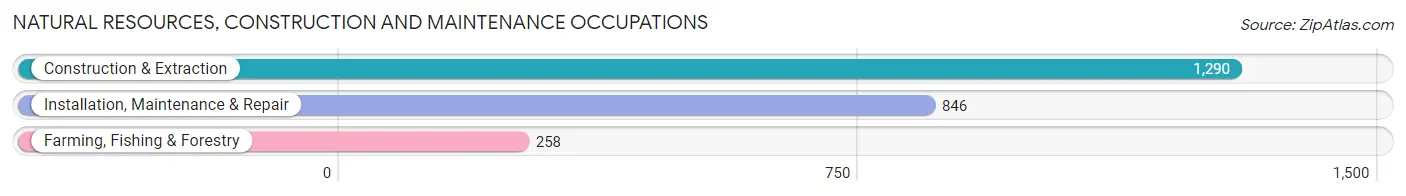
Natural Resources, Construction and Maintenance Occupations
The most common Natural Resources, Construction and Maintenance occupations in Jasper County are Construction & Extraction (1,290 | 8.4%), Installation, Maintenance & Repair (846 | 5.5%), and Farming, Fishing & Forestry (258 | 1.7%).
Natural Resources, Construction and Maintenance Occupations by Sex
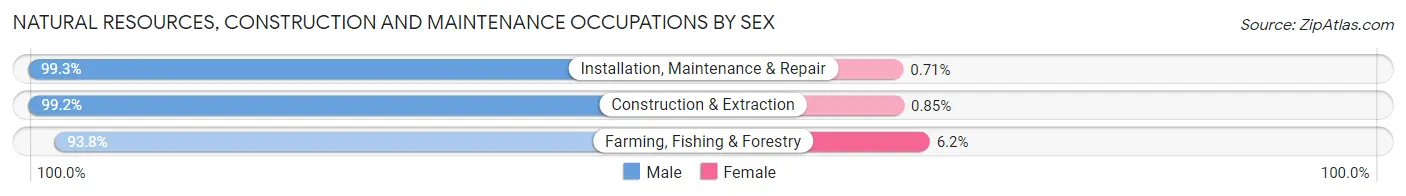
| Occupation | Male | Female |
| Farming, Fishing & Forestry | 242 (93.8%) | 16 (6.2%) |
| Construction & Extraction | 1,279 (99.2%) | 11 (0.9%) |
| Installation, Maintenance & Repair | 840 (99.3%) | 6 (0.7%) |
| Total (Category) | 2,361 (98.6%) | 33 (1.4%) |
| Total (Overall) | 8,436 (54.8%) | 6,955 (45.2%) |
Production, Transportation and Moving Occupations
The most common Production, Transportation and Moving occupations in Jasper County are Production (1,471 | 9.6%), Transportation (748 | 4.9%), and Material Moving (643 | 4.2%).

Production, Transportation and Moving Occupations by Sex
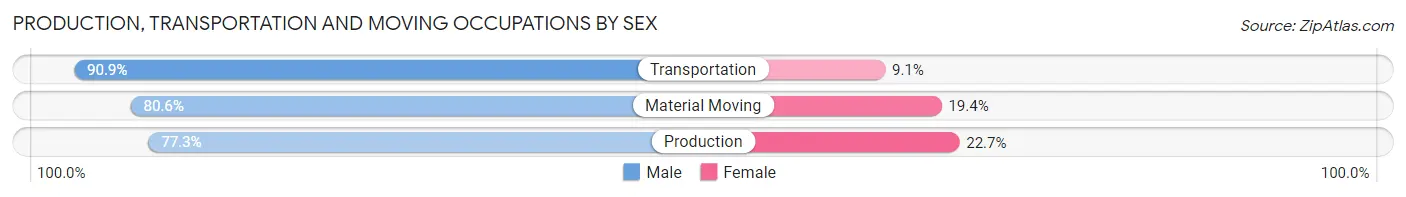
| Occupation | Male | Female |
| Production | 1,137 (77.3%) | 334 (22.7%) |
| Transportation | 680 (90.9%) | 68 (9.1%) |
| Material Moving | 518 (80.6%) | 125 (19.4%) |
| Total (Category) | 2,335 (81.6%) | 527 (18.4%) |
| Total (Overall) | 8,436 (54.8%) | 6,955 (45.2%) |
Employment Industries by Sex in Jasper County
Employment Industries in Jasper County
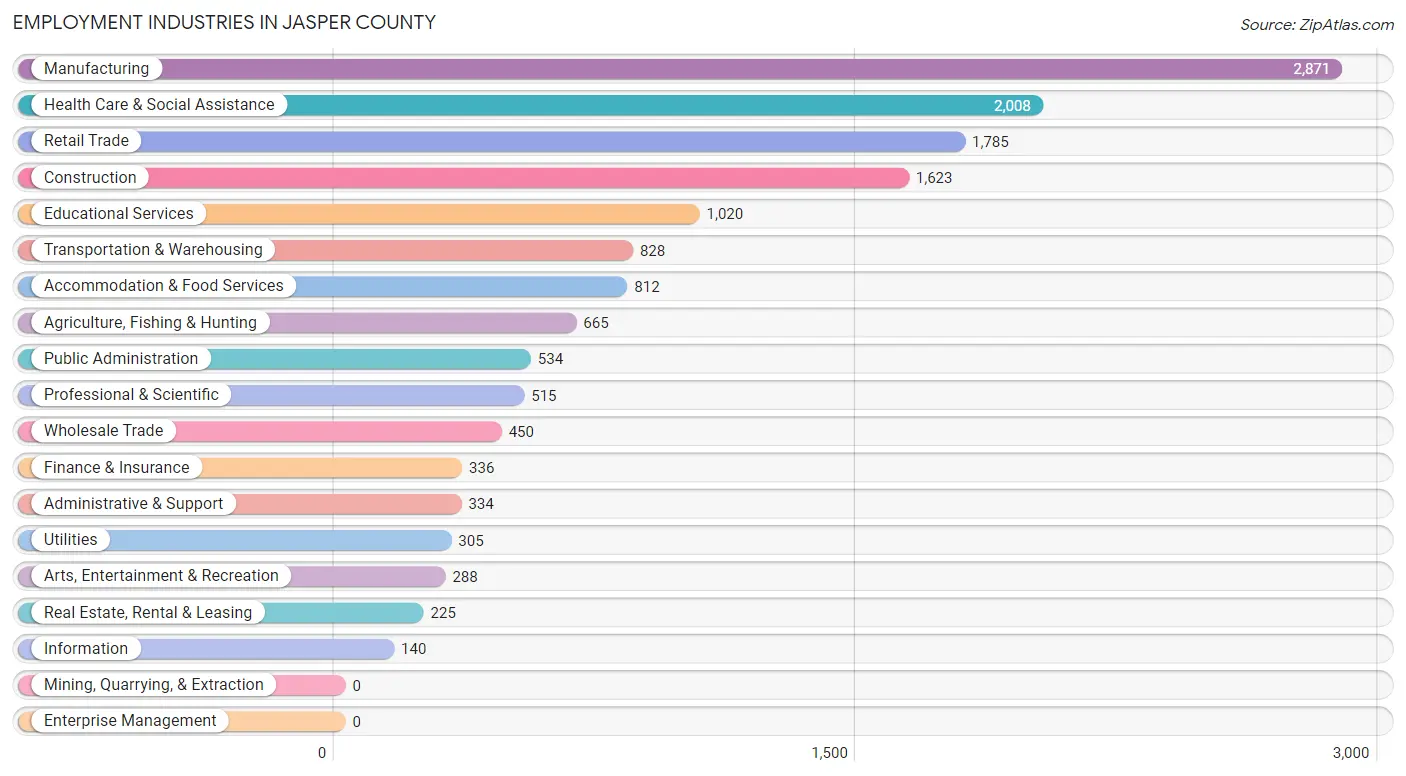
The major employment industries in Jasper County include Manufacturing (2,871 | 18.6%), Health Care & Social Assistance (2,008 | 13.1%), Retail Trade (1,785 | 11.6%), Construction (1,623 | 10.5%), and Educational Services (1,020 | 6.6%).
Employment Industries by Sex in Jasper County
The Jasper County industries that see more men than women are Construction (91.6%), Transportation & Warehousing (86.4%), and Wholesale Trade (82.7%), whereas the industries that tend to have a higher number of women are Information (92.9%), Health Care & Social Assistance (88.0%), and Finance & Insurance (75.6%).

| Industry | Male | Female |
| Agriculture, Fishing & Hunting | 507 (76.2%) | 158 (23.8%) |
| Mining, Quarrying, & Extraction | 0 (0.0%) | 0 (0.0%) |
| Construction | 1,487 (91.6%) | 136 (8.4%) |
| Manufacturing | 2,276 (79.3%) | 595 (20.7%) |
| Wholesale Trade | 372 (82.7%) | 78 (17.3%) |
| Retail Trade | 721 (40.4%) | 1,064 (59.6%) |
| Transportation & Warehousing | 715 (86.4%) | 113 (13.7%) |
| Utilities | 227 (74.4%) | 78 (25.6%) |
| Information | 10 (7.1%) | 130 (92.9%) |
| Finance & Insurance | 82 (24.4%) | 254 (75.6%) |
| Real Estate, Rental & Leasing | 98 (43.6%) | 127 (56.4%) |
| Professional & Scientific | 225 (43.7%) | 290 (56.3%) |
| Enterprise Management | 0 (0.0%) | 0 (0.0%) |
| Administrative & Support | 138 (41.3%) | 196 (58.7%) |
| Educational Services | 257 (25.2%) | 763 (74.8%) |
| Health Care & Social Assistance | 240 (11.9%) | 1,768 (88.0%) |
| Arts, Entertainment & Recreation | 198 (68.8%) | 90 (31.2%) |
| Accommodation & Food Services | 316 (38.9%) | 496 (61.1%) |
| Public Administration | 265 (49.6%) | 269 (50.4%) |
| Total | 8,436 (54.8%) | 6,955 (45.2%) |
Education in Jasper County
School Enrollment in Jasper County
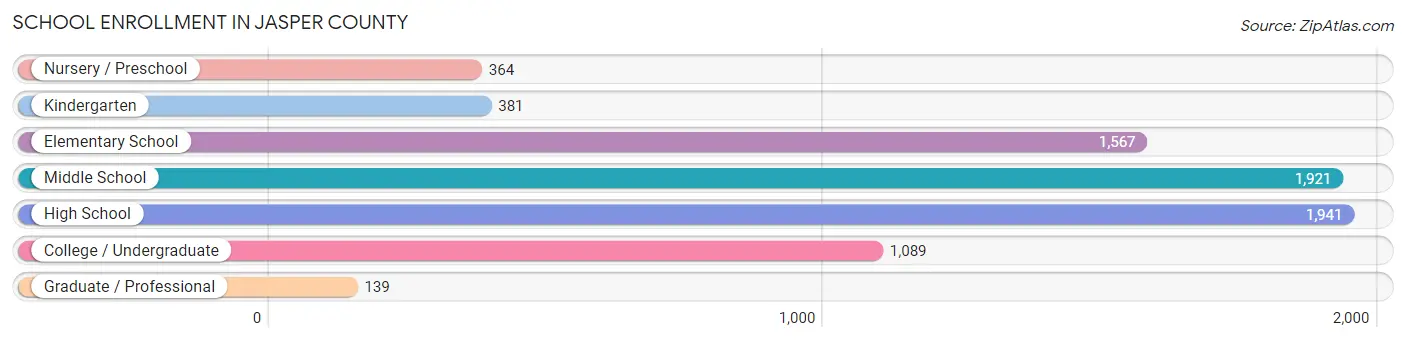
The most common levels of schooling among the 7,402 students in Jasper County are high school (1,941 | 26.2%), middle school (1,921 | 26.0%), and elementary school (1,567 | 21.2%).
| School Level | # Students | % Students |
| Nursery / Preschool | 364 | 4.9% |
| Kindergarten | 381 | 5.1% |
| Elementary School | 1,567 | 21.2% |
| Middle School | 1,921 | 26.0% |
| High School | 1,941 | 26.2% |
| College / Undergraduate | 1,089 | 14.7% |
| Graduate / Professional | 139 | 1.9% |
| Total | 7,402 | 100.0% |
School Enrollment by Age by Funding Source in Jasper County
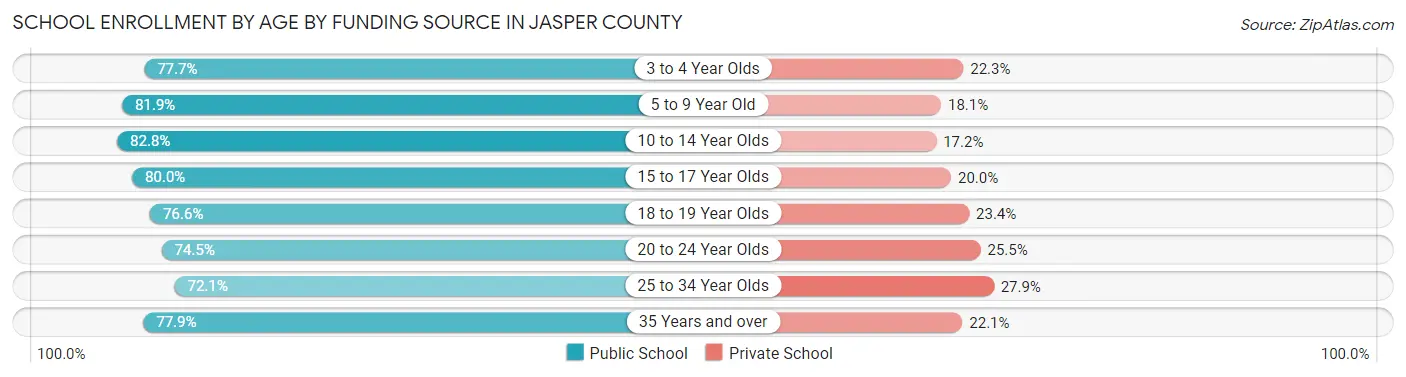
Out of a total of 7,402 students who are enrolled in schools in Jasper County, 1,458 (19.7%) attend a private institution, while the remaining 5,944 (80.3%) are enrolled in public schools. The age group of 25 to 34 year olds has the highest likelihood of being enrolled in private schools, with 57 (27.9% in the age bracket) enrolled. Conversely, the age group of 10 to 14 year olds has the lowest likelihood of being enrolled in a private school, with 1,867 (82.8% in the age bracket) attending a public institution.
| Age Bracket | Public School | Private School |
| 3 to 4 Year Olds | 157 (77.7%) | 45 (22.3%) |
| 5 to 9 Year Old | 1,615 (81.9%) | 358 (18.1%) |
| 10 to 14 Year Olds | 1,867 (82.8%) | 389 (17.2%) |
| 15 to 17 Year Olds | 1,140 (80.0%) | 285 (20.0%) |
| 18 to 19 Year Olds | 420 (76.6%) | 128 (23.4%) |
| 20 to 24 Year Olds | 450 (74.5%) | 154 (25.5%) |
| 25 to 34 Year Olds | 147 (72.1%) | 57 (27.9%) |
| 35 Years and over | 148 (77.9%) | 42 (22.1%) |
| Total | 5,944 (80.3%) | 1,458 (19.7%) |
Educational Attainment by Field of Study in Jasper County
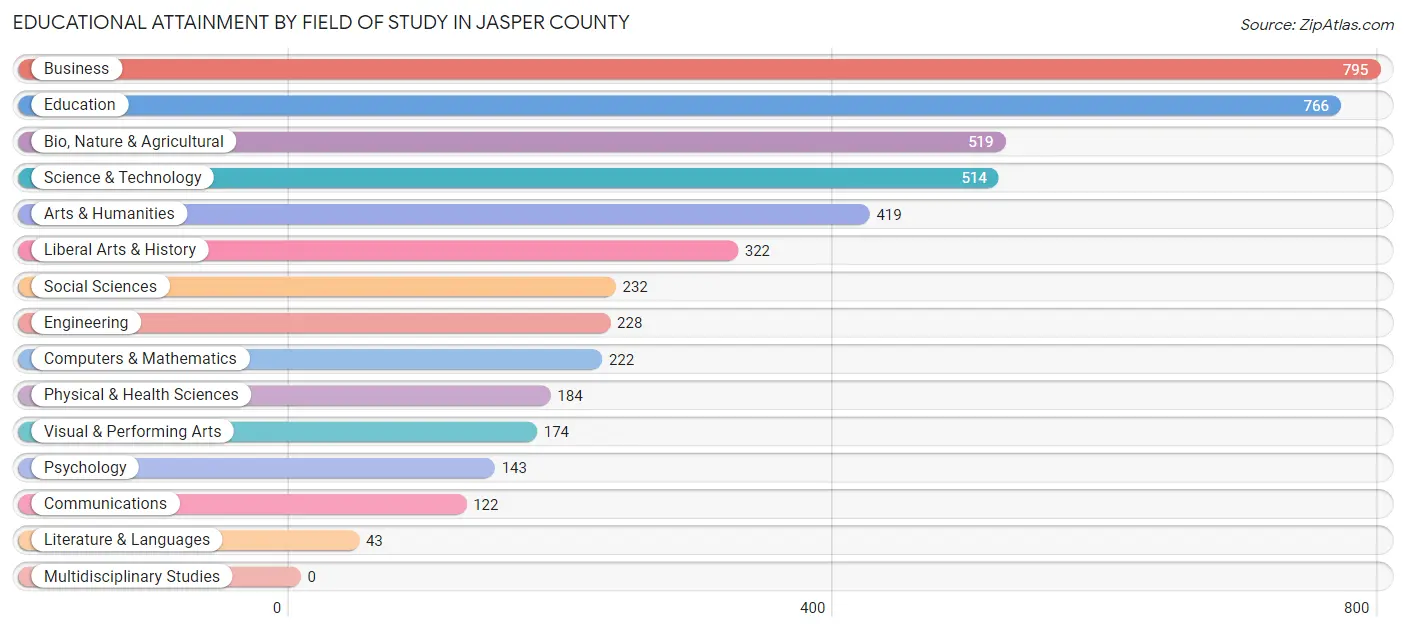
Business (795 | 17.0%), education (766 | 16.4%), bio, nature & agricultural (519 | 11.1%), science & technology (514 | 11.0%), and arts & humanities (419 | 8.9%) are the most common fields of study among 4,683 individuals in Jasper County who have obtained a bachelor's degree or higher.
| Field of Study | # Graduates | % Graduates |
| Computers & Mathematics | 222 | 4.7% |
| Bio, Nature & Agricultural | 519 | 11.1% |
| Physical & Health Sciences | 184 | 3.9% |
| Psychology | 143 | 3.0% |
| Social Sciences | 232 | 5.0% |
| Engineering | 228 | 4.9% |
| Multidisciplinary Studies | 0 | 0.0% |
| Science & Technology | 514 | 11.0% |
| Business | 795 | 17.0% |
| Education | 766 | 16.4% |
| Literature & Languages | 43 | 0.9% |
| Liberal Arts & History | 322 | 6.9% |
| Visual & Performing Arts | 174 | 3.7% |
| Communications | 122 | 2.6% |
| Arts & Humanities | 419 | 8.9% |
| Total | 4,683 | 100.0% |
Transportation & Commute in Jasper County
Vehicle Availability by Sex in Jasper County
The most prevalent vehicle ownership categories in Jasper County are males with 2 vehicles (2,822, accounting for 34.2%) and females with 2 vehicles (2,349, making up 43.2%).
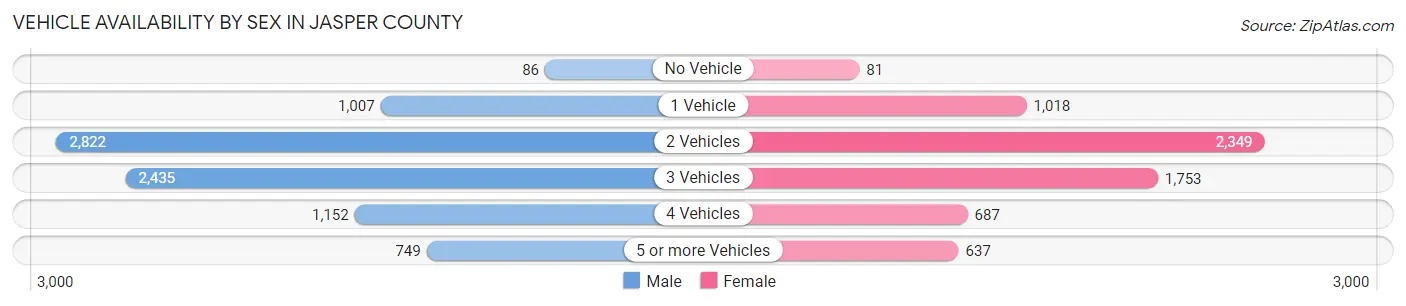
| Vehicles Available | Male | Female |
| No Vehicle | 86 (1.0%) | 81 (1.2%) |
| 1 Vehicle | 1,007 (12.2%) | 1,018 (15.6%) |
| 2 Vehicles | 2,822 (34.2%) | 2,349 (36.0%) |
| 3 Vehicles | 2,435 (29.5%) | 1,753 (26.9%) |
| 4 Vehicles | 1,152 (14.0%) | 687 (10.5%) |
| 5 or more Vehicles | 749 (9.1%) | 637 (9.8%) |
| Total | 8,251 (100.0%) | 6,525 (100.0%) |
Commute Time in Jasper County
The most frequently occuring commute durations in Jasper County are 5 to 9 minutes (2,207 commuters, 15.5%), 45 to 59 minutes (2,064 commuters, 14.5%), and 10 to 14 minutes (1,646 commuters, 11.6%).
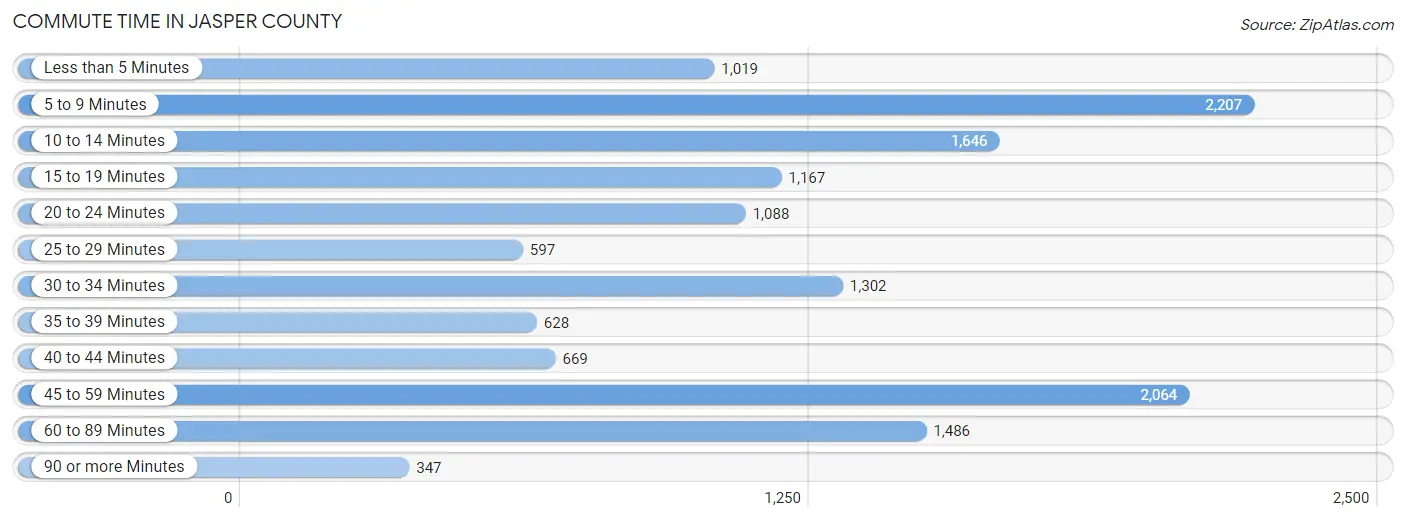
| Commute Time | # Commuters | % Commuters |
| Less than 5 Minutes | 1,019 | 7.2% |
| 5 to 9 Minutes | 2,207 | 15.5% |
| 10 to 14 Minutes | 1,646 | 11.6% |
| 15 to 19 Minutes | 1,167 | 8.2% |
| 20 to 24 Minutes | 1,088 | 7.6% |
| 25 to 29 Minutes | 597 | 4.2% |
| 30 to 34 Minutes | 1,302 | 9.2% |
| 35 to 39 Minutes | 628 | 4.4% |
| 40 to 44 Minutes | 669 | 4.7% |
| 45 to 59 Minutes | 2,064 | 14.5% |
| 60 to 89 Minutes | 1,486 | 10.4% |
| 90 or more Minutes | 347 | 2.4% |
Commute Time by Sex in Jasper County
The most common commute times in Jasper County are 45 to 59 minutes (1,457 commuters, 17.9%) for males and 5 to 9 minutes (1,334 commuters, 22.0%) for females.
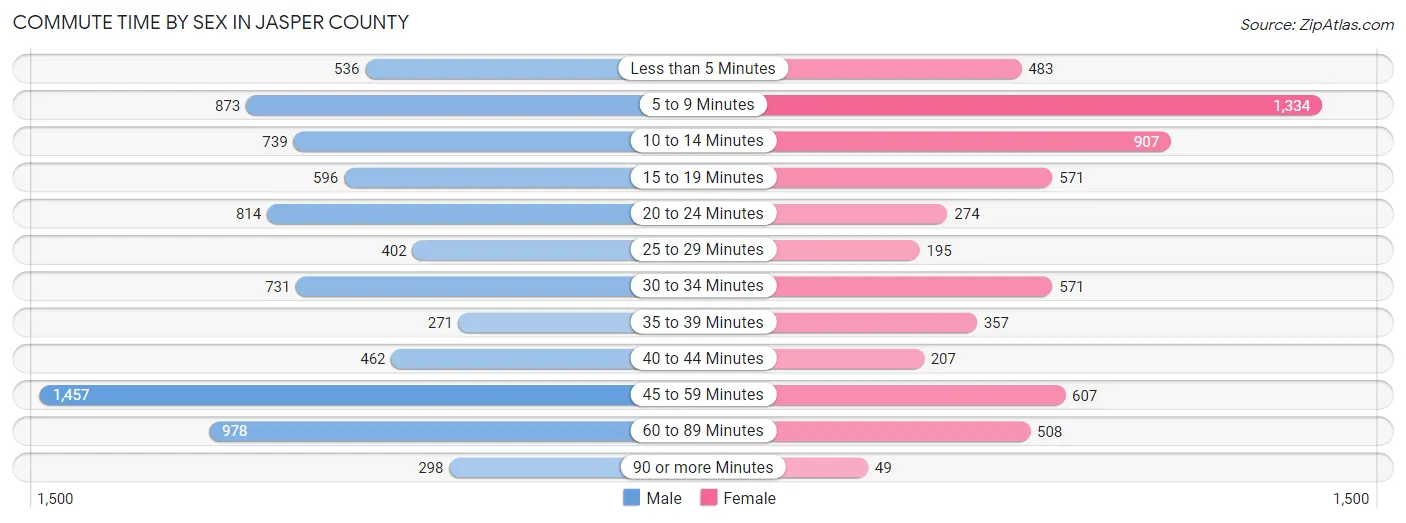
| Commute Time | Male | Female |
| Less than 5 Minutes | 536 (6.6%) | 483 (8.0%) |
| 5 to 9 Minutes | 873 (10.7%) | 1,334 (22.0%) |
| 10 to 14 Minutes | 739 (9.1%) | 907 (15.0%) |
| 15 to 19 Minutes | 596 (7.3%) | 571 (9.4%) |
| 20 to 24 Minutes | 814 (10.0%) | 274 (4.5%) |
| 25 to 29 Minutes | 402 (4.9%) | 195 (3.2%) |
| 30 to 34 Minutes | 731 (9.0%) | 571 (9.4%) |
| 35 to 39 Minutes | 271 (3.3%) | 357 (5.9%) |
| 40 to 44 Minutes | 462 (5.7%) | 207 (3.4%) |
| 45 to 59 Minutes | 1,457 (17.9%) | 607 (10.0%) |
| 60 to 89 Minutes | 978 (12.0%) | 508 (8.4%) |
| 90 or more Minutes | 298 (3.6%) | 49 (0.8%) |
Time of Departure to Work by Sex in Jasper County
The most frequent times of departure to work in Jasper County are 12:00 AM to 4:59 AM (1,395, 17.1%) for males and 7:30 AM to 7:59 AM (949, 15.7%) for females.
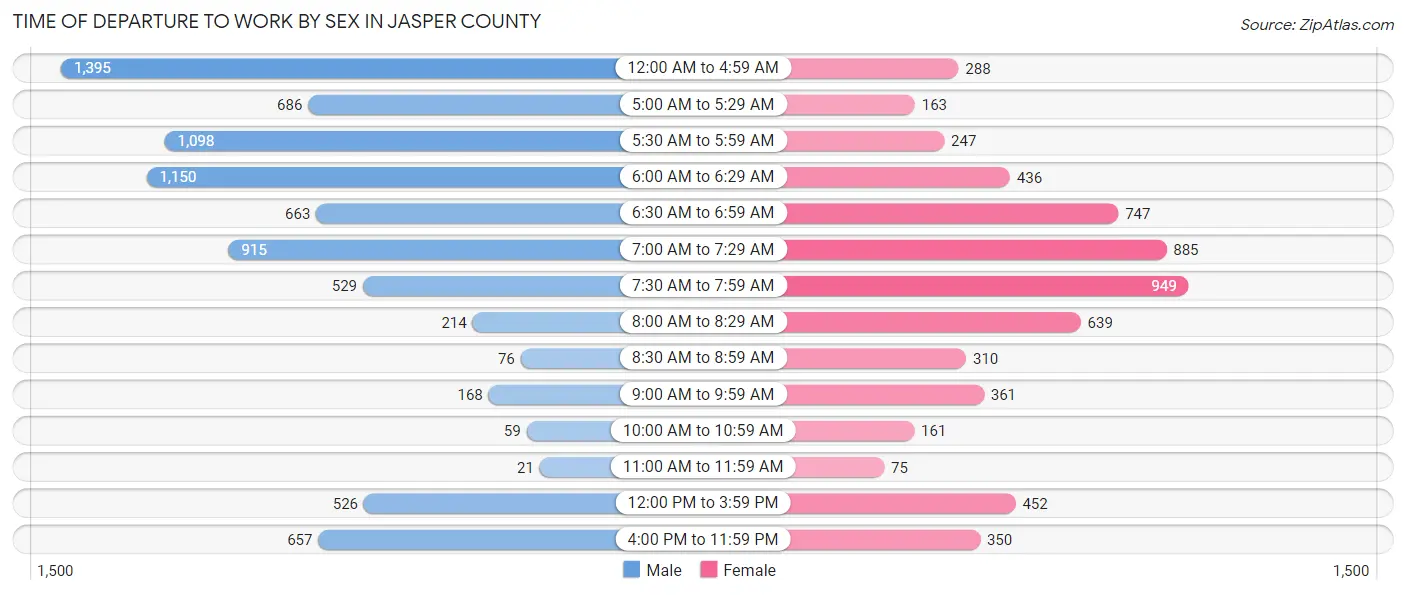
| Time of Departure | Male | Female |
| 12:00 AM to 4:59 AM | 1,395 (17.1%) | 288 (4.8%) |
| 5:00 AM to 5:29 AM | 686 (8.4%) | 163 (2.7%) |
| 5:30 AM to 5:59 AM | 1,098 (13.5%) | 247 (4.1%) |
| 6:00 AM to 6:29 AM | 1,150 (14.1%) | 436 (7.2%) |
| 6:30 AM to 6:59 AM | 663 (8.1%) | 747 (12.3%) |
| 7:00 AM to 7:29 AM | 915 (11.2%) | 885 (14.6%) |
| 7:30 AM to 7:59 AM | 529 (6.5%) | 949 (15.7%) |
| 8:00 AM to 8:29 AM | 214 (2.6%) | 639 (10.5%) |
| 8:30 AM to 8:59 AM | 76 (0.9%) | 310 (5.1%) |
| 9:00 AM to 9:59 AM | 168 (2.1%) | 361 (5.9%) |
| 10:00 AM to 10:59 AM | 59 (0.7%) | 161 (2.7%) |
| 11:00 AM to 11:59 AM | 21 (0.3%) | 75 (1.2%) |
| 12:00 PM to 3:59 PM | 526 (6.5%) | 452 (7.5%) |
| 4:00 PM to 11:59 PM | 657 (8.1%) | 350 (5.8%) |
| Total | 8,157 (100.0%) | 6,063 (100.0%) |
Housing Occupancy in Jasper County
Occupancy by Ownership in Jasper County
Of the total 12,554 dwellings in Jasper County, owner-occupied units account for 10,185 (81.1%), while renter-occupied units make up 2,369 (18.9%).
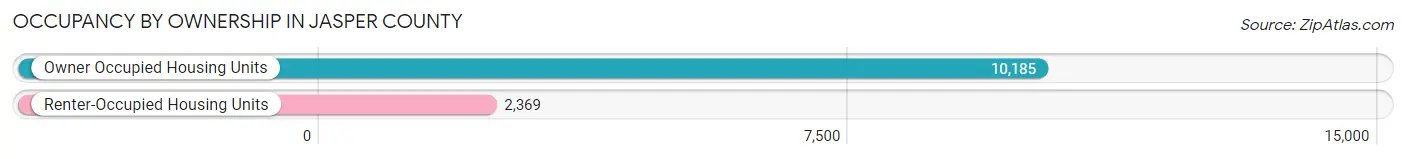
| Occupancy | # Housing Units | % Housing Units |
| Owner Occupied Housing Units | 10,185 | 81.1% |
| Renter-Occupied Housing Units | 2,369 | 18.9% |
| Total Occupied Housing Units | 12,554 | 100.0% |
Occupancy by Household Size in Jasper County
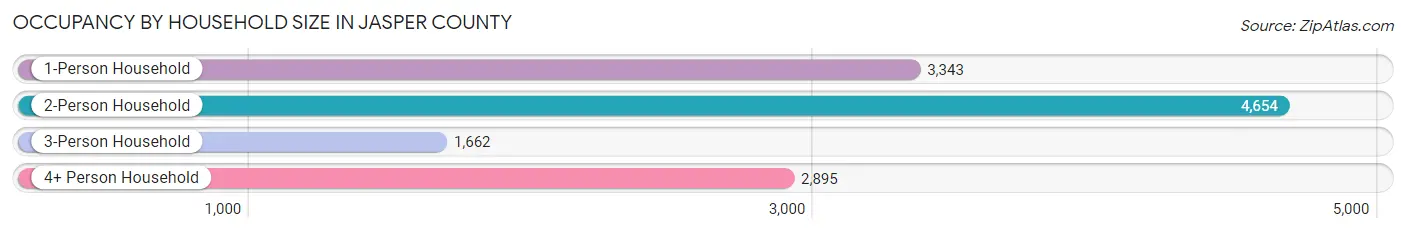
| Household Size | # Housing Units | % Housing Units |
| 1-Person Household | 3,343 | 26.6% |
| 2-Person Household | 4,654 | 37.1% |
| 3-Person Household | 1,662 | 13.2% |
| 4+ Person Household | 2,895 | 23.1% |
| Total Housing Units | 12,554 | 100.0% |
Occupancy by Ownership by Household Size in Jasper County
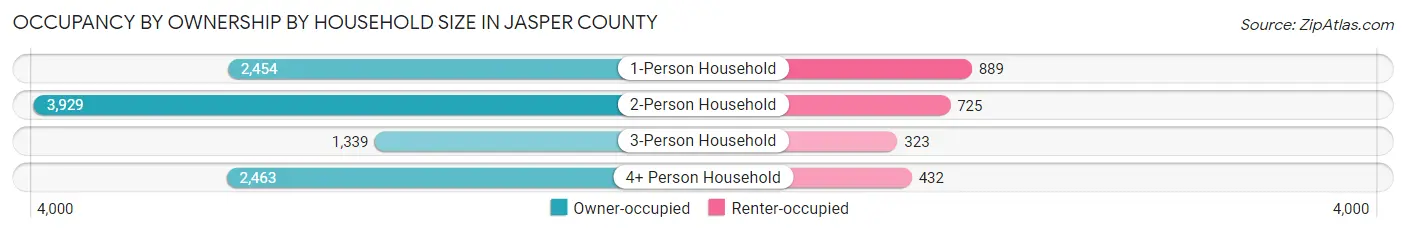
| Household Size | Owner-occupied | Renter-occupied |
| 1-Person Household | 2,454 (73.4%) | 889 (26.6%) |
| 2-Person Household | 3,929 (84.4%) | 725 (15.6%) |
| 3-Person Household | 1,339 (80.6%) | 323 (19.4%) |
| 4+ Person Household | 2,463 (85.1%) | 432 (14.9%) |
| Total Housing Units | 10,185 (81.1%) | 2,369 (18.9%) |
Occupancy by Educational Attainment in Jasper County
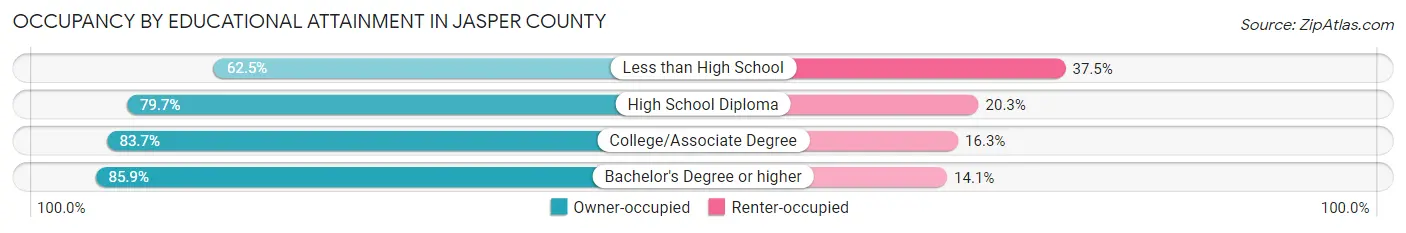
| Household Size | Owner-occupied | Renter-occupied |
| Less than High School | 539 (62.5%) | 324 (37.5%) |
| High School Diploma | 3,960 (79.7%) | 1,009 (20.3%) |
| College/Associate Degree | 3,456 (83.7%) | 671 (16.3%) |
| Bachelor's Degree or higher | 2,230 (85.9%) | 365 (14.1%) |
Occupancy by Age of Householder in Jasper County
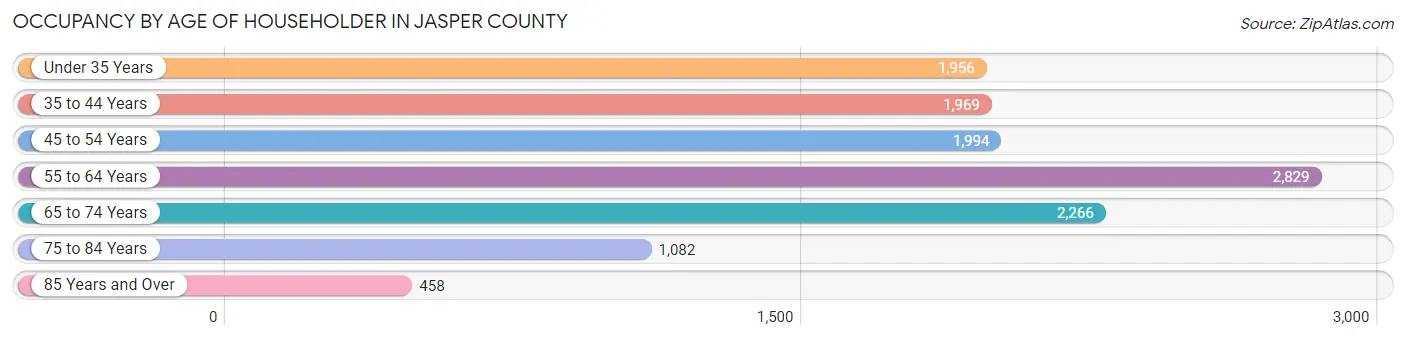
| Age Bracket | # Households | % Households |
| Under 35 Years | 1,956 | 15.6% |
| 35 to 44 Years | 1,969 | 15.7% |
| 45 to 54 Years | 1,994 | 15.9% |
| 55 to 64 Years | 2,829 | 22.5% |
| 65 to 74 Years | 2,266 | 18.0% |
| 75 to 84 Years | 1,082 | 8.6% |
| 85 Years and Over | 458 | 3.6% |
| Total | 12,554 | 100.0% |
Housing Finances in Jasper County
Median Income by Occupancy in Jasper County
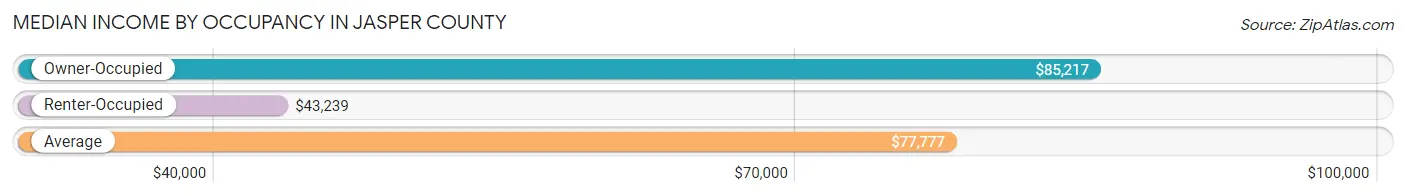
| Occupancy Type | # Households | Median Income |
| Owner-Occupied | 10,185 (81.1%) | $85,217 |
| Renter-Occupied | 2,369 (18.9%) | $43,239 |
| Average | 12,554 (100.0%) | $77,777 |
Occupancy by Householder Income Bracket in Jasper County
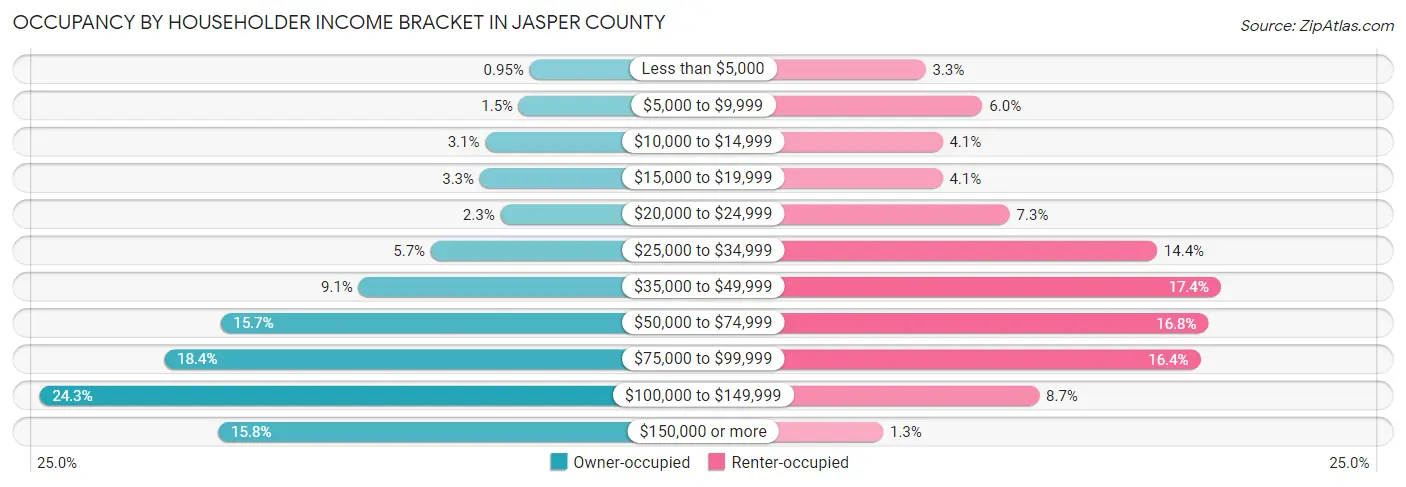
| Income Bracket | Owner-occupied | Renter-occupied |
| Less than $5,000 | 97 (0.9%) | 79 (3.3%) |
| $5,000 to $9,999 | 149 (1.5%) | 143 (6.0%) |
| $10,000 to $14,999 | 312 (3.1%) | 98 (4.1%) |
| $15,000 to $19,999 | 338 (3.3%) | 98 (4.1%) |
| $20,000 to $24,999 | 238 (2.3%) | 174 (7.3%) |
| $25,000 to $34,999 | 575 (5.7%) | 340 (14.3%) |
| $35,000 to $49,999 | 926 (9.1%) | 412 (17.4%) |
| $50,000 to $74,999 | 1,597 (15.7%) | 398 (16.8%) |
| $75,000 to $99,999 | 1,870 (18.4%) | 389 (16.4%) |
| $100,000 to $149,999 | 2,475 (24.3%) | 207 (8.7%) |
| $150,000 or more | 1,608 (15.8%) | 31 (1.3%) |
| Total | 10,185 (100.0%) | 2,369 (100.0%) |
Monthly Housing Cost Tiers in Jasper County
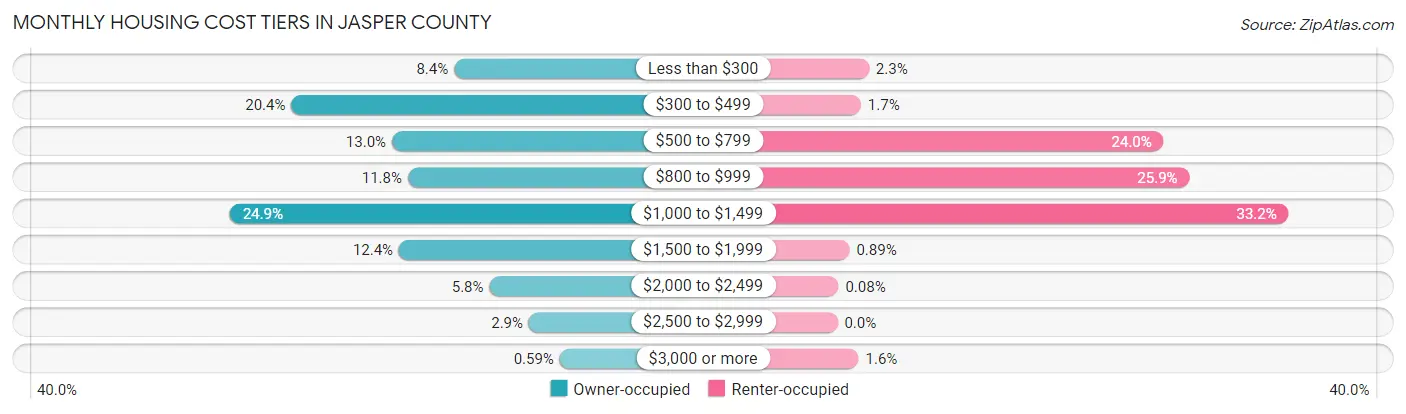
| Monthly Cost | Owner-occupied | Renter-occupied |
| Less than $300 | 852 (8.4%) | 55 (2.3%) |
| $300 to $499 | 2,074 (20.4%) | 41 (1.7%) |
| $500 to $799 | 1,319 (13.0%) | 569 (24.0%) |
| $800 to $999 | 1,200 (11.8%) | 614 (25.9%) |
| $1,000 to $1,499 | 2,535 (24.9%) | 787 (33.2%) |
| $1,500 to $1,999 | 1,266 (12.4%) | 21 (0.9%) |
| $2,000 to $2,499 | 588 (5.8%) | 2 (0.1%) |
| $2,500 to $2,999 | 291 (2.9%) | 0 (0.0%) |
| $3,000 or more | 60 (0.6%) | 37 (1.6%) |
| Total | 10,185 (100.0%) | 2,369 (100.0%) |
Physical Housing Characteristics in Jasper County
Housing Structures in Jasper County
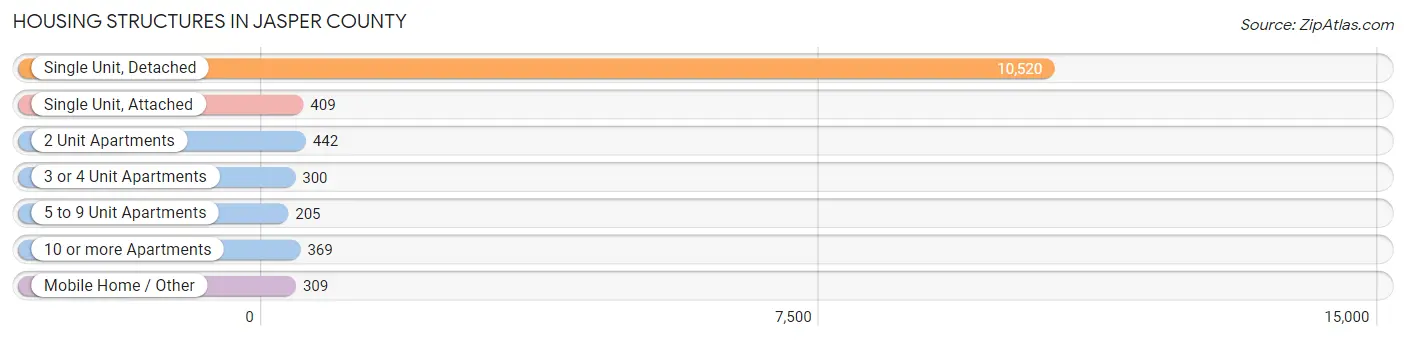
| Structure Type | # Housing Units | % Housing Units |
| Single Unit, Detached | 10,520 | 83.8% |
| Single Unit, Attached | 409 | 3.3% |
| 2 Unit Apartments | 442 | 3.5% |
| 3 or 4 Unit Apartments | 300 | 2.4% |
| 5 to 9 Unit Apartments | 205 | 1.6% |
| 10 or more Apartments | 369 | 2.9% |
| Mobile Home / Other | 309 | 2.5% |
| Total | 12,554 | 100.0% |
Housing Structures by Occupancy in Jasper County
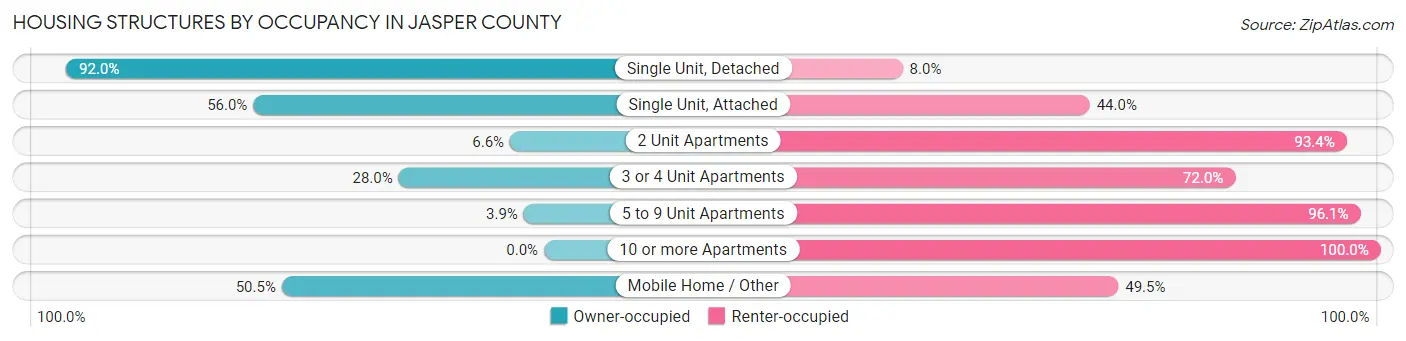
| Structure Type | Owner-occupied | Renter-occupied |
| Single Unit, Detached | 9,679 (92.0%) | 841 (8.0%) |
| Single Unit, Attached | 229 (56.0%) | 180 (44.0%) |
| 2 Unit Apartments | 29 (6.6%) | 413 (93.4%) |
| 3 or 4 Unit Apartments | 84 (28.0%) | 216 (72.0%) |
| 5 to 9 Unit Apartments | 8 (3.9%) | 197 (96.1%) |
| 10 or more Apartments | 0 (0.0%) | 369 (100.0%) |
| Mobile Home / Other | 156 (50.5%) | 153 (49.5%) |
| Total | 10,185 (81.1%) | 2,369 (18.9%) |
Housing Structures by Number of Rooms in Jasper County
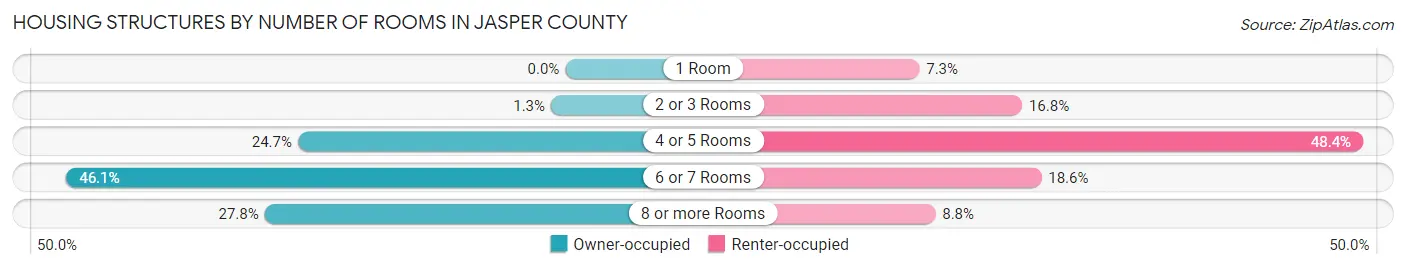
| Number of Rooms | Owner-occupied | Renter-occupied |
| 1 Room | 0 (0.0%) | 174 (7.3%) |
| 2 or 3 Rooms | 135 (1.3%) | 399 (16.8%) |
| 4 or 5 Rooms | 2,519 (24.7%) | 1,146 (48.4%) |
| 6 or 7 Rooms | 4,699 (46.1%) | 441 (18.6%) |
| 8 or more Rooms | 2,832 (27.8%) | 209 (8.8%) |
| Total | 10,185 (100.0%) | 2,369 (100.0%) |
Housing Structure by Heating Type in Jasper County
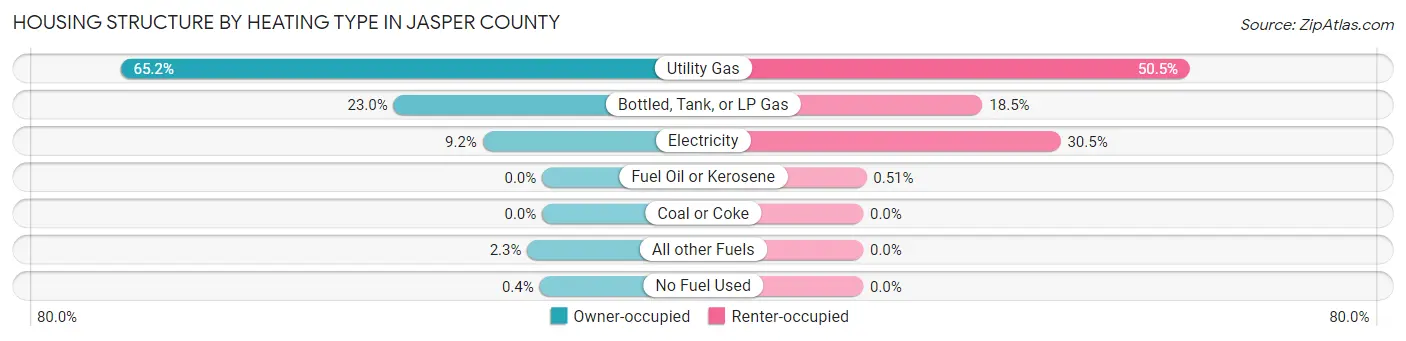
| Heating Type | Owner-occupied | Renter-occupied |
| Utility Gas | 6,637 (65.2%) | 1,197 (50.5%) |
| Bottled, Tank, or LP Gas | 2,339 (23.0%) | 437 (18.4%) |
| Electricity | 935 (9.2%) | 723 (30.5%) |
| Fuel Oil or Kerosene | 0 (0.0%) | 12 (0.5%) |
| Coal or Coke | 0 (0.0%) | 0 (0.0%) |
| All other Fuels | 233 (2.3%) | 0 (0.0%) |
| No Fuel Used | 41 (0.4%) | 0 (0.0%) |
| Total | 10,185 (100.0%) | 2,369 (100.0%) |
Household Vehicle Usage in Jasper County
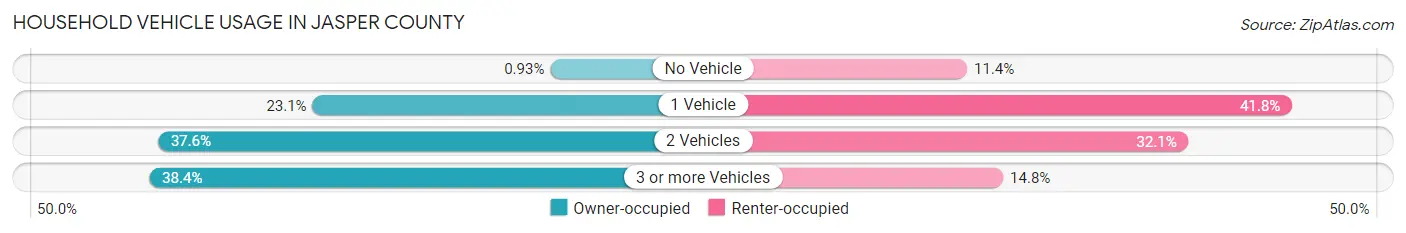
| Vehicles per Household | Owner-occupied | Renter-occupied |
| No Vehicle | 95 (0.9%) | 270 (11.4%) |
| 1 Vehicle | 2,356 (23.1%) | 989 (41.7%) |
| 2 Vehicles | 3,826 (37.6%) | 760 (32.1%) |
| 3 or more Vehicles | 3,908 (38.4%) | 350 (14.8%) |
| Total | 10,185 (100.0%) | 2,369 (100.0%) |
Real Estate & Mortgages in Jasper County
Real Estate and Mortgage Overview in Jasper County
| Characteristic | Without Mortgage | With Mortgage |
| Housing Units | 3,948 | 6,237 |
| Median Property Value | $185,700 | $195,900 |
| Median Household Income | $65,000 | $1,216 |
| Monthly Housing Costs | $398 | $60 |
| Real Estate Taxes | $902 | $36 |
Property Value by Mortgage Status in Jasper County
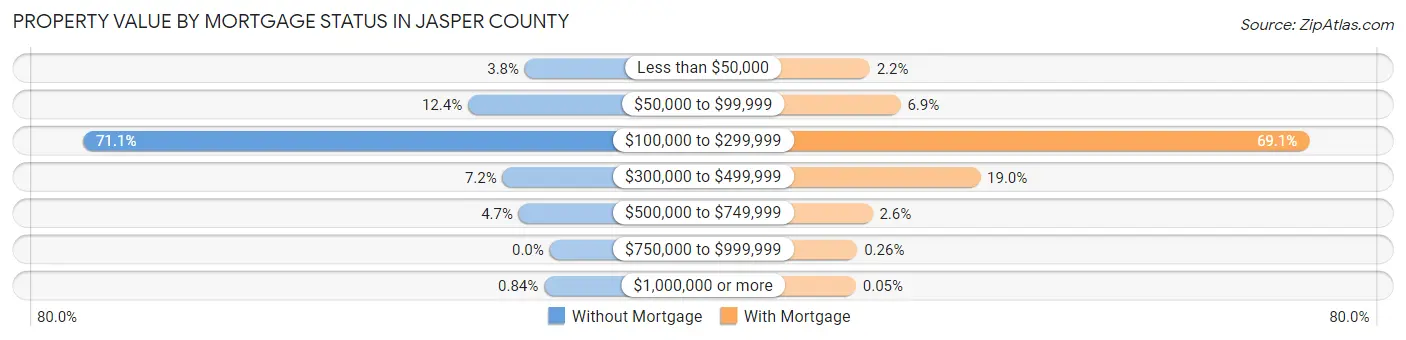
| Property Value | Without Mortgage | With Mortgage |
| Less than $50,000 | 149 (3.8%) | 135 (2.2%) |
| $50,000 to $99,999 | 491 (12.4%) | 427 (6.9%) |
| $100,000 to $299,999 | 2,807 (71.1%) | 4,311 (69.1%) |
| $300,000 to $499,999 | 283 (7.2%) | 1,184 (19.0%) |
| $500,000 to $749,999 | 185 (4.7%) | 161 (2.6%) |
| $750,000 to $999,999 | 0 (0.0%) | 16 (0.3%) |
| $1,000,000 or more | 33 (0.8%) | 3 (0.1%) |
| Total | 3,948 (100.0%) | 6,237 (100.0%) |
Household Income by Mortgage Status in Jasper County
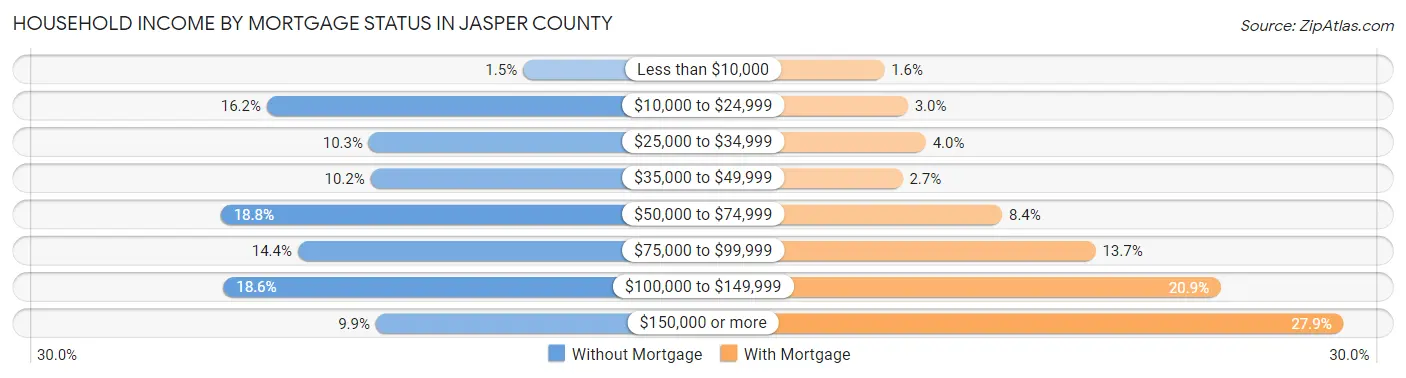
| Household Income | Without Mortgage | With Mortgage |
| Less than $10,000 | 60 (1.5%) | 102 (1.6%) |
| $10,000 to $24,999 | 638 (16.2%) | 186 (3.0%) |
| $25,000 to $34,999 | 408 (10.3%) | 250 (4.0%) |
| $35,000 to $49,999 | 404 (10.2%) | 167 (2.7%) |
| $50,000 to $74,999 | 742 (18.8%) | 522 (8.4%) |
| $75,000 to $99,999 | 568 (14.4%) | 855 (13.7%) |
| $100,000 to $149,999 | 736 (18.6%) | 1,302 (20.9%) |
| $150,000 or more | 392 (9.9%) | 1,739 (27.9%) |
| Total | 3,948 (100.0%) | 6,237 (100.0%) |
Property Value to Household Income Ratio in Jasper County
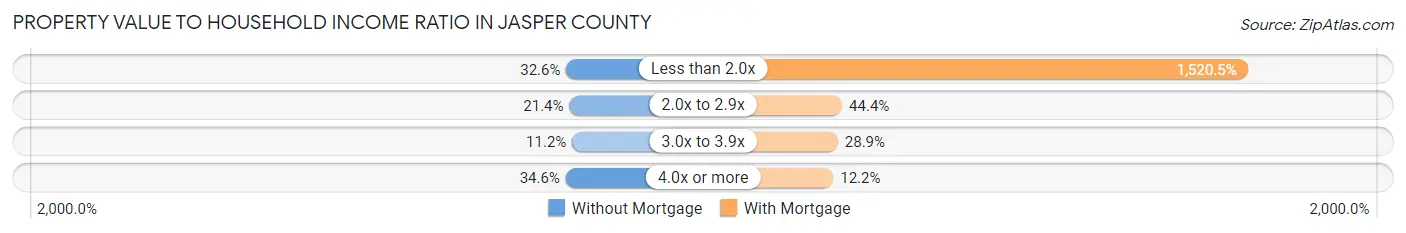
| Value-to-Income Ratio | Without Mortgage | With Mortgage |
| Less than 2.0x | 1,285 (32.6%) | 94,834 (1,520.5%) |
| 2.0x to 2.9x | 845 (21.4%) | 2,772 (44.4%) |
| 3.0x to 3.9x | 442 (11.2%) | 1,800 (28.9%) |
| 4.0x or more | 1,364 (34.5%) | 762 (12.2%) |
| Total | 3,948 (100.0%) | 6,237 (100.0%) |
Real Estate Taxes by Mortgage Status in Jasper County
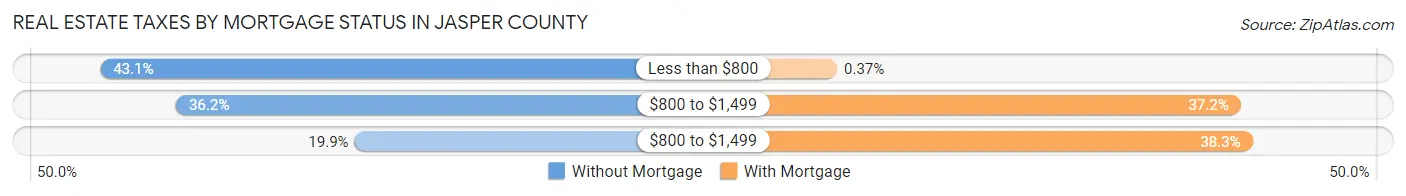
| Property Taxes | Without Mortgage | With Mortgage |
| Less than $800 | 1,701 (43.1%) | 23 (0.4%) |
| $800 to $1,499 | 1,428 (36.2%) | 2,322 (37.2%) |
| $800 to $1,499 | 785 (19.9%) | 2,389 (38.3%) |
| Total | 3,948 (100.0%) | 6,237 (100.0%) |
Health & Disability in Jasper County
Health Insurance Coverage by Age in Jasper County
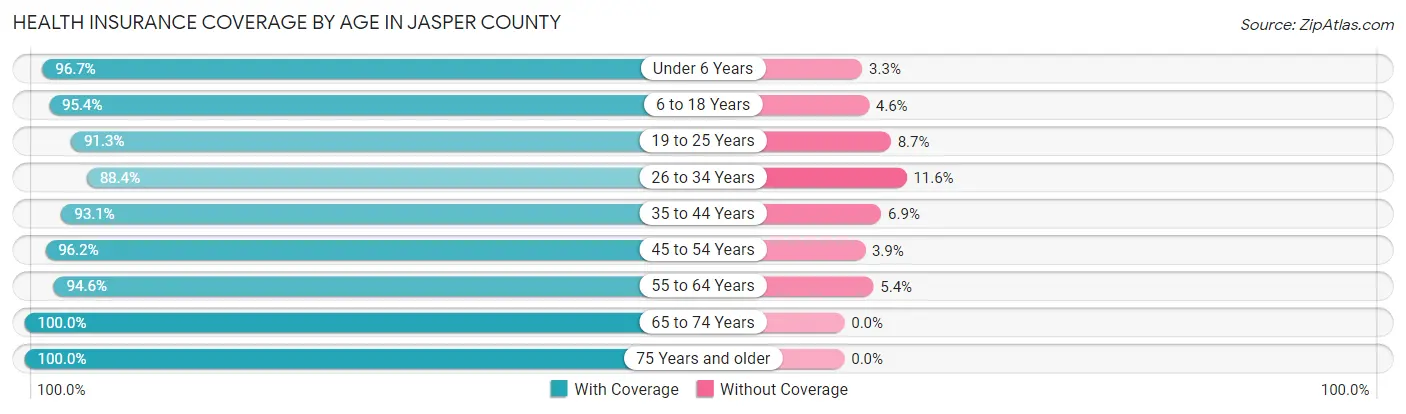
| Age Bracket | With Coverage | Without Coverage |
| Under 6 Years | 2,122 (96.7%) | 73 (3.3%) |
| 6 to 18 Years | 5,705 (95.4%) | 274 (4.6%) |
| 19 to 25 Years | 2,341 (91.3%) | 222 (8.7%) |
| 26 to 34 Years | 2,952 (88.4%) | 387 (11.6%) |
| 35 to 44 Years | 3,739 (93.1%) | 276 (6.9%) |
| 45 to 54 Years | 3,948 (96.2%) | 158 (3.8%) |
| 55 to 64 Years | 4,470 (94.6%) | 256 (5.4%) |
| 65 to 74 Years | 3,552 (100.0%) | 0 (0.0%) |
| 75 Years and older | 2,262 (100.0%) | 0 (0.0%) |
| Total | 31,091 (95.0%) | 1,646 (5.0%) |
Health Insurance Coverage by Citizenship Status in Jasper County
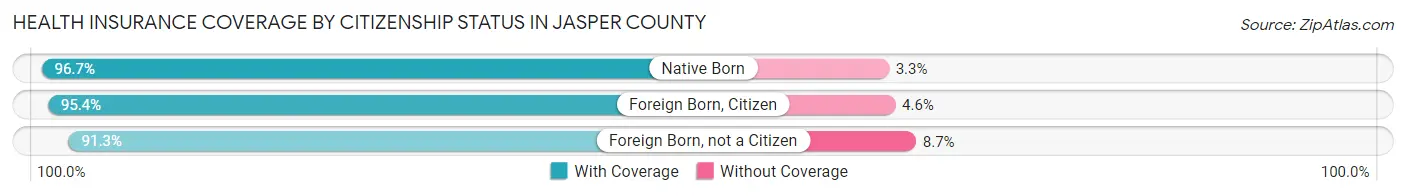
| Citizenship Status | With Coverage | Without Coverage |
| Native Born | 2,122 (96.7%) | 73 (3.3%) |
| Foreign Born, Citizen | 5,705 (95.4%) | 274 (4.6%) |
| Foreign Born, not a Citizen | 2,341 (91.3%) | 222 (8.7%) |
Health Insurance Coverage by Household Income in Jasper County

| Household Income | With Coverage | Without Coverage |
| Under $25,000 | 2,398 (94.1%) | 151 (5.9%) |
| $25,000 to $49,999 | 3,973 (94.7%) | 224 (5.3%) |
| $50,000 to $74,999 | 4,957 (91.7%) | 446 (8.3%) |
| $75,000 to $99,999 | 6,304 (94.2%) | 389 (5.8%) |
| $100,000 and over | 13,109 (96.8%) | 430 (3.2%) |
Public vs Private Health Insurance Coverage by Age in Jasper County

| Age Bracket | Public Insurance | Private Insurance |
| Under 6 | 686 (31.2%) | 1,547 (70.5%) |
| 6 to 18 Years | 2,030 (34.0%) | 4,071 (68.1%) |
| 19 to 25 Years | 407 (15.9%) | 1,959 (76.4%) |
| 25 to 34 Years | 882 (26.4%) | 2,204 (66.0%) |
| 35 to 44 Years | 954 (23.8%) | 2,914 (72.6%) |
| 45 to 54 Years | 666 (16.2%) | 3,463 (84.3%) |
| 55 to 64 Years | 947 (20.0%) | 3,803 (80.5%) |
| 65 to 74 Years | 3,412 (96.1%) | 2,246 (63.2%) |
| 75 Years and over | 2,239 (99.0%) | 1,737 (76.8%) |
| Total | 12,223 (37.3%) | 23,944 (73.1%) |
Disability Status by Sex by Age in Jasper County
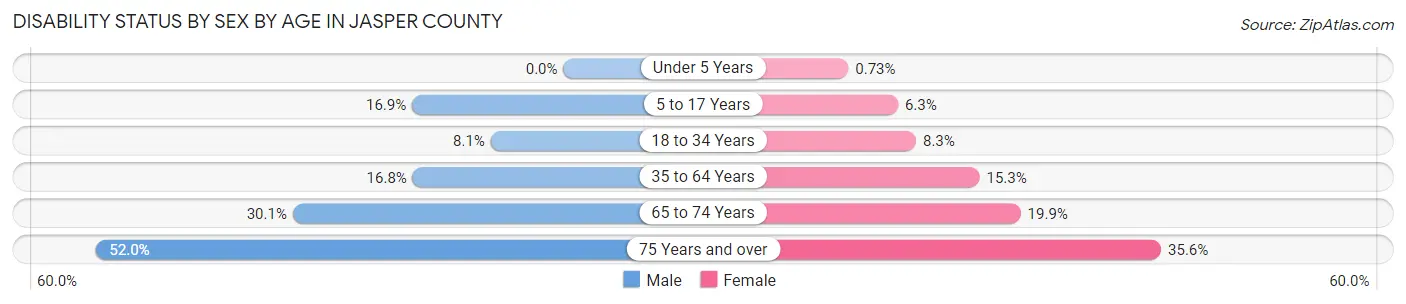
| Age Bracket | Male | Female |
| Under 5 Years | 0 (0.0%) | 6 (0.7%) |
| 5 to 17 Years | 493 (16.9%) | 179 (6.3%) |
| 18 to 34 Years | 262 (8.1%) | 267 (8.3%) |
| 35 to 64 Years | 1,100 (16.8%) | 965 (15.3%) |
| 65 to 74 Years | 520 (30.1%) | 364 (19.9%) |
| 75 Years and over | 508 (52.0%) | 457 (35.6%) |
Disability Class by Sex by Age in Jasper County
Disability Class: Hearing Difficulty
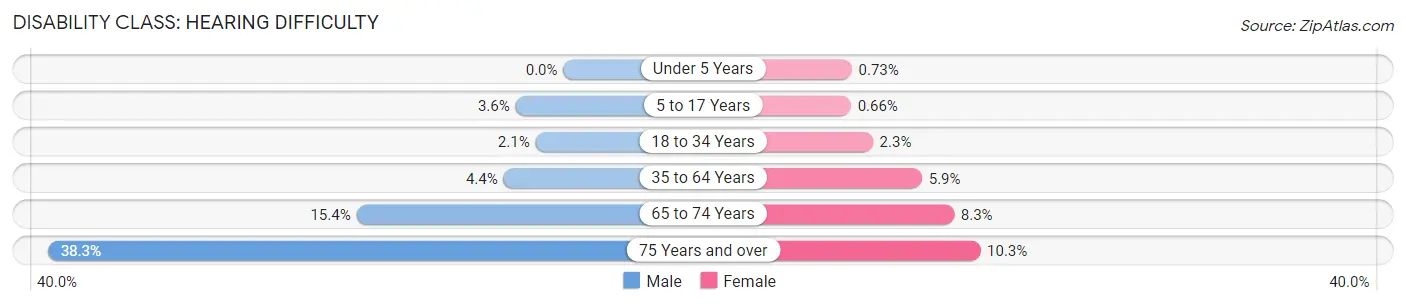
| Age Bracket | Male | Female |
| Under 5 Years | 0 (0.0%) | 6 (0.7%) |
| 5 to 17 Years | 104 (3.5%) | 19 (0.7%) |
| 18 to 34 Years | 67 (2.1%) | 74 (2.3%) |
| 35 to 64 Years | 291 (4.4%) | 374 (5.9%) |
| 65 to 74 Years | 265 (15.4%) | 152 (8.3%) |
| 75 Years and over | 374 (38.3%) | 132 (10.3%) |
Disability Class: Vision Difficulty
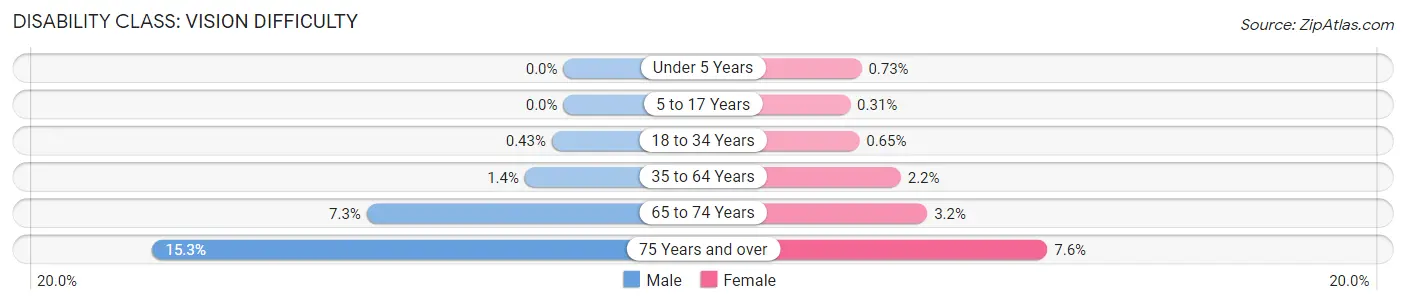
| Age Bracket | Male | Female |
| Under 5 Years | 0 (0.0%) | 6 (0.7%) |
| 5 to 17 Years | 0 (0.0%) | 9 (0.3%) |
| 18 to 34 Years | 14 (0.4%) | 21 (0.6%) |
| 35 to 64 Years | 94 (1.4%) | 138 (2.2%) |
| 65 to 74 Years | 126 (7.3%) | 58 (3.2%) |
| 75 Years and over | 149 (15.2%) | 98 (7.6%) |
Disability Class: Cognitive Difficulty
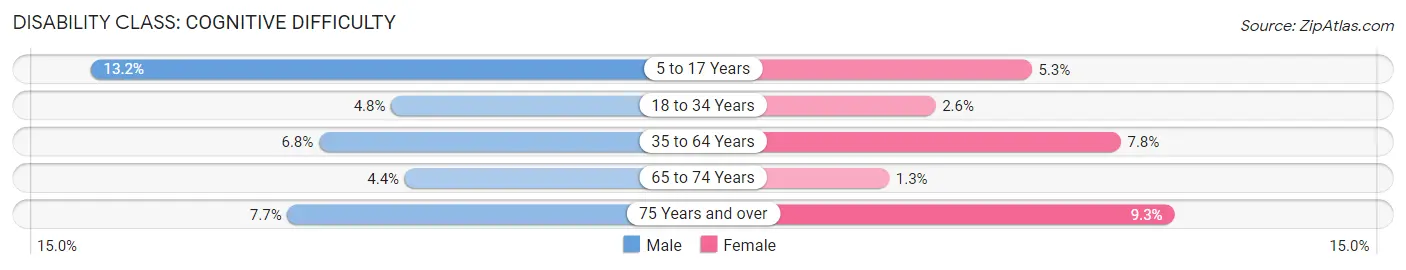
| Age Bracket | Male | Female |
| 5 to 17 Years | 385 (13.2%) | 151 (5.3%) |
| 18 to 34 Years | 155 (4.8%) | 84 (2.6%) |
| 35 to 64 Years | 446 (6.8%) | 488 (7.8%) |
| 65 to 74 Years | 76 (4.4%) | 24 (1.3%) |
| 75 Years and over | 75 (7.7%) | 119 (9.3%) |
Disability Class: Ambulatory Difficulty
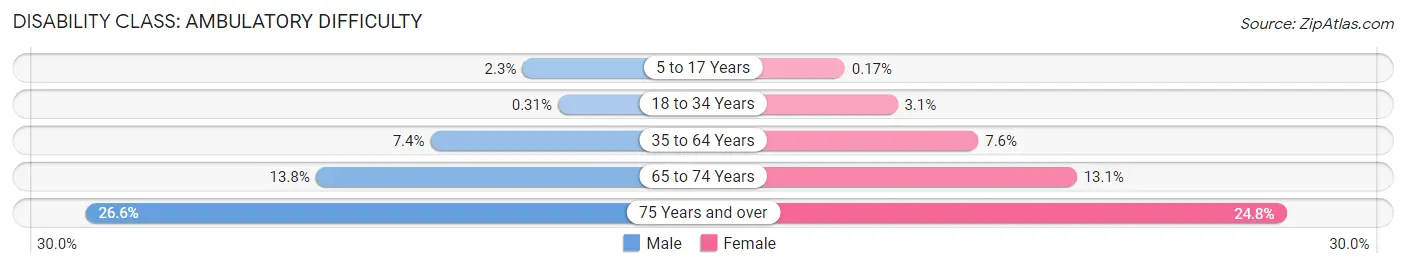
| Age Bracket | Male | Female |
| 5 to 17 Years | 67 (2.3%) | 5 (0.2%) |
| 18 to 34 Years | 10 (0.3%) | 100 (3.1%) |
| 35 to 64 Years | 486 (7.4%) | 478 (7.6%) |
| 65 to 74 Years | 238 (13.8%) | 239 (13.1%) |
| 75 Years and over | 260 (26.6%) | 318 (24.7%) |
Disability Class: Self-Care Difficulty
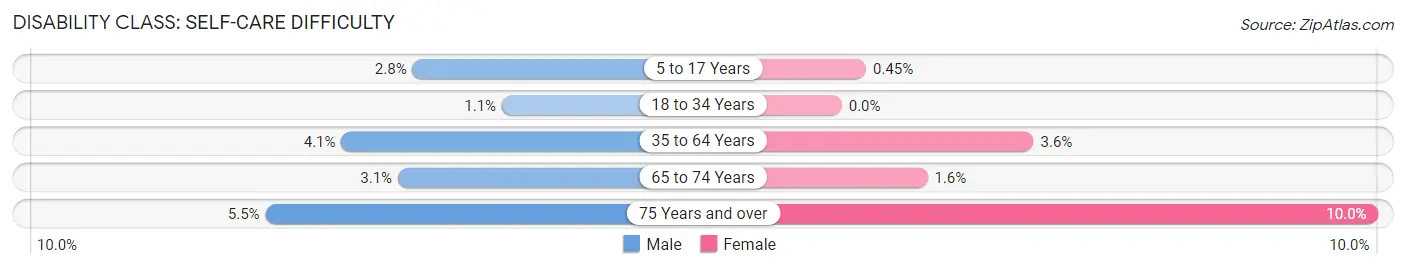
| Age Bracket | Male | Female |
| 5 to 17 Years | 82 (2.8%) | 13 (0.4%) |
| 18 to 34 Years | 37 (1.1%) | 0 (0.0%) |
| 35 to 64 Years | 270 (4.1%) | 224 (3.6%) |
| 65 to 74 Years | 53 (3.1%) | 29 (1.6%) |
| 75 Years and over | 54 (5.5%) | 128 (10.0%) |
Technology Access in Jasper County
Computing Device Access in Jasper County

| Device Type | # Households | % Households |
| Desktop or Laptop | 9,831 | 78.3% |
| Smartphone | 10,882 | 86.7% |
| Tablet | 7,896 | 62.9% |
| No Computing Device | 708 | 5.6% |
| Total | 12,554 | 100.0% |
Internet Access in Jasper County

| Internet Type | # Households | % Households |
| Dial-Up Internet | 68 | 0.5% |
| Broadband Home | 8,877 | 70.7% |
| Cellular Data Only | 1,173 | 9.3% |
| Satellite Internet | 1,388 | 11.1% |
| No Internet | 1,370 | 10.9% |
| Total | 12,554 | 100.0% |
Jasper County Summary
Jasper County is located in the northwest corner of Indiana, and is part of the Chicago metropolitan area. It is bordered by Lake and Porter counties to the north, Newton County to the east, White County to the south, and LaPorte County to the west. The county seat is Rensselaer, and the largest city is DeMotte.
History
Jasper County was formed in 1838 from parts of Newton and White counties. It was named for Sgt. William Jasper, a Revolutionary War hero who died in the Battle of Fort Moultrie. The first settlers arrived in the area in 1834, and the county was officially organized in 1837.
The county was largely agricultural in its early years, with the main crops being wheat, corn, and oats. The first railroad line was built in 1853, connecting Rensselaer to Chicago. This allowed for the development of the county’s coal mining industry, which was a major source of employment for many years.
In the late 19th century, the county saw a boom in the lumber industry, with several sawmills being built in the area. This led to the development of several small towns, such as DeMotte, Wheatfield, and Roselawn.
Geography
Jasper County covers an area of 517 square miles, making it the fourth-largest county in Indiana. It is mostly flat, with some rolling hills in the northern part of the county. The Kankakee River runs through the county, and there are several small lakes and ponds. The highest point in the county is located in the northwest corner, at an elevation of 890 feet.
The climate of Jasper County is humid continental, with hot summers and cold winters. The average annual temperature is around 50 degrees Fahrenheit, and the average annual precipitation is around 40 inches.
Economy
The economy of Jasper County is largely based on agriculture and manufacturing. The main crops grown in the county are corn, soybeans, and wheat. There are also several dairy farms in the area.
Manufacturing is the largest sector of the economy, with several factories located in the county. These include a steel mill, a paper mill, and several food processing plants. The county also has a large tourism industry, with several popular attractions, such as the Jasper-Pulaski Fish and Wildlife Area and the Jasper-Pulaski State Park.
Demographics
As of the 2010 census, Jasper County had a population of 33,478. The racial makeup of the county was 94.3% White, 1.2% African American, 0.4% Native American, 0.7% Asian, 0.1% Pacific Islander, 1.7% from other races, and 1.6% from two or more races. Hispanic or Latino of any race were 4.2% of the population.
The median household income in the county was $50,845, and the median family income was $60,945. The per capita income was $23,845. About 8.3% of the population was below the poverty line.
Jasper County is served by several school districts, including the Rensselaer Central School Corporation, the Kankakee Valley School Corporation, and the DeMotte Christian School Corporation. The county also has several higher education institutions, including Purdue University Northwest and Ivy Tech Community College.
Common Questions
What is the Total Population of Jasper County?
Total Population of Jasper County is 33,045.
What is the Total Male Population of Jasper County?
Total Male Population of Jasper County is 16,600.
What is the Total Female Population of Jasper County?
Total Female Population of Jasper County is 16,445.
What is the Ratio of Males per 100 Females in Jasper County?
There are 100.94 Males per 100 Females in Jasper County.
What is the Ratio of Females per 100 Males in Jasper County?
There are 99.07 Females per 100 Males in Jasper County.
What is the Median Population Age in Jasper County?
Median Population Age in Jasper County is 41.4 Years.
What is the Average Family Size in Jasper County
Average Family Size in Jasper County is 3.1 People.
What is the Average Household Size in Jasper County
Average Household Size in Jasper County is 2.6 People.
What is Per Capita Income in Jasper County?
Per Capita income in Jasper County is $35,793.
What is the Median Family Income in Jasper County?
Median Family Income in Jasper County is $90,042.
What is the Median Household income in Jasper County?
Median Household Income in Jasper County is $77,777.
What is Income or Wage Gap in Jasper County?
Income or Wage Gap in Jasper County is 51.6%.
Women in Jasper County earn 48.4 cents for every dollar earned by a man.
What is Family Income Deficit in Jasper County?
Family Income Deficit in Jasper County is $12,617.
Families that are below poverty line in Jasper County earn $12,617 less on average than the poverty threshold level.
What is Inequality or Gini Index in Jasper County?
Inequality or Gini Index in Jasper County is 0.41.
How Large is the Labor Force in Jasper County?
There are 16,068 People in the Labor Forcein in Jasper County.
What is the Percentage of People in the Labor Force in Jasper County?
61.1% of People are in the Labor Force in Jasper County.
What is the Unemployment Rate in Jasper County?
Unemployment Rate in Jasper County is 4.1%.