Jackson County, IN
Jackson County Map

Jackson County Overview
46,212
TOTAL POPULATION
23,240
MALE POPULATION
22,972
FEMALE POPULATION
101.17
MALES / 100 FEMALES
98.85
FEMALES / 100 MALES
39.5
MEDIAN AGE
3.1
AVG FAMILY SIZE
2.6
AVG HOUSEHOLD SIZE
$31,743
PER CAPITA INCOME
$79,256
AVG FAMILY INCOME
$65,609
AVG HOUSEHOLD INCOME
29.0%
WAGE / INCOME GAP [ % ]
71.0¢/ $1
WAGE / INCOME GAP [ $ ]
$8,482
FAMILY INCOME DEFICIT
0.42
INEQUALITY / GINI INDEX
22,939
LABOR FORCE [ PEOPLE ]
63.1%
PERCENT IN LABOR FORCE
2.7%
UNEMPLOYMENT RATE
Jackson County Area Codes
Race in Jackson County
The most populous races in Jackson County are White / Caucasian (40,352 | 87.3%), Hispanic or Latino (3,791 | 8.2%), and Two or more Races (2,736 | 5.9%).

| Race | # Population | % Population |
| Asian | 846 | 1.8% |
| Black / African American | 506 | 1.1% |
| Hawaiian / Pacific | 30 | 0.1% |
| Hispanic or Latino | 3,791 | 8.2% |
| Native / Alaskan | 172 | 0.4% |
| White / Caucasian | 40,352 | 87.3% |
| Two or more Races | 2,736 | 5.9% |
| Some other Race | 1,570 | 3.4% |
| Total | 46,212 | 100.0% |
Ancestry in Jackson County
The most populous ancestries reported in Jackson County are German (10,060 | 21.8%), American (5,675 | 12.3%), English (5,379 | 11.6%), Irish (3,935 | 8.5%), and Mexican (1,958 | 4.2%), together accounting for 58.5% of all Jackson County residents.

| Ancestry | # Population | % Population |
| African | 76 | 0.2% |
| American | 5,675 | 12.3% |
| Arab | 12 | 0.0% |
| Argentinean | 12 | 0.0% |
| Austrian | 36 | 0.1% |
| Belgian | 8 | 0.0% |
| Bhutanese | 558 | 1.2% |
| Blackfeet | 84 | 0.2% |
| British | 129 | 0.3% |
| Burmese | 22 | 0.1% |
| Canadian | 12 | 0.0% |
| Celtic | 13 | 0.0% |
| Central American | 1,096 | 2.4% |
| Central American Indian | 159 | 0.3% |
| Cherokee | 196 | 0.4% |
| Choctaw | 9 | 0.0% |
| Costa Rican | 5 | 0.0% |
| Croatian | 21 | 0.1% |
| Cuban | 103 | 0.2% |
| Czech | 20 | 0.0% |
| Czechoslovakian | 9 | 0.0% |
| Danish | 24 | 0.1% |
| Dutch | 625 | 1.3% |
| Eastern European | 13 | 0.0% |
| English | 5,379 | 11.6% |
| European | 335 | 0.7% |
| French | 442 | 1.0% |
| French Canadian | 62 | 0.1% |
| German | 10,060 | 21.8% |
| German Russian | 42 | 0.1% |
| Greek | 46 | 0.1% |
| Guatemalan | 930 | 2.0% |
| Honduran | 148 | 0.3% |
| Hungarian | 39 | 0.1% |
| Indian (Asian) | 2 | 0.0% |
| Irish | 3,935 | 8.5% |
| Italian | 581 | 1.3% |
| Korean | 168 | 0.4% |
| Lebanese | 6 | 0.0% |
| Lithuanian | 20 | 0.0% |
| Mexican | 1,958 | 4.2% |
| Mexican American Indian | 39 | 0.1% |
| Native Hawaiian | 112 | 0.2% |
| Northern European | 44 | 0.1% |
| Norwegian | 152 | 0.3% |
| Pennsylvania German | 18 | 0.0% |
| Polish | 585 | 1.3% |
| Puerto Rican | 510 | 1.1% |
| Romanian | 54 | 0.1% |
| Russian | 105 | 0.2% |
| Salvadoran | 13 | 0.0% |
| Scandinavian | 58 | 0.1% |
| Scotch-Irish | 363 | 0.8% |
| Scottish | 1,000 | 2.2% |
| South American | 12 | 0.0% |
| Spaniard | 40 | 0.1% |
| Spanish | 64 | 0.1% |
| Subsaharan African | 76 | 0.2% |
| Swedish | 171 | 0.4% |
| Swiss | 25 | 0.1% |
| Thai | 150 | 0.3% |
| Turkish | 4 | 0.0% |
| Ukrainian | 24 | 0.1% |
| Vietnamese | 266 | 0.6% |
| Welsh | 412 | 0.9% | View All 65 Rows |
Immigrants in Jackson County
The most numerous immigrant groups reported in Jackson County came from Latin America (1,691 | 3.7%), Central America (1,565 | 3.4%), Guatemala (751 | 1.6%), Asia (750 | 1.6%), and Mexico (704 | 1.5%), together accounting for 11.8% of all Jackson County residents.

| Immigration Origin | # Population | % Population |
| Asia | 750 | 1.6% |
| Bangladesh | 266 | 0.6% |
| Brazil | 23 | 0.1% |
| Canada | 30 | 0.1% |
| Caribbean | 103 | 0.2% |
| Central America | 1,565 | 3.4% |
| Cuba | 103 | 0.2% |
| Eastern Asia | 405 | 0.9% |
| Eastern Europe | 12 | 0.0% |
| El Salvador | 13 | 0.0% |
| England | 9 | 0.0% |
| Europe | 160 | 0.4% |
| Germany | 46 | 0.1% |
| Guatemala | 751 | 1.6% |
| Honduras | 97 | 0.2% |
| India | 79 | 0.2% |
| Ireland | 9 | 0.0% |
| Japan | 387 | 0.8% |
| Korea | 18 | 0.0% |
| Latin America | 1,691 | 3.7% |
| Mexico | 704 | 1.5% |
| Netherlands | 16 | 0.0% |
| Northern Europe | 76 | 0.2% |
| Scotland | 23 | 0.1% |
| South America | 23 | 0.1% |
| South Central Asia | 345 | 0.7% |
| Switzerland | 10 | 0.0% |
| Ukraine | 12 | 0.0% |
| Western Europe | 72 | 0.2% | View All 29 Rows |
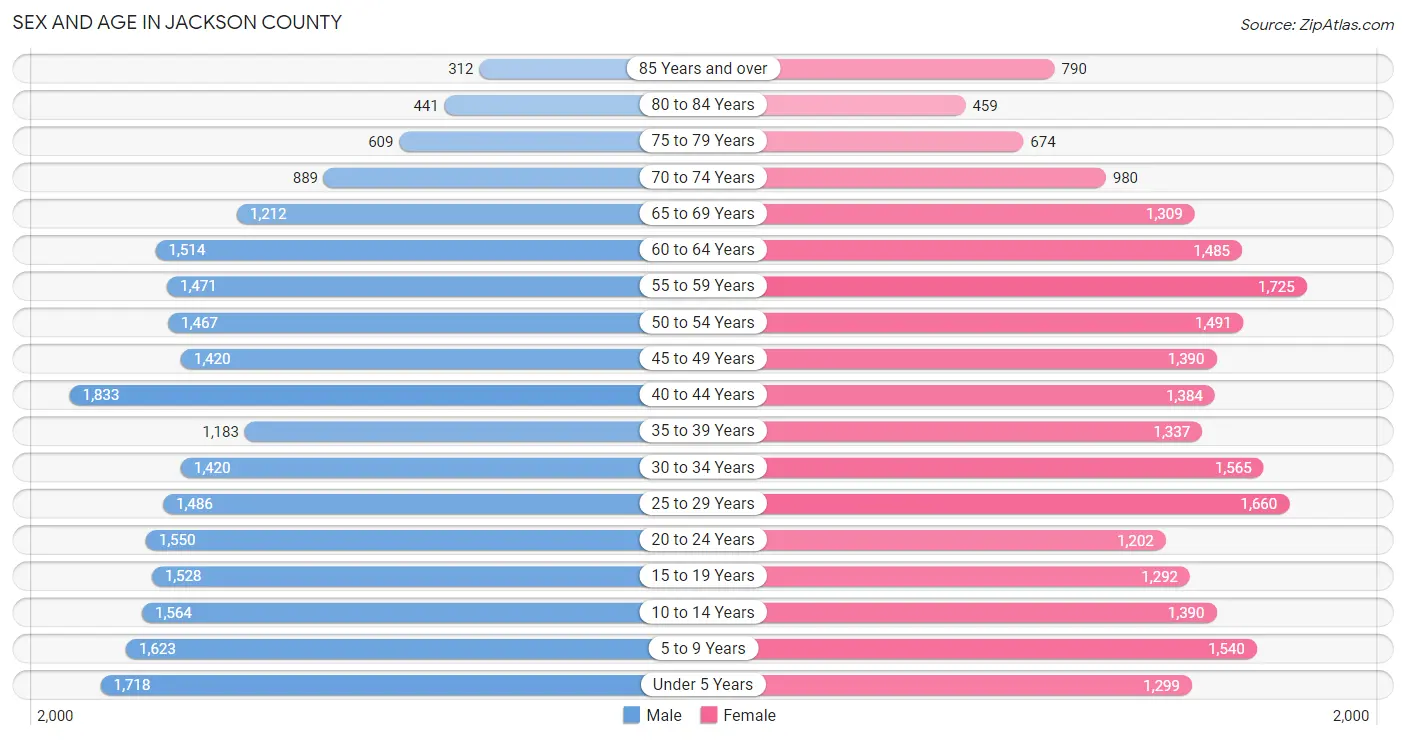
Sex and Age in Jackson County
Sex and Age in Jackson County
The most populous age groups in Jackson County are 40 to 44 Years (1,833 | 7.9%) for men and 55 to 59 Years (1,725 | 7.5%) for women.
| Age Bracket | Male | Female |
| Under 5 Years | 1,718 (7.4%) | 1,299 (5.7%) |
| 5 to 9 Years | 1,623 (7.0%) | 1,540 (6.7%) |
| 10 to 14 Years | 1,564 (6.7%) | 1,390 (6.0%) |
| 15 to 19 Years | 1,528 (6.6%) | 1,292 (5.6%) |
| 20 to 24 Years | 1,550 (6.7%) | 1,202 (5.2%) |
| 25 to 29 Years | 1,486 (6.4%) | 1,660 (7.2%) |
| 30 to 34 Years | 1,420 (6.1%) | 1,565 (6.8%) |
| 35 to 39 Years | 1,183 (5.1%) | 1,337 (5.8%) |
| 40 to 44 Years | 1,833 (7.9%) | 1,384 (6.0%) |
| 45 to 49 Years | 1,420 (6.1%) | 1,390 (6.0%) |
| 50 to 54 Years | 1,467 (6.3%) | 1,491 (6.5%) |
| 55 to 59 Years | 1,471 (6.3%) | 1,725 (7.5%) |
| 60 to 64 Years | 1,514 (6.5%) | 1,485 (6.5%) |
| 65 to 69 Years | 1,212 (5.2%) | 1,309 (5.7%) |
| 70 to 74 Years | 889 (3.8%) | 980 (4.3%) |
| 75 to 79 Years | 609 (2.6%) | 674 (2.9%) |
| 80 to 84 Years | 441 (1.9%) | 459 (2.0%) |
| 85 Years and over | 312 (1.3%) | 790 (3.4%) |
| Total | 23,240 (100.0%) | 22,972 (100.0%) |
Families and Households in Jackson County
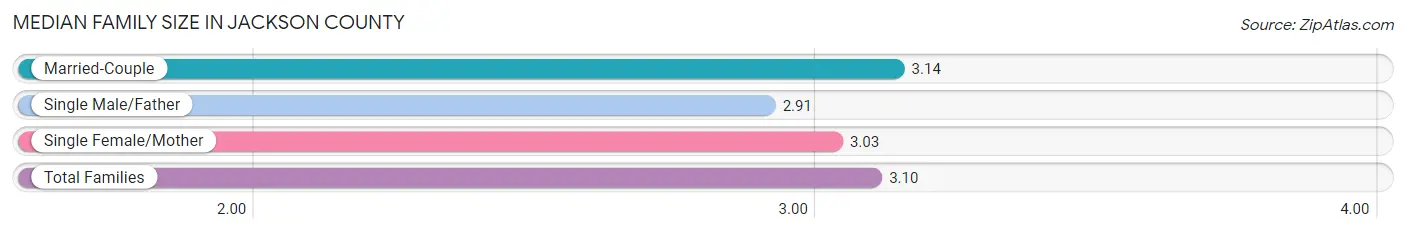
Median Family Size in Jackson County
The median family size in Jackson County is 3.10 persons per family, with married-couple families (9,126 | 76.2%) accounting for the largest median family size of 3.14 persons per family. On the other hand, single male/father families (976 | 8.2%) represent the smallest median family size with 2.91 persons per family.
| Family Type | # Families | Family Size |
| Married-Couple | 9,126 (76.2%) | 3.14 |
| Single Male/Father | 976 (8.2%) | 2.91 |
| Single Female/Mother | 1,876 (15.7%) | 3.03 |
| Total Families | 11,978 (100.0%) | 3.10 |
Median Household Size in Jackson County
The median household size in Jackson County is 2.59 persons per household, with single female/mother households (1,876 | 10.7%) accounting for the largest median household size of 3.35 persons per household. non-family households (5,596 | 31.8%) represent the smallest median household size with 1.25 persons per household.

| Household Type | # Households | Household Size |
| Married-Couple | 9,126 (51.9%) | 3.17 |
| Single Male/Father | 976 (5.6%) | 3.31 |
| Single Female/Mother | 1,876 (10.7%) | 3.35 |
| Non-family | 5,596 (31.8%) | 1.25 |
| Total Households | 17,574 (100.0%) | 2.59 |
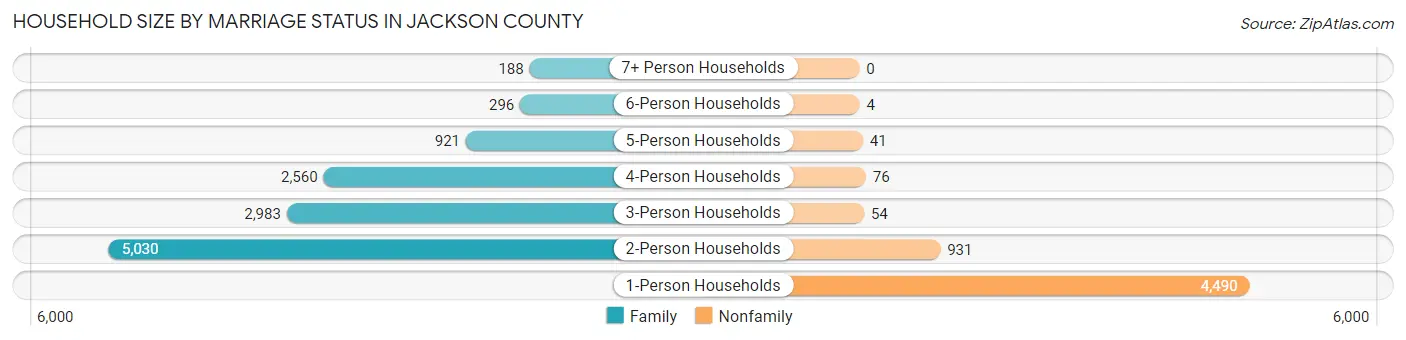
Household Size by Marriage Status in Jackson County
Out of a total of 17,574 households in Jackson County, 11,978 (68.2%) are family households, while 5,596 (31.8%) are nonfamily households. The most numerous type of family households are 2-person households, comprising 5,030, and the most common type of nonfamily households are 1-person households, comprising 4,490.
| Household Size | Family Households | Nonfamily Households |
| 1-Person Households | - | 4,490 (25.6%) |
| 2-Person Households | 5,030 (28.6%) | 931 (5.3%) |
| 3-Person Households | 2,983 (17.0%) | 54 (0.3%) |
| 4-Person Households | 2,560 (14.6%) | 76 (0.4%) |
| 5-Person Households | 921 (5.2%) | 41 (0.2%) |
| 6-Person Households | 296 (1.7%) | 4 (0.0%) |
| 7+ Person Households | 188 (1.1%) | 0 (0.0%) |
| Total | 11,978 (68.2%) | 5,596 (31.8%) |
Female Fertility in Jackson County
Fertility by Age in Jackson County
Average fertility rate in Jackson County is 47.0 births per 1,000 women. Women in the age bracket of 20 to 34 years have the highest fertility rate with 79.0 births per 1,000 women. Women in the age bracket of 20 to 34 years acount for 71.8% of all women with births.

| Age Bracket | Women with Births | Births / 1,000 Women |
| 15 to 19 years | 14 (2.9%) | 11.0 |
| 20 to 34 years | 348 (71.8%) | 79.0 |
| 35 to 50 years | 123 (25.4%) | 27.0 |
| Total | 485 (100.0%) | 47.0 |
Fertility by Age by Marriage Status in Jackson County
88.7% of women with births (485) in Jackson County are married. The highest percentage of unmarried women with births falls into 20 to 34 years age bracket with 15.8% of them unmarried at the time of birth, while the lowest percentage of unmarried women with births belong to 15 to 19 years age bracket with 0.0% of them unmarried.

| Age Bracket | Married | Unmarried |
| 15 to 19 years | 14 (100.0%) | 0 (0.0%) |
| 20 to 34 years | 293 (84.2%) | 55 (15.8%) |
| 35 to 50 years | 123 (100.0%) | 0 (0.0%) |
| Total | 430 (88.7%) | 55 (11.3%) |
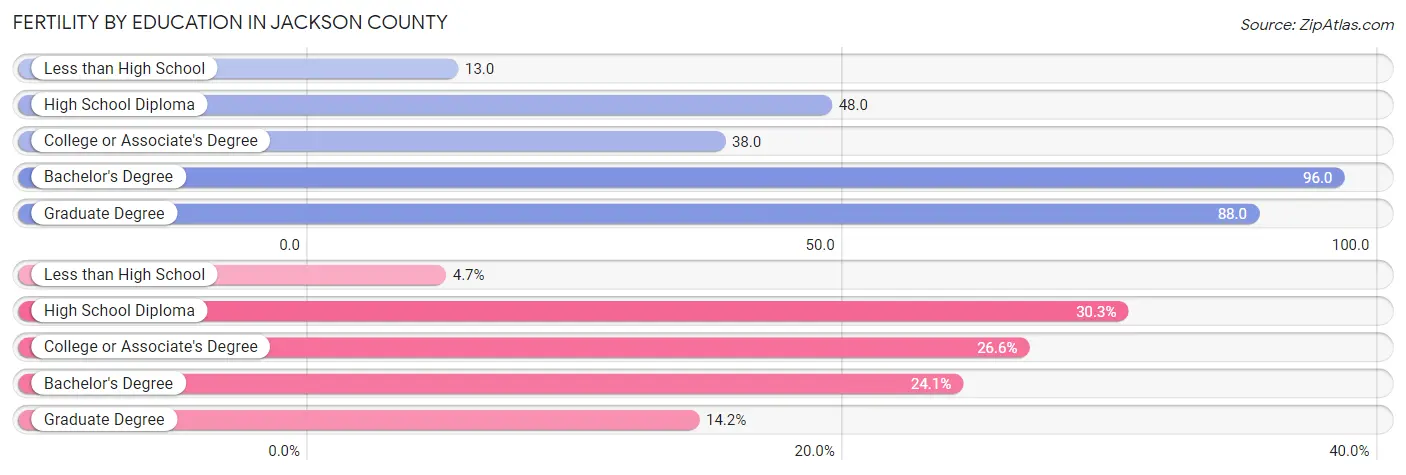
Fertility by Education in Jackson County
Average fertility rate in Jackson County is 47.0 births per 1,000 women. Women with the education attainment of bachelor's degree have the highest fertility rate of 96.0 births per 1,000 women, while women with the education attainment of less than high school have the lowest fertility at 13.0 births per 1,000 women. Women with the education attainment of high school diploma represent 30.3% of all women with births.
| Educational Attainment | Women with Births | Births / 1,000 Women |
| Less than High School | 23 (4.7%) | 13.0 |
| High School Diploma | 147 (30.3%) | 48.0 |
| College or Associate's Degree | 129 (26.6%) | 38.0 |
| Bachelor's Degree | 117 (24.1%) | 96.0 |
| Graduate Degree | 69 (14.2%) | 88.0 |
| Total | 485 (100.0%) | 47.0 |
Fertility by Education by Marriage Status in Jackson County
11.3% of women with births in Jackson County are unmarried. Women with the educational attainment of less than high school are most likely to be married with 100.0% of them married at childbirth, while women with the educational attainment of high school diploma are least likely to be married with 37.4% of them unmarried at childbirth.
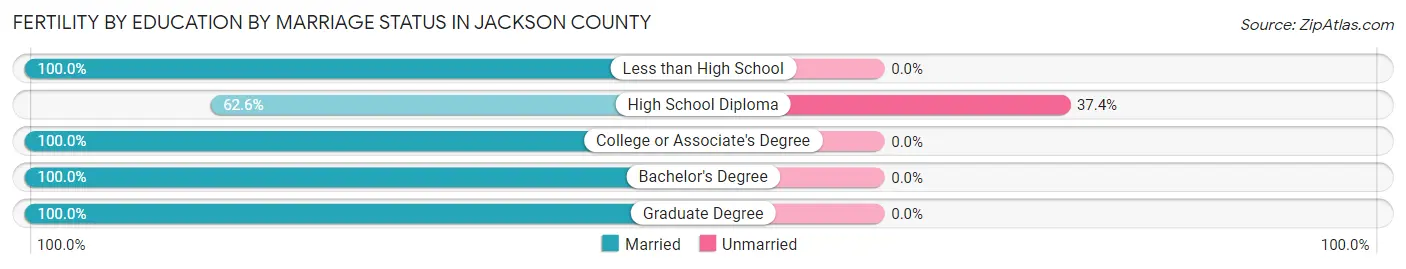
| Educational Attainment | Married | Unmarried |
| Less than High School | 23 (100.0%) | 0 (0.0%) |
| High School Diploma | 92 (62.6%) | 55 (37.4%) |
| College or Associate's Degree | 129 (100.0%) | 0 (0.0%) |
| Bachelor's Degree | 117 (100.0%) | 0 (0.0%) |
| Graduate Degree | 69 (100.0%) | 0 (0.0%) |
| Total | 430 (88.7%) | 55 (11.3%) |
Income in Jackson County
Income Overview in Jackson County
Per Capita Income in Jackson County is $31,743, while median incomes of families and households are $79,256 and $65,609 respectively.
| Characteristic | Number | Measure |
| Per Capita Income | 46,212 | $31,743 |
| Median Family Income | 11,978 | $79,256 |
| Mean Family Income | 11,978 | $92,108 |
| Median Household Income | 17,574 | $65,609 |
| Mean Household Income | 17,574 | $80,954 |
| Income Deficit | 11,978 | $8,482 |
| Wage / Income Gap (%) | 46,212 | 29.01% |
| Wage / Income Gap ($) | 46,212 | 70.99¢ per $1 |
| Gini / Inequality Index | 46,212 | 0.42 |
Earnings by Sex in Jackson County
Average Earnings in Jackson County are $41,534, $47,381 for men and $33,637 for women, a difference of 29.0%.
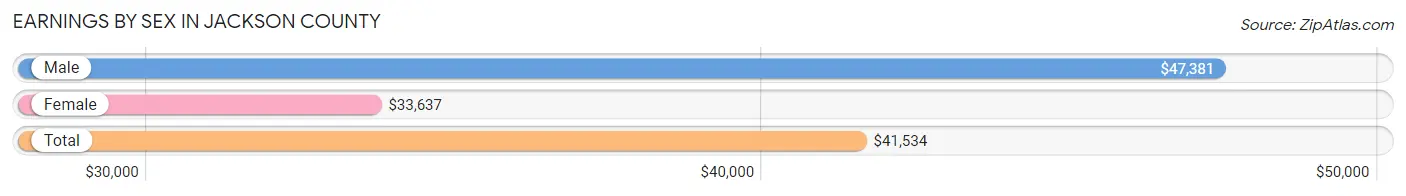
| Sex | Number | Average Earnings |
| Male | 12,797 (53.0%) | $47,381 |
| Female | 11,334 (47.0%) | $33,637 |
| Total | 24,131 (100.0%) | $41,534 |
Earnings by Sex by Income Bracket in Jackson County
The most common earnings brackets in Jackson County are $100,000+ for men (1,557 | 12.2%) and $45,000 to $49,999 for women (959 | 8.5%).

| Income | Male | Female |
| $2,499 or less | 345 (2.7%) | 618 (5.4%) |
| $2,500 to $4,999 | 475 (3.7%) | 582 (5.1%) |
| $5,000 to $7,499 | 222 (1.7%) | 470 (4.2%) |
| $7,500 to $9,999 | 191 (1.5%) | 238 (2.1%) |
| $10,000 to $12,499 | 312 (2.4%) | 267 (2.4%) |
| $12,500 to $14,999 | 218 (1.7%) | 539 (4.8%) |
| $15,000 to $17,499 | 209 (1.6%) | 347 (3.1%) |
| $17,500 to $19,999 | 251 (2.0%) | 328 (2.9%) |
| $20,000 to $22,499 | 181 (1.4%) | 498 (4.4%) |
| $22,500 to $24,999 | 351 (2.7%) | 407 (3.6%) |
| $25,000 to $29,999 | 665 (5.2%) | 830 (7.3%) |
| $30,000 to $34,999 | 586 (4.6%) | 767 (6.8%) |
| $35,000 to $39,999 | 951 (7.4%) | 583 (5.1%) |
| $40,000 to $44,999 | 973 (7.6%) | 917 (8.1%) |
| $45,000 to $49,999 | 927 (7.2%) | 959 (8.5%) |
| $50,000 to $54,999 | 767 (6.0%) | 466 (4.1%) |
| $55,000 to $64,999 | 1,249 (9.8%) | 817 (7.2%) |
| $65,000 to $74,999 | 819 (6.4%) | 582 (5.1%) |
| $75,000 to $99,999 | 1,548 (12.1%) | 741 (6.5%) |
| $100,000+ | 1,557 (12.2%) | 378 (3.3%) |
| Total | 12,797 (100.0%) | 11,334 (100.0%) |
Earnings by Sex by Educational Attainment in Jackson County
Average earnings in Jackson County are $51,082 for men and $37,935 for women, a difference of 25.7%. Men with an educational attainment of graduate degree enjoy the highest average annual earnings of $83,774, while those with less than high school education earn the least with $36,272. Women with an educational attainment of graduate degree earn the most with the average annual earnings of $62,366, while those with less than high school education have the smallest earnings of $26,094.

| Educational Attainment | Male Income | Female Income |
| Less than High School | $36,272 | $26,094 |
| High School Diploma | $46,564 | $29,782 |
| College or Associate's Degree | $50,449 | $36,696 |
| Bachelor's Degree | $83,125 | $49,894 |
| Graduate Degree | $83,774 | $62,366 |
| Total | $51,082 | $37,935 |
Family Income in Jackson County
Family Income Brackets in Jackson County
According to the Jackson County family income data, there are 2,563 families falling into the $100,000 to $149,999 income range, which is the most common income bracket and makes up 21.4% of all families. Conversely, the $10,000 to $14,999 income bracket is the least frequent group with only 216 families (1.8%) belonging to this category.
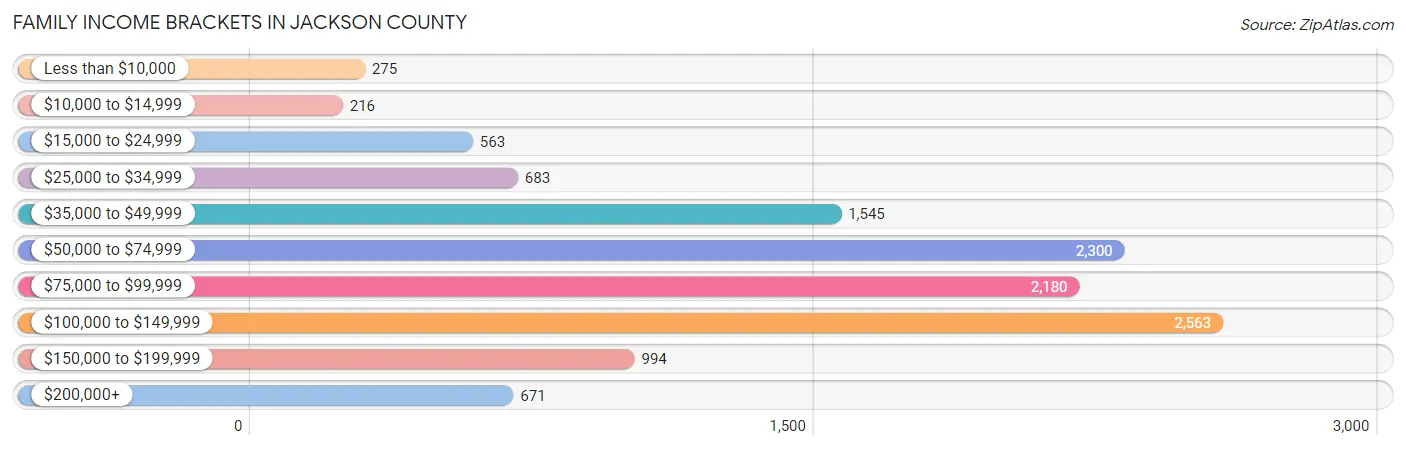
| Income Bracket | # Families | % Families |
| Less than $10,000 | 275 | 2.3% |
| $10,000 to $14,999 | 216 | 1.8% |
| $15,000 to $24,999 | 563 | 4.7% |
| $25,000 to $34,999 | 683 | 5.7% |
| $35,000 to $49,999 | 1,545 | 12.9% |
| $50,000 to $74,999 | 2,300 | 19.2% |
| $75,000 to $99,999 | 2,180 | 18.2% |
| $100,000 to $149,999 | 2,563 | 21.4% |
| $150,000 to $199,999 | 994 | 8.3% |
| $200,000+ | 671 | 5.6% |
Family Income by Famaliy Size in Jackson County
7+ person families (158 | 1.3%) account for the highest median family income in Jackson County with $142,708 per family, while 2-person families (5,586 | 46.6%) have the highest median income of $33,942 per family member.
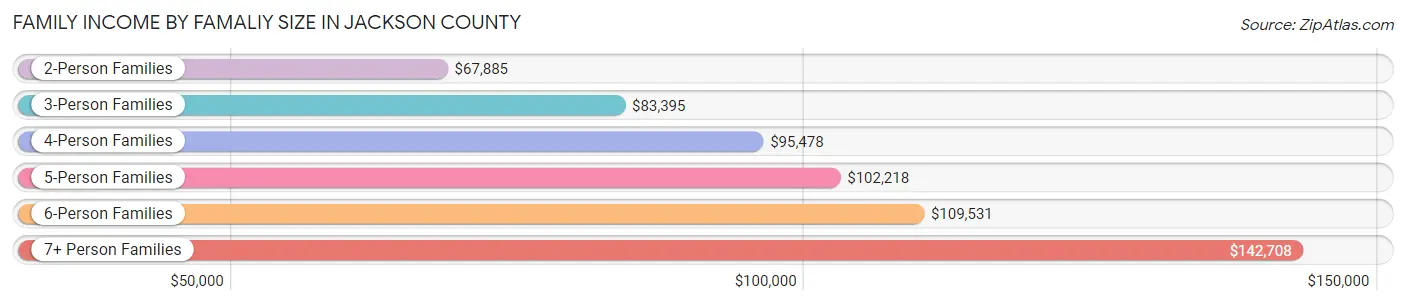
| Income Bracket | # Families | Median Income |
| 2-Person Families | 5,586 (46.6%) | $67,885 |
| 3-Person Families | 2,800 (23.4%) | $83,395 |
| 4-Person Families | 2,332 (19.5%) | $95,478 |
| 5-Person Families | 823 (6.9%) | $102,218 |
| 6-Person Families | 279 (2.3%) | $109,531 |
| 7+ Person Families | 158 (1.3%) | $142,708 |
| Total | 11,978 (100.0%) | $79,256 |
Family Income by Number of Earners in Jackson County
The median family income in Jackson County is $79,256, with families comprising 3+ earners (1,433) having the highest median family income of $143,371, while families with no earners (1,490) have the lowest median family income of $41,094, accounting for 12.0% and 12.4% of families, respectively.

| Number of Earners | # Families | Median Income |
| No Earners | 1,490 (12.4%) | $41,094 |
| 1 Earner | 4,032 (33.7%) | $52,463 |
| 2 Earners | 5,023 (41.9%) | $99,052 |
| 3+ Earners | 1,433 (12.0%) | $143,371 |
| Total | 11,978 (100.0%) | $79,256 |
Household Income in Jackson County
Household Income Brackets in Jackson County
With 3,163 households falling in the category, the $100,000 to $149,999 income range is the most frequent in Jackson County, accounting for 18.0% of all households. In contrast, only 738 households (4.2%) fall into the $10,000 to $14,999 income bracket, making it the least populous group.
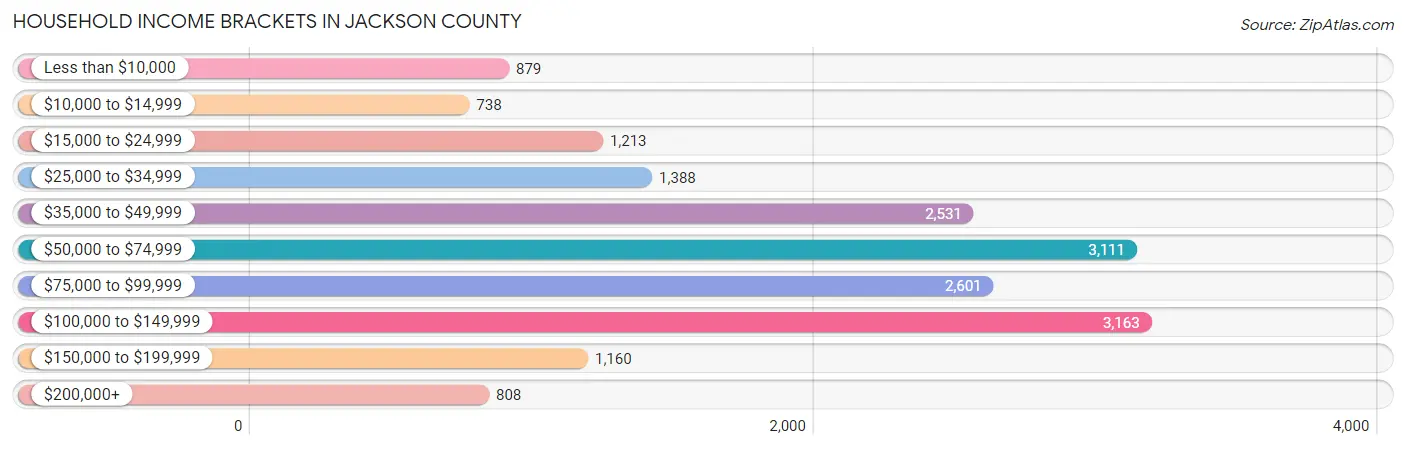
| Income Bracket | # Households | % Households |
| Less than $10,000 | 879 | 5.0% |
| $10,000 to $14,999 | 738 | 4.2% |
| $15,000 to $24,999 | 1,213 | 6.9% |
| $25,000 to $34,999 | 1,388 | 7.9% |
| $35,000 to $49,999 | 2,531 | 14.4% |
| $50,000 to $74,999 | 3,111 | 17.7% |
| $75,000 to $99,999 | 2,601 | 14.8% |
| $100,000 to $149,999 | 3,163 | 18.0% |
| $150,000 to $199,999 | 1,160 | 6.6% |
| $200,000+ | 808 | 4.6% |
Household Income by Householder Age in Jackson County
The median household income in Jackson County is $65,609, with the highest median household income of $79,459 found in the 25 to 44 years age bracket for the primary householder. A total of 5,505 households (31.3%) fall into this category. Meanwhile, the 65+ years age bracket for the primary householder has the lowest median household income of $40,754, with 4,801 households (27.3%) in this group.

| Income Bracket | # Households | Median Income |
| 15 to 24 Years | 622 (3.5%) | $47,232 |
| 25 to 44 Years | 5,505 (31.3%) | $79,459 |
| 45 to 64 Years | 6,646 (37.8%) | $78,123 |
| 65+ Years | 4,801 (27.3%) | $40,754 |
| Total | 17,574 (100.0%) | $65,609 |
Poverty in Jackson County
Income Below Poverty by Sex and Age in Jackson County
With 10.7% poverty level for males and 14.2% for females among the residents of Jackson County, 5 year old males and 75 year old and over females are the most vulnerable to poverty, with 182 males (39.9%) and 404 females (23.2%) in their respective age groups living below the poverty level.
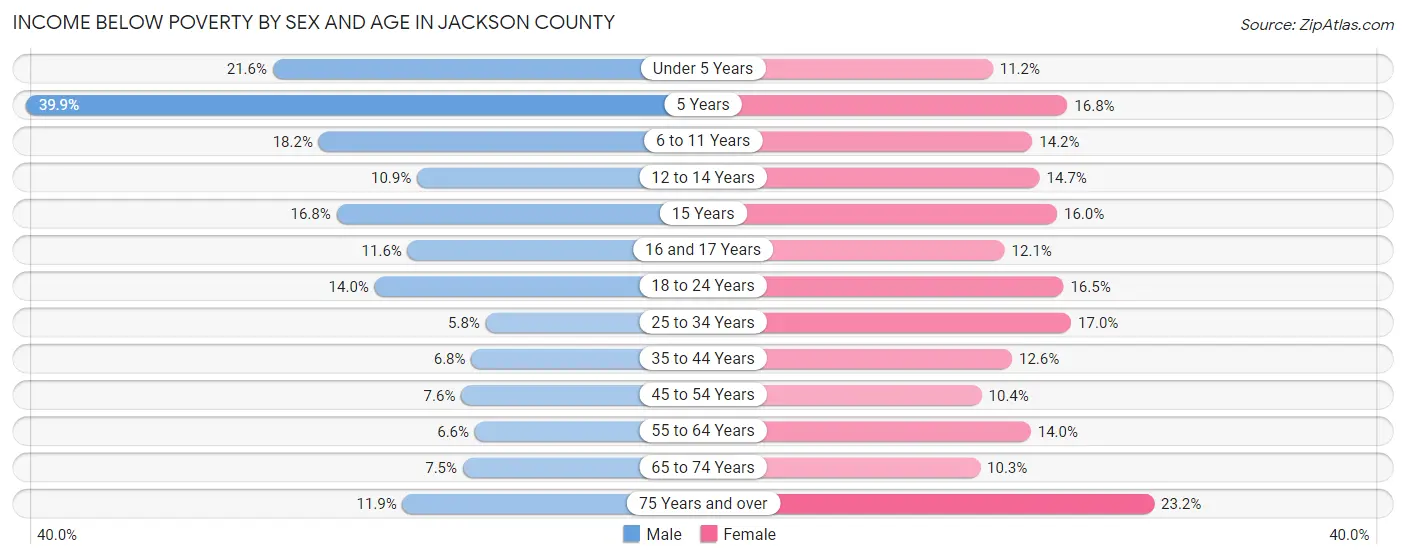
| Age Bracket | Male | Female |
| Under 5 Years | 340 (21.6%) | 142 (11.2%) |
| 5 Years | 182 (39.9%) | 32 (16.8%) |
| 6 to 11 Years | 266 (18.2%) | 250 (14.1%) |
| 12 to 14 Years | 111 (10.9%) | 135 (14.7%) |
| 15 Years | 65 (16.8%) | 54 (16.0%) |
| 16 and 17 Years | 74 (11.6%) | 67 (12.1%) |
| 18 to 24 Years | 281 (14.0%) | 263 (16.5%) |
| 25 to 34 Years | 165 (5.8%) | 547 (17.0%) |
| 35 to 44 Years | 201 (6.8%) | 342 (12.6%) |
| 45 to 54 Years | 217 (7.6%) | 299 (10.4%) |
| 55 to 64 Years | 195 (6.6%) | 444 (14.0%) |
| 65 to 74 Years | 153 (7.5%) | 222 (10.3%) |
| 75 Years and over | 156 (11.9%) | 404 (23.2%) |
| Total | 2,406 (10.7%) | 3,201 (14.2%) |
Income Above Poverty by Sex and Age in Jackson County
According to the poverty statistics in Jackson County, males aged 25 to 34 years and females aged 65 to 74 years are the age groups that are most secure financially, with 94.2% of males and 89.7% of females in these age groups living above the poverty line.
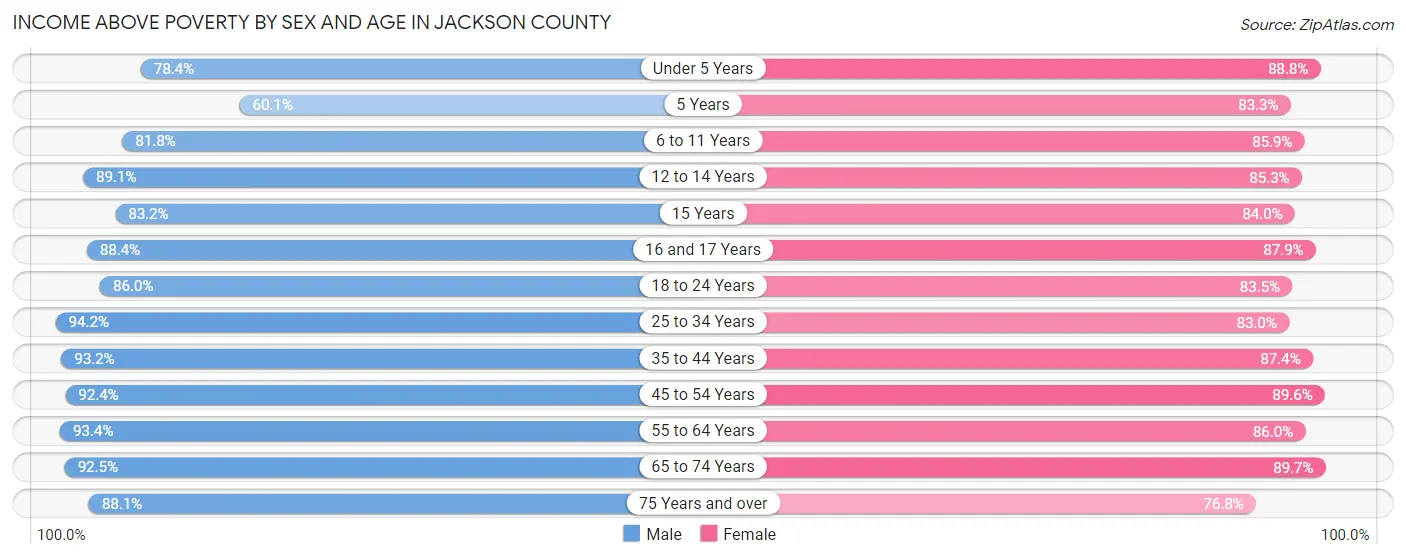
| Age Bracket | Male | Female |
| Under 5 Years | 1,236 (78.4%) | 1,125 (88.8%) |
| 5 Years | 274 (60.1%) | 159 (83.3%) |
| 6 to 11 Years | 1,199 (81.8%) | 1,517 (85.9%) |
| 12 to 14 Years | 911 (89.1%) | 784 (85.3%) |
| 15 Years | 321 (83.2%) | 284 (84.0%) |
| 16 and 17 Years | 566 (88.4%) | 487 (87.9%) |
| 18 to 24 Years | 1,724 (86.0%) | 1,335 (83.5%) |
| 25 to 34 Years | 2,695 (94.2%) | 2,665 (83.0%) |
| 35 to 44 Years | 2,744 (93.2%) | 2,363 (87.4%) |
| 45 to 54 Years | 2,645 (92.4%) | 2,582 (89.6%) |
| 55 to 64 Years | 2,774 (93.4%) | 2,721 (86.0%) |
| 65 to 74 Years | 1,898 (92.5%) | 1,940 (89.7%) |
| 75 Years and over | 1,150 (88.1%) | 1,338 (76.8%) |
| Total | 20,137 (89.3%) | 19,300 (85.8%) |
Income Below Poverty Among Married-Couple Families in Jackson County
The poverty statistics for married-couple families in Jackson County show that 4.2% or 380 of the total 9,126 families live below the poverty line. Families with 3 or 4 children have the highest poverty rate of 13.2%, comprising of 89 families. On the other hand, families with 5 or more children have the lowest poverty rate of 0.0%, which includes 0 families.
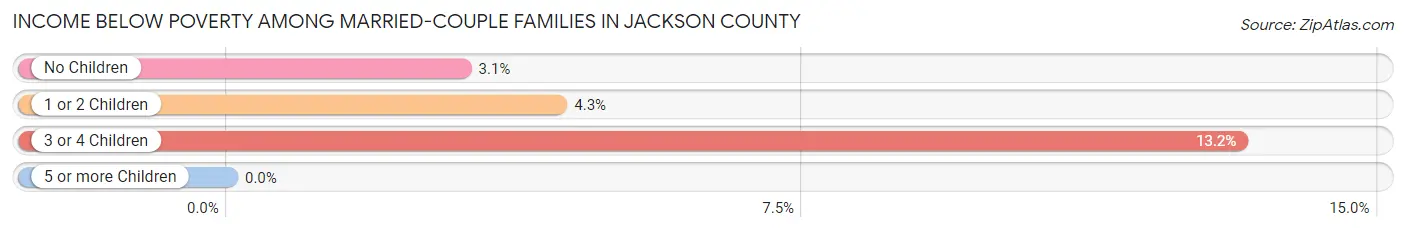
| Children | Above Poverty | Below Poverty |
| No Children | 5,208 (97.0%) | 164 (3.0%) |
| 1 or 2 Children | 2,828 (95.7%) | 127 (4.3%) |
| 3 or 4 Children | 586 (86.8%) | 89 (13.2%) |
| 5 or more Children | 124 (100.0%) | 0 (0.0%) |
| Total | 8,746 (95.8%) | 380 (4.2%) |
Income Below Poverty Among Single-Parent Households in Jackson County
According to the poverty data in Jackson County, 13.2% or 129 single-father households and 28.0% or 526 single-mother households are living below the poverty line. Among single-father households, those with 3 or 4 children have the highest poverty rate, with 10 households (26.3%) experiencing poverty. Likewise, among single-mother households, those with 3 or 4 children have the highest poverty rate, with 76 households (55.1%) falling below the poverty line.

| Children | Single Father | Single Mother |
| No Children | 51 (11.8%) | 94 (13.8%) |
| 1 or 2 Children | 68 (13.4%) | 356 (33.7%) |
| 3 or 4 Children | 10 (26.3%) | 76 (55.1%) |
| 5 or more Children | 0 (0.0%) | 0 (0.0%) |
| Total | 129 (13.2%) | 526 (28.0%) |
Income Below Poverty Among Married-Couple vs Single-Parent Households in Jackson County
The poverty data for Jackson County shows that 380 of the married-couple family households (4.2%) and 655 of the single-parent households (23.0%) are living below the poverty level. Within the married-couple family households, those with 3 or 4 children have the highest poverty rate, with 89 households (13.2%) falling below the poverty line. Among the single-parent households, those with 3 or 4 children have the highest poverty rate, with 86 household (48.9%) living below poverty.

| Children | Married-Couple Families | Single-Parent Households |
| No Children | 164 (3.0%) | 145 (13.0%) |
| 1 or 2 Children | 127 (4.3%) | 424 (27.1%) |
| 3 or 4 Children | 89 (13.2%) | 86 (48.9%) |
| 5 or more Children | 0 (0.0%) | 0 (0.0%) |
| Total | 380 (4.2%) | 655 (23.0%) |
Employment Characteristics in Jackson County
Employment by Class of Employer in Jackson County
Among the 22,017 employed individuals in Jackson County, private company employees (16,697 | 75.8%), local government employees (1,426 | 6.5%), and not-for-profit organizations (1,332 | 6.0%) make up the most common classes of employment.
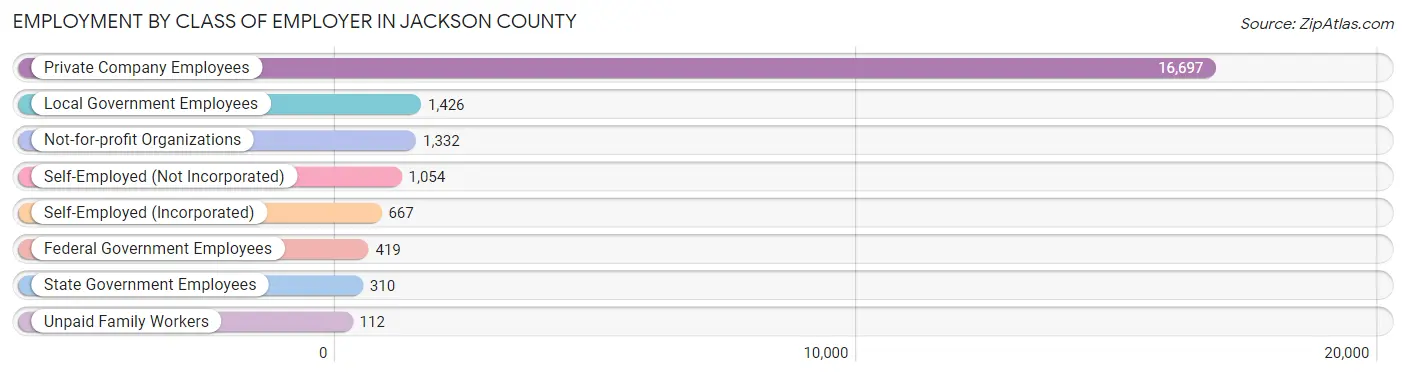
| Employer Class | # Employees | % Employees |
| Private Company Employees | 16,697 | 75.8% |
| Self-Employed (Incorporated) | 667 | 3.0% |
| Self-Employed (Not Incorporated) | 1,054 | 4.8% |
| Not-for-profit Organizations | 1,332 | 6.0% |
| Local Government Employees | 1,426 | 6.5% |
| State Government Employees | 310 | 1.4% |
| Federal Government Employees | 419 | 1.9% |
| Unpaid Family Workers | 112 | 0.5% |
| Total | 22,017 | 100.0% |
Employment Status by Age in Jackson County
According to the labor force statistics for Jackson County, out of the total population over 16 years of age (36,353), 63.1% or 22,939 individuals are in the labor force, with 2.7% or 619 of them unemployed. The age group with the highest labor force participation rate is 25 to 29 years, with 89.7% or 2,822 individuals in the labor force. Within the labor force, the 20 to 24 years age range has the highest percentage of unemployed individuals, with 6.6% or 140 of them being unemployed.
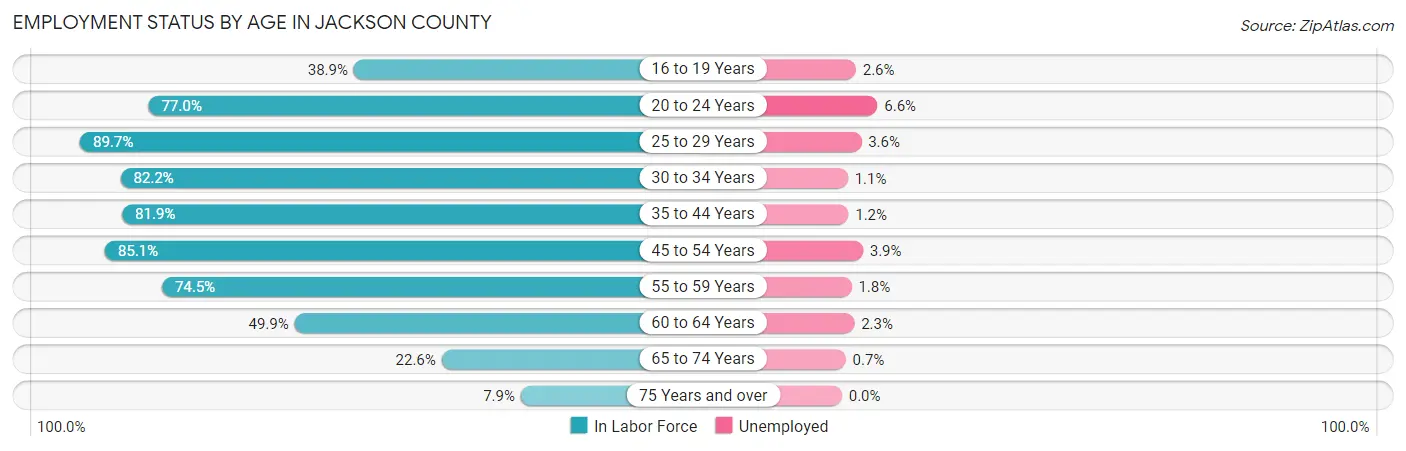
| Age Bracket | In Labor Force | Unemployed |
| 16 to 19 Years | 815 (38.9%) | 21 (2.6%) |
| 20 to 24 Years | 2,119 (77.0%) | 140 (6.6%) |
| 25 to 29 Years | 2,822 (89.7%) | 102 (3.6%) |
| 30 to 34 Years | 2,454 (82.2%) | 27 (1.1%) |
| 35 to 44 Years | 4,699 (81.9%) | 56 (1.2%) |
| 45 to 54 Years | 4,909 (85.1%) | 191 (3.9%) |
| 55 to 59 Years | 2,381 (74.5%) | 43 (1.8%) |
| 60 to 64 Years | 1,497 (49.9%) | 34 (2.3%) |
| 65 to 74 Years | 992 (22.6%) | 7 (0.7%) |
| 75 Years and over | 260 (7.9%) | 0 (0.0%) |
| Total | 22,939 (63.1%) | 619 (2.7%) |
Employment Status by Educational Attainment in Jackson County
According to labor force statistics for Jackson County, 78.7% of individuals (18,755) out of the total population between 25 and 64 years of age (23,831) are in the labor force, with 2.4% or 450 of them being unemployed. The group with the highest labor force participation rate are those with the educational attainment of bachelor's degree or higher, with 88.0% or 4,288 individuals in the labor force. Within the labor force, individuals with high school diploma education have the highest percentage of unemployment, with 4.2% or 305 of them being unemployed.
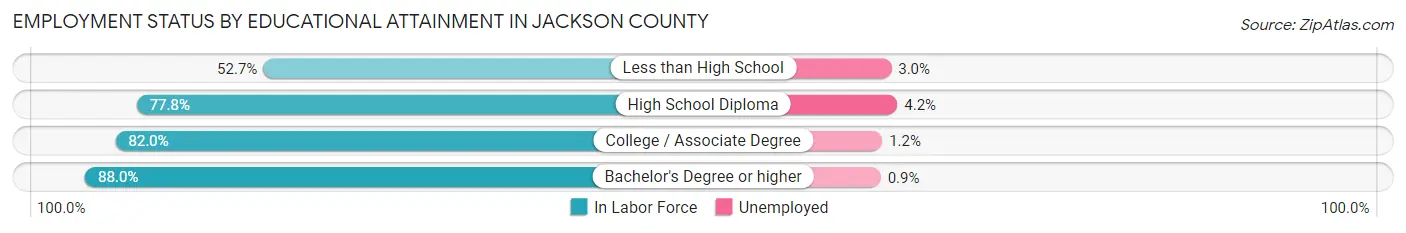
| Educational Attainment | In Labor Force | Unemployed |
| Less than High School | 1,229 (52.7%) | 70 (3.0%) |
| High School Diploma | 7,256 (77.8%) | 392 (4.2%) |
| College / Associate Degree | 5,986 (82.0%) | 88 (1.2%) |
| Bachelor's Degree or higher | 4,288 (88.0%) | 44 (0.9%) |
| Total | 18,755 (78.7%) | 572 (2.4%) |
Employment Occupations by Sex in Jackson County
Management, Business, Science and Arts Occupations
The most common Management, Business, Science and Arts occupations in Jackson County are Management (2,271 | 10.2%), Community & Social Service (1,563 | 7.0%), Computers, Engineering & Science (1,134 | 5.1%), Education Instruction & Library (1,090 | 4.9%), and Health Diagnosing & Treating (825 | 3.7%).

Management, Business, Science and Arts Occupations by Sex
Within the Management, Business, Science and Arts occupations in Jackson County, the most male-oriented occupations are Architecture & Engineering (84.4%), Management (70.2%), and Computers, Engineering & Science (70.1%), while the most female-oriented occupations are Education Instruction & Library (86.8%), Health Diagnosing & Treating (83.3%), and Health Technologists (78.0%).
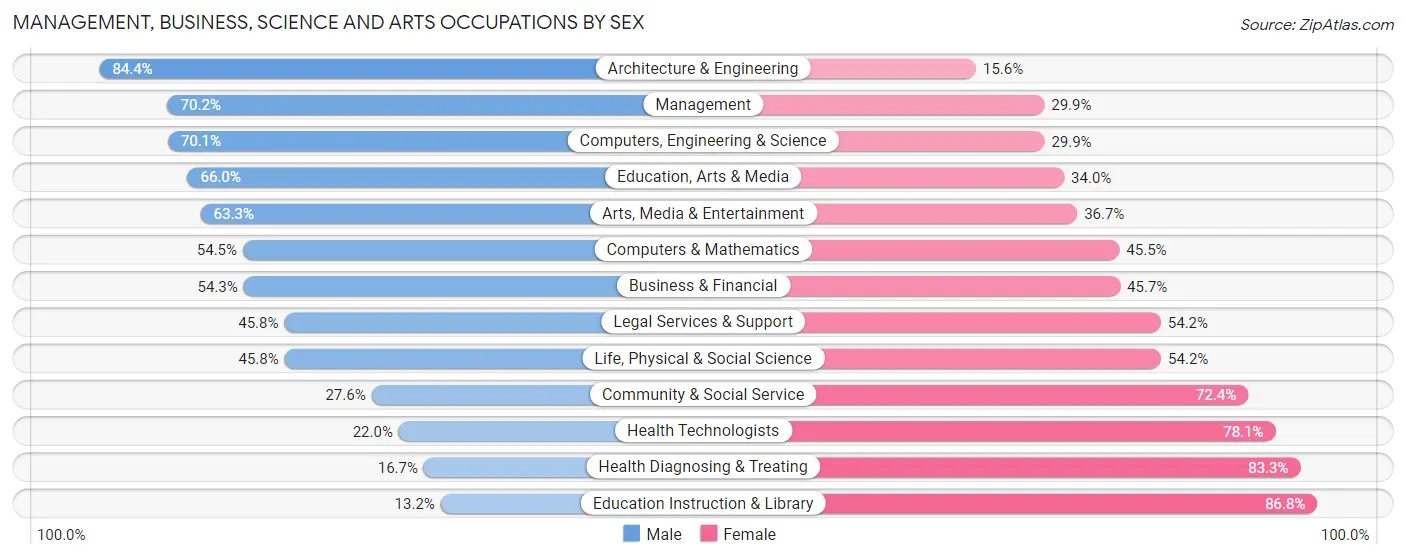
| Occupation | Male | Female |
| Management | 1,593 (70.2%) | 678 (29.8%) |
| Business & Financial | 421 (54.3%) | 354 (45.7%) |
| Computers, Engineering & Science | 795 (70.1%) | 339 (29.9%) |
| Computers & Mathematics | 195 (54.5%) | 163 (45.5%) |
| Architecture & Engineering | 535 (84.4%) | 99 (15.6%) |
| Life, Physical & Social Science | 65 (45.8%) | 77 (54.2%) |
| Community & Social Service | 432 (27.6%) | 1,131 (72.4%) |
| Education, Arts & Media | 132 (66.0%) | 68 (34.0%) |
| Legal Services & Support | 44 (45.8%) | 52 (54.2%) |
| Education Instruction & Library | 144 (13.2%) | 946 (86.8%) |
| Arts, Media & Entertainment | 112 (63.3%) | 65 (36.7%) |
| Health Diagnosing & Treating | 138 (16.7%) | 687 (83.3%) |
| Health Technologists | 115 (22.0%) | 409 (78.0%) |
| Total (Category) | 3,379 (51.4%) | 3,189 (48.5%) |
| Total (Overall) | 12,018 (53.8%) | 10,308 (46.2%) |
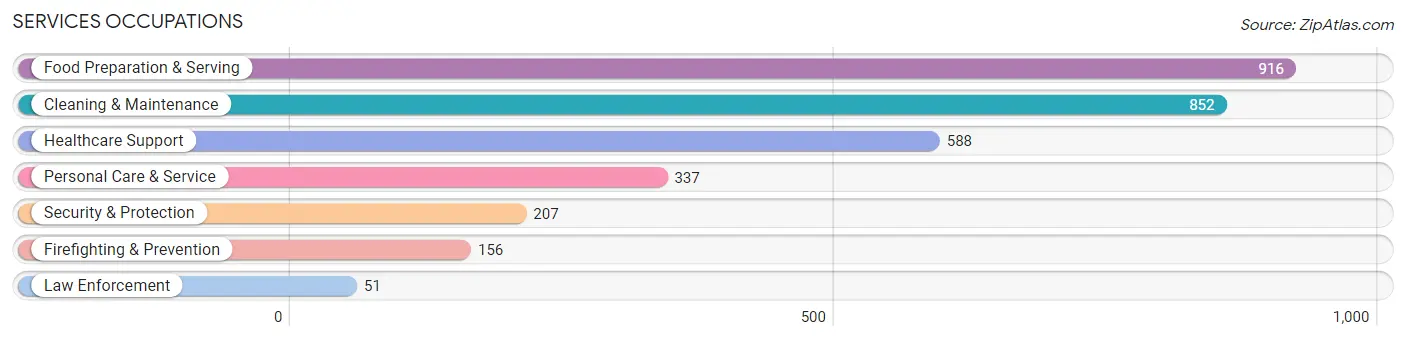
Services Occupations
The most common Services occupations in Jackson County are Food Preparation & Serving (916 | 4.1%), Cleaning & Maintenance (852 | 3.8%), Healthcare Support (588 | 2.6%), Personal Care & Service (337 | 1.5%), and Security & Protection (207 | 0.9%).
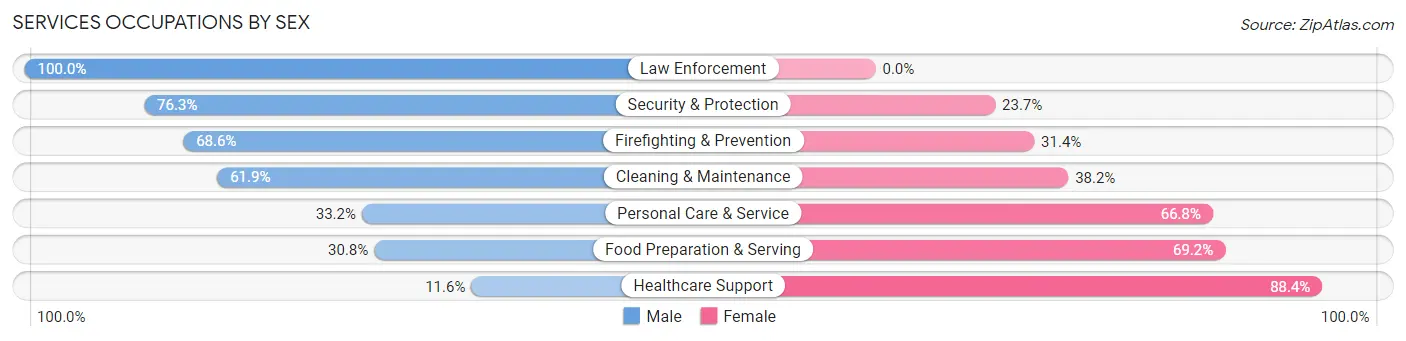
Services Occupations by Sex
Within the Services occupations in Jackson County, the most male-oriented occupations are Law Enforcement (100.0%), Security & Protection (76.3%), and Firefighting & Prevention (68.6%), while the most female-oriented occupations are Healthcare Support (88.4%), Food Preparation & Serving (69.2%), and Personal Care & Service (66.8%).
| Occupation | Male | Female |
| Healthcare Support | 68 (11.6%) | 520 (88.4%) |
| Security & Protection | 158 (76.3%) | 49 (23.7%) |
| Firefighting & Prevention | 107 (68.6%) | 49 (31.4%) |
| Law Enforcement | 51 (100.0%) | 0 (0.0%) |
| Food Preparation & Serving | 282 (30.8%) | 634 (69.2%) |
| Cleaning & Maintenance | 527 (61.9%) | 325 (38.2%) |
| Personal Care & Service | 112 (33.2%) | 225 (66.8%) |
| Total (Category) | 1,147 (39.6%) | 1,753 (60.5%) |
| Total (Overall) | 12,018 (53.8%) | 10,308 (46.2%) |
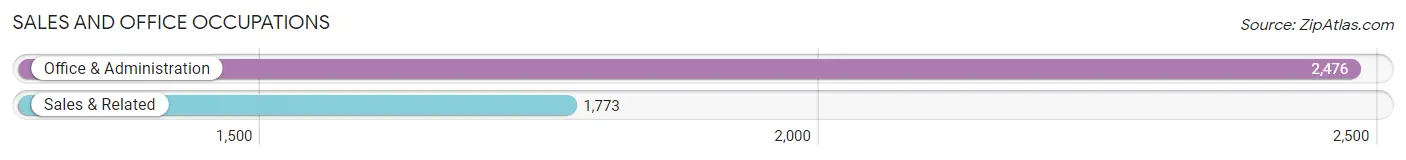
Sales and Office Occupations
The most common Sales and Office occupations in Jackson County are Office & Administration (2,476 | 11.1%), and Sales & Related (1,773 | 7.9%).
Sales and Office Occupations by Sex

| Occupation | Male | Female |
| Sales & Related | 573 (32.3%) | 1,200 (67.7%) |
| Office & Administration | 518 (20.9%) | 1,958 (79.1%) |
| Total (Category) | 1,091 (25.7%) | 3,158 (74.3%) |
| Total (Overall) | 12,018 (53.8%) | 10,308 (46.2%) |
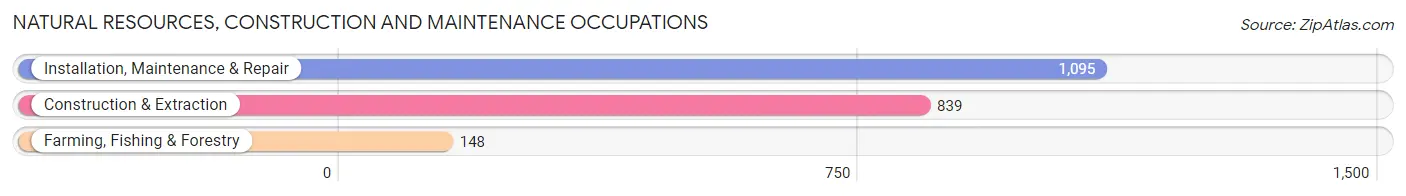
Natural Resources, Construction and Maintenance Occupations
The most common Natural Resources, Construction and Maintenance occupations in Jackson County are Installation, Maintenance & Repair (1,095 | 4.9%), Construction & Extraction (839 | 3.8%), and Farming, Fishing & Forestry (148 | 0.7%).
Natural Resources, Construction and Maintenance Occupations by Sex

| Occupation | Male | Female |
| Farming, Fishing & Forestry | 119 (80.4%) | 29 (19.6%) |
| Construction & Extraction | 832 (99.2%) | 7 (0.8%) |
| Installation, Maintenance & Repair | 1,055 (96.4%) | 40 (3.6%) |
| Total (Category) | 2,006 (96.4%) | 76 (3.6%) |
| Total (Overall) | 12,018 (53.8%) | 10,308 (46.2%) |
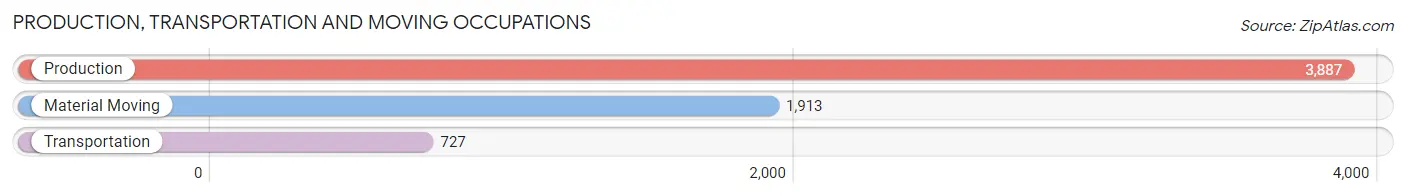
Production, Transportation and Moving Occupations
The most common Production, Transportation and Moving occupations in Jackson County are Production (3,887 | 17.4%), Material Moving (1,913 | 8.6%), and Transportation (727 | 3.3%).
Production, Transportation and Moving Occupations by Sex

| Occupation | Male | Female |
| Production | 2,381 (61.3%) | 1,506 (38.7%) |
| Transportation | 616 (84.7%) | 111 (15.3%) |
| Material Moving | 1,398 (73.1%) | 515 (26.9%) |
| Total (Category) | 4,395 (67.3%) | 2,132 (32.7%) |
| Total (Overall) | 12,018 (53.8%) | 10,308 (46.2%) |
Employment Industries by Sex in Jackson County
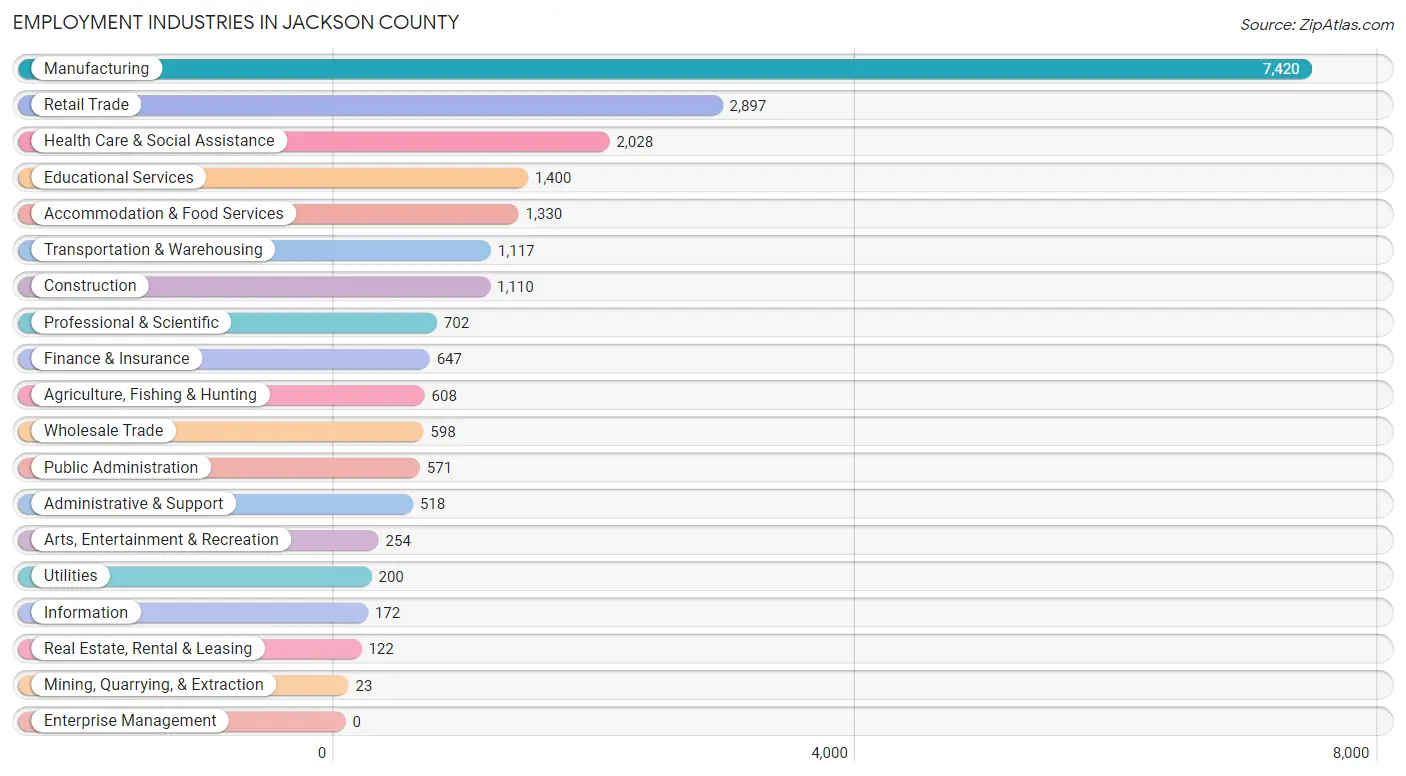
Employment Industries in Jackson County
The major employment industries in Jackson County include Manufacturing (7,420 | 33.2%), Retail Trade (2,897 | 13.0%), Health Care & Social Assistance (2,028 | 9.1%), Educational Services (1,400 | 6.3%), and Accommodation & Food Services (1,330 | 6.0%).
Employment Industries by Sex in Jackson County
The Jackson County industries that see more men than women are Construction (93.8%), Agriculture, Fishing & Hunting (90.8%), and Administrative & Support (74.1%), whereas the industries that tend to have a higher number of women are Health Care & Social Assistance (85.7%), Educational Services (80.5%), and Accommodation & Food Services (70.4%).

| Industry | Male | Female |
| Agriculture, Fishing & Hunting | 552 (90.8%) | 56 (9.2%) |
| Mining, Quarrying, & Extraction | 14 (60.9%) | 9 (39.1%) |
| Construction | 1,041 (93.8%) | 69 (6.2%) |
| Manufacturing | 4,972 (67.0%) | 2,448 (33.0%) |
| Wholesale Trade | 307 (51.3%) | 291 (48.7%) |
| Retail Trade | 1,500 (51.8%) | 1,397 (48.2%) |
| Transportation & Warehousing | 624 (55.9%) | 493 (44.1%) |
| Utilities | 122 (61.0%) | 78 (39.0%) |
| Information | 56 (32.6%) | 116 (67.4%) |
| Finance & Insurance | 279 (43.1%) | 368 (56.9%) |
| Real Estate, Rental & Leasing | 63 (51.6%) | 59 (48.4%) |
| Professional & Scientific | 394 (56.1%) | 308 (43.9%) |
| Enterprise Management | 0 (0.0%) | 0 (0.0%) |
| Administrative & Support | 384 (74.1%) | 134 (25.9%) |
| Educational Services | 273 (19.5%) | 1,127 (80.5%) |
| Health Care & Social Assistance | 291 (14.3%) | 1,737 (85.7%) |
| Arts, Entertainment & Recreation | 132 (52.0%) | 122 (48.0%) |
| Accommodation & Food Services | 394 (29.6%) | 936 (70.4%) |
| Public Administration | 277 (48.5%) | 294 (51.5%) |
| Total | 12,018 (53.8%) | 10,308 (46.2%) |
Education in Jackson County
School Enrollment in Jackson County
The most common levels of schooling among the 9,995 students in Jackson County are high school (2,741 | 27.4%), middle school (2,560 | 25.6%), and elementary school (2,352 | 23.5%).

| School Level | # Students | % Students |
| Nursery / Preschool | 624 | 6.2% |
| Kindergarten | 529 | 5.3% |
| Elementary School | 2,352 | 23.5% |
| Middle School | 2,560 | 25.6% |
| High School | 2,741 | 27.4% |
| College / Undergraduate | 948 | 9.5% |
| Graduate / Professional | 241 | 2.4% |
| Total | 9,995 | 100.0% |
School Enrollment by Age by Funding Source in Jackson County
Out of a total of 9,995 students who are enrolled in schools in Jackson County, 1,509 (15.1%) attend a private institution, while the remaining 8,486 (84.9%) are enrolled in public schools. The age group of 3 to 4 year olds has the highest likelihood of being enrolled in private schools, with 279 (66.3% in the age bracket) enrolled. Conversely, the age group of 18 to 19 year olds has the lowest likelihood of being enrolled in a private school, with 617 (96.7% in the age bracket) attending a public institution.

| Age Bracket | Public School | Private School |
| 3 to 4 Year Olds | 142 (33.7%) | 279 (66.3%) |
| 5 to 9 Year Old | 2,523 (86.2%) | 405 (13.8%) |
| 10 to 14 Year Olds | 2,491 (84.3%) | 463 (15.7%) |
| 15 to 17 Year Olds | 1,756 (92.8%) | 136 (7.2%) |
| 18 to 19 Year Olds | 617 (96.7%) | 21 (3.3%) |
| 20 to 24 Year Olds | 356 (82.6%) | 75 (17.4%) |
| 25 to 34 Year Olds | 414 (88.8%) | 52 (11.2%) |
| 35 Years and over | 183 (69.1%) | 82 (30.9%) |
| Total | 8,486 (84.9%) | 1,509 (15.1%) |
Educational Attainment by Field of Study in Jackson County
Business (1,586 | 26.0%), education (1,228 | 20.1%), engineering (747 | 12.2%), science & technology (741 | 12.1%), and bio, nature & agricultural (505 | 8.3%) are the most common fields of study among 6,097 individuals in Jackson County who have obtained a bachelor's degree or higher.

| Field of Study | # Graduates | % Graduates |
| Computers & Mathematics | 175 | 2.9% |
| Bio, Nature & Agricultural | 505 | 8.3% |
| Physical & Health Sciences | 144 | 2.4% |
| Psychology | 130 | 2.1% |
| Social Sciences | 148 | 2.4% |
| Engineering | 747 | 12.2% |
| Multidisciplinary Studies | 38 | 0.6% |
| Science & Technology | 741 | 12.1% |
| Business | 1,586 | 26.0% |
| Education | 1,228 | 20.1% |
| Literature & Languages | 72 | 1.2% |
| Liberal Arts & History | 186 | 3.0% |
| Visual & Performing Arts | 16 | 0.3% |
| Communications | 122 | 2.0% |
| Arts & Humanities | 259 | 4.3% |
| Total | 6,097 | 100.0% |
Transportation & Commute in Jackson County
Vehicle Availability by Sex in Jackson County
The most prevalent vehicle ownership categories in Jackson County are males with 2 vehicles (4,584, accounting for 38.6%) and females with 2 vehicles (3,913, making up 45.3%).

| Vehicles Available | Male | Female |
| No Vehicle | 289 (2.4%) | 173 (1.7%) |
| 1 Vehicle | 1,547 (13.0%) | 1,791 (17.7%) |
| 2 Vehicles | 4,584 (38.6%) | 3,913 (38.7%) |
| 3 Vehicles | 2,488 (20.9%) | 2,169 (21.4%) |
| 4 Vehicles | 2,155 (18.1%) | 1,196 (11.8%) |
| 5 or more Vehicles | 812 (6.8%) | 873 (8.6%) |
| Total | 11,875 (100.0%) | 10,115 (100.0%) |
Commute Time in Jackson County
The most frequently occuring commute durations in Jackson County are 10 to 14 minutes (3,815 commuters, 17.9%), 5 to 9 minutes (3,396 commuters, 16.0%), and 15 to 19 minutes (3,250 commuters, 15.3%).

| Commute Time | # Commuters | % Commuters |
| Less than 5 Minutes | 957 | 4.5% |
| 5 to 9 Minutes | 3,396 | 16.0% |
| 10 to 14 Minutes | 3,815 | 17.9% |
| 15 to 19 Minutes | 3,250 | 15.3% |
| 20 to 24 Minutes | 2,280 | 10.7% |
| 25 to 29 Minutes | 1,255 | 5.9% |
| 30 to 34 Minutes | 2,590 | 12.2% |
| 35 to 39 Minutes | 634 | 3.0% |
| 40 to 44 Minutes | 848 | 4.0% |
| 45 to 59 Minutes | 925 | 4.3% |
| 60 to 89 Minutes | 879 | 4.1% |
| 90 or more Minutes | 436 | 2.1% |
Commute Time by Sex in Jackson County
The most common commute times in Jackson County are 10 to 14 minutes (2,340 commuters, 20.4%) for males and 5 to 9 minutes (1,807 commuters, 18.5%) for females.

| Commute Time | Male | Female |
| Less than 5 Minutes | 437 (3.8%) | 520 (5.3%) |
| 5 to 9 Minutes | 1,589 (13.8%) | 1,807 (18.5%) |
| 10 to 14 Minutes | 2,340 (20.4%) | 1,475 (15.1%) |
| 15 to 19 Minutes | 1,695 (14.8%) | 1,555 (15.9%) |
| 20 to 24 Minutes | 1,315 (11.5%) | 965 (9.9%) |
| 25 to 29 Minutes | 479 (4.2%) | 776 (7.9%) |
| 30 to 34 Minutes | 1,598 (13.9%) | 992 (10.1%) |
| 35 to 39 Minutes | 256 (2.2%) | 378 (3.9%) |
| 40 to 44 Minutes | 378 (3.3%) | 470 (4.8%) |
| 45 to 59 Minutes | 531 (4.6%) | 394 (4.0%) |
| 60 to 89 Minutes | 655 (5.7%) | 224 (2.3%) |
| 90 or more Minutes | 212 (1.8%) | 224 (2.3%) |
Time of Departure to Work by Sex in Jackson County
The most frequent times of departure to work in Jackson County are 7:00 AM to 7:29 AM (1,647, 14.3%) for males and 7:30 AM to 7:59 AM (1,469, 15.0%) for females.

| Time of Departure | Male | Female |
| 12:00 AM to 4:59 AM | 1,275 (11.1%) | 557 (5.7%) |
| 5:00 AM to 5:29 AM | 459 (4.0%) | 175 (1.8%) |
| 5:30 AM to 5:59 AM | 983 (8.6%) | 699 (7.1%) |
| 6:00 AM to 6:29 AM | 1,109 (9.7%) | 914 (9.3%) |
| 6:30 AM to 6:59 AM | 1,086 (9.5%) | 808 (8.3%) |
| 7:00 AM to 7:29 AM | 1,647 (14.3%) | 1,237 (12.7%) |
| 7:30 AM to 7:59 AM | 982 (8.6%) | 1,469 (15.0%) |
| 8:00 AM to 8:29 AM | 600 (5.2%) | 897 (9.2%) |
| 8:30 AM to 8:59 AM | 356 (3.1%) | 301 (3.1%) |
| 9:00 AM to 9:59 AM | 361 (3.1%) | 459 (4.7%) |
| 10:00 AM to 10:59 AM | 129 (1.1%) | 70 (0.7%) |
| 11:00 AM to 11:59 AM | 138 (1.2%) | 146 (1.5%) |
| 12:00 PM to 3:59 PM | 953 (8.3%) | 859 (8.8%) |
| 4:00 PM to 11:59 PM | 1,407 (12.2%) | 1,189 (12.2%) |
| Total | 11,485 (100.0%) | 9,780 (100.0%) |
Housing Occupancy in Jackson County
Occupancy by Ownership in Jackson County
Of the total 17,574 dwellings in Jackson County, owner-occupied units account for 12,850 (73.1%), while renter-occupied units make up 4,724 (26.9%).

| Occupancy | # Housing Units | % Housing Units |
| Owner Occupied Housing Units | 12,850 | 73.1% |
| Renter-Occupied Housing Units | 4,724 | 26.9% |
| Total Occupied Housing Units | 17,574 | 100.0% |
Occupancy by Household Size in Jackson County

| Household Size | # Housing Units | % Housing Units |
| 1-Person Household | 4,490 | 25.6% |
| 2-Person Household | 5,961 | 33.9% |
| 3-Person Household | 3,037 | 17.3% |
| 4+ Person Household | 4,086 | 23.3% |
| Total Housing Units | 17,574 | 100.0% |
Occupancy by Ownership by Household Size in Jackson County

| Household Size | Owner-occupied | Renter-occupied |
| 1-Person Household | 2,578 (57.4%) | 1,912 (42.6%) |
| 2-Person Household | 4,797 (80.5%) | 1,164 (19.5%) |
| 3-Person Household | 2,266 (74.6%) | 771 (25.4%) |
| 4+ Person Household | 3,209 (78.5%) | 877 (21.5%) |
| Total Housing Units | 12,850 (73.1%) | 4,724 (26.9%) |
Occupancy by Educational Attainment in Jackson County

| Household Size | Owner-occupied | Renter-occupied |
| Less than High School | 850 (51.0%) | 816 (49.0%) |
| High School Diploma | 5,305 (74.1%) | 1,851 (25.9%) |
| College/Associate Degree | 3,991 (75.2%) | 1,314 (24.8%) |
| Bachelor's Degree or higher | 2,704 (78.4%) | 743 (21.5%) |
Occupancy by Age of Householder in Jackson County

| Age Bracket | # Households | % Households |
| Under 35 Years | 3,304 | 18.8% |
| 35 to 44 Years | 2,823 | 16.1% |
| 45 to 54 Years | 3,198 | 18.2% |
| 55 to 64 Years | 3,448 | 19.6% |
| 65 to 74 Years | 2,556 | 14.5% |
| 75 to 84 Years | 1,434 | 8.2% |
| 85 Years and Over | 811 | 4.6% |
| Total | 17,574 | 100.0% |
Housing Finances in Jackson County
Median Income by Occupancy in Jackson County

| Occupancy Type | # Households | Median Income |
| Owner-Occupied | 12,850 (73.1%) | $78,492 |
| Renter-Occupied | 4,724 (26.9%) | $41,486 |
| Average | 17,574 (100.0%) | $65,609 |
Occupancy by Householder Income Bracket in Jackson County

| Income Bracket | Owner-occupied | Renter-occupied |
| Less than $5,000 | 228 (1.8%) | 373 (7.9%) |
| $5,000 to $9,999 | 140 (1.1%) | 140 (3.0%) |
| $10,000 to $14,999 | 328 (2.5%) | 404 (8.6%) |
| $15,000 to $19,999 | 399 (3.1%) | 103 (2.2%) |
| $20,000 to $24,999 | 334 (2.6%) | 374 (7.9%) |
| $25,000 to $34,999 | 906 (7.0%) | 474 (10.0%) |
| $35,000 to $49,999 | 1,546 (12.0%) | 985 (20.8%) |
| $50,000 to $74,999 | 2,204 (17.2%) | 910 (19.3%) |
| $75,000 to $99,999 | 2,351 (18.3%) | 244 (5.2%) |
| $100,000 to $149,999 | 2,611 (20.3%) | 551 (11.7%) |
| $150,000 or more | 1,803 (14.0%) | 166 (3.5%) |
| Total | 12,850 (100.0%) | 4,724 (100.0%) |
Monthly Housing Cost Tiers in Jackson County

| Monthly Cost | Owner-occupied | Renter-occupied |
| Less than $300 | 1,033 (8.0%) | 301 (6.4%) |
| $300 to $499 | 2,126 (16.5%) | 277 (5.9%) |
| $500 to $799 | 2,503 (19.5%) | 1,002 (21.2%) |
| $800 to $999 | 1,603 (12.5%) | 1,250 (26.5%) |
| $1,000 to $1,499 | 3,469 (27.0%) | 1,256 (26.6%) |
| $1,500 to $1,999 | 1,295 (10.1%) | 153 (3.2%) |
| $2,000 to $2,499 | 423 (3.3%) | 78 (1.7%) |
| $2,500 to $2,999 | 268 (2.1%) | 0 (0.0%) |
| $3,000 or more | 130 (1.0%) | 142 (3.0%) |
| Total | 12,850 (100.0%) | 4,724 (100.0%) |
Physical Housing Characteristics in Jackson County
Housing Structures in Jackson County

| Structure Type | # Housing Units | % Housing Units |
| Single Unit, Detached | 12,770 | 72.7% |
| Single Unit, Attached | 246 | 1.4% |
| 2 Unit Apartments | 520 | 3.0% |
| 3 or 4 Unit Apartments | 496 | 2.8% |
| 5 to 9 Unit Apartments | 797 | 4.5% |
| 10 or more Apartments | 942 | 5.4% |
| Mobile Home / Other | 1,803 | 10.3% |
| Total | 17,574 | 100.0% |
Housing Structures by Occupancy in Jackson County

| Structure Type | Owner-occupied | Renter-occupied |
| Single Unit, Detached | 11,243 (88.0%) | 1,527 (12.0%) |
| Single Unit, Attached | 95 (38.6%) | 151 (61.4%) |
| 2 Unit Apartments | 74 (14.2%) | 446 (85.8%) |
| 3 or 4 Unit Apartments | 14 (2.8%) | 482 (97.2%) |
| 5 to 9 Unit Apartments | 27 (3.4%) | 770 (96.6%) |
| 10 or more Apartments | 10 (1.1%) | 932 (98.9%) |
| Mobile Home / Other | 1,387 (76.9%) | 416 (23.1%) |
| Total | 12,850 (73.1%) | 4,724 (26.9%) |
Housing Structures by Number of Rooms in Jackson County

| Number of Rooms | Owner-occupied | Renter-occupied |
| 1 Room | 37 (0.3%) | 266 (5.6%) |
| 2 or 3 Rooms | 209 (1.6%) | 827 (17.5%) |
| 4 or 5 Rooms | 3,358 (26.1%) | 2,648 (56.0%) |
| 6 or 7 Rooms | 5,156 (40.1%) | 833 (17.6%) |
| 8 or more Rooms | 4,090 (31.8%) | 150 (3.2%) |
| Total | 12,850 (100.0%) | 4,724 (100.0%) |
Housing Structure by Heating Type in Jackson County
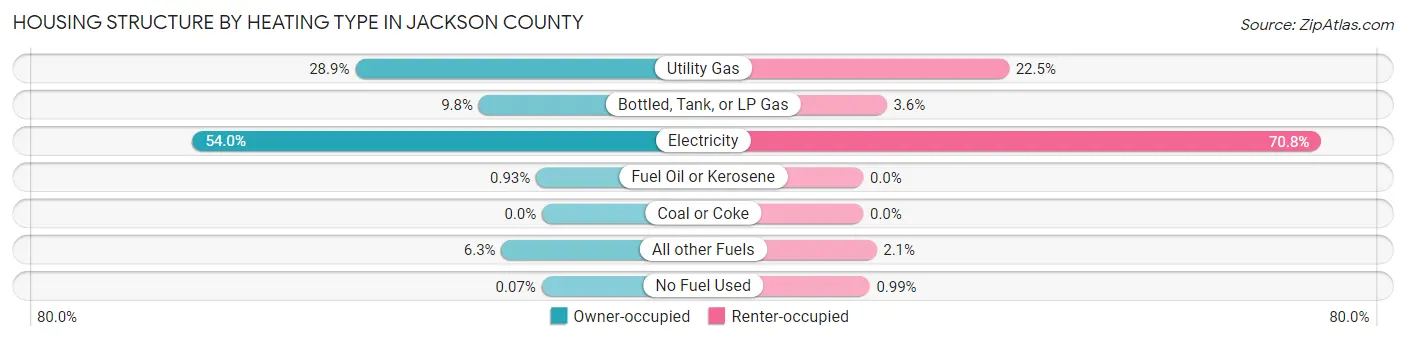
| Heating Type | Owner-occupied | Renter-occupied |
| Utility Gas | 3,713 (28.9%) | 1,064 (22.5%) |
| Bottled, Tank, or LP Gas | 1,257 (9.8%) | 171 (3.6%) |
| Electricity | 6,944 (54.0%) | 3,345 (70.8%) |
| Fuel Oil or Kerosene | 119 (0.9%) | 0 (0.0%) |
| Coal or Coke | 0 (0.0%) | 0 (0.0%) |
| All other Fuels | 808 (6.3%) | 97 (2.1%) |
| No Fuel Used | 9 (0.1%) | 47 (1.0%) |
| Total | 12,850 (100.0%) | 4,724 (100.0%) |
Household Vehicle Usage in Jackson County

| Vehicles per Household | Owner-occupied | Renter-occupied |
| No Vehicle | 352 (2.7%) | 667 (14.1%) |
| 1 Vehicle | 2,595 (20.2%) | 2,237 (47.3%) |
| 2 Vehicles | 5,047 (39.3%) | 1,457 (30.8%) |
| 3 or more Vehicles | 4,856 (37.8%) | 363 (7.7%) |
| Total | 12,850 (100.0%) | 4,724 (100.0%) |
Real Estate & Mortgages in Jackson County
Real Estate and Mortgage Overview in Jackson County
| Characteristic | Without Mortgage | With Mortgage |
| Housing Units | 4,802 | 8,048 |
| Median Property Value | $142,000 | $171,700 |
| Median Household Income | $58,933 | $1,403 |
| Monthly Housing Costs | $435 | $130 |
| Real Estate Taxes | $692 | $115 |
Property Value by Mortgage Status in Jackson County

| Property Value | Without Mortgage | With Mortgage |
| Less than $50,000 | 935 (19.5%) | 326 (4.1%) |
| $50,000 to $99,999 | 838 (17.4%) | 1,030 (12.8%) |
| $100,000 to $299,999 | 2,400 (50.0%) | 5,522 (68.6%) |
| $300,000 to $499,999 | 545 (11.4%) | 1,032 (12.8%) |
| $500,000 to $749,999 | 61 (1.3%) | 123 (1.5%) |
| $750,000 to $999,999 | 3 (0.1%) | 4 (0.1%) |
| $1,000,000 or more | 20 (0.4%) | 11 (0.1%) |
| Total | 4,802 (100.0%) | 8,048 (100.0%) |
Household Income by Mortgage Status in Jackson County

| Household Income | Without Mortgage | With Mortgage |
| Less than $10,000 | 265 (5.5%) | 164 (2.0%) |
| $10,000 to $24,999 | 689 (14.3%) | 103 (1.3%) |
| $25,000 to $34,999 | 543 (11.3%) | 372 (4.6%) |
| $35,000 to $49,999 | 713 (14.8%) | 363 (4.5%) |
| $50,000 to $74,999 | 869 (18.1%) | 833 (10.3%) |
| $75,000 to $99,999 | 770 (16.0%) | 1,335 (16.6%) |
| $100,000 to $149,999 | 553 (11.5%) | 1,581 (19.6%) |
| $150,000 or more | 400 (8.3%) | 2,058 (25.6%) |
| Total | 4,802 (100.0%) | 8,048 (100.0%) |
Property Value to Household Income Ratio in Jackson County

| Value-to-Income Ratio | Without Mortgage | With Mortgage |
| Less than 2.0x | 2,268 (47.2%) | 92,209 (1,145.7%) |
| 2.0x to 2.9x | 634 (13.2%) | 4,391 (54.6%) |
| 3.0x to 3.9x | 491 (10.2%) | 1,647 (20.5%) |
| 4.0x or more | 1,359 (28.3%) | 831 (10.3%) |
| Total | 4,802 (100.0%) | 8,048 (100.0%) |
Real Estate Taxes by Mortgage Status in Jackson County
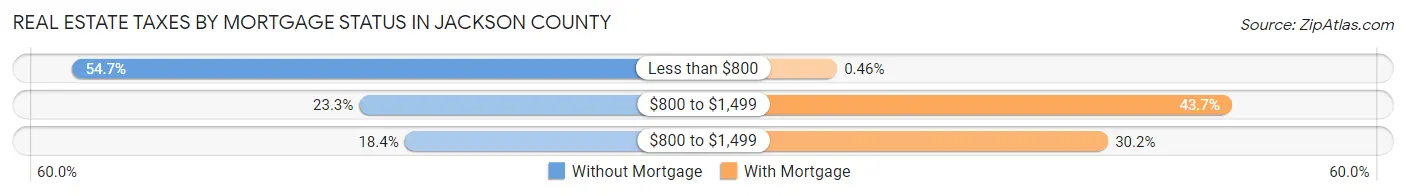
| Property Taxes | Without Mortgage | With Mortgage |
| Less than $800 | 2,628 (54.7%) | 37 (0.5%) |
| $800 to $1,499 | 1,121 (23.3%) | 3,516 (43.7%) |
| $800 to $1,499 | 882 (18.4%) | 2,427 (30.2%) |
| Total | 4,802 (100.0%) | 8,048 (100.0%) |
Health & Disability in Jackson County
Health Insurance Coverage by Age in Jackson County
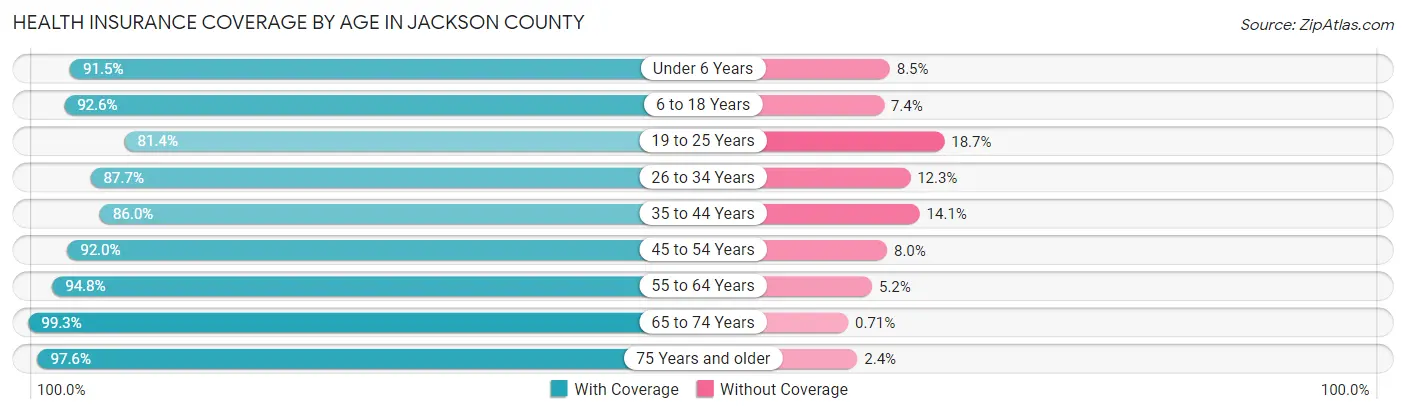
| Age Bracket | With Coverage | Without Coverage |
| Under 6 Years | 3,412 (91.5%) | 316 (8.5%) |
| 6 to 18 Years | 7,389 (92.6%) | 590 (7.4%) |
| 19 to 25 Years | 2,871 (81.4%) | 658 (18.6%) |
| 26 to 34 Years | 4,816 (87.7%) | 675 (12.3%) |
| 35 to 44 Years | 4,856 (86.0%) | 794 (14.1%) |
| 45 to 54 Years | 5,285 (92.0%) | 458 (8.0%) |
| 55 to 64 Years | 5,817 (94.8%) | 317 (5.2%) |
| 65 to 74 Years | 4,183 (99.3%) | 30 (0.7%) |
| 75 Years and older | 2,974 (97.6%) | 74 (2.4%) |
| Total | 41,603 (91.4%) | 3,912 (8.6%) |
Health Insurance Coverage by Citizenship Status in Jackson County

| Citizenship Status | With Coverage | Without Coverage |
| Native Born | 3,412 (91.5%) | 316 (8.5%) |
| Foreign Born, Citizen | 7,389 (92.6%) | 590 (7.4%) |
| Foreign Born, not a Citizen | 2,871 (81.4%) | 658 (18.6%) |
Health Insurance Coverage by Household Income in Jackson County

| Household Income | With Coverage | Without Coverage |
| Under $25,000 | 3,786 (83.6%) | 741 (16.4%) |
| $25,000 to $49,999 | 8,297 (87.1%) | 1,226 (12.9%) |
| $50,000 to $74,999 | 6,925 (89.7%) | 795 (10.3%) |
| $75,000 to $99,999 | 7,012 (96.1%) | 287 (3.9%) |
| $100,000 and over | 15,520 (94.8%) | 860 (5.2%) |
Public vs Private Health Insurance Coverage by Age in Jackson County
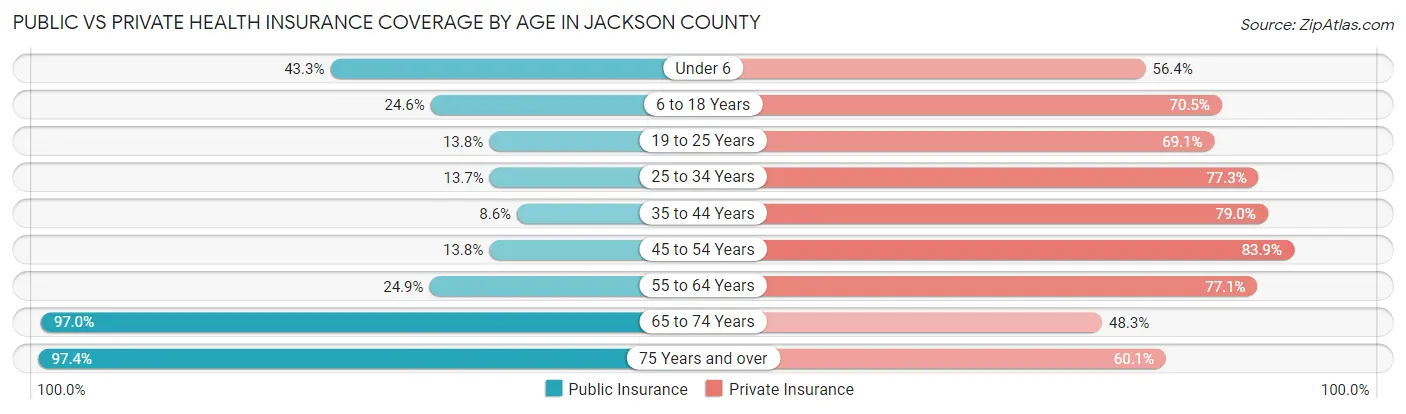
| Age Bracket | Public Insurance | Private Insurance |
| Under 6 | 1,613 (43.3%) | 2,102 (56.4%) |
| 6 to 18 Years | 1,966 (24.6%) | 5,624 (70.5%) |
| 19 to 25 Years | 487 (13.8%) | 2,440 (69.1%) |
| 25 to 34 Years | 752 (13.7%) | 4,247 (77.3%) |
| 35 to 44 Years | 487 (8.6%) | 4,465 (79.0%) |
| 45 to 54 Years | 792 (13.8%) | 4,817 (83.9%) |
| 55 to 64 Years | 1,527 (24.9%) | 4,732 (77.1%) |
| 65 to 74 Years | 4,086 (97.0%) | 2,035 (48.3%) |
| 75 Years and over | 2,968 (97.4%) | 1,833 (60.1%) |
| Total | 14,678 (32.3%) | 32,295 (71.0%) |
Disability Status by Sex by Age in Jackson County

| Age Bracket | Male | Female |
| Under 5 Years | 87 (5.1%) | 0 (0.0%) |
| 5 to 17 Years | 175 (4.2%) | 125 (3.3%) |
| 18 to 34 Years | 241 (5.0%) | 391 (8.1%) |
| 35 to 64 Years | 1,166 (13.3%) | 1,699 (19.4%) |
| 65 to 74 Years | 476 (23.2%) | 591 (27.3%) |
| 75 Years and over | 681 (52.1%) | 1,112 (63.8%) |
Disability Class by Sex by Age in Jackson County
Disability Class: Hearing Difficulty

| Age Bracket | Male | Female |
| Under 5 Years | 87 (5.1%) | 0 (0.0%) |
| 5 to 17 Years | 0 (0.0%) | 8 (0.2%) |
| 18 to 34 Years | 8 (0.2%) | 0 (0.0%) |
| 35 to 64 Years | 376 (4.3%) | 73 (0.8%) |
| 65 to 74 Years | 160 (7.8%) | 77 (3.6%) |
| 75 Years and over | 411 (31.5%) | 440 (25.3%) |
Disability Class: Vision Difficulty

| Age Bracket | Male | Female |
| Under 5 Years | 0 (0.0%) | 0 (0.0%) |
| 5 to 17 Years | 0 (0.0%) | 14 (0.4%) |
| 18 to 34 Years | 29 (0.6%) | 85 (1.8%) |
| 35 to 64 Years | 333 (3.8%) | 443 (5.1%) |
| 65 to 74 Years | 130 (6.3%) | 108 (5.0%) |
| 75 Years and over | 244 (18.7%) | 353 (20.3%) |
Disability Class: Cognitive Difficulty

| Age Bracket | Male | Female |
| 5 to 17 Years | 175 (4.2%) | 90 (2.4%) |
| 18 to 34 Years | 174 (3.6%) | 238 (5.0%) |
| 35 to 64 Years | 167 (1.9%) | 604 (6.9%) |
| 65 to 74 Years | 18 (0.9%) | 94 (4.3%) |
| 75 Years and over | 184 (14.1%) | 257 (14.7%) |
Disability Class: Ambulatory Difficulty
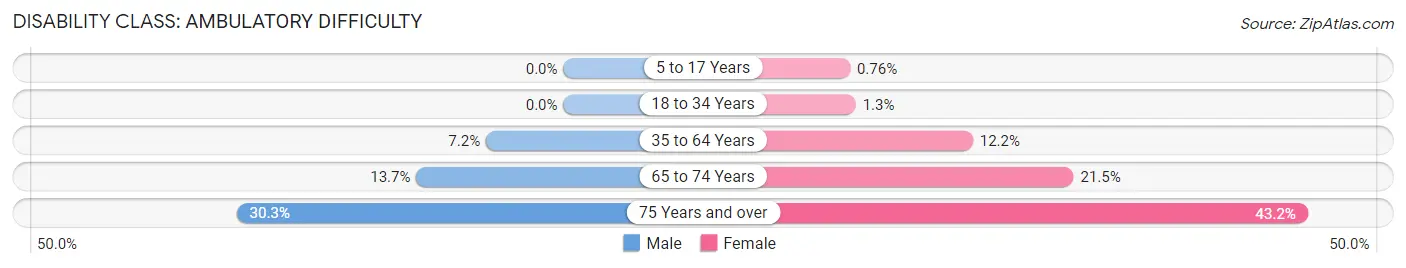
| Age Bracket | Male | Female |
| 5 to 17 Years | 0 (0.0%) | 29 (0.8%) |
| 18 to 34 Years | 0 (0.0%) | 62 (1.3%) |
| 35 to 64 Years | 630 (7.2%) | 1,064 (12.2%) |
| 65 to 74 Years | 280 (13.7%) | 465 (21.5%) |
| 75 Years and over | 396 (30.3%) | 753 (43.2%) |
Disability Class: Self-Care Difficulty

| Age Bracket | Male | Female |
| 5 to 17 Years | 35 (0.8%) | 37 (1.0%) |
| 18 to 34 Years | 22 (0.4%) | 85 (1.8%) |
| 35 to 64 Years | 258 (2.9%) | 530 (6.1%) |
| 65 to 74 Years | 88 (4.3%) | 71 (3.3%) |
| 75 Years and over | 193 (14.8%) | 492 (28.2%) |
Technology Access in Jackson County
Computing Device Access in Jackson County

| Device Type | # Households | % Households |
| Desktop or Laptop | 12,416 | 70.7% |
| Smartphone | 14,134 | 80.4% |
| Tablet | 10,194 | 58.0% |
| No Computing Device | 2,148 | 12.2% |
| Total | 17,574 | 100.0% |
Internet Access in Jackson County
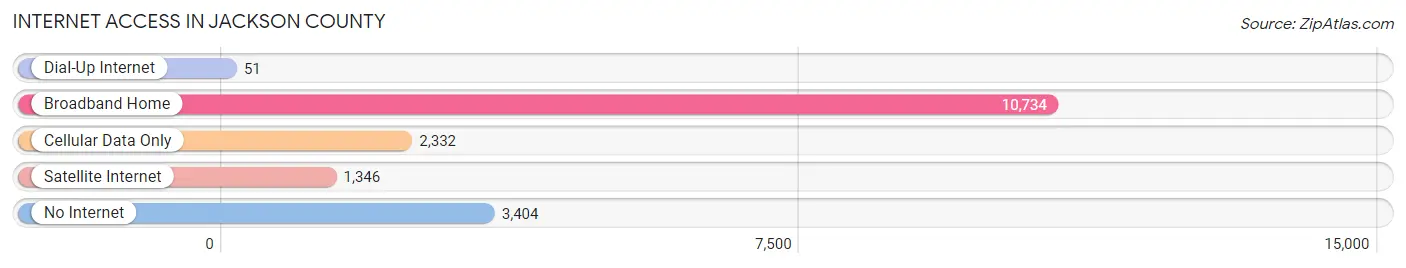
| Internet Type | # Households | % Households |
| Dial-Up Internet | 51 | 0.3% |
| Broadband Home | 10,734 | 61.1% |
| Cellular Data Only | 2,332 | 13.3% |
| Satellite Internet | 1,346 | 7.7% |
| No Internet | 3,404 | 19.4% |
| Total | 17,574 | 100.0% |
Jackson County Summary
Jackson County is located in the south-central region of Indiana, and is part of the Indianapolis metropolitan area. The county was established in 1816 and is named after Andrew Jackson, the seventh president of the United States. Jackson County is bordered by Bartholomew, Jennings, Lawrence, Monroe, and Washington counties. The county seat is Brownstown, and the largest city is Seymour.
Geography
Jackson County covers an area of 437 square miles and is located in the rolling hills of the southern part of the state. The county is drained by the East Fork of the White River and its tributaries. The highest point in the county is located in the northwest corner, at an elevation of 890 feet. The county is mostly covered in forest and farmland, with some urban areas in the cities of Seymour and Brownstown.
Climate
Jackson County has a humid continental climate, with hot summers and cold winters. The average annual temperature is around 50°F, and the average annual precipitation is around 40 inches.
Demographics
As of the 2010 census, Jackson County had a population of 42,376. The racial makeup of the county was 94.2% White, 2.7% African American, 0.4% Native American, 0.7% Asian, 0.2% Pacific Islander, 0.7% from other races, and 1.2% from two or more races. Hispanic or Latino of any race were 2.2% of the population.
Economy
Jackson County is home to a variety of industries, including manufacturing, agriculture, and tourism. The county is home to several large employers, including Cummins, Inc., a diesel engine manufacturer, and Jackson County Hospital. Agriculture is also an important part of the economy, with corn, soybeans, and wheat being the main crops. Tourism is also an important part of the economy, with many visitors coming to the county to enjoy its natural beauty and outdoor activities.
History
Jackson County was established in 1816 and was named after Andrew Jackson, the seventh president of the United States. The county was originally part of the Northwest Territory, and was later part of the Indiana Territory. The county was home to several Native American tribes, including the Miami, Potawatomi, and Shawnee.
In the early 19th century, the county was settled by European immigrants, mostly from Germany and Ireland. The county was an important part of the Underground Railroad, with many escaped slaves passing through the county on their way to freedom.
During the Civil War, Jackson County was home to several Union regiments, and several battles were fought in the county. After the war, the county experienced a period of growth and prosperity, with the development of railroads and the establishment of several industries.
Today, Jackson County is a thriving community, with a strong economy and a diverse population. The county is home to several parks and recreational areas, and is a popular destination for outdoor enthusiasts.
Common Questions
What is the Total Population of Jackson County?
Total Population of Jackson County is 46,212.
What is the Total Male Population of Jackson County?
Total Male Population of Jackson County is 23,240.
What is the Total Female Population of Jackson County?
Total Female Population of Jackson County is 22,972.
What is the Ratio of Males per 100 Females in Jackson County?
There are 101.17 Males per 100 Females in Jackson County.
What is the Ratio of Females per 100 Males in Jackson County?
There are 98.85 Females per 100 Males in Jackson County.
What is the Median Population Age in Jackson County?
Median Population Age in Jackson County is 39.5 Years.
What is the Average Family Size in Jackson County
Average Family Size in Jackson County is 3.1 People.
What is the Average Household Size in Jackson County
Average Household Size in Jackson County is 2.6 People.
What is Per Capita Income in Jackson County?
Per Capita income in Jackson County is $31,743.
What is the Median Family Income in Jackson County?
Median Family Income in Jackson County is $79,256.
What is the Median Household income in Jackson County?
Median Household Income in Jackson County is $65,609.
What is Income or Wage Gap in Jackson County?
Income or Wage Gap in Jackson County is 29.0%.
Women in Jackson County earn 71.0 cents for every dollar earned by a man.
What is Family Income Deficit in Jackson County?
Family Income Deficit in Jackson County is $8,482.
Families that are below poverty line in Jackson County earn $8,482 less on average than the poverty threshold level.
What is Inequality or Gini Index in Jackson County?
Inequality or Gini Index in Jackson County is 0.42.
How Large is the Labor Force in Jackson County?
There are 22,939 People in the Labor Forcein in Jackson County.
What is the Percentage of People in the Labor Force in Jackson County?
63.1% of People are in the Labor Force in Jackson County.
What is the Unemployment Rate in Jackson County?
Unemployment Rate in Jackson County is 2.7%.