Huntington County, IN
Huntington County Map

Huntington County Overview
36,699
TOTAL POPULATION
18,383
MALE POPULATION
18,316
FEMALE POPULATION
100.37
MALES / 100 FEMALES
99.64
FEMALES / 100 MALES
41.4
MEDIAN AGE
2.8
AVG FAMILY SIZE
2.3
AVG HOUSEHOLD SIZE
$32,046
PER CAPITA INCOME
$76,527
AVG FAMILY INCOME
$59,894
AVG HOUSEHOLD INCOME
37.1%
WAGE / INCOME GAP [ % ]
62.9¢/ $1
WAGE / INCOME GAP [ $ ]
$8,145
FAMILY INCOME DEFICIT
0.41
INEQUALITY / GINI INDEX
18,790
LABOR FORCE [ PEOPLE ]
63.1%
PERCENT IN LABOR FORCE
3.4%
UNEMPLOYMENT RATE
Huntington County Area Codes
Race in Huntington County
The most populous races in Huntington County are White / Caucasian (34,790 | 94.8%), Hispanic or Latino (1,012 | 2.8%), and Two or more Races (780 | 2.1%).

| Race | # Population | % Population |
| Asian | 258 | 0.7% |
| Black / African American | 344 | 0.9% |
| Hawaiian / Pacific | 58 | 0.2% |
| Hispanic or Latino | 1,012 | 2.8% |
| Native / Alaskan | 74 | 0.2% |
| White / Caucasian | 34,790 | 94.8% |
| Two or more Races | 780 | 2.1% |
| Some other Race | 395 | 1.1% |
| Total | 36,699 | 100.0% |
Ancestry in Huntington County
The most populous ancestries reported in Huntington County are German (9,898 | 27.0%), Irish (4,201 | 11.5%), English (3,659 | 10.0%), American (2,964 | 8.1%), and Mexican (769 | 2.1%), together accounting for 58.6% of all Huntington County residents.

| Ancestry | # Population | % Population |
| African | 48 | 0.1% |
| American | 2,964 | 8.1% |
| Apache | 12 | 0.0% |
| Arab | 68 | 0.2% |
| Argentinean | 4 | 0.0% |
| Armenian | 11 | 0.0% |
| Australian | 2 | 0.0% |
| Austrian | 46 | 0.1% |
| Bahamian | 37 | 0.1% |
| Belgian | 35 | 0.1% |
| Bhutanese | 31 | 0.1% |
| Blackfeet | 14 | 0.0% |
| British | 168 | 0.5% |
| Bulgarian | 24 | 0.1% |
| Burmese | 37 | 0.1% |
| Canadian | 44 | 0.1% |
| Central American | 13 | 0.0% |
| Cherokee | 156 | 0.4% |
| Colombian | 4 | 0.0% |
| Cree | 1 | 0.0% |
| Cuban | 5 | 0.0% |
| Czech | 52 | 0.1% |
| Czechoslovakian | 4 | 0.0% |
| Danish | 3 | 0.0% |
| Dominican | 19 | 0.1% |
| Dutch | 554 | 1.5% |
| Eastern European | 104 | 0.3% |
| Ecuadorian | 82 | 0.2% |
| Egyptian | 50 | 0.1% |
| English | 3,659 | 10.0% |
| European | 587 | 1.6% |
| Finnish | 10 | 0.0% |
| French | 583 | 1.6% |
| French Canadian | 40 | 0.1% |
| German | 9,898 | 27.0% |
| Greek | 16 | 0.0% |
| Guamanian / Chamorro | 34 | 0.1% |
| Honduran | 5 | 0.0% |
| Hungarian | 81 | 0.2% |
| Indian (Asian) | 193 | 0.5% |
| Irish | 4,201 | 11.5% |
| Iroquois | 1 | 0.0% |
| Italian | 544 | 1.5% |
| Korean | 27 | 0.1% |
| Luxembourger | 6 | 0.0% |
| Macedonian | 5 | 0.0% |
| Malaysian | 7 | 0.0% |
| Mexican | 769 | 2.1% |
| Moroccan | 7 | 0.0% |
| Native Hawaiian | 24 | 0.1% |
| Navajo | 13 | 0.0% |
| Northern European | 14 | 0.0% |
| Norwegian | 151 | 0.4% |
| Osage | 5 | 0.0% |
| Pennsylvania German | 32 | 0.1% |
| Polish | 438 | 1.2% |
| Puerto Rican | 93 | 0.3% |
| Romanian | 36 | 0.1% |
| Russian | 55 | 0.2% |
| Salvadoran | 8 | 0.0% |
| Scandinavian | 70 | 0.2% |
| Scotch-Irish | 271 | 0.7% |
| Scottish | 654 | 1.8% |
| Serbian | 9 | 0.0% |
| Sioux | 9 | 0.0% |
| South American | 90 | 0.3% |
| Spanish | 1 | 0.0% |
| Sri Lankan | 12 | 0.0% |
| Subsaharan African | 48 | 0.1% |
| Swedish | 102 | 0.3% |
| Swiss | 249 | 0.7% |
| Thai | 19 | 0.1% |
| Ukrainian | 108 | 0.3% |
| Welsh | 161 | 0.4% |
| Yugoslavian | 11 | 0.0% | View All 75 Rows |
Immigrants in Huntington County
The most numerous immigrant groups reported in Huntington County came from Latin America (254 | 0.7%), Asia (229 | 0.6%), Eastern Asia (195 | 0.5%), Central America (182 | 0.5%), and China (182 | 0.5%), together accounting for 2.8% of all Huntington County residents.

| Immigration Origin | # Population | % Population |
| Africa | 48 | 0.1% |
| Argentina | 4 | 0.0% |
| Asia | 229 | 0.6% |
| Australia | 2 | 0.0% |
| Bahamas | 37 | 0.1% |
| Brazil | 12 | 0.0% |
| Canada | 5 | 0.0% |
| Caribbean | 37 | 0.1% |
| Central America | 182 | 0.5% |
| China | 182 | 0.5% |
| Eastern Asia | 195 | 0.5% |
| Ecuador | 19 | 0.1% |
| England | 28 | 0.1% |
| Europe | 53 | 0.1% |
| Germany | 9 | 0.0% |
| Guatemala | 21 | 0.1% |
| India | 16 | 0.0% |
| Italy | 16 | 0.0% |
| Japan | 2 | 0.0% |
| Korea | 11 | 0.0% |
| Latin America | 254 | 0.7% |
| Mexico | 161 | 0.4% |
| Northern Europe | 28 | 0.1% |
| Oceania | 2 | 0.0% |
| Philippines | 11 | 0.0% |
| South Africa | 48 | 0.1% |
| South America | 35 | 0.1% |
| South Central Asia | 16 | 0.0% |
| South Eastern Asia | 18 | 0.1% |
| Southern Europe | 16 | 0.0% |
| Vietnam | 7 | 0.0% |
| Western Europe | 9 | 0.0% | View All 32 Rows |
Sex and Age in Huntington County
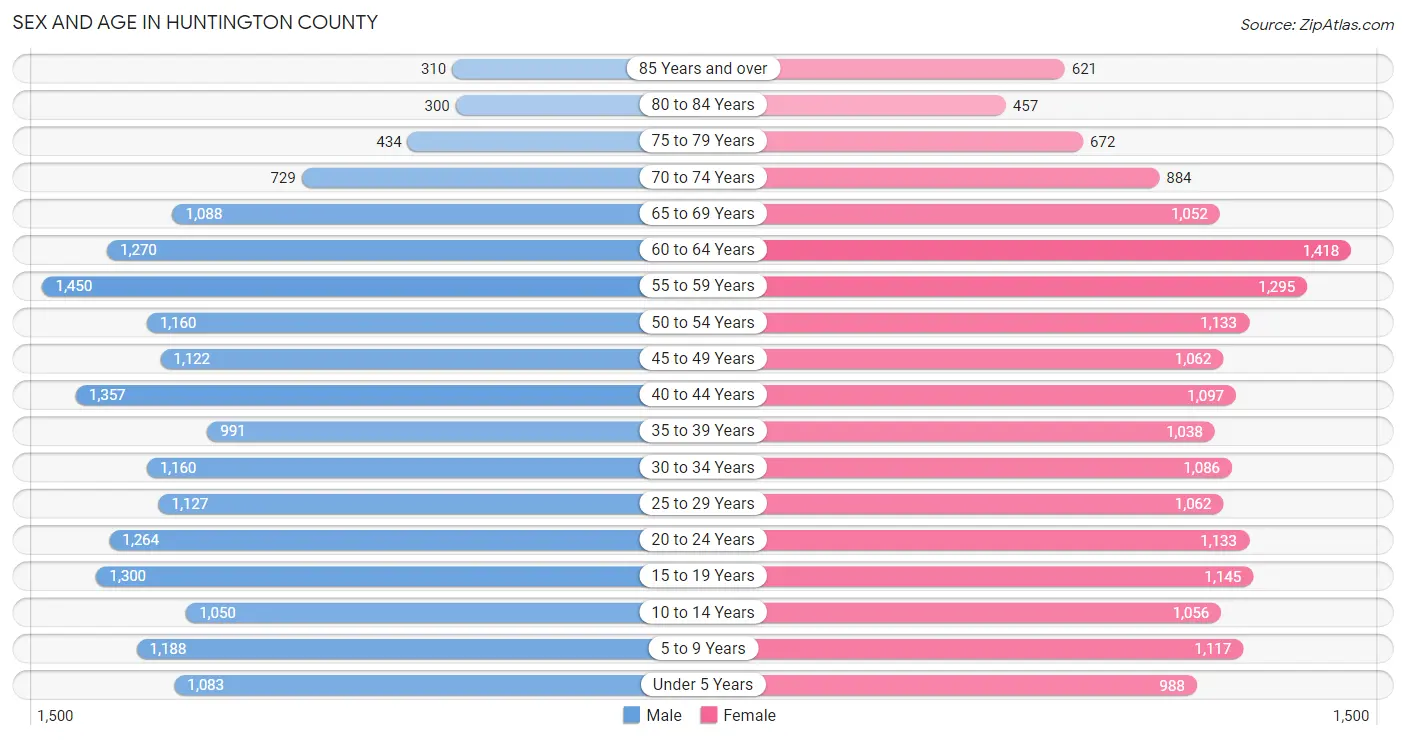
Sex and Age in Huntington County
The most populous age groups in Huntington County are 55 to 59 Years (1,450 | 7.9%) for men and 60 to 64 Years (1,418 | 7.7%) for women.
| Age Bracket | Male | Female |
| Under 5 Years | 1,083 (5.9%) | 988 (5.4%) |
| 5 to 9 Years | 1,188 (6.5%) | 1,117 (6.1%) |
| 10 to 14 Years | 1,050 (5.7%) | 1,056 (5.8%) |
| 15 to 19 Years | 1,300 (7.1%) | 1,145 (6.2%) |
| 20 to 24 Years | 1,264 (6.9%) | 1,133 (6.2%) |
| 25 to 29 Years | 1,127 (6.1%) | 1,062 (5.8%) |
| 30 to 34 Years | 1,160 (6.3%) | 1,086 (5.9%) |
| 35 to 39 Years | 991 (5.4%) | 1,038 (5.7%) |
| 40 to 44 Years | 1,357 (7.4%) | 1,097 (6.0%) |
| 45 to 49 Years | 1,122 (6.1%) | 1,062 (5.8%) |
| 50 to 54 Years | 1,160 (6.3%) | 1,133 (6.2%) |
| 55 to 59 Years | 1,450 (7.9%) | 1,295 (7.1%) |
| 60 to 64 Years | 1,270 (6.9%) | 1,418 (7.7%) |
| 65 to 69 Years | 1,088 (5.9%) | 1,052 (5.7%) |
| 70 to 74 Years | 729 (4.0%) | 884 (4.8%) |
| 75 to 79 Years | 434 (2.4%) | 672 (3.7%) |
| 80 to 84 Years | 300 (1.6%) | 457 (2.5%) |
| 85 Years and over | 310 (1.7%) | 621 (3.4%) |
| Total | 18,383 (100.0%) | 18,316 (100.0%) |
Families and Households in Huntington County
Median Family Size in Huntington County
The median family size in Huntington County is 2.84 persons per family, with single male/father families (716 | 7.3%) accounting for the largest median family size of 2.99 persons per family. On the other hand, single female/mother families (1,514 | 15.4%) represent the smallest median family size with 2.72 persons per family.

| Family Type | # Families | Family Size |
| Married-Couple | 7,597 (77.3%) | 2.85 |
| Single Male/Father | 716 (7.3%) | 2.99 |
| Single Female/Mother | 1,514 (15.4%) | 2.72 |
| Total Families | 9,827 (100.0%) | 2.84 |
Median Household Size in Huntington County
The median household size in Huntington County is 2.33 persons per household, with single male/father households (716 | 4.7%) accounting for the largest median household size of 3.34 persons per household. non-family households (5,338 | 35.2%) represent the smallest median household size with 1.22 persons per household.

| Household Type | # Households | Household Size |
| Married-Couple | 7,597 (50.1%) | 2.87 |
| Single Male/Father | 716 (4.7%) | 3.34 |
| Single Female/Mother | 1,514 (10.0%) | 3.08 |
| Non-family | 5,338 (35.2%) | 1.22 |
| Total Households | 15,165 (100.0%) | 2.33 |
Household Size by Marriage Status in Huntington County
Out of a total of 15,165 households in Huntington County, 9,827 (64.8%) are family households, while 5,338 (35.2%) are nonfamily households. The most numerous type of family households are 2-person households, comprising 4,962, and the most common type of nonfamily households are 1-person households, comprising 4,447.

| Household Size | Family Households | Nonfamily Households |
| 1-Person Households | - | 4,447 (29.3%) |
| 2-Person Households | 4,962 (32.7%) | 687 (4.5%) |
| 3-Person Households | 1,974 (13.0%) | 124 (0.8%) |
| 4-Person Households | 1,478 (9.8%) | 56 (0.4%) |
| 5-Person Households | 884 (5.8%) | 24 (0.2%) |
| 6-Person Households | 328 (2.2%) | 0 (0.0%) |
| 7+ Person Households | 201 (1.3%) | 0 (0.0%) |
| Total | 9,827 (64.8%) | 5,338 (35.2%) |
Female Fertility in Huntington County
Fertility by Age in Huntington County
Average fertility rate in Huntington County is 51.0 births per 1,000 women. Women in the age bracket of 20 to 34 years have the highest fertility rate with 85.0 births per 1,000 women. Women in the age bracket of 20 to 34 years acount for 69.8% of all women with births.

| Age Bracket | Women with Births | Births / 1,000 Women |
| 15 to 19 years | 8 (2.0%) | 7.0 |
| 20 to 34 years | 280 (69.8%) | 85.0 |
| 35 to 50 years | 113 (28.2%) | 34.0 |
| Total | 401 (100.0%) | 51.0 |
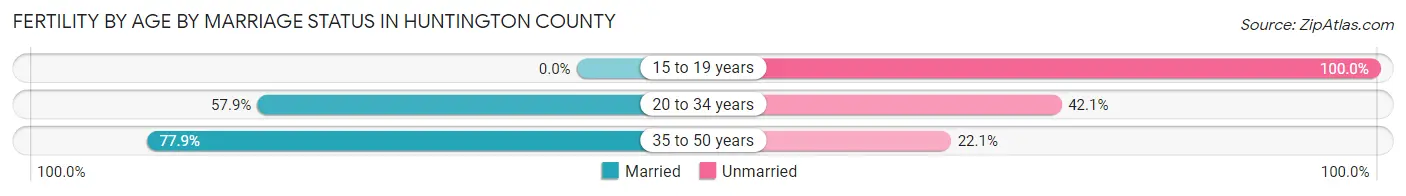
Fertility by Age by Marriage Status in Huntington County
62.3% of women with births (401) in Huntington County are married. The highest percentage of unmarried women with births falls into 15 to 19 years age bracket with 100.0% of them unmarried at the time of birth, while the lowest percentage of unmarried women with births belong to 35 to 50 years age bracket with 22.1% of them unmarried.
| Age Bracket | Married | Unmarried |
| 15 to 19 years | 0 (0.0%) | 8 (100.0%) |
| 20 to 34 years | 162 (57.9%) | 118 (42.1%) |
| 35 to 50 years | 88 (77.9%) | 25 (22.1%) |
| Total | 250 (62.3%) | 151 (37.7%) |
Fertility by Education in Huntington County
Average fertility rate in Huntington County is 51.0 births per 1,000 women. Women with the education attainment of college or associate's degree have the highest fertility rate of 75.0 births per 1,000 women, while women with the education attainment of bachelor's degree have the lowest fertility at 26.0 births per 1,000 women. Women with the education attainment of college or associate's degree represent 46.1% of all women with births.

| Educational Attainment | Women with Births | Births / 1,000 Women |
| Less than High School | 59 (14.7%) | 51.0 |
| High School Diploma | 110 (27.4%) | 46.0 |
| College or Associate's Degree | 185 (46.1%) | 75.0 |
| Bachelor's Degree | 34 (8.5%) | 26.0 |
| Graduate Degree | 13 (3.2%) | 29.0 |
| Total | 401 (100.0%) | 51.0 |
Fertility by Education by Marriage Status in Huntington County
37.7% of women with births in Huntington County are unmarried. Women with the educational attainment of bachelor's degree are most likely to be married with 100.0% of them married at childbirth, while women with the educational attainment of high school diploma are least likely to be married with 74.6% of them unmarried at childbirth.

| Educational Attainment | Married | Unmarried |
| Less than High School | 40 (67.8%) | 19 (32.2%) |
| High School Diploma | 28 (25.5%) | 82 (74.6%) |
| College or Associate's Degree | 135 (73.0%) | 50 (27.0%) |
| Bachelor's Degree | 34 (100.0%) | 0 (0.0%) |
| Graduate Degree | 13 (100.0%) | 0 (0.0%) |
| Total | 250 (62.3%) | 151 (37.7%) |
Income in Huntington County
Income Overview in Huntington County
Per Capita Income in Huntington County is $32,046, while median incomes of families and households are $76,527 and $59,894 respectively.
| Characteristic | Number | Measure |
| Per Capita Income | 36,699 | $32,046 |
| Median Family Income | 9,827 | $76,527 |
| Mean Family Income | 9,827 | $90,442 |
| Median Household Income | 15,165 | $59,894 |
| Mean Household Income | 15,165 | $76,590 |
| Income Deficit | 9,827 | $8,145 |
| Wage / Income Gap (%) | 36,699 | 37.07% |
| Wage / Income Gap ($) | 36,699 | 62.93¢ per $1 |
| Gini / Inequality Index | 36,699 | 0.41 |
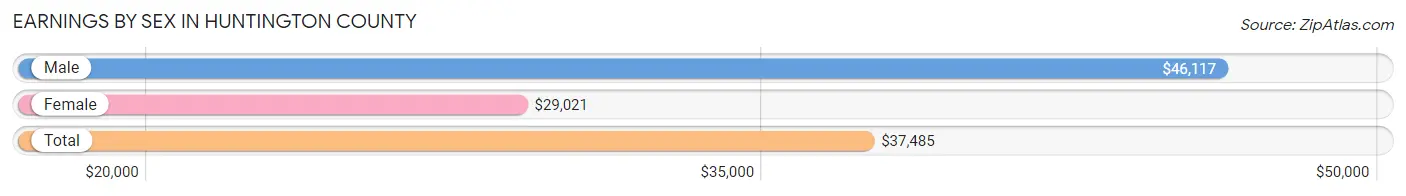
Earnings by Sex in Huntington County
Average Earnings in Huntington County are $37,485, $46,117 for men and $29,021 for women, a difference of 37.1%.
| Sex | Number | Average Earnings |
| Male | 10,832 (54.7%) | $46,117 |
| Female | 8,967 (45.3%) | $29,021 |
| Total | 19,799 (100.0%) | $37,485 |
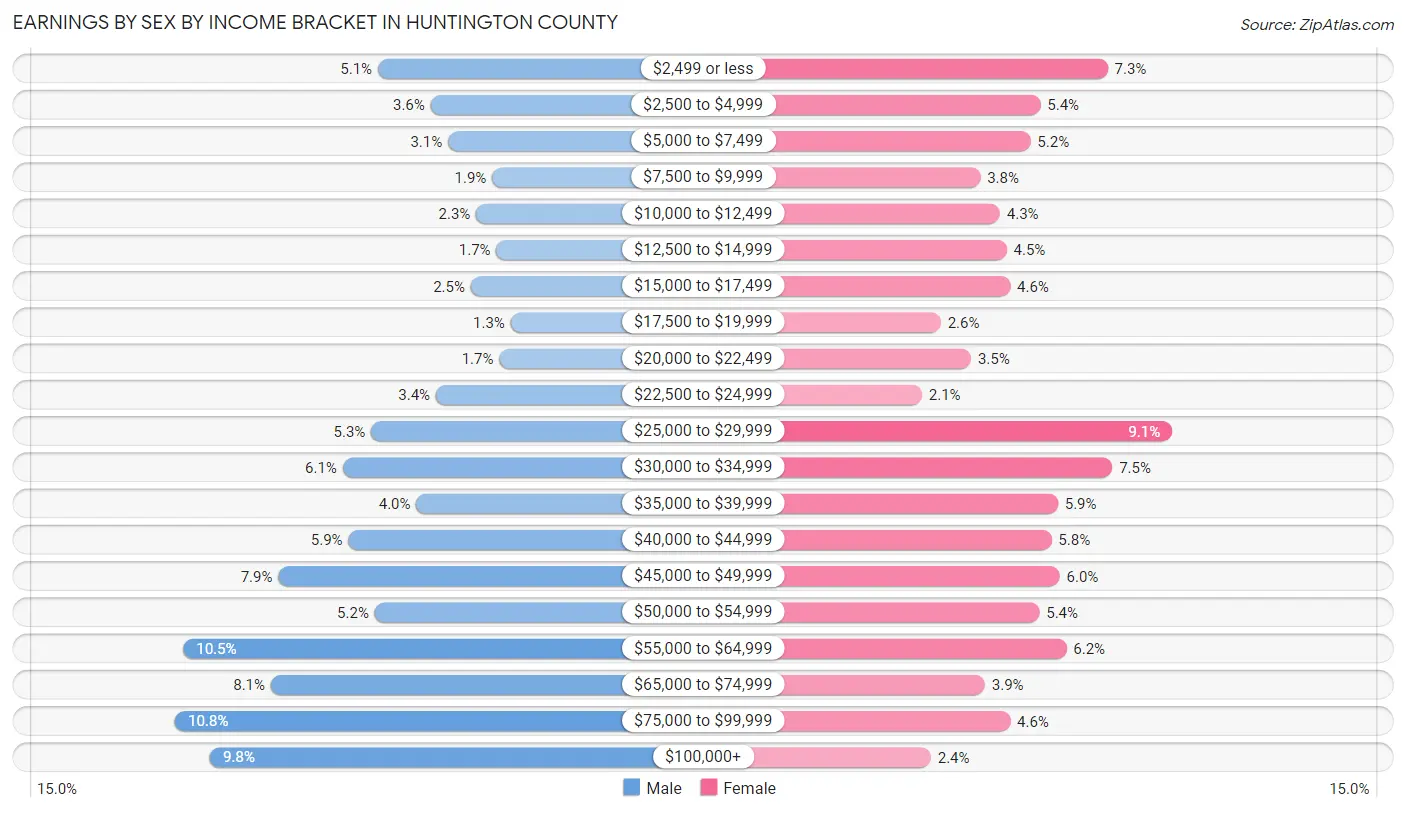
Earnings by Sex by Income Bracket in Huntington County
The most common earnings brackets in Huntington County are $75,000 to $99,999 for men (1,167 | 10.8%) and $25,000 to $29,999 for women (820 | 9.1%).
| Income | Male | Female |
| $2,499 or less | 549 (5.1%) | 657 (7.3%) |
| $2,500 to $4,999 | 389 (3.6%) | 488 (5.4%) |
| $5,000 to $7,499 | 336 (3.1%) | 463 (5.2%) |
| $7,500 to $9,999 | 202 (1.9%) | 336 (3.7%) |
| $10,000 to $12,499 | 250 (2.3%) | 386 (4.3%) |
| $12,500 to $14,999 | 188 (1.7%) | 403 (4.5%) |
| $15,000 to $17,499 | 267 (2.5%) | 412 (4.6%) |
| $17,500 to $19,999 | 145 (1.3%) | 237 (2.6%) |
| $20,000 to $22,499 | 180 (1.7%) | 313 (3.5%) |
| $22,500 to $24,999 | 373 (3.4%) | 189 (2.1%) |
| $25,000 to $29,999 | 570 (5.3%) | 820 (9.1%) |
| $30,000 to $34,999 | 656 (6.1%) | 669 (7.5%) |
| $35,000 to $39,999 | 432 (4.0%) | 532 (5.9%) |
| $40,000 to $44,999 | 639 (5.9%) | 516 (5.8%) |
| $45,000 to $49,999 | 853 (7.9%) | 536 (6.0%) |
| $50,000 to $54,999 | 559 (5.2%) | 485 (5.4%) |
| $55,000 to $64,999 | 1,142 (10.5%) | 553 (6.2%) |
| $65,000 to $74,999 | 875 (8.1%) | 348 (3.9%) |
| $75,000 to $99,999 | 1,167 (10.8%) | 412 (4.6%) |
| $100,000+ | 1,060 (9.8%) | 212 (2.4%) |
| Total | 10,832 (100.0%) | 8,967 (100.0%) |
Earnings by Sex by Educational Attainment in Huntington County
Average earnings in Huntington County are $51,156 for men and $33,174 for women, a difference of 35.1%. Men with an educational attainment of bachelor's degree enjoy the highest average annual earnings of $68,500, while those with less than high school education earn the least with $36,036. Women with an educational attainment of graduate degree earn the most with the average annual earnings of $54,835, while those with less than high school education have the smallest earnings of $25,000.

| Educational Attainment | Male Income | Female Income |
| Less than High School | $36,036 | $25,000 |
| High School Diploma | $47,365 | $28,279 |
| College or Associate's Degree | $51,887 | $35,189 |
| Bachelor's Degree | $68,500 | $41,744 |
| Graduate Degree | $64,671 | $54,835 |
| Total | $51,156 | $33,174 |
Family Income in Huntington County
Family Income Brackets in Huntington County
According to the Huntington County family income data, there are 2,182 families falling into the $50,000 to $74,999 income range, which is the most common income bracket and makes up 22.2% of all families. Conversely, the less than $10,000 income bracket is the least frequent group with only 147 families (1.5%) belonging to this category.

| Income Bracket | # Families | % Families |
| Less than $10,000 | 147 | 1.5% |
| $10,000 to $14,999 | 177 | 1.8% |
| $15,000 to $24,999 | 403 | 4.1% |
| $25,000 to $34,999 | 678 | 6.9% |
| $35,000 to $49,999 | 1,179 | 12.0% |
| $50,000 to $74,999 | 2,182 | 22.2% |
| $75,000 to $99,999 | 1,847 | 18.8% |
| $100,000 to $149,999 | 2,182 | 22.2% |
| $150,000 to $199,999 | 599 | 6.1% |
| $200,000+ | 442 | 4.5% |
Family Income by Famaliy Size in Huntington County
5-person families (692 | 7.0%) account for the highest median family income in Huntington County with $107,891 per family, while 2-person families (5,269 | 53.6%) have the highest median income of $34,856 per family member.
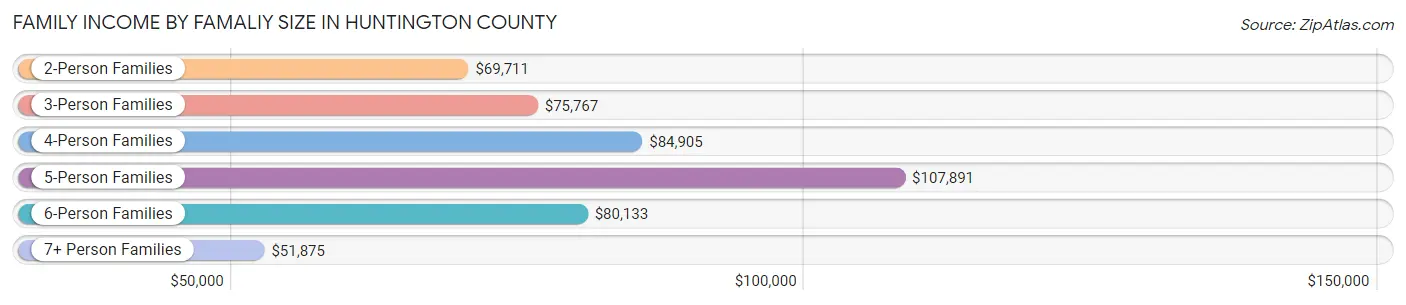
| Income Bracket | # Families | Median Income |
| 2-Person Families | 5,269 (53.6%) | $69,711 |
| 3-Person Families | 1,851 (18.8%) | $75,767 |
| 4-Person Families | 1,547 (15.7%) | $84,905 |
| 5-Person Families | 692 (7.0%) | $107,891 |
| 6-Person Families | 343 (3.5%) | $80,133 |
| 7+ Person Families | 125 (1.3%) | $51,875 |
| Total | 9,827 (100.0%) | $76,527 |
Family Income by Number of Earners in Huntington County
The median family income in Huntington County is $76,527, with families comprising 3+ earners (990) having the highest median family income of $124,696, while families with no earners (1,356) have the lowest median family income of $46,613, accounting for 10.1% and 13.8% of families, respectively.
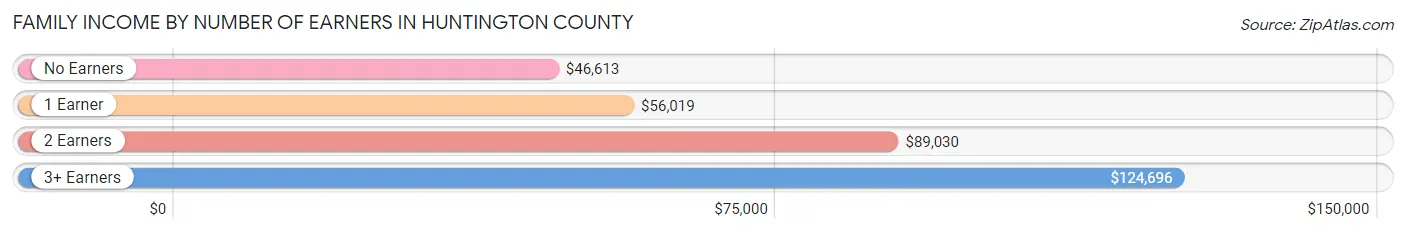
| Number of Earners | # Families | Median Income |
| No Earners | 1,356 (13.8%) | $46,613 |
| 1 Earner | 3,279 (33.4%) | $56,019 |
| 2 Earners | 4,202 (42.8%) | $89,030 |
| 3+ Earners | 990 (10.1%) | $124,696 |
| Total | 9,827 (100.0%) | $76,527 |
Household Income in Huntington County
Household Income Brackets in Huntington County
With 3,139 households falling in the category, the $50,000 to $74,999 income range is the most frequent in Huntington County, accounting for 20.7% of all households. In contrast, only 485 households (3.2%) fall into the $200,000+ income bracket, making it the least populous group.
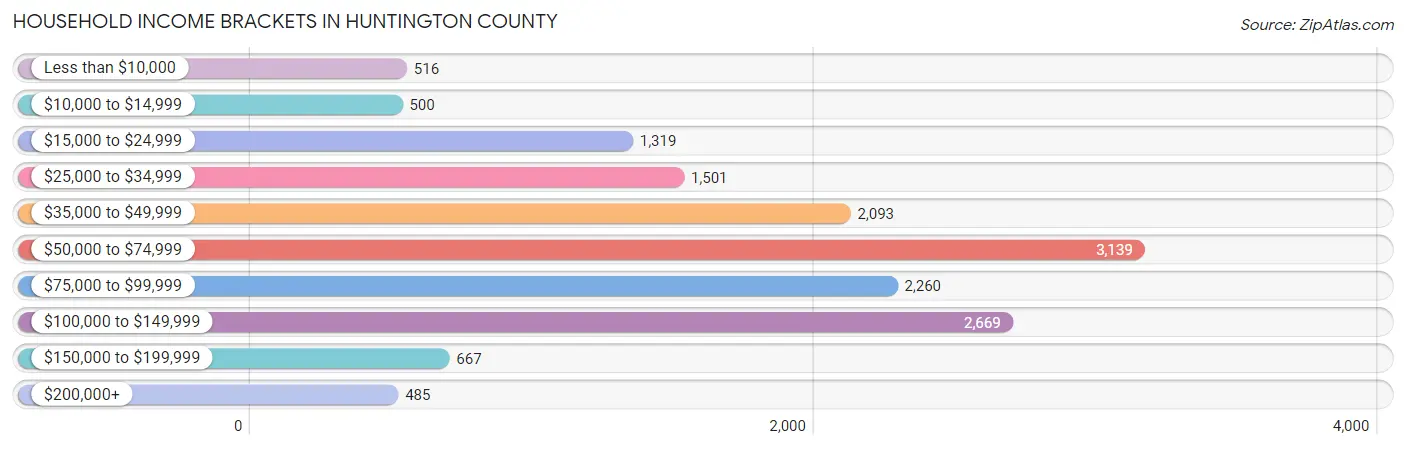
| Income Bracket | # Households | % Households |
| Less than $10,000 | 516 | 3.4% |
| $10,000 to $14,999 | 500 | 3.3% |
| $15,000 to $24,999 | 1,319 | 8.7% |
| $25,000 to $34,999 | 1,501 | 9.9% |
| $35,000 to $49,999 | 2,093 | 13.8% |
| $50,000 to $74,999 | 3,139 | 20.7% |
| $75,000 to $99,999 | 2,260 | 14.9% |
| $100,000 to $149,999 | 2,669 | 17.6% |
| $150,000 to $199,999 | 667 | 4.4% |
| $200,000+ | 485 | 3.2% |
Household Income by Householder Age in Huntington County
The median household income in Huntington County is $59,894, with the highest median household income of $73,265 found in the 45 to 64 years age bracket for the primary householder. A total of 5,774 households (38.1%) fall into this category. Meanwhile, the 15 to 24 years age bracket for the primary householder has the lowest median household income of $33,897, with 651 households (4.3%) in this group.

| Income Bracket | # Households | Median Income |
| 15 to 24 Years | 651 (4.3%) | $33,897 |
| 25 to 44 Years | 4,566 (30.1%) | $72,018 |
| 45 to 64 Years | 5,774 (38.1%) | $73,265 |
| 65+ Years | 4,174 (27.5%) | $42,607 |
| Total | 15,165 (100.0%) | $59,894 |
Poverty in Huntington County
Income Below Poverty by Sex and Age in Huntington County
With 9.3% poverty level for males and 13.0% for females among the residents of Huntington County, under 5 year old males and 18 to 24 year old females are the most vulnerable to poverty, with 205 males (19.2%) and 348 females (32.3%) in their respective age groups living below the poverty level.

| Age Bracket | Male | Female |
| Under 5 Years | 205 (19.2%) | 132 (13.6%) |
| 5 Years | 31 (14.8%) | 70 (32.0%) |
| 6 to 11 Years | 164 (11.8%) | 154 (13.3%) |
| 12 to 14 Years | 58 (9.4%) | 88 (13.5%) |
| 15 Years | 20 (9.6%) | 3 (1.3%) |
| 16 and 17 Years | 62 (11.2%) | 41 (10.0%) |
| 18 to 24 Years | 256 (16.1%) | 348 (32.3%) |
| 25 to 34 Years | 261 (11.5%) | 222 (10.5%) |
| 35 to 44 Years | 130 (5.6%) | 327 (15.3%) |
| 45 to 54 Years | 154 (6.8%) | 145 (6.6%) |
| 55 to 64 Years | 222 (8.2%) | 330 (12.2%) |
| 65 to 74 Years | 77 (4.3%) | 173 (9.1%) |
| 75 Years and over | 29 (3.1%) | 221 (14.0%) |
| Total | 1,669 (9.3%) | 2,254 (13.0%) |
Income Above Poverty by Sex and Age in Huntington County
According to the poverty statistics in Huntington County, males aged 75 years and over and females aged 15 years are the age groups that are most secure financially, with 96.9% of males and 98.7% of females in these age groups living above the poverty line.

| Age Bracket | Male | Female |
| Under 5 Years | 865 (80.8%) | 838 (86.4%) |
| 5 Years | 179 (85.2%) | 149 (68.0%) |
| 6 to 11 Years | 1,229 (88.2%) | 1,001 (86.7%) |
| 12 to 14 Years | 557 (90.6%) | 566 (86.5%) |
| 15 Years | 188 (90.4%) | 228 (98.7%) |
| 16 and 17 Years | 493 (88.8%) | 368 (90.0%) |
| 18 to 24 Years | 1,332 (83.9%) | 728 (67.7%) |
| 25 to 34 Years | 2,001 (88.5%) | 1,897 (89.5%) |
| 35 to 44 Years | 2,201 (94.4%) | 1,808 (84.7%) |
| 45 to 54 Years | 2,116 (93.2%) | 2,045 (93.4%) |
| 55 to 64 Years | 2,481 (91.8%) | 2,380 (87.8%) |
| 65 to 74 Years | 1,731 (95.7%) | 1,733 (90.9%) |
| 75 Years and over | 896 (96.9%) | 1,360 (86.0%) |
| Total | 16,269 (90.7%) | 15,101 (87.0%) |
Income Below Poverty Among Married-Couple Families in Huntington County
The poverty statistics for married-couple families in Huntington County show that 3.4% or 260 of the total 7,597 families live below the poverty line. Families with 1 or 2 children have the highest poverty rate of 5.2%, comprising of 104 families. On the other hand, families with 5 or more children have the lowest poverty rate of 0.0%, which includes 0 families.
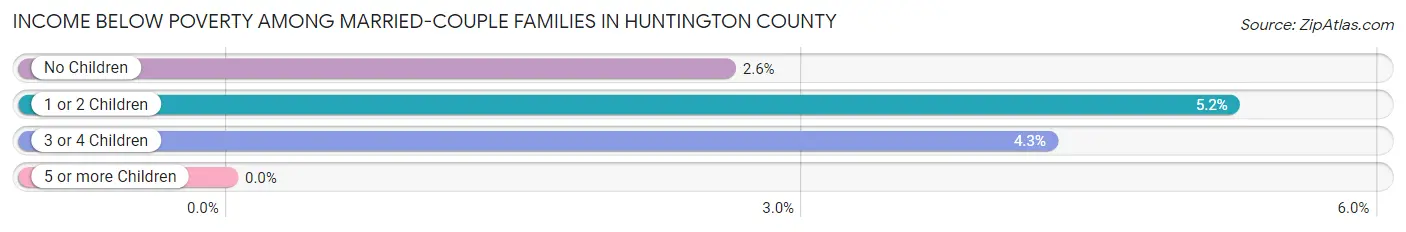
| Children | Above Poverty | Below Poverty |
| No Children | 4,749 (97.4%) | 127 (2.6%) |
| 1 or 2 Children | 1,883 (94.8%) | 104 (5.2%) |
| 3 or 4 Children | 649 (95.7%) | 29 (4.3%) |
| 5 or more Children | 56 (100.0%) | 0 (0.0%) |
| Total | 7,337 (96.6%) | 260 (3.4%) |
Income Below Poverty Among Single-Parent Households in Huntington County
According to the poverty data in Huntington County, 15.8% or 113 single-father households and 23.5% or 356 single-mother households are living below the poverty line. Among single-father households, those with 3 or 4 children have the highest poverty rate, with 52 households (32.3%) experiencing poverty. Likewise, among single-mother households, those with 5 or more children have the highest poverty rate, with 38 households (53.5%) falling below the poverty line.
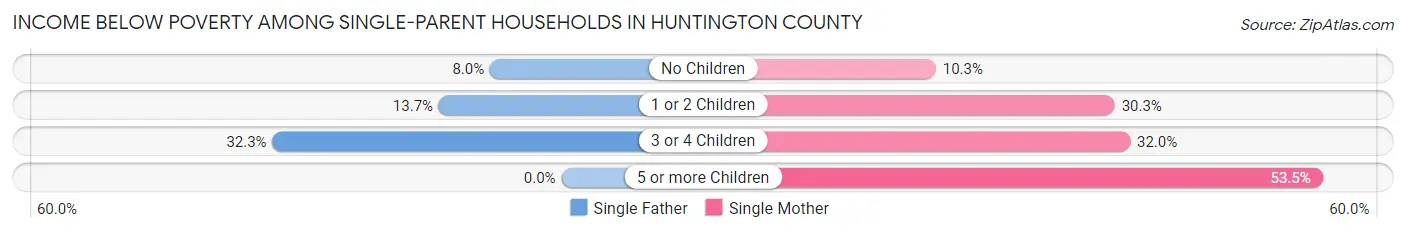
| Children | Single Father | Single Mother |
| No Children | 21 (8.0%) | 62 (10.3%) |
| 1 or 2 Children | 40 (13.7%) | 232 (30.3%) |
| 3 or 4 Children | 52 (32.3%) | 24 (32.0%) |
| 5 or more Children | 0 (0.0%) | 38 (53.5%) |
| Total | 113 (15.8%) | 356 (23.5%) |
Income Below Poverty Among Married-Couple vs Single-Parent Households in Huntington County
The poverty data for Huntington County shows that 260 of the married-couple family households (3.4%) and 469 of the single-parent households (21.0%) are living below the poverty level. Within the married-couple family households, those with 1 or 2 children have the highest poverty rate, with 104 households (5.2%) falling below the poverty line. Among the single-parent households, those with 5 or more children have the highest poverty rate, with 38 household (53.5%) living below poverty.
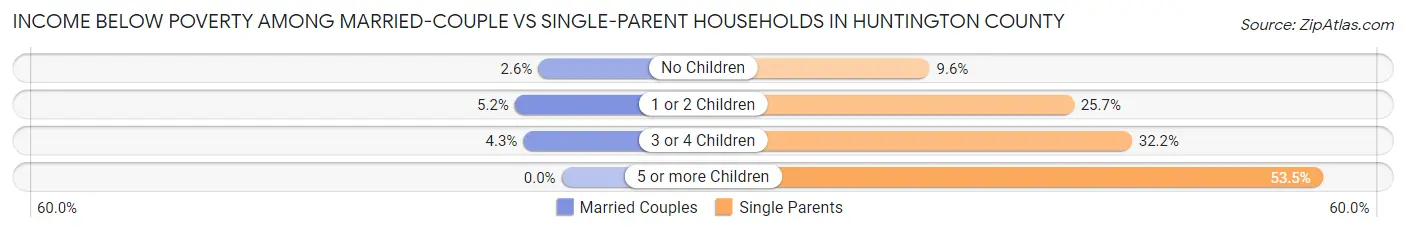
| Children | Married-Couple Families | Single-Parent Households |
| No Children | 127 (2.6%) | 83 (9.6%) |
| 1 or 2 Children | 104 (5.2%) | 272 (25.7%) |
| 3 or 4 Children | 29 (4.3%) | 76 (32.2%) |
| 5 or more Children | 0 (0.0%) | 38 (53.5%) |
| Total | 260 (3.4%) | 469 (21.0%) |
Employment Characteristics in Huntington County
Employment by Class of Employer in Huntington County
Among the 17,611 employed individuals in Huntington County, private company employees (12,982 | 73.7%), not-for-profit organizations (1,967 | 11.2%), and local government employees (845 | 4.8%) make up the most common classes of employment.

| Employer Class | # Employees | % Employees |
| Private Company Employees | 12,982 | 73.7% |
| Self-Employed (Incorporated) | 463 | 2.6% |
| Self-Employed (Not Incorporated) | 664 | 3.8% |
| Not-for-profit Organizations | 1,967 | 11.2% |
| Local Government Employees | 845 | 4.8% |
| State Government Employees | 505 | 2.9% |
| Federal Government Employees | 183 | 1.0% |
| Unpaid Family Workers | 2 | 0.0% |
| Total | 17,611 | 100.0% |
Employment Status by Age in Huntington County
According to the labor force statistics for Huntington County, out of the total population over 16 years of age (29,778), 63.1% or 18,790 individuals are in the labor force, with 3.4% or 639 of them unemployed. The age group with the highest labor force participation rate is 25 to 29 years, with 87.9% or 1,924 individuals in the labor force. Within the labor force, the 16 to 19 years age range has the highest percentage of unemployed individuals, with 11.8% or 124 of them being unemployed.
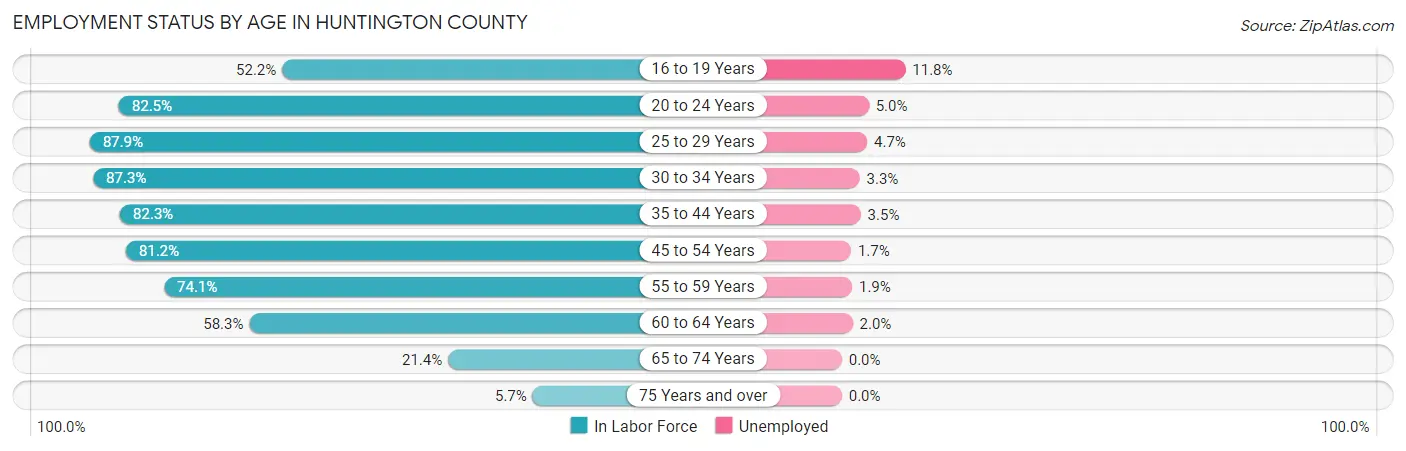
| Age Bracket | In Labor Force | Unemployed |
| 16 to 19 Years | 1,047 (52.2%) | 124 (11.8%) |
| 20 to 24 Years | 1,978 (82.5%) | 99 (5.0%) |
| 25 to 29 Years | 1,924 (87.9%) | 90 (4.7%) |
| 30 to 34 Years | 1,961 (87.3%) | 65 (3.3%) |
| 35 to 44 Years | 3,690 (82.3%) | 129 (3.5%) |
| 45 to 54 Years | 3,635 (81.2%) | 62 (1.7%) |
| 55 to 59 Years | 2,034 (74.1%) | 39 (1.9%) |
| 60 to 64 Years | 1,567 (58.3%) | 31 (2.0%) |
| 65 to 74 Years | 803 (21.4%) | 0 (0.0%) |
| 75 Years and over | 159 (5.7%) | 0 (0.0%) |
| Total | 18,790 (63.1%) | 639 (3.4%) |
Employment Status by Educational Attainment in Huntington County
According to labor force statistics for Huntington County, 78.6% of individuals (14,799) out of the total population between 25 and 64 years of age (18,828) are in the labor force, with 2.8% or 414 of them being unemployed. The group with the highest labor force participation rate are those with the educational attainment of bachelor's degree or higher, with 86.0% or 3,684 individuals in the labor force. Within the labor force, individuals with less than high school education have the highest percentage of unemployment, with 9.6% or 79 of them being unemployed.

| Educational Attainment | In Labor Force | Unemployed |
| Less than High School | 826 (57.8%) | 137 (9.6%) |
| High School Diploma | 5,667 (76.7%) | 288 (3.9%) |
| College / Associate Degree | 4,632 (80.9%) | 109 (1.9%) |
| Bachelor's Degree or higher | 3,684 (86.0%) | 30 (0.7%) |
| Total | 14,799 (78.6%) | 527 (2.8%) |
Employment Occupations by Sex in Huntington County
Management, Business, Science and Arts Occupations
The most common Management, Business, Science and Arts occupations in Huntington County are Community & Social Service (1,474 | 8.1%), Management (1,397 | 7.7%), Health Diagnosing & Treating (1,033 | 5.7%), Computers, Engineering & Science (895 | 4.9%), and Education Instruction & Library (816 | 4.5%).

Management, Business, Science and Arts Occupations by Sex
Within the Management, Business, Science and Arts occupations in Huntington County, the most male-oriented occupations are Computers & Mathematics (93.0%), Computers, Engineering & Science (89.4%), and Life, Physical & Social Science (87.8%), while the most female-oriented occupations are Health Diagnosing & Treating (81.9%), Health Technologists (80.0%), and Education Instruction & Library (72.6%).
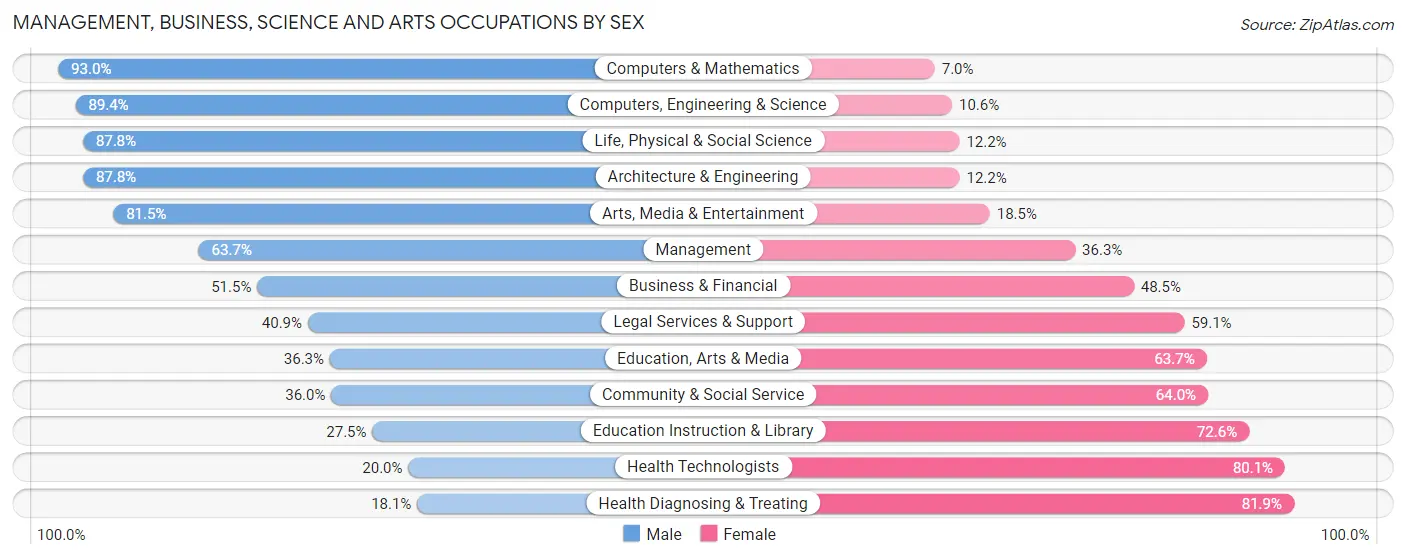
| Occupation | Male | Female |
| Management | 890 (63.7%) | 507 (36.3%) |
| Business & Financial | 402 (51.5%) | 379 (48.5%) |
| Computers, Engineering & Science | 800 (89.4%) | 95 (10.6%) |
| Computers & Mathematics | 252 (93.0%) | 19 (7.0%) |
| Architecture & Engineering | 483 (87.8%) | 67 (12.2%) |
| Life, Physical & Social Science | 65 (87.8%) | 9 (12.2%) |
| Community & Social Service | 531 (36.0%) | 943 (64.0%) |
| Education, Arts & Media | 170 (36.3%) | 298 (63.7%) |
| Legal Services & Support | 18 (40.9%) | 26 (59.1%) |
| Education Instruction & Library | 224 (27.5%) | 592 (72.6%) |
| Arts, Media & Entertainment | 119 (81.5%) | 27 (18.5%) |
| Health Diagnosing & Treating | 187 (18.1%) | 846 (81.9%) |
| Health Technologists | 147 (20.0%) | 590 (80.0%) |
| Total (Category) | 2,810 (50.4%) | 2,770 (49.6%) |
| Total (Overall) | 10,013 (55.2%) | 8,126 (44.8%) |
Services Occupations
The most common Services occupations in Huntington County are Food Preparation & Serving (824 | 4.5%), Cleaning & Maintenance (814 | 4.5%), Healthcare Support (620 | 3.4%), Personal Care & Service (364 | 2.0%), and Security & Protection (206 | 1.1%).
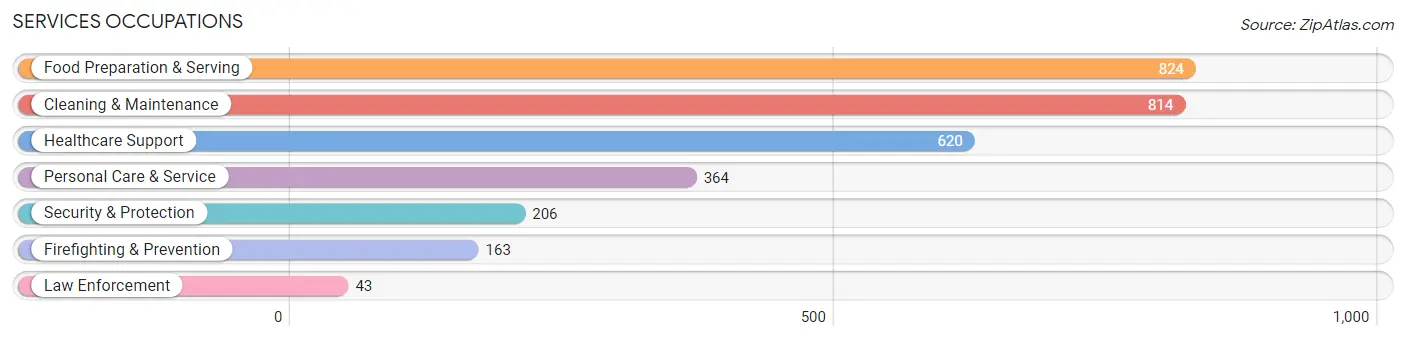
Services Occupations by Sex
Within the Services occupations in Huntington County, the most male-oriented occupations are Law Enforcement (100.0%), Cleaning & Maintenance (68.7%), and Security & Protection (52.4%), while the most female-oriented occupations are Healthcare Support (94.5%), Personal Care & Service (87.4%), and Food Preparation & Serving (63.5%).

| Occupation | Male | Female |
| Healthcare Support | 34 (5.5%) | 586 (94.5%) |
| Security & Protection | 108 (52.4%) | 98 (47.6%) |
| Firefighting & Prevention | 65 (39.9%) | 98 (60.1%) |
| Law Enforcement | 43 (100.0%) | 0 (0.0%) |
| Food Preparation & Serving | 301 (36.5%) | 523 (63.5%) |
| Cleaning & Maintenance | 559 (68.7%) | 255 (31.3%) |
| Personal Care & Service | 46 (12.6%) | 318 (87.4%) |
| Total (Category) | 1,048 (37.1%) | 1,780 (62.9%) |
| Total (Overall) | 10,013 (55.2%) | 8,126 (44.8%) |
Sales and Office Occupations
The most common Sales and Office occupations in Huntington County are Office & Administration (1,822 | 10.0%), and Sales & Related (1,528 | 8.4%).

Sales and Office Occupations by Sex

| Occupation | Male | Female |
| Sales & Related | 684 (44.8%) | 844 (55.2%) |
| Office & Administration | 433 (23.8%) | 1,389 (76.2%) |
| Total (Category) | 1,117 (33.3%) | 2,233 (66.7%) |
| Total (Overall) | 10,013 (55.2%) | 8,126 (44.8%) |
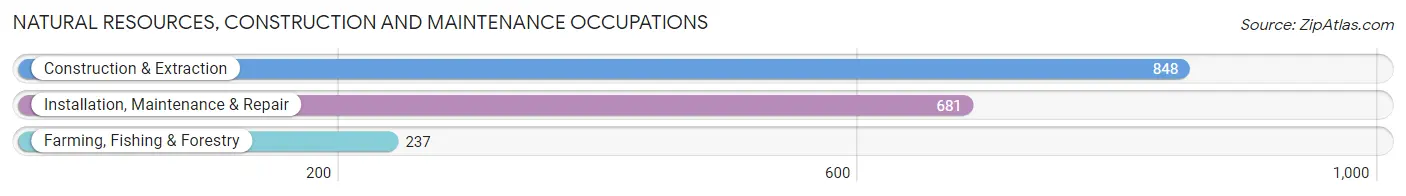
Natural Resources, Construction and Maintenance Occupations
The most common Natural Resources, Construction and Maintenance occupations in Huntington County are Construction & Extraction (848 | 4.7%), Installation, Maintenance & Repair (681 | 3.7%), and Farming, Fishing & Forestry (237 | 1.3%).
Natural Resources, Construction and Maintenance Occupations by Sex
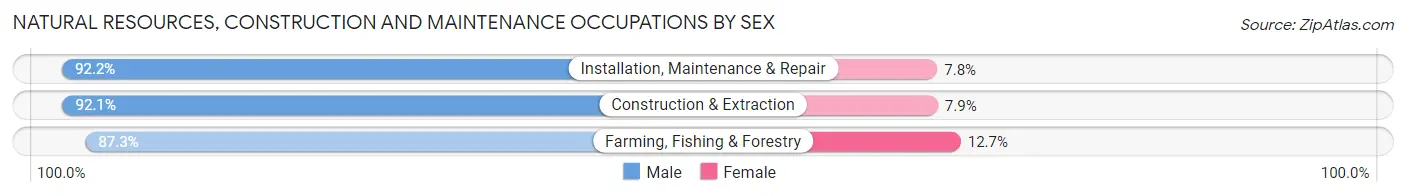
| Occupation | Male | Female |
| Farming, Fishing & Forestry | 207 (87.3%) | 30 (12.7%) |
| Construction & Extraction | 781 (92.1%) | 67 (7.9%) |
| Installation, Maintenance & Repair | 628 (92.2%) | 53 (7.8%) |
| Total (Category) | 1,616 (91.5%) | 150 (8.5%) |
| Total (Overall) | 10,013 (55.2%) | 8,126 (44.8%) |
Production, Transportation and Moving Occupations
The most common Production, Transportation and Moving occupations in Huntington County are Production (2,678 | 14.8%), Material Moving (1,044 | 5.8%), and Transportation (893 | 4.9%).
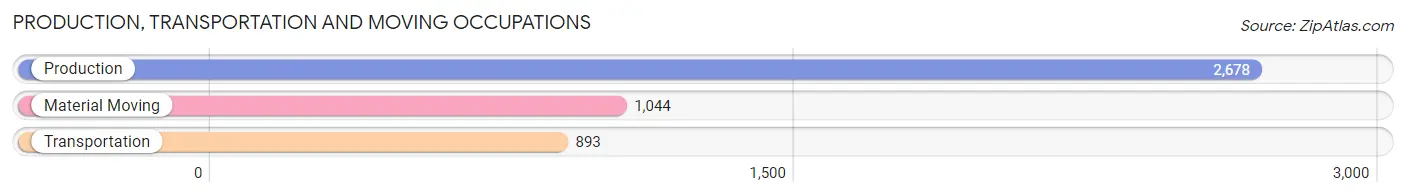
Production, Transportation and Moving Occupations by Sex

| Occupation | Male | Female |
| Production | 1,893 (70.7%) | 785 (29.3%) |
| Transportation | 805 (90.1%) | 88 (9.9%) |
| Material Moving | 724 (69.4%) | 320 (30.6%) |
| Total (Category) | 3,422 (74.2%) | 1,193 (25.9%) |
| Total (Overall) | 10,013 (55.2%) | 8,126 (44.8%) |
Employment Industries by Sex in Huntington County
Employment Industries in Huntington County
The major employment industries in Huntington County include Manufacturing (4,675 | 25.8%), Health Care & Social Assistance (2,605 | 14.4%), Retail Trade (1,998 | 11.0%), Educational Services (1,246 | 6.9%), and Construction (1,017 | 5.6%).

Employment Industries by Sex in Huntington County
The Huntington County industries that see more men than women are Mining, Quarrying, & Extraction (100.0%), Enterprise Management (100.0%), and Transportation & Warehousing (89.1%), whereas the industries that tend to have a higher number of women are Health Care & Social Assistance (83.6%), Arts, Entertainment & Recreation (78.0%), and Educational Services (68.2%).

| Industry | Male | Female |
| Agriculture, Fishing & Hunting | 274 (70.1%) | 117 (29.9%) |
| Mining, Quarrying, & Extraction | 30 (100.0%) | 0 (0.0%) |
| Construction | 902 (88.7%) | 115 (11.3%) |
| Manufacturing | 3,466 (74.1%) | 1,209 (25.9%) |
| Wholesale Trade | 337 (78.0%) | 95 (22.0%) |
| Retail Trade | 927 (46.4%) | 1,071 (53.6%) |
| Transportation & Warehousing | 824 (89.1%) | 101 (10.9%) |
| Utilities | 147 (79.0%) | 39 (21.0%) |
| Information | 70 (43.5%) | 91 (56.5%) |
| Finance & Insurance | 373 (44.6%) | 463 (55.4%) |
| Real Estate, Rental & Leasing | 53 (65.4%) | 28 (34.6%) |
| Professional & Scientific | 251 (50.3%) | 248 (49.7%) |
| Enterprise Management | 11 (100.0%) | 0 (0.0%) |
| Administrative & Support | 365 (53.4%) | 319 (46.6%) |
| Educational Services | 396 (31.8%) | 850 (68.2%) |
| Health Care & Social Assistance | 427 (16.4%) | 2,178 (83.6%) |
| Arts, Entertainment & Recreation | 36 (22.0%) | 128 (78.0%) |
| Accommodation & Food Services | 413 (49.6%) | 420 (50.4%) |
| Public Administration | 273 (53.9%) | 233 (46.1%) |
| Total | 10,013 (55.2%) | 8,126 (44.8%) |
Education in Huntington County
School Enrollment in Huntington County
The most common levels of schooling among the 8,009 students in Huntington County are elementary school (1,825 | 22.8%), high school (1,823 | 22.8%), and college / undergraduate (1,574 | 19.7%).
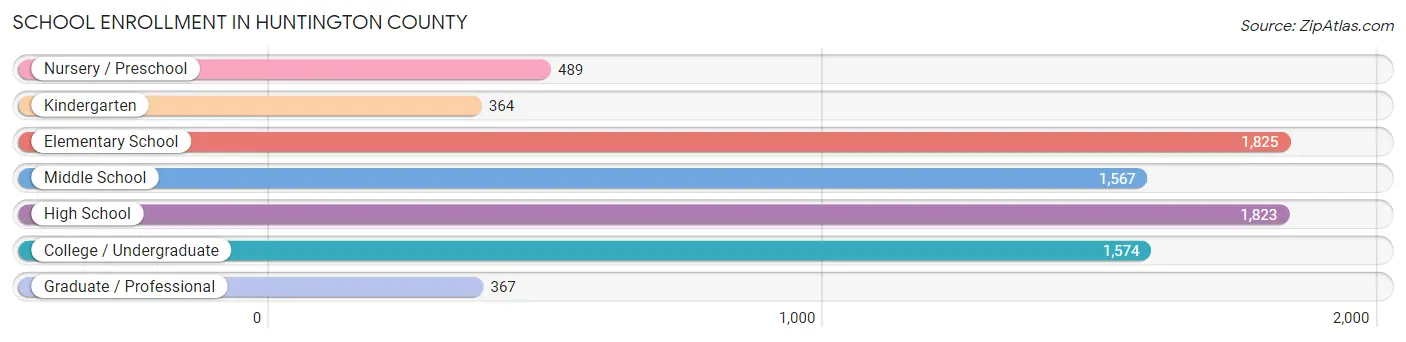
| School Level | # Students | % Students |
| Nursery / Preschool | 489 | 6.1% |
| Kindergarten | 364 | 4.5% |
| Elementary School | 1,825 | 22.8% |
| Middle School | 1,567 | 19.6% |
| High School | 1,823 | 22.8% |
| College / Undergraduate | 1,574 | 19.7% |
| Graduate / Professional | 367 | 4.6% |
| Total | 8,009 | 100.0% |
School Enrollment by Age by Funding Source in Huntington County
Out of a total of 8,009 students who are enrolled in schools in Huntington County, 1,546 (19.3%) attend a private institution, while the remaining 6,463 (80.7%) are enrolled in public schools. The age group of 20 to 24 year olds has the highest likelihood of being enrolled in private schools, with 463 (53.4% in the age bracket) enrolled. Conversely, the age group of 5 to 9 year old has the lowest likelihood of being enrolled in a private school, with 1,913 (90.9% in the age bracket) attending a public institution.
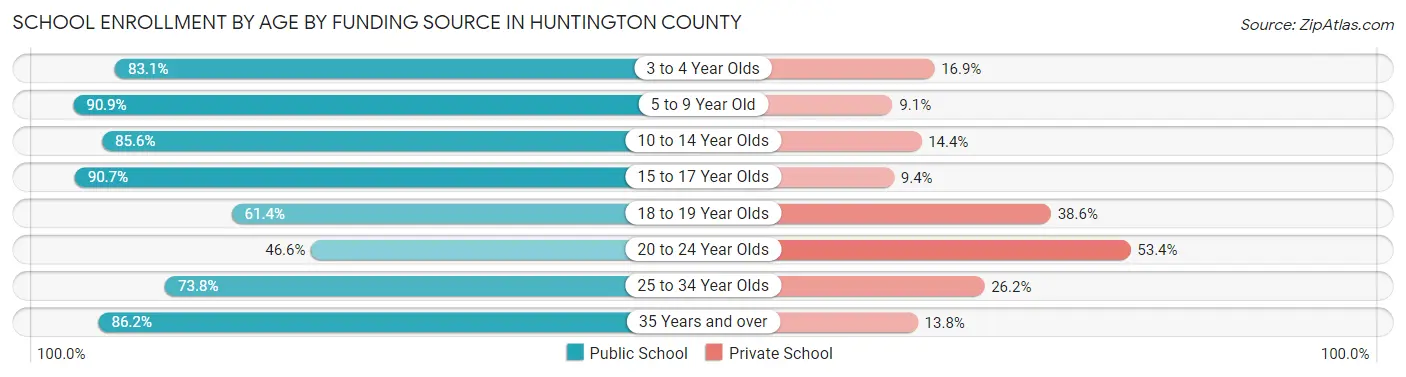
| Age Bracket | Public School | Private School |
| 3 to 4 Year Olds | 291 (83.1%) | 59 (16.9%) |
| 5 to 9 Year Old | 1,913 (90.9%) | 191 (9.1%) |
| 10 to 14 Year Olds | 1,718 (85.6%) | 290 (14.4%) |
| 15 to 17 Year Olds | 1,202 (90.6%) | 124 (9.3%) |
| 18 to 19 Year Olds | 481 (61.4%) | 302 (38.6%) |
| 20 to 24 Year Olds | 404 (46.6%) | 463 (53.4%) |
| 25 to 34 Year Olds | 234 (73.8%) | 83 (26.2%) |
| 35 Years and over | 219 (86.2%) | 35 (13.8%) |
| Total | 6,463 (80.7%) | 1,546 (19.3%) |
Educational Attainment by Field of Study in Huntington County
Education (1,317 | 22.6%), business (1,306 | 22.4%), science & technology (673 | 11.5%), liberal arts & history (410 | 7.0%), and bio, nature & agricultural (350 | 6.0%) are the most common fields of study among 5,835 individuals in Huntington County who have obtained a bachelor's degree or higher.
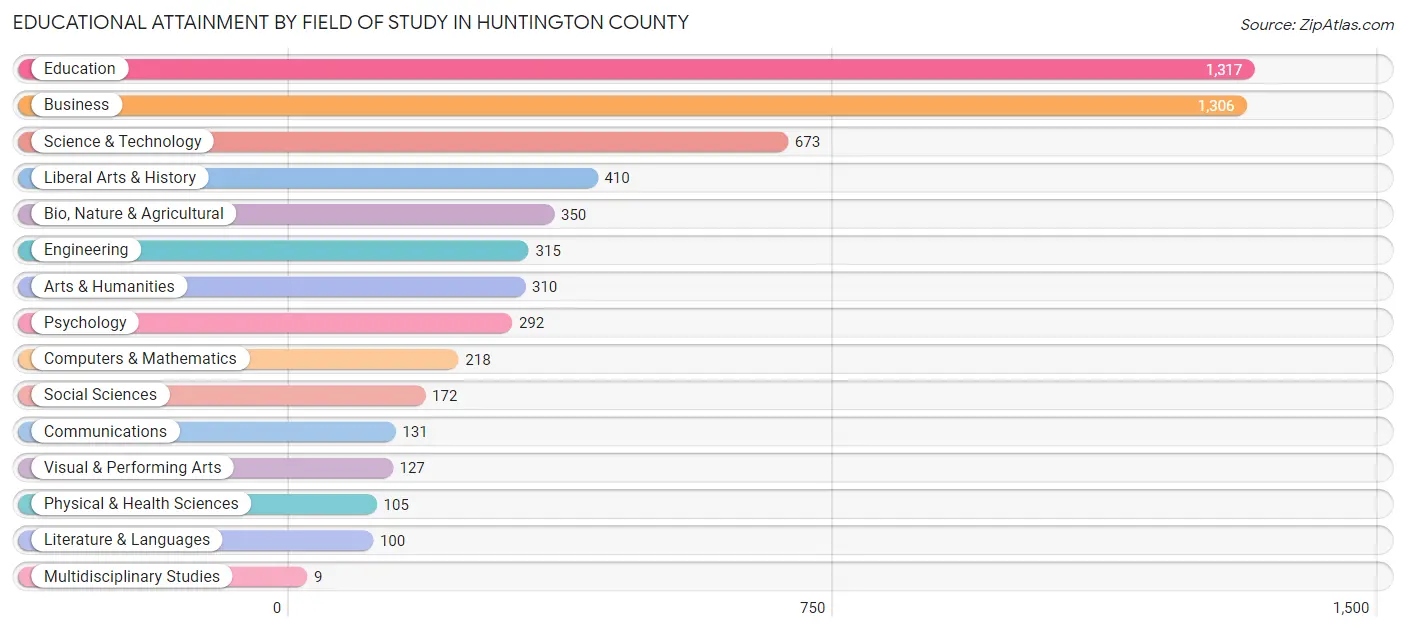
| Field of Study | # Graduates | % Graduates |
| Computers & Mathematics | 218 | 3.7% |
| Bio, Nature & Agricultural | 350 | 6.0% |
| Physical & Health Sciences | 105 | 1.8% |
| Psychology | 292 | 5.0% |
| Social Sciences | 172 | 2.9% |
| Engineering | 315 | 5.4% |
| Multidisciplinary Studies | 9 | 0.2% |
| Science & Technology | 673 | 11.5% |
| Business | 1,306 | 22.4% |
| Education | 1,317 | 22.6% |
| Literature & Languages | 100 | 1.7% |
| Liberal Arts & History | 410 | 7.0% |
| Visual & Performing Arts | 127 | 2.2% |
| Communications | 131 | 2.2% |
| Arts & Humanities | 310 | 5.3% |
| Total | 5,835 | 100.0% |
Transportation & Commute in Huntington County
Vehicle Availability by Sex in Huntington County
The most prevalent vehicle ownership categories in Huntington County are males with 2 vehicles (4,471, accounting for 46.0%) and females with 2 vehicles (3,410, making up 59.7%).
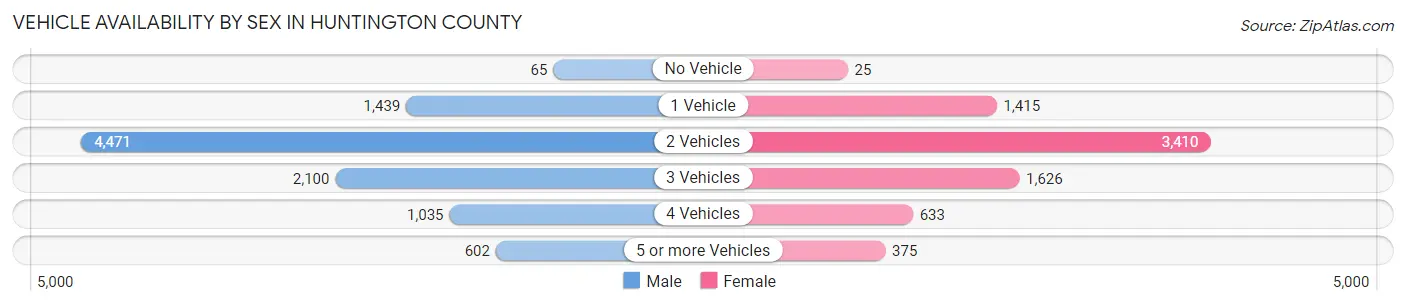
| Vehicles Available | Male | Female |
| No Vehicle | 65 (0.7%) | 25 (0.3%) |
| 1 Vehicle | 1,439 (14.8%) | 1,415 (18.9%) |
| 2 Vehicles | 4,471 (46.0%) | 3,410 (45.6%) |
| 3 Vehicles | 2,100 (21.6%) | 1,626 (21.7%) |
| 4 Vehicles | 1,035 (10.7%) | 633 (8.5%) |
| 5 or more Vehicles | 602 (6.2%) | 375 (5.0%) |
| Total | 9,712 (100.0%) | 7,484 (100.0%) |
Commute Time in Huntington County
The most frequently occuring commute durations in Huntington County are 10 to 14 minutes (3,091 commuters, 18.7%), 15 to 19 minutes (2,656 commuters, 16.1%), and 5 to 9 minutes (2,379 commuters, 14.4%).
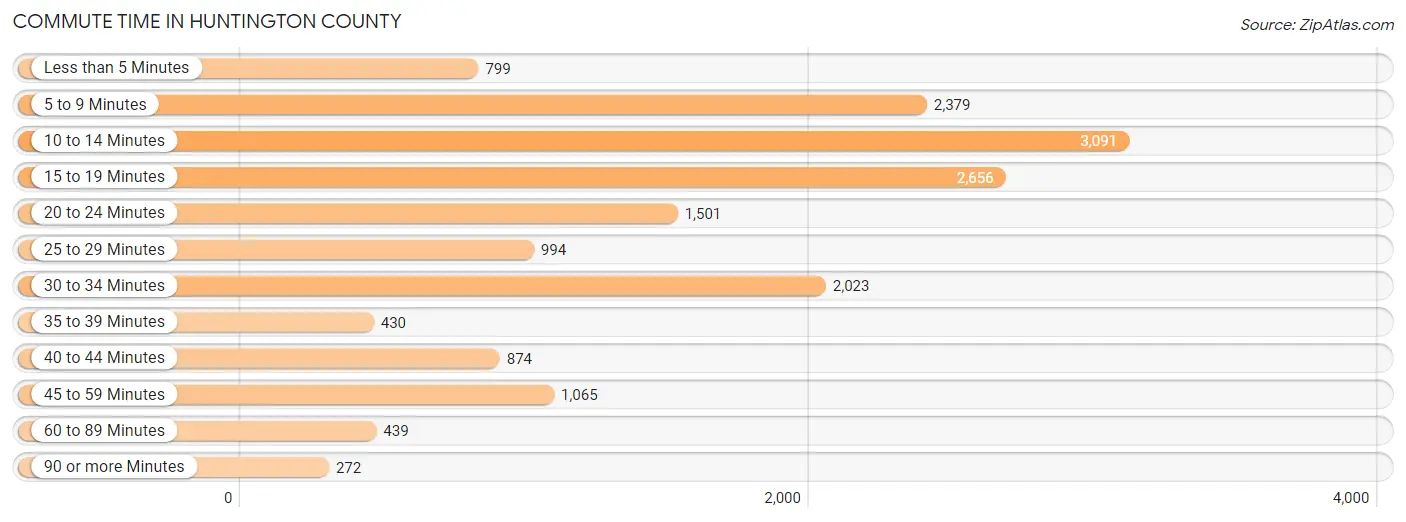
| Commute Time | # Commuters | % Commuters |
| Less than 5 Minutes | 799 | 4.8% |
| 5 to 9 Minutes | 2,379 | 14.4% |
| 10 to 14 Minutes | 3,091 | 18.7% |
| 15 to 19 Minutes | 2,656 | 16.1% |
| 20 to 24 Minutes | 1,501 | 9.1% |
| 25 to 29 Minutes | 994 | 6.0% |
| 30 to 34 Minutes | 2,023 | 12.2% |
| 35 to 39 Minutes | 430 | 2.6% |
| 40 to 44 Minutes | 874 | 5.3% |
| 45 to 59 Minutes | 1,065 | 6.5% |
| 60 to 89 Minutes | 439 | 2.7% |
| 90 or more Minutes | 272 | 1.7% |
Commute Time by Sex in Huntington County
The most common commute times in Huntington County are 10 to 14 minutes (1,770 commuters, 19.0%) for males and 10 to 14 minutes (1,321 commuters, 18.3%) for females.
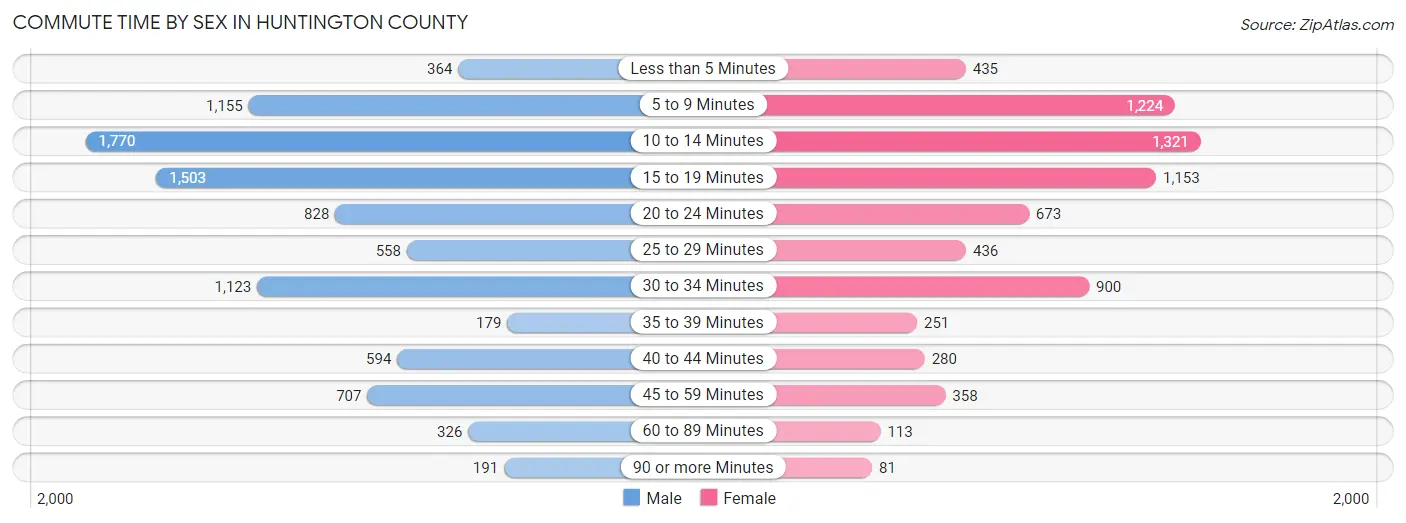
| Commute Time | Male | Female |
| Less than 5 Minutes | 364 (3.9%) | 435 (6.0%) |
| 5 to 9 Minutes | 1,155 (12.4%) | 1,224 (16.9%) |
| 10 to 14 Minutes | 1,770 (19.0%) | 1,321 (18.3%) |
| 15 to 19 Minutes | 1,503 (16.2%) | 1,153 (16.0%) |
| 20 to 24 Minutes | 828 (8.9%) | 673 (9.3%) |
| 25 to 29 Minutes | 558 (6.0%) | 436 (6.0%) |
| 30 to 34 Minutes | 1,123 (12.1%) | 900 (12.5%) |
| 35 to 39 Minutes | 179 (1.9%) | 251 (3.5%) |
| 40 to 44 Minutes | 594 (6.4%) | 280 (3.9%) |
| 45 to 59 Minutes | 707 (7.6%) | 358 (5.0%) |
| 60 to 89 Minutes | 326 (3.5%) | 113 (1.6%) |
| 90 or more Minutes | 191 (2.1%) | 81 (1.1%) |
Time of Departure to Work by Sex in Huntington County
The most frequent times of departure to work in Huntington County are 6:00 AM to 6:29 AM (1,367, 14.7%) for males and 7:00 AM to 7:29 AM (1,148, 15.9%) for females.
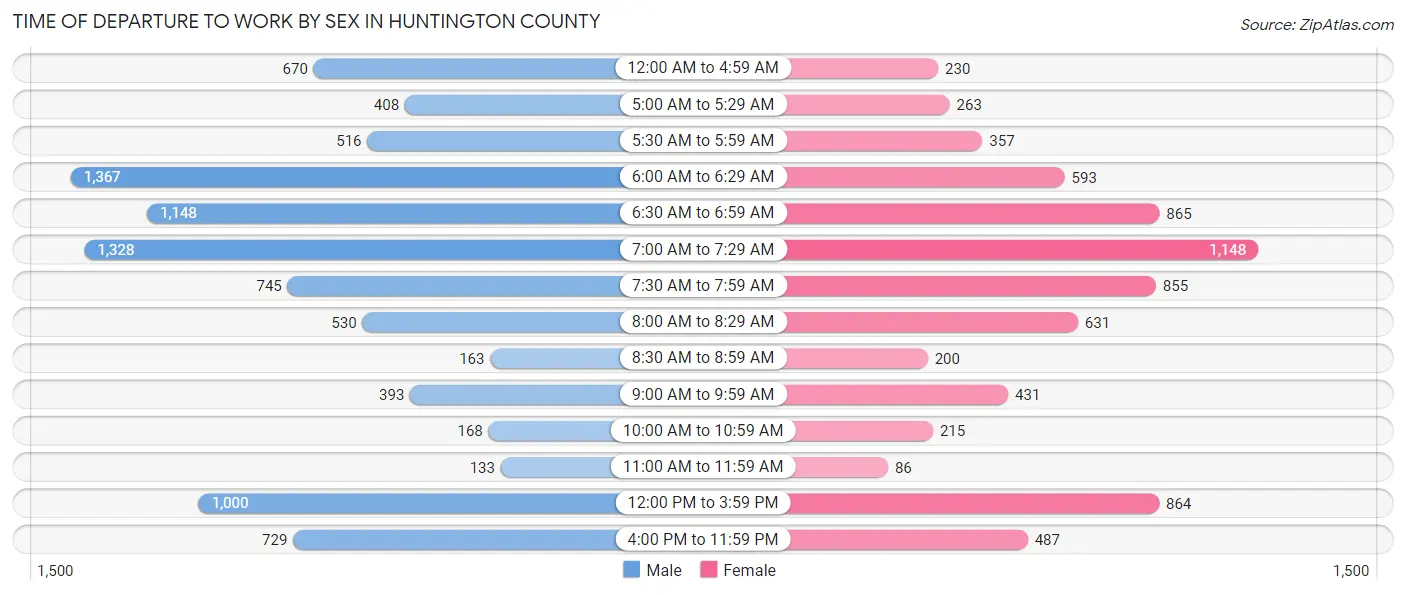
| Time of Departure | Male | Female |
| 12:00 AM to 4:59 AM | 670 (7.2%) | 230 (3.2%) |
| 5:00 AM to 5:29 AM | 408 (4.4%) | 263 (3.6%) |
| 5:30 AM to 5:59 AM | 516 (5.6%) | 357 (4.9%) |
| 6:00 AM to 6:29 AM | 1,367 (14.7%) | 593 (8.2%) |
| 6:30 AM to 6:59 AM | 1,148 (12.3%) | 865 (12.0%) |
| 7:00 AM to 7:29 AM | 1,328 (14.3%) | 1,148 (15.9%) |
| 7:30 AM to 7:59 AM | 745 (8.0%) | 855 (11.8%) |
| 8:00 AM to 8:29 AM | 530 (5.7%) | 631 (8.7%) |
| 8:30 AM to 8:59 AM | 163 (1.8%) | 200 (2.8%) |
| 9:00 AM to 9:59 AM | 393 (4.2%) | 431 (6.0%) |
| 10:00 AM to 10:59 AM | 168 (1.8%) | 215 (3.0%) |
| 11:00 AM to 11:59 AM | 133 (1.4%) | 86 (1.2%) |
| 12:00 PM to 3:59 PM | 1,000 (10.8%) | 864 (12.0%) |
| 4:00 PM to 11:59 PM | 729 (7.8%) | 487 (6.7%) |
| Total | 9,298 (100.0%) | 7,225 (100.0%) |
Housing Occupancy in Huntington County
Occupancy by Ownership in Huntington County
Of the total 15,165 dwellings in Huntington County, owner-occupied units account for 11,462 (75.6%), while renter-occupied units make up 3,703 (24.4%).

| Occupancy | # Housing Units | % Housing Units |
| Owner Occupied Housing Units | 11,462 | 75.6% |
| Renter-Occupied Housing Units | 3,703 | 24.4% |
| Total Occupied Housing Units | 15,165 | 100.0% |
Occupancy by Household Size in Huntington County

| Household Size | # Housing Units | % Housing Units |
| 1-Person Household | 4,447 | 29.3% |
| 2-Person Household | 5,649 | 37.2% |
| 3-Person Household | 2,098 | 13.8% |
| 4+ Person Household | 2,971 | 19.6% |
| Total Housing Units | 15,165 | 100.0% |
Occupancy by Ownership by Household Size in Huntington County

| Household Size | Owner-occupied | Renter-occupied |
| 1-Person Household | 2,996 (67.4%) | 1,451 (32.6%) |
| 2-Person Household | 4,568 (80.9%) | 1,081 (19.1%) |
| 3-Person Household | 1,615 (77.0%) | 483 (23.0%) |
| 4+ Person Household | 2,283 (76.8%) | 688 (23.2%) |
| Total Housing Units | 11,462 (75.6%) | 3,703 (24.4%) |
Occupancy by Educational Attainment in Huntington County

| Household Size | Owner-occupied | Renter-occupied |
| Less than High School | 472 (49.0%) | 492 (51.0%) |
| High School Diploma | 4,807 (76.5%) | 1,473 (23.5%) |
| College/Associate Degree | 3,308 (75.3%) | 1,086 (24.7%) |
| Bachelor's Degree or higher | 2,875 (81.5%) | 652 (18.5%) |
Occupancy by Age of Householder in Huntington County
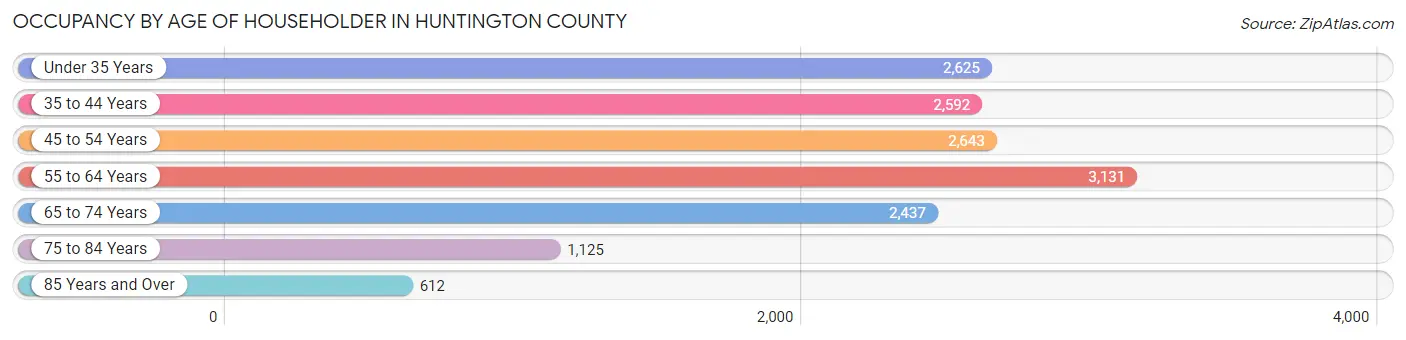
| Age Bracket | # Households | % Households |
| Under 35 Years | 2,625 | 17.3% |
| 35 to 44 Years | 2,592 | 17.1% |
| 45 to 54 Years | 2,643 | 17.4% |
| 55 to 64 Years | 3,131 | 20.6% |
| 65 to 74 Years | 2,437 | 16.1% |
| 75 to 84 Years | 1,125 | 7.4% |
| 85 Years and Over | 612 | 4.0% |
| Total | 15,165 | 100.0% |
Housing Finances in Huntington County
Median Income by Occupancy in Huntington County

| Occupancy Type | # Households | Median Income |
| Owner-Occupied | 11,462 (75.6%) | $70,511 |
| Renter-Occupied | 3,703 (24.4%) | $35,648 |
| Average | 15,165 (100.0%) | $59,894 |
Occupancy by Householder Income Bracket in Huntington County

| Income Bracket | Owner-occupied | Renter-occupied |
| Less than $5,000 | 152 (1.3%) | 190 (5.1%) |
| $5,000 to $9,999 | 67 (0.6%) | 108 (2.9%) |
| $10,000 to $14,999 | 200 (1.7%) | 297 (8.0%) |
| $15,000 to $19,999 | 336 (2.9%) | 311 (8.4%) |
| $20,000 to $24,999 | 422 (3.7%) | 247 (6.7%) |
| $25,000 to $34,999 | 838 (7.3%) | 670 (18.1%) |
| $35,000 to $49,999 | 1,638 (14.3%) | 448 (12.1%) |
| $50,000 to $74,999 | 2,445 (21.3%) | 691 (18.7%) |
| $75,000 to $99,999 | 1,792 (15.6%) | 475 (12.8%) |
| $100,000 to $149,999 | 2,487 (21.7%) | 187 (5.1%) |
| $150,000 or more | 1,085 (9.5%) | 79 (2.1%) |
| Total | 11,462 (100.0%) | 3,703 (100.0%) |
Monthly Housing Cost Tiers in Huntington County
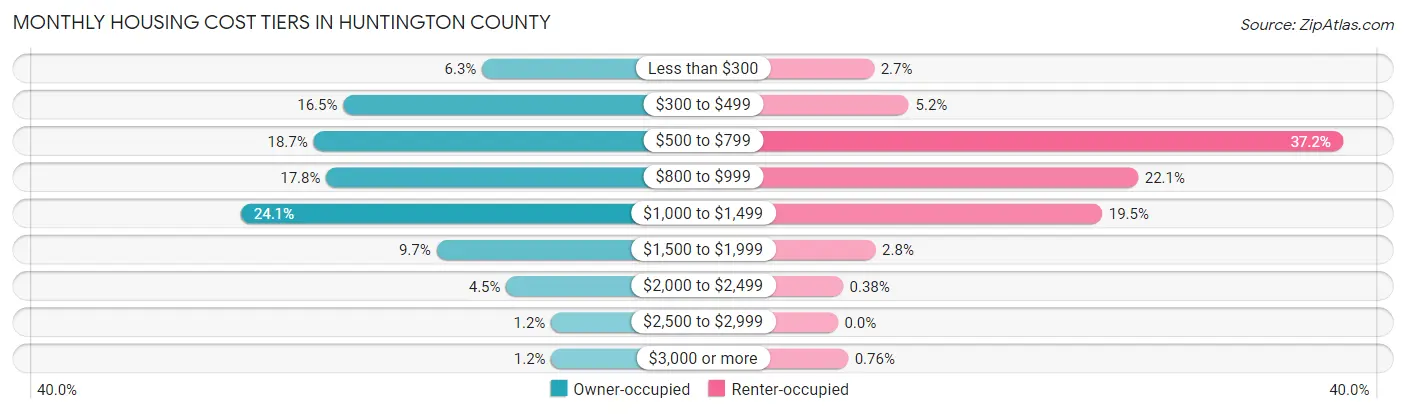
| Monthly Cost | Owner-occupied | Renter-occupied |
| Less than $300 | 722 (6.3%) | 99 (2.7%) |
| $300 to $499 | 1,895 (16.5%) | 194 (5.2%) |
| $500 to $799 | 2,146 (18.7%) | 1,378 (37.2%) |
| $800 to $999 | 2,038 (17.8%) | 819 (22.1%) |
| $1,000 to $1,499 | 2,759 (24.1%) | 721 (19.5%) |
| $1,500 to $1,999 | 1,107 (9.7%) | 103 (2.8%) |
| $2,000 to $2,499 | 518 (4.5%) | 14 (0.4%) |
| $2,500 to $2,999 | 140 (1.2%) | 0 (0.0%) |
| $3,000 or more | 137 (1.2%) | 28 (0.8%) |
| Total | 11,462 (100.0%) | 3,703 (100.0%) |
Physical Housing Characteristics in Huntington County
Housing Structures in Huntington County

| Structure Type | # Housing Units | % Housing Units |
| Single Unit, Detached | 12,898 | 85.1% |
| Single Unit, Attached | 266 | 1.8% |
| 2 Unit Apartments | 362 | 2.4% |
| 3 or 4 Unit Apartments | 397 | 2.6% |
| 5 to 9 Unit Apartments | 214 | 1.4% |
| 10 or more Apartments | 552 | 3.6% |
| Mobile Home / Other | 476 | 3.1% |
| Total | 15,165 | 100.0% |
Housing Structures by Occupancy in Huntington County
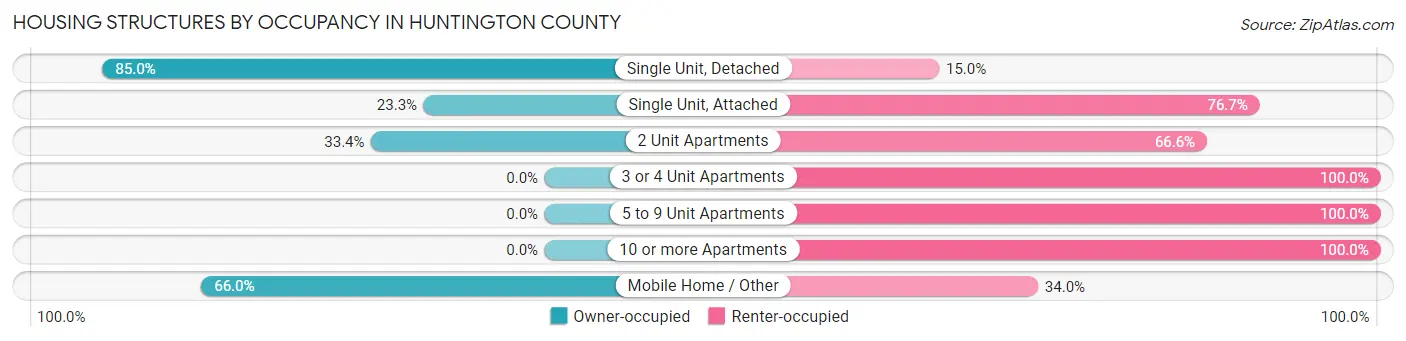
| Structure Type | Owner-occupied | Renter-occupied |
| Single Unit, Detached | 10,965 (85.0%) | 1,933 (15.0%) |
| Single Unit, Attached | 62 (23.3%) | 204 (76.7%) |
| 2 Unit Apartments | 121 (33.4%) | 241 (66.6%) |
| 3 or 4 Unit Apartments | 0 (0.0%) | 397 (100.0%) |
| 5 to 9 Unit Apartments | 0 (0.0%) | 214 (100.0%) |
| 10 or more Apartments | 0 (0.0%) | 552 (100.0%) |
| Mobile Home / Other | 314 (66.0%) | 162 (34.0%) |
| Total | 11,462 (75.6%) | 3,703 (24.4%) |
Housing Structures by Number of Rooms in Huntington County
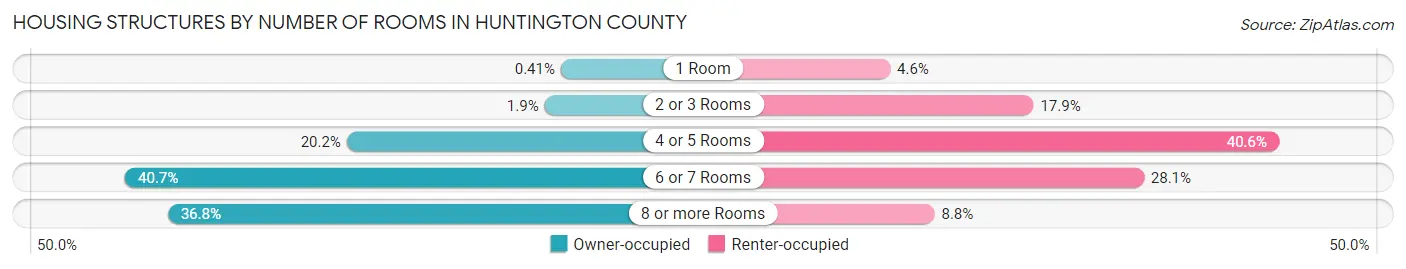
| Number of Rooms | Owner-occupied | Renter-occupied |
| 1 Room | 47 (0.4%) | 172 (4.6%) |
| 2 or 3 Rooms | 220 (1.9%) | 663 (17.9%) |
| 4 or 5 Rooms | 2,317 (20.2%) | 1,503 (40.6%) |
| 6 or 7 Rooms | 4,665 (40.7%) | 1,041 (28.1%) |
| 8 or more Rooms | 4,213 (36.8%) | 324 (8.7%) |
| Total | 11,462 (100.0%) | 3,703 (100.0%) |
Housing Structure by Heating Type in Huntington County

| Heating Type | Owner-occupied | Renter-occupied |
| Utility Gas | 5,506 (48.0%) | 1,581 (42.7%) |
| Bottled, Tank, or LP Gas | 1,875 (16.4%) | 333 (9.0%) |
| Electricity | 3,356 (29.3%) | 1,716 (46.3%) |
| Fuel Oil or Kerosene | 200 (1.7%) | 42 (1.1%) |
| Coal or Coke | 0 (0.0%) | 0 (0.0%) |
| All other Fuels | 402 (3.5%) | 21 (0.6%) |
| No Fuel Used | 123 (1.1%) | 10 (0.3%) |
| Total | 11,462 (100.0%) | 3,703 (100.0%) |
Household Vehicle Usage in Huntington County

| Vehicles per Household | Owner-occupied | Renter-occupied |
| No Vehicle | 195 (1.7%) | 286 (7.7%) |
| 1 Vehicle | 2,863 (25.0%) | 1,931 (52.1%) |
| 2 Vehicles | 5,161 (45.0%) | 1,089 (29.4%) |
| 3 or more Vehicles | 3,243 (28.3%) | 397 (10.7%) |
| Total | 11,462 (100.0%) | 3,703 (100.0%) |
Real Estate & Mortgages in Huntington County
Real Estate and Mortgage Overview in Huntington County
| Characteristic | Without Mortgage | With Mortgage |
| Housing Units | 3,752 | 7,710 |
| Median Property Value | $124,300 | $138,400 |
| Median Household Income | $50,551 | $809 |
| Monthly Housing Costs | $416 | $137 |
| Real Estate Taxes | $904 | $194 |
Property Value by Mortgage Status in Huntington County
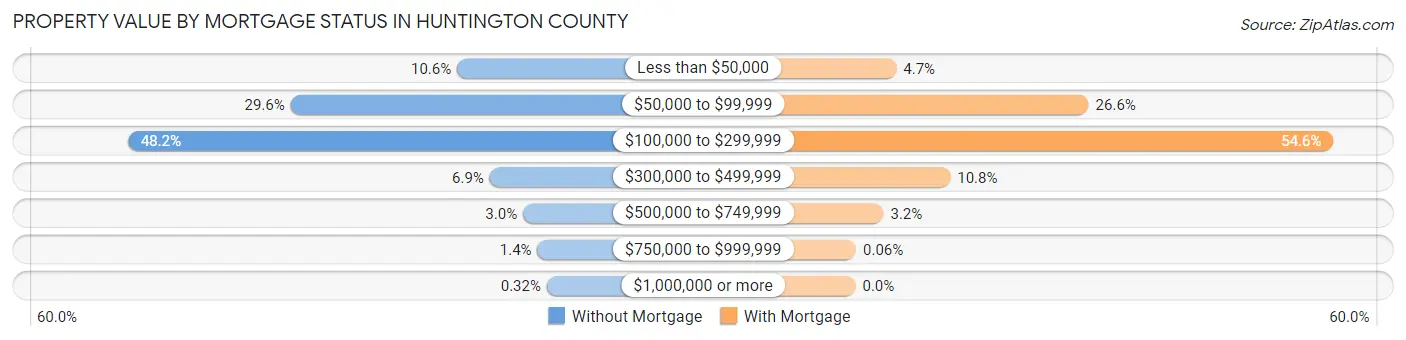
| Property Value | Without Mortgage | With Mortgage |
| Less than $50,000 | 397 (10.6%) | 359 (4.7%) |
| $50,000 to $99,999 | 1,111 (29.6%) | 2,054 (26.6%) |
| $100,000 to $299,999 | 1,809 (48.2%) | 4,210 (54.6%) |
| $300,000 to $499,999 | 257 (6.9%) | 835 (10.8%) |
| $500,000 to $749,999 | 114 (3.0%) | 247 (3.2%) |
| $750,000 to $999,999 | 52 (1.4%) | 5 (0.1%) |
| $1,000,000 or more | 12 (0.3%) | 0 (0.0%) |
| Total | 3,752 (100.0%) | 7,710 (100.0%) |
Household Income by Mortgage Status in Huntington County
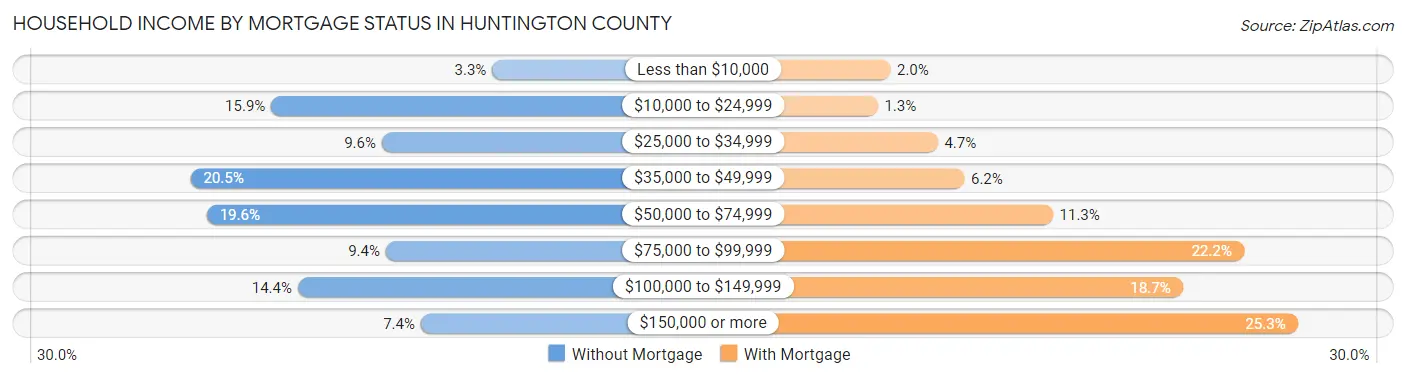
| Household Income | Without Mortgage | With Mortgage |
| Less than $10,000 | 123 (3.3%) | 152 (2.0%) |
| $10,000 to $24,999 | 597 (15.9%) | 96 (1.3%) |
| $25,000 to $34,999 | 360 (9.6%) | 361 (4.7%) |
| $35,000 to $49,999 | 770 (20.5%) | 478 (6.2%) |
| $50,000 to $74,999 | 735 (19.6%) | 868 (11.3%) |
| $75,000 to $99,999 | 351 (9.4%) | 1,710 (22.2%) |
| $100,000 to $149,999 | 540 (14.4%) | 1,441 (18.7%) |
| $150,000 or more | 276 (7.4%) | 1,947 (25.3%) |
| Total | 3,752 (100.0%) | 7,710 (100.0%) |
Property Value to Household Income Ratio in Huntington County
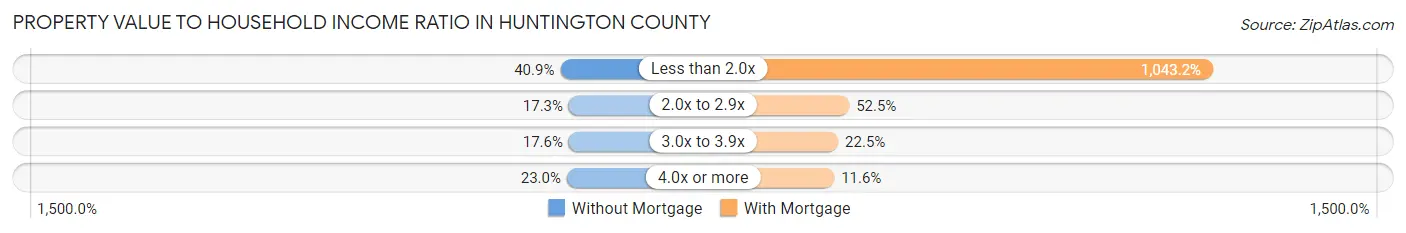
| Value-to-Income Ratio | Without Mortgage | With Mortgage |
| Less than 2.0x | 1,533 (40.9%) | 80,429 (1,043.2%) |
| 2.0x to 2.9x | 650 (17.3%) | 4,049 (52.5%) |
| 3.0x to 3.9x | 659 (17.6%) | 1,734 (22.5%) |
| 4.0x or more | 864 (23.0%) | 894 (11.6%) |
| Total | 3,752 (100.0%) | 7,710 (100.0%) |
Real Estate Taxes by Mortgage Status in Huntington County

| Property Taxes | Without Mortgage | With Mortgage |
| Less than $800 | 1,537 (41.0%) | 8 (0.1%) |
| $800 to $1,499 | 1,012 (27.0%) | 2,544 (33.0%) |
| $800 to $1,499 | 1,050 (28.0%) | 2,479 (32.2%) |
| Total | 3,752 (100.0%) | 7,710 (100.0%) |
Health & Disability in Huntington County
Health Insurance Coverage by Age in Huntington County

| Age Bracket | With Coverage | Without Coverage |
| Under 6 Years | 2,425 (96.7%) | 83 (3.3%) |
| 6 to 18 Years | 5,545 (95.8%) | 244 (4.2%) |
| 19 to 25 Years | 3,178 (89.6%) | 367 (10.3%) |
| 26 to 34 Years | 3,371 (87.4%) | 487 (12.6%) |
| 35 to 44 Years | 3,882 (87.2%) | 569 (12.8%) |
| 45 to 54 Years | 4,139 (92.8%) | 321 (7.2%) |
| 55 to 64 Years | 5,129 (94.8%) | 283 (5.2%) |
| 65 to 74 Years | 3,711 (99.9%) | 3 (0.1%) |
| 75 Years and older | 2,506 (100.0%) | 0 (0.0%) |
| Total | 33,886 (93.5%) | 2,357 (6.5%) |
Health Insurance Coverage by Citizenship Status in Huntington County

| Citizenship Status | With Coverage | Without Coverage |
| Native Born | 2,425 (96.7%) | 83 (3.3%) |
| Foreign Born, Citizen | 5,545 (95.8%) | 244 (4.2%) |
| Foreign Born, not a Citizen | 3,178 (89.6%) | 367 (10.3%) |
Health Insurance Coverage by Household Income in Huntington County

| Household Income | With Coverage | Without Coverage |
| Under $25,000 | 3,203 (90.9%) | 321 (9.1%) |
| $25,000 to $49,999 | 6,304 (91.7%) | 567 (8.3%) |
| $50,000 to $74,999 | 6,700 (92.7%) | 531 (7.3%) |
| $75,000 to $99,999 | 5,865 (92.9%) | 445 (7.0%) |
| $100,000 and over | 11,015 (96.7%) | 381 (3.3%) |
Public vs Private Health Insurance Coverage by Age in Huntington County

| Age Bracket | Public Insurance | Private Insurance |
| Under 6 | 1,117 (44.5%) | 1,429 (57.0%) |
| 6 to 18 Years | 1,857 (32.1%) | 4,049 (69.9%) |
| 19 to 25 Years | 600 (16.9%) | 2,701 (76.2%) |
| 25 to 34 Years | 677 (17.5%) | 2,841 (73.6%) |
| 35 to 44 Years | 619 (13.9%) | 3,372 (75.8%) |
| 45 to 54 Years | 735 (16.5%) | 3,493 (78.3%) |
| 55 to 64 Years | 1,116 (20.6%) | 4,468 (82.6%) |
| 65 to 74 Years | 3,573 (96.2%) | 1,817 (48.9%) |
| 75 Years and over | 2,492 (99.4%) | 1,437 (57.3%) |
| Total | 12,786 (35.3%) | 25,607 (70.7%) |
Disability Status by Sex by Age in Huntington County

| Age Bracket | Male | Female |
| Under 5 Years | 0 (0.0%) | 0 (0.0%) |
| 5 to 17 Years | 175 (5.8%) | 122 (4.3%) |
| 18 to 34 Years | 279 (6.9%) | 263 (7.0%) |
| 35 to 64 Years | 1,244 (17.1%) | 1,105 (15.7%) |
| 65 to 74 Years | 554 (30.6%) | 385 (20.2%) |
| 75 Years and over | 402 (43.5%) | 677 (42.8%) |
Disability Class by Sex by Age in Huntington County
Disability Class: Hearing Difficulty

| Age Bracket | Male | Female |
| Under 5 Years | 0 (0.0%) | 0 (0.0%) |
| 5 to 17 Years | 7 (0.2%) | 27 (1.0%) |
| 18 to 34 Years | 37 (0.9%) | 13 (0.4%) |
| 35 to 64 Years | 425 (5.8%) | 159 (2.3%) |
| 65 to 74 Years | 252 (13.9%) | 95 (5.0%) |
| 75 Years and over | 206 (22.3%) | 242 (15.3%) |
Disability Class: Vision Difficulty

| Age Bracket | Male | Female |
| Under 5 Years | 0 (0.0%) | 0 (0.0%) |
| 5 to 17 Years | 12 (0.4%) | 45 (1.6%) |
| 18 to 34 Years | 44 (1.1%) | 7 (0.2%) |
| 35 to 64 Years | 332 (4.6%) | 352 (5.0%) |
| 65 to 74 Years | 165 (9.1%) | 49 (2.6%) |
| 75 Years and over | 77 (8.3%) | 76 (4.8%) |
Disability Class: Cognitive Difficulty

| Age Bracket | Male | Female |
| 5 to 17 Years | 156 (5.2%) | 82 (2.9%) |
| 18 to 34 Years | 201 (5.0%) | 170 (4.5%) |
| 35 to 64 Years | 550 (7.5%) | 317 (4.5%) |
| 65 to 74 Years | 31 (1.7%) | 68 (3.6%) |
| 75 Years and over | 78 (8.4%) | 160 (10.1%) |
Disability Class: Ambulatory Difficulty
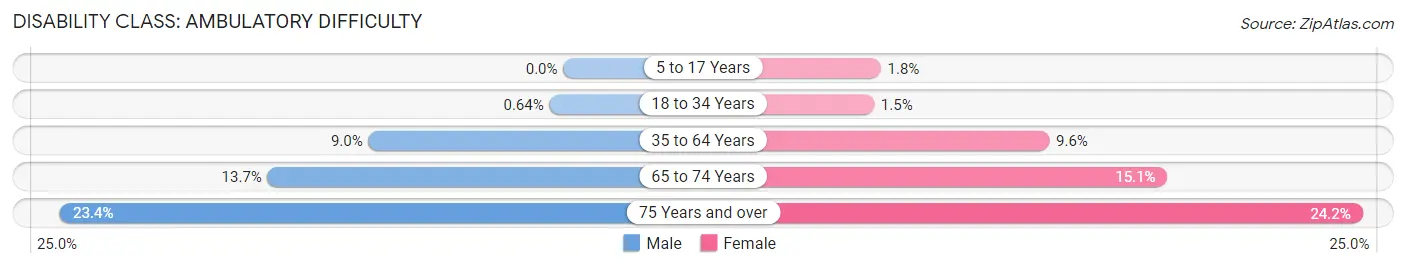
| Age Bracket | Male | Female |
| 5 to 17 Years | 0 (0.0%) | 51 (1.8%) |
| 18 to 34 Years | 26 (0.6%) | 56 (1.5%) |
| 35 to 64 Years | 659 (9.0%) | 677 (9.6%) |
| 65 to 74 Years | 248 (13.7%) | 288 (15.1%) |
| 75 Years and over | 216 (23.4%) | 382 (24.2%) |
Disability Class: Self-Care Difficulty
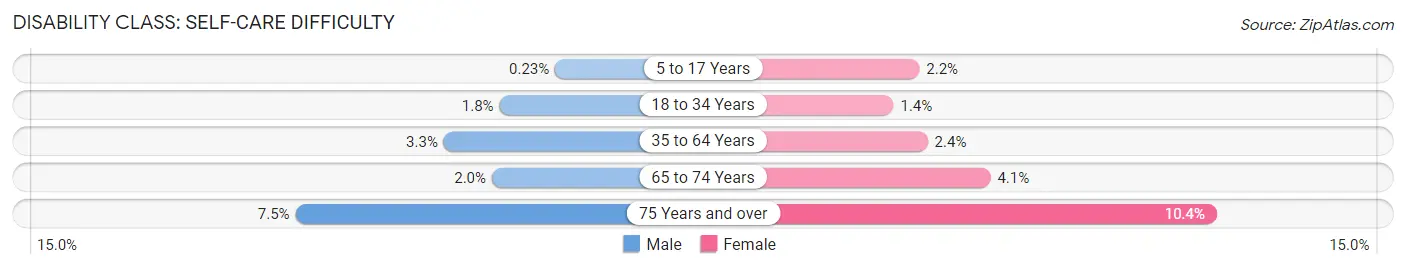
| Age Bracket | Male | Female |
| 5 to 17 Years | 7 (0.2%) | 61 (2.2%) |
| 18 to 34 Years | 72 (1.8%) | 54 (1.4%) |
| 35 to 64 Years | 243 (3.3%) | 168 (2.4%) |
| 65 to 74 Years | 36 (2.0%) | 79 (4.1%) |
| 75 Years and over | 69 (7.5%) | 165 (10.4%) |
Technology Access in Huntington County
Computing Device Access in Huntington County
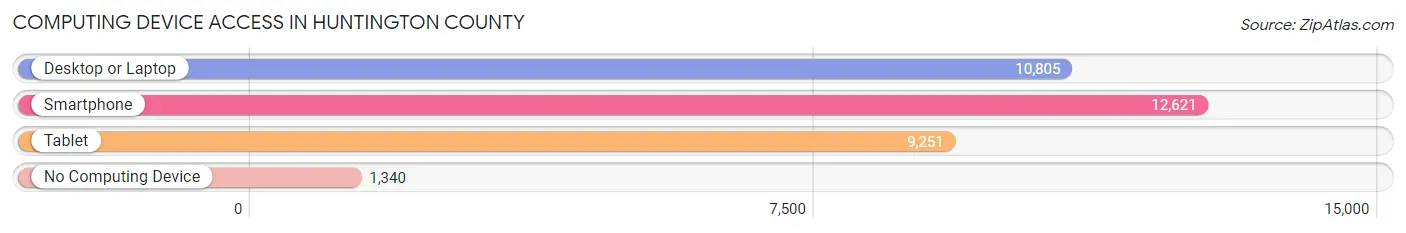
| Device Type | # Households | % Households |
| Desktop or Laptop | 10,805 | 71.3% |
| Smartphone | 12,621 | 83.2% |
| Tablet | 9,251 | 61.0% |
| No Computing Device | 1,340 | 8.8% |
| Total | 15,165 | 100.0% |
Internet Access in Huntington County
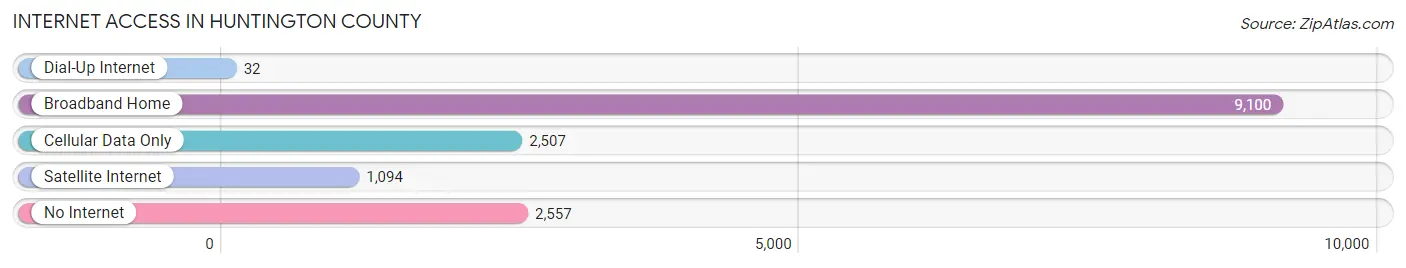
| Internet Type | # Households | % Households |
| Dial-Up Internet | 32 | 0.2% |
| Broadband Home | 9,100 | 60.0% |
| Cellular Data Only | 2,507 | 16.5% |
| Satellite Internet | 1,094 | 7.2% |
| No Internet | 2,557 | 16.9% |
| Total | 15,165 | 100.0% |
Huntington County Summary
Huntington County is located in the northeastern part of Indiana, and is part of the Fort Wayne metropolitan area. It is bordered by Whitley County to the north, Wells County to the east, Adams County to the south, and Allen County to the west. The county seat is Huntington, and the largest city is Huntington. The county was established in 1832 and named for Samuel Huntington, a signer of the Declaration of Independence.
Geography
Huntington County covers an area of 437 square miles, of which 434 square miles is land and 3 square miles is water. The county is located in the Central Till Plains region of Indiana, and is characterized by rolling hills and flat plains. The county is drained by the Wabash River, which forms the western border of the county. The county is home to several state parks, including Salamonie Lake State Recreation Area, Huntington County State Park, and Ouabache State Park.
Demographics
As of the 2010 census, Huntington County had a population of 37,124. The racial makeup of the county was 94.2% White, 1.7% African American, 0.3% Native American, 0.7% Asian, 0.1% Pacific Islander, 1.7% from other races, and 1.2% from two or more races. Hispanic or Latino of any race were 3.7% of the population.
The median household income in Huntington County was $45,945, and the median family income was $54,945. The per capita income was $21,945. About 8.7% of families and 11.3% of the population were below the poverty line, including 15.2% of those under age 18 and 8.2% of those age 65 or over.
Economy
Huntington County is home to a diverse economy, with a mix of manufacturing, agriculture, and service industries. The county is home to several large employers, including Steel Dynamics, a steel producer; Zimmer Biomet, a medical device manufacturer; and Parkview Health, a healthcare provider. Agriculture is also an important part of the county’s economy, with corn, soybeans, and wheat being the primary crops.
Huntington County is also home to several educational institutions, including Huntington University, a private liberal arts college; Huntington County Community School Corporation, a public school district; and Ivy Tech Community College, a two-year college.
History
Huntington County was established in 1832 and named for Samuel Huntington, a signer of the Declaration of Independence. The county was originally part of the Miami Indian Reservation, and the first settlers arrived in the area in the early 1800s. The county was largely agricultural in its early years, with corn, wheat, and livestock being the primary crops.
In the late 1800s, the county began to industrialize, with the establishment of several factories, including a steel mill and a paper mill. The county also saw an influx of immigrants, primarily from Germany and Ireland. The county continued to grow and develop throughout the 20th century, and today it is a vibrant and diverse community.
Common Questions
What is the Total Population of Huntington County?
Total Population of Huntington County is 36,699.
What is the Total Male Population of Huntington County?
Total Male Population of Huntington County is 18,383.
What is the Total Female Population of Huntington County?
Total Female Population of Huntington County is 18,316.
What is the Ratio of Males per 100 Females in Huntington County?
There are 100.37 Males per 100 Females in Huntington County.
What is the Ratio of Females per 100 Males in Huntington County?
There are 99.64 Females per 100 Males in Huntington County.
What is the Median Population Age in Huntington County?
Median Population Age in Huntington County is 41.4 Years.
What is the Average Family Size in Huntington County
Average Family Size in Huntington County is 2.8 People.
What is the Average Household Size in Huntington County
Average Household Size in Huntington County is 2.3 People.
What is Per Capita Income in Huntington County?
Per Capita income in Huntington County is $32,046.
What is the Median Family Income in Huntington County?
Median Family Income in Huntington County is $76,527.
What is the Median Household income in Huntington County?
Median Household Income in Huntington County is $59,894.
What is Income or Wage Gap in Huntington County?
Income or Wage Gap in Huntington County is 37.1%.
Women in Huntington County earn 62.9 cents for every dollar earned by a man.
What is Family Income Deficit in Huntington County?
Family Income Deficit in Huntington County is $8,145.
Families that are below poverty line in Huntington County earn $8,145 less on average than the poverty threshold level.
What is Inequality or Gini Index in Huntington County?
Inequality or Gini Index in Huntington County is 0.41.
How Large is the Labor Force in Huntington County?
There are 18,790 People in the Labor Forcein in Huntington County.
What is the Percentage of People in the Labor Force in Huntington County?
63.1% of People are in the Labor Force in Huntington County.
What is the Unemployment Rate in Huntington County?
Unemployment Rate in Huntington County is 3.4%.