Howard County, IN
Howard County Map
Howard County Overview
83,452
TOTAL POPULATION
40,618
MALE POPULATION
42,834
FEMALE POPULATION
94.83
MALES / 100 FEMALES
105.46
FEMALES / 100 MALES
41.2
MEDIAN AGE
3.0
AVG FAMILY SIZE
2.4
AVG HOUSEHOLD SIZE
$33,391
PER CAPITA INCOME
$79,222
AVG FAMILY INCOME
$62,014
AVG HOUSEHOLD INCOME
31.4%
WAGE / INCOME GAP [ % ]
68.6¢/ $1
WAGE / INCOME GAP [ $ ]
$10,368
FAMILY INCOME DEFICIT
0.42
INEQUALITY / GINI INDEX
39,654
LABOR FORCE [ PEOPLE ]
59.4%
PERCENT IN LABOR FORCE
5.8%
UNEMPLOYMENT RATE
Howard County Area Codes
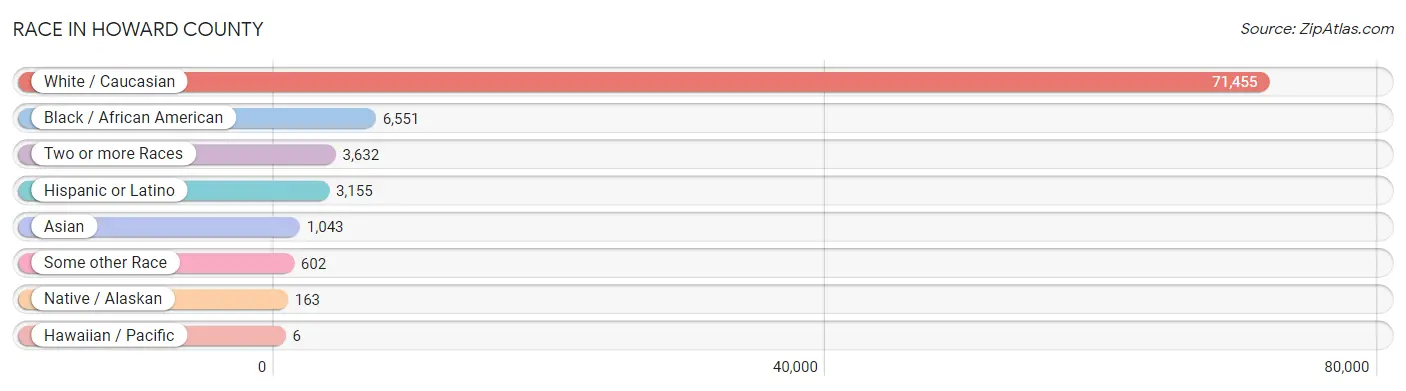
Race in Howard County
The most populous races in Howard County are White / Caucasian (71,455 | 85.6%), Black / African American (6,551 | 7.9%), and Two or more Races (3,632 | 4.3%).
| Race | # Population | % Population |
| Asian | 1,043 | 1.3% |
| Black / African American | 6,551 | 7.9% |
| Hawaiian / Pacific | 6 | 0.0% |
| Hispanic or Latino | 3,155 | 3.8% |
| Native / Alaskan | 163 | 0.2% |
| White / Caucasian | 71,455 | 85.6% |
| Two or more Races | 3,632 | 4.3% |
| Some other Race | 602 | 0.7% |
| Total | 83,452 | 100.0% |
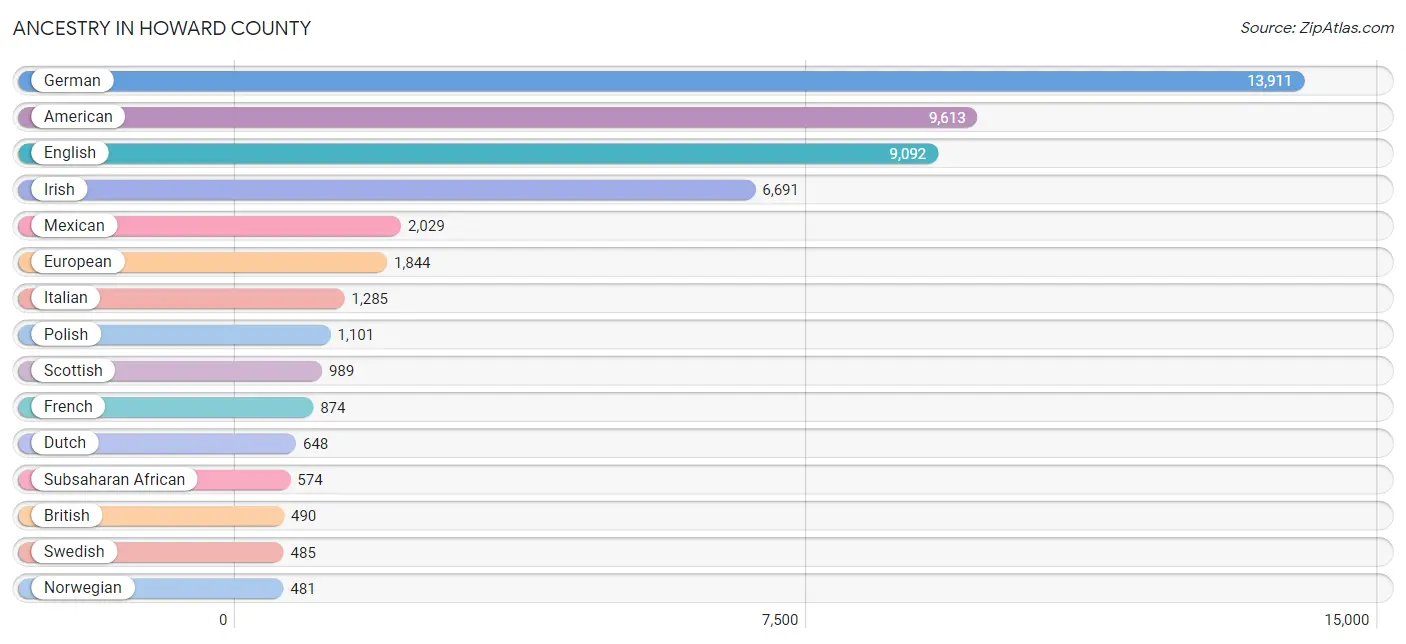
Ancestry in Howard County
The most populous ancestries reported in Howard County are German (13,911 | 16.7%), American (9,613 | 11.5%), English (9,092 | 10.9%), Irish (6,691 | 8.0%), and Mexican (2,029 | 2.4%), together accounting for 49.5% of all Howard County residents.
| Ancestry | # Population | % Population |
| African | 465 | 0.6% |
| American | 9,613 | 11.5% |
| Arab | 66 | 0.1% |
| Argentinean | 68 | 0.1% |
| Australian | 27 | 0.0% |
| Austrian | 49 | 0.1% |
| Bahamian | 54 | 0.1% |
| Belgian | 61 | 0.1% |
| Bhutanese | 80 | 0.1% |
| Blackfeet | 153 | 0.2% |
| British | 490 | 0.6% |
| Bulgarian | 25 | 0.0% |
| Burmese | 157 | 0.2% |
| Cajun | 23 | 0.0% |
| Canadian | 5 | 0.0% |
| Central American | 61 | 0.1% |
| Cherokee | 217 | 0.3% |
| Chinese | 1 | 0.0% |
| Choctaw | 44 | 0.1% |
| Comanche | 5 | 0.0% |
| Creek | 10 | 0.0% |
| Croatian | 25 | 0.0% |
| Cuban | 200 | 0.2% |
| Czech | 31 | 0.0% |
| Czechoslovakian | 38 | 0.1% |
| Danish | 88 | 0.1% |
| Dominican | 38 | 0.1% |
| Dutch | 648 | 0.8% |
| Eastern European | 109 | 0.1% |
| English | 9,092 | 10.9% |
| Ethiopian | 9 | 0.0% |
| European | 1,844 | 2.2% |
| Finnish | 49 | 0.1% |
| French | 874 | 1.1% |
| French Canadian | 72 | 0.1% |
| German | 13,911 | 16.7% |
| Greek | 201 | 0.2% |
| Guamanian / Chamorro | 86 | 0.1% |
| Guatemalan | 36 | 0.0% |
| Haitian | 76 | 0.1% |
| Hungarian | 136 | 0.2% |
| Indian (Asian) | 59 | 0.1% |
| Iranian | 44 | 0.1% |
| Irish | 6,691 | 8.0% |
| Iroquois | 51 | 0.1% |
| Italian | 1,285 | 1.5% |
| Japanese | 252 | 0.3% |
| Korean | 410 | 0.5% |
| Lebanese | 19 | 0.0% |
| Liberian | 50 | 0.1% |
| Lithuanian | 75 | 0.1% |
| Macedonian | 2 | 0.0% |
| Mexican | 2,029 | 2.4% |
| Mexican American Indian | 44 | 0.1% |
| Moroccan | 14 | 0.0% |
| Native Hawaiian | 31 | 0.0% |
| Nigerian | 50 | 0.1% |
| Northern European | 5 | 0.0% |
| Norwegian | 481 | 0.6% |
| Pennsylvania German | 29 | 0.0% |
| Peruvian | 23 | 0.0% |
| Polish | 1,101 | 1.3% |
| Portuguese | 33 | 0.0% |
| Puerto Rican | 242 | 0.3% |
| Romanian | 174 | 0.2% |
| Russian | 121 | 0.1% |
| Salvadoran | 25 | 0.0% |
| Samoan | 24 | 0.0% |
| Scandinavian | 256 | 0.3% |
| Scotch-Irish | 468 | 0.6% |
| Scottish | 989 | 1.2% |
| Serbian | 22 | 0.0% |
| Sioux | 8 | 0.0% |
| Slavic | 23 | 0.0% |
| Slovak | 3 | 0.0% |
| Slovene | 13 | 0.0% |
| South American | 91 | 0.1% |
| Spaniard | 112 | 0.1% |
| Spanish | 167 | 0.2% |
| Sri Lankan | 164 | 0.2% |
| Subsaharan African | 574 | 0.7% |
| Swedish | 485 | 0.6% |
| Swiss | 388 | 0.5% |
| Syrian | 33 | 0.0% |
| Thai | 434 | 0.5% |
| Ukrainian | 8 | 0.0% |
| Welsh | 167 | 0.2% | View All 87 Rows |
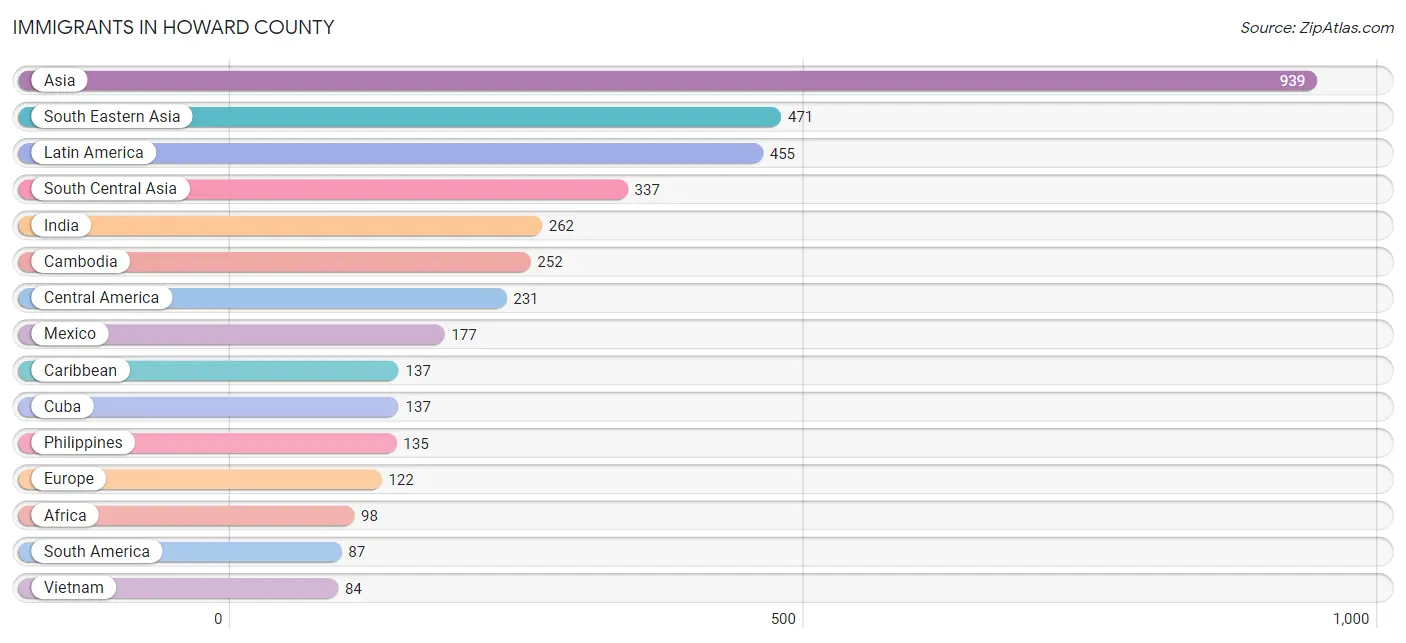
Immigrants in Howard County
The most numerous immigrant groups reported in Howard County came from Asia (939 | 1.1%), South Eastern Asia (471 | 0.6%), Latin America (455 | 0.5%), South Central Asia (337 | 0.4%), and India (262 | 0.3%), together accounting for 2.9% of all Howard County residents.
| Immigration Origin | # Population | % Population |
| Africa | 98 | 0.1% |
| Argentina | 68 | 0.1% |
| Asia | 939 | 1.1% |
| Belize | 13 | 0.0% |
| Brazil | 9 | 0.0% |
| Bulgaria | 25 | 0.0% |
| Cambodia | 252 | 0.3% |
| Canada | 50 | 0.1% |
| Caribbean | 137 | 0.2% |
| Central America | 231 | 0.3% |
| China | 41 | 0.1% |
| Congo | 21 | 0.0% |
| Cuba | 137 | 0.2% |
| Eastern Africa | 32 | 0.0% |
| Eastern Asia | 75 | 0.1% |
| Eastern Europe | 39 | 0.1% |
| El Salvador | 41 | 0.1% |
| England | 12 | 0.0% |
| Eritrea | 24 | 0.0% |
| Ethiopia | 8 | 0.0% |
| Europe | 122 | 0.2% |
| Germany | 32 | 0.0% |
| India | 262 | 0.3% |
| Iran | 44 | 0.1% |
| Israel | 56 | 0.1% |
| Kazakhstan | 31 | 0.0% |
| Korea | 34 | 0.0% |
| Latin America | 455 | 0.5% |
| Mexico | 177 | 0.2% |
| Middle Africa | 21 | 0.0% |
| Morocco | 14 | 0.0% |
| Nigeria | 31 | 0.0% |
| Northern Africa | 14 | 0.0% |
| Northern Europe | 14 | 0.0% |
| Philippines | 135 | 0.2% |
| Russia | 14 | 0.0% |
| South America | 87 | 0.1% |
| South Central Asia | 337 | 0.4% |
| South Eastern Asia | 471 | 0.6% |
| Switzerland | 37 | 0.0% |
| Venezuela | 10 | 0.0% |
| Vietnam | 84 | 0.1% |
| Western Africa | 31 | 0.0% |
| Western Asia | 56 | 0.1% |
| Western Europe | 69 | 0.1% | View All 45 Rows |
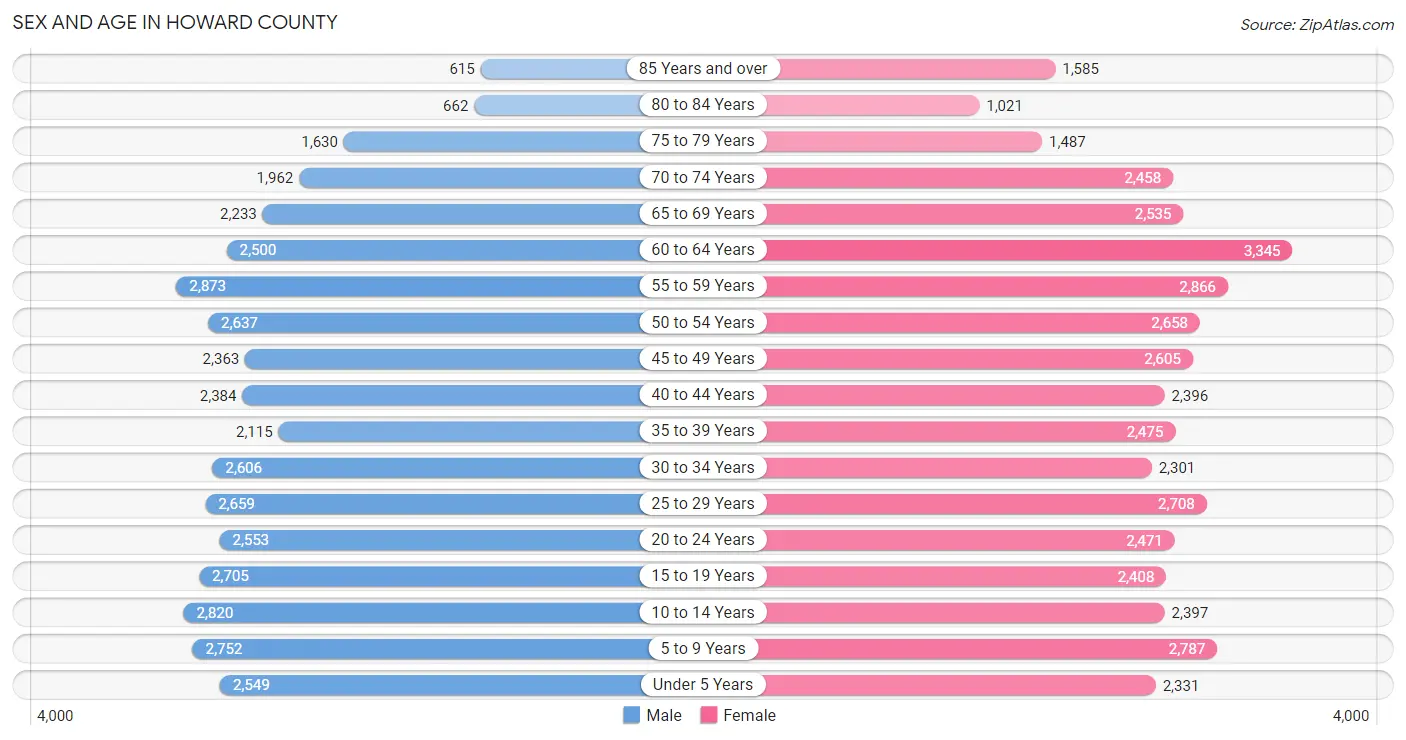
Sex and Age in Howard County
Sex and Age in Howard County
The most populous age groups in Howard County are 55 to 59 Years (2,873 | 7.1%) for men and 60 to 64 Years (3,345 | 7.8%) for women.
| Age Bracket | Male | Female |
| Under 5 Years | 2,549 (6.3%) | 2,331 (5.4%) |
| 5 to 9 Years | 2,752 (6.8%) | 2,787 (6.5%) |
| 10 to 14 Years | 2,820 (6.9%) | 2,397 (5.6%) |
| 15 to 19 Years | 2,705 (6.7%) | 2,408 (5.6%) |
| 20 to 24 Years | 2,553 (6.3%) | 2,471 (5.8%) |
| 25 to 29 Years | 2,659 (6.6%) | 2,708 (6.3%) |
| 30 to 34 Years | 2,606 (6.4%) | 2,301 (5.4%) |
| 35 to 39 Years | 2,115 (5.2%) | 2,475 (5.8%) |
| 40 to 44 Years | 2,384 (5.9%) | 2,396 (5.6%) |
| 45 to 49 Years | 2,363 (5.8%) | 2,605 (6.1%) |
| 50 to 54 Years | 2,637 (6.5%) | 2,658 (6.2%) |
| 55 to 59 Years | 2,873 (7.1%) | 2,866 (6.7%) |
| 60 to 64 Years | 2,500 (6.1%) | 3,345 (7.8%) |
| 65 to 69 Years | 2,233 (5.5%) | 2,535 (5.9%) |
| 70 to 74 Years | 1,962 (4.8%) | 2,458 (5.7%) |
| 75 to 79 Years | 1,630 (4.0%) | 1,487 (3.5%) |
| 80 to 84 Years | 662 (1.6%) | 1,021 (2.4%) |
| 85 Years and over | 615 (1.5%) | 1,585 (3.7%) |
| Total | 40,618 (100.0%) | 42,834 (100.0%) |
Families and Households in Howard County
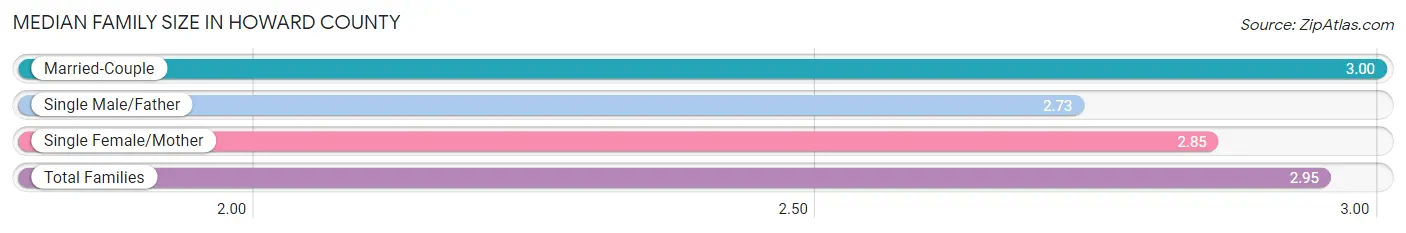
Median Family Size in Howard County
The median family size in Howard County is 2.95 persons per family, with married-couple families (15,233 | 69.6%) accounting for the largest median family size of 3 persons per family. On the other hand, single male/father families (1,866 | 8.5%) represent the smallest median family size with 2.73 persons per family.
| Family Type | # Families | Family Size |
| Married-Couple | 15,233 (69.6%) | 3.00 |
| Single Male/Father | 1,866 (8.5%) | 2.73 |
| Single Female/Mother | 4,794 (21.9%) | 2.85 |
| Total Families | 21,893 (100.0%) | 2.95 |
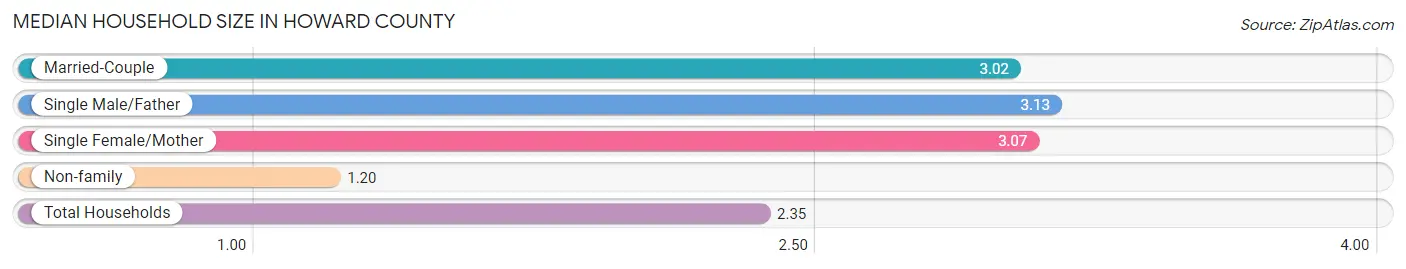
Median Household Size in Howard County
The median household size in Howard County is 2.35 persons per household, with single male/father households (1,866 | 5.3%) accounting for the largest median household size of 3.13 persons per household. non-family households (13,064 | 37.4%) represent the smallest median household size with 1.20 persons per household.
| Household Type | # Households | Household Size |
| Married-Couple | 15,233 (43.6%) | 3.02 |
| Single Male/Father | 1,866 (5.3%) | 3.13 |
| Single Female/Mother | 4,794 (13.7%) | 3.07 |
| Non-family | 13,064 (37.4%) | 1.20 |
| Total Households | 34,957 (100.0%) | 2.35 |
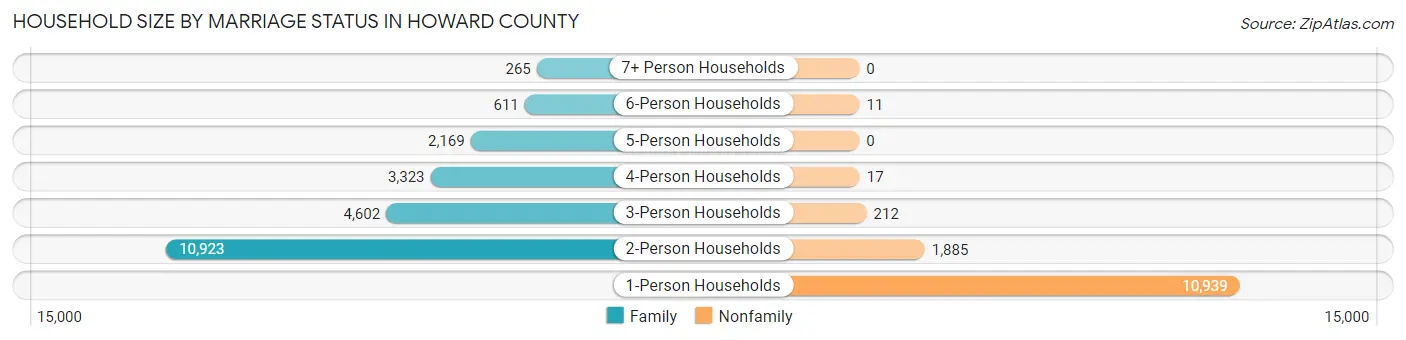
Household Size by Marriage Status in Howard County
Out of a total of 34,957 households in Howard County, 21,893 (62.6%) are family households, while 13,064 (37.4%) are nonfamily households. The most numerous type of family households are 2-person households, comprising 10,923, and the most common type of nonfamily households are 1-person households, comprising 10,939.
| Household Size | Family Households | Nonfamily Households |
| 1-Person Households | - | 10,939 (31.3%) |
| 2-Person Households | 10,923 (31.2%) | 1,885 (5.4%) |
| 3-Person Households | 4,602 (13.2%) | 212 (0.6%) |
| 4-Person Households | 3,323 (9.5%) | 17 (0.1%) |
| 5-Person Households | 2,169 (6.2%) | 0 (0.0%) |
| 6-Person Households | 611 (1.8%) | 11 (0.0%) |
| 7+ Person Households | 265 (0.8%) | 0 (0.0%) |
| Total | 21,893 (62.6%) | 13,064 (37.4%) |
Female Fertility in Howard County
Fertility by Age in Howard County
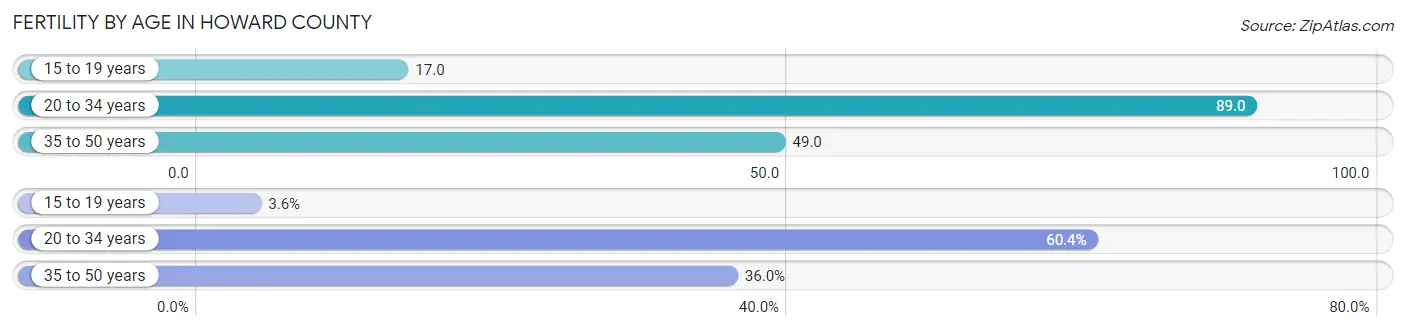
Average fertility rate in Howard County is 61.0 births per 1,000 women. Women in the age bracket of 20 to 34 years have the highest fertility rate with 89.0 births per 1,000 women. Women in the age bracket of 20 to 34 years acount for 60.4% of all women with births.
| Age Bracket | Women with Births | Births / 1,000 Women |
| 15 to 19 years | 40 (3.6%) | 17.0 |
| 20 to 34 years | 667 (60.4%) | 89.0 |
| 35 to 50 years | 397 (36.0%) | 49.0 |
| Total | 1,104 (100.0%) | 61.0 |
Fertility by Age by Marriage Status in Howard County
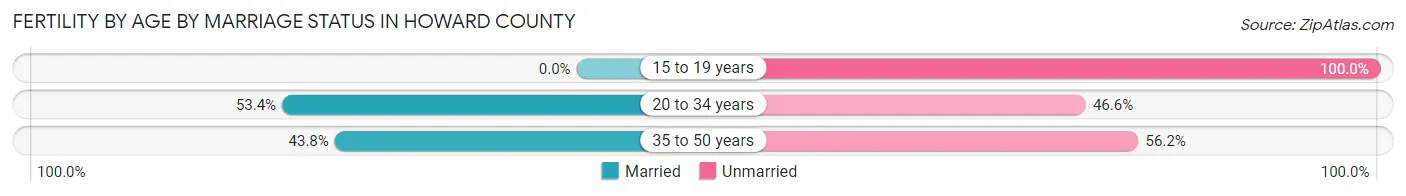
48.0% of women with births (1,104) in Howard County are married. The highest percentage of unmarried women with births falls into 15 to 19 years age bracket with 100.0% of them unmarried at the time of birth, while the lowest percentage of unmarried women with births belong to 20 to 34 years age bracket with 46.6% of them unmarried.
| Age Bracket | Married | Unmarried |
| 15 to 19 years | 0 (0.0%) | 40 (100.0%) |
| 20 to 34 years | 356 (53.4%) | 311 (46.6%) |
| 35 to 50 years | 174 (43.8%) | 223 (56.2%) |
| Total | 530 (48.0%) | 574 (52.0%) |
Fertility by Education in Howard County
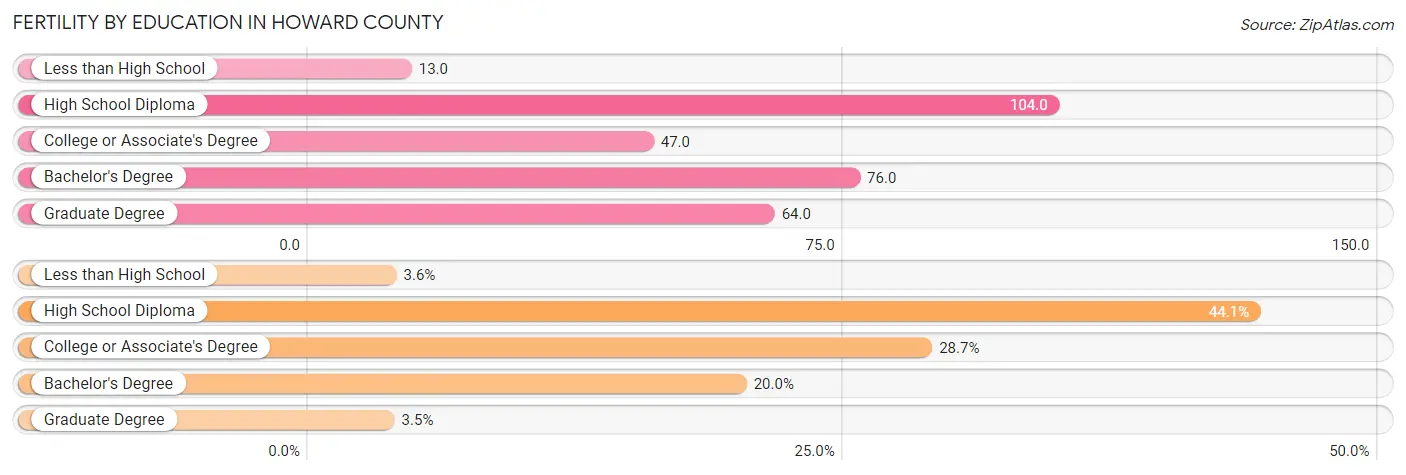
Average fertility rate in Howard County is 61.0 births per 1,000 women. Women with the education attainment of high school diploma have the highest fertility rate of 104.0 births per 1,000 women, while women with the education attainment of less than high school have the lowest fertility at 13.0 births per 1,000 women. Women with the education attainment of high school diploma represent 44.1% of all women with births.
| Educational Attainment | Women with Births | Births / 1,000 Women |
| Less than High School | 40 (3.6%) | 13.0 |
| High School Diploma | 487 (44.1%) | 104.0 |
| College or Associate's Degree | 317 (28.7%) | 47.0 |
| Bachelor's Degree | 221 (20.0%) | 76.0 |
| Graduate Degree | 39 (3.5%) | 64.0 |
| Total | 1,104 (100.0%) | 61.0 |
Fertility by Education by Marriage Status in Howard County
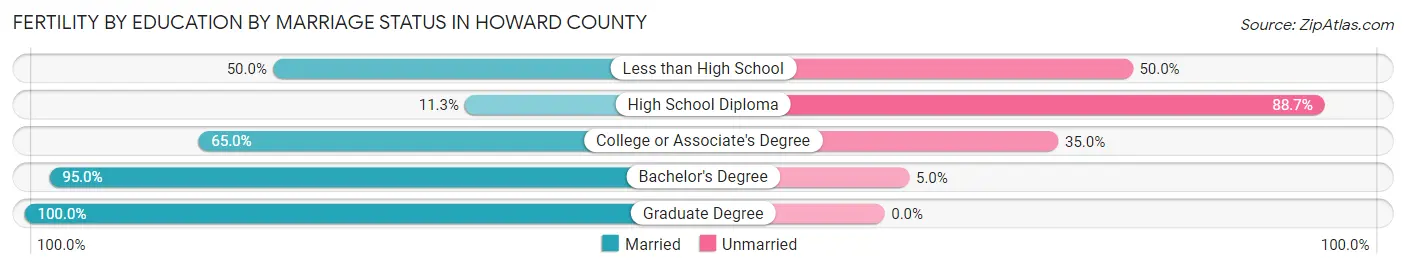
52.0% of women with births in Howard County are unmarried. Women with the educational attainment of graduate degree are most likely to be married with 100.0% of them married at childbirth, while women with the educational attainment of high school diploma are least likely to be married with 88.7% of them unmarried at childbirth.
| Educational Attainment | Married | Unmarried |
| Less than High School | 20 (50.0%) | 20 (50.0%) |
| High School Diploma | 55 (11.3%) | 432 (88.7%) |
| College or Associate's Degree | 206 (65.0%) | 111 (35.0%) |
| Bachelor's Degree | 210 (95.0%) | 11 (5.0%) |
| Graduate Degree | 39 (100.0%) | 0 (0.0%) |
| Total | 530 (48.0%) | 574 (52.0%) |
Income in Howard County
Income Overview in Howard County
Per Capita Income in Howard County is $33,391, while median incomes of families and households are $79,222 and $62,014 respectively.
| Characteristic | Number | Measure |
| Per Capita Income | 83,452 | $33,391 |
| Median Family Income | 21,893 | $79,222 |
| Mean Family Income | 21,893 | $93,988 |
| Median Household Income | 34,957 | $62,014 |
| Mean Household Income | 34,957 | $78,616 |
| Income Deficit | 21,893 | $10,368 |
| Wage / Income Gap (%) | 83,452 | 31.42% |
| Wage / Income Gap ($) | 83,452 | 68.58¢ per $1 |
| Gini / Inequality Index | 83,452 | 0.42 |
Earnings by Sex in Howard County
Average Earnings in Howard County are $36,846, $46,966 for men and $32,209 for women, a difference of 31.4%.
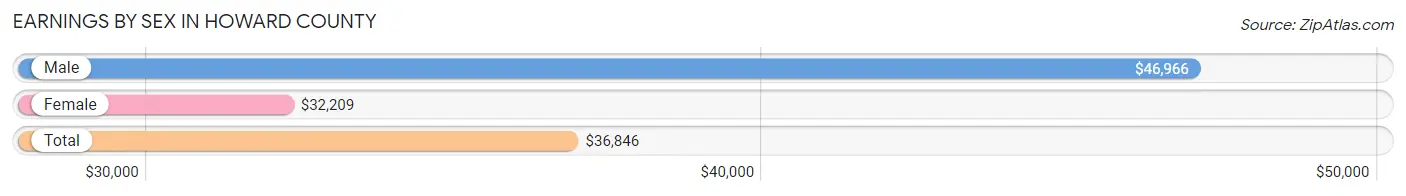
| Sex | Number | Average Earnings |
| Male | 21,085 (50.4%) | $46,966 |
| Female | 20,710 (49.5%) | $32,209 |
| Total | 41,795 (100.0%) | $36,846 |
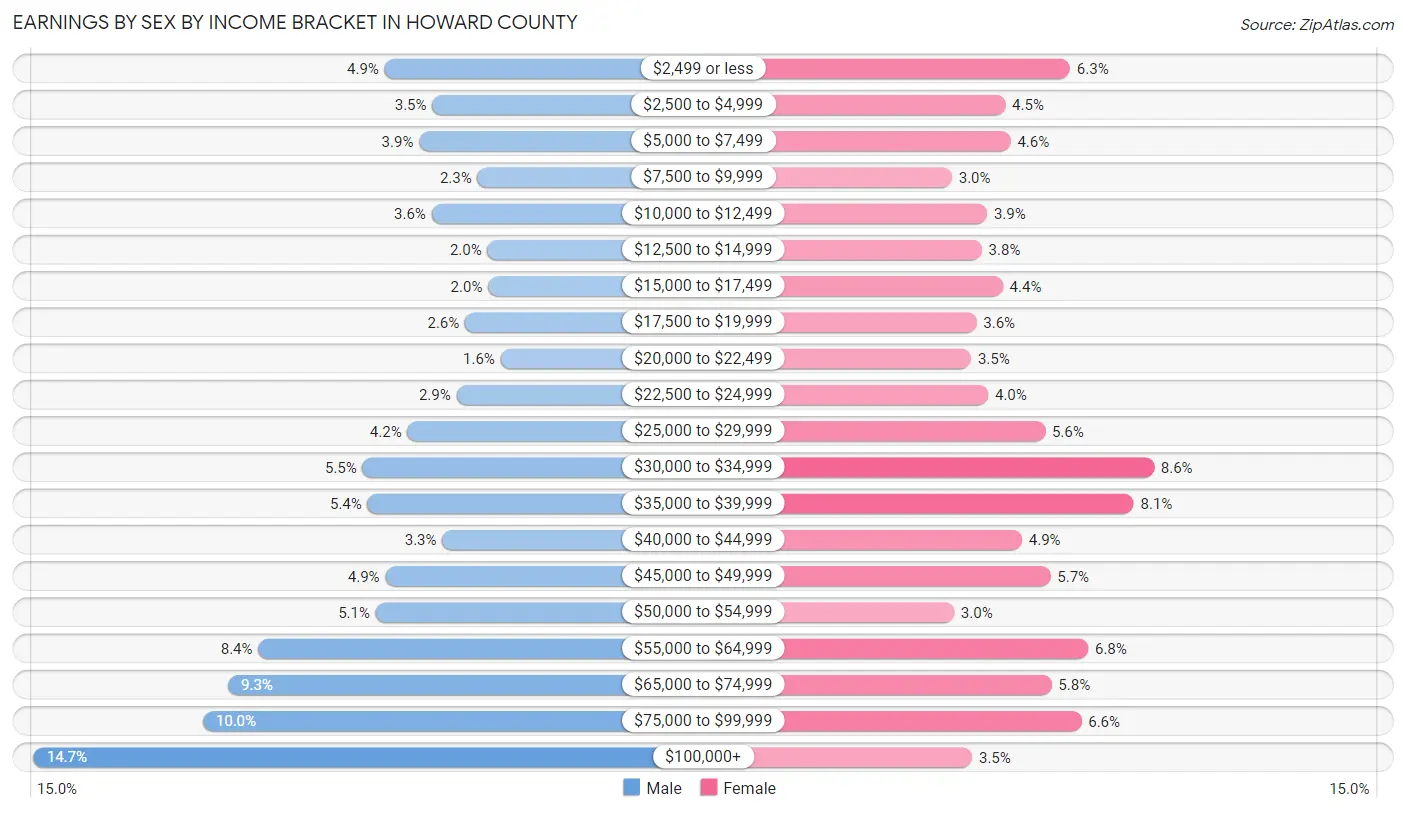
Earnings by Sex by Income Bracket in Howard County
The most common earnings brackets in Howard County are $100,000+ for men (3,107 | 14.7%) and $30,000 to $34,999 for women (1,787 | 8.6%).
| Income | Male | Female |
| $2,499 or less | 1,029 (4.9%) | 1,298 (6.3%) |
| $2,500 to $4,999 | 747 (3.5%) | 921 (4.4%) |
| $5,000 to $7,499 | 824 (3.9%) | 952 (4.6%) |
| $7,500 to $9,999 | 478 (2.3%) | 611 (2.9%) |
| $10,000 to $12,499 | 750 (3.6%) | 816 (3.9%) |
| $12,500 to $14,999 | 420 (2.0%) | 784 (3.8%) |
| $15,000 to $17,499 | 416 (2.0%) | 907 (4.4%) |
| $17,500 to $19,999 | 552 (2.6%) | 753 (3.6%) |
| $20,000 to $22,499 | 342 (1.6%) | 723 (3.5%) |
| $22,500 to $24,999 | 603 (2.9%) | 822 (4.0%) |
| $25,000 to $29,999 | 893 (4.2%) | 1,153 (5.6%) |
| $30,000 to $34,999 | 1,159 (5.5%) | 1,787 (8.6%) |
| $35,000 to $39,999 | 1,131 (5.4%) | 1,670 (8.1%) |
| $40,000 to $44,999 | 688 (3.3%) | 1,018 (4.9%) |
| $45,000 to $49,999 | 1,024 (4.9%) | 1,184 (5.7%) |
| $50,000 to $54,999 | 1,081 (5.1%) | 624 (3.0%) |
| $55,000 to $64,999 | 1,778 (8.4%) | 1,404 (6.8%) |
| $65,000 to $74,999 | 1,957 (9.3%) | 1,191 (5.8%) |
| $75,000 to $99,999 | 2,106 (10.0%) | 1,364 (6.6%) |
| $100,000+ | 3,107 (14.7%) | 728 (3.5%) |
| Total | 21,085 (100.0%) | 20,710 (100.0%) |
Earnings by Sex by Educational Attainment in Howard County
Average earnings in Howard County are $54,034 for men and $34,901 for women, a difference of 35.4%. Men with an educational attainment of bachelor's degree enjoy the highest average annual earnings of $80,603, while those with less than high school education earn the least with $24,034. Women with an educational attainment of graduate degree earn the most with the average annual earnings of $56,768, while those with high school diploma education have the smallest earnings of $27,674.
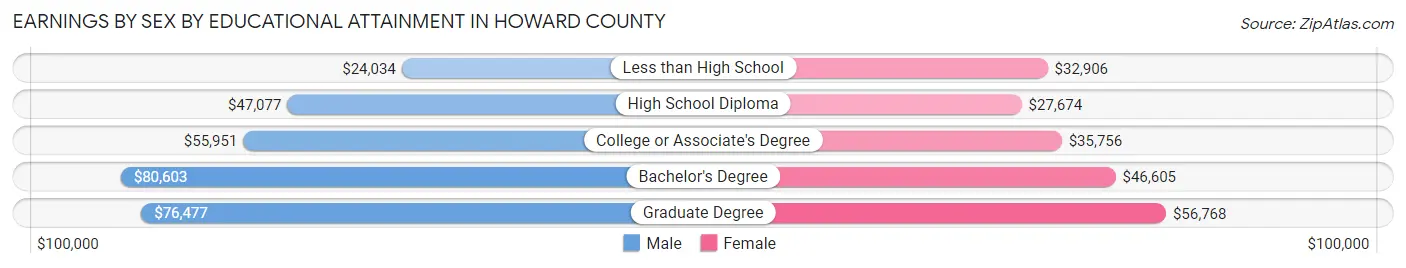
| Educational Attainment | Male Income | Female Income |
| Less than High School | $24,034 | $32,906 |
| High School Diploma | $47,077 | $27,674 |
| College or Associate's Degree | $55,951 | $35,756 |
| Bachelor's Degree | $80,603 | $46,605 |
| Graduate Degree | $76,477 | $56,768 |
| Total | $54,034 | $34,901 |
Family Income in Howard County
Family Income Brackets in Howard County
According to the Howard County family income data, there are 5,211 families falling into the $100,000 to $149,999 income range, which is the most common income bracket and makes up 23.8% of all families. Conversely, the $10,000 to $14,999 income bracket is the least frequent group with only 416 families (1.9%) belonging to this category.
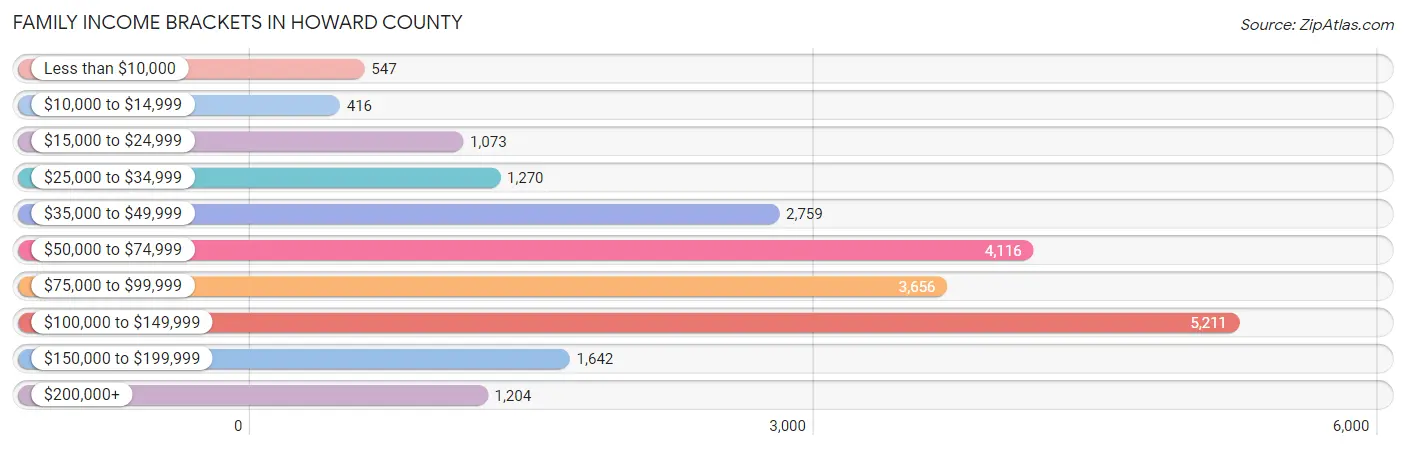
| Income Bracket | # Families | % Families |
| Less than $10,000 | 547 | 2.5% |
| $10,000 to $14,999 | 416 | 1.9% |
| $15,000 to $24,999 | 1,073 | 4.9% |
| $25,000 to $34,999 | 1,270 | 5.8% |
| $35,000 to $49,999 | 2,759 | 12.6% |
| $50,000 to $74,999 | 4,116 | 18.8% |
| $75,000 to $99,999 | 3,656 | 16.7% |
| $100,000 to $149,999 | 5,211 | 23.8% |
| $150,000 to $199,999 | 1,642 | 7.5% |
| $200,000+ | 1,204 | 5.5% |
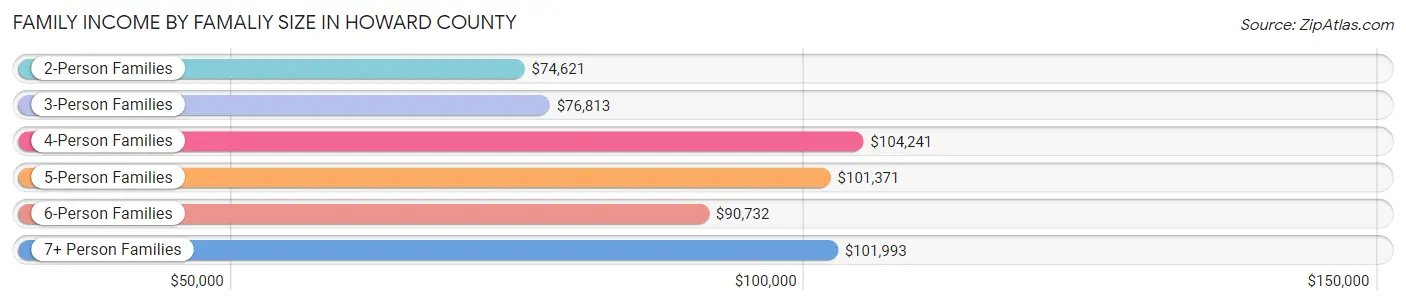
Family Income by Famaliy Size in Howard County
4-person families (2,962 | 13.5%) account for the highest median family income in Howard County with $104,241 per family, while 2-person families (11,612 | 53.0%) have the highest median income of $37,310 per family member.
| Income Bracket | # Families | Median Income |
| 2-Person Families | 11,612 (53.0%) | $74,621 |
| 3-Person Families | 4,543 (20.7%) | $76,813 |
| 4-Person Families | 2,962 (13.5%) | $104,241 |
| 5-Person Families | 2,116 (9.7%) | $101,371 |
| 6-Person Families | 489 (2.2%) | $90,732 |
| 7+ Person Families | 171 (0.8%) | $101,993 |
| Total | 21,893 (100.0%) | $79,222 |
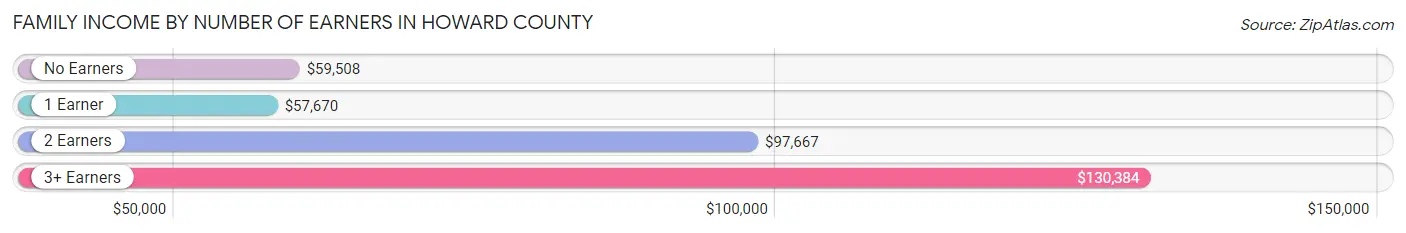
Family Income by Number of Earners in Howard County
The median family income in Howard County is $79,222, with families comprising 3+ earners (2,457) having the highest median family income of $130,384, while families with 1 earner (7,322) have the lowest median family income of $57,670, accounting for 11.2% and 33.4% of families, respectively.
| Number of Earners | # Families | Median Income |
| No Earners | 4,217 (19.3%) | $59,508 |
| 1 Earner | 7,322 (33.4%) | $57,670 |
| 2 Earners | 7,897 (36.1%) | $97,667 |
| 3+ Earners | 2,457 (11.2%) | $130,384 |
| Total | 21,893 (100.0%) | $79,222 |
Household Income in Howard County
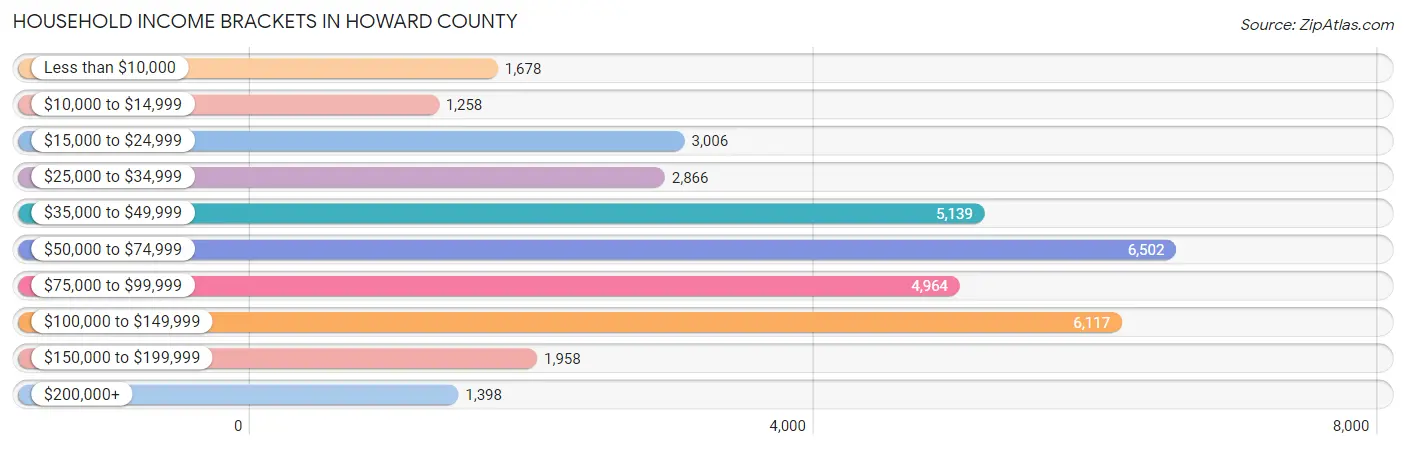
Household Income Brackets in Howard County
With 6,502 households falling in the category, the $50,000 to $74,999 income range is the most frequent in Howard County, accounting for 18.6% of all households. In contrast, only 1,258 households (3.6%) fall into the $10,000 to $14,999 income bracket, making it the least populous group.
| Income Bracket | # Households | % Households |
| Less than $10,000 | 1,678 | 4.8% |
| $10,000 to $14,999 | 1,258 | 3.6% |
| $15,000 to $24,999 | 3,006 | 8.6% |
| $25,000 to $34,999 | 2,866 | 8.2% |
| $35,000 to $49,999 | 5,139 | 14.7% |
| $50,000 to $74,999 | 6,502 | 18.6% |
| $75,000 to $99,999 | 4,964 | 14.2% |
| $100,000 to $149,999 | 6,117 | 17.5% |
| $150,000 to $199,999 | 1,958 | 5.6% |
| $200,000+ | 1,398 | 4.0% |
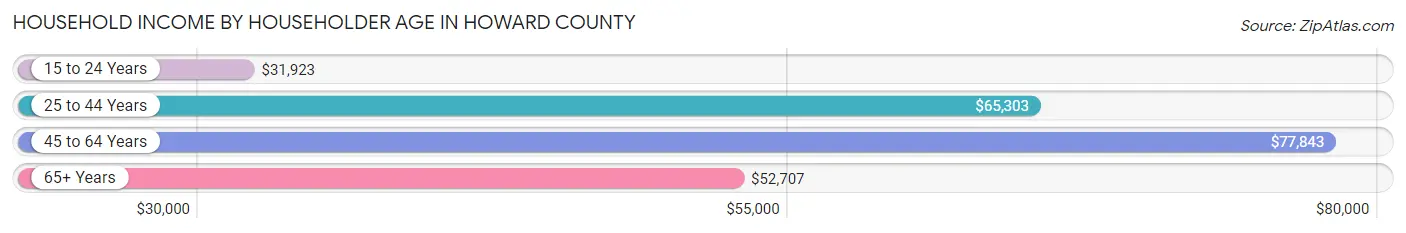
Household Income by Householder Age in Howard County
The median household income in Howard County is $62,014, with the highest median household income of $77,843 found in the 45 to 64 years age bracket for the primary householder. A total of 12,789 households (36.6%) fall into this category. Meanwhile, the 15 to 24 years age bracket for the primary householder has the lowest median household income of $31,923, with 1,138 households (3.3%) in this group.
| Income Bracket | # Households | Median Income |
| 15 to 24 Years | 1,138 (3.3%) | $31,923 |
| 25 to 44 Years | 10,003 (28.6%) | $65,303 |
| 45 to 64 Years | 12,789 (36.6%) | $77,843 |
| 65+ Years | 11,027 (31.5%) | $52,707 |
| Total | 34,957 (100.0%) | $62,014 |
Poverty in Howard County
Income Below Poverty by Sex and Age in Howard County
With 11.3% poverty level for males and 12.9% for females among the residents of Howard County, under 5 year old males and 6 to 11 year old females are the most vulnerable to poverty, with 497 males (19.9%) and 633 females (20.1%) in their respective age groups living below the poverty level.
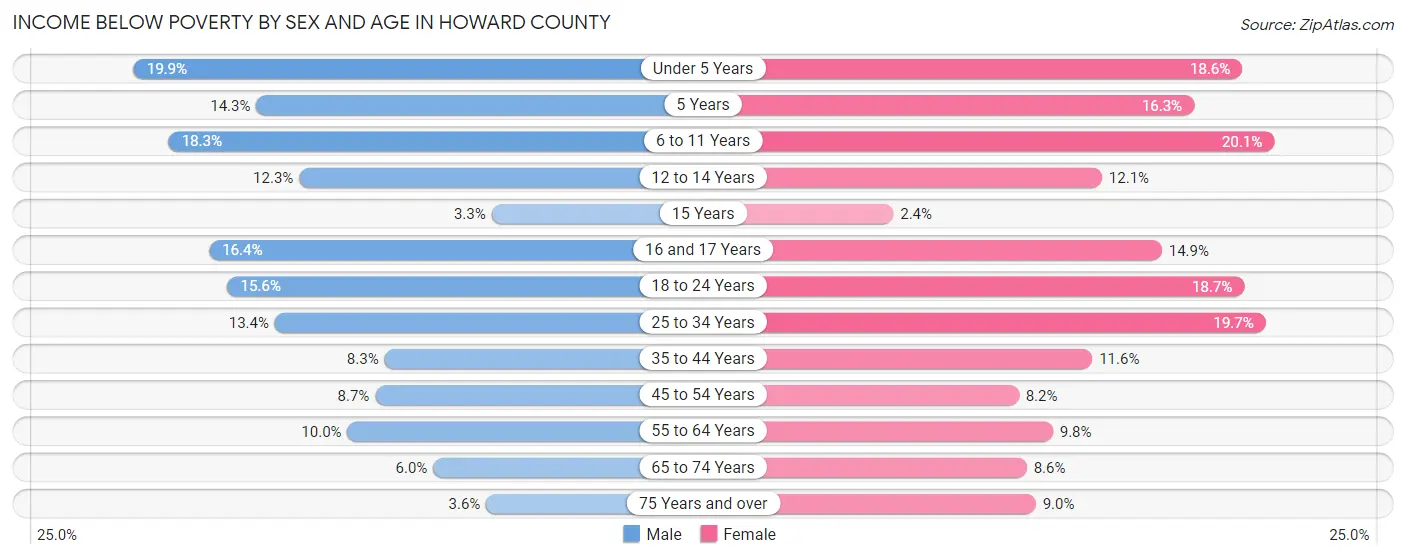
| Age Bracket | Male | Female |
| Under 5 Years | 497 (19.9%) | 415 (18.6%) |
| 5 Years | 64 (14.2%) | 74 (16.3%) |
| 6 to 11 Years | 597 (18.3%) | 633 (20.1%) |
| 12 to 14 Years | 208 (12.3%) | 172 (12.1%) |
| 15 Years | 17 (3.3%) | 13 (2.4%) |
| 16 and 17 Years | 200 (16.4%) | 158 (14.8%) |
| 18 to 24 Years | 546 (15.6%) | 607 (18.7%) |
| 25 to 34 Years | 686 (13.4%) | 974 (19.7%) |
| 35 to 44 Years | 366 (8.3%) | 561 (11.6%) |
| 45 to 54 Years | 430 (8.7%) | 432 (8.2%) |
| 55 to 64 Years | 533 (10.0%) | 605 (9.8%) |
| 65 to 74 Years | 250 (6.0%) | 420 (8.6%) |
| 75 Years and over | 100 (3.6%) | 352 (9.0%) |
| Total | 4,494 (11.3%) | 5,416 (12.9%) |
Income Above Poverty by Sex and Age in Howard County
According to the poverty statistics in Howard County, males aged 15 years and females aged 15 years are the age groups that are most secure financially, with 96.7% of males and 97.6% of females in these age groups living above the poverty line.
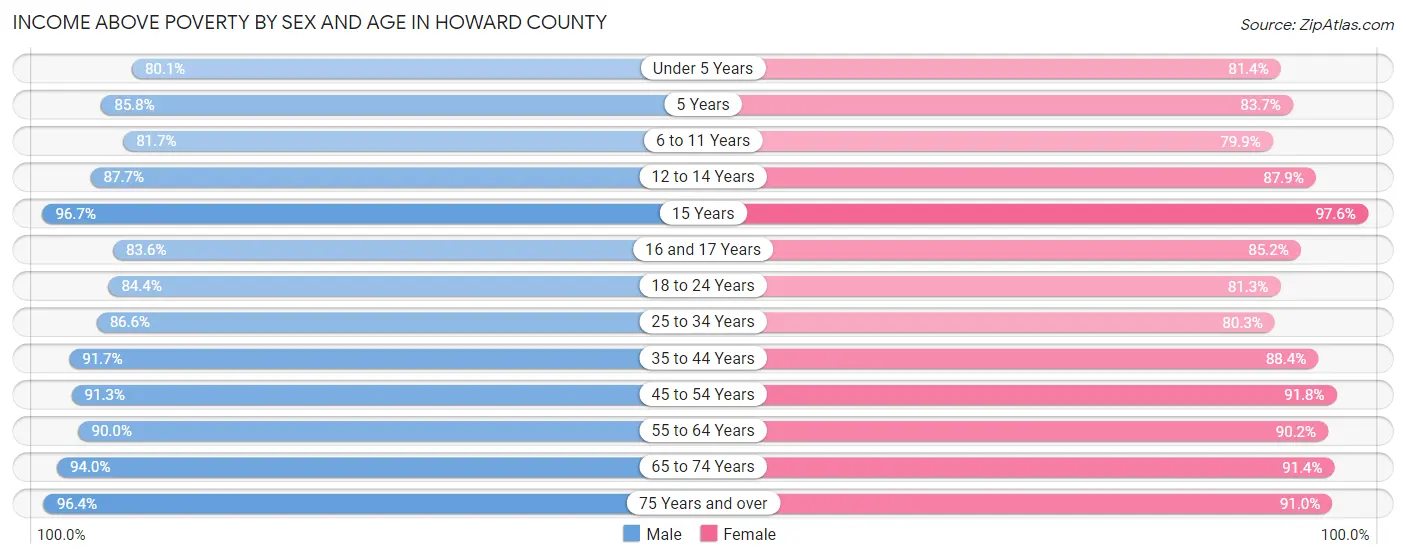
| Age Bracket | Male | Female |
| Under 5 Years | 1,997 (80.1%) | 1,820 (81.4%) |
| 5 Years | 385 (85.8%) | 379 (83.7%) |
| 6 to 11 Years | 2,663 (81.7%) | 2,523 (79.9%) |
| 12 to 14 Years | 1,488 (87.7%) | 1,253 (87.9%) |
| 15 Years | 493 (96.7%) | 530 (97.6%) |
| 16 and 17 Years | 1,017 (83.6%) | 906 (85.2%) |
| 18 to 24 Years | 2,958 (84.4%) | 2,645 (81.3%) |
| 25 to 34 Years | 4,439 (86.6%) | 3,980 (80.3%) |
| 35 to 44 Years | 4,041 (91.7%) | 4,266 (88.4%) |
| 45 to 54 Years | 4,493 (91.3%) | 4,831 (91.8%) |
| 55 to 64 Years | 4,788 (90.0%) | 5,573 (90.2%) |
| 65 to 74 Years | 3,892 (94.0%) | 4,475 (91.4%) |
| 75 Years and over | 2,696 (96.4%) | 3,558 (91.0%) |
| Total | 35,350 (88.7%) | 36,739 (87.2%) |
Income Below Poverty Among Married-Couple Families in Howard County
The poverty statistics for married-couple families in Howard County show that 3.1% or 469 of the total 15,233 families live below the poverty line. Families with 3 or 4 children have the highest poverty rate of 13.9%, comprising of 187 families. On the other hand, families with 5 or more children have the lowest poverty rate of 0.0%, which includes 0 families.
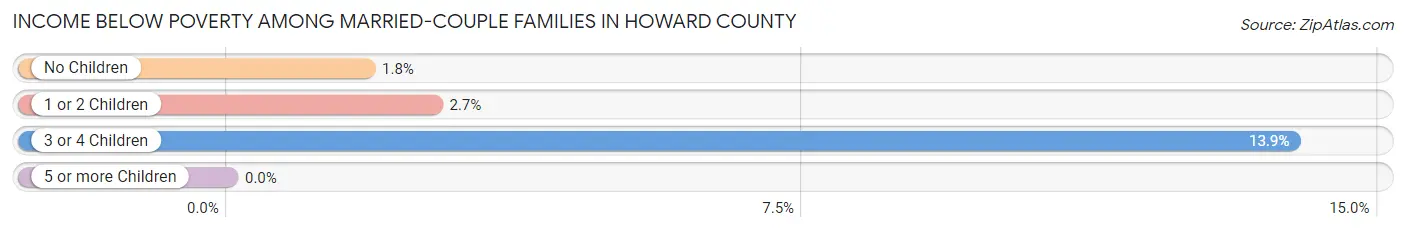
| Children | Above Poverty | Below Poverty |
| No Children | 9,692 (98.2%) | 177 (1.8%) |
| 1 or 2 Children | 3,832 (97.3%) | 105 (2.7%) |
| 3 or 4 Children | 1,160 (86.1%) | 187 (13.9%) |
| 5 or more Children | 80 (100.0%) | 0 (0.0%) |
| Total | 14,764 (96.9%) | 469 (3.1%) |
Income Below Poverty Among Single-Parent Households in Howard County
According to the poverty data in Howard County, 15.1% or 282 single-father households and 23.9% or 1,144 single-mother households are living below the poverty line. Among single-father households, those with 3 or 4 children have the highest poverty rate, with 50 households (26.2%) experiencing poverty. Likewise, among single-mother households, those with 3 or 4 children have the highest poverty rate, with 198 households (51.0%) falling below the poverty line.
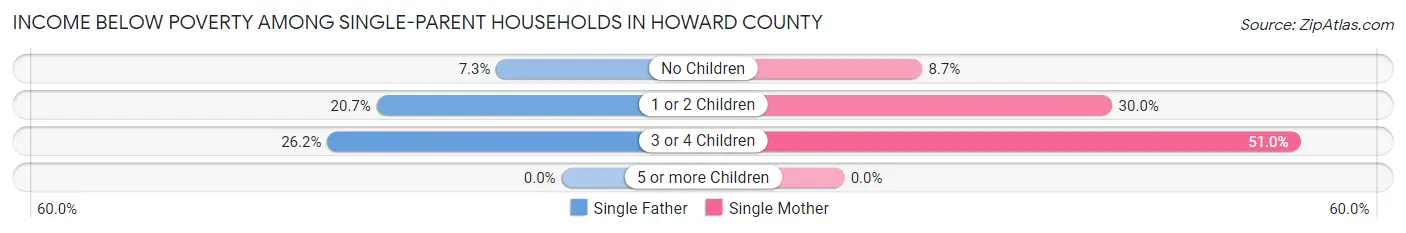
| Children | Single Father | Single Mother |
| No Children | 62 (7.3%) | 150 (8.7%) |
| 1 or 2 Children | 170 (20.7%) | 796 (29.9%) |
| 3 or 4 Children | 50 (26.2%) | 198 (51.0%) |
| 5 or more Children | 0 (0.0%) | 0 (0.0%) |
| Total | 282 (15.1%) | 1,144 (23.9%) |
Income Below Poverty Among Married-Couple vs Single-Parent Households in Howard County
The poverty data for Howard County shows that 469 of the married-couple family households (3.1%) and 1,426 of the single-parent households (21.4%) are living below the poverty level. Within the married-couple family households, those with 3 or 4 children have the highest poverty rate, with 187 households (13.9%) falling below the poverty line. Among the single-parent households, those with 3 or 4 children have the highest poverty rate, with 248 household (42.8%) living below poverty.
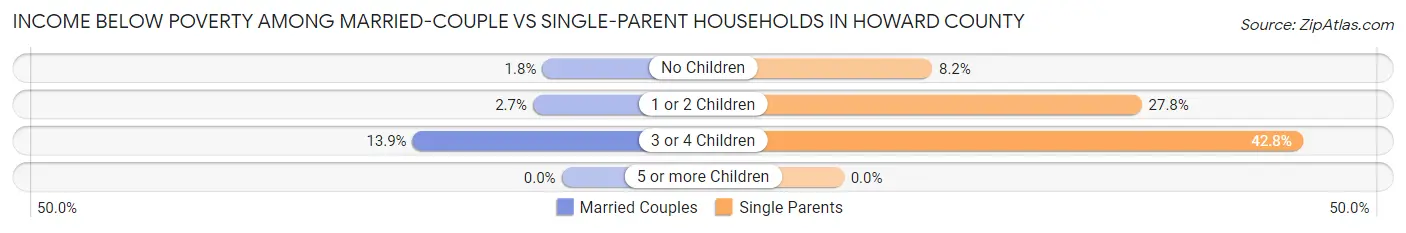
| Children | Married-Couple Families | Single-Parent Households |
| No Children | 177 (1.8%) | 212 (8.2%) |
| 1 or 2 Children | 105 (2.7%) | 966 (27.8%) |
| 3 or 4 Children | 187 (13.9%) | 248 (42.8%) |
| 5 or more Children | 0 (0.0%) | 0 (0.0%) |
| Total | 469 (3.1%) | 1,426 (21.4%) |
Employment Characteristics in Howard County
Employment by Class of Employer in Howard County
Among the 36,245 employed individuals in Howard County, private company employees (26,499 | 73.1%), not-for-profit organizations (2,860 | 7.9%), and local government employees (2,666 | 7.4%) make up the most common classes of employment.
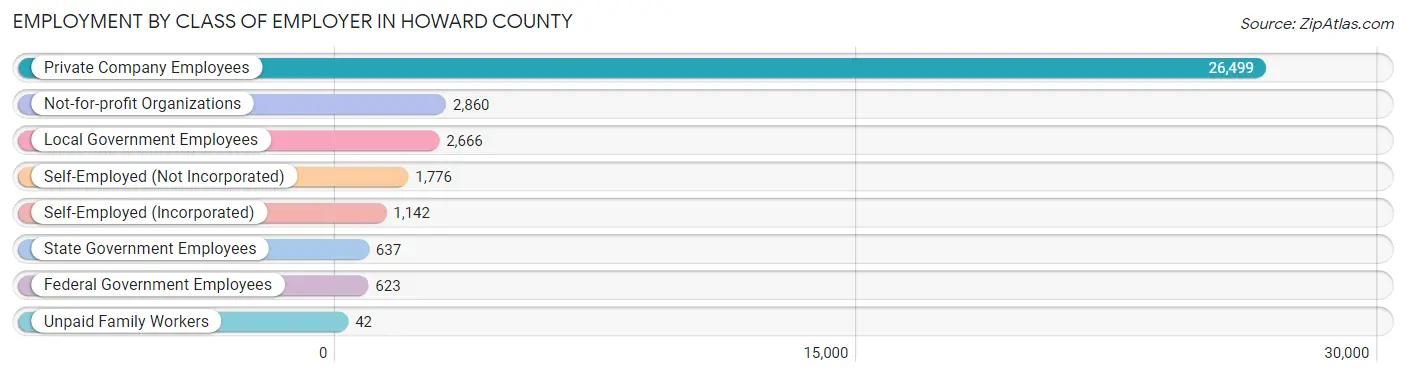
| Employer Class | # Employees | % Employees |
| Private Company Employees | 26,499 | 73.1% |
| Self-Employed (Incorporated) | 1,142 | 3.2% |
| Self-Employed (Not Incorporated) | 1,776 | 4.9% |
| Not-for-profit Organizations | 2,860 | 7.9% |
| Local Government Employees | 2,666 | 7.4% |
| State Government Employees | 637 | 1.8% |
| Federal Government Employees | 623 | 1.7% |
| Unpaid Family Workers | 42 | 0.1% |
| Total | 36,245 | 100.0% |
Employment Status by Age in Howard County
According to the labor force statistics for Howard County, out of the total population over 16 years of age (66,758), 59.4% or 39,654 individuals are in the labor force, with 5.8% or 2,300 of them unemployed. The age group with the highest labor force participation rate is 25 to 29 years, with 86.8% or 4,659 individuals in the labor force. Within the labor force, the 20 to 24 years age range has the highest percentage of unemployed individuals, with 21.7% or 894 of them being unemployed.
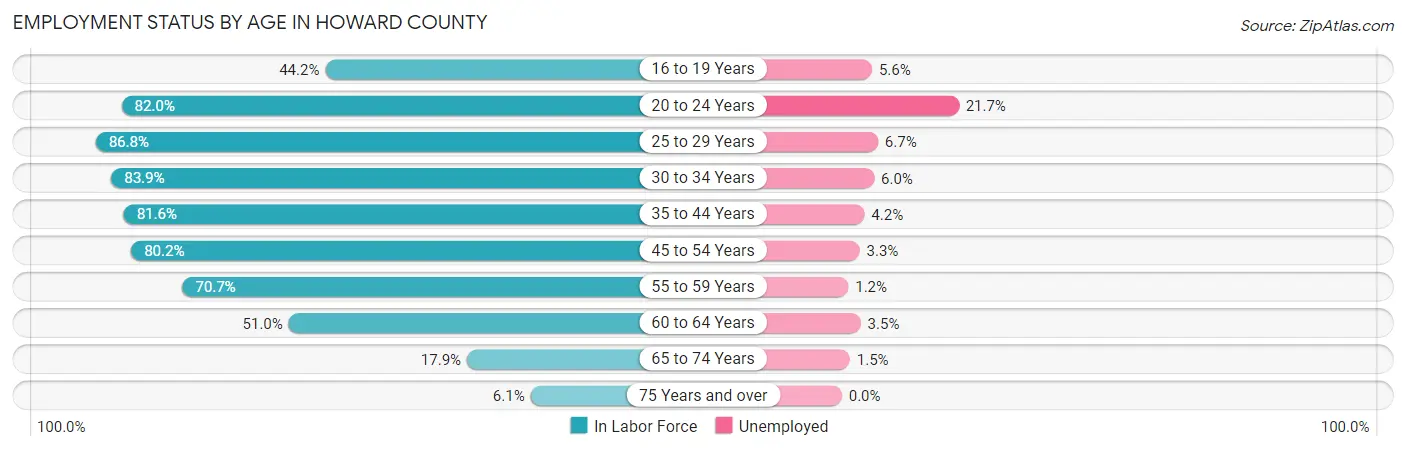
| Age Bracket | In Labor Force | Unemployed |
| 16 to 19 Years | 1,792 (44.2%) | 100 (5.6%) |
| 20 to 24 Years | 4,120 (82.0%) | 894 (21.7%) |
| 25 to 29 Years | 4,659 (86.8%) | 312 (6.7%) |
| 30 to 34 Years | 4,117 (83.9%) | 247 (6.0%) |
| 35 to 44 Years | 7,646 (81.6%) | 321 (4.2%) |
| 45 to 54 Years | 8,231 (80.2%) | 272 (3.3%) |
| 55 to 59 Years | 4,057 (70.7%) | 49 (1.2%) |
| 60 to 64 Years | 2,981 (51.0%) | 104 (3.5%) |
| 65 to 74 Years | 1,645 (17.9%) | 25 (1.5%) |
| 75 Years and over | 427 (6.1%) | 0 (0.0%) |
| Total | 39,654 (59.4%) | 2,300 (5.8%) |
Employment Status by Educational Attainment in Howard County
According to labor force statistics for Howard County, 76.4% of individuals (31,699) out of the total population between 25 and 64 years of age (41,491) are in the labor force, with 4.1% or 1,300 of them being unemployed. The group with the highest labor force participation rate are those with the educational attainment of bachelor's degree or higher, with 89.7% or 7,485 individuals in the labor force. Within the labor force, individuals with less than high school education have the highest percentage of unemployment, with 13.3% or 224 of them being unemployed.
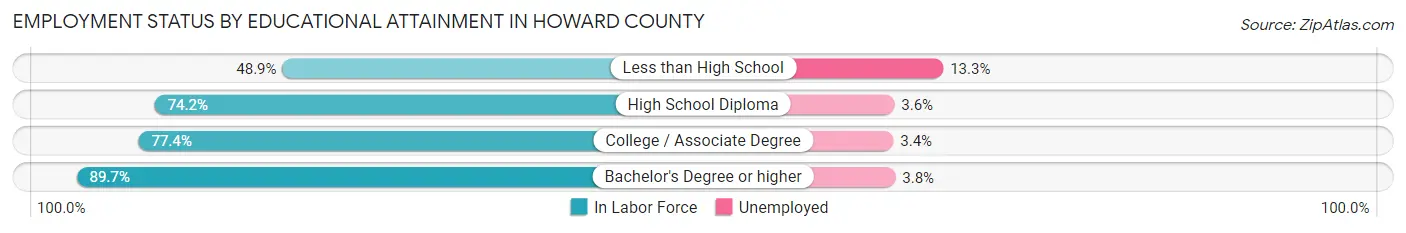
| Educational Attainment | In Labor Force | Unemployed |
| Less than High School | 1,686 (48.9%) | 459 (13.3%) |
| High School Diploma | 10,934 (74.2%) | 530 (3.6%) |
| College / Associate Degree | 11,581 (77.4%) | 509 (3.4%) |
| Bachelor's Degree or higher | 7,485 (89.7%) | 317 (3.8%) |
| Total | 31,699 (76.4%) | 1,701 (4.1%) |
Employment Occupations by Sex in Howard County
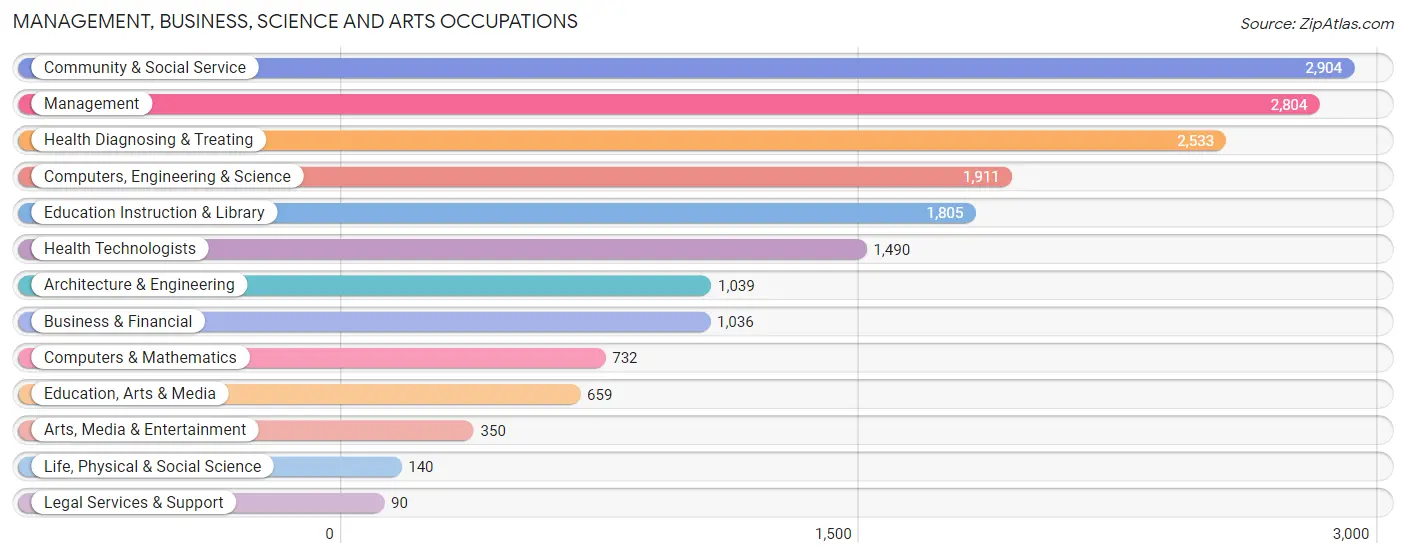
Management, Business, Science and Arts Occupations
The most common Management, Business, Science and Arts occupations in Howard County are Community & Social Service (2,904 | 7.8%), Management (2,804 | 7.5%), Health Diagnosing & Treating (2,533 | 6.8%), Computers, Engineering & Science (1,911 | 5.1%), and Education Instruction & Library (1,805 | 4.9%).
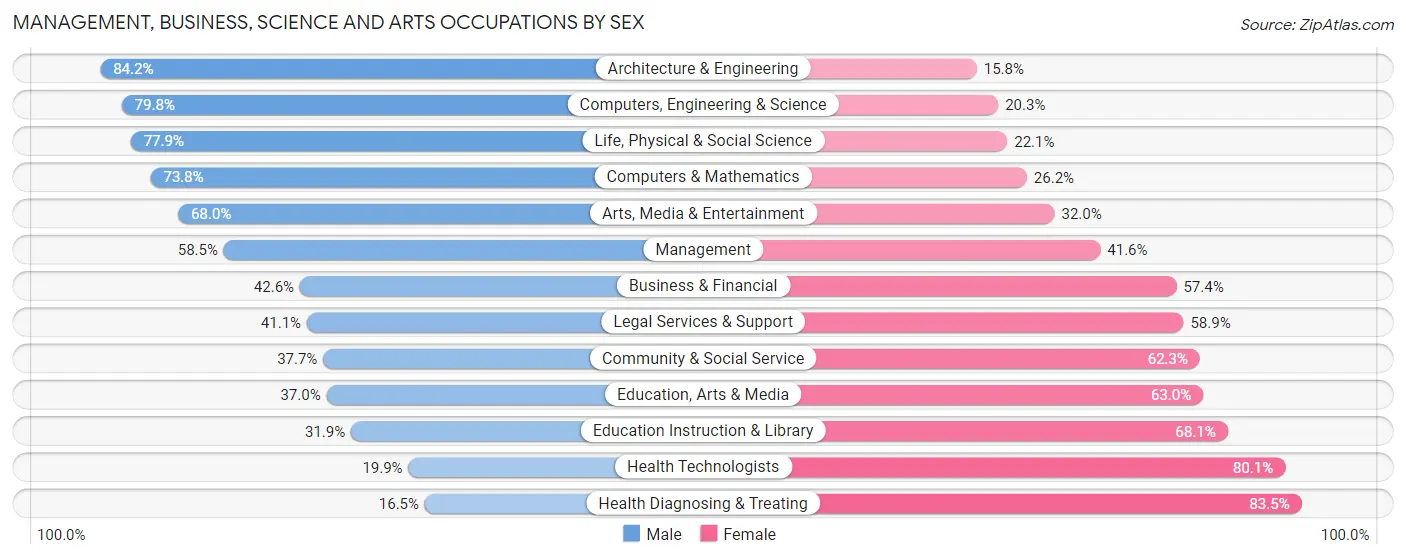
Management, Business, Science and Arts Occupations by Sex
Within the Management, Business, Science and Arts occupations in Howard County, the most male-oriented occupations are Architecture & Engineering (84.2%), Computers, Engineering & Science (79.7%), and Life, Physical & Social Science (77.9%), while the most female-oriented occupations are Health Diagnosing & Treating (83.5%), Health Technologists (80.1%), and Education Instruction & Library (68.1%).
| Occupation | Male | Female |
| Management | 1,639 (58.5%) | 1,165 (41.5%) |
| Business & Financial | 441 (42.6%) | 595 (57.4%) |
| Computers, Engineering & Science | 1,524 (79.7%) | 387 (20.3%) |
| Computers & Mathematics | 540 (73.8%) | 192 (26.2%) |
| Architecture & Engineering | 875 (84.2%) | 164 (15.8%) |
| Life, Physical & Social Science | 109 (77.9%) | 31 (22.1%) |
| Community & Social Service | 1,095 (37.7%) | 1,809 (62.3%) |
| Education, Arts & Media | 244 (37.0%) | 415 (63.0%) |
| Legal Services & Support | 37 (41.1%) | 53 (58.9%) |
| Education Instruction & Library | 576 (31.9%) | 1,229 (68.1%) |
| Arts, Media & Entertainment | 238 (68.0%) | 112 (32.0%) |
| Health Diagnosing & Treating | 418 (16.5%) | 2,115 (83.5%) |
| Health Technologists | 297 (19.9%) | 1,193 (80.1%) |
| Total (Category) | 5,117 (45.7%) | 6,071 (54.3%) |
| Total (Overall) | 18,684 (50.3%) | 18,473 (49.7%) |
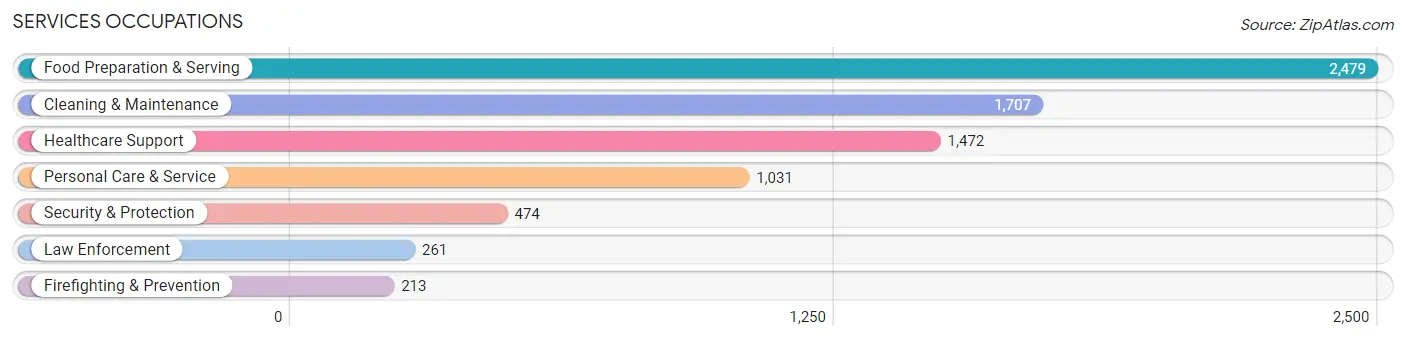
Services Occupations
The most common Services occupations in Howard County are Food Preparation & Serving (2,479 | 6.7%), Cleaning & Maintenance (1,707 | 4.6%), Healthcare Support (1,472 | 4.0%), Personal Care & Service (1,031 | 2.8%), and Security & Protection (474 | 1.3%).
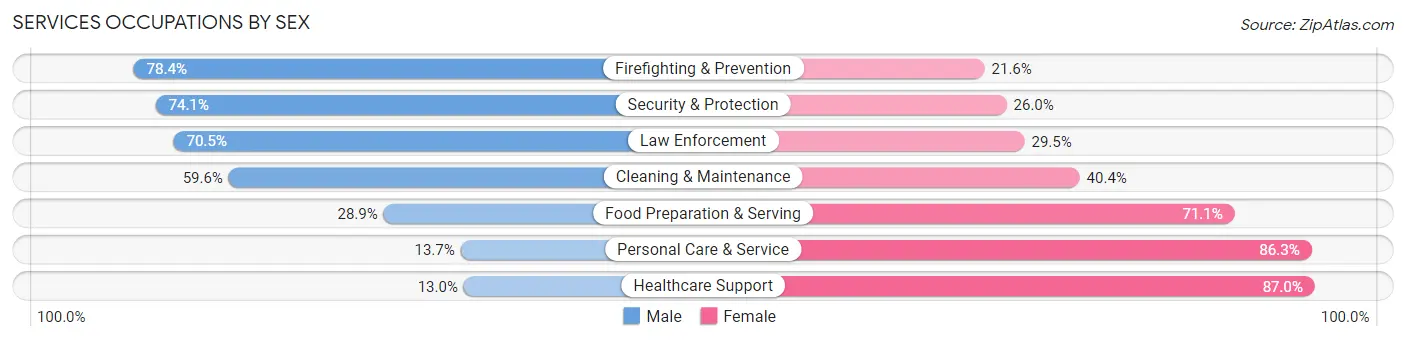
Services Occupations by Sex
Within the Services occupations in Howard County, the most male-oriented occupations are Firefighting & Prevention (78.4%), Security & Protection (74.1%), and Law Enforcement (70.5%), while the most female-oriented occupations are Healthcare Support (87.0%), Personal Care & Service (86.3%), and Food Preparation & Serving (71.1%).
| Occupation | Male | Female |
| Healthcare Support | 192 (13.0%) | 1,280 (87.0%) |
| Security & Protection | 351 (74.1%) | 123 (26.0%) |
| Firefighting & Prevention | 167 (78.4%) | 46 (21.6%) |
| Law Enforcement | 184 (70.5%) | 77 (29.5%) |
| Food Preparation & Serving | 717 (28.9%) | 1,762 (71.1%) |
| Cleaning & Maintenance | 1,017 (59.6%) | 690 (40.4%) |
| Personal Care & Service | 141 (13.7%) | 890 (86.3%) |
| Total (Category) | 2,418 (33.8%) | 4,745 (66.2%) |
| Total (Overall) | 18,684 (50.3%) | 18,473 (49.7%) |
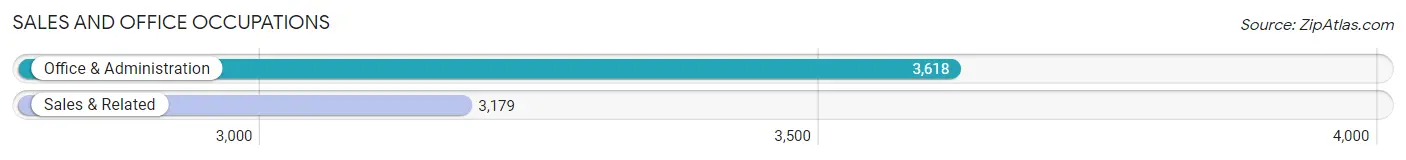
Sales and Office Occupations
The most common Sales and Office occupations in Howard County are Office & Administration (3,618 | 9.7%), and Sales & Related (3,179 | 8.6%).
Sales and Office Occupations by Sex
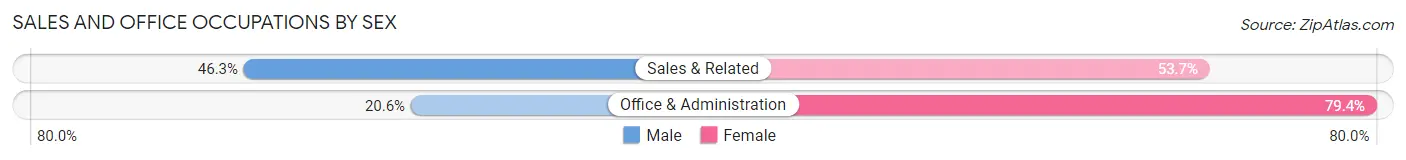
| Occupation | Male | Female |
| Sales & Related | 1,471 (46.3%) | 1,708 (53.7%) |
| Office & Administration | 744 (20.6%) | 2,874 (79.4%) |
| Total (Category) | 2,215 (32.6%) | 4,582 (67.4%) |
| Total (Overall) | 18,684 (50.3%) | 18,473 (49.7%) |
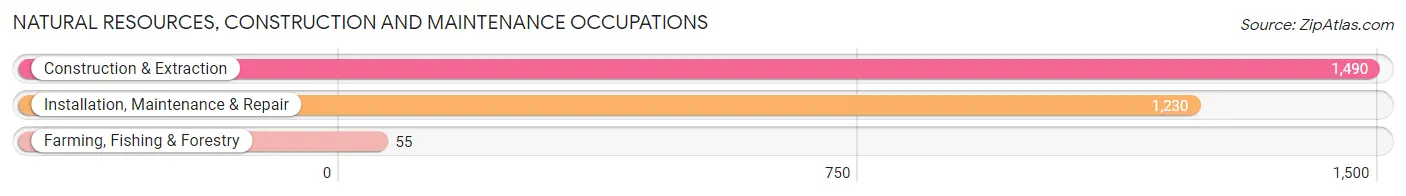
Natural Resources, Construction and Maintenance Occupations
The most common Natural Resources, Construction and Maintenance occupations in Howard County are Construction & Extraction (1,490 | 4.0%), Installation, Maintenance & Repair (1,230 | 3.3%), and Farming, Fishing & Forestry (55 | 0.2%).
Natural Resources, Construction and Maintenance Occupations by Sex
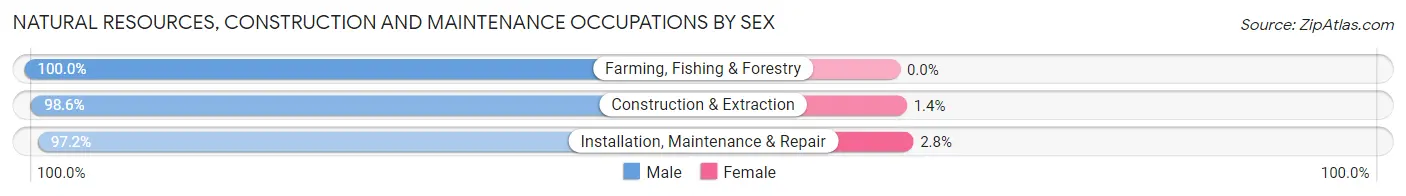
| Occupation | Male | Female |
| Farming, Fishing & Forestry | 55 (100.0%) | 0 (0.0%) |
| Construction & Extraction | 1,469 (98.6%) | 21 (1.4%) |
| Installation, Maintenance & Repair | 1,196 (97.2%) | 34 (2.8%) |
| Total (Category) | 2,720 (98.0%) | 55 (2.0%) |
| Total (Overall) | 18,684 (50.3%) | 18,473 (49.7%) |
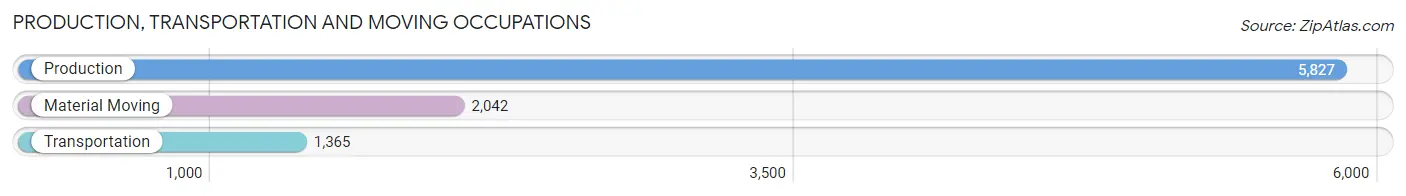
Production, Transportation and Moving Occupations
The most common Production, Transportation and Moving occupations in Howard County are Production (5,827 | 15.7%), Material Moving (2,042 | 5.5%), and Transportation (1,365 | 3.7%).
Production, Transportation and Moving Occupations by Sex
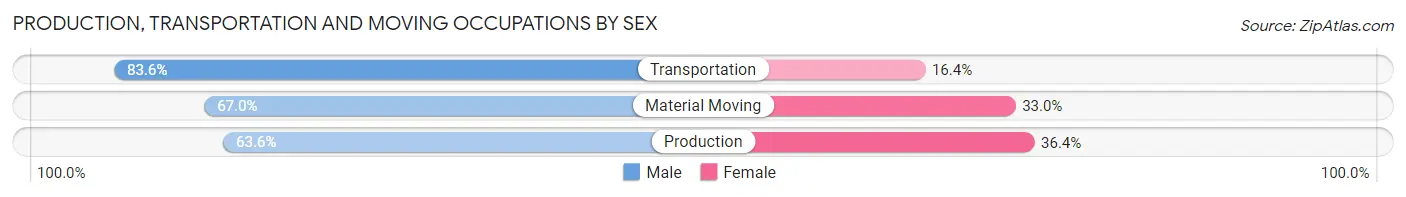
| Occupation | Male | Female |
| Production | 3,704 (63.6%) | 2,123 (36.4%) |
| Transportation | 1,141 (83.6%) | 224 (16.4%) |
| Material Moving | 1,369 (67.0%) | 673 (33.0%) |
| Total (Category) | 6,214 (67.3%) | 3,020 (32.7%) |
| Total (Overall) | 18,684 (50.3%) | 18,473 (49.7%) |
Employment Industries by Sex in Howard County
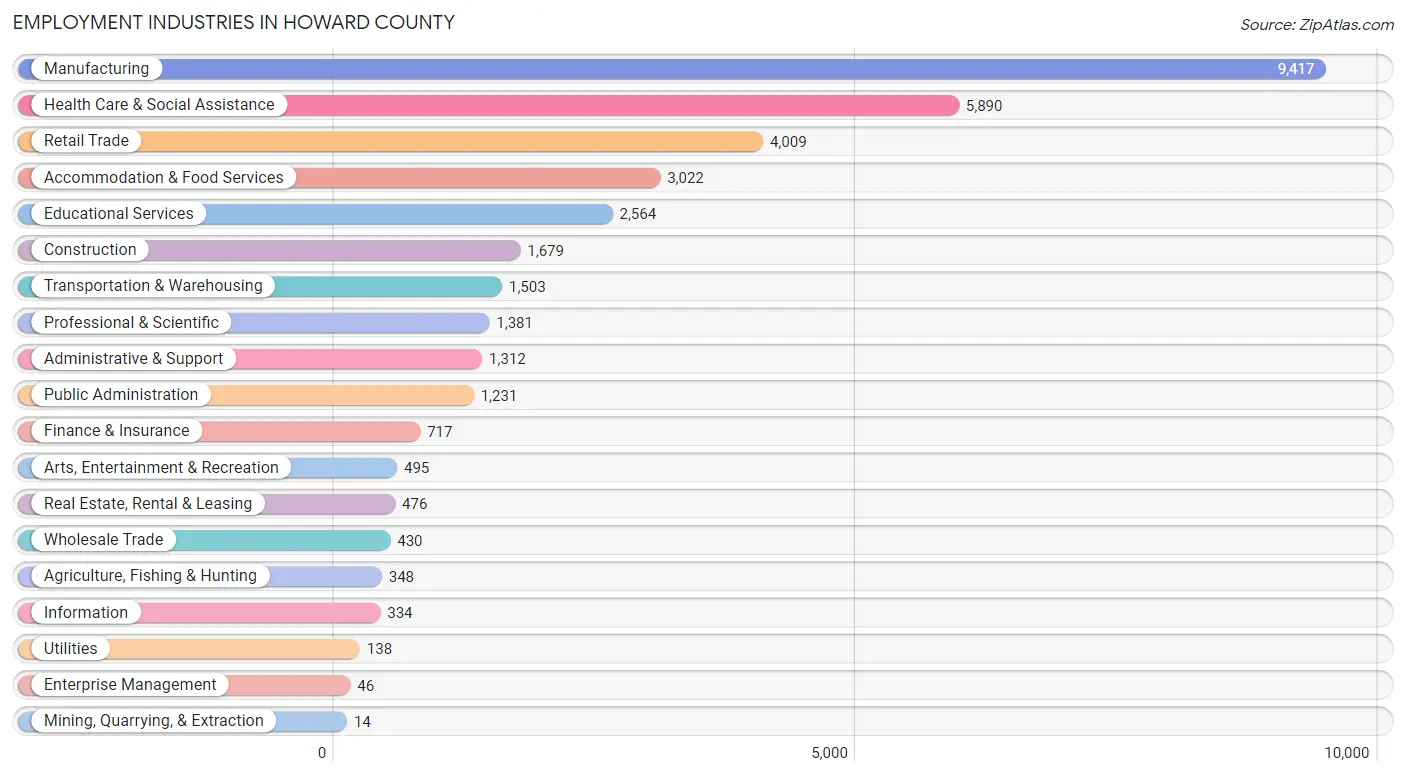
Employment Industries in Howard County
The major employment industries in Howard County include Manufacturing (9,417 | 25.3%), Health Care & Social Assistance (5,890 | 15.9%), Retail Trade (4,009 | 10.8%), Accommodation & Food Services (3,022 | 8.1%), and Educational Services (2,564 | 6.9%).
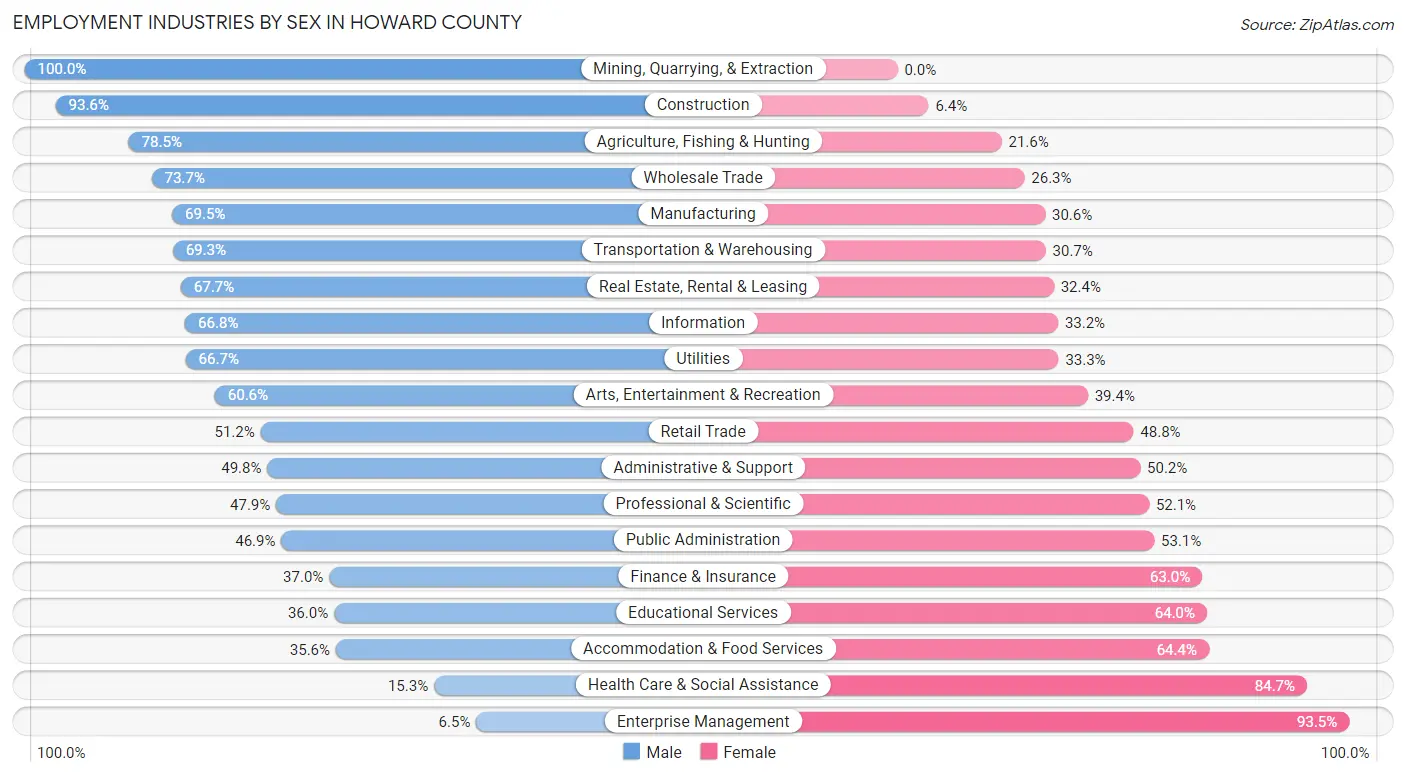
Employment Industries by Sex in Howard County
The Howard County industries that see more men than women are Mining, Quarrying, & Extraction (100.0%), Construction (93.6%), and Agriculture, Fishing & Hunting (78.4%), whereas the industries that tend to have a higher number of women are Enterprise Management (93.5%), Health Care & Social Assistance (84.7%), and Accommodation & Food Services (64.4%).
| Industry | Male | Female |
| Agriculture, Fishing & Hunting | 273 (78.4%) | 75 (21.5%) |
| Mining, Quarrying, & Extraction | 14 (100.0%) | 0 (0.0%) |
| Construction | 1,571 (93.6%) | 108 (6.4%) |
| Manufacturing | 6,540 (69.5%) | 2,877 (30.5%) |
| Wholesale Trade | 317 (73.7%) | 113 (26.3%) |
| Retail Trade | 2,051 (51.2%) | 1,958 (48.8%) |
| Transportation & Warehousing | 1,042 (69.3%) | 461 (30.7%) |
| Utilities | 92 (66.7%) | 46 (33.3%) |
| Information | 223 (66.8%) | 111 (33.2%) |
| Finance & Insurance | 265 (37.0%) | 452 (63.0%) |
| Real Estate, Rental & Leasing | 322 (67.6%) | 154 (32.4%) |
| Professional & Scientific | 662 (47.9%) | 719 (52.1%) |
| Enterprise Management | 3 (6.5%) | 43 (93.5%) |
| Administrative & Support | 653 (49.8%) | 659 (50.2%) |
| Educational Services | 922 (36.0%) | 1,642 (64.0%) |
| Health Care & Social Assistance | 899 (15.3%) | 4,991 (84.7%) |
| Arts, Entertainment & Recreation | 300 (60.6%) | 195 (39.4%) |
| Accommodation & Food Services | 1,075 (35.6%) | 1,947 (64.4%) |
| Public Administration | 577 (46.9%) | 654 (53.1%) |
| Total | 18,684 (50.3%) | 18,473 (49.7%) |
Education in Howard County
School Enrollment in Howard County
The most common levels of schooling among the 19,009 students in Howard County are elementary school (4,642 | 24.4%), high school (4,502 | 23.7%), and middle school (4,120 | 21.7%).
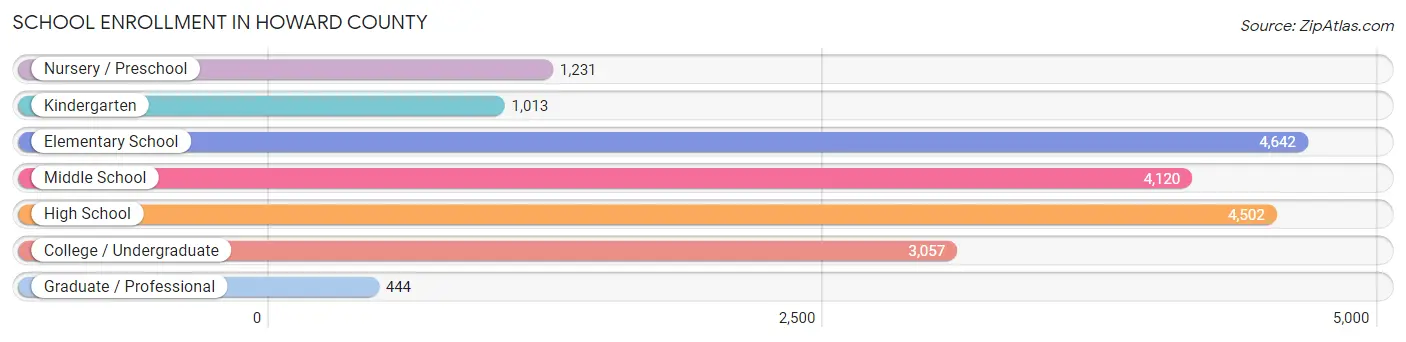
| School Level | # Students | % Students |
| Nursery / Preschool | 1,231 | 6.5% |
| Kindergarten | 1,013 | 5.3% |
| Elementary School | 4,642 | 24.4% |
| Middle School | 4,120 | 21.7% |
| High School | 4,502 | 23.7% |
| College / Undergraduate | 3,057 | 16.1% |
| Graduate / Professional | 444 | 2.3% |
| Total | 19,009 | 100.0% |
School Enrollment by Age by Funding Source in Howard County
Out of a total of 19,009 students who are enrolled in schools in Howard County, 1,559 (8.2%) attend a private institution, while the remaining 17,450 (91.8%) are enrolled in public schools. The age group of 3 to 4 year olds has the highest likelihood of being enrolled in private schools, with 236 (22.9% in the age bracket) enrolled. Conversely, the age group of 15 to 17 year olds has the lowest likelihood of being enrolled in a private school, with 3,094 (97.4% in the age bracket) attending a public institution.
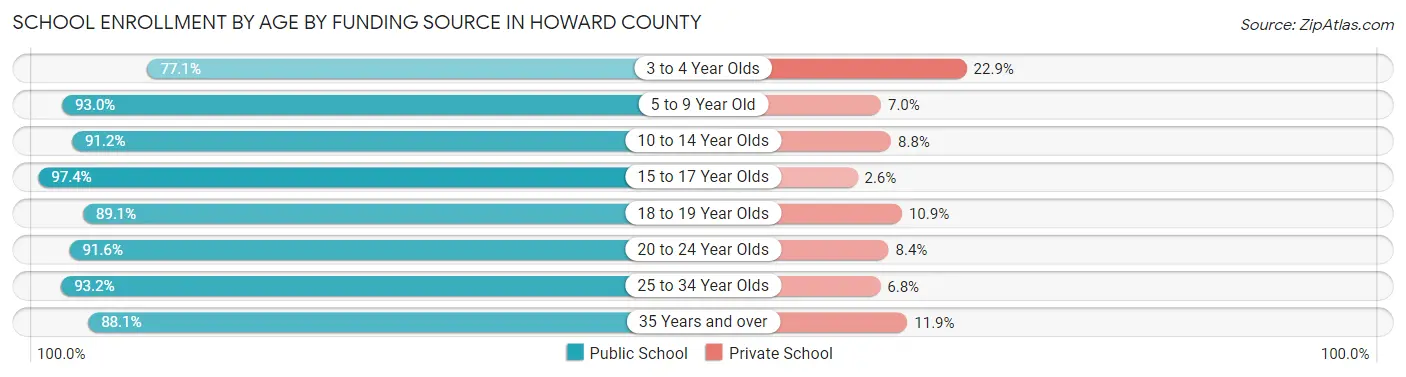
| Age Bracket | Public School | Private School |
| 3 to 4 Year Olds | 794 (77.1%) | 236 (22.9%) |
| 5 to 9 Year Old | 4,836 (93.0%) | 362 (7.0%) |
| 10 to 14 Year Olds | 4,626 (91.2%) | 448 (8.8%) |
| 15 to 17 Year Olds | 3,094 (97.4%) | 82 (2.6%) |
| 18 to 19 Year Olds | 1,223 (89.1%) | 149 (10.9%) |
| 20 to 24 Year Olds | 1,117 (91.6%) | 102 (8.4%) |
| 25 to 34 Year Olds | 873 (93.2%) | 64 (6.8%) |
| 35 Years and over | 884 (88.1%) | 119 (11.9%) |
| Total | 17,450 (91.8%) | 1,559 (8.2%) |
Educational Attainment by Field of Study in Howard County
Education (2,358 | 19.3%), business (2,290 | 18.7%), science & technology (1,645 | 13.4%), engineering (1,327 | 10.8%), and liberal arts & history (749 | 6.1%) are the most common fields of study among 12,252 individuals in Howard County who have obtained a bachelor's degree or higher.
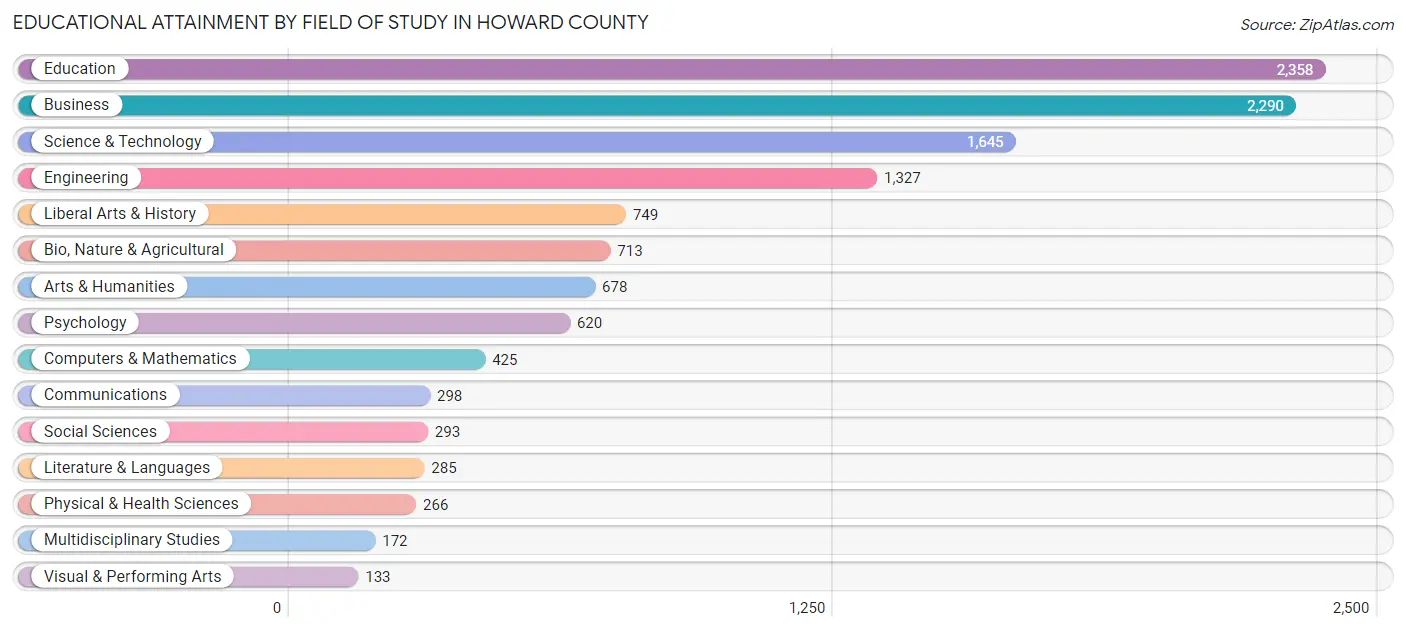
| Field of Study | # Graduates | % Graduates |
| Computers & Mathematics | 425 | 3.5% |
| Bio, Nature & Agricultural | 713 | 5.8% |
| Physical & Health Sciences | 266 | 2.2% |
| Psychology | 620 | 5.1% |
| Social Sciences | 293 | 2.4% |
| Engineering | 1,327 | 10.8% |
| Multidisciplinary Studies | 172 | 1.4% |
| Science & Technology | 1,645 | 13.4% |
| Business | 2,290 | 18.7% |
| Education | 2,358 | 19.3% |
| Literature & Languages | 285 | 2.3% |
| Liberal Arts & History | 749 | 6.1% |
| Visual & Performing Arts | 133 | 1.1% |
| Communications | 298 | 2.4% |
| Arts & Humanities | 678 | 5.5% |
| Total | 12,252 | 100.0% |
Transportation & Commute in Howard County
Vehicle Availability by Sex in Howard County
The most prevalent vehicle ownership categories in Howard County are males with 2 vehicles (7,394, accounting for 40.1%) and females with 2 vehicles (7,257, making up 41.6%).
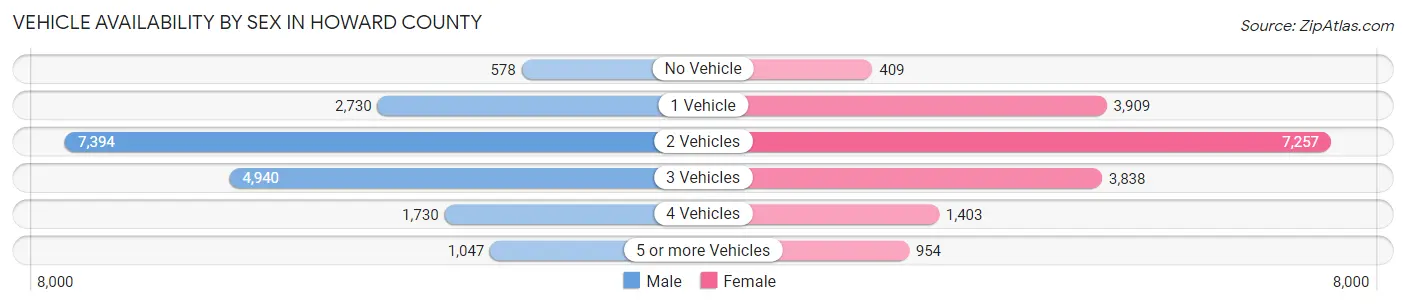
| Vehicles Available | Male | Female |
| No Vehicle | 578 (3.1%) | 409 (2.3%) |
| 1 Vehicle | 2,730 (14.8%) | 3,909 (22.0%) |
| 2 Vehicles | 7,394 (40.1%) | 7,257 (40.8%) |
| 3 Vehicles | 4,940 (26.8%) | 3,838 (21.6%) |
| 4 Vehicles | 1,730 (9.4%) | 1,403 (7.9%) |
| 5 or more Vehicles | 1,047 (5.7%) | 954 (5.4%) |
| Total | 18,419 (100.0%) | 17,770 (100.0%) |
Commute Time in Howard County
The most frequently occuring commute durations in Howard County are 10 to 14 minutes (7,742 commuters, 22.6%), 15 to 19 minutes (7,001 commuters, 20.4%), and 5 to 9 minutes (5,718 commuters, 16.7%).
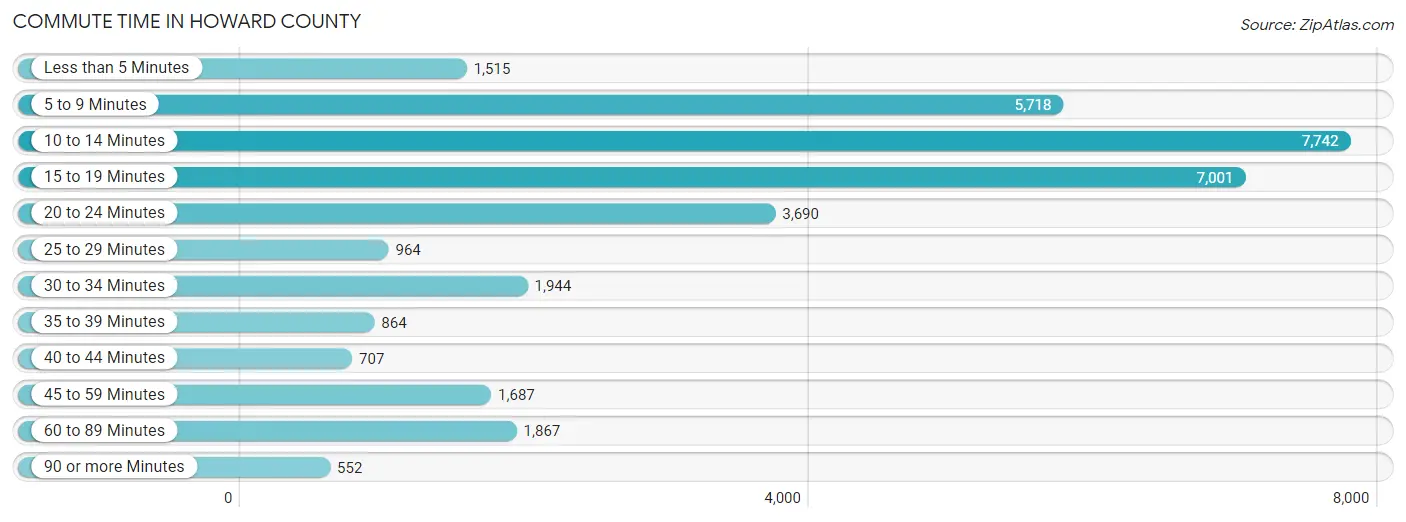
| Commute Time | # Commuters | % Commuters |
| Less than 5 Minutes | 1,515 | 4.4% |
| 5 to 9 Minutes | 5,718 | 16.7% |
| 10 to 14 Minutes | 7,742 | 22.6% |
| 15 to 19 Minutes | 7,001 | 20.4% |
| 20 to 24 Minutes | 3,690 | 10.8% |
| 25 to 29 Minutes | 964 | 2.8% |
| 30 to 34 Minutes | 1,944 | 5.7% |
| 35 to 39 Minutes | 864 | 2.5% |
| 40 to 44 Minutes | 707 | 2.1% |
| 45 to 59 Minutes | 1,687 | 4.9% |
| 60 to 89 Minutes | 1,867 | 5.4% |
| 90 or more Minutes | 552 | 1.6% |
Commute Time by Sex in Howard County
The most common commute times in Howard County are 10 to 14 minutes (3,726 commuters, 21.3%) for males and 10 to 14 minutes (4,016 commuters, 24.0%) for females.
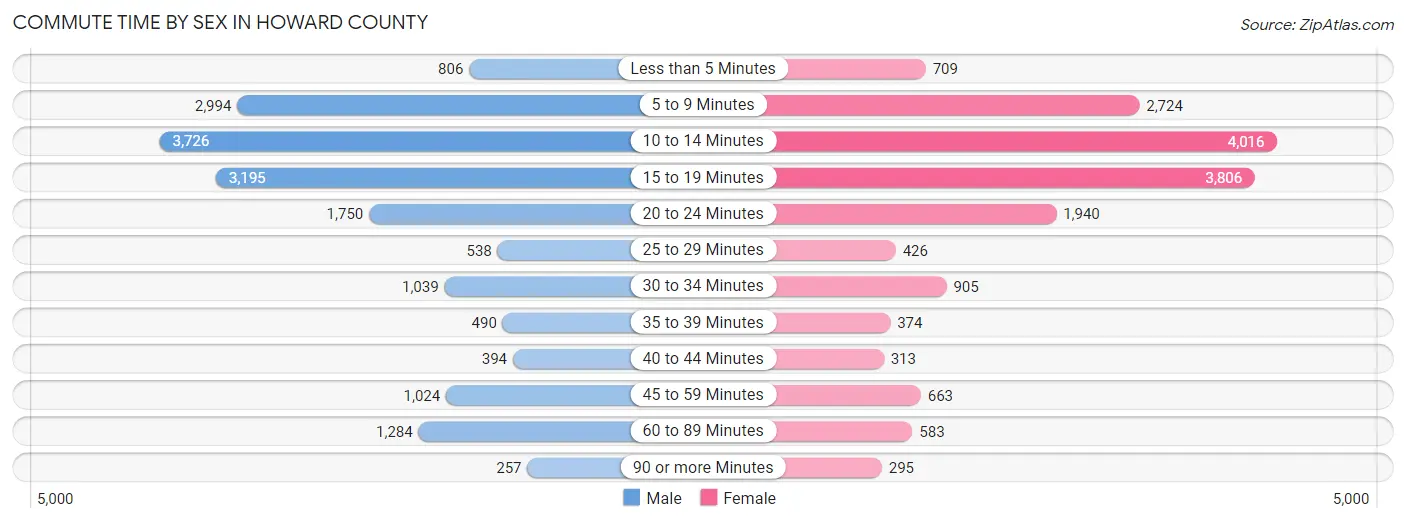
| Commute Time | Male | Female |
| Less than 5 Minutes | 806 (4.6%) | 709 (4.2%) |
| 5 to 9 Minutes | 2,994 (17.1%) | 2,724 (16.3%) |
| 10 to 14 Minutes | 3,726 (21.3%) | 4,016 (24.0%) |
| 15 to 19 Minutes | 3,195 (18.3%) | 3,806 (22.7%) |
| 20 to 24 Minutes | 1,750 (10.0%) | 1,940 (11.6%) |
| 25 to 29 Minutes | 538 (3.1%) | 426 (2.5%) |
| 30 to 34 Minutes | 1,039 (5.9%) | 905 (5.4%) |
| 35 to 39 Minutes | 490 (2.8%) | 374 (2.2%) |
| 40 to 44 Minutes | 394 (2.2%) | 313 (1.9%) |
| 45 to 59 Minutes | 1,024 (5.9%) | 663 (4.0%) |
| 60 to 89 Minutes | 1,284 (7.3%) | 583 (3.5%) |
| 90 or more Minutes | 257 (1.5%) | 295 (1.8%) |
Time of Departure to Work by Sex in Howard County
The most frequent times of departure to work in Howard County are 4:00 PM to 11:59 PM (2,290, 13.1%) for males and 7:30 AM to 7:59 AM (2,697, 16.1%) for females.
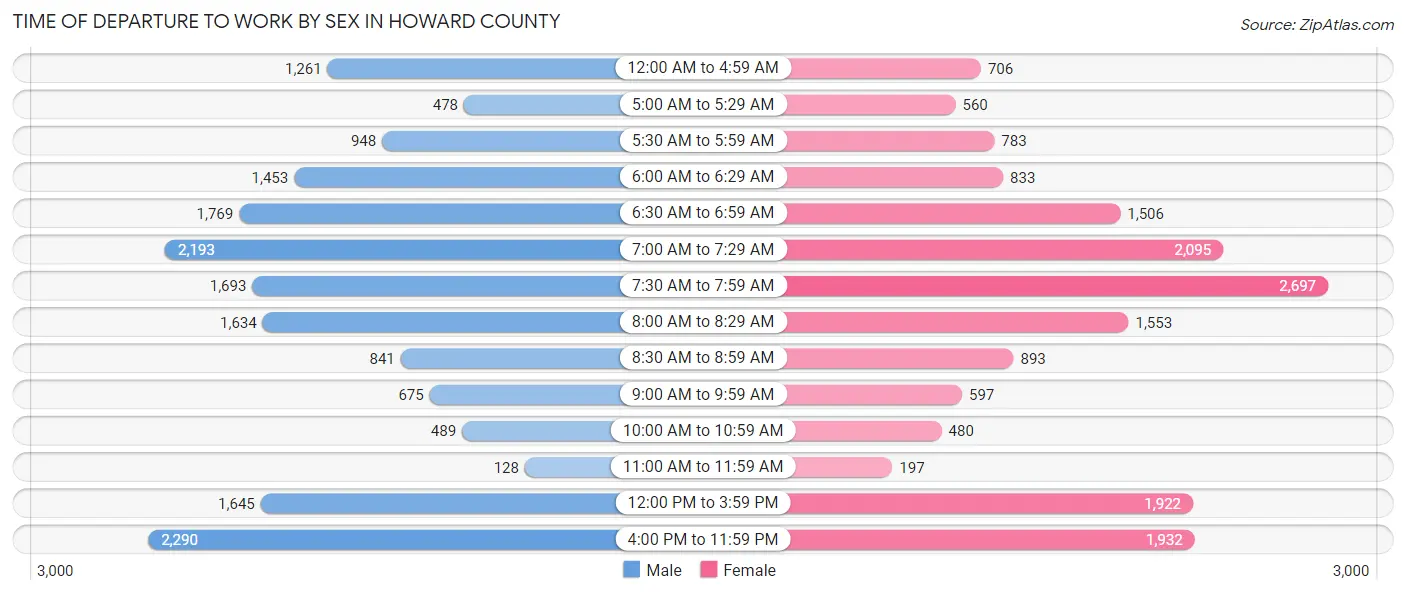
| Time of Departure | Male | Female |
| 12:00 AM to 4:59 AM | 1,261 (7.2%) | 706 (4.2%) |
| 5:00 AM to 5:29 AM | 478 (2.7%) | 560 (3.3%) |
| 5:30 AM to 5:59 AM | 948 (5.4%) | 783 (4.7%) |
| 6:00 AM to 6:29 AM | 1,453 (8.3%) | 833 (5.0%) |
| 6:30 AM to 6:59 AM | 1,769 (10.1%) | 1,506 (9.0%) |
| 7:00 AM to 7:29 AM | 2,193 (12.5%) | 2,095 (12.5%) |
| 7:30 AM to 7:59 AM | 1,693 (9.7%) | 2,697 (16.1%) |
| 8:00 AM to 8:29 AM | 1,634 (9.3%) | 1,553 (9.3%) |
| 8:30 AM to 8:59 AM | 841 (4.8%) | 893 (5.3%) |
| 9:00 AM to 9:59 AM | 675 (3.9%) | 597 (3.6%) |
| 10:00 AM to 10:59 AM | 489 (2.8%) | 480 (2.9%) |
| 11:00 AM to 11:59 AM | 128 (0.7%) | 197 (1.2%) |
| 12:00 PM to 3:59 PM | 1,645 (9.4%) | 1,922 (11.5%) |
| 4:00 PM to 11:59 PM | 2,290 (13.1%) | 1,932 (11.5%) |
| Total | 17,497 (100.0%) | 16,754 (100.0%) |
Housing Occupancy in Howard County
Occupancy by Ownership in Howard County
Of the total 34,957 dwellings in Howard County, owner-occupied units account for 25,052 (71.7%), while renter-occupied units make up 9,905 (28.3%).
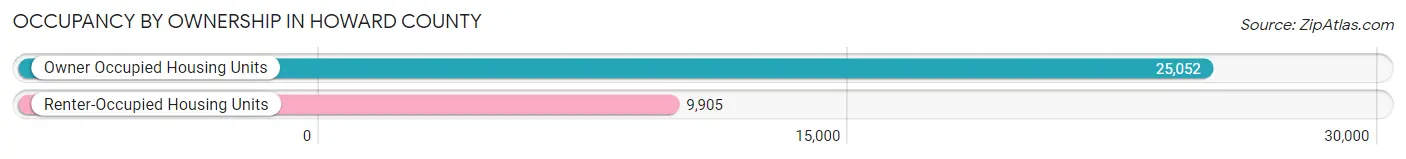
| Occupancy | # Housing Units | % Housing Units |
| Owner Occupied Housing Units | 25,052 | 71.7% |
| Renter-Occupied Housing Units | 9,905 | 28.3% |
| Total Occupied Housing Units | 34,957 | 100.0% |
Occupancy by Household Size in Howard County
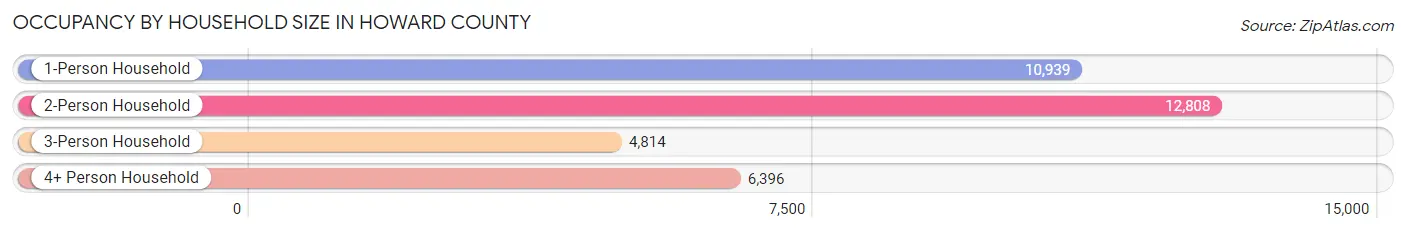
| Household Size | # Housing Units | % Housing Units |
| 1-Person Household | 10,939 | 31.3% |
| 2-Person Household | 12,808 | 36.6% |
| 3-Person Household | 4,814 | 13.8% |
| 4+ Person Household | 6,396 | 18.3% |
| Total Housing Units | 34,957 | 100.0% |
Occupancy by Ownership by Household Size in Howard County
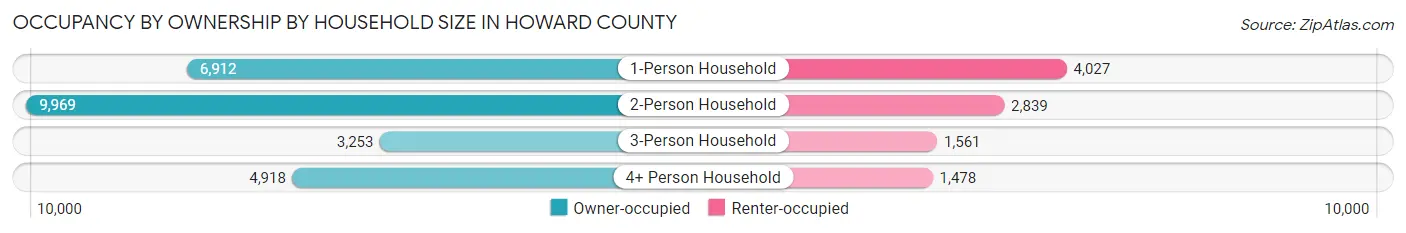
| Household Size | Owner-occupied | Renter-occupied |
| 1-Person Household | 6,912 (63.2%) | 4,027 (36.8%) |
| 2-Person Household | 9,969 (77.8%) | 2,839 (22.2%) |
| 3-Person Household | 3,253 (67.6%) | 1,561 (32.4%) |
| 4+ Person Household | 4,918 (76.9%) | 1,478 (23.1%) |
| Total Housing Units | 25,052 (71.7%) | 9,905 (28.3%) |
Occupancy by Educational Attainment in Howard County
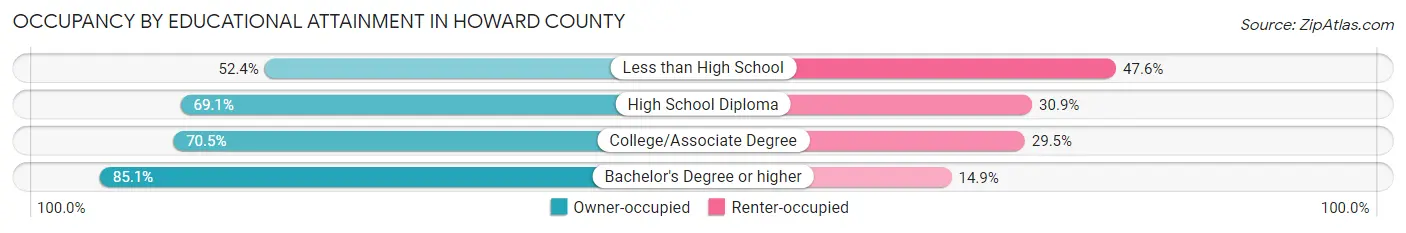
| Household Size | Owner-occupied | Renter-occupied |
| Less than High School | 1,559 (52.4%) | 1,415 (47.6%) |
| High School Diploma | 8,389 (69.1%) | 3,756 (30.9%) |
| College/Associate Degree | 8,587 (70.5%) | 3,589 (29.5%) |
| Bachelor's Degree or higher | 6,517 (85.1%) | 1,145 (14.9%) |
Occupancy by Age of Householder in Howard County
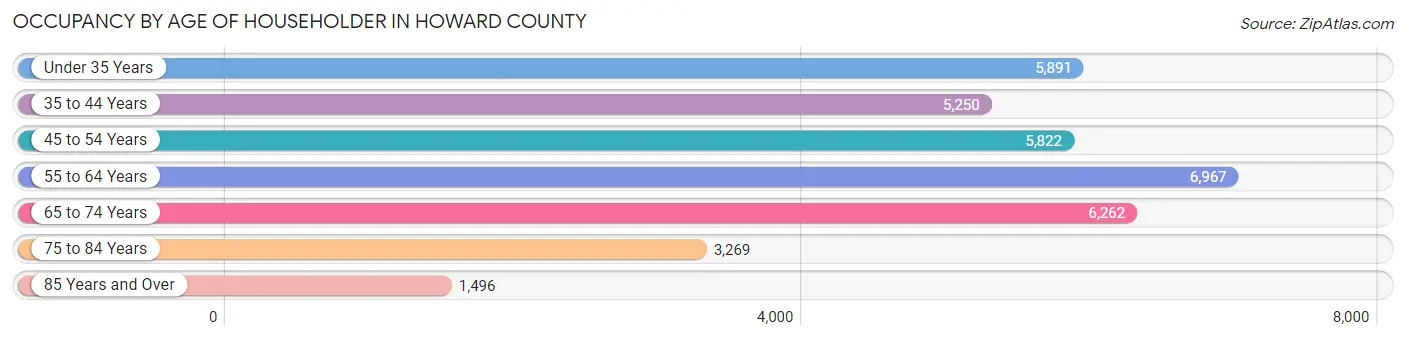
| Age Bracket | # Households | % Households |
| Under 35 Years | 5,891 | 16.9% |
| 35 to 44 Years | 5,250 | 15.0% |
| 45 to 54 Years | 5,822 | 16.7% |
| 55 to 64 Years | 6,967 | 19.9% |
| 65 to 74 Years | 6,262 | 17.9% |
| 75 to 84 Years | 3,269 | 9.3% |
| 85 Years and Over | 1,496 | 4.3% |
| Total | 34,957 | 100.0% |
Housing Finances in Howard County
Median Income by Occupancy in Howard County
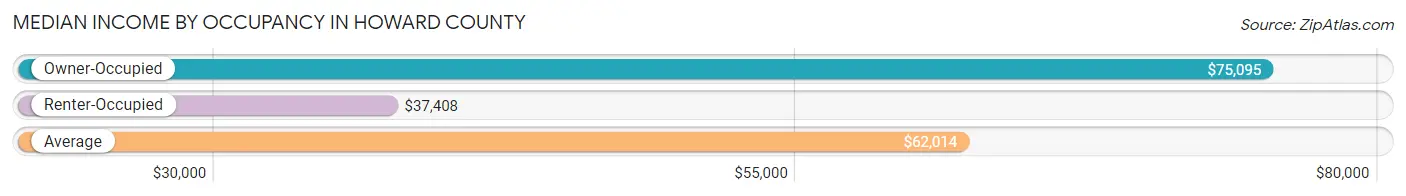
| Occupancy Type | # Households | Median Income |
| Owner-Occupied | 25,052 (71.7%) | $75,095 |
| Renter-Occupied | 9,905 (28.3%) | $37,408 |
| Average | 34,957 (100.0%) | $62,014 |
Occupancy by Householder Income Bracket in Howard County
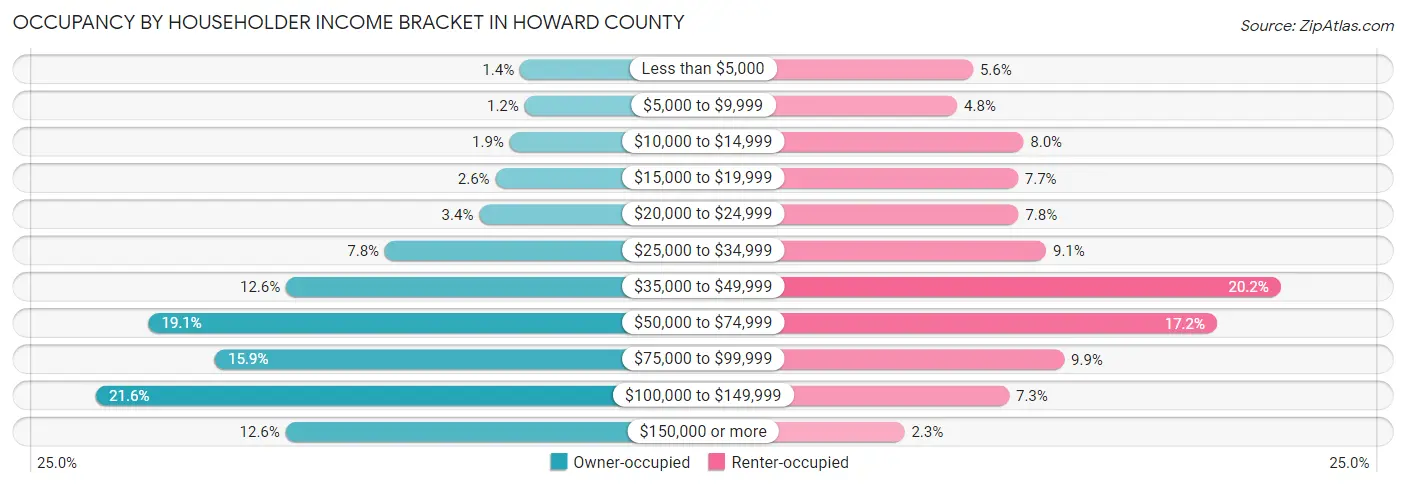
| Income Bracket | Owner-occupied | Renter-occupied |
| Less than $5,000 | 352 (1.4%) | 554 (5.6%) |
| $5,000 to $9,999 | 298 (1.2%) | 479 (4.8%) |
| $10,000 to $14,999 | 477 (1.9%) | 791 (8.0%) |
| $15,000 to $19,999 | 647 (2.6%) | 766 (7.7%) |
| $20,000 to $24,999 | 838 (3.4%) | 769 (7.8%) |
| $25,000 to $34,999 | 1,965 (7.8%) | 898 (9.1%) |
| $35,000 to $49,999 | 3,144 (12.6%) | 2,005 (20.2%) |
| $50,000 to $74,999 | 4,784 (19.1%) | 1,704 (17.2%) |
| $75,000 to $99,999 | 3,990 (15.9%) | 984 (9.9%) |
| $100,000 to $149,999 | 5,409 (21.6%) | 724 (7.3%) |
| $150,000 or more | 3,148 (12.6%) | 231 (2.3%) |
| Total | 25,052 (100.0%) | 9,905 (100.0%) |
Monthly Housing Cost Tiers in Howard County
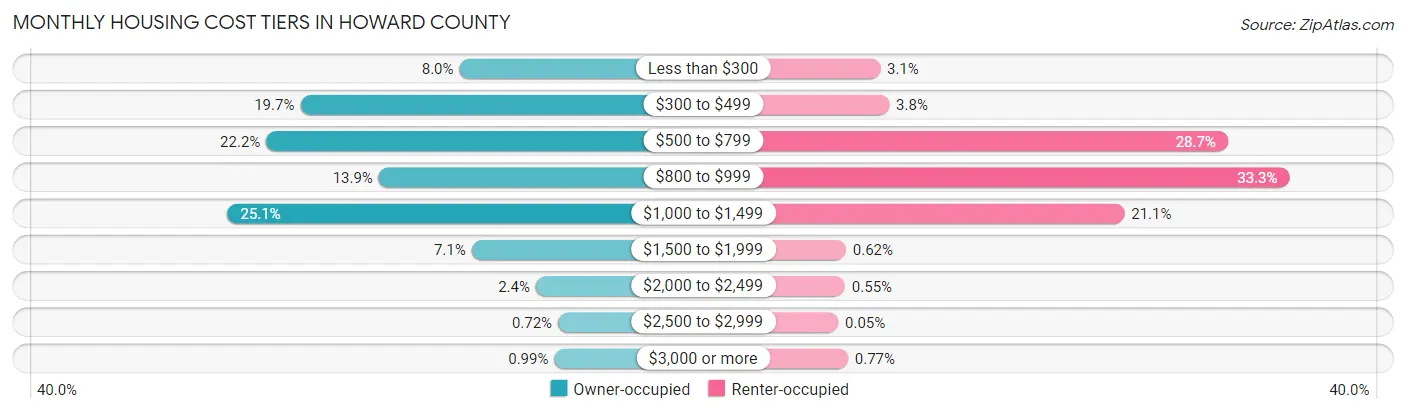
| Monthly Cost | Owner-occupied | Renter-occupied |
| Less than $300 | 1,998 (8.0%) | 311 (3.1%) |
| $300 to $499 | 4,935 (19.7%) | 377 (3.8%) |
| $500 to $799 | 5,563 (22.2%) | 2,847 (28.7%) |
| $800 to $999 | 3,487 (13.9%) | 3,296 (33.3%) |
| $1,000 to $1,499 | 6,278 (25.1%) | 2,093 (21.1%) |
| $1,500 to $1,999 | 1,773 (7.1%) | 61 (0.6%) |
| $2,000 to $2,499 | 588 (2.4%) | 54 (0.5%) |
| $2,500 to $2,999 | 181 (0.7%) | 5 (0.1%) |
| $3,000 or more | 249 (1.0%) | 76 (0.8%) |
| Total | 25,052 (100.0%) | 9,905 (100.0%) |
Physical Housing Characteristics in Howard County
Housing Structures in Howard County
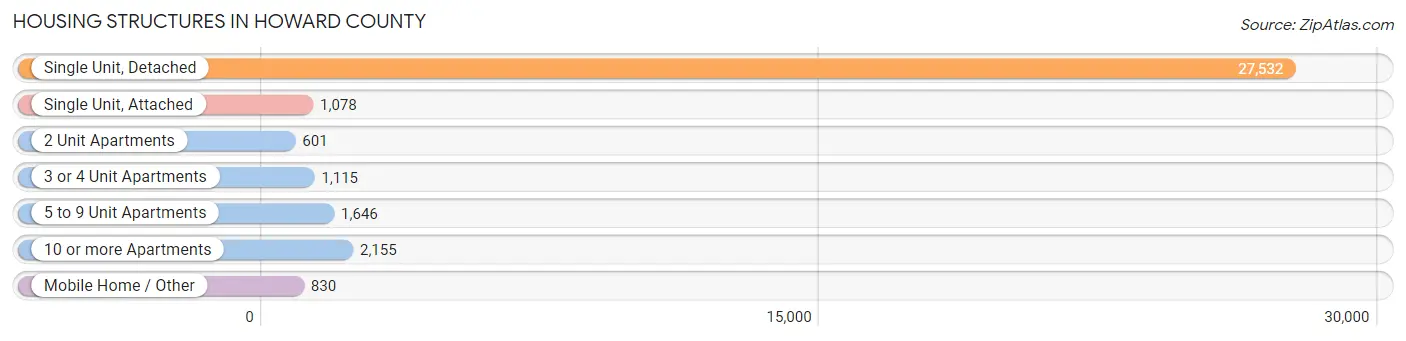
| Structure Type | # Housing Units | % Housing Units |
| Single Unit, Detached | 27,532 | 78.8% |
| Single Unit, Attached | 1,078 | 3.1% |
| 2 Unit Apartments | 601 | 1.7% |
| 3 or 4 Unit Apartments | 1,115 | 3.2% |
| 5 to 9 Unit Apartments | 1,646 | 4.7% |
| 10 or more Apartments | 2,155 | 6.2% |
| Mobile Home / Other | 830 | 2.4% |
| Total | 34,957 | 100.0% |
Housing Structures by Occupancy in Howard County
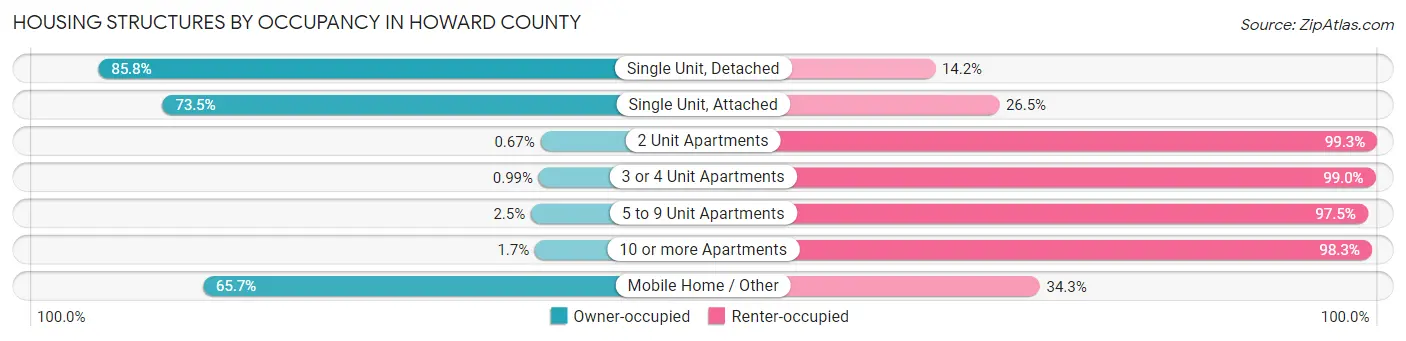
| Structure Type | Owner-occupied | Renter-occupied |
| Single Unit, Detached | 23,622 (85.8%) | 3,910 (14.2%) |
| Single Unit, Attached | 792 (73.5%) | 286 (26.5%) |
| 2 Unit Apartments | 4 (0.7%) | 597 (99.3%) |
| 3 or 4 Unit Apartments | 11 (1.0%) | 1,104 (99.0%) |
| 5 to 9 Unit Apartments | 41 (2.5%) | 1,605 (97.5%) |
| 10 or more Apartments | 37 (1.7%) | 2,118 (98.3%) |
| Mobile Home / Other | 545 (65.7%) | 285 (34.3%) |
| Total | 25,052 (71.7%) | 9,905 (28.3%) |
Housing Structures by Number of Rooms in Howard County
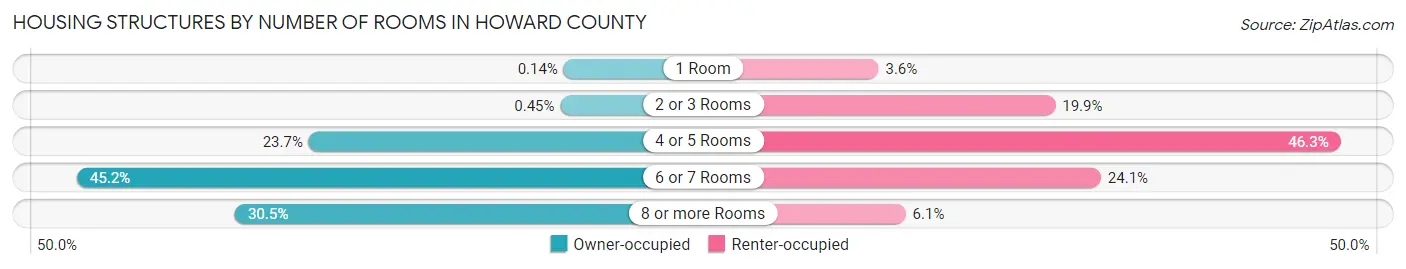
| Number of Rooms | Owner-occupied | Renter-occupied |
| 1 Room | 35 (0.1%) | 354 (3.6%) |
| 2 or 3 Rooms | 112 (0.4%) | 1,973 (19.9%) |
| 4 or 5 Rooms | 5,942 (23.7%) | 4,585 (46.3%) |
| 6 or 7 Rooms | 11,313 (45.2%) | 2,391 (24.1%) |
| 8 or more Rooms | 7,650 (30.5%) | 602 (6.1%) |
| Total | 25,052 (100.0%) | 9,905 (100.0%) |
Housing Structure by Heating Type in Howard County
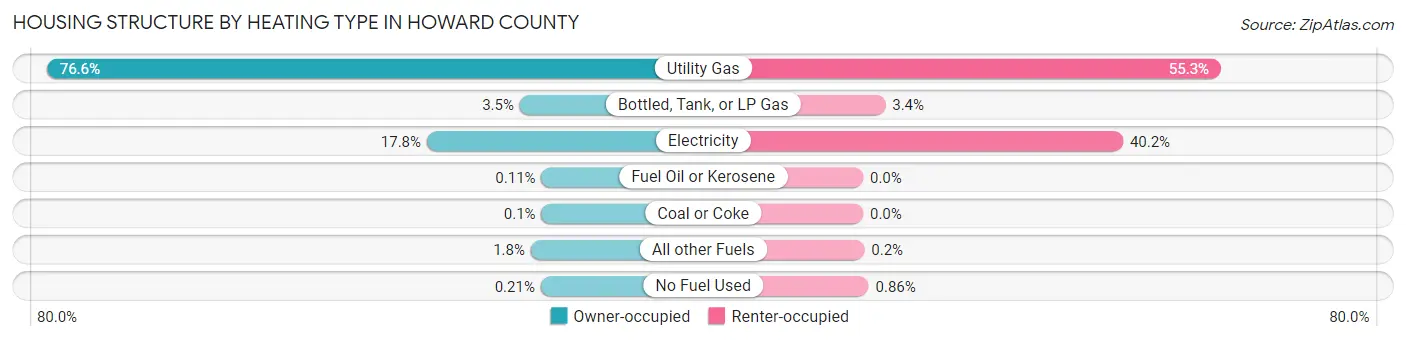
| Heating Type | Owner-occupied | Renter-occupied |
| Utility Gas | 19,181 (76.6%) | 5,479 (55.3%) |
| Bottled, Tank, or LP Gas | 864 (3.5%) | 341 (3.4%) |
| Electricity | 4,464 (17.8%) | 3,980 (40.2%) |
| Fuel Oil or Kerosene | 28 (0.1%) | 0 (0.0%) |
| Coal or Coke | 24 (0.1%) | 0 (0.0%) |
| All other Fuels | 439 (1.8%) | 20 (0.2%) |
| No Fuel Used | 52 (0.2%) | 85 (0.9%) |
| Total | 25,052 (100.0%) | 9,905 (100.0%) |
Household Vehicle Usage in Howard County
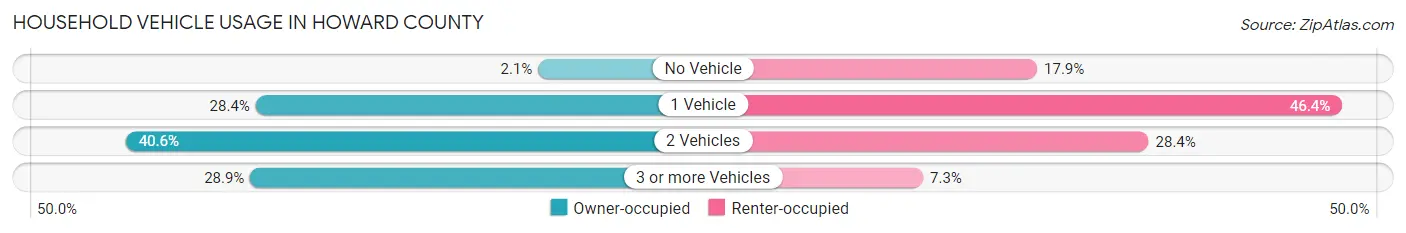
| Vehicles per Household | Owner-occupied | Renter-occupied |
| No Vehicle | 517 (2.1%) | 1,777 (17.9%) |
| 1 Vehicle | 7,123 (28.4%) | 4,597 (46.4%) |
| 2 Vehicles | 10,161 (40.6%) | 2,808 (28.3%) |
| 3 or more Vehicles | 7,251 (28.9%) | 723 (7.3%) |
| Total | 25,052 (100.0%) | 9,905 (100.0%) |
Real Estate & Mortgages in Howard County
Real Estate and Mortgage Overview in Howard County
| Characteristic | Without Mortgage | With Mortgage |
| Housing Units | 9,284 | 15,768 |
| Median Property Value | $130,400 | $148,300 |
| Median Household Income | $61,655 | $2,278 |
| Monthly Housing Costs | $415 | $218 |
| Real Estate Taxes | $949 | $644 |
Property Value by Mortgage Status in Howard County
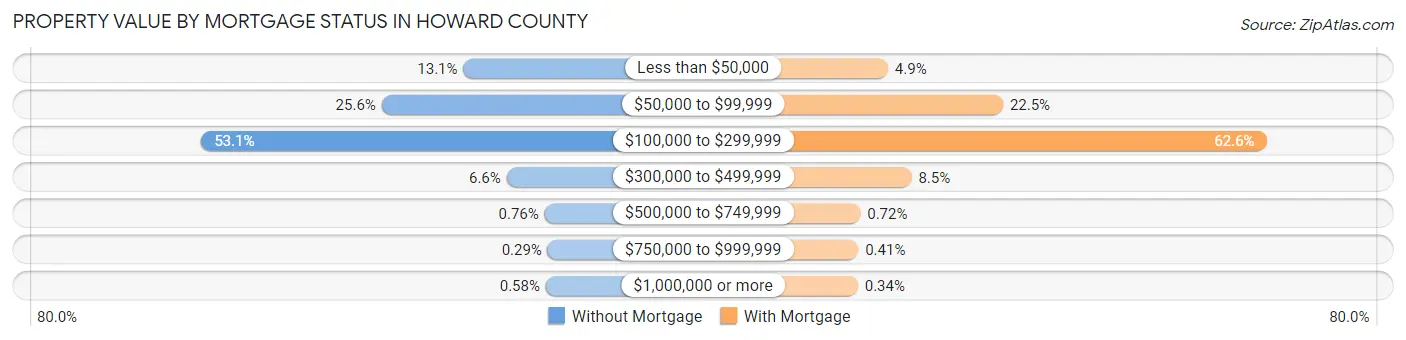
| Property Value | Without Mortgage | With Mortgage |
| Less than $50,000 | 1,220 (13.1%) | 778 (4.9%) |
| $50,000 to $99,999 | 2,376 (25.6%) | 3,541 (22.5%) |
| $100,000 to $299,999 | 4,928 (53.1%) | 9,873 (62.6%) |
| $300,000 to $499,999 | 608 (6.6%) | 1,344 (8.5%) |
| $500,000 to $749,999 | 71 (0.8%) | 114 (0.7%) |
| $750,000 to $999,999 | 27 (0.3%) | 65 (0.4%) |
| $1,000,000 or more | 54 (0.6%) | 53 (0.3%) |
| Total | 9,284 (100.0%) | 15,768 (100.0%) |
Household Income by Mortgage Status in Howard County
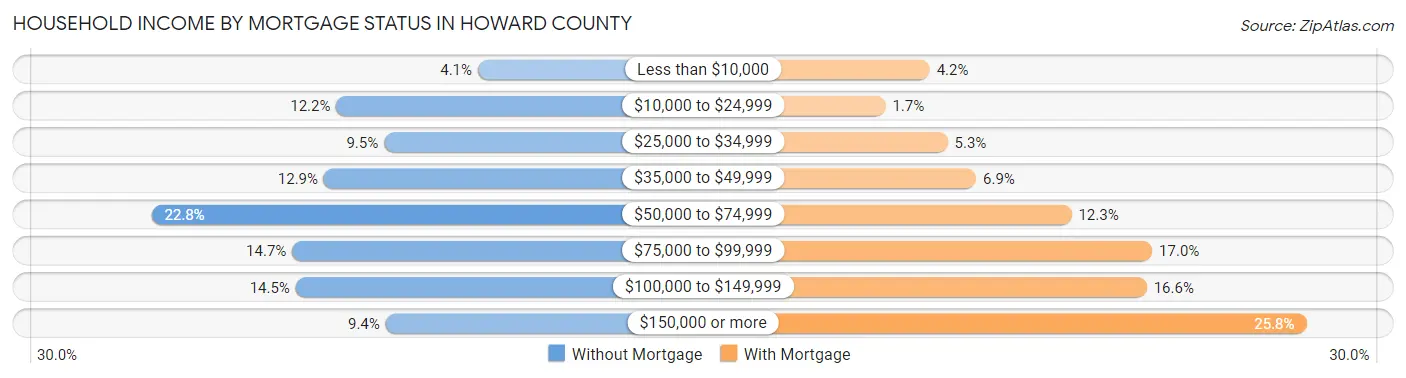
| Household Income | Without Mortgage | With Mortgage |
| Less than $10,000 | 381 (4.1%) | 669 (4.2%) |
| $10,000 to $24,999 | 1,132 (12.2%) | 269 (1.7%) |
| $25,000 to $34,999 | 878 (9.5%) | 830 (5.3%) |
| $35,000 to $49,999 | 1,198 (12.9%) | 1,087 (6.9%) |
| $50,000 to $74,999 | 2,112 (22.8%) | 1,946 (12.3%) |
| $75,000 to $99,999 | 1,366 (14.7%) | 2,672 (17.0%) |
| $100,000 to $149,999 | 1,347 (14.5%) | 2,624 (16.6%) |
| $150,000 or more | 870 (9.4%) | 4,062 (25.8%) |
| Total | 9,284 (100.0%) | 15,768 (100.0%) |
Property Value to Household Income Ratio in Howard County
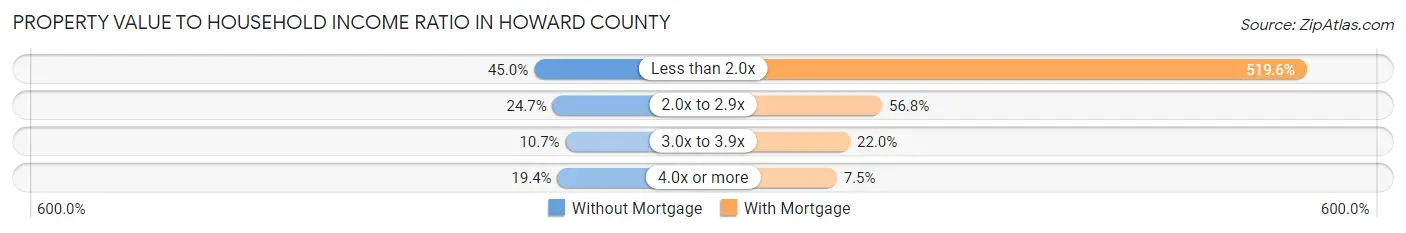
| Value-to-Income Ratio | Without Mortgage | With Mortgage |
| Less than 2.0x | 4,174 (45.0%) | 81,930 (519.6%) |
| 2.0x to 2.9x | 2,293 (24.7%) | 8,961 (56.8%) |
| 3.0x to 3.9x | 990 (10.7%) | 3,468 (22.0%) |
| 4.0x or more | 1,801 (19.4%) | 1,180 (7.5%) |
| Total | 9,284 (100.0%) | 15,768 (100.0%) |
Real Estate Taxes by Mortgage Status in Howard County
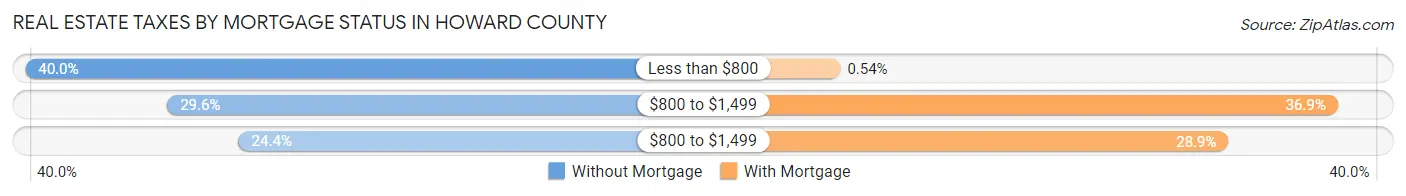
| Property Taxes | Without Mortgage | With Mortgage |
| Less than $800 | 3,709 (40.0%) | 85 (0.5%) |
| $800 to $1,499 | 2,746 (29.6%) | 5,813 (36.9%) |
| $800 to $1,499 | 2,262 (24.4%) | 4,554 (28.9%) |
| Total | 9,284 (100.0%) | 15,768 (100.0%) |
Health & Disability in Howard County
Health Insurance Coverage by Age in Howard County
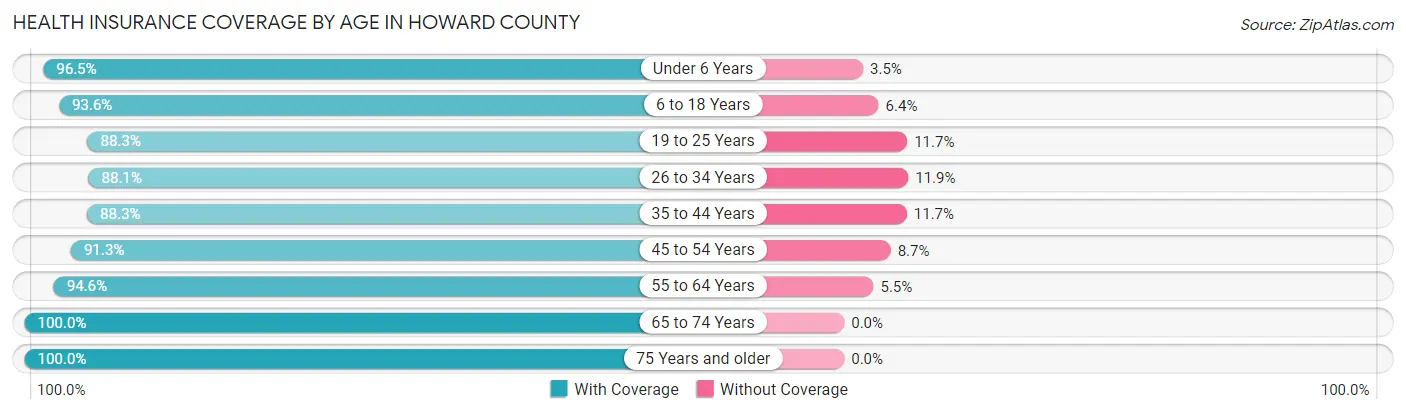
| Age Bracket | With Coverage | Without Coverage |
| Under 6 Years | 5,601 (96.5%) | 204 (3.5%) |
| 6 to 18 Years | 13,326 (93.6%) | 913 (6.4%) |
| 19 to 25 Years | 5,856 (88.3%) | 779 (11.7%) |
| 26 to 34 Years | 7,870 (88.1%) | 1,067 (11.9%) |
| 35 to 44 Years | 8,152 (88.3%) | 1,077 (11.7%) |
| 45 to 54 Years | 9,287 (91.3%) | 880 (8.7%) |
| 55 to 64 Years | 10,872 (94.6%) | 627 (5.4%) |
| 65 to 74 Years | 9,037 (100.0%) | 0 (0.0%) |
| 75 Years and older | 6,706 (100.0%) | 0 (0.0%) |
| Total | 76,707 (93.3%) | 5,547 (6.7%) |
Health Insurance Coverage by Citizenship Status in Howard County
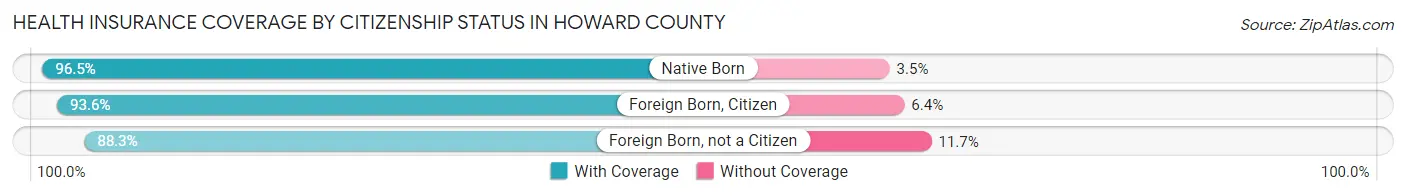
| Citizenship Status | With Coverage | Without Coverage |
| Native Born | 5,601 (96.5%) | 204 (3.5%) |
| Foreign Born, Citizen | 13,326 (93.6%) | 913 (6.4%) |
| Foreign Born, not a Citizen | 5,856 (88.3%) | 779 (11.7%) |
Health Insurance Coverage by Household Income in Howard County
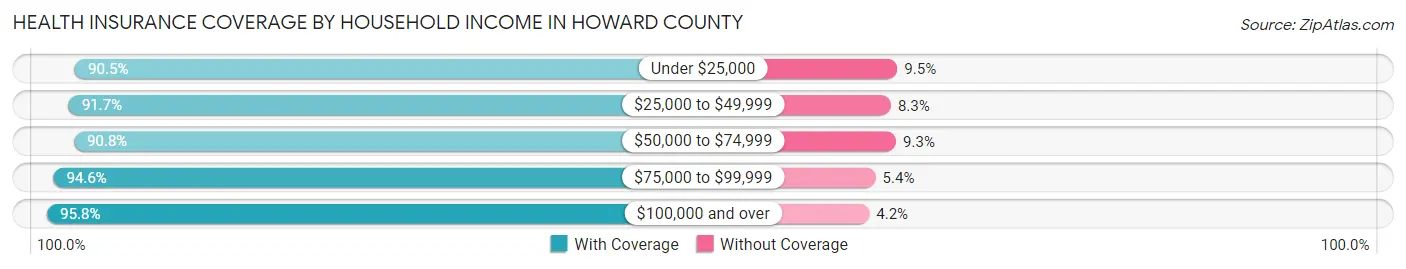
| Household Income | With Coverage | Without Coverage |
| Under $25,000 | 8,684 (90.5%) | 909 (9.5%) |
| $25,000 to $49,999 | 13,622 (91.7%) | 1,229 (8.3%) |
| $50,000 to $74,999 | 14,470 (90.7%) | 1,475 (9.2%) |
| $75,000 to $99,999 | 11,934 (94.6%) | 682 (5.4%) |
| $100,000 and over | 27,821 (95.8%) | 1,228 (4.2%) |
Public vs Private Health Insurance Coverage by Age in Howard County
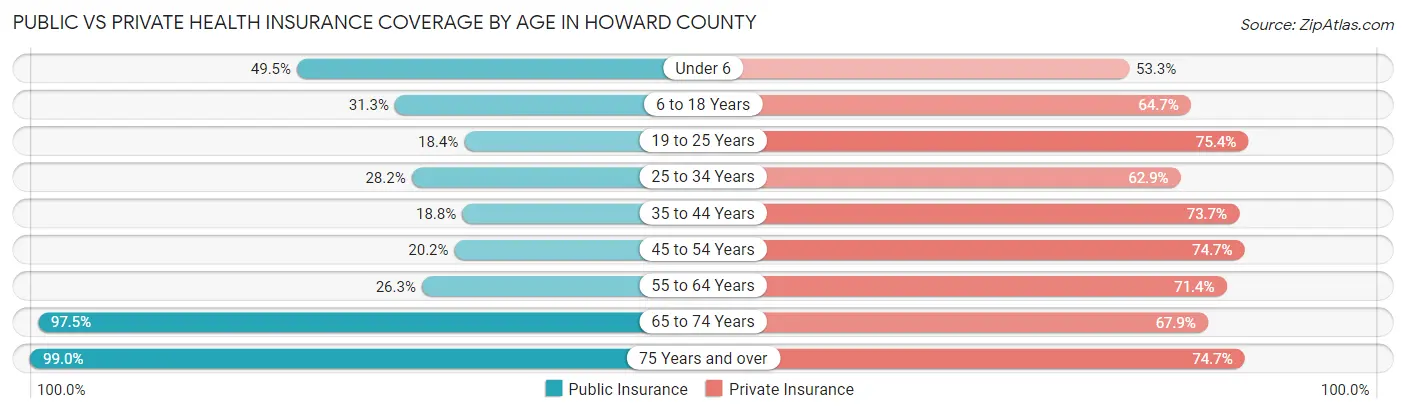
| Age Bracket | Public Insurance | Private Insurance |
| Under 6 | 2,872 (49.5%) | 3,095 (53.3%) |
| 6 to 18 Years | 4,455 (31.3%) | 9,219 (64.7%) |
| 19 to 25 Years | 1,222 (18.4%) | 5,004 (75.4%) |
| 25 to 34 Years | 2,519 (28.2%) | 5,617 (62.8%) |
| 35 to 44 Years | 1,736 (18.8%) | 6,800 (73.7%) |
| 45 to 54 Years | 2,057 (20.2%) | 7,597 (74.7%) |
| 55 to 64 Years | 3,023 (26.3%) | 8,207 (71.4%) |
| 65 to 74 Years | 8,815 (97.5%) | 6,137 (67.9%) |
| 75 Years and over | 6,636 (99.0%) | 5,012 (74.7%) |
| Total | 33,335 (40.5%) | 56,688 (68.9%) |
Disability Status by Sex by Age in Howard County
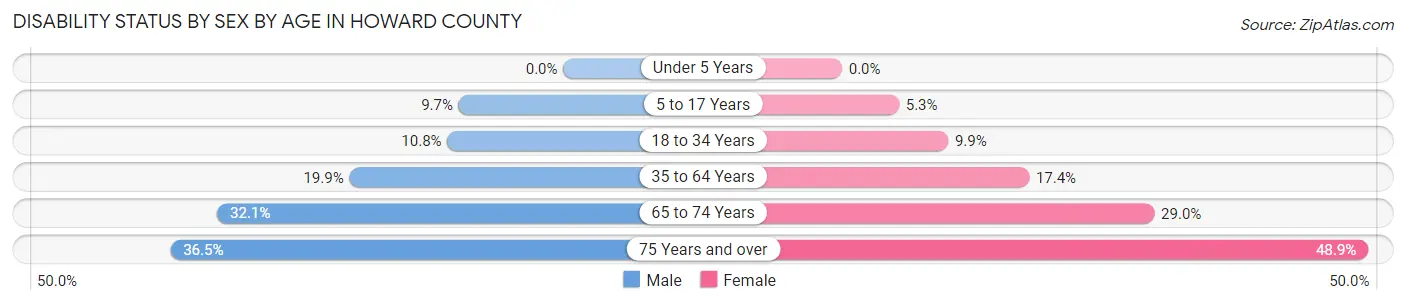
| Age Bracket | Male | Female |
| Under 5 Years | 0 (0.0%) | 0 (0.0%) |
| 5 to 17 Years | 708 (9.7%) | 359 (5.3%) |
| 18 to 34 Years | 914 (10.8%) | 804 (9.9%) |
| 35 to 64 Years | 2,904 (19.9%) | 2,825 (17.4%) |
| 65 to 74 Years | 1,331 (32.1%) | 1,419 (29.0%) |
| 75 Years and over | 1,020 (36.5%) | 1,910 (48.8%) |
Disability Class by Sex by Age in Howard County
Disability Class: Hearing Difficulty
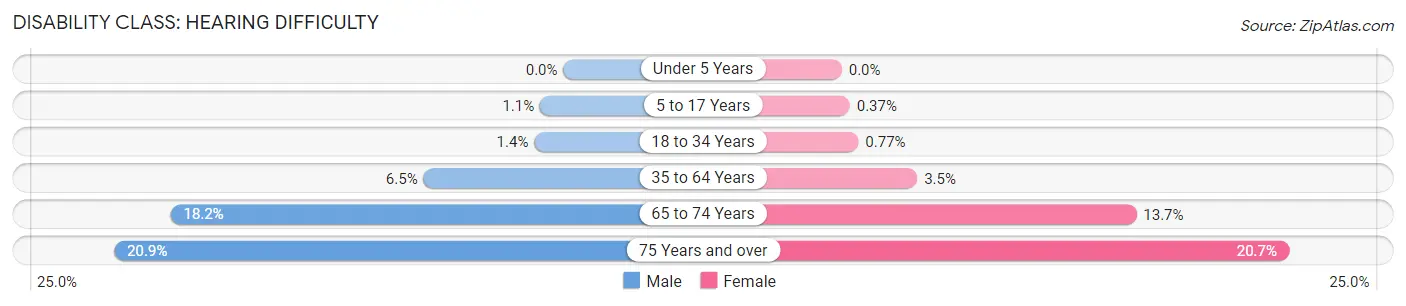
| Age Bracket | Male | Female |
| Under 5 Years | 0 (0.0%) | 0 (0.0%) |
| 5 to 17 Years | 79 (1.1%) | 25 (0.4%) |
| 18 to 34 Years | 115 (1.3%) | 63 (0.8%) |
| 35 to 64 Years | 950 (6.5%) | 570 (3.5%) |
| 65 to 74 Years | 755 (18.2%) | 669 (13.7%) |
| 75 Years and over | 583 (20.8%) | 811 (20.7%) |
Disability Class: Vision Difficulty
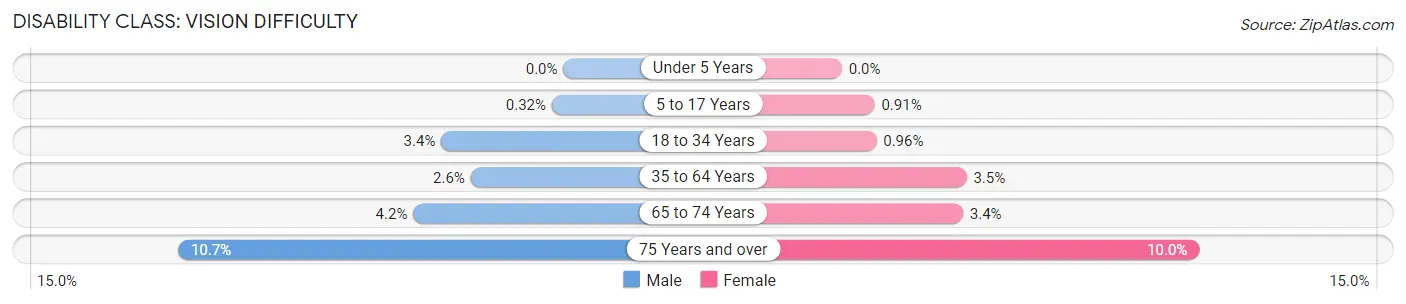
| Age Bracket | Male | Female |
| Under 5 Years | 0 (0.0%) | 0 (0.0%) |
| 5 to 17 Years | 23 (0.3%) | 62 (0.9%) |
| 18 to 34 Years | 289 (3.4%) | 78 (1.0%) |
| 35 to 64 Years | 378 (2.6%) | 565 (3.5%) |
| 65 to 74 Years | 173 (4.2%) | 165 (3.4%) |
| 75 Years and over | 300 (10.7%) | 389 (10.0%) |
Disability Class: Cognitive Difficulty
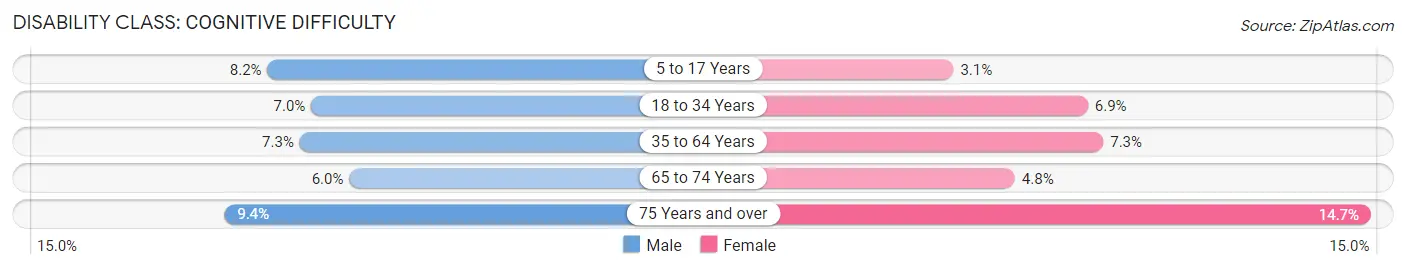
| Age Bracket | Male | Female |
| 5 to 17 Years | 601 (8.2%) | 211 (3.1%) |
| 18 to 34 Years | 596 (7.0%) | 559 (6.9%) |
| 35 to 64 Years | 1,073 (7.3%) | 1,185 (7.3%) |
| 65 to 74 Years | 247 (6.0%) | 236 (4.8%) |
| 75 Years and over | 264 (9.4%) | 576 (14.7%) |
Disability Class: Ambulatory Difficulty
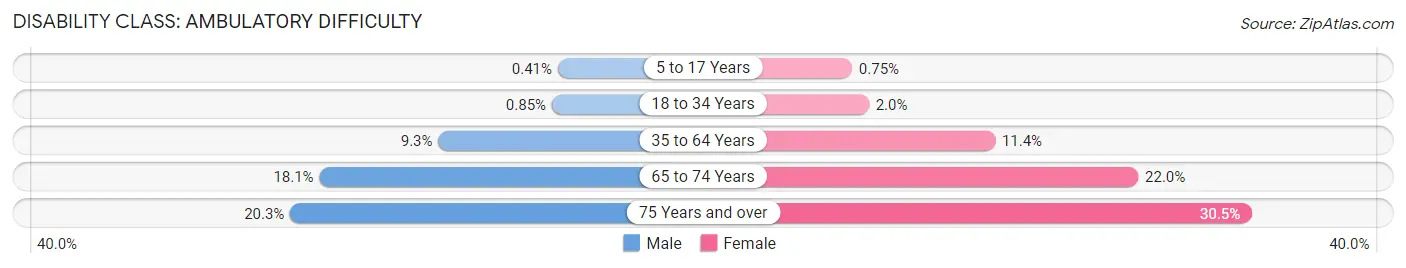
| Age Bracket | Male | Female |
| 5 to 17 Years | 30 (0.4%) | 51 (0.7%) |
| 18 to 34 Years | 72 (0.9%) | 163 (2.0%) |
| 35 to 64 Years | 1,357 (9.3%) | 1,850 (11.4%) |
| 65 to 74 Years | 750 (18.1%) | 1,077 (22.0%) |
| 75 Years and over | 567 (20.3%) | 1,191 (30.5%) |
Disability Class: Self-Care Difficulty
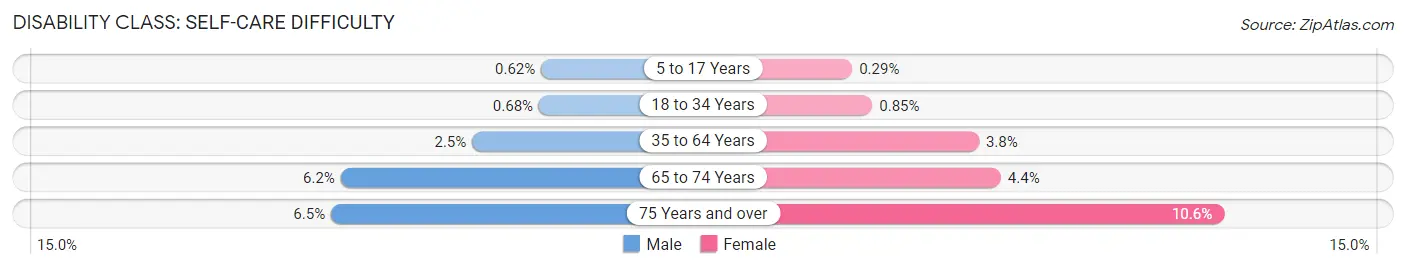
| Age Bracket | Male | Female |
| 5 to 17 Years | 45 (0.6%) | 20 (0.3%) |
| 18 to 34 Years | 58 (0.7%) | 69 (0.9%) |
| 35 to 64 Years | 372 (2.5%) | 621 (3.8%) |
| 65 to 74 Years | 257 (6.2%) | 217 (4.4%) |
| 75 Years and over | 181 (6.5%) | 416 (10.6%) |
Technology Access in Howard County
Computing Device Access in Howard County
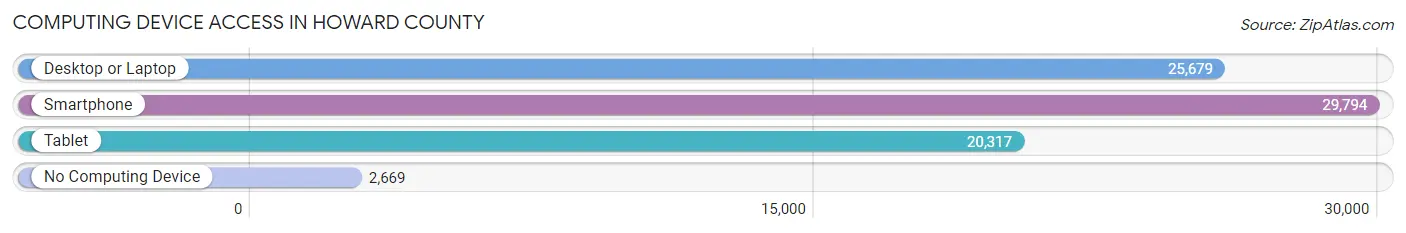
| Device Type | # Households | % Households |
| Desktop or Laptop | 25,679 | 73.5% |
| Smartphone | 29,794 | 85.2% |
| Tablet | 20,317 | 58.1% |
| No Computing Device | 2,669 | 7.6% |
| Total | 34,957 | 100.0% |
Internet Access in Howard County
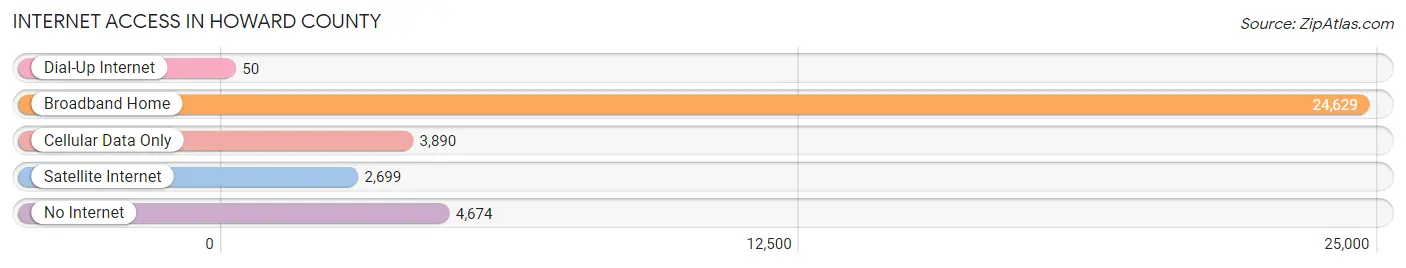
| Internet Type | # Households | % Households |
| Dial-Up Internet | 50 | 0.1% |
| Broadband Home | 24,629 | 70.5% |
| Cellular Data Only | 3,890 | 11.1% |
| Satellite Internet | 2,699 | 7.7% |
| No Internet | 4,674 | 13.4% |
| Total | 34,957 | 100.0% |
Howard County Summary
Howard County is located in the east central region of Indiana, and is part of the Kokomo Metropolitan Statistical Area. The county seat is Kokomo, and the county was named for General Tilghman Ashurst Howard, a veteran of the War of 1812. As of the 2010 census, the population of Howard County was 82,752.
Geography
Howard County is located in east central Indiana, and is bordered by Cass County to the north, Tipton County to the east, Grant County to the south, and Miami County to the west. The county has a total area of 437 square miles, of which 434 square miles is land and 3 square miles is water. The county is located in the Central Till Plains region of Indiana, and is characterized by rolling hills and flat plains. The highest point in the county is located in the northwest corner, at an elevation of 1,000 feet.
The county is home to several bodies of water, including Wildcat Creek, which runs through the county from north to south, and the Mississinewa River, which runs through the eastern part of the county. Other bodies of water include Lake Cicott, Lake Santee, and Lake Wawasee.
Demographics
As of the 2010 census, the population of Howard County was 82,752, with a population density of 189.7 people per square mile. The racial makeup of the county was 87.2% White, 8.3% African American, 0.4% Native American, 1.2% Asian, 0.1% Pacific Islander, 1.2% from other races, and 1.6% from two or more races. Hispanic or Latino of any race were 3.2% of the population.
The median income for a household in the county was $45,945, and the median income for a family was $54,945. The per capita income for the county was $22,845. About 8.2% of families and 11.2% of the population were below the poverty line, including 15.2% of those under age 18 and 6.2% of those age 65 or over.
Economy
Howard County is home to several major employers, including Delphi Electronics and Safety, Haynes International, and Chrysler. The county is also home to several smaller businesses, including manufacturing, retail, and service industries.
The county is home to several higher education institutions, including Indiana University Kokomo, Ivy Tech Community College, and Taylor University.
History
Howard County was formed in 1844 from parts of Miami and Tipton counties. The county was named for General Tilghman Ashurst Howard, a veteran of the War of 1812.
The county was largely agricultural in its early years, with corn, wheat, and oats being the main crops. The county also had a thriving livestock industry, with cattle, hogs, and sheep being raised in the area.
In the late 19th century, the county began to industrialize, with the establishment of several factories in the area. The county also saw an influx of immigrants, with many coming from Germany, Ireland, and Italy.
In the early 20th century, the county continued to industrialize, with the establishment of several automobile factories in the area. The county also saw an influx of African Americans from the South, who came to the area to work in the factories.
Today, Howard County is a thriving community, with a diverse economy and a strong educational system. The county is home to several major employers, and is a popular destination for tourists and outdoor enthusiasts.
Common Questions
What is the Total Population of Howard County?
Total Population of Howard County is 83,452.
What is the Total Male Population of Howard County?
Total Male Population of Howard County is 40,618.
What is the Total Female Population of Howard County?
Total Female Population of Howard County is 42,834.
What is the Ratio of Males per 100 Females in Howard County?
There are 94.83 Males per 100 Females in Howard County.
What is the Ratio of Females per 100 Males in Howard County?
There are 105.46 Females per 100 Males in Howard County.
What is the Median Population Age in Howard County?
Median Population Age in Howard County is 41.2 Years.
What is the Average Family Size in Howard County
Average Family Size in Howard County is 3.0 People.
What is the Average Household Size in Howard County
Average Household Size in Howard County is 2.4 People.
What is Per Capita Income in Howard County?
Per Capita income in Howard County is $33,391.
What is the Median Family Income in Howard County?
Median Family Income in Howard County is $79,222.
What is the Median Household income in Howard County?
Median Household Income in Howard County is $62,014.
What is Income or Wage Gap in Howard County?
Income or Wage Gap in Howard County is 31.4%.
Women in Howard County earn 68.6 cents for every dollar earned by a man.
What is Family Income Deficit in Howard County?
Family Income Deficit in Howard County is $10,368.
Families that are below poverty line in Howard County earn $10,368 less on average than the poverty threshold level.
What is Inequality or Gini Index in Howard County?
Inequality or Gini Index in Howard County is 0.42.
How Large is the Labor Force in Howard County?
There are 39,654 People in the Labor Forcein in Howard County.
What is the Percentage of People in the Labor Force in Howard County?
59.4% of People are in the Labor Force in Howard County.
What is the Unemployment Rate in Howard County?
Unemployment Rate in Howard County is 5.8%.