Henry County, IN
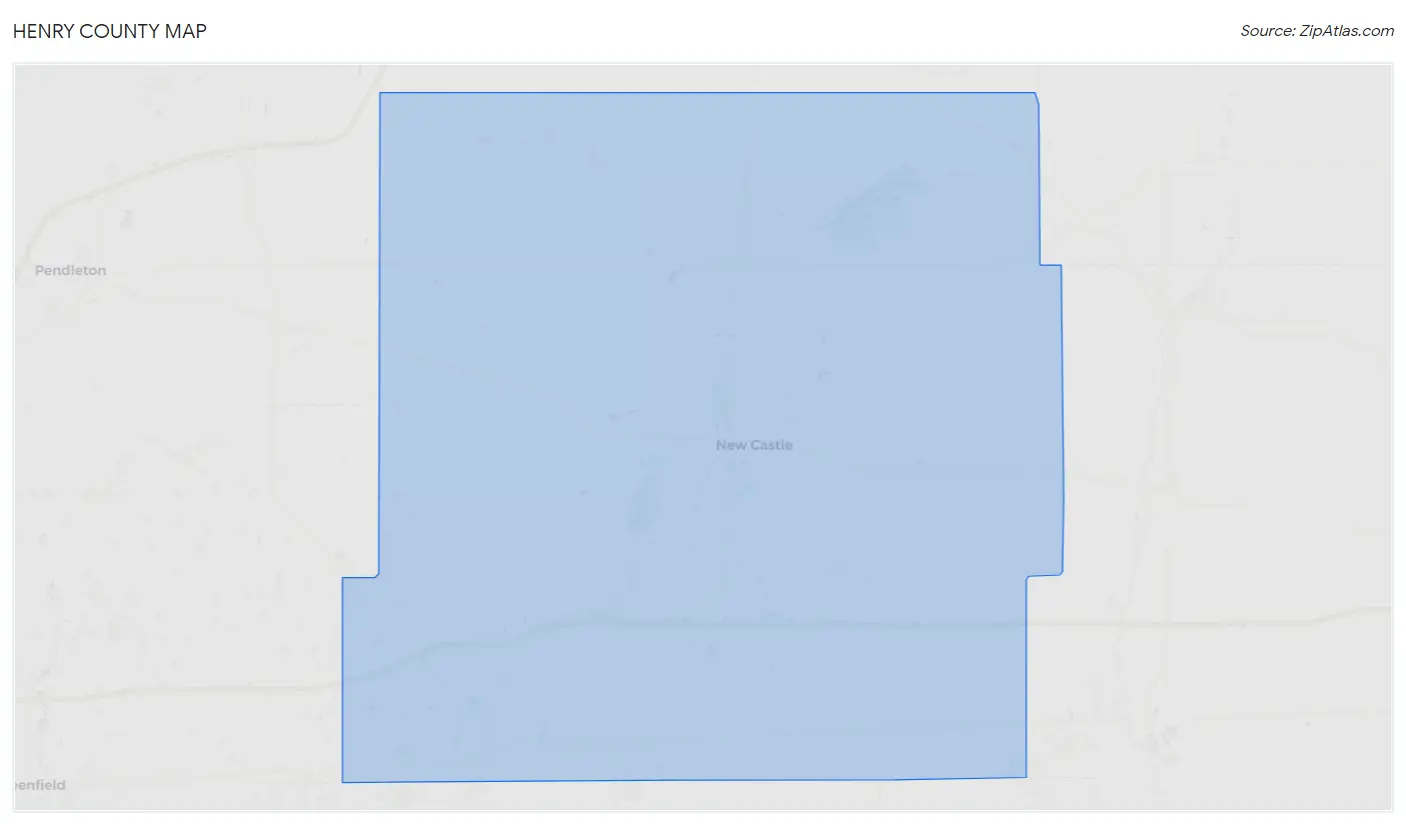
Henry County Map
Henry County Overview
48,913
TOTAL POPULATION
25,877
MALE POPULATION
23,036
FEMALE POPULATION
112.33
MALES / 100 FEMALES
89.02
FEMALES / 100 MALES
42.2
MEDIAN AGE
3.0
AVG FAMILY SIZE
2.5
AVG HOUSEHOLD SIZE
$29,421
PER CAPITA INCOME
$71,332
AVG FAMILY INCOME
$57,632
AVG HOUSEHOLD INCOME
22.7%
WAGE / INCOME GAP [ % ]
77.3¢/ $1
WAGE / INCOME GAP [ $ ]
$10,274
FAMILY INCOME DEFICIT
0.43
INEQUALITY / GINI INDEX
21,634
LABOR FORCE [ PEOPLE ]
54.0%
PERCENT IN LABOR FORCE
4.5%
UNEMPLOYMENT RATE
Race in Henry County
The most populous races in Henry County are White / Caucasian (45,776 | 93.6%), Two or more Races (1,285 | 2.6%), and Black / African American (1,189 | 2.4%).
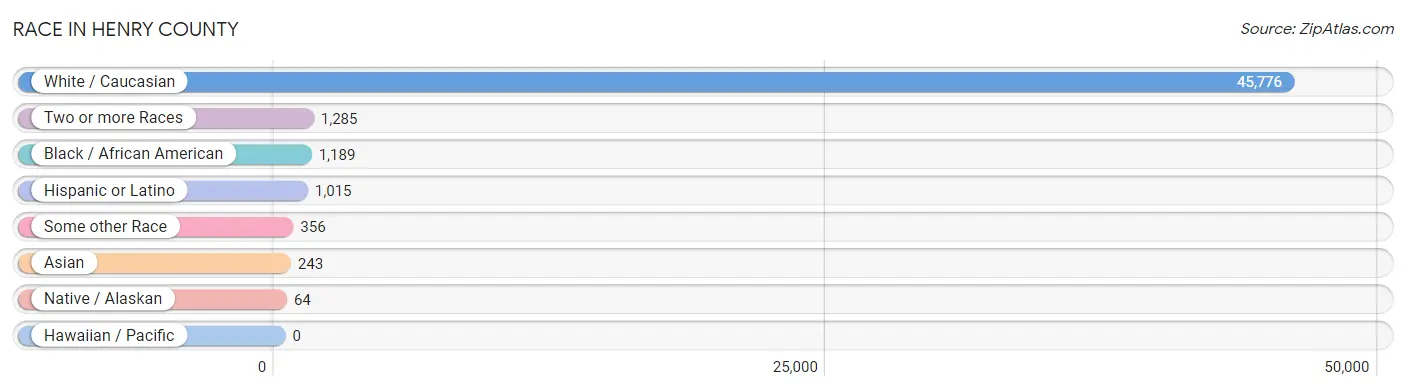
| Race | # Population | % Population |
| Asian | 243 | 0.5% |
| Black / African American | 1,189 | 2.4% |
| Hawaiian / Pacific | 0 | 0.0% |
| Hispanic or Latino | 1,015 | 2.1% |
| Native / Alaskan | 64 | 0.1% |
| White / Caucasian | 45,776 | 93.6% |
| Two or more Races | 1,285 | 2.6% |
| Some other Race | 356 | 0.7% |
| Total | 48,913 | 100.0% |
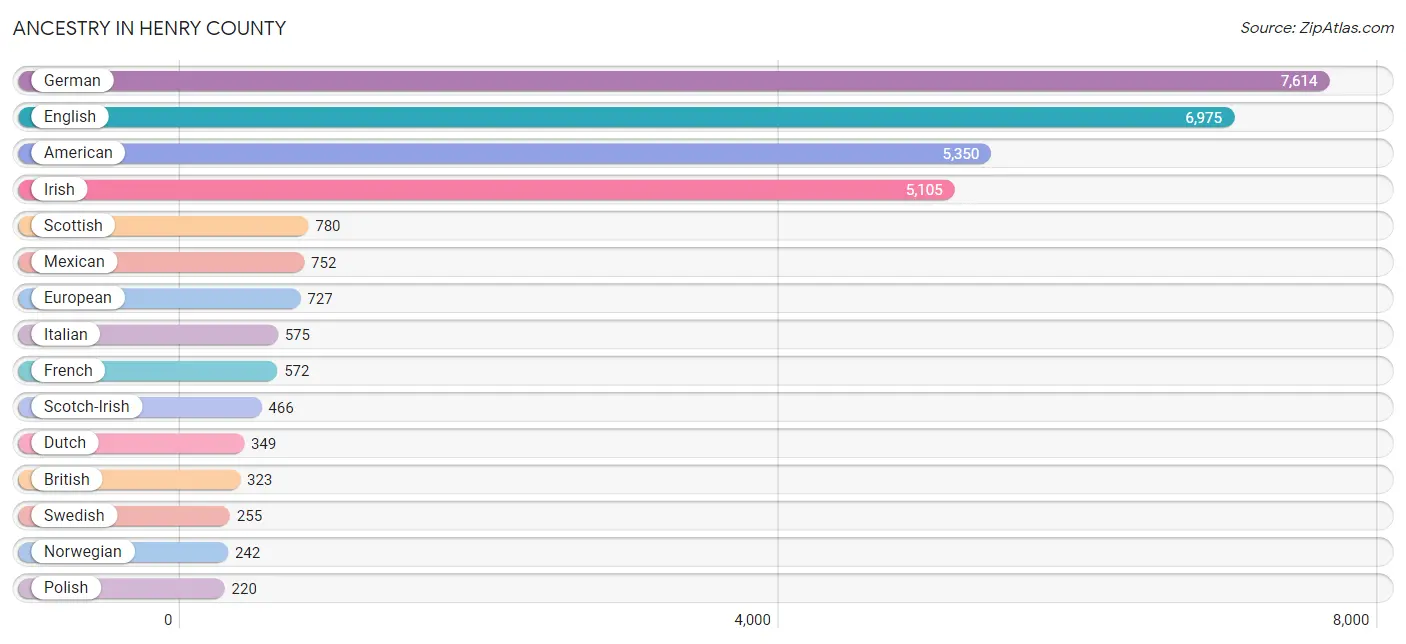
Ancestry in Henry County
The most populous ancestries reported in Henry County are German (7,614 | 15.6%), English (6,975 | 14.3%), American (5,350 | 10.9%), Irish (5,105 | 10.4%), and Scottish (780 | 1.6%), together accounting for 52.8% of all Henry County residents.
| Ancestry | # Population | % Population |
| African | 27 | 0.1% |
| American | 5,350 | 10.9% |
| Arab | 9 | 0.0% |
| Austrian | 14 | 0.0% |
| Bahamian | 5 | 0.0% |
| Belgian | 13 | 0.0% |
| Bhutanese | 43 | 0.1% |
| Blackfeet | 41 | 0.1% |
| British | 323 | 0.7% |
| Bulgarian | 13 | 0.0% |
| Burmese | 67 | 0.1% |
| Cajun | 3 | 0.0% |
| Canadian | 43 | 0.1% |
| Central American | 44 | 0.1% |
| Cherokee | 159 | 0.3% |
| Cheyenne | 10 | 0.0% |
| Choctaw | 2 | 0.0% |
| Comanche | 1 | 0.0% |
| Costa Rican | 16 | 0.0% |
| Creek | 2 | 0.0% |
| Croatian | 15 | 0.0% |
| Cuban | 59 | 0.1% |
| Czech | 10 | 0.0% |
| Czechoslovakian | 8 | 0.0% |
| Danish | 76 | 0.2% |
| Dutch | 349 | 0.7% |
| Eastern European | 90 | 0.2% |
| English | 6,975 | 14.3% |
| Ethiopian | 14 | 0.0% |
| European | 727 | 1.5% |
| French | 572 | 1.2% |
| French Canadian | 139 | 0.3% |
| German | 7,614 | 15.6% |
| German Russian | 13 | 0.0% |
| Greek | 47 | 0.1% |
| Guatemalan | 4 | 0.0% |
| Haitian | 11 | 0.0% |
| Honduran | 4 | 0.0% |
| Hungarian | 89 | 0.2% |
| Icelander | 10 | 0.0% |
| Indian (Asian) | 120 | 0.3% |
| Indonesian | 22 | 0.0% |
| Irish | 5,105 | 10.4% |
| Iroquois | 17 | 0.0% |
| Italian | 575 | 1.2% |
| Korean | 87 | 0.2% |
| Latvian | 12 | 0.0% |
| Lithuanian | 8 | 0.0% |
| Mexican | 752 | 1.5% |
| Mexican American Indian | 24 | 0.1% |
| Moroccan | 9 | 0.0% |
| Navajo | 2 | 0.0% |
| Nicaraguan | 4 | 0.0% |
| Northern European | 35 | 0.1% |
| Norwegian | 242 | 0.5% |
| Polish | 220 | 0.4% |
| Portuguese | 4 | 0.0% |
| Puerto Rican | 101 | 0.2% |
| Russian | 29 | 0.1% |
| Salvadoran | 16 | 0.0% |
| Samoan | 25 | 0.1% |
| Scandinavian | 88 | 0.2% |
| Scotch-Irish | 466 | 0.9% |
| Scottish | 780 | 1.6% |
| Serbian | 12 | 0.0% |
| Sioux | 6 | 0.0% |
| Slovak | 29 | 0.1% |
| South American | 6 | 0.0% |
| Spaniard | 13 | 0.0% |
| Sri Lankan | 7 | 0.0% |
| Subsaharan African | 41 | 0.1% |
| Swedish | 255 | 0.5% |
| Swiss | 108 | 0.2% |
| Ukrainian | 10 | 0.0% |
| Venezuelan | 6 | 0.0% |
| Welsh | 191 | 0.4% | View All 76 Rows |
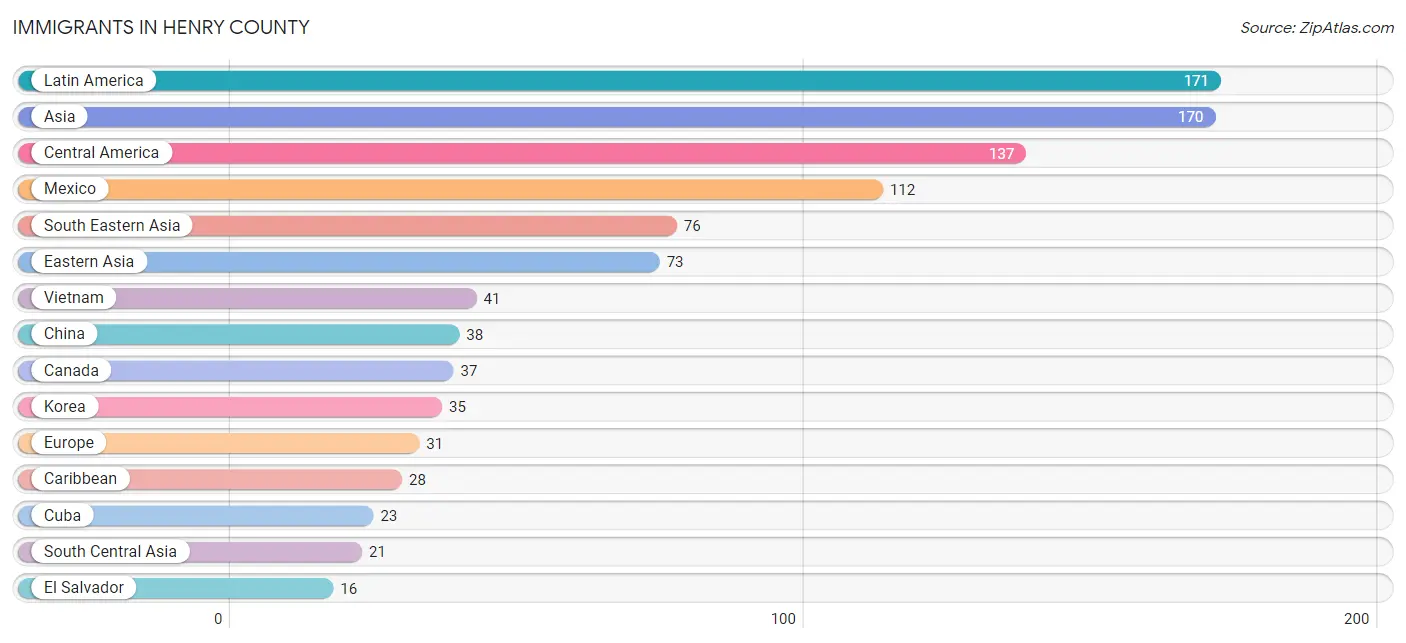
Immigrants in Henry County
The most numerous immigrant groups reported in Henry County came from Latin America (171 | 0.4%), Asia (170 | 0.4%), Central America (137 | 0.3%), Mexico (112 | 0.2%), and South Eastern Asia (76 | 0.2%), together accounting for 1.4% of all Henry County residents.
| Immigration Origin | # Population | % Population |
| Africa | 14 | 0.0% |
| Asia | 170 | 0.4% |
| Bahamas | 5 | 0.0% |
| Bulgaria | 13 | 0.0% |
| Canada | 37 | 0.1% |
| Caribbean | 28 | 0.1% |
| Central America | 137 | 0.3% |
| China | 38 | 0.1% |
| Cuba | 23 | 0.1% |
| Eastern Africa | 14 | 0.0% |
| Eastern Asia | 73 | 0.2% |
| Eastern Europe | 13 | 0.0% |
| El Salvador | 16 | 0.0% |
| England | 1 | 0.0% |
| Ethiopia | 14 | 0.0% |
| Europe | 31 | 0.1% |
| Germany | 15 | 0.0% |
| Greece | 2 | 0.0% |
| Guatemala | 4 | 0.0% |
| Honduras | 4 | 0.0% |
| India | 10 | 0.0% |
| Iran | 11 | 0.0% |
| Korea | 35 | 0.1% |
| Latin America | 171 | 0.4% |
| Mexico | 112 | 0.2% |
| Nicaragua | 1 | 0.0% |
| Northern Europe | 1 | 0.0% |
| Philippines | 13 | 0.0% |
| South America | 6 | 0.0% |
| South Central Asia | 21 | 0.0% |
| South Eastern Asia | 76 | 0.2% |
| Southern Europe | 2 | 0.0% |
| Venezuela | 6 | 0.0% |
| Vietnam | 41 | 0.1% |
| Western Europe | 15 | 0.0% | View All 35 Rows |
Sex and Age in Henry County
Sex and Age in Henry County
The most populous age groups in Henry County are 55 to 59 Years (1,998 | 7.7%) for men and 60 to 64 Years (1,996 | 8.7%) for women.
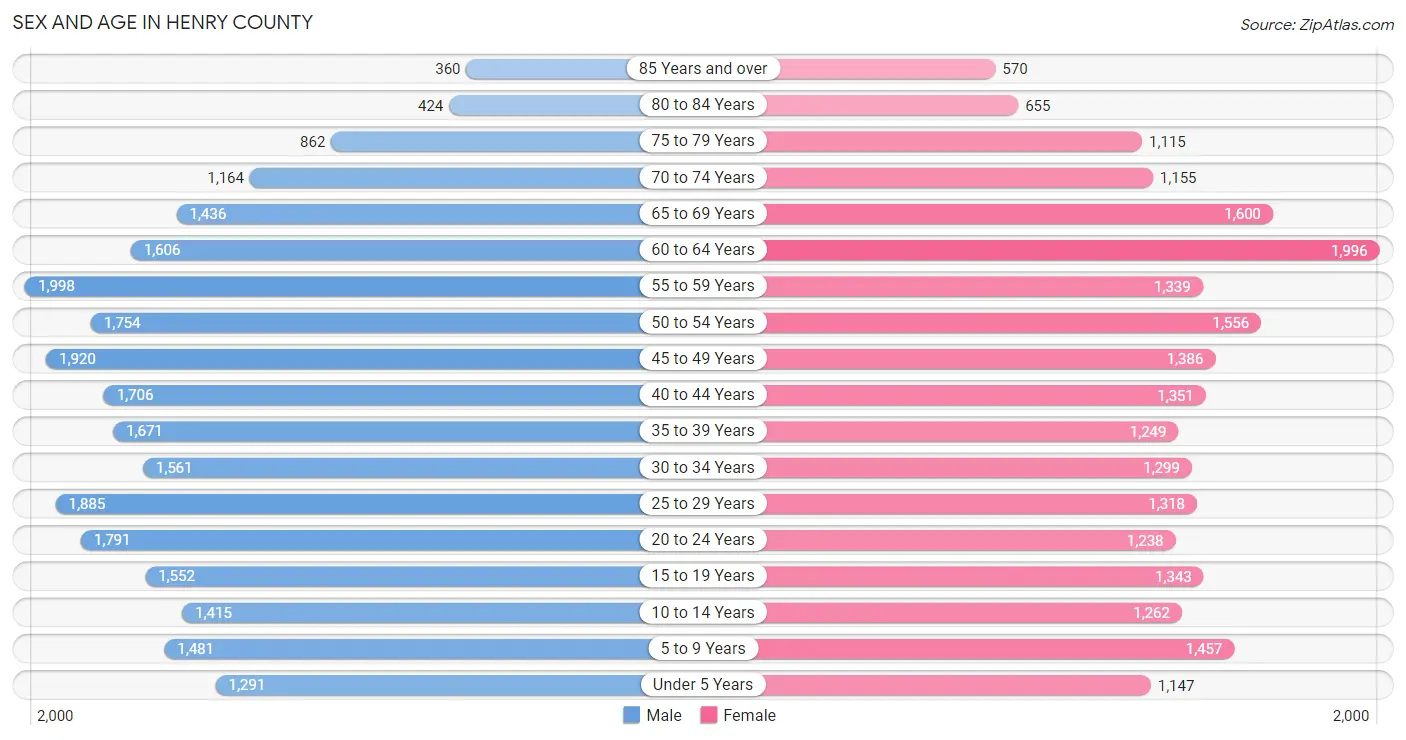
| Age Bracket | Male | Female |
| Under 5 Years | 1,291 (5.0%) | 1,147 (5.0%) |
| 5 to 9 Years | 1,481 (5.7%) | 1,457 (6.3%) |
| 10 to 14 Years | 1,415 (5.5%) | 1,262 (5.5%) |
| 15 to 19 Years | 1,552 (6.0%) | 1,343 (5.8%) |
| 20 to 24 Years | 1,791 (6.9%) | 1,238 (5.4%) |
| 25 to 29 Years | 1,885 (7.3%) | 1,318 (5.7%) |
| 30 to 34 Years | 1,561 (6.0%) | 1,299 (5.6%) |
| 35 to 39 Years | 1,671 (6.5%) | 1,249 (5.4%) |
| 40 to 44 Years | 1,706 (6.6%) | 1,351 (5.9%) |
| 45 to 49 Years | 1,920 (7.4%) | 1,386 (6.0%) |
| 50 to 54 Years | 1,754 (6.8%) | 1,556 (6.8%) |
| 55 to 59 Years | 1,998 (7.7%) | 1,339 (5.8%) |
| 60 to 64 Years | 1,606 (6.2%) | 1,996 (8.7%) |
| 65 to 69 Years | 1,436 (5.6%) | 1,600 (7.0%) |
| 70 to 74 Years | 1,164 (4.5%) | 1,155 (5.0%) |
| 75 to 79 Years | 862 (3.3%) | 1,115 (4.8%) |
| 80 to 84 Years | 424 (1.6%) | 655 (2.8%) |
| 85 Years and over | 360 (1.4%) | 570 (2.5%) |
| Total | 25,877 (100.0%) | 23,036 (100.0%) |
Families and Households in Henry County
Median Family Size in Henry County
The median family size in Henry County is 3.04 persons per family, with married-couple families (9,101 | 75.2%) accounting for the largest median family size of 3.1 persons per family. On the other hand, single male/father families (1,139 | 9.4%) represent the smallest median family size with 2.59 persons per family.
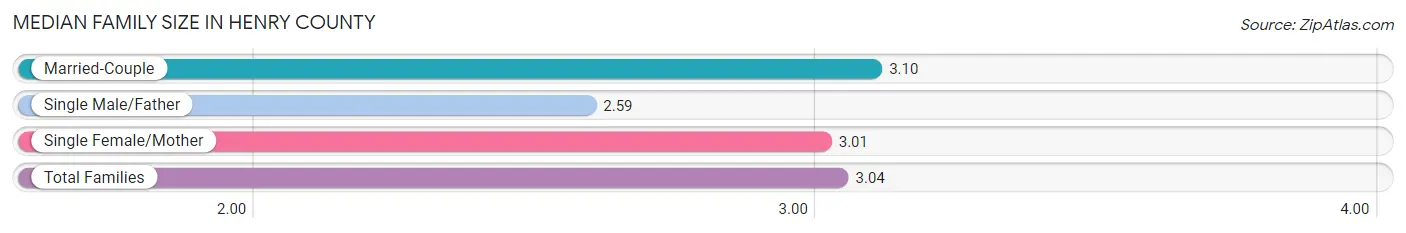
| Family Type | # Families | Family Size |
| Married-Couple | 9,101 (75.2%) | 3.10 |
| Single Male/Father | 1,139 (9.4%) | 2.59 |
| Single Female/Mother | 1,860 (15.4%) | 3.01 |
| Total Families | 12,100 (100.0%) | 3.04 |
Median Household Size in Henry County
The median household size in Henry County is 2.47 persons per household, with single female/mother households (1,860 | 10.0%) accounting for the largest median household size of 3.29 persons per household. non-family households (6,449 | 34.8%) represent the smallest median household size with 1.18 persons per household.
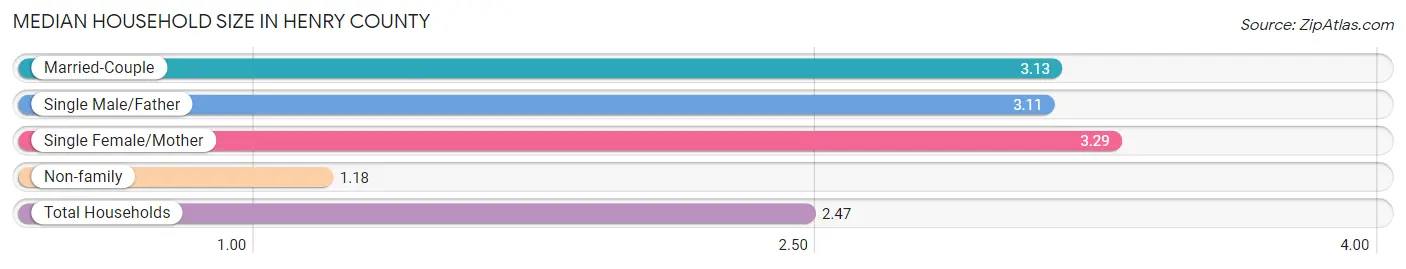
| Household Type | # Households | Household Size |
| Married-Couple | 9,101 (49.1%) | 3.13 |
| Single Male/Father | 1,139 (6.1%) | 3.11 |
| Single Female/Mother | 1,860 (10.0%) | 3.29 |
| Non-family | 6,449 (34.8%) | 1.18 |
| Total Households | 18,549 (100.0%) | 2.47 |
Household Size by Marriage Status in Henry County
Out of a total of 18,549 households in Henry County, 12,100 (65.2%) are family households, while 6,449 (34.8%) are nonfamily households. The most numerous type of family households are 2-person households, comprising 5,877, and the most common type of nonfamily households are 1-person households, comprising 5,565.
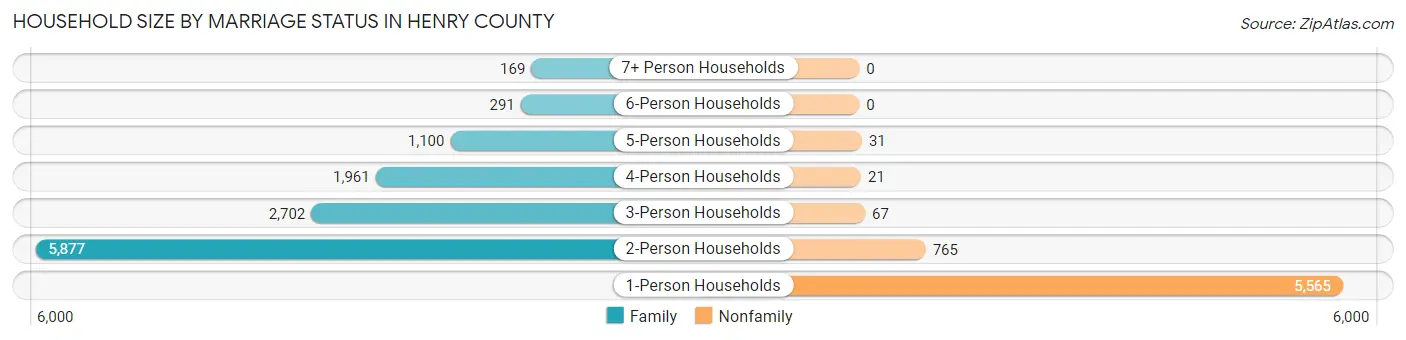
| Household Size | Family Households | Nonfamily Households |
| 1-Person Households | - | 5,565 (30.0%) |
| 2-Person Households | 5,877 (31.7%) | 765 (4.1%) |
| 3-Person Households | 2,702 (14.6%) | 67 (0.4%) |
| 4-Person Households | 1,961 (10.6%) | 21 (0.1%) |
| 5-Person Households | 1,100 (5.9%) | 31 (0.2%) |
| 6-Person Households | 291 (1.6%) | 0 (0.0%) |
| 7+ Person Households | 169 (0.9%) | 0 (0.0%) |
| Total | 12,100 (65.2%) | 6,449 (34.8%) |
Female Fertility in Henry County
Fertility by Age in Henry County
Average fertility rate in Henry County is 48.0 births per 1,000 women. Women in the age bracket of 20 to 34 years have the highest fertility rate with 98.0 births per 1,000 women. Women in the age bracket of 20 to 34 years acount for 82.5% of all women with births.
| Age Bracket | Women with Births | Births / 1,000 Women |
| 15 to 19 years | 5 (1.1%) | 4.0 |
| 20 to 34 years | 377 (82.5%) | 98.0 |
| 35 to 50 years | 75 (16.4%) | 18.0 |
| Total | 457 (100.0%) | 48.0 |
Fertility by Age by Marriage Status in Henry County
42.9% of women with births (457) in Henry County are married. The highest percentage of unmarried women with births falls into 15 to 19 years age bracket with 100.0% of them unmarried at the time of birth, while the lowest percentage of unmarried women with births belong to 35 to 50 years age bracket with 42.7% of them unmarried.
| Age Bracket | Married | Unmarried |
| 15 to 19 years | 0 (0.0%) | 5 (100.0%) |
| 20 to 34 years | 153 (40.6%) | 224 (59.4%) |
| 35 to 50 years | 43 (57.3%) | 32 (42.7%) |
| Total | 196 (42.9%) | 261 (57.1%) |
Fertility by Education in Henry County
| Educational Attainment | Women with Births | Births / 1,000 Women |
| Less than High School | 22 (4.8%) | 16.0 |
| High School Diploma | 169 (37.0%) | 62.0 |
| College or Associate's Degree | 216 (47.3%) | 63.0 |
| Bachelor's Degree | 50 (10.9%) | 34.0 |
| Graduate Degree | 0 (0.0%) | 0.0 |
| Total | 457 (100.0%) | 48.0 |
Fertility by Education by Marriage Status in Henry County
57.1% of women with births in Henry County are unmarried. Women with the educational attainment of bachelor's degree are most likely to be married with 100.0% of them married at childbirth, while women with the educational attainment of less than high school are least likely to be married with 81.8% of them unmarried at childbirth.
| Educational Attainment | Married | Unmarried |
| Less than High School | 4 (18.2%) | 18 (81.8%) |
| High School Diploma | 60 (35.5%) | 109 (64.5%) |
| College or Associate's Degree | 82 (38.0%) | 134 (62.0%) |
| Bachelor's Degree | 50 (100.0%) | 0 (0.0%) |
| Graduate Degree | 0 (0.0%) | 0 (0.0%) |
| Total | 196 (42.9%) | 261 (57.1%) |
Income in Henry County
Income Overview in Henry County
Per Capita Income in Henry County is $29,421, while median incomes of families and households are $71,332 and $57,632 respectively.
| Characteristic | Number | Measure |
| Per Capita Income | 48,913 | $29,421 |
| Median Family Income | 12,100 | $71,332 |
| Mean Family Income | 12,100 | $86,273 |
| Median Household Income | 18,549 | $57,632 |
| Mean Household Income | 18,549 | $74,301 |
| Income Deficit | 12,100 | $10,274 |
| Wage / Income Gap (%) | 48,913 | 22.72% |
| Wage / Income Gap ($) | 48,913 | 77.28¢ per $1 |
| Gini / Inequality Index | 48,913 | 0.43 |
Earnings by Sex in Henry County
Average Earnings in Henry County are $37,372, $43,416 for men and $33,553 for women, a difference of 22.7%.
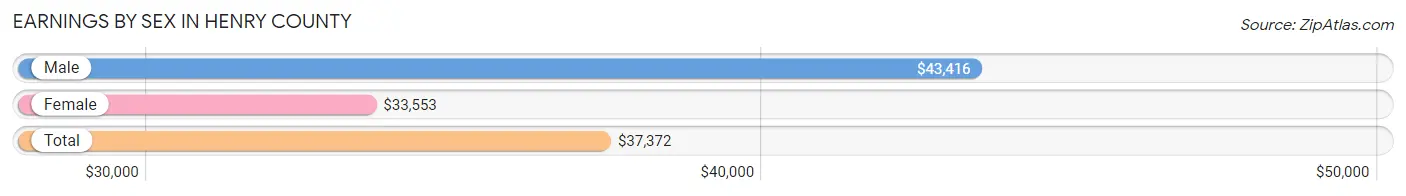
| Sex | Number | Average Earnings |
| Male | 12,454 (54.5%) | $43,416 |
| Female | 10,401 (45.5%) | $33,553 |
| Total | 22,855 (100.0%) | $37,372 |
Earnings by Sex by Income Bracket in Henry County
The most common earnings brackets in Henry County are $75,000 to $99,999 for men (1,207 | 9.7%) and $35,000 to $39,999 for women (958 | 9.2%).
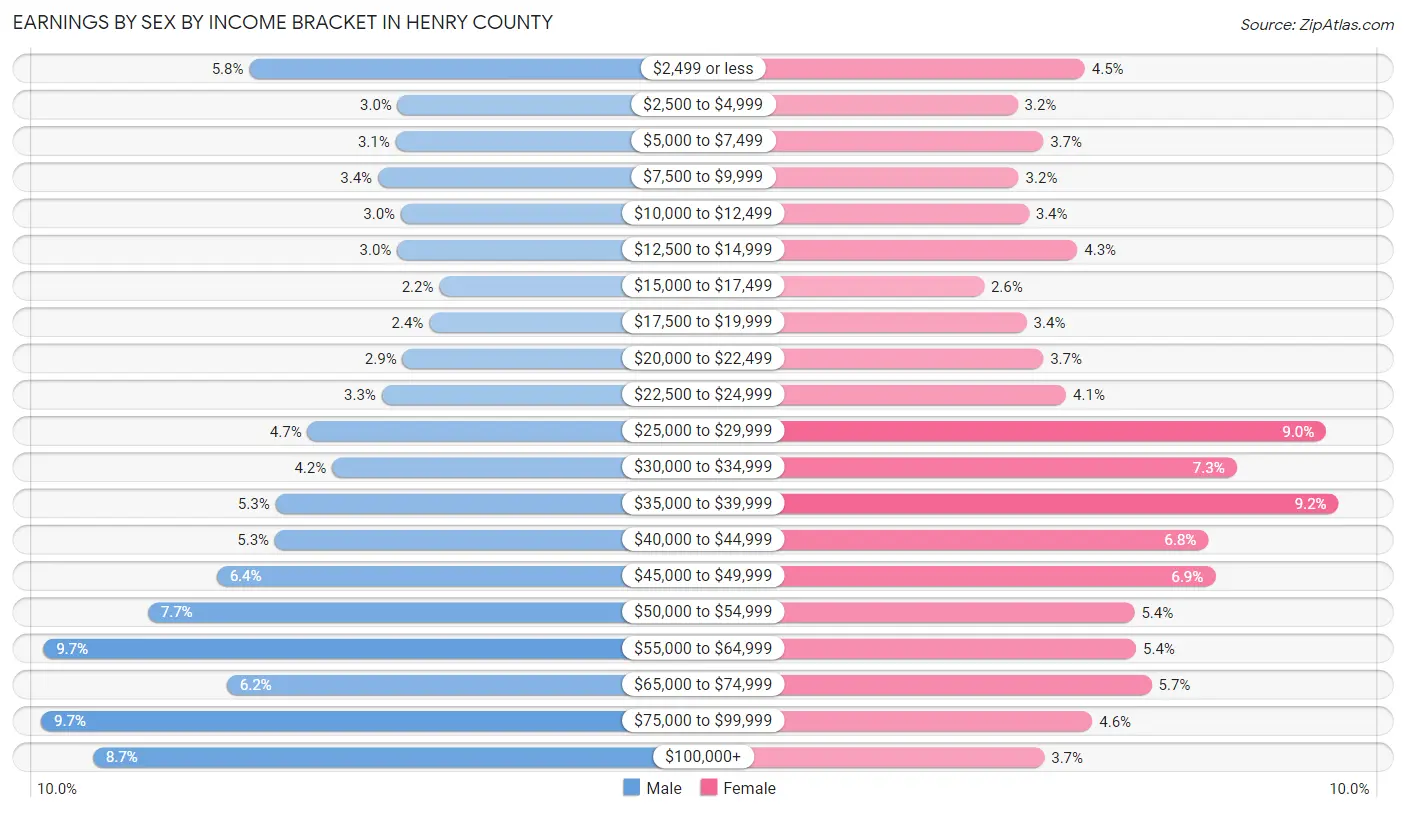
| Income | Male | Female |
| $2,499 or less | 721 (5.8%) | 464 (4.5%) |
| $2,500 to $4,999 | 375 (3.0%) | 333 (3.2%) |
| $5,000 to $7,499 | 380 (3.0%) | 383 (3.7%) |
| $7,500 to $9,999 | 421 (3.4%) | 335 (3.2%) |
| $10,000 to $12,499 | 368 (2.9%) | 355 (3.4%) |
| $12,500 to $14,999 | 376 (3.0%) | 449 (4.3%) |
| $15,000 to $17,499 | 278 (2.2%) | 267 (2.6%) |
| $17,500 to $19,999 | 302 (2.4%) | 350 (3.4%) |
| $20,000 to $22,499 | 364 (2.9%) | 383 (3.7%) |
| $22,500 to $24,999 | 412 (3.3%) | 427 (4.1%) |
| $25,000 to $29,999 | 585 (4.7%) | 934 (9.0%) |
| $30,000 to $34,999 | 528 (4.2%) | 759 (7.3%) |
| $35,000 to $39,999 | 660 (5.3%) | 958 (9.2%) |
| $40,000 to $44,999 | 661 (5.3%) | 704 (6.8%) |
| $45,000 to $49,999 | 797 (6.4%) | 718 (6.9%) |
| $50,000 to $54,999 | 958 (7.7%) | 561 (5.4%) |
| $55,000 to $64,999 | 1,202 (9.7%) | 564 (5.4%) |
| $65,000 to $74,999 | 773 (6.2%) | 594 (5.7%) |
| $75,000 to $99,999 | 1,207 (9.7%) | 478 (4.6%) |
| $100,000+ | 1,086 (8.7%) | 385 (3.7%) |
| Total | 12,454 (100.0%) | 10,401 (100.0%) |
Earnings by Sex by Educational Attainment in Henry County
Average earnings in Henry County are $47,834 for men and $36,893 for women, a difference of 22.9%. Men with an educational attainment of bachelor's degree enjoy the highest average annual earnings of $65,357, while those with less than high school education earn the least with $24,399. Women with an educational attainment of graduate degree earn the most with the average annual earnings of $65,408, while those with less than high school education have the smallest earnings of $19,792.
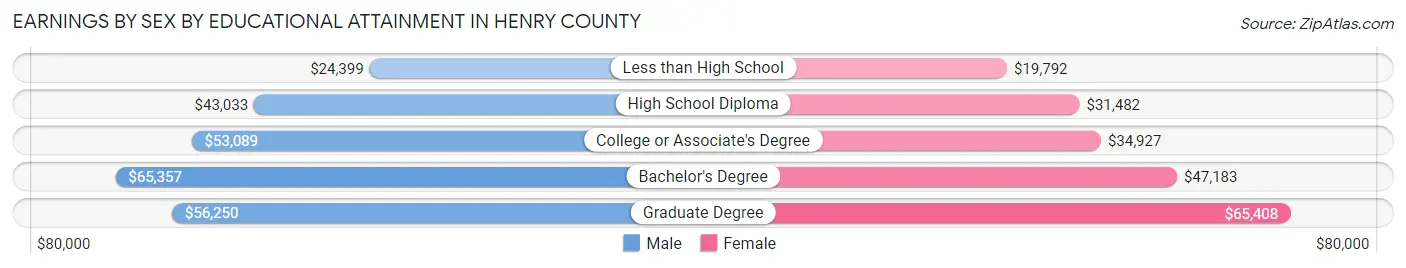
| Educational Attainment | Male Income | Female Income |
| Less than High School | $24,399 | $19,792 |
| High School Diploma | $43,033 | $31,482 |
| College or Associate's Degree | $53,089 | $34,927 |
| Bachelor's Degree | $65,357 | $47,183 |
| Graduate Degree | $56,250 | $65,408 |
| Total | $47,834 | $36,893 |
Family Income in Henry County
Family Income Brackets in Henry County
According to the Henry County family income data, there are 2,577 families falling into the $100,000 to $149,999 income range, which is the most common income bracket and makes up 21.3% of all families. Conversely, the $10,000 to $14,999 income bracket is the least frequent group with only 242 families (2.0%) belonging to this category.
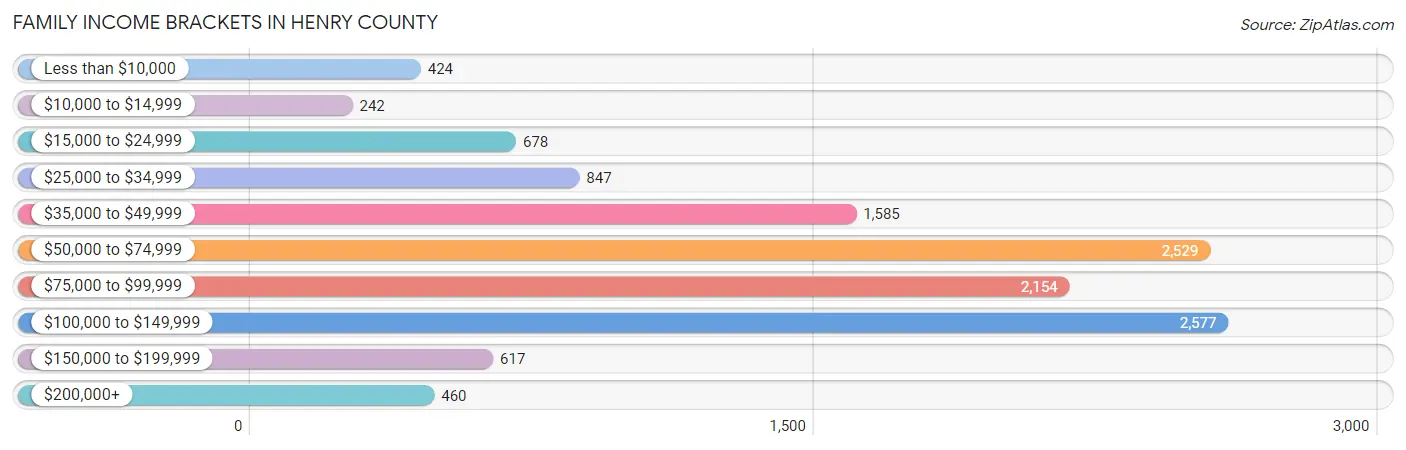
| Income Bracket | # Families | % Families |
| Less than $10,000 | 424 | 3.5% |
| $10,000 to $14,999 | 242 | 2.0% |
| $15,000 to $24,999 | 678 | 5.6% |
| $25,000 to $34,999 | 847 | 7.0% |
| $35,000 to $49,999 | 1,585 | 13.1% |
| $50,000 to $74,999 | 2,529 | 20.9% |
| $75,000 to $99,999 | 2,154 | 17.8% |
| $100,000 to $149,999 | 2,577 | 21.3% |
| $150,000 to $199,999 | 617 | 5.1% |
| $200,000+ | 460 | 3.8% |
Family Income by Famaliy Size in Henry County
7+ person families (153 | 1.3%) account for the highest median family income in Henry County with $126,442 per family, while 2-person families (6,359 | 52.5%) have the highest median income of $30,536 per family member.
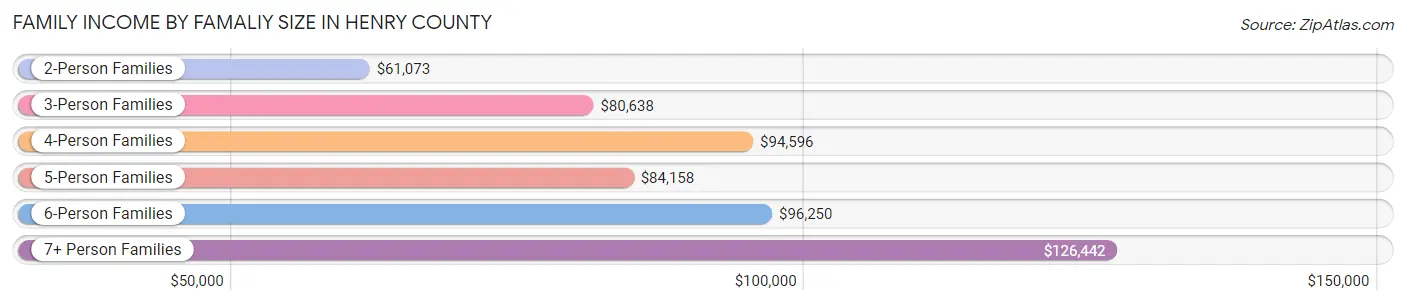
| Income Bracket | # Families | Median Income |
| 2-Person Families | 6,359 (52.5%) | $61,073 |
| 3-Person Families | 2,568 (21.2%) | $80,638 |
| 4-Person Families | 1,837 (15.2%) | $94,596 |
| 5-Person Families | 949 (7.8%) | $84,158 |
| 6-Person Families | 234 (1.9%) | $96,250 |
| 7+ Person Families | 153 (1.3%) | $126,442 |
| Total | 12,100 (100.0%) | $71,332 |
Family Income by Number of Earners in Henry County
The median family income in Henry County is $71,332, with families comprising 3+ earners (1,021) having the highest median family income of $129,028, while families with no earners (2,526) have the lowest median family income of $46,154, accounting for 8.4% and 20.9% of families, respectively.
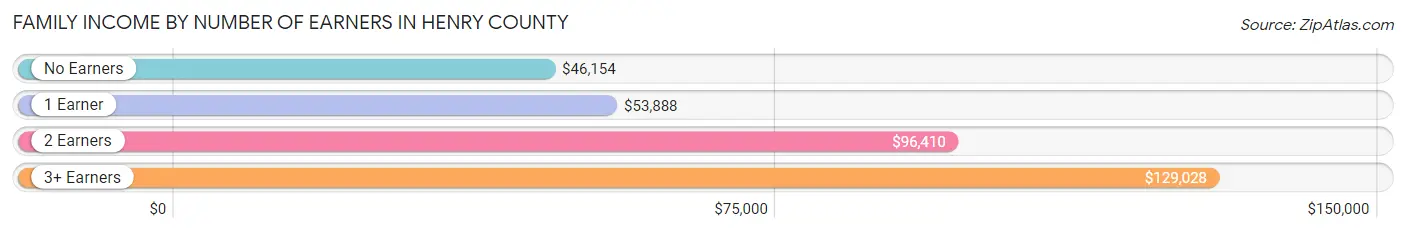
| Number of Earners | # Families | Median Income |
| No Earners | 2,526 (20.9%) | $46,154 |
| 1 Earner | 3,941 (32.6%) | $53,888 |
| 2 Earners | 4,612 (38.1%) | $96,410 |
| 3+ Earners | 1,021 (8.4%) | $129,028 |
| Total | 12,100 (100.0%) | $71,332 |
Household Income in Henry County
Household Income Brackets in Henry County
With 3,821 households falling in the category, the $50,000 to $74,999 income range is the most frequent in Henry County, accounting for 20.6% of all households. In contrast, only 556 households (3.0%) fall into the $200,000+ income bracket, making it the least populous group.
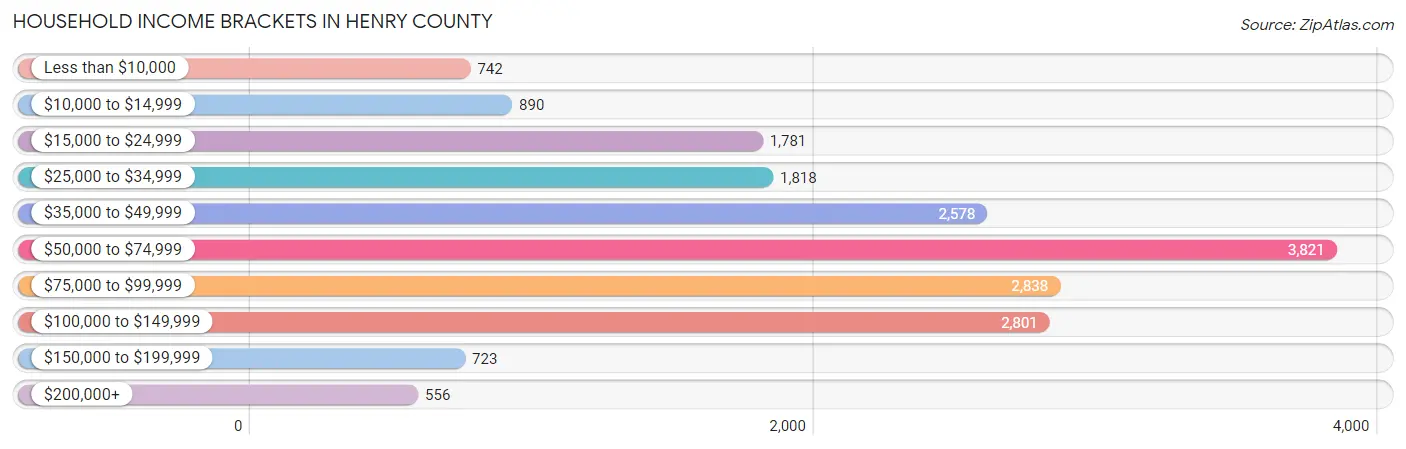
| Income Bracket | # Households | % Households |
| Less than $10,000 | 742 | 4.0% |
| $10,000 to $14,999 | 890 | 4.8% |
| $15,000 to $24,999 | 1,781 | 9.6% |
| $25,000 to $34,999 | 1,818 | 9.8% |
| $35,000 to $49,999 | 2,578 | 13.9% |
| $50,000 to $74,999 | 3,821 | 20.6% |
| $75,000 to $99,999 | 2,838 | 15.3% |
| $100,000 to $149,999 | 2,801 | 15.1% |
| $150,000 to $199,999 | 723 | 3.9% |
| $200,000+ | 556 | 3.0% |
Household Income by Householder Age in Henry County
The median household income in Henry County is $57,632, with the highest median household income of $69,222 found in the 25 to 44 years age bracket for the primary householder. A total of 4,912 households (26.5%) fall into this category. Meanwhile, the 15 to 24 years age bracket for the primary householder has the lowest median household income of $45,164, with 606 households (3.3%) in this group.
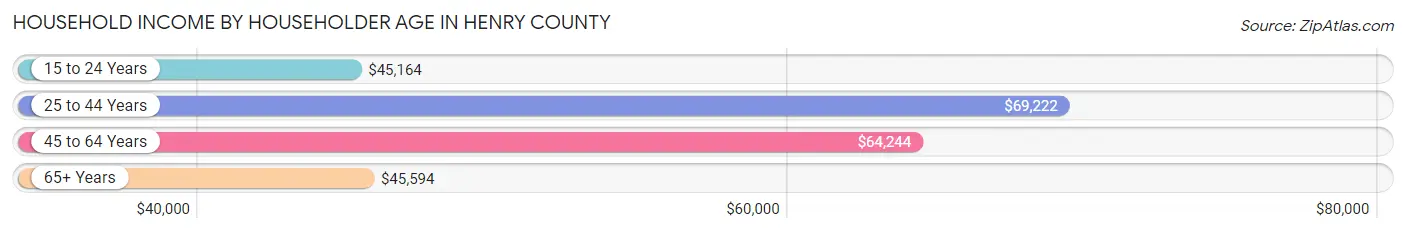
| Income Bracket | # Households | Median Income |
| 15 to 24 Years | 606 (3.3%) | $45,164 |
| 25 to 44 Years | 4,912 (26.5%) | $69,222 |
| 45 to 64 Years | 7,285 (39.3%) | $64,244 |
| 65+ Years | 5,746 (31.0%) | $45,594 |
| Total | 18,549 (100.0%) | $57,632 |
Poverty in Henry County
Income Below Poverty by Sex and Age in Henry County
With 13.7% poverty level for males and 13.7% for females among the residents of Henry County, under 5 year old males and 5 year old females are the most vulnerable to poverty, with 356 males (28.4%) and 92 females (29.2%) in their respective age groups living below the poverty level.
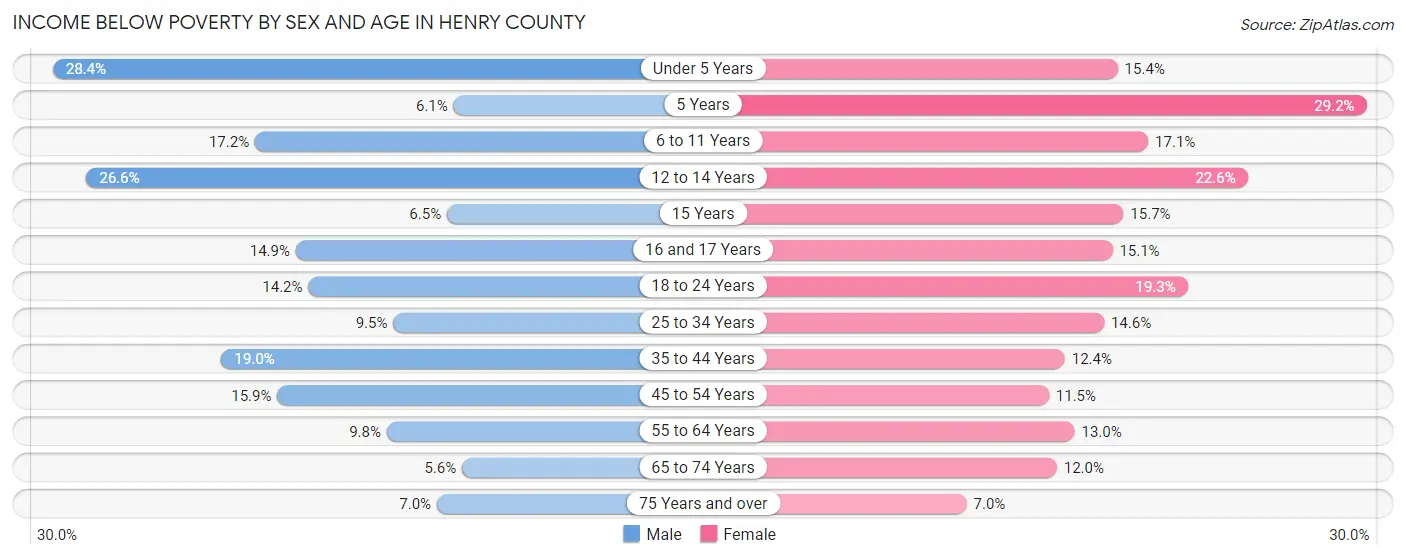
| Age Bracket | Male | Female |
| Under 5 Years | 356 (28.4%) | 174 (15.4%) |
| 5 Years | 16 (6.1%) | 92 (29.2%) |
| 6 to 11 Years | 293 (17.2%) | 281 (17.1%) |
| 12 to 14 Years | 230 (26.6%) | 169 (22.6%) |
| 15 Years | 23 (6.5%) | 69 (15.7%) |
| 16 and 17 Years | 90 (14.9%) | 71 (15.1%) |
| 18 to 24 Years | 318 (14.2%) | 312 (19.3%) |
| 25 to 34 Years | 283 (9.5%) | 382 (14.6%) |
| 35 to 44 Years | 498 (19.0%) | 323 (12.4%) |
| 45 to 54 Years | 503 (15.9%) | 337 (11.5%) |
| 55 to 64 Years | 313 (9.8%) | 430 (13.0%) |
| 65 to 74 Years | 129 (5.6%) | 321 (12.0%) |
| 75 Years and over | 110 (7.0%) | 148 (7.0%) |
| Total | 3,162 (13.7%) | 3,109 (13.7%) |
Income Above Poverty by Sex and Age in Henry County
According to the poverty statistics in Henry County, males aged 65 to 74 years and females aged 75 years and over are the age groups that are most secure financially, with 94.4% of males and 93.0% of females in these age groups living above the poverty line.
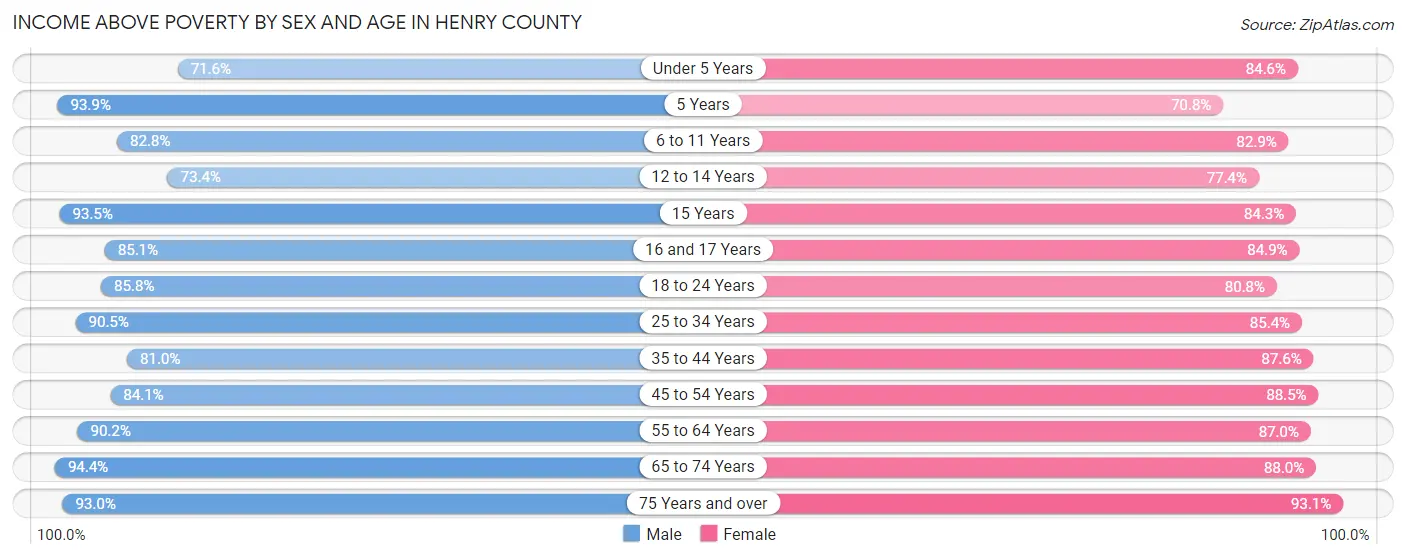
| Age Bracket | Male | Female |
| Under 5 Years | 896 (71.6%) | 959 (84.6%) |
| 5 Years | 246 (93.9%) | 223 (70.8%) |
| 6 to 11 Years | 1,413 (82.8%) | 1,366 (82.9%) |
| 12 to 14 Years | 636 (73.4%) | 579 (77.4%) |
| 15 Years | 332 (93.5%) | 371 (84.3%) |
| 16 and 17 Years | 514 (85.1%) | 400 (84.9%) |
| 18 to 24 Years | 1,921 (85.8%) | 1,309 (80.7%) |
| 25 to 34 Years | 2,706 (90.5%) | 2,235 (85.4%) |
| 35 to 44 Years | 2,117 (81.0%) | 2,277 (87.6%) |
| 45 to 54 Years | 2,654 (84.1%) | 2,585 (88.5%) |
| 55 to 64 Years | 2,871 (90.2%) | 2,888 (87.0%) |
| 65 to 74 Years | 2,159 (94.4%) | 2,360 (88.0%) |
| 75 Years and over | 1,452 (93.0%) | 1,983 (93.0%) |
| Total | 19,917 (86.3%) | 19,535 (86.3%) |
Income Below Poverty Among Married-Couple Families in Henry County
The poverty statistics for married-couple families in Henry County show that 5.1% or 468 of the total 9,101 families live below the poverty line. Families with 5 or more children have the highest poverty rate of 96.9%, comprising of 31 families. On the other hand, families with no children have the lowest poverty rate of 4.2%, which includes 244 families.
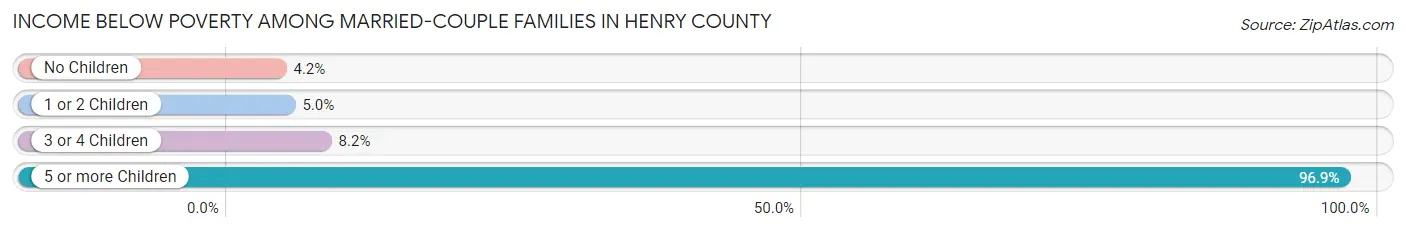
| Children | Above Poverty | Below Poverty |
| No Children | 5,536 (95.8%) | 244 (4.2%) |
| 1 or 2 Children | 2,262 (95.0%) | 119 (5.0%) |
| 3 or 4 Children | 834 (91.8%) | 74 (8.2%) |
| 5 or more Children | 1 (3.1%) | 31 (96.9%) |
| Total | 8,633 (94.9%) | 468 (5.1%) |
Income Below Poverty Among Single-Parent Households in Henry County
According to the poverty data in Henry County, 27.0% or 308 single-father households and 23.5% or 438 single-mother households are living below the poverty line. Among single-father households, those with 5 or more children have the highest poverty rate, with 4 households (100.0%) experiencing poverty. Likewise, among single-mother households, those with 3 or 4 children have the highest poverty rate, with 113 households (55.9%) falling below the poverty line.
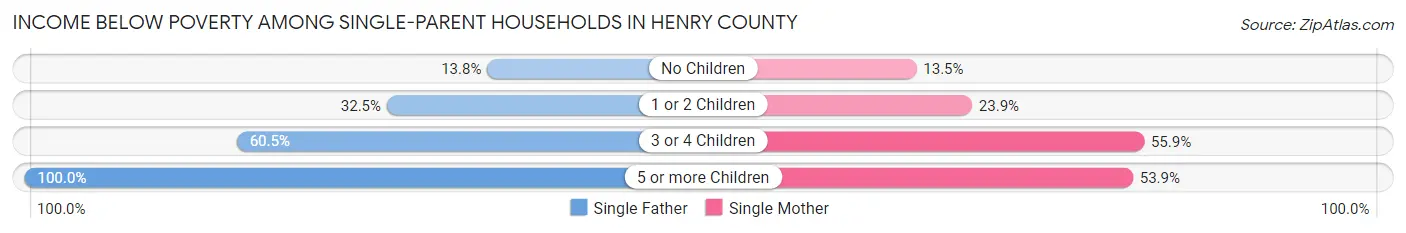
| Children | Single Father | Single Mother |
| No Children | 65 (13.8%) | 98 (13.5%) |
| 1 or 2 Children | 190 (32.5%) | 220 (23.9%) |
| 3 or 4 Children | 49 (60.5%) | 113 (55.9%) |
| 5 or more Children | 4 (100.0%) | 7 (53.8%) |
| Total | 308 (27.0%) | 438 (23.5%) |
Income Below Poverty Among Married-Couple vs Single-Parent Households in Henry County
The poverty data for Henry County shows that 468 of the married-couple family households (5.1%) and 746 of the single-parent households (24.9%) are living below the poverty level. Within the married-couple family households, those with 5 or more children have the highest poverty rate, with 31 households (96.9%) falling below the poverty line. Among the single-parent households, those with 5 or more children have the highest poverty rate, with 11 household (64.7%) living below poverty.
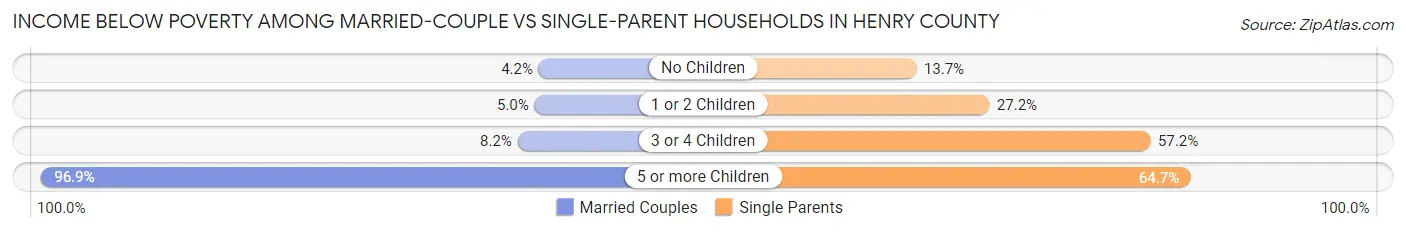
| Children | Married-Couple Families | Single-Parent Households |
| No Children | 244 (4.2%) | 163 (13.7%) |
| 1 or 2 Children | 119 (5.0%) | 410 (27.2%) |
| 3 or 4 Children | 74 (8.2%) | 162 (57.2%) |
| 5 or more Children | 31 (96.9%) | 11 (64.7%) |
| Total | 468 (5.1%) | 746 (24.9%) |
Employment Characteristics in Henry County
Employment by Class of Employer in Henry County
Among the 20,169 employed individuals in Henry County, private company employees (14,474 | 71.8%), not-for-profit organizations (1,796 | 8.9%), and local government employees (1,465 | 7.3%) make up the most common classes of employment.
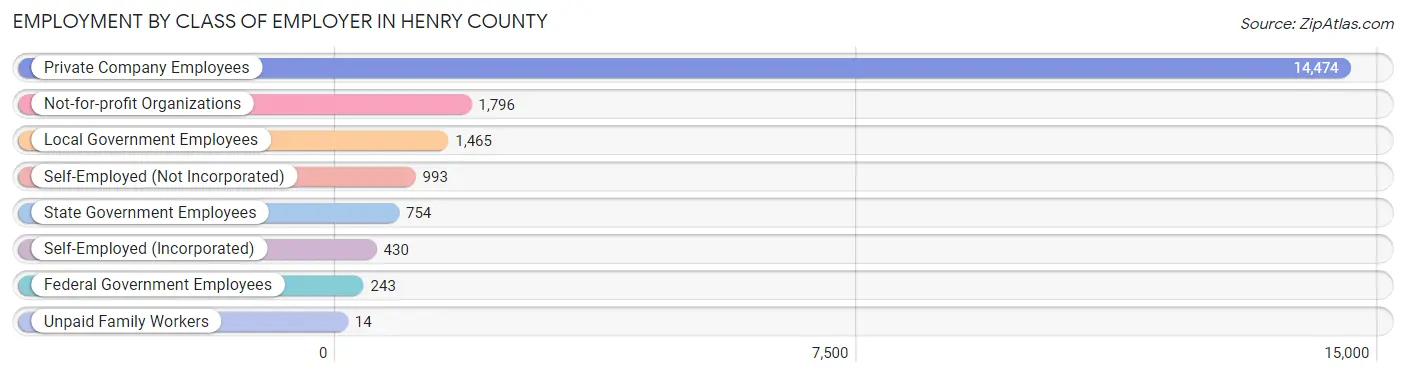
| Employer Class | # Employees | % Employees |
| Private Company Employees | 14,474 | 71.8% |
| Self-Employed (Incorporated) | 430 | 2.1% |
| Self-Employed (Not Incorporated) | 993 | 4.9% |
| Not-for-profit Organizations | 1,796 | 8.9% |
| Local Government Employees | 1,465 | 7.3% |
| State Government Employees | 754 | 3.7% |
| Federal Government Employees | 243 | 1.2% |
| Unpaid Family Workers | 14 | 0.1% |
| Total | 20,169 | 100.0% |
Employment Status by Age in Henry County
According to the labor force statistics for Henry County, out of the total population over 16 years of age (40,063), 54.0% or 21,634 individuals are in the labor force, with 4.5% or 974 of them unemployed. The age group with the highest labor force participation rate is 20 to 24 years, with 81.0% or 2,453 individuals in the labor force. Within the labor force, the 16 to 19 years age range has the highest percentage of unemployed individuals, with 18.8% or 156 of them being unemployed.
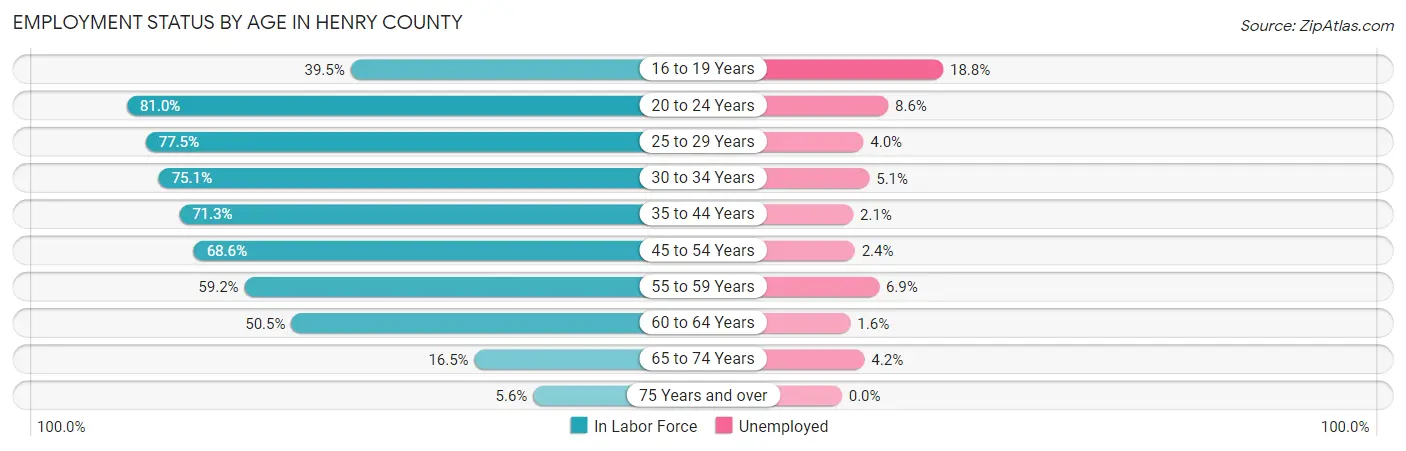
| Age Bracket | In Labor Force | Unemployed |
| 16 to 19 Years | 829 (39.5%) | 156 (18.8%) |
| 20 to 24 Years | 2,453 (81.0%) | 211 (8.6%) |
| 25 to 29 Years | 2,482 (77.5%) | 99 (4.0%) |
| 30 to 34 Years | 2,148 (75.1%) | 110 (5.1%) |
| 35 to 44 Years | 4,262 (71.3%) | 90 (2.1%) |
| 45 to 54 Years | 4,539 (68.6%) | 109 (2.4%) |
| 55 to 59 Years | 1,976 (59.2%) | 136 (6.9%) |
| 60 to 64 Years | 1,819 (50.5%) | 29 (1.6%) |
| 65 to 74 Years | 884 (16.5%) | 37 (4.2%) |
| 75 Years and over | 223 (5.6%) | 0 (0.0%) |
| Total | 21,634 (54.0%) | 974 (4.5%) |
Employment Status by Educational Attainment in Henry County
According to labor force statistics for Henry County, 67.3% of individuals (17,225) out of the total population between 25 and 64 years of age (25,595) are in the labor force, with 3.3% or 568 of them being unemployed. The group with the highest labor force participation rate are those with the educational attainment of bachelor's degree or higher, with 85.8% or 3,887 individuals in the labor force. Within the labor force, individuals with less than high school education have the highest percentage of unemployment, with 11.9% or 79 of them being unemployed.
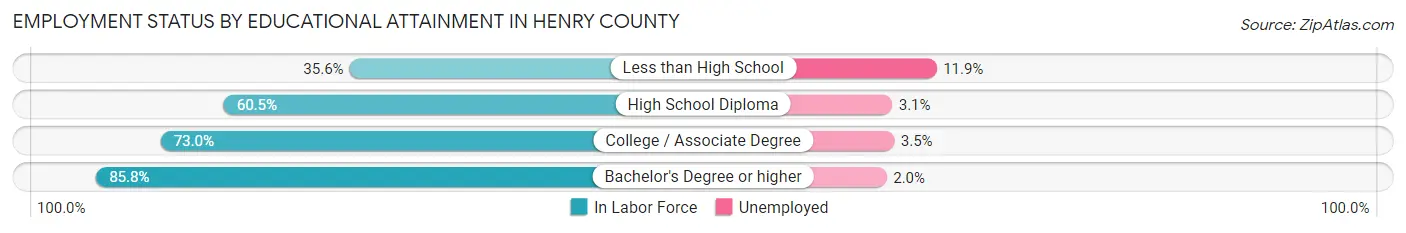
| Educational Attainment | In Labor Force | Unemployed |
| Less than High School | 664 (35.6%) | 222 (11.9%) |
| High School Diploma | 6,524 (60.5%) | 334 (3.1%) |
| College / Associate Degree | 6,144 (73.0%) | 295 (3.5%) |
| Bachelor's Degree or higher | 3,887 (85.8%) | 91 (2.0%) |
| Total | 17,225 (67.3%) | 845 (3.3%) |
Employment Occupations by Sex in Henry County
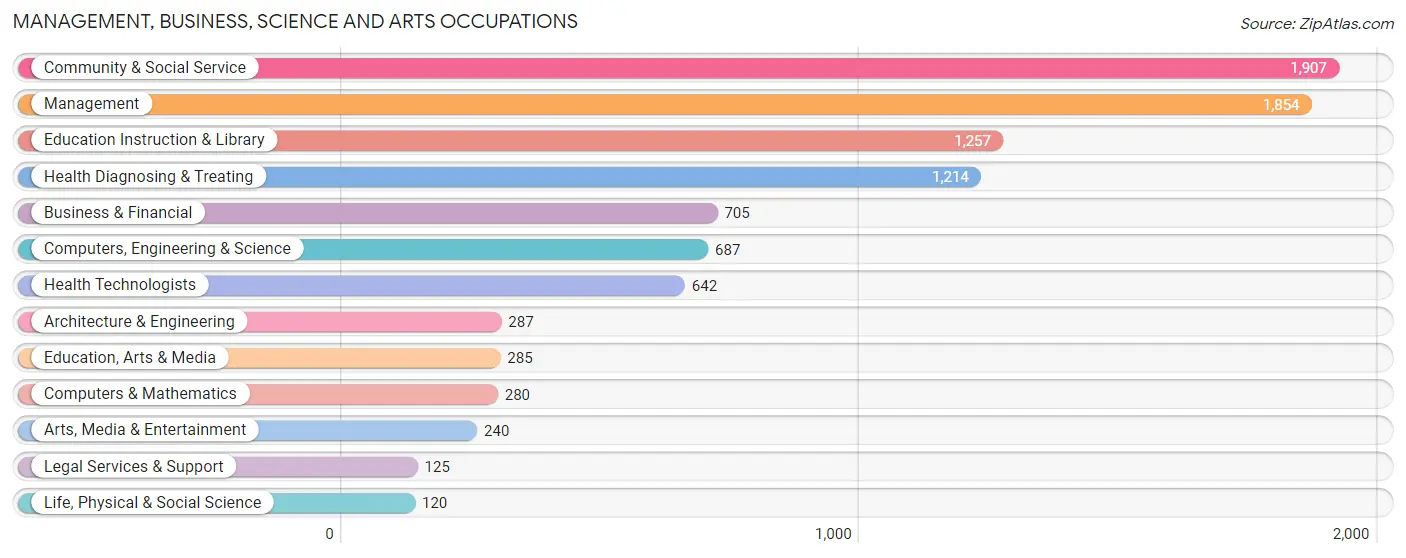
Management, Business, Science and Arts Occupations
The most common Management, Business, Science and Arts occupations in Henry County are Community & Social Service (1,907 | 9.3%), Management (1,854 | 9.0%), Education Instruction & Library (1,257 | 6.1%), Health Diagnosing & Treating (1,214 | 5.9%), and Business & Financial (705 | 3.4%).
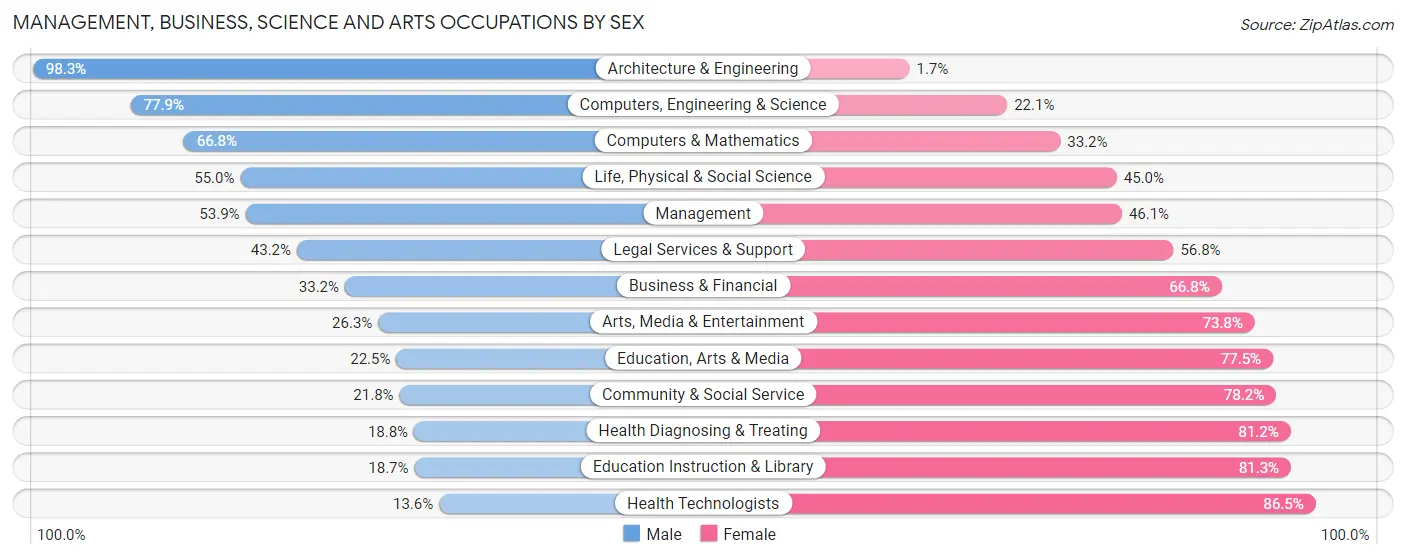
Management, Business, Science and Arts Occupations by Sex
Within the Management, Business, Science and Arts occupations in Henry County, the most male-oriented occupations are Architecture & Engineering (98.3%), Computers, Engineering & Science (77.9%), and Computers & Mathematics (66.8%), while the most female-oriented occupations are Health Technologists (86.5%), Education Instruction & Library (81.3%), and Health Diagnosing & Treating (81.2%).
| Occupation | Male | Female |
| Management | 1,000 (53.9%) | 854 (46.1%) |
| Business & Financial | 234 (33.2%) | 471 (66.8%) |
| Computers, Engineering & Science | 535 (77.9%) | 152 (22.1%) |
| Computers & Mathematics | 187 (66.8%) | 93 (33.2%) |
| Architecture & Engineering | 282 (98.3%) | 5 (1.7%) |
| Life, Physical & Social Science | 66 (55.0%) | 54 (45.0%) |
| Community & Social Service | 416 (21.8%) | 1,491 (78.2%) |
| Education, Arts & Media | 64 (22.5%) | 221 (77.5%) |
| Legal Services & Support | 54 (43.2%) | 71 (56.8%) |
| Education Instruction & Library | 235 (18.7%) | 1,022 (81.3%) |
| Arts, Media & Entertainment | 63 (26.3%) | 177 (73.8%) |
| Health Diagnosing & Treating | 228 (18.8%) | 986 (81.2%) |
| Health Technologists | 87 (13.6%) | 555 (86.5%) |
| Total (Category) | 2,413 (37.9%) | 3,954 (62.1%) |
| Total (Overall) | 10,807 (52.4%) | 9,797 (47.5%) |
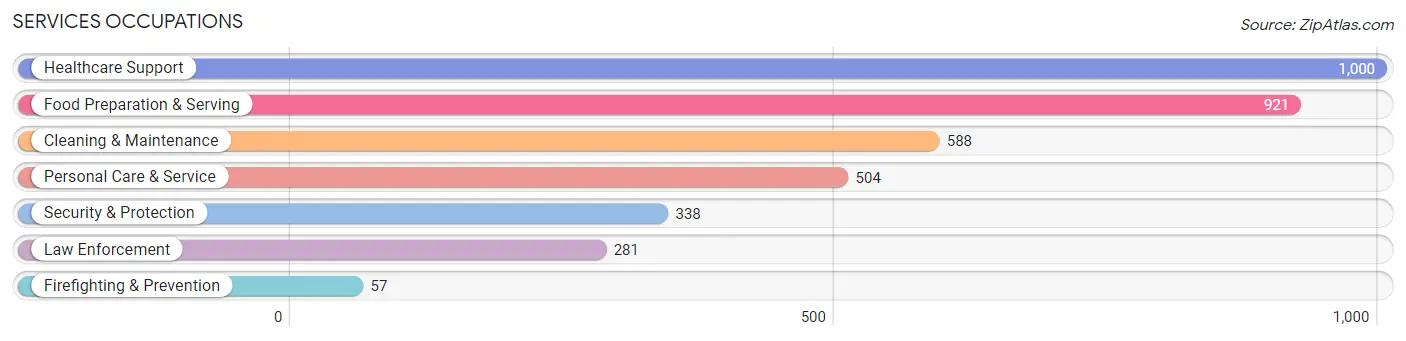
Services Occupations
The most common Services occupations in Henry County are Healthcare Support (1,000 | 4.9%), Food Preparation & Serving (921 | 4.5%), Cleaning & Maintenance (588 | 2.9%), Personal Care & Service (504 | 2.5%), and Security & Protection (338 | 1.6%).
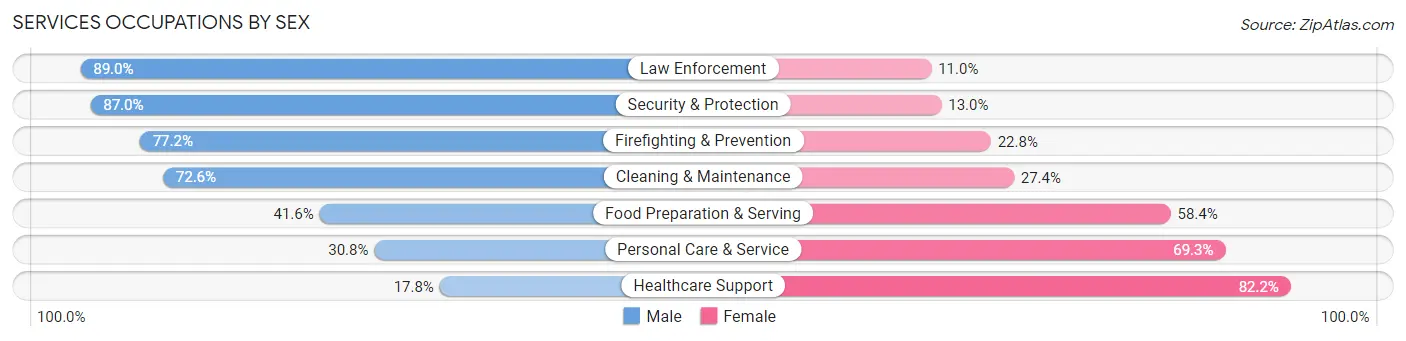
Services Occupations by Sex
Within the Services occupations in Henry County, the most male-oriented occupations are Law Enforcement (89.0%), Security & Protection (87.0%), and Firefighting & Prevention (77.2%), while the most female-oriented occupations are Healthcare Support (82.2%), Personal Care & Service (69.3%), and Food Preparation & Serving (58.4%).
| Occupation | Male | Female |
| Healthcare Support | 178 (17.8%) | 822 (82.2%) |
| Security & Protection | 294 (87.0%) | 44 (13.0%) |
| Firefighting & Prevention | 44 (77.2%) | 13 (22.8%) |
| Law Enforcement | 250 (89.0%) | 31 (11.0%) |
| Food Preparation & Serving | 383 (41.6%) | 538 (58.4%) |
| Cleaning & Maintenance | 427 (72.6%) | 161 (27.4%) |
| Personal Care & Service | 155 (30.7%) | 349 (69.3%) |
| Total (Category) | 1,437 (42.9%) | 1,914 (57.1%) |
| Total (Overall) | 10,807 (52.4%) | 9,797 (47.5%) |
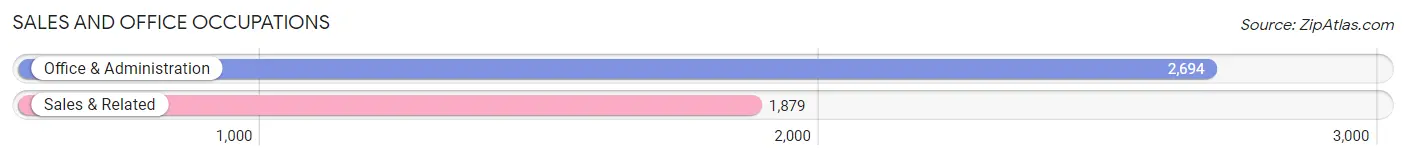
Sales and Office Occupations
The most common Sales and Office occupations in Henry County are Office & Administration (2,694 | 13.1%), and Sales & Related (1,879 | 9.1%).
Sales and Office Occupations by Sex
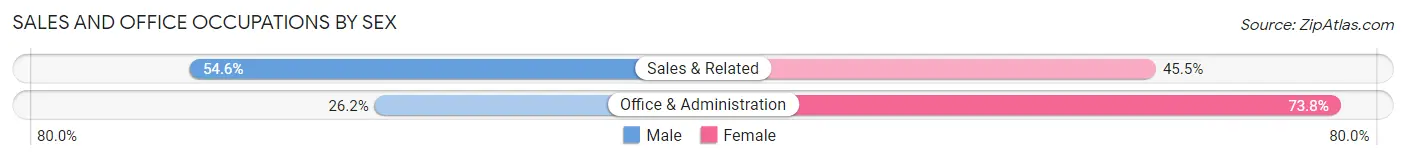
| Occupation | Male | Female |
| Sales & Related | 1,025 (54.5%) | 854 (45.5%) |
| Office & Administration | 705 (26.2%) | 1,989 (73.8%) |
| Total (Category) | 1,730 (37.8%) | 2,843 (62.2%) |
| Total (Overall) | 10,807 (52.4%) | 9,797 (47.5%) |
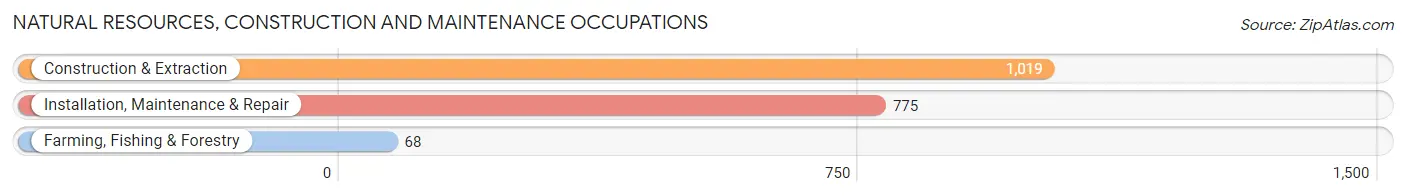
Natural Resources, Construction and Maintenance Occupations
The most common Natural Resources, Construction and Maintenance occupations in Henry County are Construction & Extraction (1,019 | 5.0%), Installation, Maintenance & Repair (775 | 3.8%), and Farming, Fishing & Forestry (68 | 0.3%).
Natural Resources, Construction and Maintenance Occupations by Sex
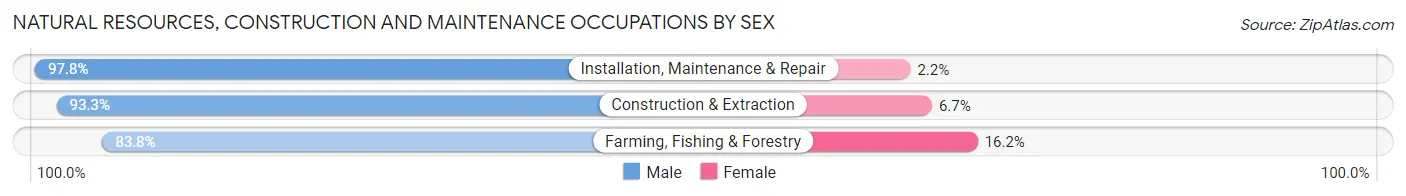
| Occupation | Male | Female |
| Farming, Fishing & Forestry | 57 (83.8%) | 11 (16.2%) |
| Construction & Extraction | 951 (93.3%) | 68 (6.7%) |
| Installation, Maintenance & Repair | 758 (97.8%) | 17 (2.2%) |
| Total (Category) | 1,766 (94.8%) | 96 (5.2%) |
| Total (Overall) | 10,807 (52.4%) | 9,797 (47.5%) |
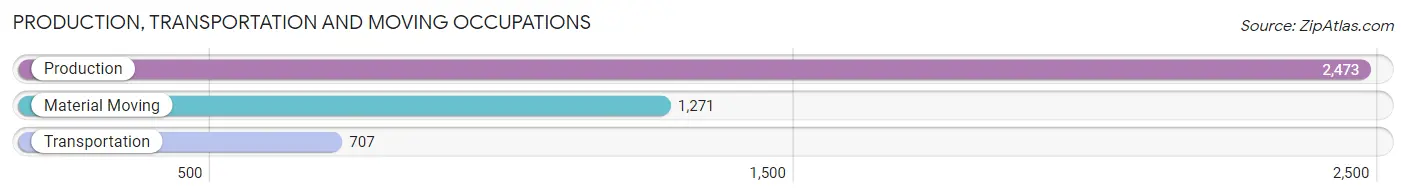
Production, Transportation and Moving Occupations
The most common Production, Transportation and Moving occupations in Henry County are Production (2,473 | 12.0%), Material Moving (1,271 | 6.2%), and Transportation (707 | 3.4%).
Production, Transportation and Moving Occupations by Sex
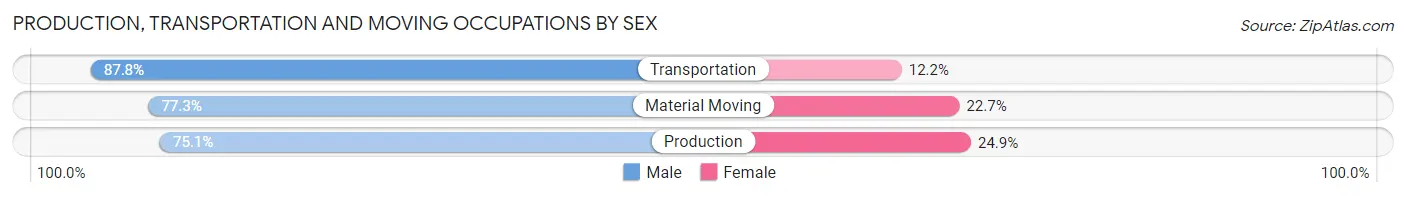
| Occupation | Male | Female |
| Production | 1,858 (75.1%) | 615 (24.9%) |
| Transportation | 621 (87.8%) | 86 (12.2%) |
| Material Moving | 982 (77.3%) | 289 (22.7%) |
| Total (Category) | 3,461 (77.8%) | 990 (22.2%) |
| Total (Overall) | 10,807 (52.4%) | 9,797 (47.5%) |
Employment Industries by Sex in Henry County
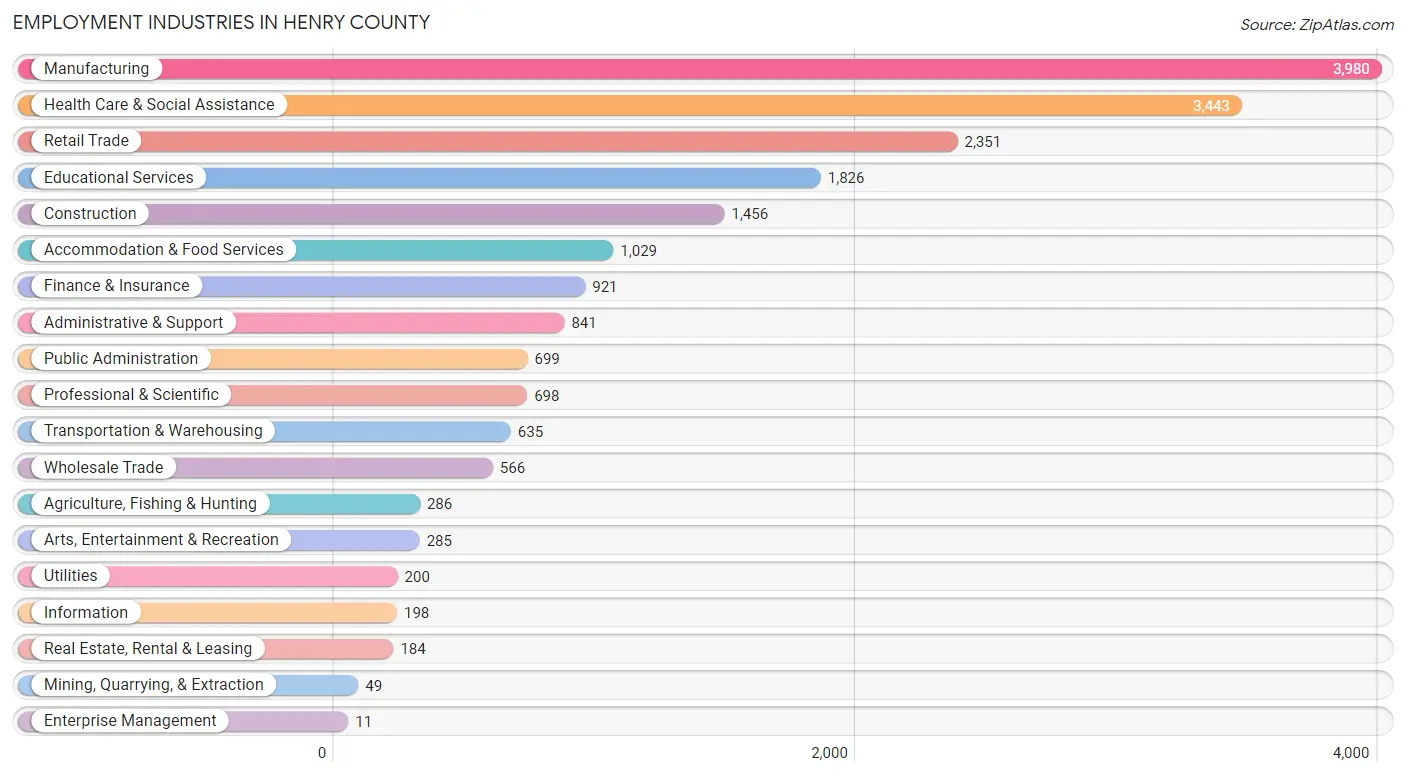
Employment Industries in Henry County
The major employment industries in Henry County include Manufacturing (3,980 | 19.3%), Health Care & Social Assistance (3,443 | 16.7%), Retail Trade (2,351 | 11.4%), Educational Services (1,826 | 8.9%), and Construction (1,456 | 7.1%).
Employment Industries by Sex in Henry County
The Henry County industries that see more men than women are Mining, Quarrying, & Extraction (100.0%), Enterprise Management (100.0%), and Construction (84.4%), whereas the industries that tend to have a higher number of women are Health Care & Social Assistance (83.6%), Educational Services (78.6%), and Finance & Insurance (70.4%).
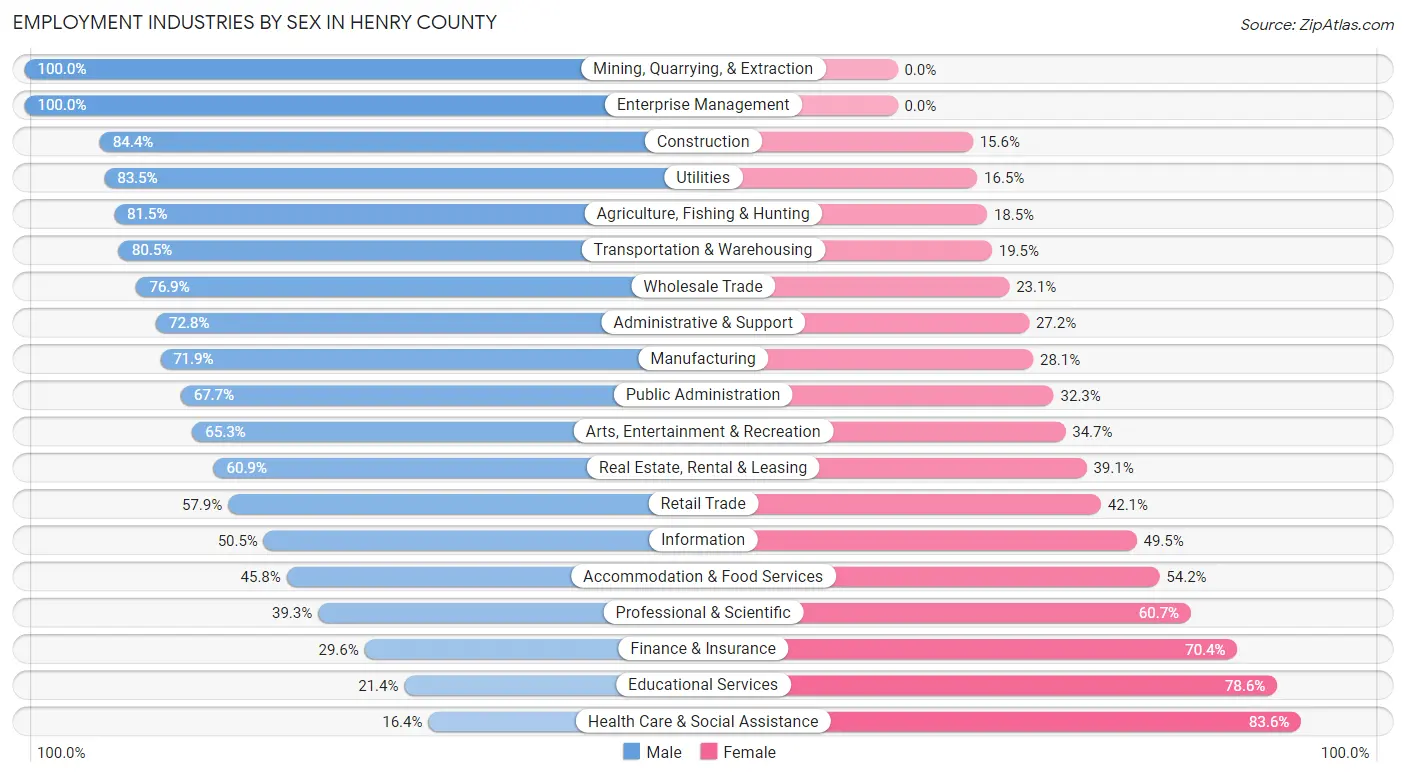
| Industry | Male | Female |
| Agriculture, Fishing & Hunting | 233 (81.5%) | 53 (18.5%) |
| Mining, Quarrying, & Extraction | 49 (100.0%) | 0 (0.0%) |
| Construction | 1,229 (84.4%) | 227 (15.6%) |
| Manufacturing | 2,863 (71.9%) | 1,117 (28.1%) |
| Wholesale Trade | 435 (76.9%) | 131 (23.1%) |
| Retail Trade | 1,361 (57.9%) | 990 (42.1%) |
| Transportation & Warehousing | 511 (80.5%) | 124 (19.5%) |
| Utilities | 167 (83.5%) | 33 (16.5%) |
| Information | 100 (50.5%) | 98 (49.5%) |
| Finance & Insurance | 273 (29.6%) | 648 (70.4%) |
| Real Estate, Rental & Leasing | 112 (60.9%) | 72 (39.1%) |
| Professional & Scientific | 274 (39.3%) | 424 (60.7%) |
| Enterprise Management | 11 (100.0%) | 0 (0.0%) |
| Administrative & Support | 612 (72.8%) | 229 (27.2%) |
| Educational Services | 391 (21.4%) | 1,435 (78.6%) |
| Health Care & Social Assistance | 566 (16.4%) | 2,877 (83.6%) |
| Arts, Entertainment & Recreation | 186 (65.3%) | 99 (34.7%) |
| Accommodation & Food Services | 471 (45.8%) | 558 (54.2%) |
| Public Administration | 473 (67.7%) | 226 (32.3%) |
| Total | 10,807 (52.4%) | 9,797 (47.5%) |
Education in Henry County
School Enrollment in Henry County
The most common levels of schooling among the 9,504 students in Henry County are high school (2,364 | 24.9%), elementary school (2,215 | 23.3%), and middle school (2,178 | 22.9%).
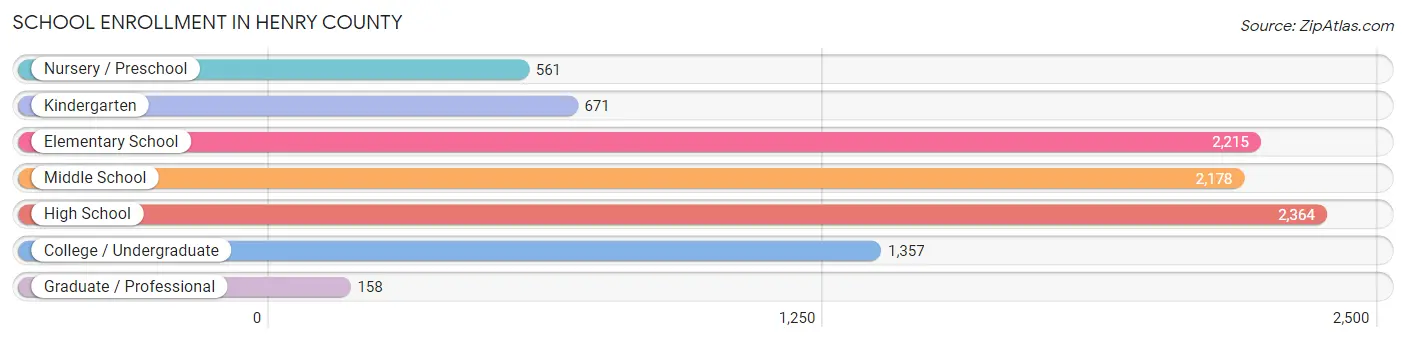
| School Level | # Students | % Students |
| Nursery / Preschool | 561 | 5.9% |
| Kindergarten | 671 | 7.1% |
| Elementary School | 2,215 | 23.3% |
| Middle School | 2,178 | 22.9% |
| High School | 2,364 | 24.9% |
| College / Undergraduate | 1,357 | 14.3% |
| Graduate / Professional | 158 | 1.7% |
| Total | 9,504 | 100.0% |
School Enrollment by Age by Funding Source in Henry County
Out of a total of 9,504 students who are enrolled in schools in Henry County, 1,036 (10.9%) attend a private institution, while the remaining 8,468 (89.1%) are enrolled in public schools. The age group of 3 to 4 year olds has the highest likelihood of being enrolled in private schools, with 83 (27.6% in the age bracket) enrolled. Conversely, the age group of 20 to 24 year olds has the lowest likelihood of being enrolled in a private school, with 644 (94.2% in the age bracket) attending a public institution.
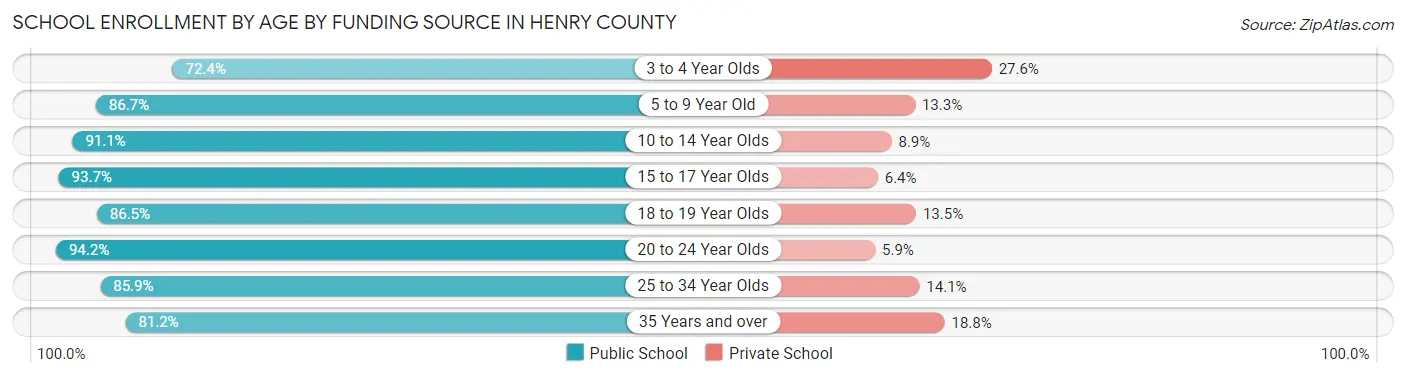
| Age Bracket | Public School | Private School |
| 3 to 4 Year Olds | 218 (72.4%) | 83 (27.6%) |
| 5 to 9 Year Old | 2,442 (86.7%) | 374 (13.3%) |
| 10 to 14 Year Olds | 2,430 (91.1%) | 238 (8.9%) |
| 15 to 17 Year Olds | 1,653 (93.6%) | 112 (6.4%) |
| 18 to 19 Year Olds | 456 (86.5%) | 71 (13.5%) |
| 20 to 24 Year Olds | 644 (94.2%) | 40 (5.9%) |
| 25 to 34 Year Olds | 341 (85.9%) | 56 (14.1%) |
| 35 Years and over | 281 (81.2%) | 65 (18.8%) |
| Total | 8,468 (89.1%) | 1,036 (10.9%) |
Educational Attainment by Field of Study in Henry County
Education (1,590 | 24.2%), business (1,198 | 18.3%), science & technology (879 | 13.4%), psychology (406 | 6.2%), and engineering (394 | 6.0%) are the most common fields of study among 6,561 individuals in Henry County who have obtained a bachelor's degree or higher.
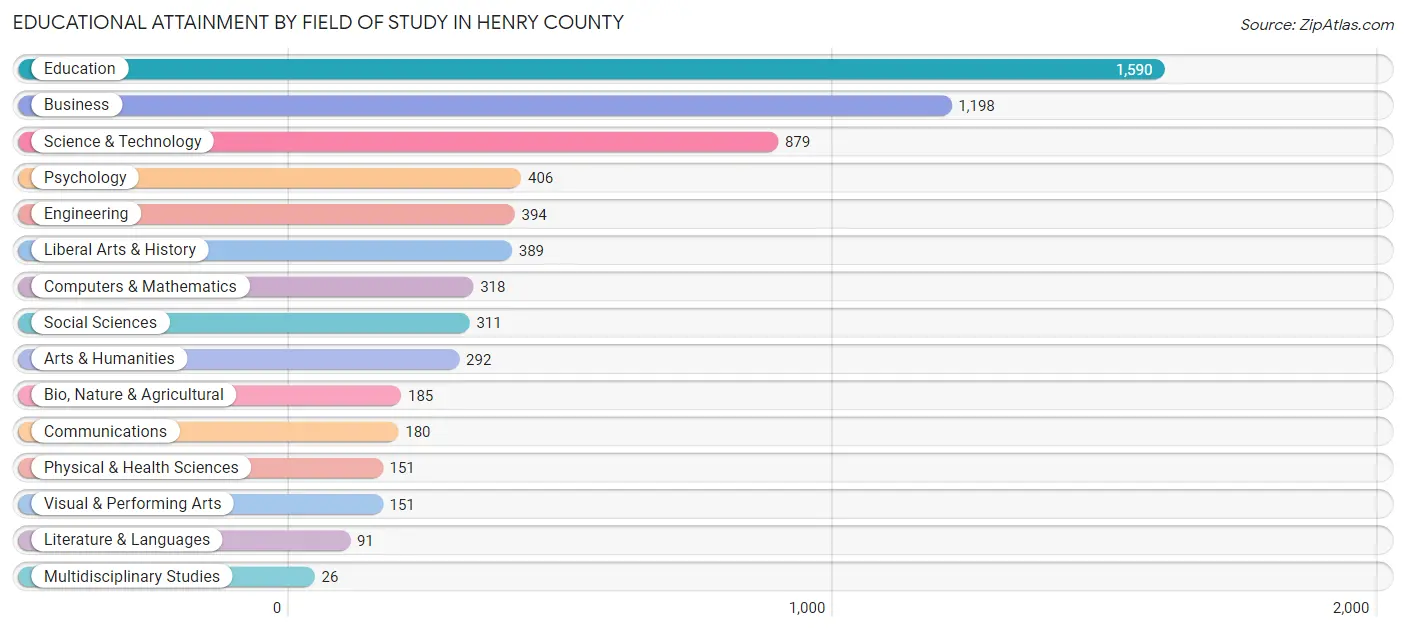
| Field of Study | # Graduates | % Graduates |
| Computers & Mathematics | 318 | 4.9% |
| Bio, Nature & Agricultural | 185 | 2.8% |
| Physical & Health Sciences | 151 | 2.3% |
| Psychology | 406 | 6.2% |
| Social Sciences | 311 | 4.7% |
| Engineering | 394 | 6.0% |
| Multidisciplinary Studies | 26 | 0.4% |
| Science & Technology | 879 | 13.4% |
| Business | 1,198 | 18.3% |
| Education | 1,590 | 24.2% |
| Literature & Languages | 91 | 1.4% |
| Liberal Arts & History | 389 | 5.9% |
| Visual & Performing Arts | 151 | 2.3% |
| Communications | 180 | 2.7% |
| Arts & Humanities | 292 | 4.4% |
| Total | 6,561 | 100.0% |
Transportation & Commute in Henry County
Vehicle Availability by Sex in Henry County
The most prevalent vehicle ownership categories in Henry County are males with 2 vehicles (4,286, accounting for 40.6%) and females with 2 vehicles (3,697, making up 44.7%).
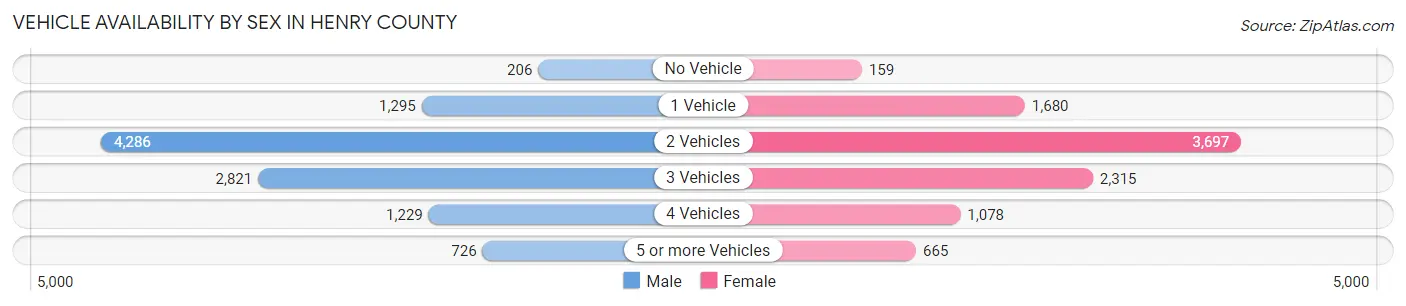
| Vehicles Available | Male | Female |
| No Vehicle | 206 (1.9%) | 159 (1.7%) |
| 1 Vehicle | 1,295 (12.3%) | 1,680 (17.5%) |
| 2 Vehicles | 4,286 (40.6%) | 3,697 (38.5%) |
| 3 Vehicles | 2,821 (26.7%) | 2,315 (24.1%) |
| 4 Vehicles | 1,229 (11.6%) | 1,078 (11.2%) |
| 5 or more Vehicles | 726 (6.9%) | 665 (6.9%) |
| Total | 10,563 (100.0%) | 9,594 (100.0%) |
Commute Time in Henry County
The most frequently occuring commute durations in Henry County are 5 to 9 minutes (3,089 commuters, 16.4%), 10 to 14 minutes (2,781 commuters, 14.7%), and 15 to 19 minutes (2,344 commuters, 12.4%).
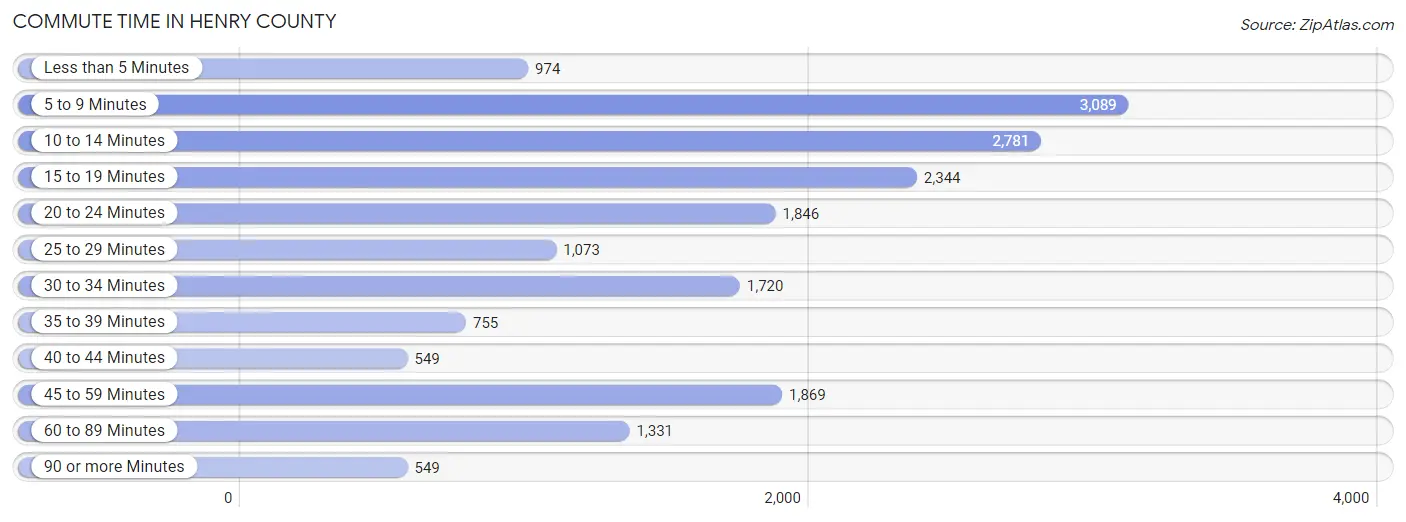
| Commute Time | # Commuters | % Commuters |
| Less than 5 Minutes | 974 | 5.2% |
| 5 to 9 Minutes | 3,089 | 16.4% |
| 10 to 14 Minutes | 2,781 | 14.7% |
| 15 to 19 Minutes | 2,344 | 12.4% |
| 20 to 24 Minutes | 1,846 | 9.8% |
| 25 to 29 Minutes | 1,073 | 5.7% |
| 30 to 34 Minutes | 1,720 | 9.1% |
| 35 to 39 Minutes | 755 | 4.0% |
| 40 to 44 Minutes | 549 | 2.9% |
| 45 to 59 Minutes | 1,869 | 9.9% |
| 60 to 89 Minutes | 1,331 | 7.0% |
| 90 or more Minutes | 549 | 2.9% |
Commute Time by Sex in Henry County
The most common commute times in Henry County are 5 to 9 minutes (1,492 commuters, 14.7%) for males and 5 to 9 minutes (1,597 commuters, 18.3%) for females.
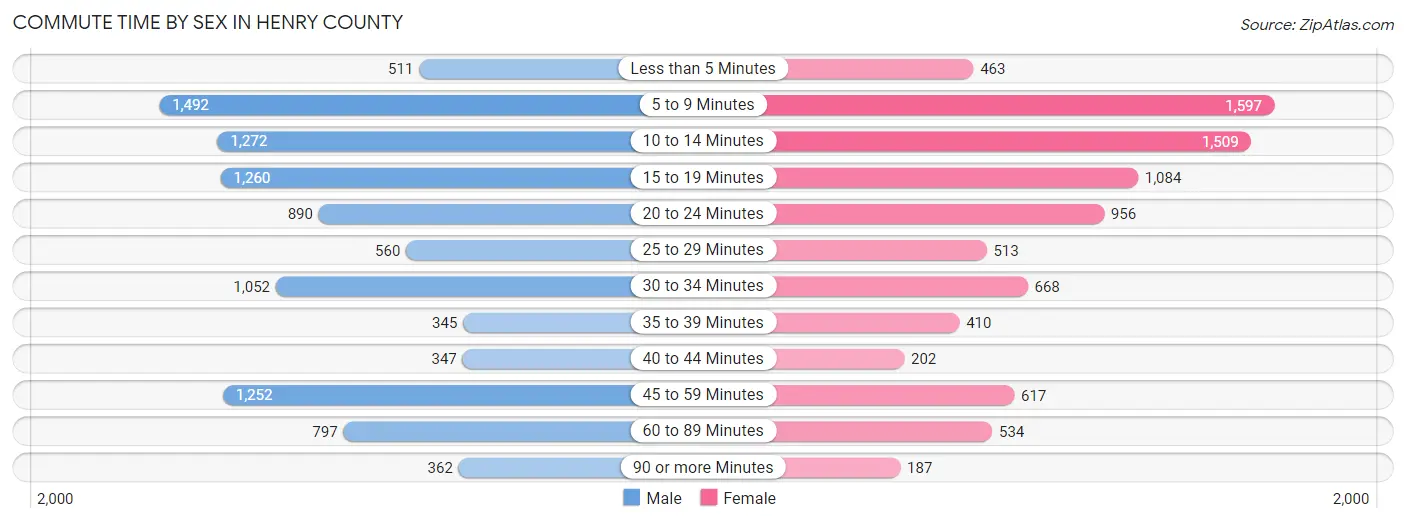
| Commute Time | Male | Female |
| Less than 5 Minutes | 511 (5.0%) | 463 (5.3%) |
| 5 to 9 Minutes | 1,492 (14.7%) | 1,597 (18.3%) |
| 10 to 14 Minutes | 1,272 (12.5%) | 1,509 (17.3%) |
| 15 to 19 Minutes | 1,260 (12.4%) | 1,084 (12.4%) |
| 20 to 24 Minutes | 890 (8.8%) | 956 (10.9%) |
| 25 to 29 Minutes | 560 (5.5%) | 513 (5.9%) |
| 30 to 34 Minutes | 1,052 (10.4%) | 668 (7.6%) |
| 35 to 39 Minutes | 345 (3.4%) | 410 (4.7%) |
| 40 to 44 Minutes | 347 (3.4%) | 202 (2.3%) |
| 45 to 59 Minutes | 1,252 (12.3%) | 617 (7.1%) |
| 60 to 89 Minutes | 797 (7.9%) | 534 (6.1%) |
| 90 or more Minutes | 362 (3.6%) | 187 (2.1%) |
Time of Departure to Work by Sex in Henry County
The most frequent times of departure to work in Henry County are 7:00 AM to 7:29 AM (1,099, 10.8%) for males and 7:30 AM to 7:59 AM (1,719, 19.7%) for females.
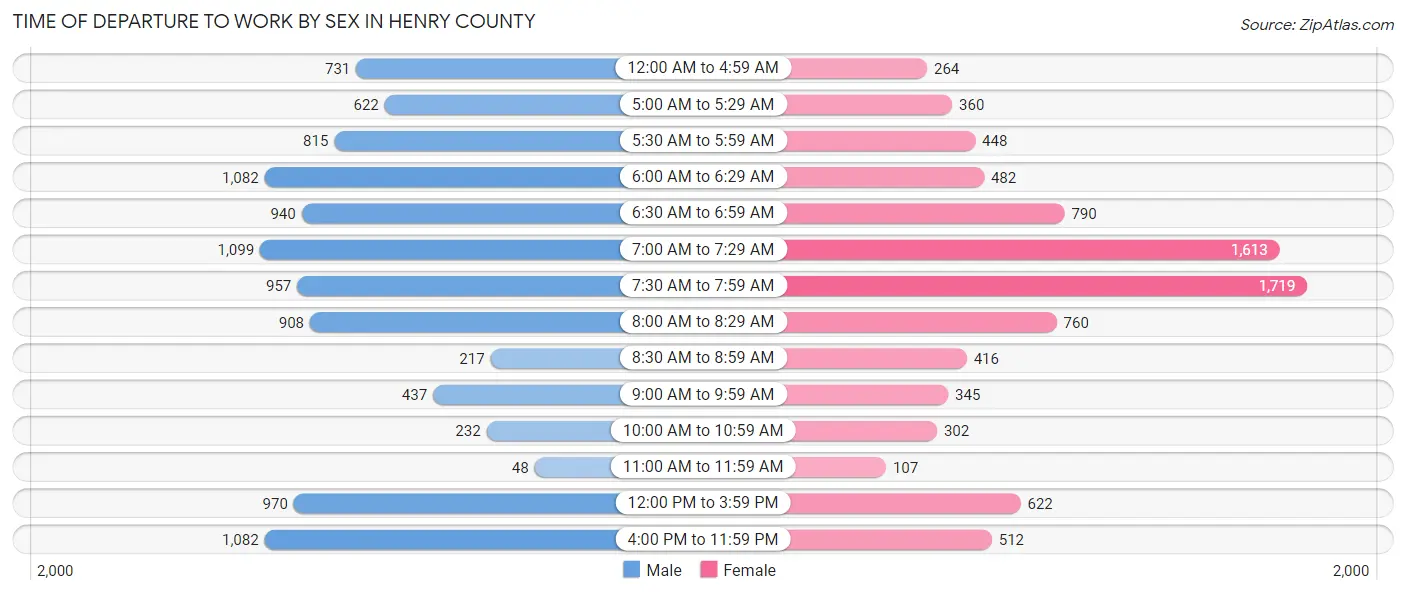
| Time of Departure | Male | Female |
| 12:00 AM to 4:59 AM | 731 (7.2%) | 264 (3.0%) |
| 5:00 AM to 5:29 AM | 622 (6.1%) | 360 (4.1%) |
| 5:30 AM to 5:59 AM | 815 (8.0%) | 448 (5.1%) |
| 6:00 AM to 6:29 AM | 1,082 (10.7%) | 482 (5.5%) |
| 6:30 AM to 6:59 AM | 940 (9.3%) | 790 (9.0%) |
| 7:00 AM to 7:29 AM | 1,099 (10.8%) | 1,613 (18.5%) |
| 7:30 AM to 7:59 AM | 957 (9.4%) | 1,719 (19.7%) |
| 8:00 AM to 8:29 AM | 908 (8.9%) | 760 (8.7%) |
| 8:30 AM to 8:59 AM | 217 (2.1%) | 416 (4.8%) |
| 9:00 AM to 9:59 AM | 437 (4.3%) | 345 (4.0%) |
| 10:00 AM to 10:59 AM | 232 (2.3%) | 302 (3.5%) |
| 11:00 AM to 11:59 AM | 48 (0.5%) | 107 (1.2%) |
| 12:00 PM to 3:59 PM | 970 (9.6%) | 622 (7.1%) |
| 4:00 PM to 11:59 PM | 1,082 (10.7%) | 512 (5.9%) |
| Total | 10,140 (100.0%) | 8,740 (100.0%) |
Housing Occupancy in Henry County
Occupancy by Ownership in Henry County
Of the total 18,549 dwellings in Henry County, owner-occupied units account for 13,967 (75.3%), while renter-occupied units make up 4,582 (24.7%).
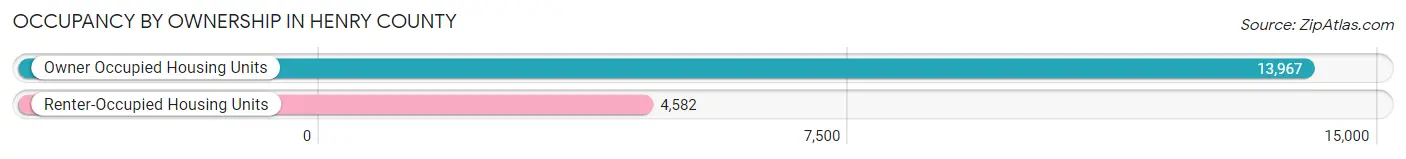
| Occupancy | # Housing Units | % Housing Units |
| Owner Occupied Housing Units | 13,967 | 75.3% |
| Renter-Occupied Housing Units | 4,582 | 24.7% |
| Total Occupied Housing Units | 18,549 | 100.0% |
Occupancy by Household Size in Henry County
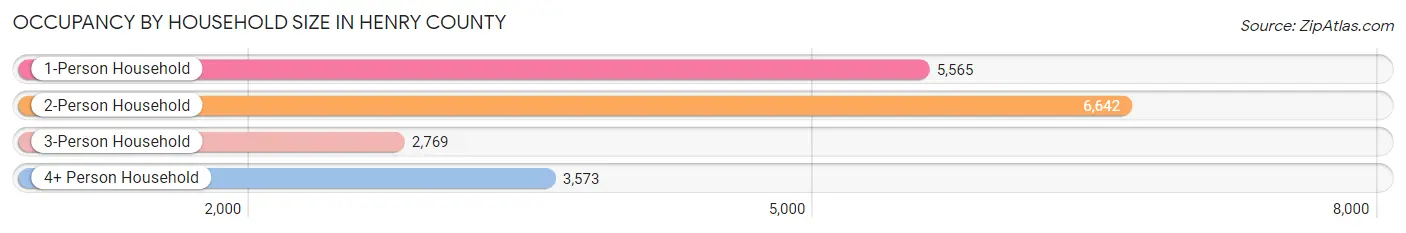
| Household Size | # Housing Units | % Housing Units |
| 1-Person Household | 5,565 | 30.0% |
| 2-Person Household | 6,642 | 35.8% |
| 3-Person Household | 2,769 | 14.9% |
| 4+ Person Household | 3,573 | 19.3% |
| Total Housing Units | 18,549 | 100.0% |
Occupancy by Ownership by Household Size in Henry County
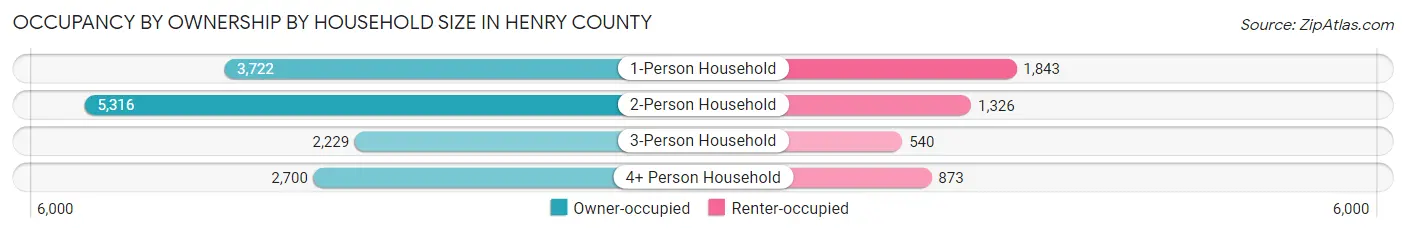
| Household Size | Owner-occupied | Renter-occupied |
| 1-Person Household | 3,722 (66.9%) | 1,843 (33.1%) |
| 2-Person Household | 5,316 (80.0%) | 1,326 (20.0%) |
| 3-Person Household | 2,229 (80.5%) | 540 (19.5%) |
| 4+ Person Household | 2,700 (75.6%) | 873 (24.4%) |
| Total Housing Units | 13,967 (75.3%) | 4,582 (24.7%) |
Occupancy by Educational Attainment in Henry County
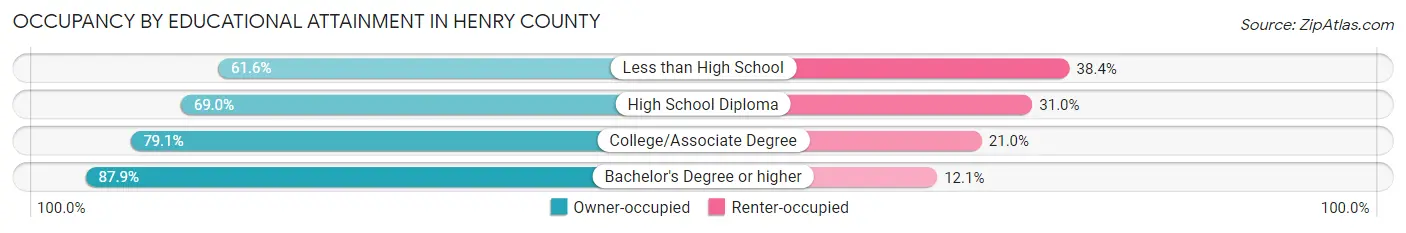
| Household Size | Owner-occupied | Renter-occupied |
| Less than High School | 911 (61.6%) | 567 (38.4%) |
| High School Diploma | 5,174 (69.0%) | 2,321 (31.0%) |
| College/Associate Degree | 4,776 (79.0%) | 1,266 (20.9%) |
| Bachelor's Degree or higher | 3,106 (87.9%) | 428 (12.1%) |
Occupancy by Age of Householder in Henry County
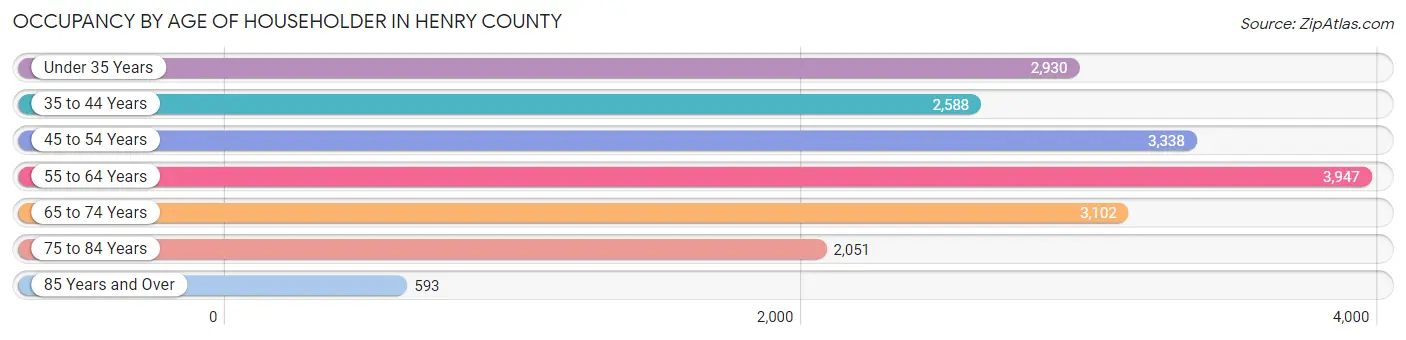
| Age Bracket | # Households | % Households |
| Under 35 Years | 2,930 | 15.8% |
| 35 to 44 Years | 2,588 | 14.0% |
| 45 to 54 Years | 3,338 | 18.0% |
| 55 to 64 Years | 3,947 | 21.3% |
| 65 to 74 Years | 3,102 | 16.7% |
| 75 to 84 Years | 2,051 | 11.1% |
| 85 Years and Over | 593 | 3.2% |
| Total | 18,549 | 100.0% |
Housing Finances in Henry County
Median Income by Occupancy in Henry County
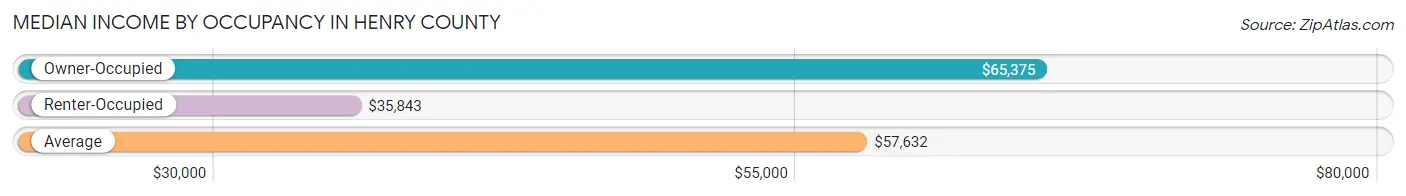
| Occupancy Type | # Households | Median Income |
| Owner-Occupied | 13,967 (75.3%) | $65,375 |
| Renter-Occupied | 4,582 (24.7%) | $35,843 |
| Average | 18,549 (100.0%) | $57,632 |
Occupancy by Householder Income Bracket in Henry County
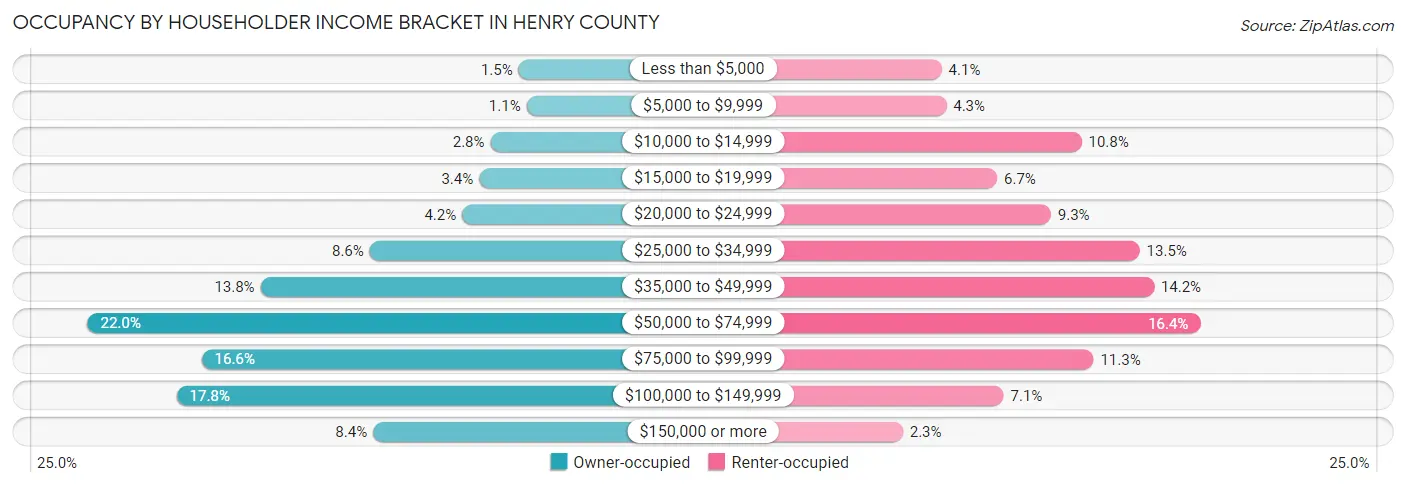
| Income Bracket | Owner-occupied | Renter-occupied |
| Less than $5,000 | 207 (1.5%) | 188 (4.1%) |
| $5,000 to $9,999 | 153 (1.1%) | 198 (4.3%) |
| $10,000 to $14,999 | 394 (2.8%) | 493 (10.8%) |
| $15,000 to $19,999 | 469 (3.4%) | 309 (6.7%) |
| $20,000 to $24,999 | 582 (4.2%) | 426 (9.3%) |
| $25,000 to $34,999 | 1,197 (8.6%) | 620 (13.5%) |
| $35,000 to $49,999 | 1,923 (13.8%) | 651 (14.2%) |
| $50,000 to $74,999 | 3,073 (22.0%) | 752 (16.4%) |
| $75,000 to $99,999 | 2,315 (16.6%) | 519 (11.3%) |
| $100,000 to $149,999 | 2,480 (17.8%) | 323 (7.0%) |
| $150,000 or more | 1,174 (8.4%) | 103 (2.2%) |
| Total | 13,967 (100.0%) | 4,582 (100.0%) |
Monthly Housing Cost Tiers in Henry County
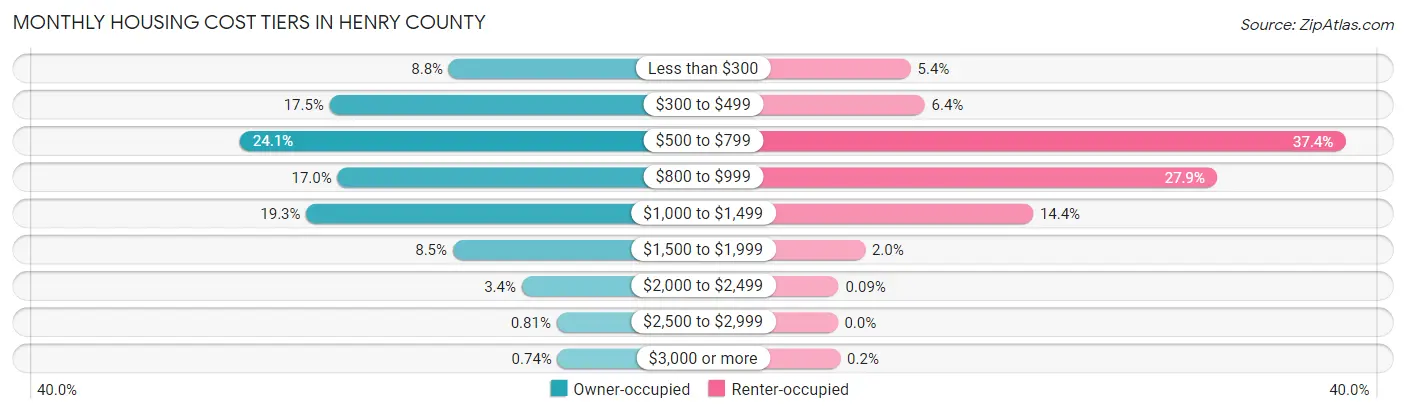
| Monthly Cost | Owner-occupied | Renter-occupied |
| Less than $300 | 1,222 (8.7%) | 247 (5.4%) |
| $300 to $499 | 2,448 (17.5%) | 294 (6.4%) |
| $500 to $799 | 3,372 (24.1%) | 1,713 (37.4%) |
| $800 to $999 | 2,367 (17.0%) | 1,280 (27.9%) |
| $1,000 to $1,499 | 2,688 (19.3%) | 660 (14.4%) |
| $1,500 to $1,999 | 1,181 (8.5%) | 93 (2.0%) |
| $2,000 to $2,499 | 472 (3.4%) | 4 (0.1%) |
| $2,500 to $2,999 | 113 (0.8%) | 0 (0.0%) |
| $3,000 or more | 104 (0.7%) | 9 (0.2%) |
| Total | 13,967 (100.0%) | 4,582 (100.0%) |
Physical Housing Characteristics in Henry County
Housing Structures in Henry County
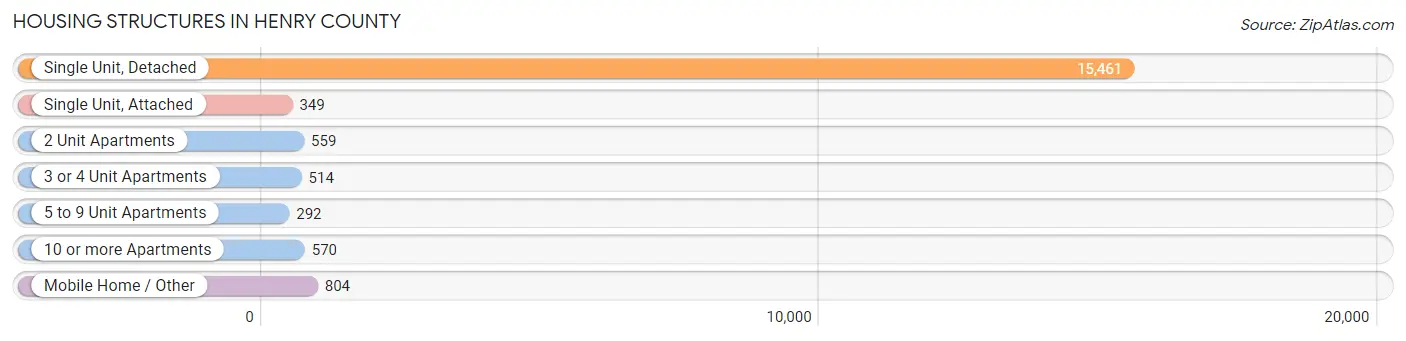
| Structure Type | # Housing Units | % Housing Units |
| Single Unit, Detached | 15,461 | 83.4% |
| Single Unit, Attached | 349 | 1.9% |
| 2 Unit Apartments | 559 | 3.0% |
| 3 or 4 Unit Apartments | 514 | 2.8% |
| 5 to 9 Unit Apartments | 292 | 1.6% |
| 10 or more Apartments | 570 | 3.1% |
| Mobile Home / Other | 804 | 4.3% |
| Total | 18,549 | 100.0% |
Housing Structures by Occupancy in Henry County
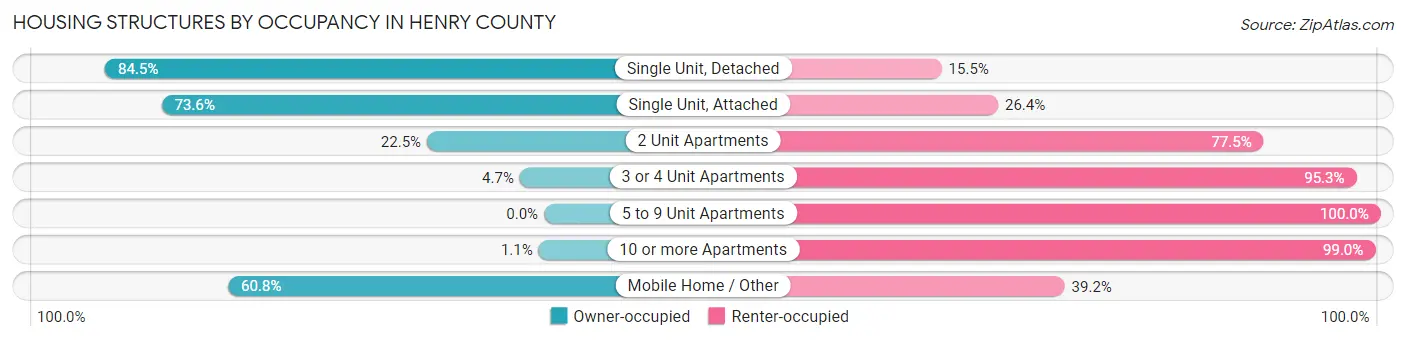
| Structure Type | Owner-occupied | Renter-occupied |
| Single Unit, Detached | 13,065 (84.5%) | 2,396 (15.5%) |
| Single Unit, Attached | 257 (73.6%) | 92 (26.4%) |
| 2 Unit Apartments | 126 (22.5%) | 433 (77.5%) |
| 3 or 4 Unit Apartments | 24 (4.7%) | 490 (95.3%) |
| 5 to 9 Unit Apartments | 0 (0.0%) | 292 (100.0%) |
| 10 or more Apartments | 6 (1.1%) | 564 (99.0%) |
| Mobile Home / Other | 489 (60.8%) | 315 (39.2%) |
| Total | 13,967 (75.3%) | 4,582 (24.7%) |
Housing Structures by Number of Rooms in Henry County
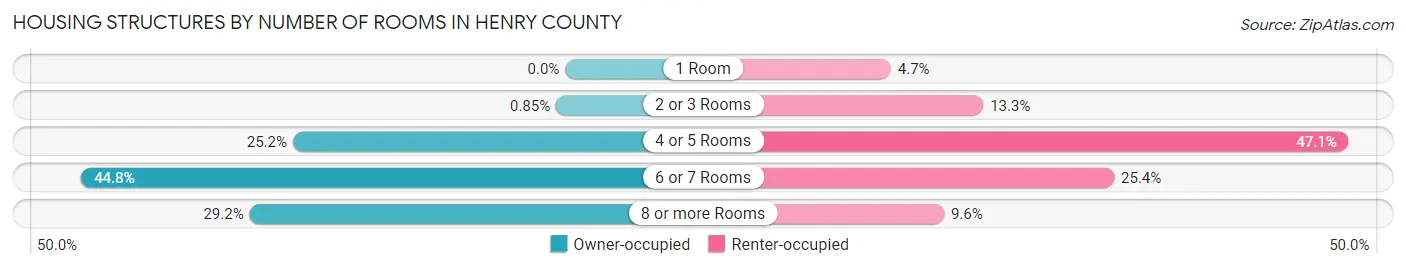
| Number of Rooms | Owner-occupied | Renter-occupied |
| 1 Room | 0 (0.0%) | 216 (4.7%) |
| 2 or 3 Rooms | 119 (0.9%) | 607 (13.3%) |
| 4 or 5 Rooms | 3,518 (25.2%) | 2,156 (47.0%) |
| 6 or 7 Rooms | 6,251 (44.8%) | 1,162 (25.4%) |
| 8 or more Rooms | 4,079 (29.2%) | 441 (9.6%) |
| Total | 13,967 (100.0%) | 4,582 (100.0%) |
Housing Structure by Heating Type in Henry County
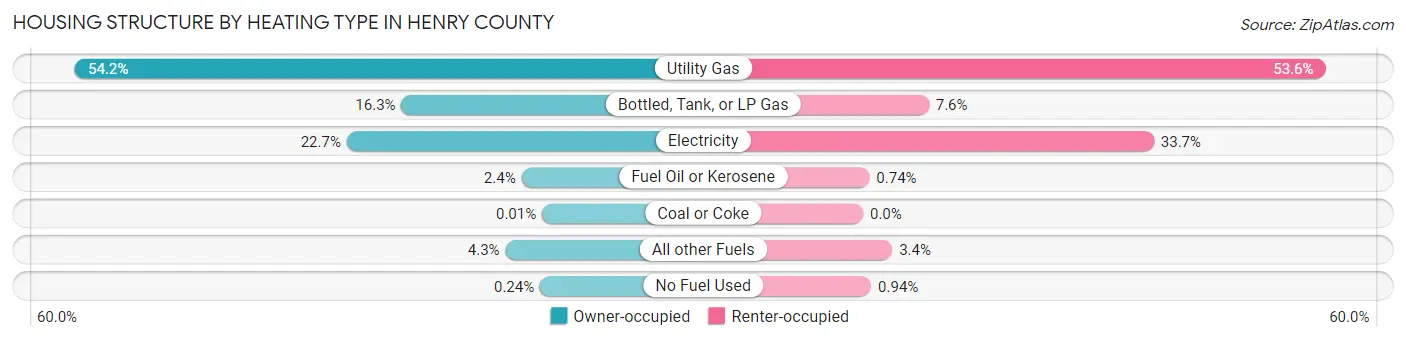
| Heating Type | Owner-occupied | Renter-occupied |
| Utility Gas | 7,563 (54.1%) | 2,456 (53.6%) |
| Bottled, Tank, or LP Gas | 2,278 (16.3%) | 349 (7.6%) |
| Electricity | 3,164 (22.7%) | 1,545 (33.7%) |
| Fuel Oil or Kerosene | 334 (2.4%) | 34 (0.7%) |
| Coal or Coke | 2 (0.0%) | 0 (0.0%) |
| All other Fuels | 593 (4.3%) | 155 (3.4%) |
| No Fuel Used | 33 (0.2%) | 43 (0.9%) |
| Total | 13,967 (100.0%) | 4,582 (100.0%) |
Household Vehicle Usage in Henry County
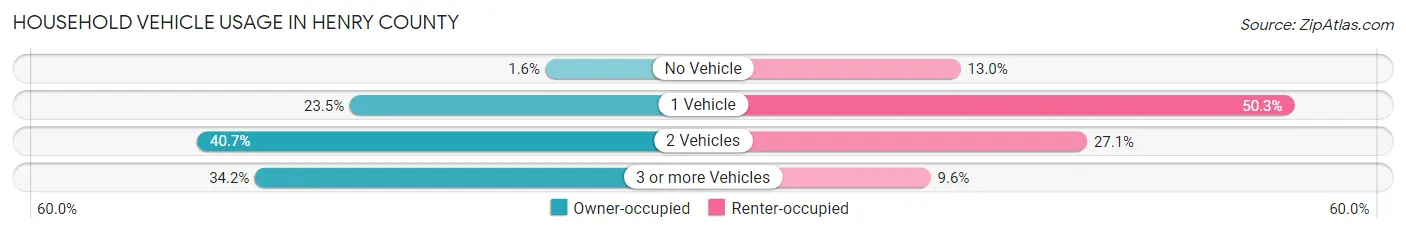
| Vehicles per Household | Owner-occupied | Renter-occupied |
| No Vehicle | 225 (1.6%) | 594 (13.0%) |
| 1 Vehicle | 3,288 (23.5%) | 2,306 (50.3%) |
| 2 Vehicles | 5,681 (40.7%) | 1,242 (27.1%) |
| 3 or more Vehicles | 4,773 (34.2%) | 440 (9.6%) |
| Total | 13,967 (100.0%) | 4,582 (100.0%) |
Real Estate & Mortgages in Henry County
Real Estate and Mortgage Overview in Henry County
| Characteristic | Without Mortgage | With Mortgage |
| Housing Units | 5,915 | 8,052 |
| Median Property Value | $112,000 | $135,600 |
| Median Household Income | $53,660 | $781 |
| Monthly Housing Costs | $469 | $86 |
| Real Estate Taxes | $953 | $227 |
Property Value by Mortgage Status in Henry County
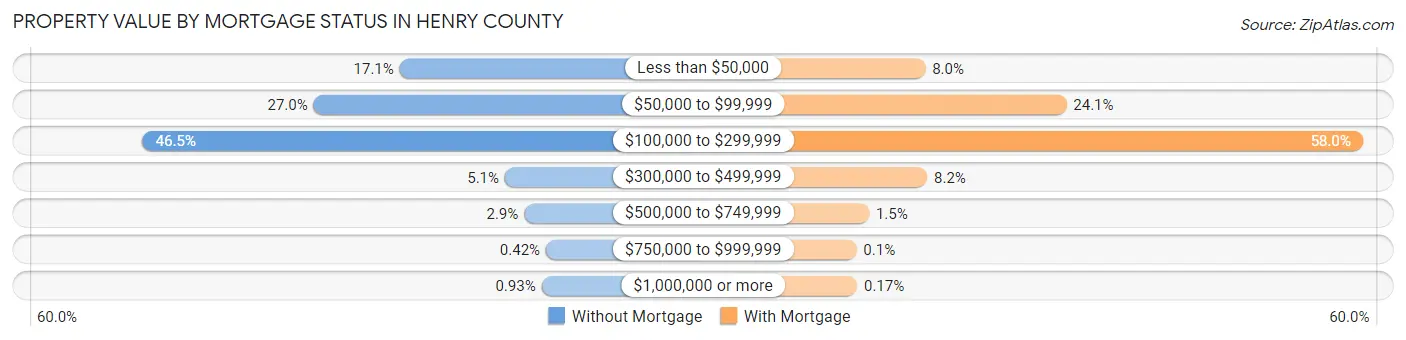
| Property Value | Without Mortgage | With Mortgage |
| Less than $50,000 | 1,014 (17.1%) | 641 (8.0%) |
| $50,000 to $99,999 | 1,596 (27.0%) | 1,940 (24.1%) |
| $100,000 to $299,999 | 2,751 (46.5%) | 4,667 (58.0%) |
| $300,000 to $499,999 | 302 (5.1%) | 659 (8.2%) |
| $500,000 to $749,999 | 172 (2.9%) | 123 (1.5%) |
| $750,000 to $999,999 | 25 (0.4%) | 8 (0.1%) |
| $1,000,000 or more | 55 (0.9%) | 14 (0.2%) |
| Total | 5,915 (100.0%) | 8,052 (100.0%) |
Household Income by Mortgage Status in Henry County
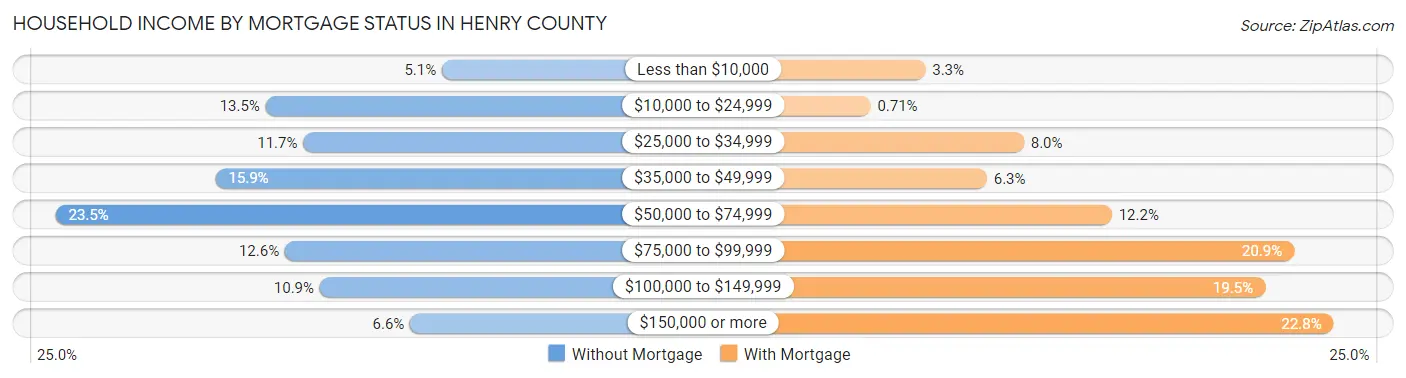
| Household Income | Without Mortgage | With Mortgage |
| Less than $10,000 | 303 (5.1%) | 267 (3.3%) |
| $10,000 to $24,999 | 800 (13.5%) | 57 (0.7%) |
| $25,000 to $34,999 | 694 (11.7%) | 645 (8.0%) |
| $35,000 to $49,999 | 941 (15.9%) | 503 (6.2%) |
| $50,000 to $74,999 | 1,392 (23.5%) | 982 (12.2%) |
| $75,000 to $99,999 | 745 (12.6%) | 1,681 (20.9%) |
| $100,000 to $149,999 | 647 (10.9%) | 1,570 (19.5%) |
| $150,000 or more | 393 (6.6%) | 1,833 (22.8%) |
| Total | 5,915 (100.0%) | 8,052 (100.0%) |
Property Value to Household Income Ratio in Henry County
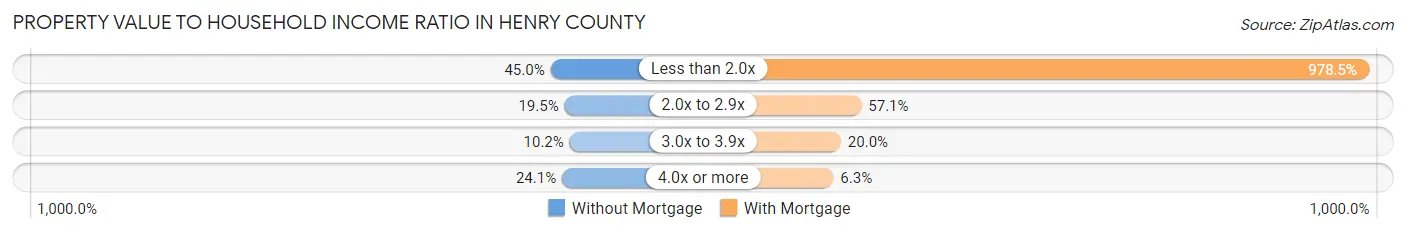
| Value-to-Income Ratio | Without Mortgage | With Mortgage |
| Less than 2.0x | 2,660 (45.0%) | 78,790 (978.5%) |
| 2.0x to 2.9x | 1,155 (19.5%) | 4,596 (57.1%) |
| 3.0x to 3.9x | 601 (10.2%) | 1,609 (20.0%) |
| 4.0x or more | 1,424 (24.1%) | 506 (6.3%) |
| Total | 5,915 (100.0%) | 8,052 (100.0%) |
Real Estate Taxes by Mortgage Status in Henry County
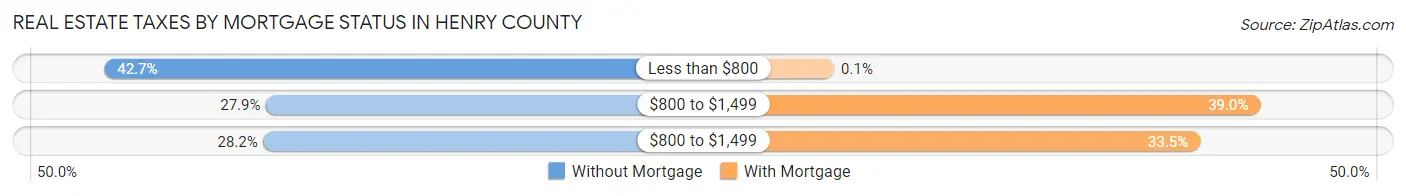
| Property Taxes | Without Mortgage | With Mortgage |
| Less than $800 | 2,527 (42.7%) | 8 (0.1%) |
| $800 to $1,499 | 1,652 (27.9%) | 3,141 (39.0%) |
| $800 to $1,499 | 1,667 (28.2%) | 2,699 (33.5%) |
| Total | 5,915 (100.0%) | 8,052 (100.0%) |
Health & Disability in Henry County
Health Insurance Coverage by Age in Henry County
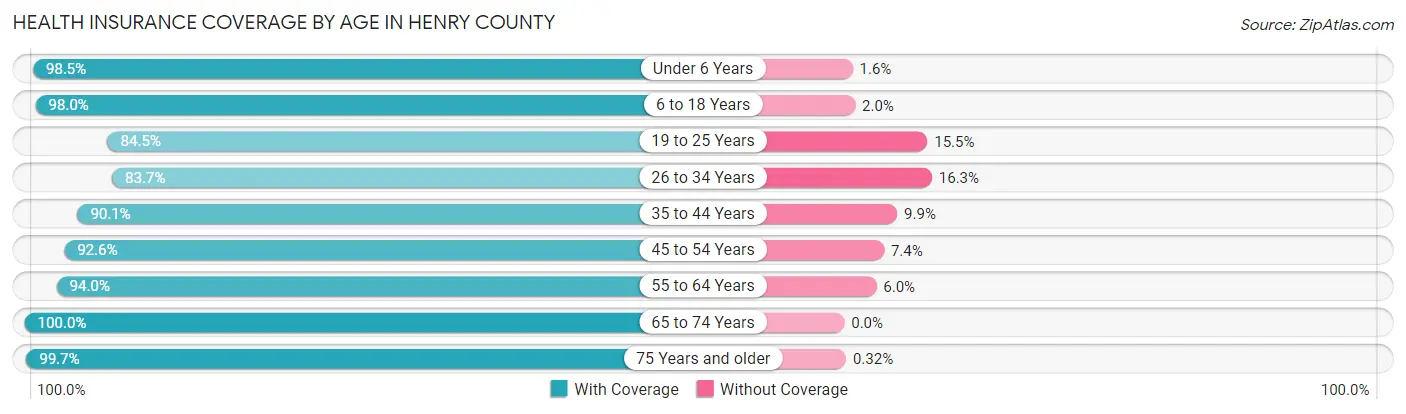
| Age Bracket | With Coverage | Without Coverage |
| Under 6 Years | 2,984 (98.5%) | 47 (1.5%) |
| 6 to 18 Years | 7,265 (98.0%) | 150 (2.0%) |
| 19 to 25 Years | 3,352 (84.5%) | 614 (15.5%) |
| 26 to 34 Years | 4,134 (83.7%) | 807 (16.3%) |
| 35 to 44 Years | 4,698 (90.1%) | 514 (9.9%) |
| 45 to 54 Years | 5,629 (92.6%) | 450 (7.4%) |
| 55 to 64 Years | 6,113 (94.0%) | 389 (6.0%) |
| 65 to 74 Years | 4,969 (100.0%) | 0 (0.0%) |
| 75 Years and older | 3,681 (99.7%) | 12 (0.3%) |
| Total | 42,825 (93.5%) | 2,983 (6.5%) |
Health Insurance Coverage by Citizenship Status in Henry County
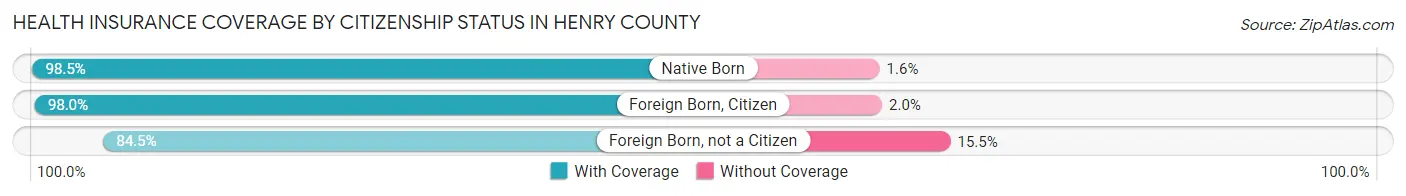
| Citizenship Status | With Coverage | Without Coverage |
| Native Born | 2,984 (98.5%) | 47 (1.5%) |
| Foreign Born, Citizen | 7,265 (98.0%) | 150 (2.0%) |
| Foreign Born, not a Citizen | 3,352 (84.5%) | 614 (15.5%) |
Health Insurance Coverage by Household Income in Henry County
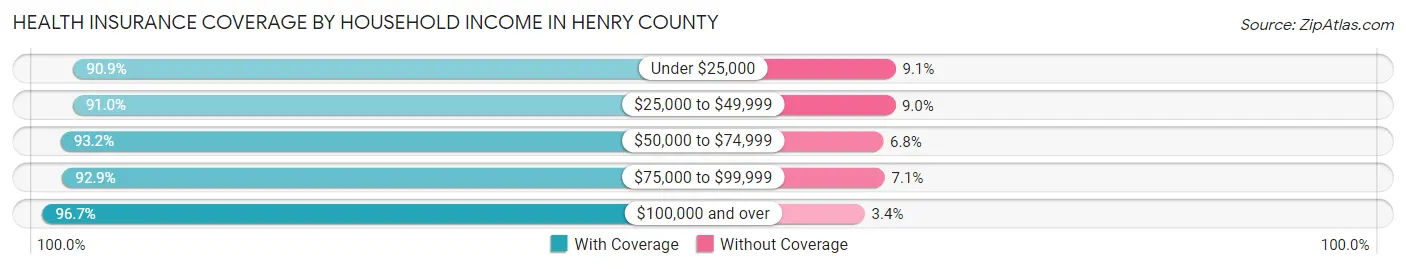
| Household Income | With Coverage | Without Coverage |
| Under $25,000 | 5,323 (90.9%) | 535 (9.1%) |
| $25,000 to $49,999 | 8,150 (91.0%) | 808 (9.0%) |
| $50,000 to $74,999 | 8,309 (93.2%) | 605 (6.8%) |
| $75,000 to $99,999 | 7,430 (92.9%) | 566 (7.1%) |
| $100,000 and over | 13,496 (96.7%) | 468 (3.4%) |
Public vs Private Health Insurance Coverage by Age in Henry County
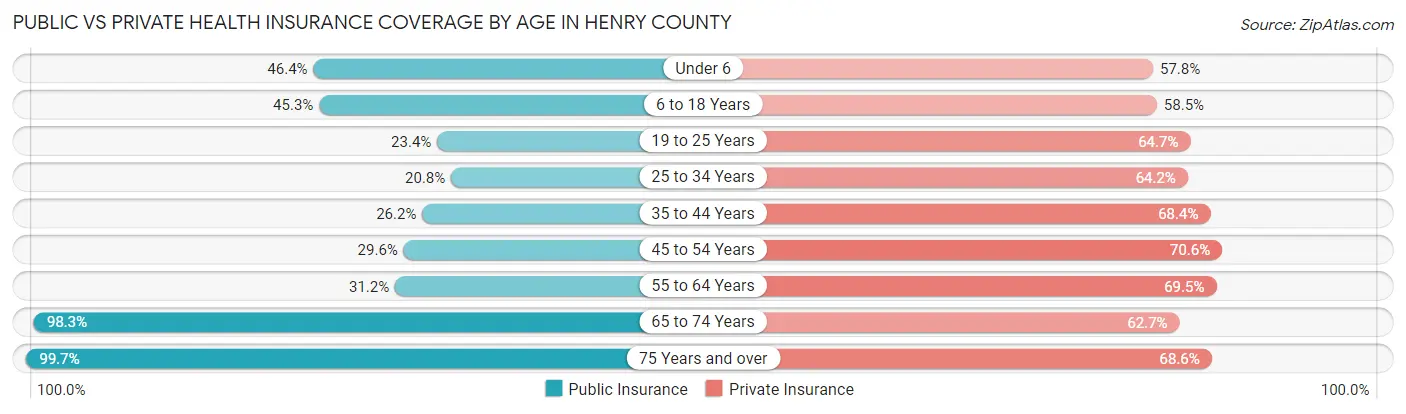
| Age Bracket | Public Insurance | Private Insurance |
| Under 6 | 1,406 (46.4%) | 1,751 (57.8%) |
| 6 to 18 Years | 3,361 (45.3%) | 4,337 (58.5%) |
| 19 to 25 Years | 929 (23.4%) | 2,565 (64.7%) |
| 25 to 34 Years | 1,029 (20.8%) | 3,172 (64.2%) |
| 35 to 44 Years | 1,365 (26.2%) | 3,564 (68.4%) |
| 45 to 54 Years | 1,802 (29.6%) | 4,290 (70.6%) |
| 55 to 64 Years | 2,031 (31.2%) | 4,519 (69.5%) |
| 65 to 74 Years | 4,884 (98.3%) | 3,114 (62.7%) |
| 75 Years and over | 3,681 (99.7%) | 2,535 (68.6%) |
| Total | 20,488 (44.7%) | 29,847 (65.2%) |
Disability Status by Sex by Age in Henry County
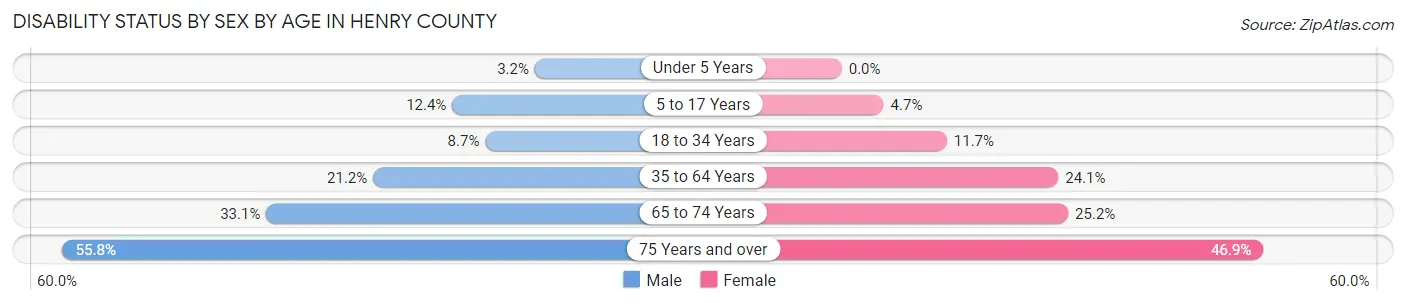
| Age Bracket | Male | Female |
| Under 5 Years | 41 (3.2%) | 0 (0.0%) |
| 5 to 17 Years | 477 (12.4%) | 169 (4.7%) |
| 18 to 34 Years | 452 (8.7%) | 496 (11.7%) |
| 35 to 64 Years | 1,897 (21.2%) | 2,131 (24.1%) |
| 65 to 74 Years | 757 (33.1%) | 676 (25.2%) |
| 75 Years and over | 871 (55.8%) | 1,000 (46.9%) |
Disability Class by Sex by Age in Henry County
Disability Class: Hearing Difficulty
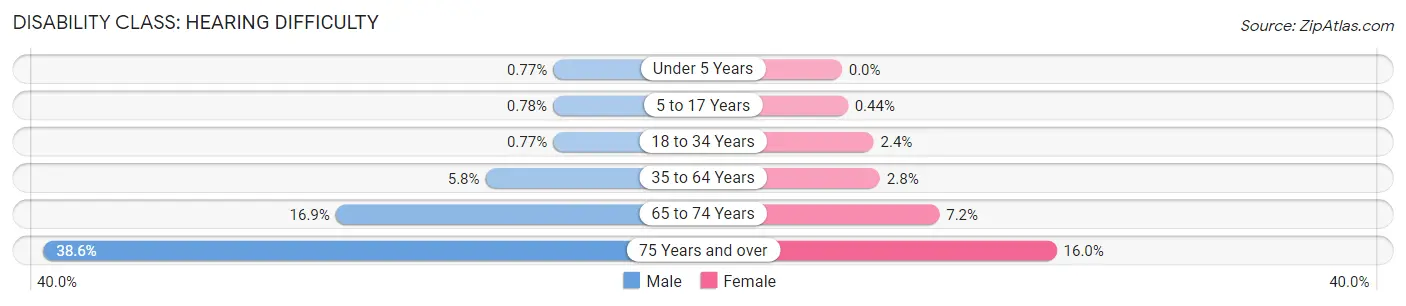
| Age Bracket | Male | Female |
| Under 5 Years | 10 (0.8%) | 0 (0.0%) |
| 5 to 17 Years | 30 (0.8%) | 16 (0.4%) |
| 18 to 34 Years | 40 (0.8%) | 100 (2.4%) |
| 35 to 64 Years | 518 (5.8%) | 250 (2.8%) |
| 65 to 74 Years | 387 (16.9%) | 194 (7.2%) |
| 75 Years and over | 603 (38.6%) | 340 (16.0%) |
Disability Class: Vision Difficulty
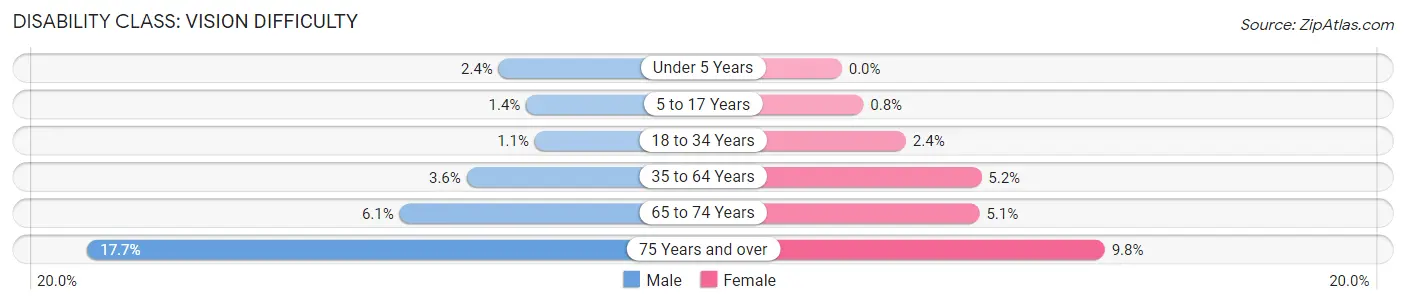
| Age Bracket | Male | Female |
| Under 5 Years | 31 (2.4%) | 0 (0.0%) |
| 5 to 17 Years | 53 (1.4%) | 29 (0.8%) |
| 18 to 34 Years | 55 (1.1%) | 101 (2.4%) |
| 35 to 64 Years | 321 (3.6%) | 458 (5.2%) |
| 65 to 74 Years | 139 (6.1%) | 137 (5.1%) |
| 75 Years and over | 276 (17.7%) | 208 (9.8%) |
Disability Class: Cognitive Difficulty
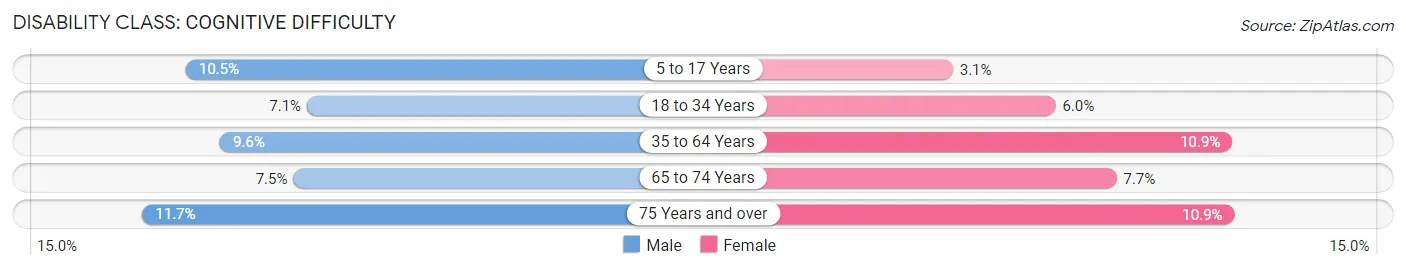
| Age Bracket | Male | Female |
| 5 to 17 Years | 405 (10.5%) | 112 (3.1%) |
| 18 to 34 Years | 371 (7.1%) | 252 (5.9%) |
| 35 to 64 Years | 856 (9.6%) | 961 (10.9%) |
| 65 to 74 Years | 172 (7.5%) | 205 (7.6%) |
| 75 Years and over | 183 (11.7%) | 233 (10.9%) |
Disability Class: Ambulatory Difficulty
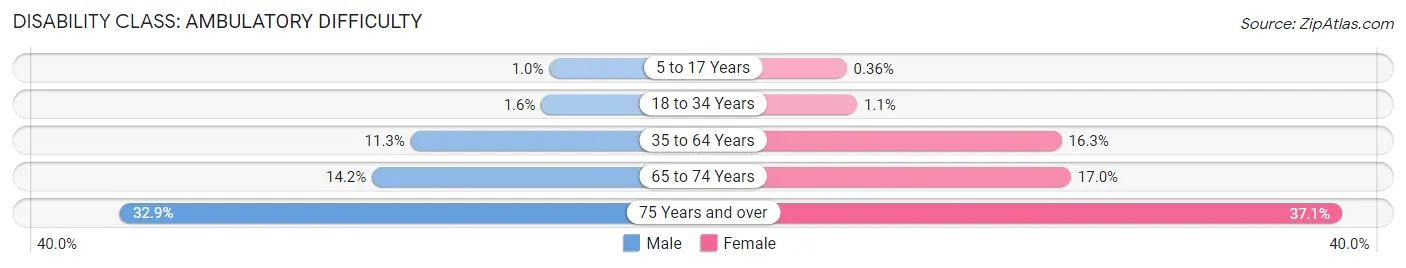
| Age Bracket | Male | Female |
| 5 to 17 Years | 40 (1.0%) | 13 (0.4%) |
| 18 to 34 Years | 85 (1.6%) | 48 (1.1%) |
| 35 to 64 Years | 1,015 (11.3%) | 1,443 (16.3%) |
| 65 to 74 Years | 325 (14.2%) | 456 (17.0%) |
| 75 Years and over | 514 (32.9%) | 791 (37.1%) |
Disability Class: Self-Care Difficulty
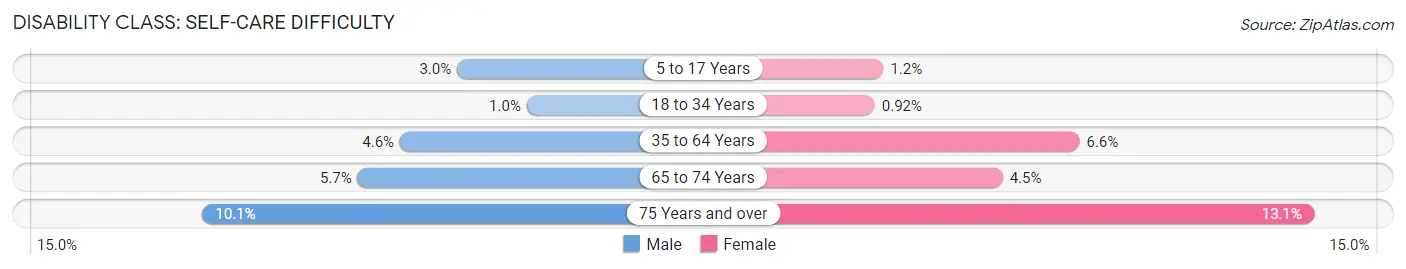
| Age Bracket | Male | Female |
| 5 to 17 Years | 114 (3.0%) | 42 (1.2%) |
| 18 to 34 Years | 53 (1.0%) | 39 (0.9%) |
| 35 to 64 Years | 407 (4.5%) | 585 (6.6%) |
| 65 to 74 Years | 131 (5.7%) | 120 (4.5%) |
| 75 Years and over | 157 (10.1%) | 280 (13.1%) |
Technology Access in Henry County
Computing Device Access in Henry County
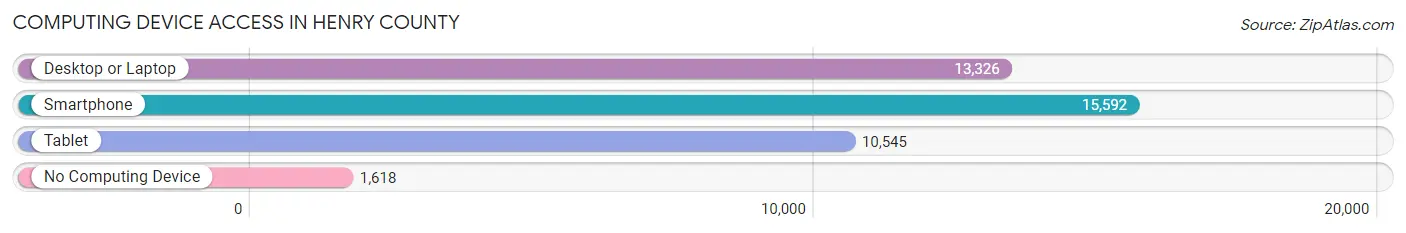
| Device Type | # Households | % Households |
| Desktop or Laptop | 13,326 | 71.8% |
| Smartphone | 15,592 | 84.1% |
| Tablet | 10,545 | 56.9% |
| No Computing Device | 1,618 | 8.7% |
| Total | 18,549 | 100.0% |
Internet Access in Henry County
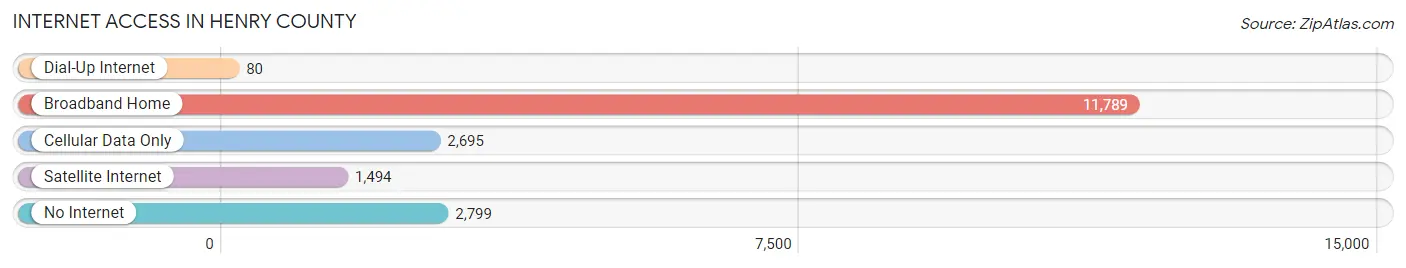
| Internet Type | # Households | % Households |
| Dial-Up Internet | 80 | 0.4% |
| Broadband Home | 11,789 | 63.6% |
| Cellular Data Only | 2,695 | 14.5% |
| Satellite Internet | 1,494 | 8.1% |
| No Internet | 2,799 | 15.1% |
| Total | 18,549 | 100.0% |
Henry County Summary
Henry County, Indiana is located in the east central part of the state, and is part of the Indianapolis metropolitan area. It is bordered by Madison County to the north, Hancock County to the east, Rush County to the south, and Delaware County to the west. The county seat is New Castle, and the county was named for Patrick Henry, the famous Revolutionary War patriot.
History
Henry County was formed in 1822 from parts of Delaware, Randolph, and Wayne counties. The county was named for Patrick Henry, the famous Revolutionary War patriot. The first settlers in the area were Quakers, who arrived in 1810. The county was largely agricultural, and the first crops grown were wheat, corn, and oats. The first county seat was in the town of Middletown, but it was moved to New Castle in 1824.
The county experienced rapid growth in the late 19th and early 20th centuries, due to the discovery of natural gas and oil in the area. This led to the development of several industries, including glass manufacturing, furniture making, and metalworking. The county also became a major center for the production of automobiles, with several factories located in New Castle.
Geography
Henry County covers an area of 437 square miles, and is located in the east central part of the state. It is bordered by Madison County to the north, Hancock County to the east, Rush County to the south, and Delaware County to the west. The county is mostly flat, with some rolling hills in the northern part. The White River flows through the county, and there are several small lakes and ponds. The county is part of the Central Till Plains region of Indiana.
Economy
Henry County has a diverse economy, with a mix of manufacturing, agriculture, and services. The county is home to several large employers, including New Castle Chrysler, New Castle Glass, and New Castle Metal Products. Agriculture is also an important part of the economy, with corn, soybeans, and wheat being the main crops. The county is also home to several small businesses, including restaurants, retail stores, and professional services.
Demographics
As of the 2010 census, Henry County had a population of 49,462. The population was spread out, with 24.3% under the age of 18, 8.2% from 18 to 24, 28.2% from 25 to 44, 24.3% from 45 to 64, and 14.0% who were 65 years of age or older. The median age was 37.4 years. The median income for a household in the county was $45,945, and the median income for a family was $54,945. The per capita income for the county was $21,945.
Henry County is largely white, with 91.2% of the population identifying as white. The largest minority group is African American, at 4.3%. Other minority groups include Hispanic or Latino (2.3%), Asian (1.2%), and Native American (0.3%). The county is also home to a large Amish population, with over 1,000 Amish living in the county.
Common Questions
What is the Total Population of Henry County?
Total Population of Henry County is 48,913.
What is the Total Male Population of Henry County?
Total Male Population of Henry County is 25,877.
What is the Total Female Population of Henry County?
Total Female Population of Henry County is 23,036.
What is the Ratio of Males per 100 Females in Henry County?
There are 112.33 Males per 100 Females in Henry County.
What is the Ratio of Females per 100 Males in Henry County?
There are 89.02 Females per 100 Males in Henry County.
What is the Median Population Age in Henry County?
Median Population Age in Henry County is 42.2 Years.
What is the Average Family Size in Henry County
Average Family Size in Henry County is 3.0 People.
What is the Average Household Size in Henry County
Average Household Size in Henry County is 2.5 People.
What is Per Capita Income in Henry County?
Per Capita income in Henry County is $29,421.
What is the Median Family Income in Henry County?
Median Family Income in Henry County is $71,332.
What is the Median Household income in Henry County?
Median Household Income in Henry County is $57,632.
What is Income or Wage Gap in Henry County?
Income or Wage Gap in Henry County is 22.7%.
Women in Henry County earn 77.3 cents for every dollar earned by a man.
What is Family Income Deficit in Henry County?
Family Income Deficit in Henry County is $10,274.
Families that are below poverty line in Henry County earn $10,274 less on average than the poverty threshold level.
What is Inequality or Gini Index in Henry County?
Inequality or Gini Index in Henry County is 0.43.
How Large is the Labor Force in Henry County?
There are 21,634 People in the Labor Forcein in Henry County.
What is the Percentage of People in the Labor Force in Henry County?
54.0% of People are in the Labor Force in Henry County.
What is the Unemployment Rate in Henry County?
Unemployment Rate in Henry County is 4.5%.