Hendricks County, IN
Hendricks County Overview
175,639
TOTAL POPULATION
88,267
MALE POPULATION
87,372
FEMALE POPULATION
101.02
MALES / 100 FEMALES
98.99
FEMALES / 100 MALES
38.4
MEDIAN AGE
3.1
AVG FAMILY SIZE
2.7
AVG HOUSEHOLD SIZE
$43,651
PER CAPITA INCOME
$109,727
AVG FAMILY INCOME
$95,261
AVG HOUSEHOLD INCOME
31.8%
WAGE / INCOME GAP [ % ]
68.2¢/ $1
WAGE / INCOME GAP [ $ ]
$9,725
FAMILY INCOME DEFICIT
0.39
INEQUALITY / GINI INDEX
96,183
LABOR FORCE [ PEOPLE ]
69.8%
PERCENT IN LABOR FORCE
2.4%
UNEMPLOYMENT RATE
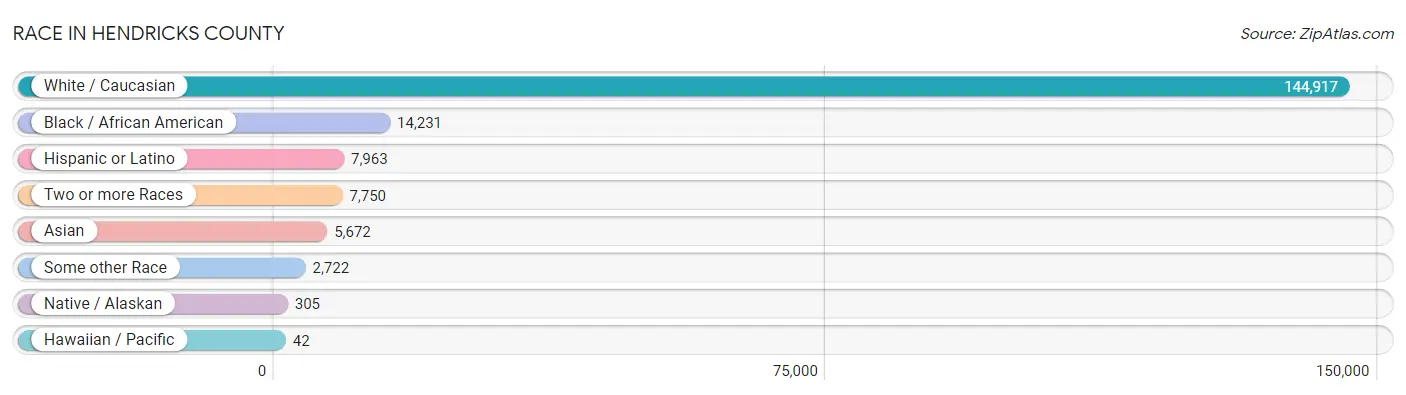
Race in Hendricks County
The most populous races in Hendricks County are White / Caucasian (144,917 | 82.5%), Black / African American (14,231 | 8.1%), and Hispanic or Latino (7,963 | 4.5%).
| Race | # Population | % Population |
| Asian | 5,672 | 3.2% |
| Black / African American | 14,231 | 8.1% |
| Hawaiian / Pacific | 42 | 0.0% |
| Hispanic or Latino | 7,963 | 4.5% |
| Native / Alaskan | 305 | 0.2% |
| White / Caucasian | 144,917 | 82.5% |
| Two or more Races | 7,750 | 4.4% |
| Some other Race | 2,722 | 1.5% |
| Total | 175,639 | 100.0% |
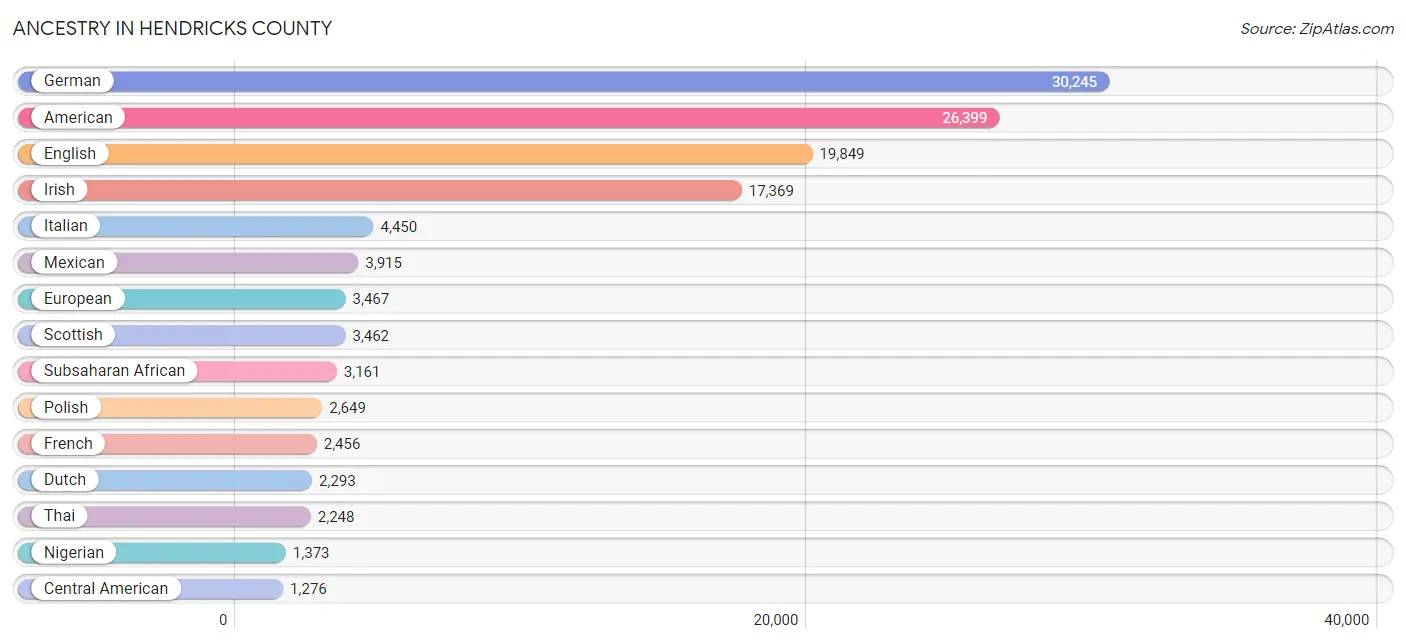
Ancestry in Hendricks County
The most populous ancestries reported in Hendricks County are German (30,245 | 17.2%), American (26,399 | 15.0%), English (19,849 | 11.3%), Irish (17,369 | 9.9%), and Italian (4,450 | 2.5%), together accounting for 56.0% of all Hendricks County residents.
| Ancestry | # Population | % Population |
| Afghan | 87 | 0.1% |
| African | 717 | 0.4% |
| Alaskan Athabascan | 8 | 0.0% |
| Alsatian | 7 | 0.0% |
| American | 26,399 | 15.0% |
| Apache | 35 | 0.0% |
| Arab | 247 | 0.1% |
| Argentinean | 153 | 0.1% |
| Armenian | 24 | 0.0% |
| Austrian | 267 | 0.2% |
| Bangladeshi | 8 | 0.0% |
| Basque | 23 | 0.0% |
| Belgian | 217 | 0.1% |
| Bhutanese | 144 | 0.1% |
| Blackfeet | 6 | 0.0% |
| Bolivian | 20 | 0.0% |
| Brazilian | 185 | 0.1% |
| British | 1,020 | 0.6% |
| Burmese | 225 | 0.1% |
| Cambodian | 4 | 0.0% |
| Canadian | 236 | 0.1% |
| Central American | 1,276 | 0.7% |
| Cherokee | 455 | 0.3% |
| Cheyenne | 14 | 0.0% |
| Chilean | 38 | 0.0% |
| Chippewa | 2 | 0.0% |
| Colombian | 110 | 0.1% |
| Costa Rican | 63 | 0.0% |
| Creek | 4 | 0.0% |
| Croatian | 93 | 0.1% |
| Cuban | 126 | 0.1% |
| Czech | 216 | 0.1% |
| Czechoslovakian | 118 | 0.1% |
| Danish | 246 | 0.1% |
| Delaware | 76 | 0.0% |
| Dominican | 279 | 0.2% |
| Dutch | 2,293 | 1.3% |
| Eastern European | 880 | 0.5% |
| Ecuadorian | 19 | 0.0% |
| Egyptian | 59 | 0.0% |
| English | 19,849 | 11.3% |
| Ethiopian | 691 | 0.4% |
| European | 3,467 | 2.0% |
| Filipino | 64 | 0.0% |
| Finnish | 262 | 0.2% |
| French | 2,456 | 1.4% |
| French Canadian | 177 | 0.1% |
| German | 30,245 | 17.2% |
| Ghanaian | 10 | 0.0% |
| Greek | 576 | 0.3% |
| Guatemalan | 43 | 0.0% |
| Haitian | 82 | 0.1% |
| Honduran | 31 | 0.0% |
| Hungarian | 528 | 0.3% |
| Icelander | 4 | 0.0% |
| Indian (Asian) | 939 | 0.5% |
| Indonesian | 1 | 0.0% |
| Iranian | 31 | 0.0% |
| Irish | 17,369 | 9.9% |
| Italian | 4,450 | 2.5% |
| Jamaican | 67 | 0.0% |
| Kenyan | 43 | 0.0% |
| Korean | 675 | 0.4% |
| Laotian | 232 | 0.1% |
| Latvian | 38 | 0.0% |
| Lebanese | 62 | 0.0% |
| Lithuanian | 353 | 0.2% |
| Macedonian | 236 | 0.1% |
| Malaysian | 45 | 0.0% |
| Mexican | 3,915 | 2.2% |
| Moroccan | 48 | 0.0% |
| Native Hawaiian | 63 | 0.0% |
| Navajo | 3 | 0.0% |
| Nicaraguan | 41 | 0.0% |
| Nigerian | 1,373 | 0.8% |
| Northern European | 406 | 0.2% |
| Norwegian | 808 | 0.5% |
| Panamanian | 86 | 0.1% |
| Pennsylvania German | 26 | 0.0% |
| Peruvian | 46 | 0.0% |
| Polish | 2,649 | 1.5% |
| Portuguese | 141 | 0.1% |
| Puerto Rican | 690 | 0.4% |
| Romanian | 248 | 0.1% |
| Russian | 453 | 0.3% |
| Salvadoran | 493 | 0.3% |
| Samoan | 18 | 0.0% |
| Scandinavian | 216 | 0.1% |
| Scotch-Irish | 1,092 | 0.6% |
| Scottish | 3,462 | 2.0% |
| Serbian | 95 | 0.1% |
| Sioux | 2 | 0.0% |
| Slavic | 66 | 0.0% |
| Slovak | 247 | 0.1% |
| Slovene | 418 | 0.2% |
| South American | 741 | 0.4% |
| Spaniard | 453 | 0.3% |
| Spanish | 67 | 0.0% |
| Sri Lankan | 216 | 0.1% |
| Subsaharan African | 3,161 | 1.8% |
| Swedish | 895 | 0.5% |
| Swiss | 437 | 0.3% |
| Syrian | 17 | 0.0% |
| Thai | 2,248 | 1.3% |
| Turkish | 35 | 0.0% |
| Ukrainian | 91 | 0.1% |
| Venezuelan | 355 | 0.2% |
| Welsh | 919 | 0.5% |
| West Indian | 27 | 0.0% |
| Yugoslavian | 52 | 0.0% | View All 110 Rows |
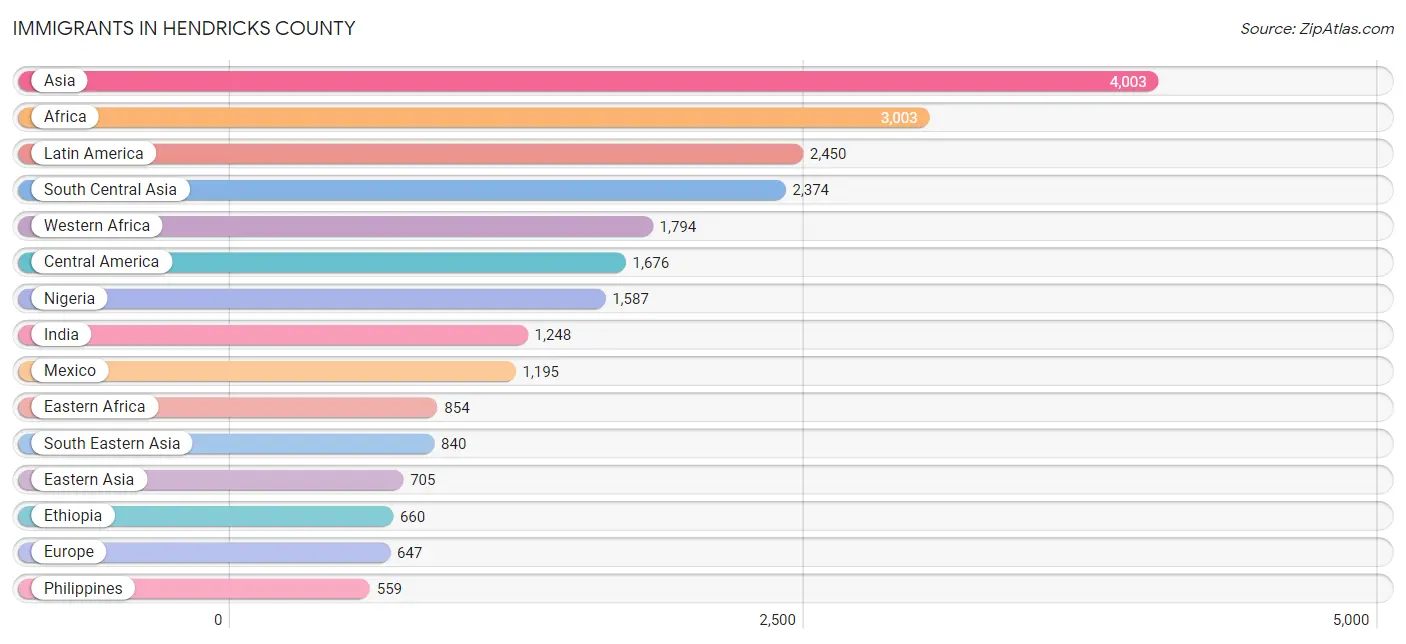
Immigrants in Hendricks County
The most numerous immigrant groups reported in Hendricks County came from Asia (4,003 | 2.3%), Africa (3,003 | 1.7%), Latin America (2,450 | 1.4%), South Central Asia (2,374 | 1.3%), and Western Africa (1,794 | 1.0%), together accounting for 7.7% of all Hendricks County residents.
| Immigration Origin | # Population | % Population |
| Afghanistan | 32 | 0.0% |
| Africa | 3,003 | 1.7% |
| Argentina | 87 | 0.1% |
| Asia | 4,003 | 2.3% |
| Bosnia and Herzegovina | 14 | 0.0% |
| Brazil | 153 | 0.1% |
| Canada | 265 | 0.2% |
| Caribbean | 223 | 0.1% |
| Central America | 1,676 | 0.9% |
| China | 557 | 0.3% |
| Colombia | 42 | 0.0% |
| Congo | 127 | 0.1% |
| Cuba | 22 | 0.0% |
| Dominican Republic | 8 | 0.0% |
| Eastern Africa | 854 | 0.5% |
| Eastern Asia | 705 | 0.4% |
| Eastern Europe | 203 | 0.1% |
| Ecuador | 19 | 0.0% |
| El Salvador | 5 | 0.0% |
| England | 75 | 0.0% |
| Eritrea | 151 | 0.1% |
| Ethiopia | 660 | 0.4% |
| Europe | 647 | 0.4% |
| France | 150 | 0.1% |
| Germany | 12 | 0.0% |
| Greece | 9 | 0.0% |
| Guatemala | 41 | 0.0% |
| Guyana | 81 | 0.1% |
| Haiti | 131 | 0.1% |
| Honduras | 24 | 0.0% |
| Hong Kong | 41 | 0.0% |
| India | 1,248 | 0.7% |
| Iran | 47 | 0.0% |
| Jamaica | 62 | 0.0% |
| Japan | 10 | 0.0% |
| Kenya | 43 | 0.0% |
| Korea | 138 | 0.1% |
| Kuwait | 65 | 0.0% |
| Laos | 10 | 0.0% |
| Latin America | 2,450 | 1.4% |
| Lithuania | 43 | 0.0% |
| Malaysia | 26 | 0.0% |
| Mexico | 1,195 | 0.7% |
| Middle Africa | 135 | 0.1% |
| Moldova | 21 | 0.0% |
| Nicaragua | 24 | 0.0% |
| Nigeria | 1,587 | 0.9% |
| Northern Europe | 75 | 0.0% |
| Pakistan | 518 | 0.3% |
| Panama | 73 | 0.0% |
| Peru | 54 | 0.0% |
| Philippines | 559 | 0.3% |
| Poland | 27 | 0.0% |
| Russia | 29 | 0.0% |
| Serbia | 23 | 0.0% |
| South Africa | 29 | 0.0% |
| South America | 551 | 0.3% |
| South Central Asia | 2,374 | 1.3% |
| South Eastern Asia | 840 | 0.5% |
| Southern Europe | 207 | 0.1% |
| Spain | 198 | 0.1% |
| Sri Lanka | 516 | 0.3% |
| Taiwan | 107 | 0.1% |
| Thailand | 23 | 0.0% |
| Turkey | 19 | 0.0% |
| Ukraine | 26 | 0.0% |
| Venezuela | 115 | 0.1% |
| Vietnam | 171 | 0.1% |
| Western Africa | 1,794 | 1.0% |
| Western Asia | 84 | 0.1% |
| Western Europe | 162 | 0.1% |
| Zaire | 8 | 0.0% | View All 72 Rows |
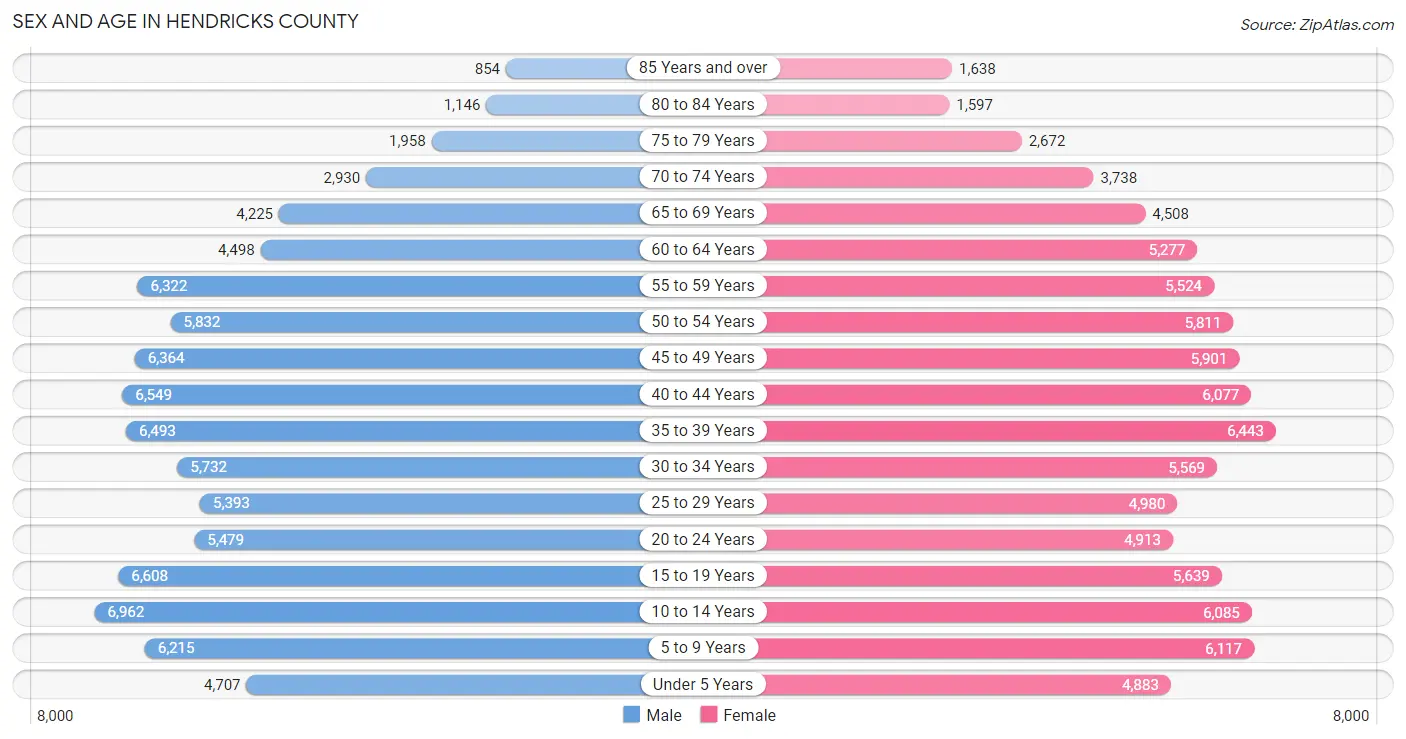
Sex and Age in Hendricks County
Sex and Age in Hendricks County
The most populous age groups in Hendricks County are 10 to 14 Years (6,962 | 7.9%) for men and 35 to 39 Years (6,443 | 7.4%) for women.
| Age Bracket | Male | Female |
| Under 5 Years | 4,707 (5.3%) | 4,883 (5.6%) |
| 5 to 9 Years | 6,215 (7.0%) | 6,117 (7.0%) |
| 10 to 14 Years | 6,962 (7.9%) | 6,085 (7.0%) |
| 15 to 19 Years | 6,608 (7.5%) | 5,639 (6.5%) |
| 20 to 24 Years | 5,479 (6.2%) | 4,913 (5.6%) |
| 25 to 29 Years | 5,393 (6.1%) | 4,980 (5.7%) |
| 30 to 34 Years | 5,732 (6.5%) | 5,569 (6.4%) |
| 35 to 39 Years | 6,493 (7.4%) | 6,443 (7.4%) |
| 40 to 44 Years | 6,549 (7.4%) | 6,077 (7.0%) |
| 45 to 49 Years | 6,364 (7.2%) | 5,901 (6.8%) |
| 50 to 54 Years | 5,832 (6.6%) | 5,811 (6.7%) |
| 55 to 59 Years | 6,322 (7.2%) | 5,524 (6.3%) |
| 60 to 64 Years | 4,498 (5.1%) | 5,277 (6.0%) |
| 65 to 69 Years | 4,225 (4.8%) | 4,508 (5.2%) |
| 70 to 74 Years | 2,930 (3.3%) | 3,738 (4.3%) |
| 75 to 79 Years | 1,958 (2.2%) | 2,672 (3.1%) |
| 80 to 84 Years | 1,146 (1.3%) | 1,597 (1.8%) |
| 85 Years and over | 854 (1.0%) | 1,638 (1.9%) |
| Total | 88,267 (100.0%) | 87,372 (100.0%) |
Families and Households in Hendricks County
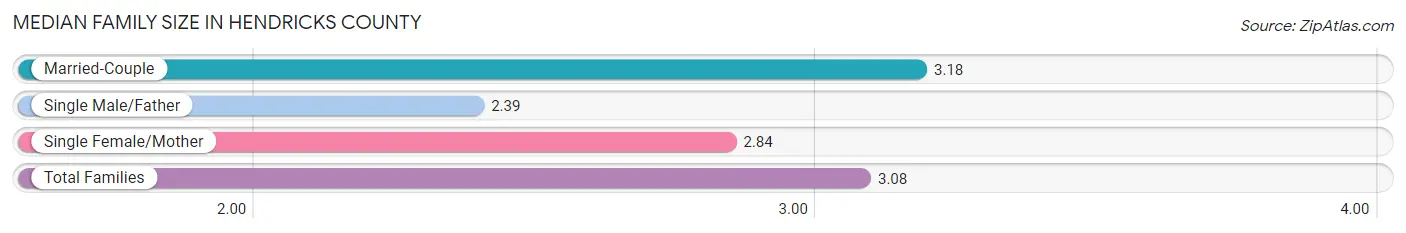
Median Family Size in Hendricks County
The median family size in Hendricks County is 3.08 persons per family, with married-couple families (39,230 | 81.0%) accounting for the largest median family size of 3.18 persons per family. On the other hand, single male/father families (3,417 | 7.0%) represent the smallest median family size with 2.39 persons per family.
| Family Type | # Families | Family Size |
| Married-Couple | 39,230 (81.0%) | 3.18 |
| Single Male/Father | 3,417 (7.0%) | 2.39 |
| Single Female/Mother | 5,799 (12.0%) | 2.84 |
| Total Families | 48,446 (100.0%) | 3.08 |
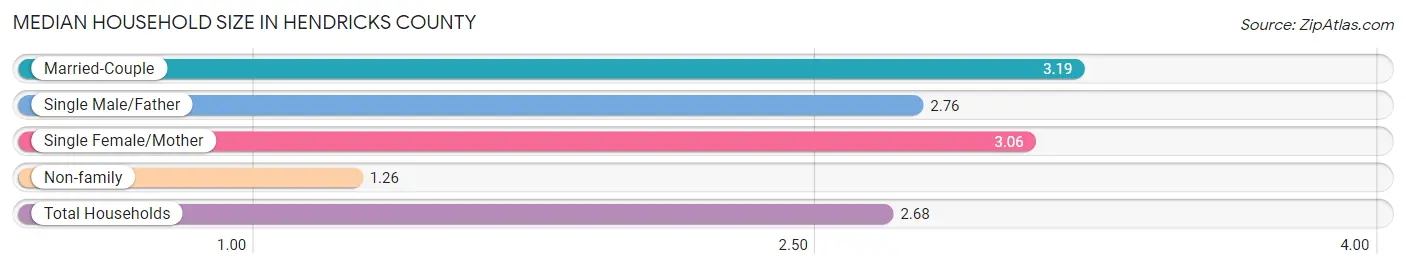
Median Household Size in Hendricks County
The median household size in Hendricks County is 2.68 persons per household, with married-couple households (39,230 | 60.9%) accounting for the largest median household size of 3.19 persons per household. non-family households (15,957 | 24.8%) represent the smallest median household size with 1.26 persons per household.
| Household Type | # Households | Household Size |
| Married-Couple | 39,230 (60.9%) | 3.19 |
| Single Male/Father | 3,417 (5.3%) | 2.76 |
| Single Female/Mother | 5,799 (9.0%) | 3.06 |
| Non-family | 15,957 (24.8%) | 1.26 |
| Total Households | 64,403 (100.0%) | 2.68 |
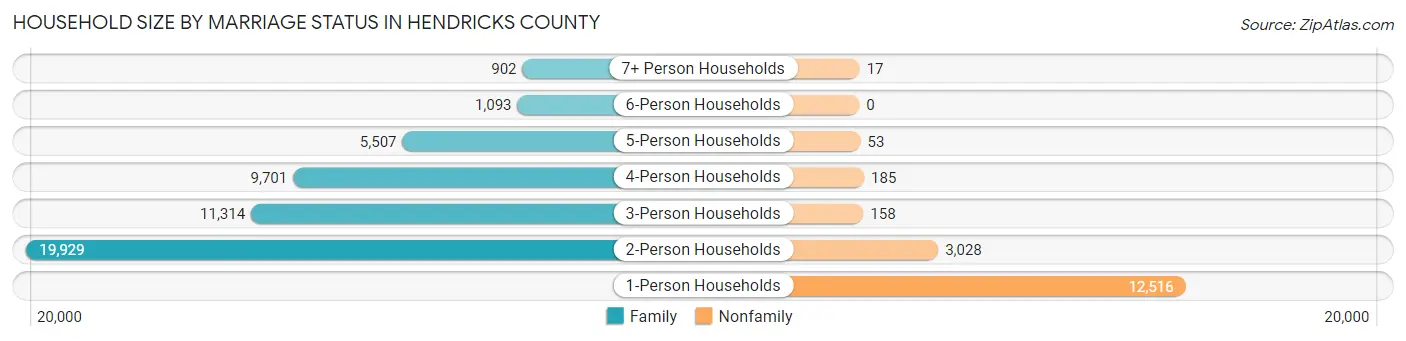
Household Size by Marriage Status in Hendricks County
Out of a total of 64,403 households in Hendricks County, 48,446 (75.2%) are family households, while 15,957 (24.8%) are nonfamily households. The most numerous type of family households are 2-person households, comprising 19,929, and the most common type of nonfamily households are 1-person households, comprising 12,516.
| Household Size | Family Households | Nonfamily Households |
| 1-Person Households | - | 12,516 (19.4%) |
| 2-Person Households | 19,929 (30.9%) | 3,028 (4.7%) |
| 3-Person Households | 11,314 (17.6%) | 158 (0.3%) |
| 4-Person Households | 9,701 (15.1%) | 185 (0.3%) |
| 5-Person Households | 5,507 (8.6%) | 53 (0.1%) |
| 6-Person Households | 1,093 (1.7%) | 0 (0.0%) |
| 7+ Person Households | 902 (1.4%) | 17 (0.0%) |
| Total | 48,446 (75.2%) | 15,957 (24.8%) |
Female Fertility in Hendricks County
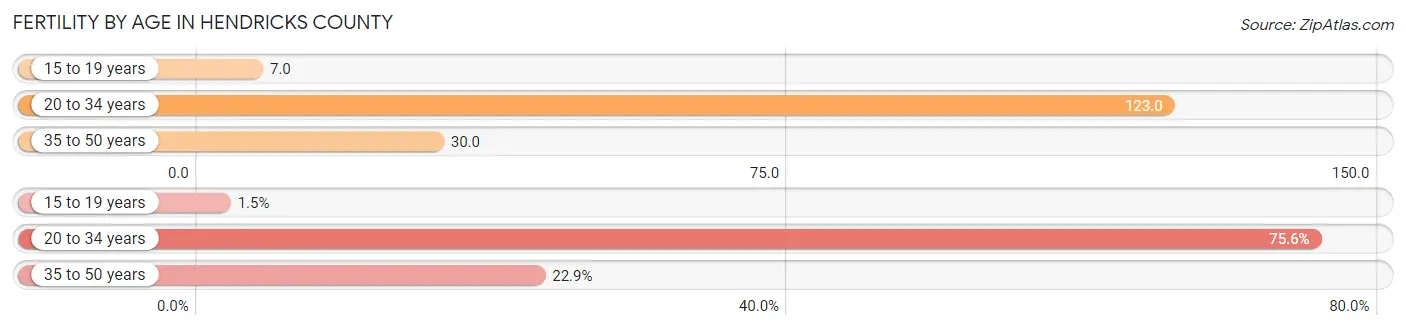
Fertility by Age in Hendricks County
Average fertility rate in Hendricks County is 62.0 births per 1,000 women. Women in the age bracket of 20 to 34 years have the highest fertility rate with 123.0 births per 1,000 women. Women in the age bracket of 20 to 34 years acount for 75.6% of all women with births.
| Age Bracket | Women with Births | Births / 1,000 Women |
| 15 to 19 years | 39 (1.5%) | 7.0 |
| 20 to 34 years | 1,908 (75.6%) | 123.0 |
| 35 to 50 years | 578 (22.9%) | 30.0 |
| Total | 2,525 (100.0%) | 62.0 |
Fertility by Age by Marriage Status in Hendricks County
79.9% of women with births (2,525) in Hendricks County are married. The highest percentage of unmarried women with births falls into 15 to 19 years age bracket with 100.0% of them unmarried at the time of birth, while the lowest percentage of unmarried women with births belong to 35 to 50 years age bracket with 9.0% of them unmarried.
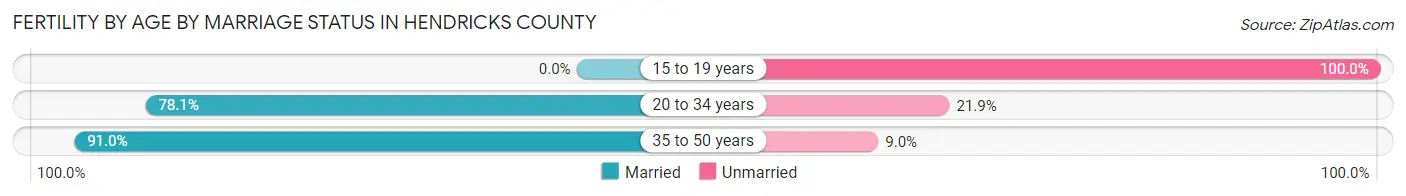
| Age Bracket | Married | Unmarried |
| 15 to 19 years | 0 (0.0%) | 39 (100.0%) |
| 20 to 34 years | 1,490 (78.1%) | 418 (21.9%) |
| 35 to 50 years | 526 (91.0%) | 52 (9.0%) |
| Total | 2,017 (79.9%) | 508 (20.1%) |
Fertility by Education in Hendricks County
Average fertility rate in Hendricks County is 62.0 births per 1,000 women. Women with the education attainment of graduate degree have the highest fertility rate of 85.0 births per 1,000 women, while women with the education attainment of less than high school have the lowest fertility at 16.0 births per 1,000 women. Women with the education attainment of bachelor's degree represent 35.0% of all women with births.
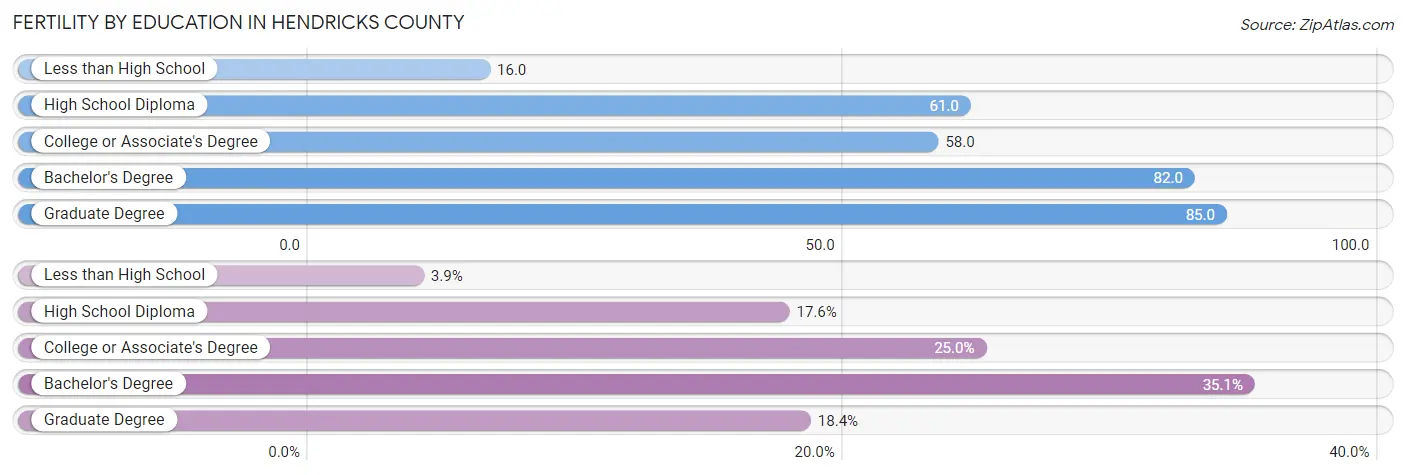
| Educational Attainment | Women with Births | Births / 1,000 Women |
| Less than High School | 99 (3.9%) | 16.0 |
| High School Diploma | 445 (17.6%) | 61.0 |
| College or Associate's Degree | 631 (25.0%) | 58.0 |
| Bachelor's Degree | 885 (35.0%) | 82.0 |
| Graduate Degree | 465 (18.4%) | 85.0 |
| Total | 2,525 (100.0%) | 62.0 |
Fertility by Education by Marriage Status in Hendricks County
20.1% of women with births in Hendricks County are unmarried. Women with the educational attainment of graduate degree are most likely to be married with 100.0% of them married at childbirth, while women with the educational attainment of less than high school are least likely to be married with 55.6% of them unmarried at childbirth.
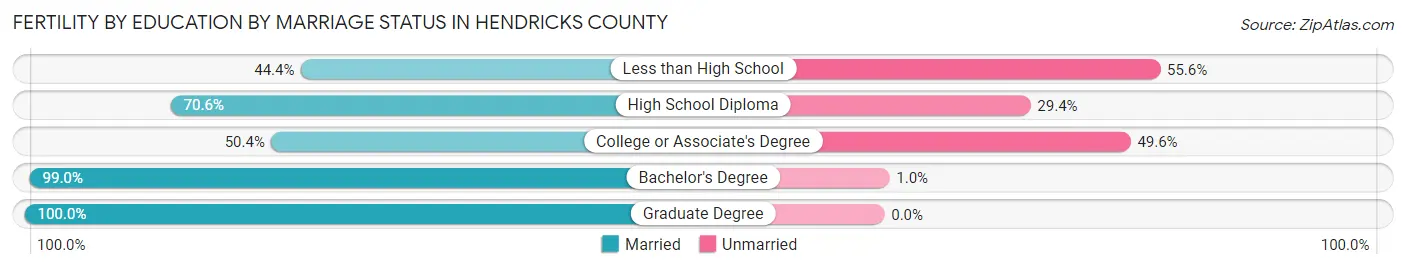
| Educational Attainment | Married | Unmarried |
| Less than High School | 44 (44.4%) | 55 (55.6%) |
| High School Diploma | 314 (70.6%) | 131 (29.4%) |
| College or Associate's Degree | 318 (50.4%) | 313 (49.6%) |
| Bachelor's Degree | 876 (99.0%) | 9 (1.0%) |
| Graduate Degree | 465 (100.0%) | 0 (0.0%) |
| Total | 2,017 (79.9%) | 508 (20.1%) |
Income in Hendricks County
Income Overview in Hendricks County
Per Capita Income in Hendricks County is $43,651, while median incomes of families and households are $109,727 and $95,261 respectively.
| Characteristic | Number | Measure |
| Per Capita Income | 175,639 | $43,651 |
| Median Family Income | 48,446 | $109,727 |
| Mean Family Income | 48,446 | $132,506 |
| Median Household Income | 64,403 | $95,261 |
| Mean Household Income | 64,403 | $117,133 |
| Income Deficit | 48,446 | $9,725 |
| Wage / Income Gap (%) | 175,639 | 31.77% |
| Wage / Income Gap ($) | 175,639 | 68.23¢ per $1 |
| Gini / Inequality Index | 175,639 | 0.39 |
Earnings by Sex in Hendricks County
Average Earnings in Hendricks County are $49,007, $59,214 for men and $40,404 for women, a difference of 31.8%.
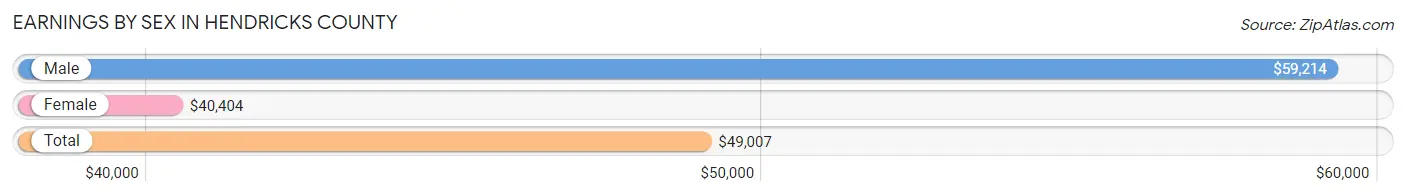
| Sex | Number | Average Earnings |
| Male | 52,662 (52.6%) | $59,214 |
| Female | 47,478 (47.4%) | $40,404 |
| Total | 100,140 (100.0%) | $49,007 |
Earnings by Sex by Income Bracket in Hendricks County
The most common earnings brackets in Hendricks County are $100,000+ for men (11,872 | 22.5%) and $100,000+ for women (4,989 | 10.5%).
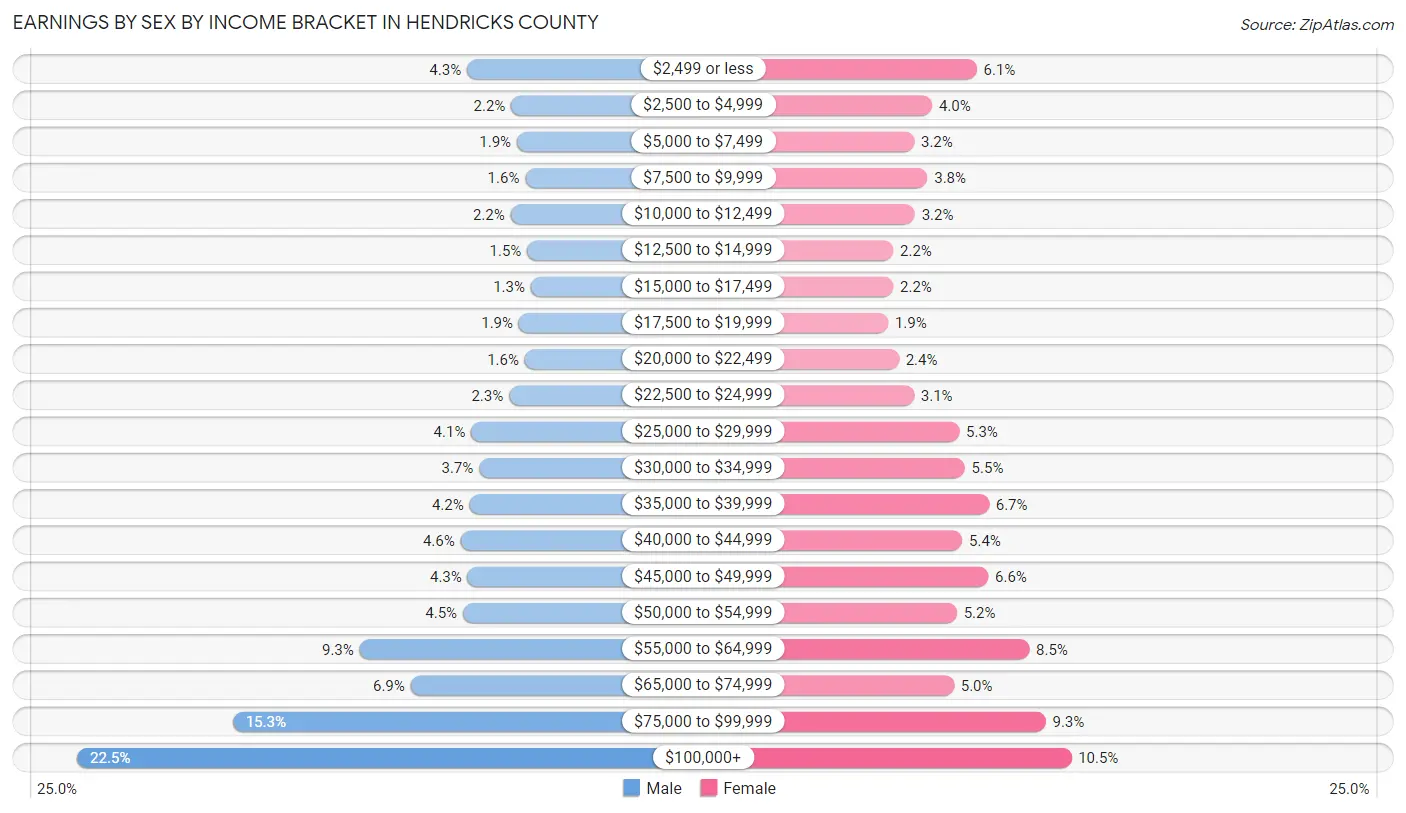
| Income | Male | Female |
| $2,499 or less | 2,256 (4.3%) | 2,889 (6.1%) |
| $2,500 to $4,999 | 1,163 (2.2%) | 1,895 (4.0%) |
| $5,000 to $7,499 | 1,024 (1.9%) | 1,497 (3.2%) |
| $7,500 to $9,999 | 818 (1.5%) | 1,791 (3.8%) |
| $10,000 to $12,499 | 1,178 (2.2%) | 1,512 (3.2%) |
| $12,500 to $14,999 | 771 (1.5%) | 1,031 (2.2%) |
| $15,000 to $17,499 | 680 (1.3%) | 1,031 (2.2%) |
| $17,500 to $19,999 | 976 (1.8%) | 914 (1.9%) |
| $20,000 to $22,499 | 825 (1.6%) | 1,155 (2.4%) |
| $22,500 to $24,999 | 1,217 (2.3%) | 1,492 (3.1%) |
| $25,000 to $29,999 | 2,151 (4.1%) | 2,496 (5.3%) |
| $30,000 to $34,999 | 1,955 (3.7%) | 2,619 (5.5%) |
| $35,000 to $39,999 | 2,193 (4.2%) | 3,155 (6.7%) |
| $40,000 to $44,999 | 2,412 (4.6%) | 2,565 (5.4%) |
| $45,000 to $49,999 | 2,240 (4.3%) | 3,145 (6.6%) |
| $50,000 to $54,999 | 2,354 (4.5%) | 2,446 (5.1%) |
| $55,000 to $64,999 | 4,901 (9.3%) | 4,055 (8.5%) |
| $65,000 to $74,999 | 3,646 (6.9%) | 2,379 (5.0%) |
| $75,000 to $99,999 | 8,030 (15.2%) | 4,422 (9.3%) |
| $100,000+ | 11,872 (22.5%) | 4,989 (10.5%) |
| Total | 52,662 (100.0%) | 47,478 (100.0%) |
Earnings by Sex by Educational Attainment in Hendricks County
Average earnings in Hendricks County are $65,861 for men and $45,996 for women, a difference of 30.2%. Men with an educational attainment of graduate degree enjoy the highest average annual earnings of $114,591, while those with less than high school education earn the least with $50,207. Women with an educational attainment of graduate degree earn the most with the average annual earnings of $76,108, while those with less than high school education have the smallest earnings of $33,361.
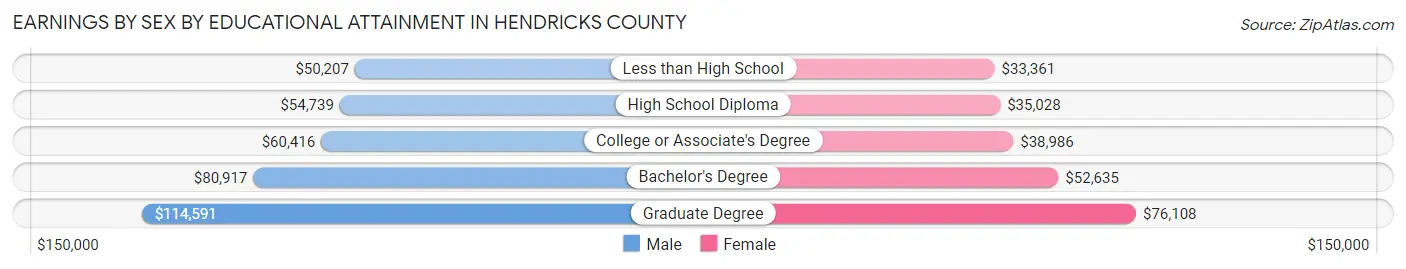
| Educational Attainment | Male Income | Female Income |
| Less than High School | $50,207 | $33,361 |
| High School Diploma | $54,739 | $35,028 |
| College or Associate's Degree | $60,416 | $38,986 |
| Bachelor's Degree | $80,917 | $52,635 |
| Graduate Degree | $114,591 | $76,108 |
| Total | $65,861 | $45,996 |
Family Income in Hendricks County
Family Income Brackets in Hendricks County
According to the Hendricks County family income data, there are 12,887 families falling into the $100,000 to $149,999 income range, which is the most common income bracket and makes up 26.6% of all families. Conversely, the $10,000 to $14,999 income bracket is the least frequent group with only 194 families (0.4%) belonging to this category.
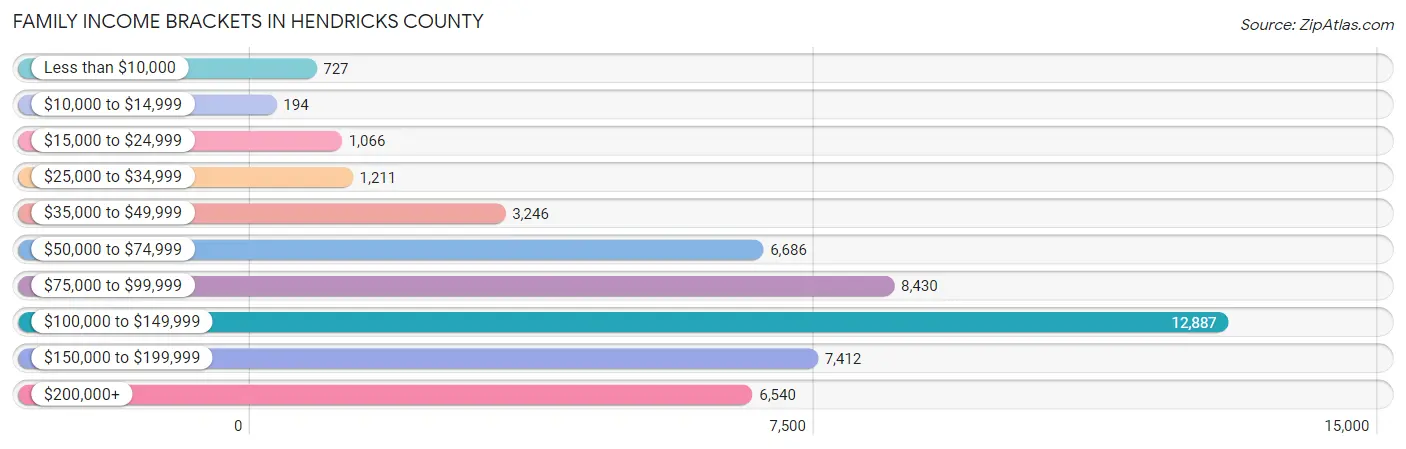
| Income Bracket | # Families | % Families |
| Less than $10,000 | 727 | 1.5% |
| $10,000 to $14,999 | 194 | 0.4% |
| $15,000 to $24,999 | 1,066 | 2.2% |
| $25,000 to $34,999 | 1,211 | 2.5% |
| $35,000 to $49,999 | 3,246 | 6.7% |
| $50,000 to $74,999 | 6,686 | 13.8% |
| $75,000 to $99,999 | 8,430 | 17.4% |
| $100,000 to $149,999 | 12,887 | 26.6% |
| $150,000 to $199,999 | 7,412 | 15.3% |
| $200,000+ | 6,540 | 13.5% |
Family Income by Famaliy Size in Hendricks County
6-person families (969 | 2.0%) account for the highest median family income in Hendricks County with $148,248 per family, while 2-person families (21,118 | 43.6%) have the highest median income of $45,419 per family member.
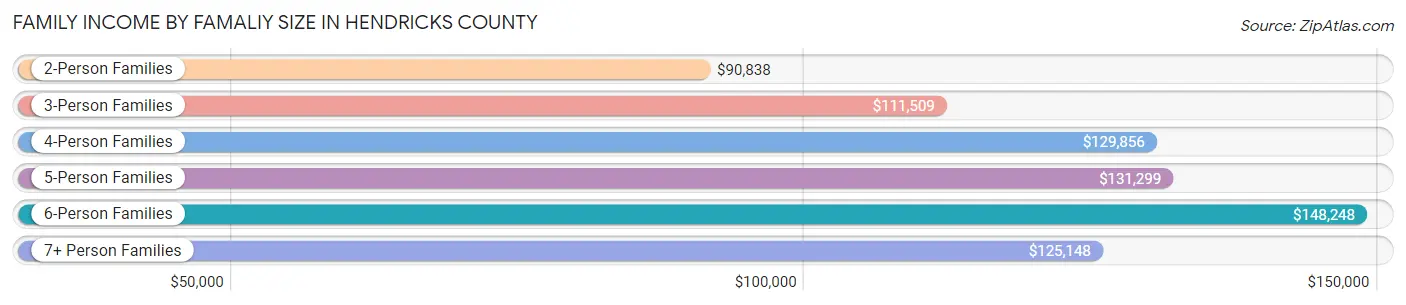
| Income Bracket | # Families | Median Income |
| 2-Person Families | 21,118 (43.6%) | $90,838 |
| 3-Person Families | 10,969 (22.6%) | $111,509 |
| 4-Person Families | 9,560 (19.7%) | $129,856 |
| 5-Person Families | 4,989 (10.3%) | $131,299 |
| 6-Person Families | 969 (2.0%) | $148,248 |
| 7+ Person Families | 841 (1.7%) | $125,148 |
| Total | 48,446 (100.0%) | $109,727 |
Family Income by Number of Earners in Hendricks County
The median family income in Hendricks County is $109,727, with families comprising 3+ earners (7,263) having the highest median family income of $152,917, while families with no earners (5,672) have the lowest median family income of $69,316, accounting for 15.0% and 11.7% of families, respectively.
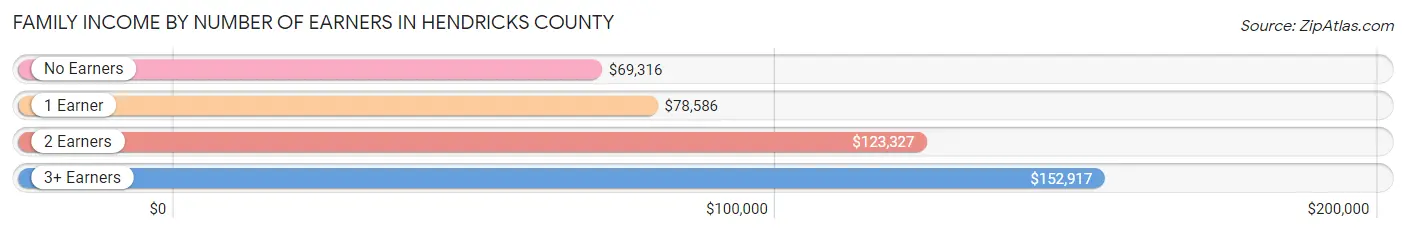
| Number of Earners | # Families | Median Income |
| No Earners | 5,672 (11.7%) | $69,316 |
| 1 Earner | 12,196 (25.2%) | $78,586 |
| 2 Earners | 23,315 (48.1%) | $123,327 |
| 3+ Earners | 7,263 (15.0%) | $152,917 |
| Total | 48,446 (100.0%) | $109,727 |
Household Income in Hendricks County
Household Income Brackets in Hendricks County
With 15,264 households falling in the category, the $100,000 to $149,999 income range is the most frequent in Hendricks County, accounting for 23.7% of all households. In contrast, only 837 households (1.3%) fall into the $10,000 to $14,999 income bracket, making it the least populous group.
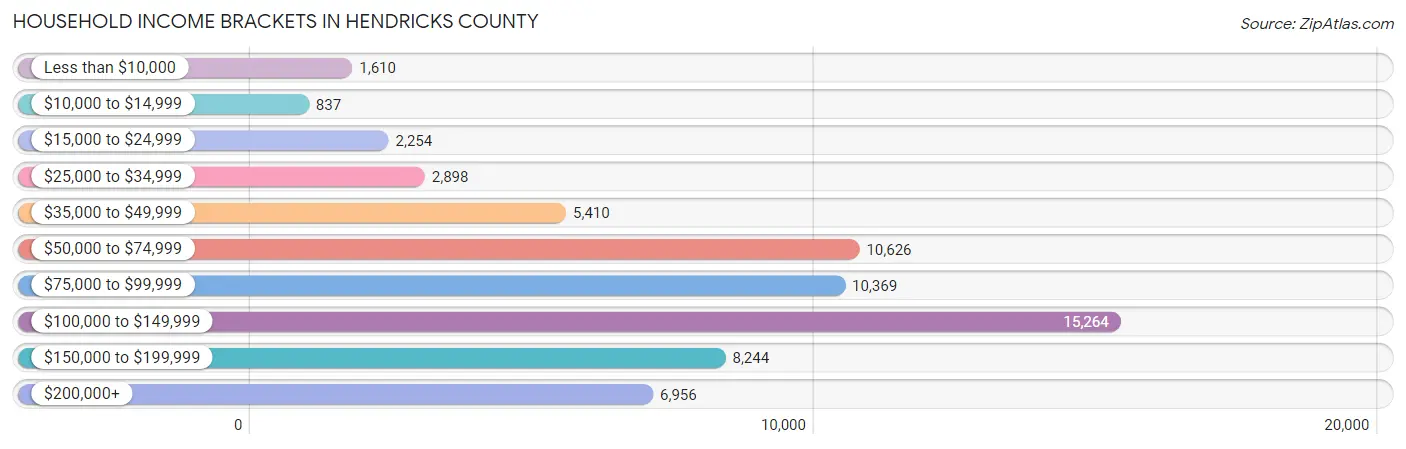
| Income Bracket | # Households | % Households |
| Less than $10,000 | 1,610 | 2.5% |
| $10,000 to $14,999 | 837 | 1.3% |
| $15,000 to $24,999 | 2,254 | 3.5% |
| $25,000 to $34,999 | 2,898 | 4.5% |
| $35,000 to $49,999 | 5,410 | 8.4% |
| $50,000 to $74,999 | 10,626 | 16.5% |
| $75,000 to $99,999 | 10,369 | 16.1% |
| $100,000 to $149,999 | 15,264 | 23.7% |
| $150,000 to $199,999 | 8,244 | 12.8% |
| $200,000+ | 6,956 | 10.8% |
Household Income by Householder Age in Hendricks County
The median household income in Hendricks County is $95,261, with the highest median household income of $120,956 found in the 45 to 64 years age bracket for the primary householder. A total of 24,281 households (37.7%) fall into this category. Meanwhile, the 65+ years age bracket for the primary householder has the lowest median household income of $64,714, with 14,849 households (23.1%) in this group.
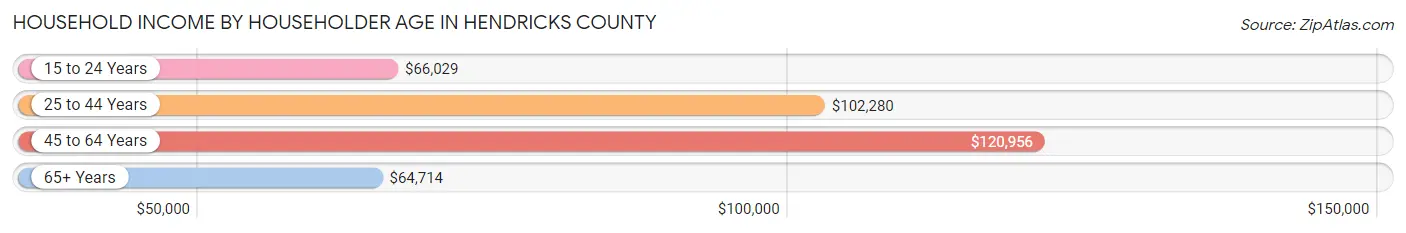
| Income Bracket | # Households | Median Income |
| 15 to 24 Years | 2,158 (3.4%) | $66,029 |
| 25 to 44 Years | 23,115 (35.9%) | $102,280 |
| 45 to 64 Years | 24,281 (37.7%) | $120,956 |
| 65+ Years | 14,849 (23.1%) | $64,714 |
| Total | 64,403 (100.0%) | $95,261 |
Poverty in Hendricks County
Income Below Poverty by Sex and Age in Hendricks County
With 5.0% poverty level for males and 5.5% for females among the residents of Hendricks County, 5 year old males and 25 to 34 year old females are the most vulnerable to poverty, with 106 males (10.5%) and 1,077 females (10.2%) in their respective age groups living below the poverty level.
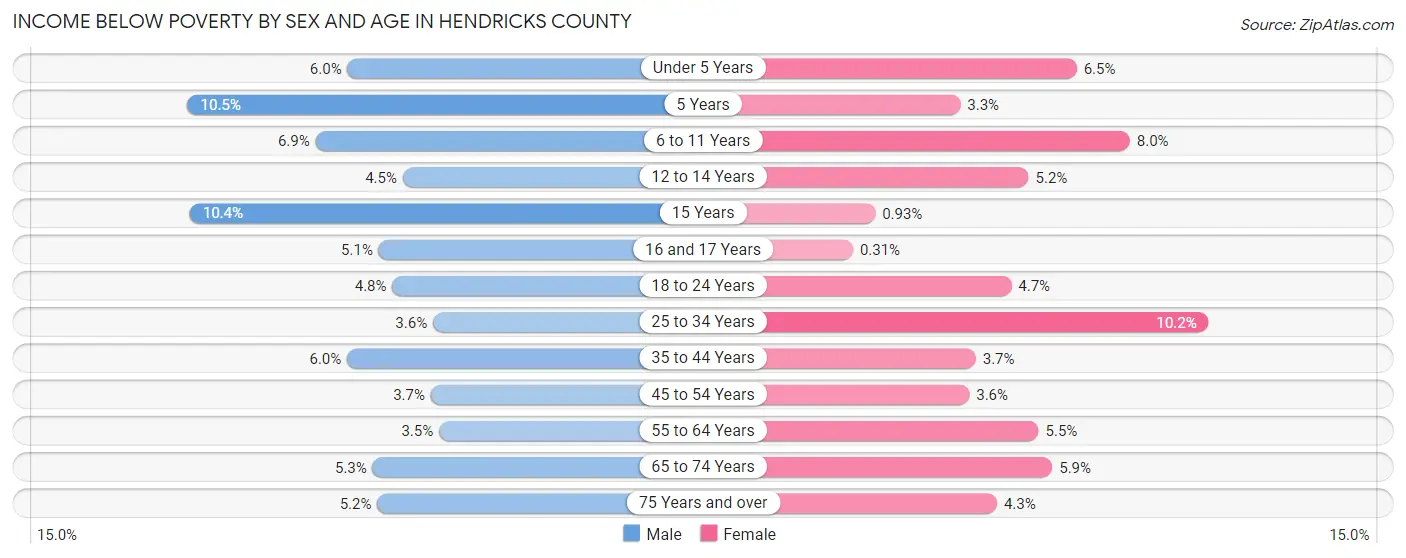
| Age Bracket | Male | Female |
| Under 5 Years | 280 (6.0%) | 316 (6.5%) |
| 5 Years | 106 (10.5%) | 39 (3.3%) |
| 6 to 11 Years | 494 (6.9%) | 576 (8.0%) |
| 12 to 14 Years | 204 (4.5%) | 188 (5.2%) |
| 15 Years | 175 (10.4%) | 11 (0.9%) |
| 16 and 17 Years | 137 (5.1%) | 8 (0.3%) |
| 18 to 24 Years | 356 (4.8%) | 320 (4.7%) |
| 25 to 34 Years | 384 (3.6%) | 1,077 (10.2%) |
| 35 to 44 Years | 742 (6.0%) | 467 (3.7%) |
| 45 to 54 Years | 433 (3.7%) | 416 (3.5%) |
| 55 to 64 Years | 366 (3.5%) | 590 (5.5%) |
| 65 to 74 Years | 375 (5.3%) | 474 (5.9%) |
| 75 Years and over | 194 (5.2%) | 240 (4.3%) |
| Total | 4,246 (5.0%) | 4,722 (5.5%) |
Income Above Poverty by Sex and Age in Hendricks County
According to the poverty statistics in Hendricks County, males aged 55 to 64 years and females aged 16 and 17 years are the age groups that are most secure financially, with 96.5% of males and 99.7% of females in these age groups living above the poverty line.
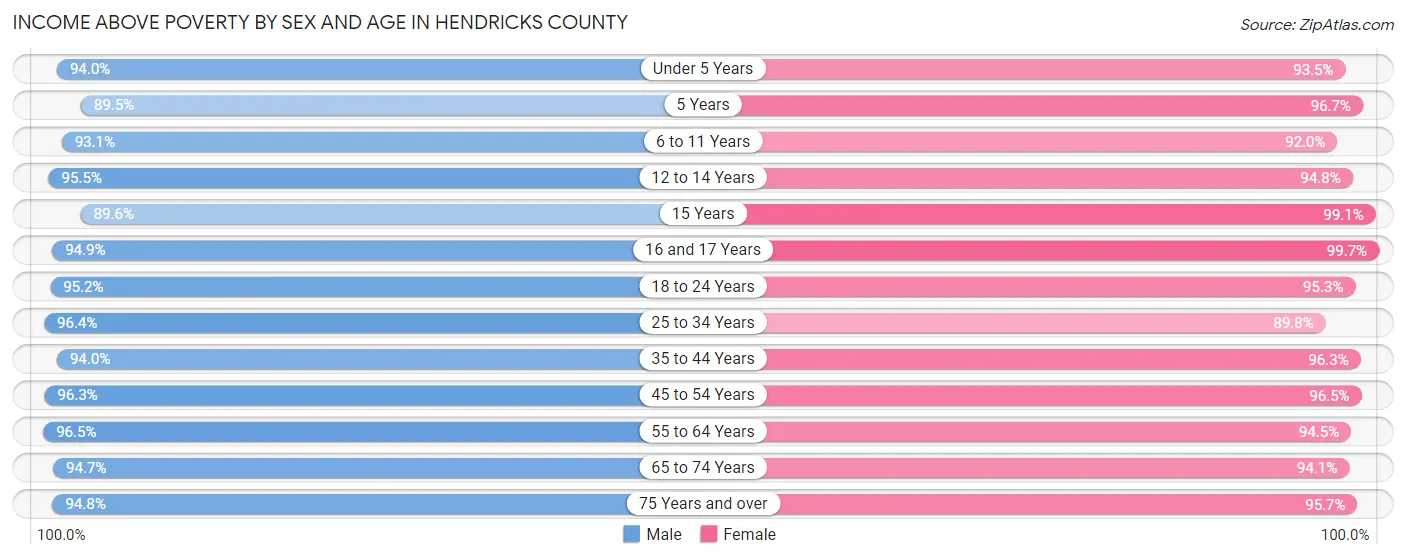
| Age Bracket | Male | Female |
| Under 5 Years | 4,379 (94.0%) | 4,516 (93.5%) |
| 5 Years | 907 (89.5%) | 1,143 (96.7%) |
| 6 to 11 Years | 6,668 (93.1%) | 6,610 (92.0%) |
| 12 to 14 Years | 4,358 (95.5%) | 3,426 (94.8%) |
| 15 Years | 1,508 (89.6%) | 1,178 (99.1%) |
| 16 and 17 Years | 2,528 (94.9%) | 2,575 (99.7%) |
| 18 to 24 Years | 7,119 (95.2%) | 6,459 (95.3%) |
| 25 to 34 Years | 10,189 (96.4%) | 9,472 (89.8%) |
| 35 to 44 Years | 11,575 (94.0%) | 12,053 (96.3%) |
| 45 to 54 Years | 11,297 (96.3%) | 11,289 (96.5%) |
| 55 to 64 Years | 10,206 (96.5%) | 10,169 (94.5%) |
| 65 to 74 Years | 6,685 (94.7%) | 7,612 (94.1%) |
| 75 Years and over | 3,553 (94.8%) | 5,320 (95.7%) |
| Total | 80,972 (95.0%) | 81,822 (94.5%) |
Income Below Poverty Among Married-Couple Families in Hendricks County
The poverty statistics for married-couple families in Hendricks County show that 2.3% or 917 of the total 39,230 families live below the poverty line. Families with 3 or 4 children have the highest poverty rate of 5.1%, comprising of 216 families. On the other hand, families with 5 or more children have the lowest poverty rate of 0.8%, which includes 4 families.
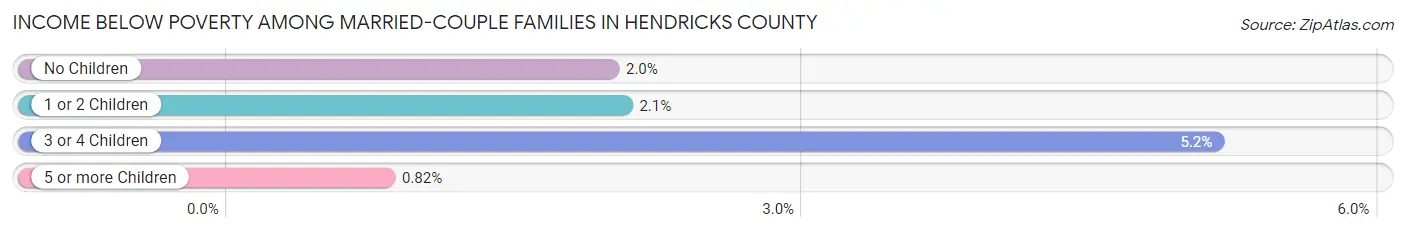
| Children | Above Poverty | Below Poverty |
| No Children | 20,242 (98.0%) | 411 (2.0%) |
| 1 or 2 Children | 13,613 (97.9%) | 286 (2.1%) |
| 3 or 4 Children | 3,977 (94.9%) | 216 (5.1%) |
| 5 or more Children | 481 (99.2%) | 4 (0.8%) |
| Total | 38,313 (97.7%) | 917 (2.3%) |
Income Below Poverty Among Single-Parent Households in Hendricks County
According to the poverty data in Hendricks County, 5.1% or 176 single-father households and 15.6% or 907 single-mother households are living below the poverty line. Among single-father households, those with 3 or 4 children have the highest poverty rate, with 126 households (48.8%) experiencing poverty. Likewise, among single-mother households, those with 3 or 4 children have the highest poverty rate, with 220 households (43.7%) falling below the poverty line.

| Children | Single Father | Single Mother |
| No Children | 18 (1.2%) | 119 (5.6%) |
| 1 or 2 Children | 32 (2.0%) | 563 (17.9%) |
| 3 or 4 Children | 126 (48.8%) | 220 (43.7%) |
| 5 or more Children | 0 (0.0%) | 5 (29.4%) |
| Total | 176 (5.1%) | 907 (15.6%) |
Income Below Poverty Among Married-Couple vs Single-Parent Households in Hendricks County
The poverty data for Hendricks County shows that 917 of the married-couple family households (2.3%) and 1,083 of the single-parent households (11.7%) are living below the poverty level. Within the married-couple family households, those with 3 or 4 children have the highest poverty rate, with 216 households (5.1%) falling below the poverty line. Among the single-parent households, those with 3 or 4 children have the highest poverty rate, with 346 household (45.5%) living below poverty.
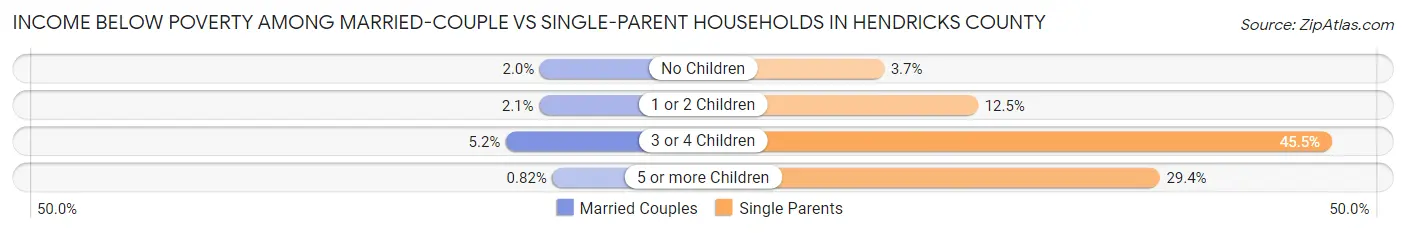
| Children | Married-Couple Families | Single-Parent Households |
| No Children | 411 (2.0%) | 137 (3.7%) |
| 1 or 2 Children | 286 (2.1%) | 595 (12.5%) |
| 3 or 4 Children | 216 (5.1%) | 346 (45.5%) |
| 5 or more Children | 4 (0.8%) | 5 (29.4%) |
| Total | 917 (2.3%) | 1,083 (11.7%) |
Employment Characteristics in Hendricks County
Employment by Class of Employer in Hendricks County
Among the 91,969 employed individuals in Hendricks County, private company employees (63,952 | 69.5%), not-for-profit organizations (9,355 | 10.2%), and local government employees (6,741 | 7.3%) make up the most common classes of employment.
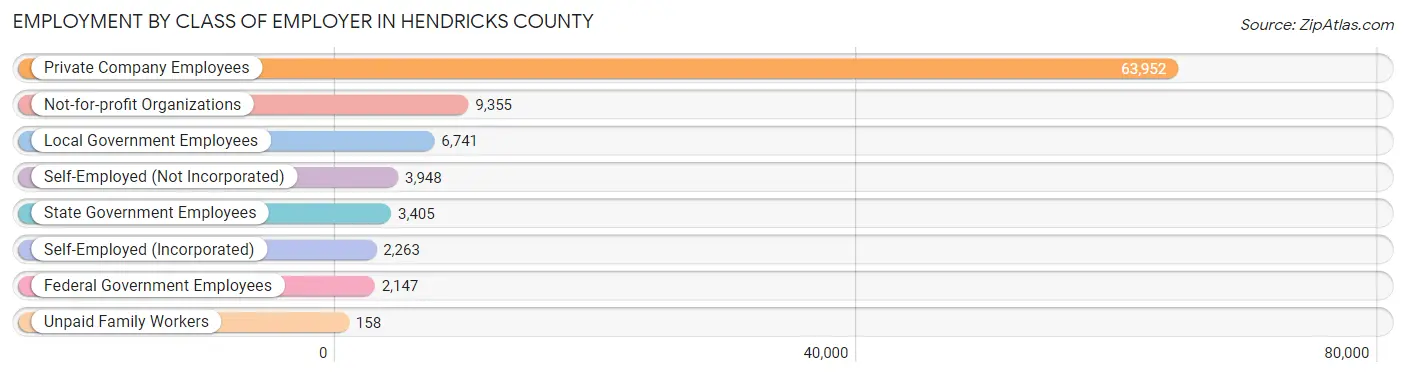
| Employer Class | # Employees | % Employees |
| Private Company Employees | 63,952 | 69.5% |
| Self-Employed (Incorporated) | 2,263 | 2.5% |
| Self-Employed (Not Incorporated) | 3,948 | 4.3% |
| Not-for-profit Organizations | 9,355 | 10.2% |
| Local Government Employees | 6,741 | 7.3% |
| State Government Employees | 3,405 | 3.7% |
| Federal Government Employees | 2,147 | 2.3% |
| Unpaid Family Workers | 158 | 0.2% |
| Total | 91,969 | 100.0% |
Employment Status by Age in Hendricks County
According to the labor force statistics for Hendricks County, out of the total population over 16 years of age (137,798), 69.8% or 96,183 individuals are in the labor force, with 2.4% or 2,308 of them unemployed. The age group with the highest labor force participation rate is 45 to 54 years, with 89.2% or 21,326 individuals in the labor force. Within the labor force, the 20 to 24 years age range has the highest percentage of unemployed individuals, with 6.7% or 588 of them being unemployed.
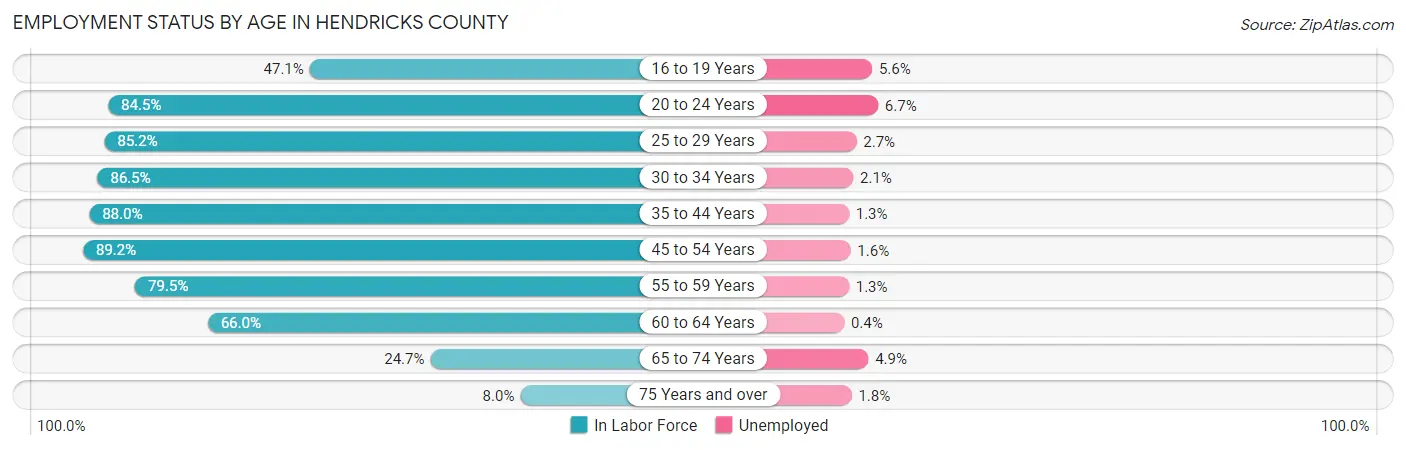
| Age Bracket | In Labor Force | Unemployed |
| 16 to 19 Years | 4,416 (47.1%) | 247 (5.6%) |
| 20 to 24 Years | 8,781 (84.5%) | 588 (6.7%) |
| 25 to 29 Years | 8,838 (85.2%) | 239 (2.7%) |
| 30 to 34 Years | 9,775 (86.5%) | 205 (2.1%) |
| 35 to 44 Years | 22,495 (88.0%) | 292 (1.3%) |
| 45 to 54 Years | 21,326 (89.2%) | 341 (1.6%) |
| 55 to 59 Years | 9,418 (79.5%) | 122 (1.3%) |
| 60 to 64 Years | 6,452 (66.0%) | 26 (0.4%) |
| 65 to 74 Years | 3,804 (24.7%) | 186 (4.9%) |
| 75 Years and over | 789 (8.0%) | 14 (1.8%) |
| Total | 96,183 (69.8%) | 2,308 (2.4%) |
Employment Status by Educational Attainment in Hendricks County
According to labor force statistics for Hendricks County, 84.4% of individuals (78,294) out of the total population between 25 and 64 years of age (92,765) are in the labor force, with 1.6% or 1,253 of them being unemployed. The group with the highest labor force participation rate are those with the educational attainment of bachelor's degree or higher, with 90.0% or 35,214 individuals in the labor force. Within the labor force, individuals with less than high school education have the highest percentage of unemployment, with 2.6% or 112 of them being unemployed.
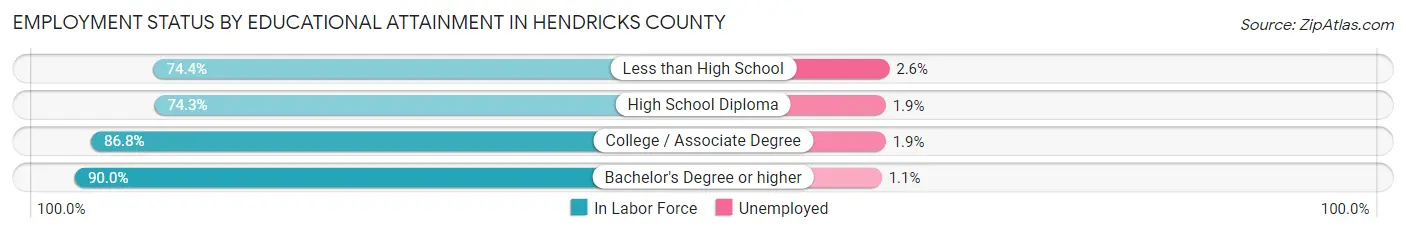
| Educational Attainment | In Labor Force | Unemployed |
| Less than High School | 4,314 (74.4%) | 151 (2.6%) |
| High School Diploma | 16,319 (74.3%) | 417 (1.9%) |
| College / Associate Degree | 22,460 (86.8%) | 492 (1.9%) |
| Bachelor's Degree or higher | 35,214 (90.0%) | 430 (1.1%) |
| Total | 78,294 (84.4%) | 1,484 (1.6%) |
Employment Occupations by Sex in Hendricks County
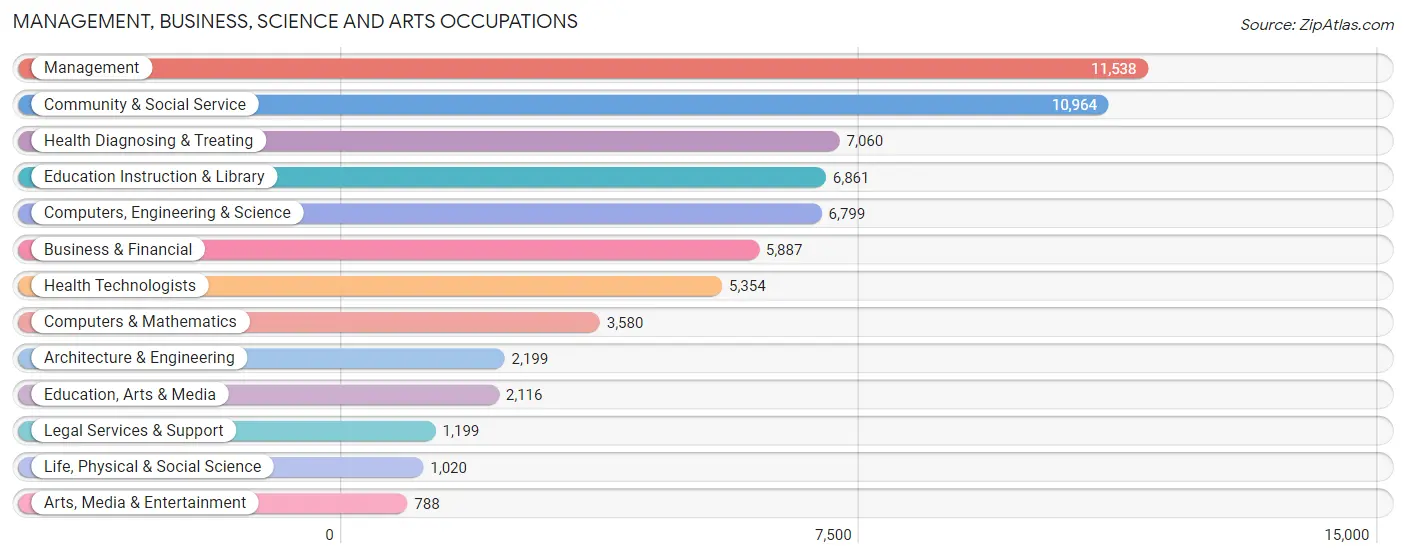
Management, Business, Science and Arts Occupations
The most common Management, Business, Science and Arts occupations in Hendricks County are Management (11,538 | 12.3%), Community & Social Service (10,964 | 11.7%), Health Diagnosing & Treating (7,060 | 7.5%), Education Instruction & Library (6,861 | 7.3%), and Computers, Engineering & Science (6,799 | 7.3%).
Management, Business, Science and Arts Occupations by Sex
Within the Management, Business, Science and Arts occupations in Hendricks County, the most male-oriented occupations are Architecture & Engineering (82.1%), Computers, Engineering & Science (71.2%), and Computers & Mathematics (66.5%), while the most female-oriented occupations are Education Instruction & Library (80.6%), Health Diagnosing & Treating (79.1%), and Education, Arts & Media (77.3%).
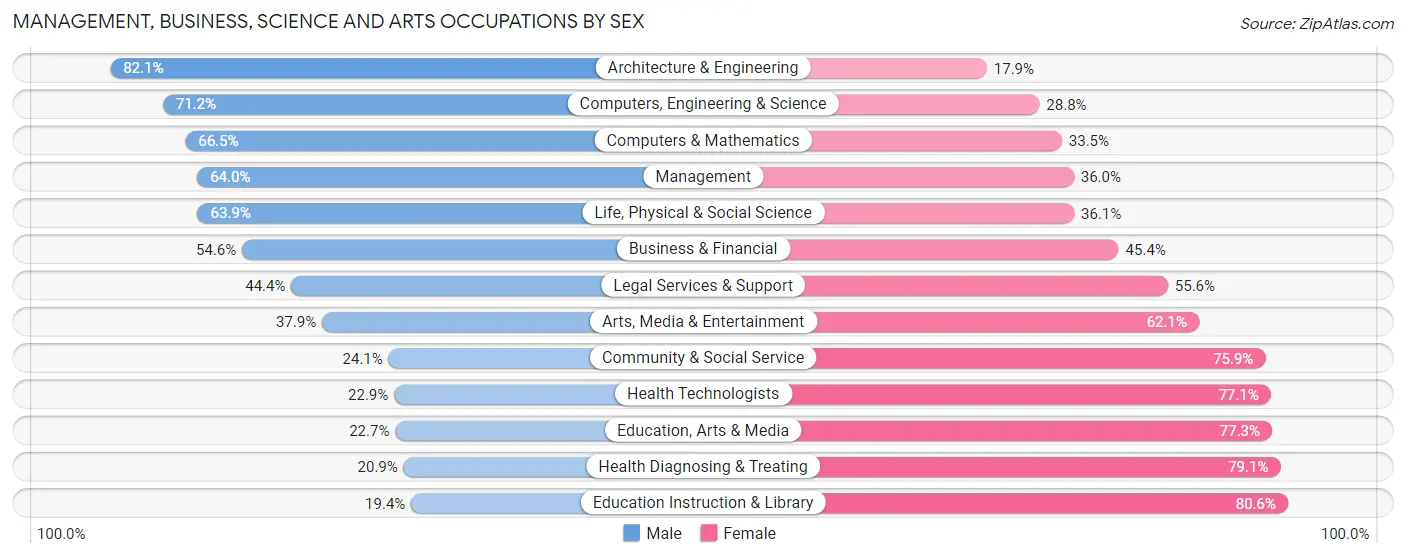
| Occupation | Male | Female |
| Management | 7,383 (64.0%) | 4,155 (36.0%) |
| Business & Financial | 3,216 (54.6%) | 2,671 (45.4%) |
| Computers, Engineering & Science | 4,838 (71.2%) | 1,961 (28.8%) |
| Computers & Mathematics | 2,380 (66.5%) | 1,200 (33.5%) |
| Architecture & Engineering | 1,806 (82.1%) | 393 (17.9%) |
| Life, Physical & Social Science | 652 (63.9%) | 368 (36.1%) |
| Community & Social Service | 2,639 (24.1%) | 8,325 (75.9%) |
| Education, Arts & Media | 480 (22.7%) | 1,636 (77.3%) |
| Legal Services & Support | 532 (44.4%) | 667 (55.6%) |
| Education Instruction & Library | 1,328 (19.4%) | 5,533 (80.6%) |
| Arts, Media & Entertainment | 299 (37.9%) | 489 (62.1%) |
| Health Diagnosing & Treating | 1,478 (20.9%) | 5,582 (79.1%) |
| Health Technologists | 1,227 (22.9%) | 4,127 (77.1%) |
| Total (Category) | 19,554 (46.3%) | 22,694 (53.7%) |
| Total (Overall) | 49,208 (52.5%) | 44,503 (47.5%) |
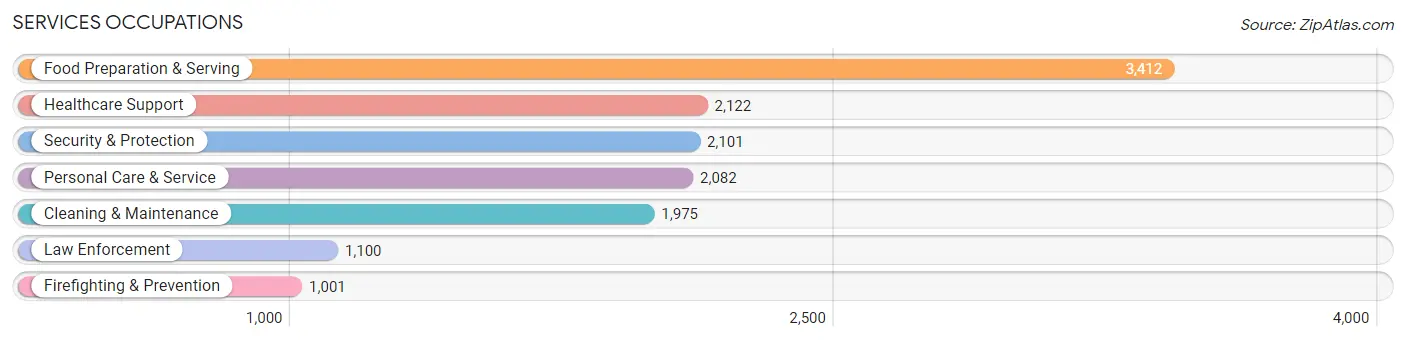
Services Occupations
The most common Services occupations in Hendricks County are Food Preparation & Serving (3,412 | 3.6%), Healthcare Support (2,122 | 2.3%), Security & Protection (2,101 | 2.2%), Personal Care & Service (2,082 | 2.2%), and Cleaning & Maintenance (1,975 | 2.1%).
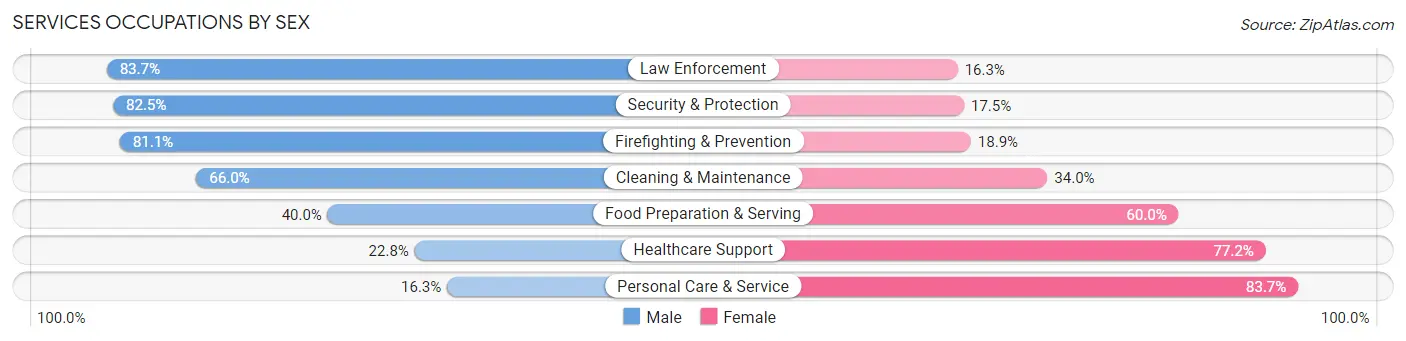
Services Occupations by Sex
Within the Services occupations in Hendricks County, the most male-oriented occupations are Law Enforcement (83.7%), Security & Protection (82.5%), and Firefighting & Prevention (81.1%), while the most female-oriented occupations are Personal Care & Service (83.7%), Healthcare Support (77.2%), and Food Preparation & Serving (60.0%).
| Occupation | Male | Female |
| Healthcare Support | 483 (22.8%) | 1,639 (77.2%) |
| Security & Protection | 1,733 (82.5%) | 368 (17.5%) |
| Firefighting & Prevention | 812 (81.1%) | 189 (18.9%) |
| Law Enforcement | 921 (83.7%) | 179 (16.3%) |
| Food Preparation & Serving | 1,364 (40.0%) | 2,048 (60.0%) |
| Cleaning & Maintenance | 1,303 (66.0%) | 672 (34.0%) |
| Personal Care & Service | 340 (16.3%) | 1,742 (83.7%) |
| Total (Category) | 5,223 (44.7%) | 6,469 (55.3%) |
| Total (Overall) | 49,208 (52.5%) | 44,503 (47.5%) |
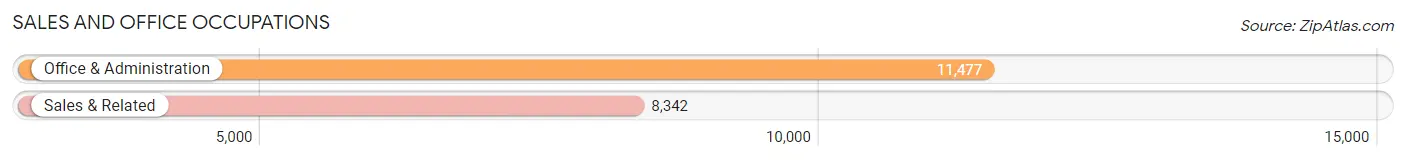
Sales and Office Occupations
The most common Sales and Office occupations in Hendricks County are Office & Administration (11,477 | 12.2%), and Sales & Related (8,342 | 8.9%).
Sales and Office Occupations by Sex
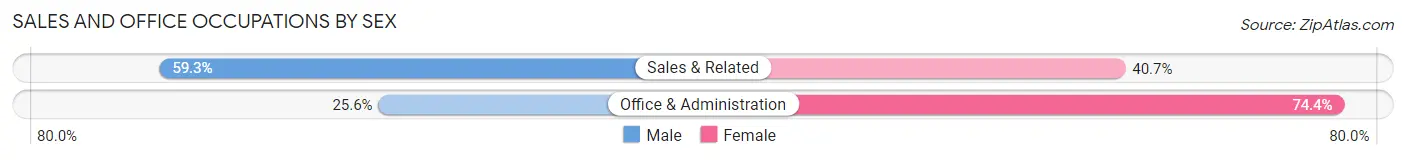
| Occupation | Male | Female |
| Sales & Related | 4,944 (59.3%) | 3,398 (40.7%) |
| Office & Administration | 2,934 (25.6%) | 8,543 (74.4%) |
| Total (Category) | 7,878 (39.8%) | 11,941 (60.3%) |
| Total (Overall) | 49,208 (52.5%) | 44,503 (47.5%) |
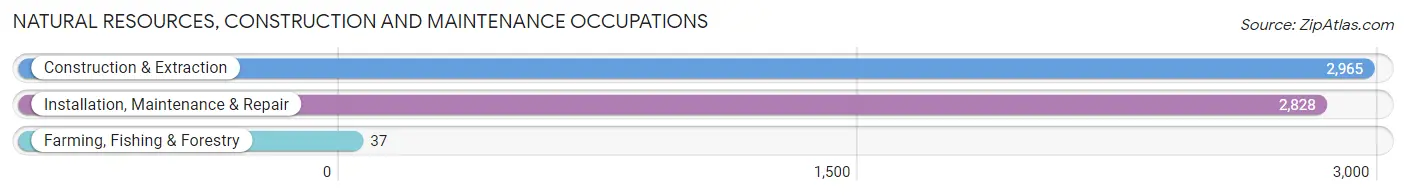
Natural Resources, Construction and Maintenance Occupations
The most common Natural Resources, Construction and Maintenance occupations in Hendricks County are Construction & Extraction (2,965 | 3.2%), Installation, Maintenance & Repair (2,828 | 3.0%), and Farming, Fishing & Forestry (37 | 0.0%).
Natural Resources, Construction and Maintenance Occupations by Sex
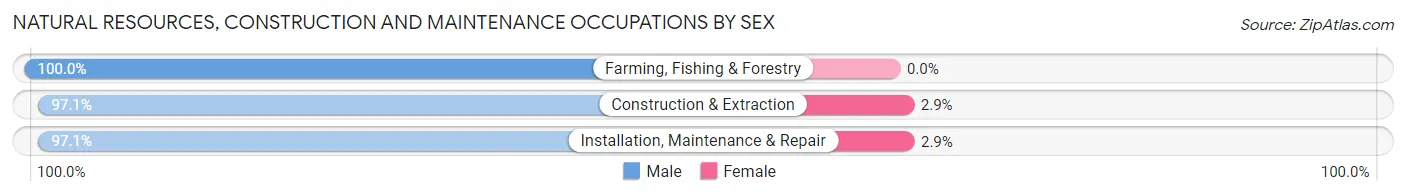
| Occupation | Male | Female |
| Farming, Fishing & Forestry | 37 (100.0%) | 0 (0.0%) |
| Construction & Extraction | 2,879 (97.1%) | 86 (2.9%) |
| Installation, Maintenance & Repair | 2,745 (97.1%) | 83 (2.9%) |
| Total (Category) | 5,661 (97.1%) | 169 (2.9%) |
| Total (Overall) | 49,208 (52.5%) | 44,503 (47.5%) |
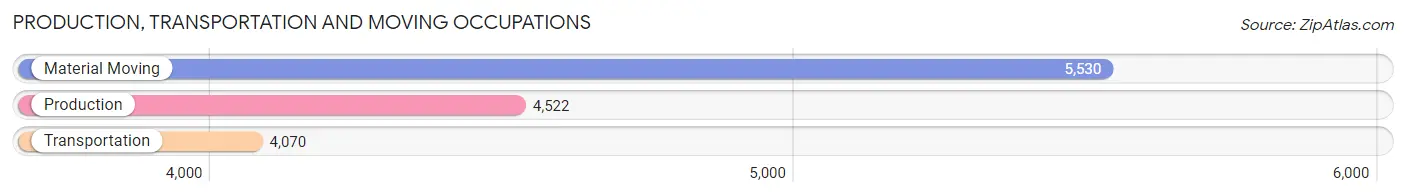
Production, Transportation and Moving Occupations
The most common Production, Transportation and Moving occupations in Hendricks County are Material Moving (5,530 | 5.9%), Production (4,522 | 4.8%), and Transportation (4,070 | 4.3%).
Production, Transportation and Moving Occupations by Sex
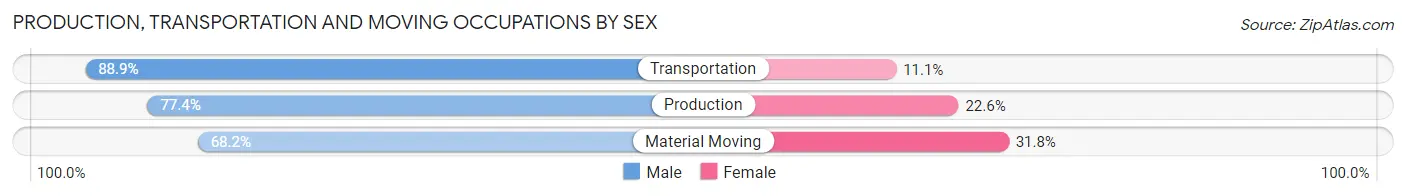
| Occupation | Male | Female |
| Production | 3,502 (77.4%) | 1,020 (22.6%) |
| Transportation | 3,617 (88.9%) | 453 (11.1%) |
| Material Moving | 3,773 (68.2%) | 1,757 (31.8%) |
| Total (Category) | 10,892 (77.1%) | 3,230 (22.9%) |
| Total (Overall) | 49,208 (52.5%) | 44,503 (47.5%) |
Employment Industries by Sex in Hendricks County
Employment Industries in Hendricks County
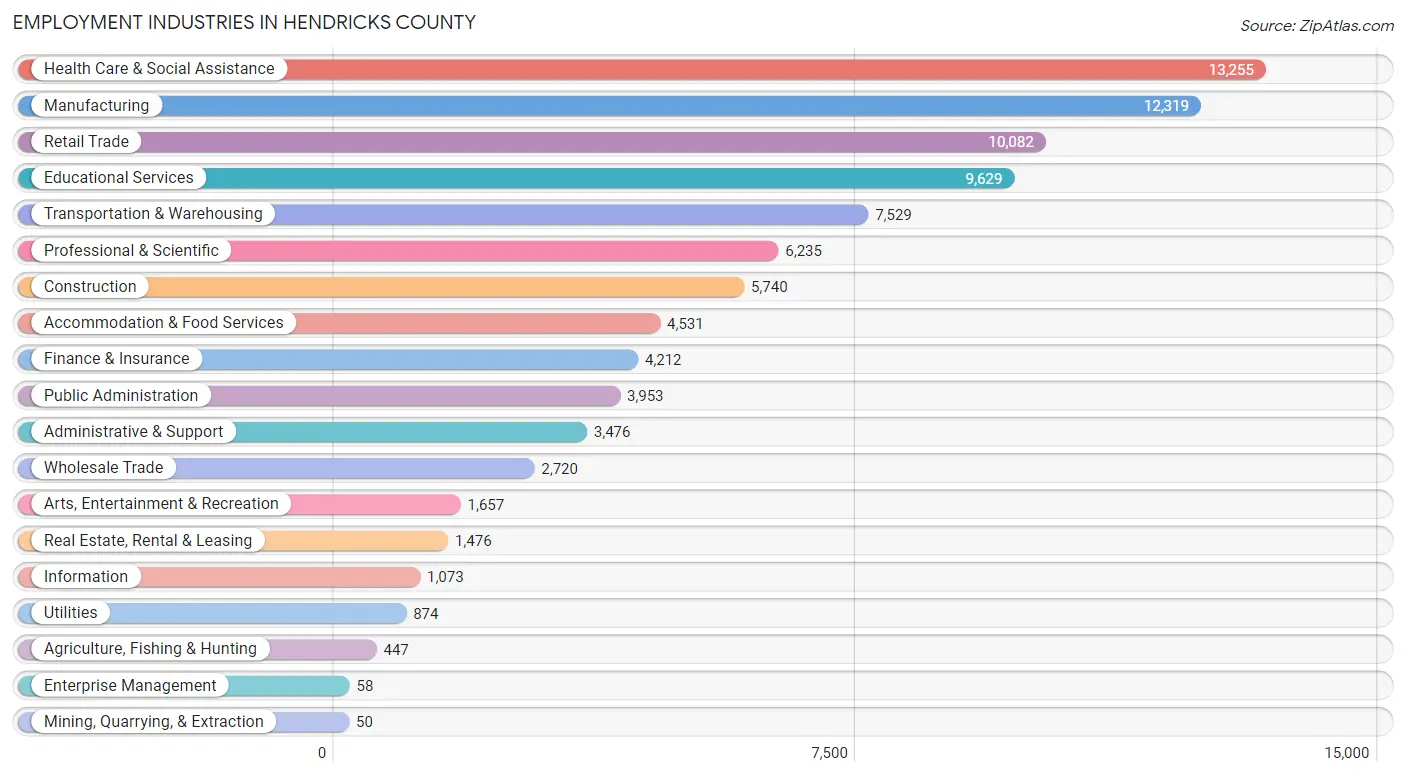
The major employment industries in Hendricks County include Health Care & Social Assistance (13,255 | 14.1%), Manufacturing (12,319 | 13.2%), Retail Trade (10,082 | 10.8%), Educational Services (9,629 | 10.3%), and Transportation & Warehousing (7,529 | 8.0%).
Employment Industries by Sex in Hendricks County
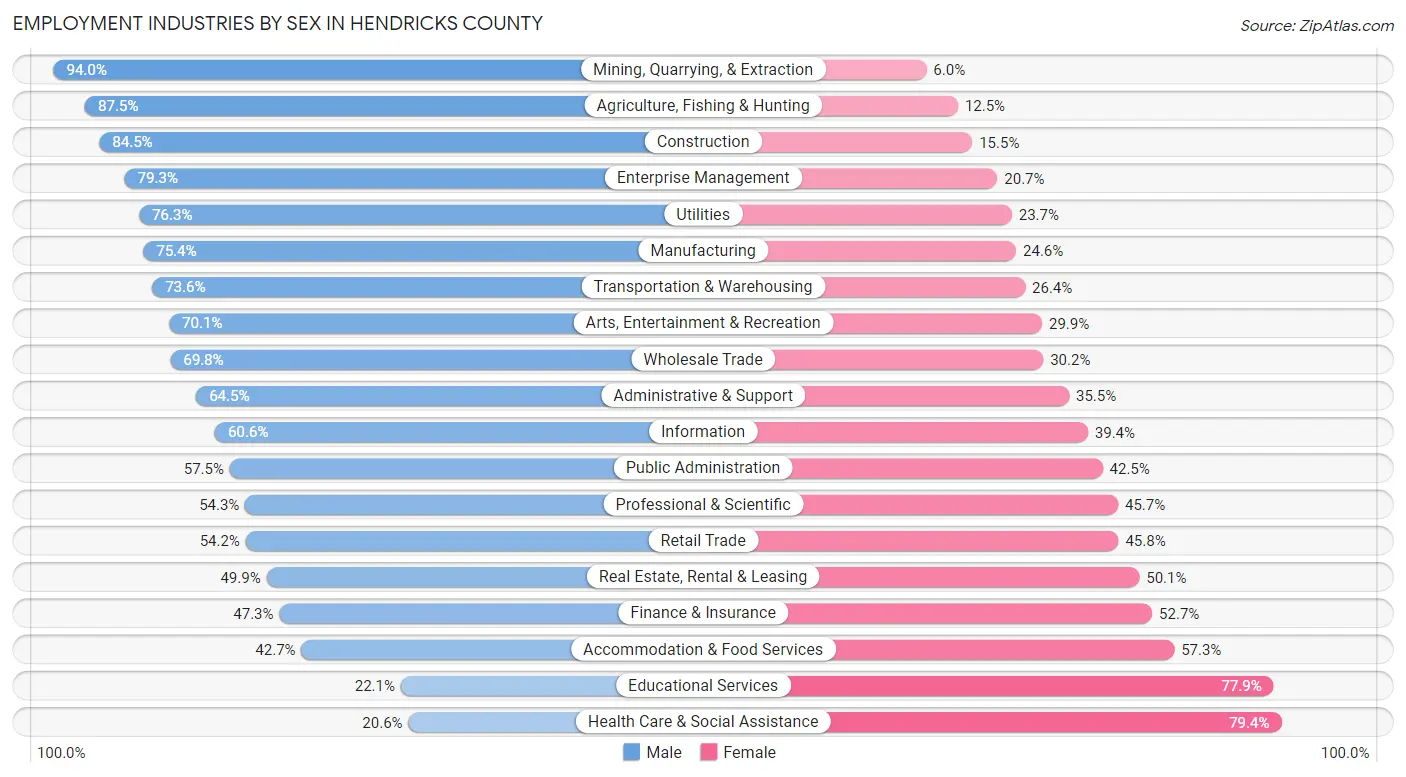
The Hendricks County industries that see more men than women are Mining, Quarrying, & Extraction (94.0%), Agriculture, Fishing & Hunting (87.5%), and Construction (84.5%), whereas the industries that tend to have a higher number of women are Health Care & Social Assistance (79.4%), Educational Services (77.9%), and Accommodation & Food Services (57.3%).
| Industry | Male | Female |
| Agriculture, Fishing & Hunting | 391 (87.5%) | 56 (12.5%) |
| Mining, Quarrying, & Extraction | 47 (94.0%) | 3 (6.0%) |
| Construction | 4,851 (84.5%) | 889 (15.5%) |
| Manufacturing | 9,292 (75.4%) | 3,027 (24.6%) |
| Wholesale Trade | 1,899 (69.8%) | 821 (30.2%) |
| Retail Trade | 5,468 (54.2%) | 4,614 (45.8%) |
| Transportation & Warehousing | 5,539 (73.6%) | 1,990 (26.4%) |
| Utilities | 667 (76.3%) | 207 (23.7%) |
| Information | 650 (60.6%) | 423 (39.4%) |
| Finance & Insurance | 1,991 (47.3%) | 2,221 (52.7%) |
| Real Estate, Rental & Leasing | 737 (49.9%) | 739 (50.1%) |
| Professional & Scientific | 3,388 (54.3%) | 2,847 (45.7%) |
| Enterprise Management | 46 (79.3%) | 12 (20.7%) |
| Administrative & Support | 2,241 (64.5%) | 1,235 (35.5%) |
| Educational Services | 2,132 (22.1%) | 7,497 (77.9%) |
| Health Care & Social Assistance | 2,725 (20.6%) | 10,530 (79.4%) |
| Arts, Entertainment & Recreation | 1,161 (70.1%) | 496 (29.9%) |
| Accommodation & Food Services | 1,935 (42.7%) | 2,596 (57.3%) |
| Public Administration | 2,274 (57.5%) | 1,679 (42.5%) |
| Total | 49,208 (52.5%) | 44,503 (47.5%) |
Education in Hendricks County
School Enrollment in Hendricks County
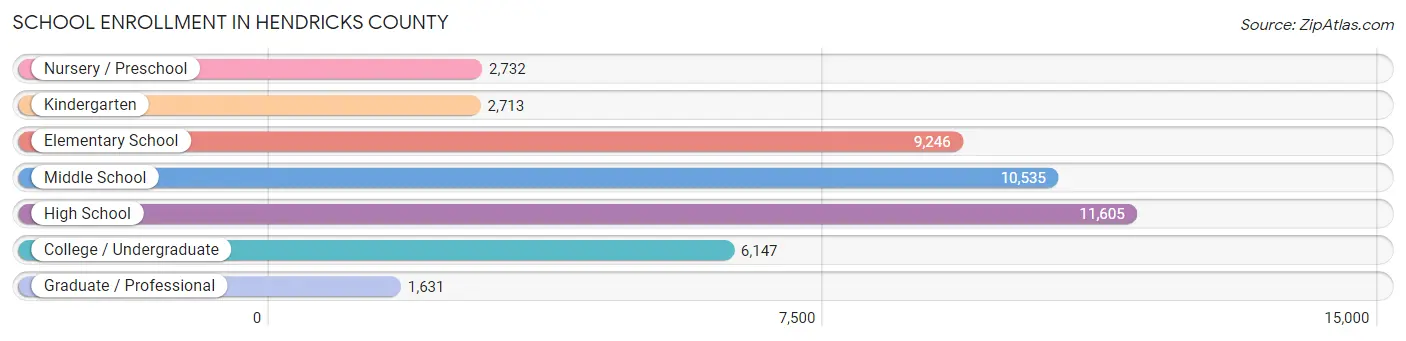
The most common levels of schooling among the 44,609 students in Hendricks County are high school (11,605 | 26.0%), middle school (10,535 | 23.6%), and elementary school (9,246 | 20.7%).
| School Level | # Students | % Students |
| Nursery / Preschool | 2,732 | 6.1% |
| Kindergarten | 2,713 | 6.1% |
| Elementary School | 9,246 | 20.7% |
| Middle School | 10,535 | 23.6% |
| High School | 11,605 | 26.0% |
| College / Undergraduate | 6,147 | 13.8% |
| Graduate / Professional | 1,631 | 3.7% |
| Total | 44,609 | 100.0% |
School Enrollment by Age by Funding Source in Hendricks County
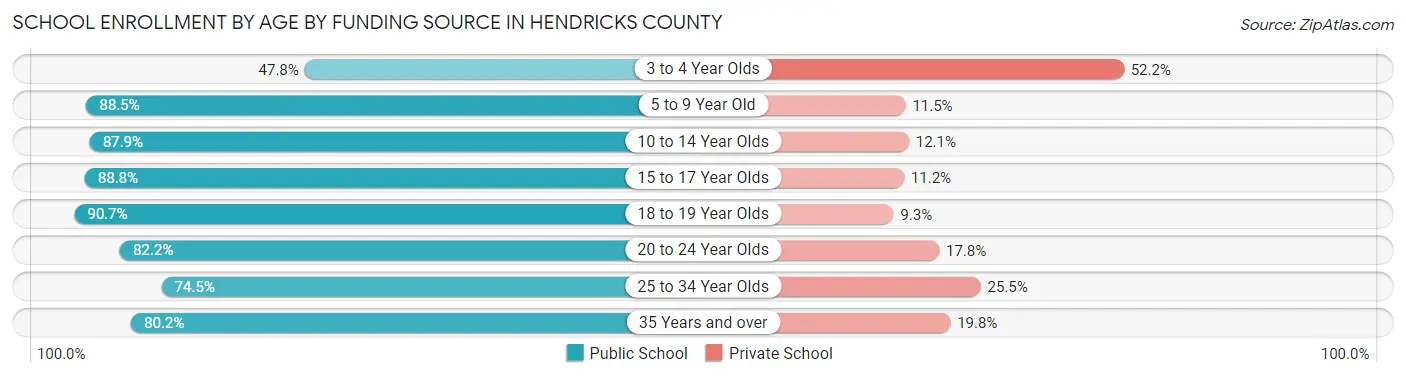
Out of a total of 44,609 students who are enrolled in schools in Hendricks County, 6,647 (14.9%) attend a private institution, while the remaining 37,962 (85.1%) are enrolled in public schools. The age group of 3 to 4 year olds has the highest likelihood of being enrolled in private schools, with 1,172 (52.2% in the age bracket) enrolled. Conversely, the age group of 18 to 19 year olds has the lowest likelihood of being enrolled in a private school, with 2,881 (90.7% in the age bracket) attending a public institution.
| Age Bracket | Public School | Private School |
| 3 to 4 Year Olds | 1,075 (47.8%) | 1,172 (52.2%) |
| 5 to 9 Year Old | 10,170 (88.5%) | 1,323 (11.5%) |
| 10 to 14 Year Olds | 11,232 (87.9%) | 1,550 (12.1%) |
| 15 to 17 Year Olds | 7,078 (88.8%) | 895 (11.2%) |
| 18 to 19 Year Olds | 2,881 (90.7%) | 294 (9.3%) |
| 20 to 24 Year Olds | 2,564 (82.2%) | 554 (17.8%) |
| 25 to 34 Year Olds | 1,157 (74.5%) | 396 (25.5%) |
| 35 Years and over | 1,818 (80.2%) | 450 (19.8%) |
| Total | 37,962 (85.1%) | 6,647 (14.9%) |
Educational Attainment by Field of Study in Hendricks County
Business (10,628 | 21.3%), education (7,337 | 14.7%), science & technology (6,850 | 13.7%), engineering (3,896 | 7.8%), and arts & humanities (3,786 | 7.6%) are the most common fields of study among 49,950 individuals in Hendricks County who have obtained a bachelor's degree or higher.
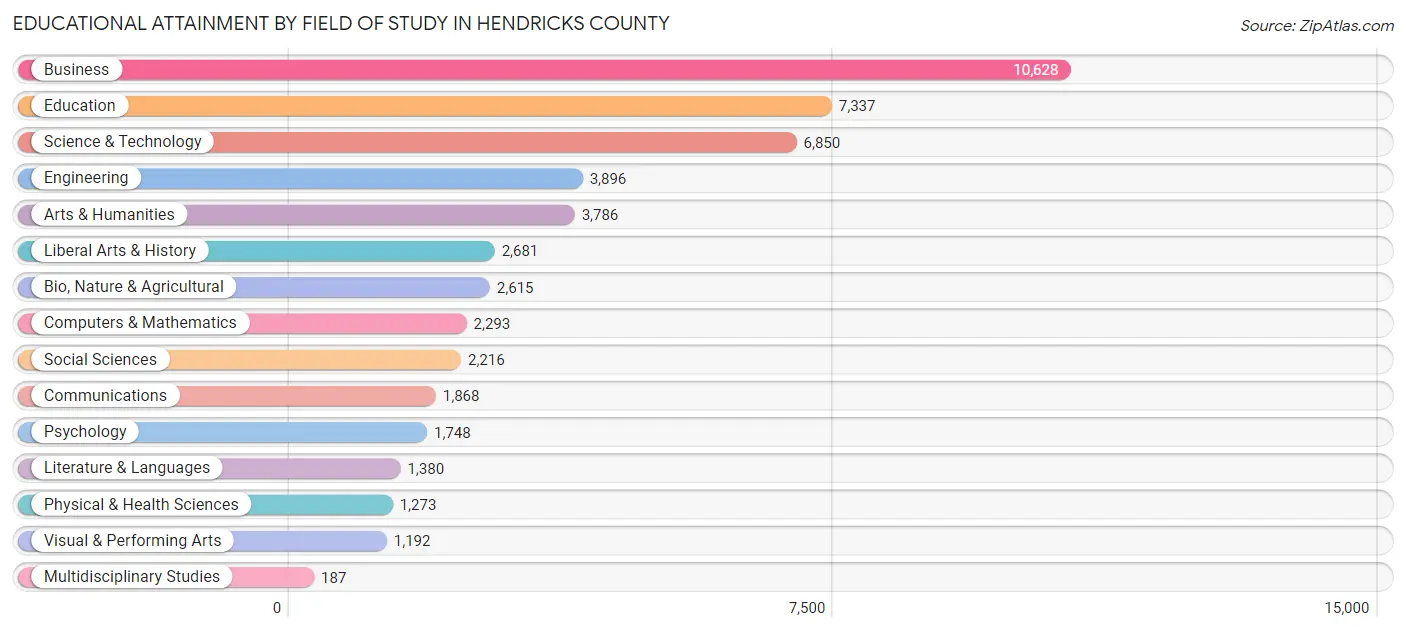
| Field of Study | # Graduates | % Graduates |
| Computers & Mathematics | 2,293 | 4.6% |
| Bio, Nature & Agricultural | 2,615 | 5.2% |
| Physical & Health Sciences | 1,273 | 2.5% |
| Psychology | 1,748 | 3.5% |
| Social Sciences | 2,216 | 4.4% |
| Engineering | 3,896 | 7.8% |
| Multidisciplinary Studies | 187 | 0.4% |
| Science & Technology | 6,850 | 13.7% |
| Business | 10,628 | 21.3% |
| Education | 7,337 | 14.7% |
| Literature & Languages | 1,380 | 2.8% |
| Liberal Arts & History | 2,681 | 5.4% |
| Visual & Performing Arts | 1,192 | 2.4% |
| Communications | 1,868 | 3.7% |
| Arts & Humanities | 3,786 | 7.6% |
| Total | 49,950 | 100.0% |
Transportation & Commute in Hendricks County
Vehicle Availability by Sex in Hendricks County
The most prevalent vehicle ownership categories in Hendricks County are males with 2 vehicles (22,529, accounting for 46.4%) and females with 2 vehicles (19,919, making up 51.9%).
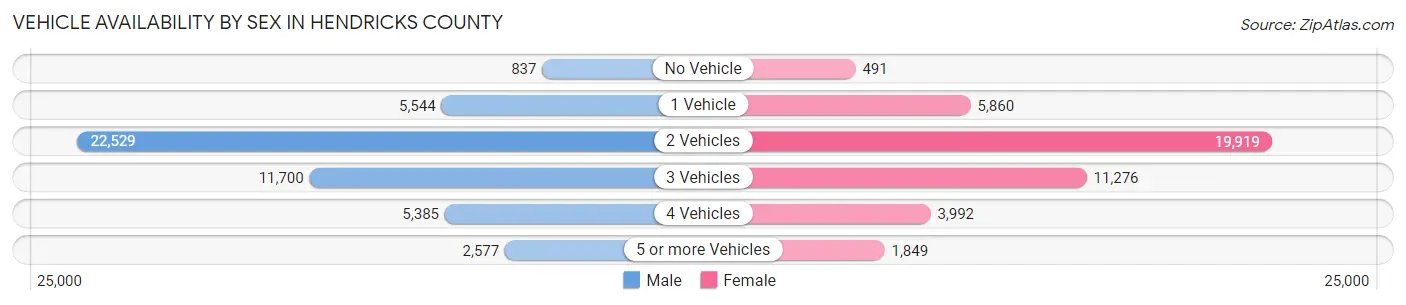
| Vehicles Available | Male | Female |
| No Vehicle | 837 (1.7%) | 491 (1.1%) |
| 1 Vehicle | 5,544 (11.4%) | 5,860 (13.5%) |
| 2 Vehicles | 22,529 (46.4%) | 19,919 (45.9%) |
| 3 Vehicles | 11,700 (24.1%) | 11,276 (26.0%) |
| 4 Vehicles | 5,385 (11.1%) | 3,992 (9.2%) |
| 5 or more Vehicles | 2,577 (5.3%) | 1,849 (4.3%) |
| Total | 48,572 (100.0%) | 43,387 (100.0%) |
Commute Time in Hendricks County
The most frequently occuring commute durations in Hendricks County are 30 to 34 minutes (14,024 commuters, 17.3%), 20 to 24 minutes (10,874 commuters, 13.4%), and 15 to 19 minutes (10,448 commuters, 12.9%).
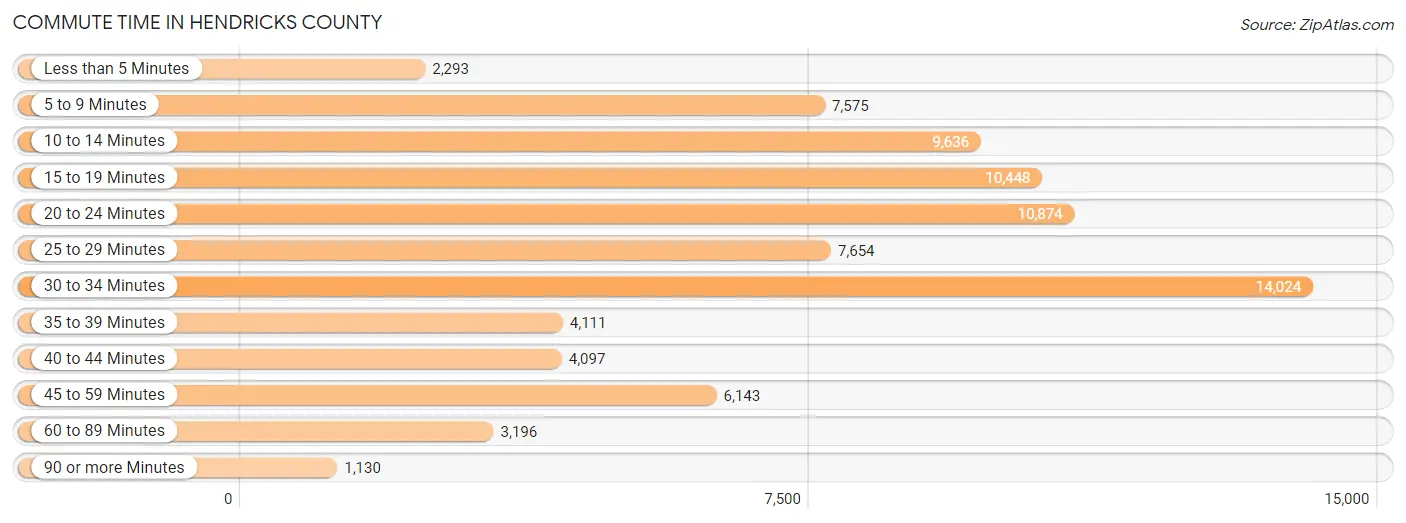
| Commute Time | # Commuters | % Commuters |
| Less than 5 Minutes | 2,293 | 2.8% |
| 5 to 9 Minutes | 7,575 | 9.3% |
| 10 to 14 Minutes | 9,636 | 11.9% |
| 15 to 19 Minutes | 10,448 | 12.9% |
| 20 to 24 Minutes | 10,874 | 13.4% |
| 25 to 29 Minutes | 7,654 | 9.4% |
| 30 to 34 Minutes | 14,024 | 17.3% |
| 35 to 39 Minutes | 4,111 | 5.1% |
| 40 to 44 Minutes | 4,097 | 5.1% |
| 45 to 59 Minutes | 6,143 | 7.6% |
| 60 to 89 Minutes | 3,196 | 3.9% |
| 90 or more Minutes | 1,130 | 1.4% |
Commute Time by Sex in Hendricks County
The most common commute times in Hendricks County are 30 to 34 minutes (7,931 commuters, 18.4%) for males and 30 to 34 minutes (6,093 commuters, 16.0%) for females.
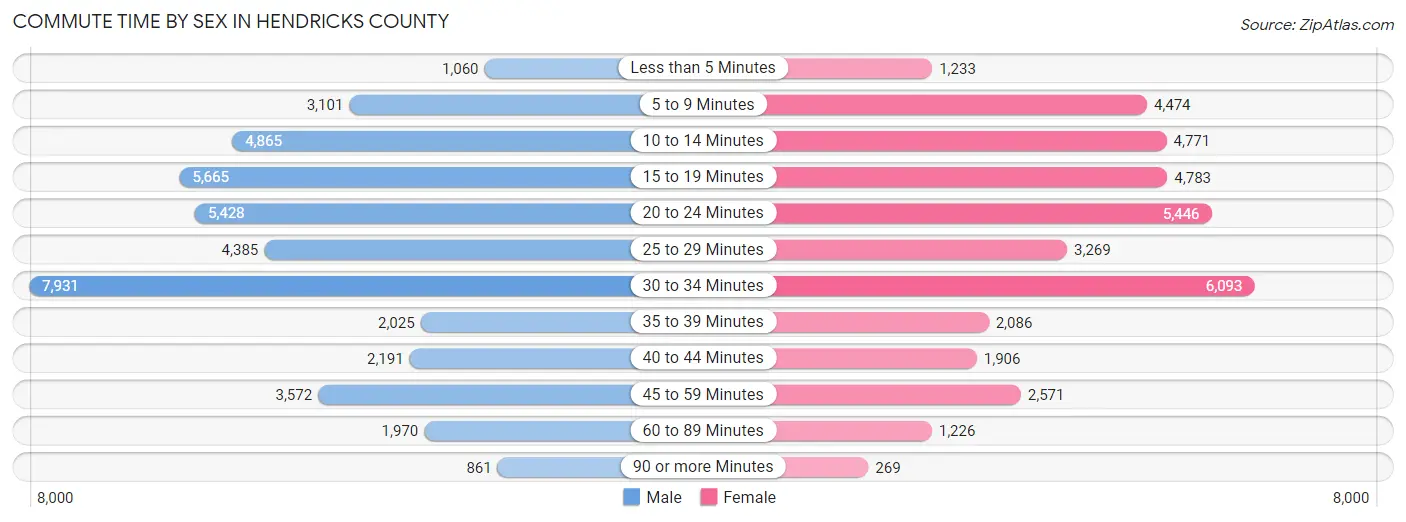
| Commute Time | Male | Female |
| Less than 5 Minutes | 1,060 (2.5%) | 1,233 (3.2%) |
| 5 to 9 Minutes | 3,101 (7.2%) | 4,474 (11.7%) |
| 10 to 14 Minutes | 4,865 (11.3%) | 4,771 (12.5%) |
| 15 to 19 Minutes | 5,665 (13.2%) | 4,783 (12.5%) |
| 20 to 24 Minutes | 5,428 (12.6%) | 5,446 (14.3%) |
| 25 to 29 Minutes | 4,385 (10.2%) | 3,269 (8.6%) |
| 30 to 34 Minutes | 7,931 (18.4%) | 6,093 (16.0%) |
| 35 to 39 Minutes | 2,025 (4.7%) | 2,086 (5.5%) |
| 40 to 44 Minutes | 2,191 (5.1%) | 1,906 (5.0%) |
| 45 to 59 Minutes | 3,572 (8.3%) | 2,571 (6.7%) |
| 60 to 89 Minutes | 1,970 (4.6%) | 1,226 (3.2%) |
| 90 or more Minutes | 861 (2.0%) | 269 (0.7%) |
Time of Departure to Work by Sex in Hendricks County
The most frequent times of departure to work in Hendricks County are 7:00 AM to 7:29 AM (6,074, 14.1%) for males and 7:00 AM to 7:29 AM (6,458, 16.9%) for females.
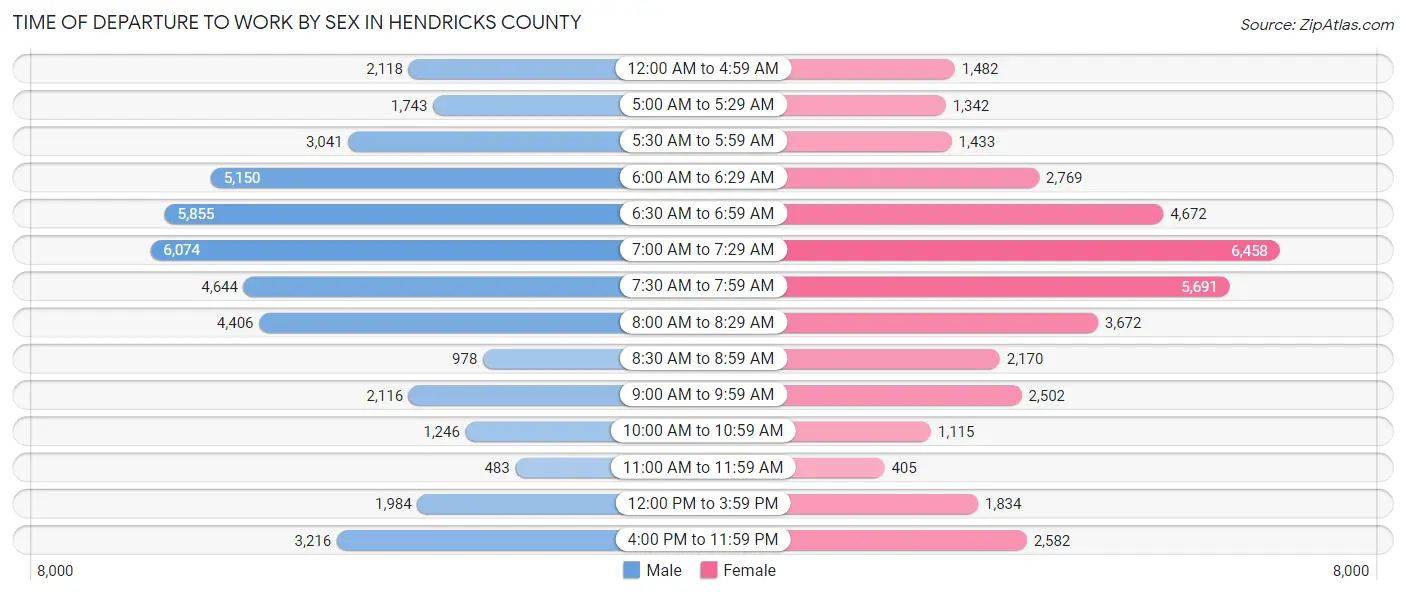
| Time of Departure | Male | Female |
| 12:00 AM to 4:59 AM | 2,118 (4.9%) | 1,482 (3.9%) |
| 5:00 AM to 5:29 AM | 1,743 (4.1%) | 1,342 (3.5%) |
| 5:30 AM to 5:59 AM | 3,041 (7.1%) | 1,433 (3.8%) |
| 6:00 AM to 6:29 AM | 5,150 (12.0%) | 2,769 (7.3%) |
| 6:30 AM to 6:59 AM | 5,855 (13.6%) | 4,672 (12.2%) |
| 7:00 AM to 7:29 AM | 6,074 (14.1%) | 6,458 (16.9%) |
| 7:30 AM to 7:59 AM | 4,644 (10.8%) | 5,691 (14.9%) |
| 8:00 AM to 8:29 AM | 4,406 (10.2%) | 3,672 (9.6%) |
| 8:30 AM to 8:59 AM | 978 (2.3%) | 2,170 (5.7%) |
| 9:00 AM to 9:59 AM | 2,116 (4.9%) | 2,502 (6.6%) |
| 10:00 AM to 10:59 AM | 1,246 (2.9%) | 1,115 (2.9%) |
| 11:00 AM to 11:59 AM | 483 (1.1%) | 405 (1.1%) |
| 12:00 PM to 3:59 PM | 1,984 (4.6%) | 1,834 (4.8%) |
| 4:00 PM to 11:59 PM | 3,216 (7.5%) | 2,582 (6.8%) |
| Total | 43,054 (100.0%) | 38,127 (100.0%) |
Housing Occupancy in Hendricks County
Occupancy by Ownership in Hendricks County
Of the total 64,403 dwellings in Hendricks County, owner-occupied units account for 49,994 (77.6%), while renter-occupied units make up 14,409 (22.4%).
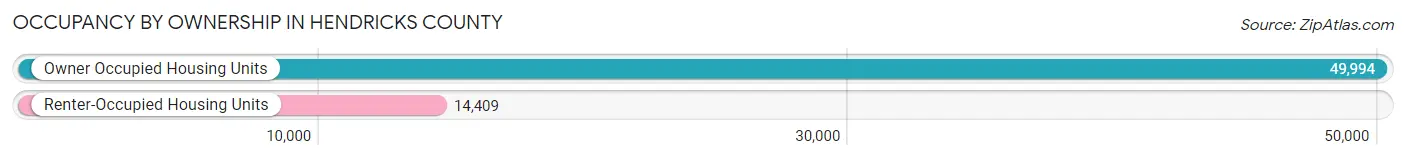
| Occupancy | # Housing Units | % Housing Units |
| Owner Occupied Housing Units | 49,994 | 77.6% |
| Renter-Occupied Housing Units | 14,409 | 22.4% |
| Total Occupied Housing Units | 64,403 | 100.0% |
Occupancy by Household Size in Hendricks County
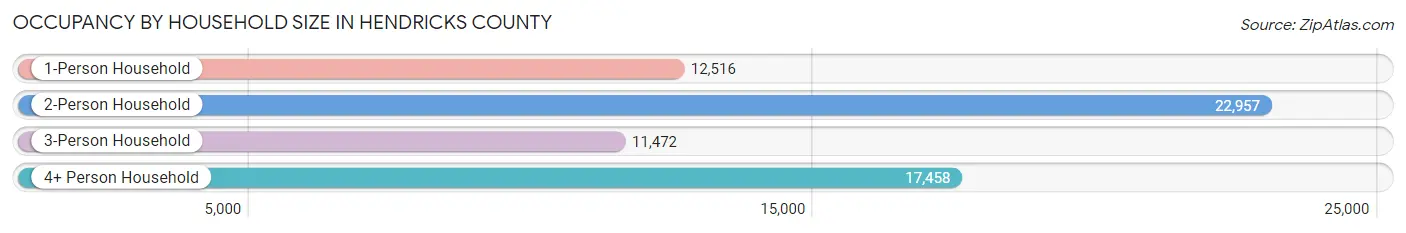
| Household Size | # Housing Units | % Housing Units |
| 1-Person Household | 12,516 | 19.4% |
| 2-Person Household | 22,957 | 35.6% |
| 3-Person Household | 11,472 | 17.8% |
| 4+ Person Household | 17,458 | 27.1% |
| Total Housing Units | 64,403 | 100.0% |
Occupancy by Ownership by Household Size in Hendricks County
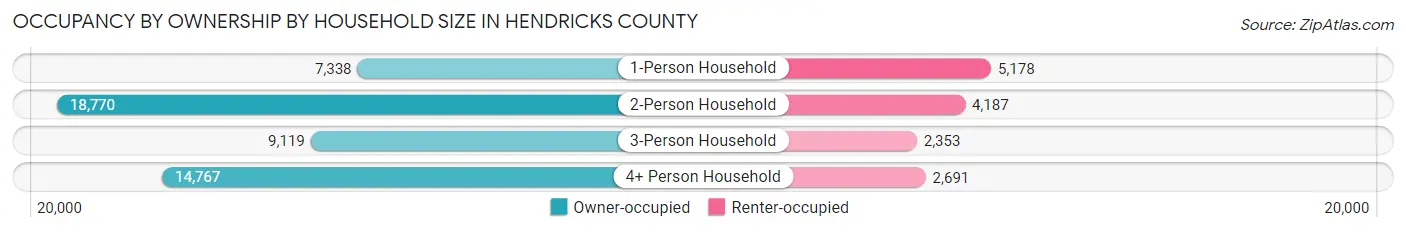
| Household Size | Owner-occupied | Renter-occupied |
| 1-Person Household | 7,338 (58.6%) | 5,178 (41.4%) |
| 2-Person Household | 18,770 (81.8%) | 4,187 (18.2%) |
| 3-Person Household | 9,119 (79.5%) | 2,353 (20.5%) |
| 4+ Person Household | 14,767 (84.6%) | 2,691 (15.4%) |
| Total Housing Units | 49,994 (77.6%) | 14,409 (22.4%) |
Occupancy by Educational Attainment in Hendricks County
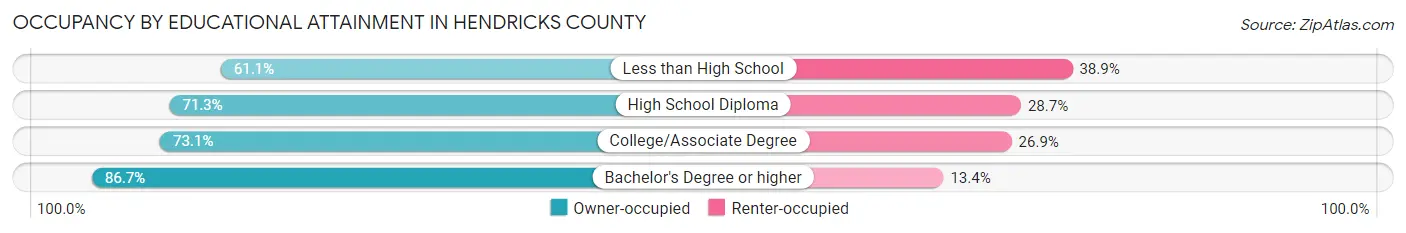
| Household Size | Owner-occupied | Renter-occupied |
| Less than High School | 2,265 (61.1%) | 1,443 (38.9%) |
| High School Diploma | 11,077 (71.3%) | 4,462 (28.7%) |
| College/Associate Degree | 13,410 (73.1%) | 4,924 (26.9%) |
| Bachelor's Degree or higher | 23,242 (86.7%) | 3,580 (13.4%) |
Occupancy by Age of Householder in Hendricks County
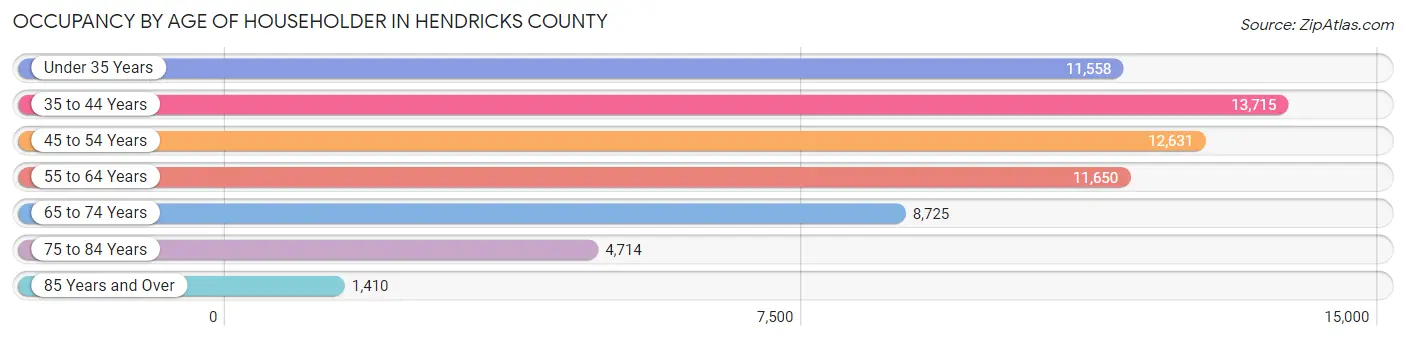
| Age Bracket | # Households | % Households |
| Under 35 Years | 11,558 | 17.9% |
| 35 to 44 Years | 13,715 | 21.3% |
| 45 to 54 Years | 12,631 | 19.6% |
| 55 to 64 Years | 11,650 | 18.1% |
| 65 to 74 Years | 8,725 | 13.6% |
| 75 to 84 Years | 4,714 | 7.3% |
| 85 Years and Over | 1,410 | 2.2% |
| Total | 64,403 | 100.0% |
Housing Finances in Hendricks County
Median Income by Occupancy in Hendricks County
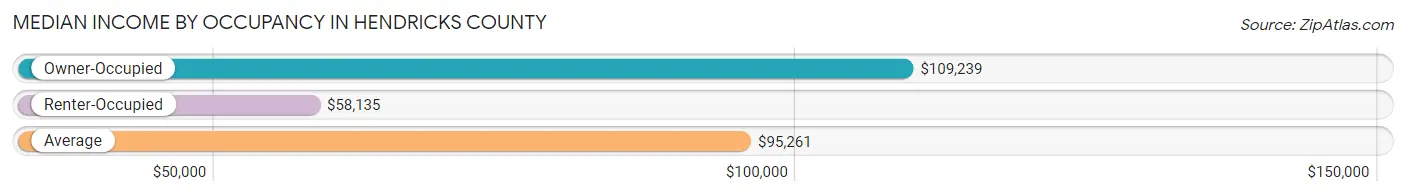
| Occupancy Type | # Households | Median Income |
| Owner-Occupied | 49,994 (77.6%) | $109,239 |
| Renter-Occupied | 14,409 (22.4%) | $58,135 |
| Average | 64,403 (100.0%) | $95,261 |
Occupancy by Householder Income Bracket in Hendricks County
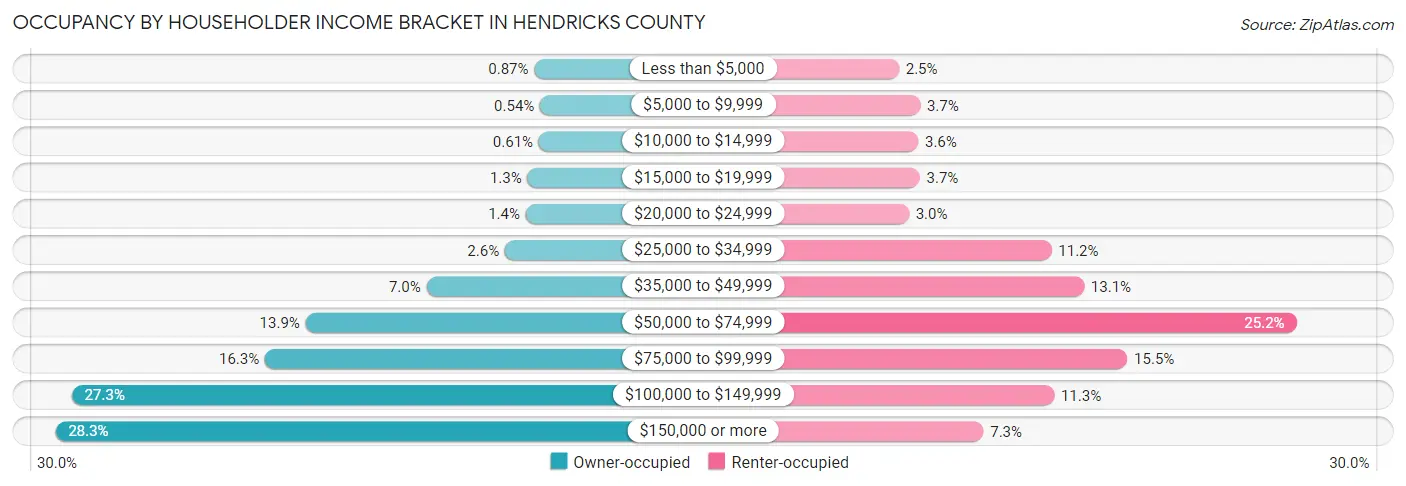
| Income Bracket | Owner-occupied | Renter-occupied |
| Less than $5,000 | 436 (0.9%) | 356 (2.5%) |
| $5,000 to $9,999 | 269 (0.5%) | 530 (3.7%) |
| $10,000 to $14,999 | 306 (0.6%) | 514 (3.6%) |
| $15,000 to $19,999 | 631 (1.3%) | 527 (3.7%) |
| $20,000 to $24,999 | 682 (1.4%) | 438 (3.0%) |
| $25,000 to $34,999 | 1,277 (2.5%) | 1,613 (11.2%) |
| $35,000 to $49,999 | 3,513 (7.0%) | 1,880 (13.1%) |
| $50,000 to $74,999 | 6,970 (13.9%) | 3,629 (25.2%) |
| $75,000 to $99,999 | 8,129 (16.3%) | 2,236 (15.5%) |
| $100,000 to $149,999 | 13,656 (27.3%) | 1,634 (11.3%) |
| $150,000 or more | 14,125 (28.2%) | 1,052 (7.3%) |
| Total | 49,994 (100.0%) | 14,409 (100.0%) |
Monthly Housing Cost Tiers in Hendricks County
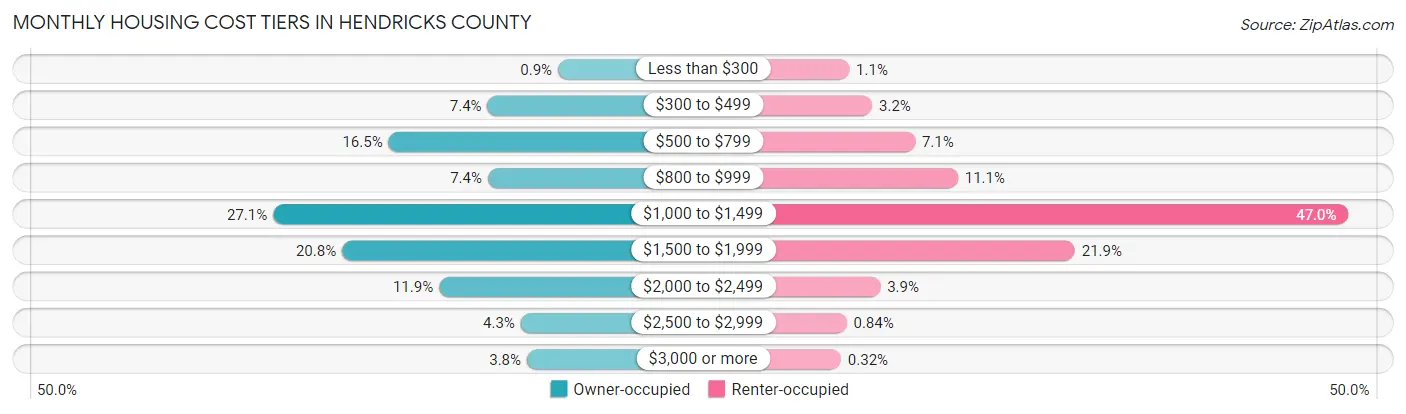
| Monthly Cost | Owner-occupied | Renter-occupied |
| Less than $300 | 448 (0.9%) | 156 (1.1%) |
| $300 to $499 | 3,695 (7.4%) | 459 (3.2%) |
| $500 to $799 | 8,248 (16.5%) | 1,029 (7.1%) |
| $800 to $999 | 3,679 (7.4%) | 1,596 (11.1%) |
| $1,000 to $1,499 | 13,565 (27.1%) | 6,777 (47.0%) |
| $1,500 to $1,999 | 10,391 (20.8%) | 3,149 (21.8%) |
| $2,000 to $2,499 | 5,924 (11.8%) | 567 (3.9%) |
| $2,500 to $2,999 | 2,164 (4.3%) | 121 (0.8%) |
| $3,000 or more | 1,880 (3.8%) | 46 (0.3%) |
| Total | 49,994 (100.0%) | 14,409 (100.0%) |
Physical Housing Characteristics in Hendricks County
Housing Structures in Hendricks County
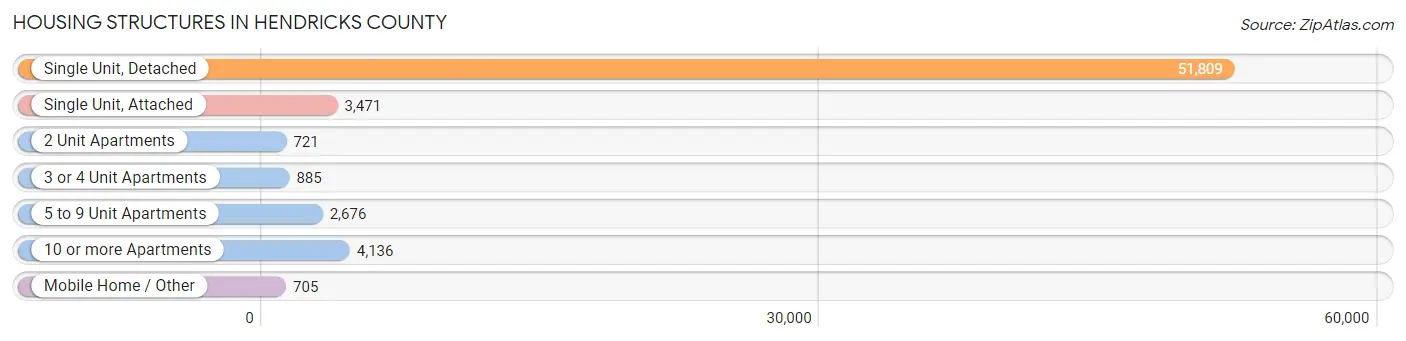
| Structure Type | # Housing Units | % Housing Units |
| Single Unit, Detached | 51,809 | 80.4% |
| Single Unit, Attached | 3,471 | 5.4% |
| 2 Unit Apartments | 721 | 1.1% |
| 3 or 4 Unit Apartments | 885 | 1.4% |
| 5 to 9 Unit Apartments | 2,676 | 4.2% |
| 10 or more Apartments | 4,136 | 6.4% |
| Mobile Home / Other | 705 | 1.1% |
| Total | 64,403 | 100.0% |
Housing Structures by Occupancy in Hendricks County
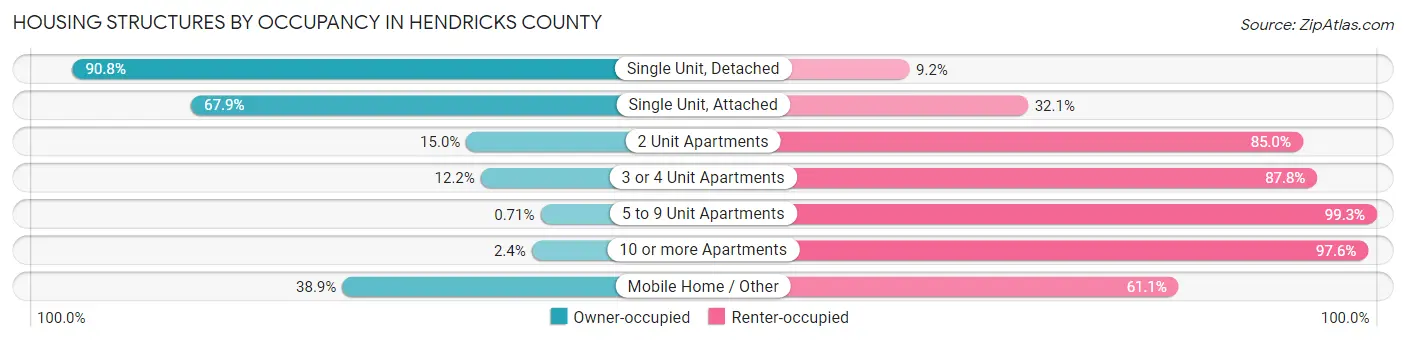
| Structure Type | Owner-occupied | Renter-occupied |
| Single Unit, Detached | 47,028 (90.8%) | 4,781 (9.2%) |
| Single Unit, Attached | 2,358 (67.9%) | 1,113 (32.1%) |
| 2 Unit Apartments | 108 (15.0%) | 613 (85.0%) |
| 3 or 4 Unit Apartments | 108 (12.2%) | 777 (87.8%) |
| 5 to 9 Unit Apartments | 19 (0.7%) | 2,657 (99.3%) |
| 10 or more Apartments | 99 (2.4%) | 4,037 (97.6%) |
| Mobile Home / Other | 274 (38.9%) | 431 (61.1%) |
| Total | 49,994 (77.6%) | 14,409 (22.4%) |
Housing Structures by Number of Rooms in Hendricks County
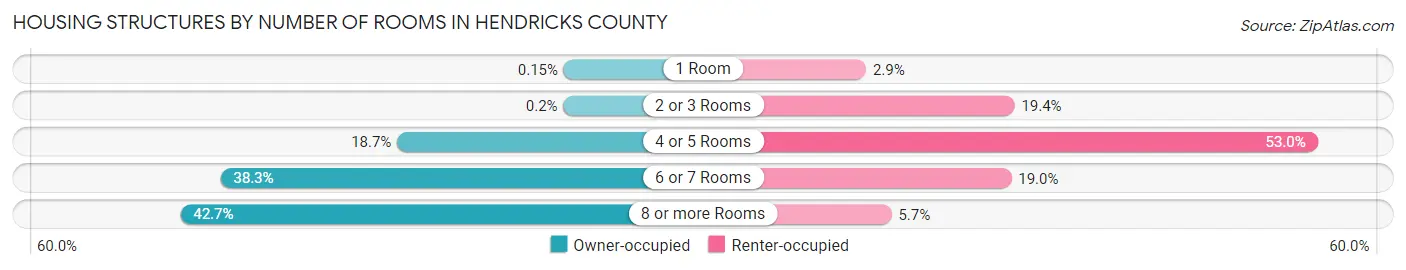
| Number of Rooms | Owner-occupied | Renter-occupied |
| 1 Room | 77 (0.2%) | 416 (2.9%) |
| 2 or 3 Rooms | 102 (0.2%) | 2,791 (19.4%) |
| 4 or 5 Rooms | 9,325 (18.6%) | 7,638 (53.0%) |
| 6 or 7 Rooms | 19,131 (38.3%) | 2,740 (19.0%) |
| 8 or more Rooms | 21,359 (42.7%) | 824 (5.7%) |
| Total | 49,994 (100.0%) | 14,409 (100.0%) |
Housing Structure by Heating Type in Hendricks County
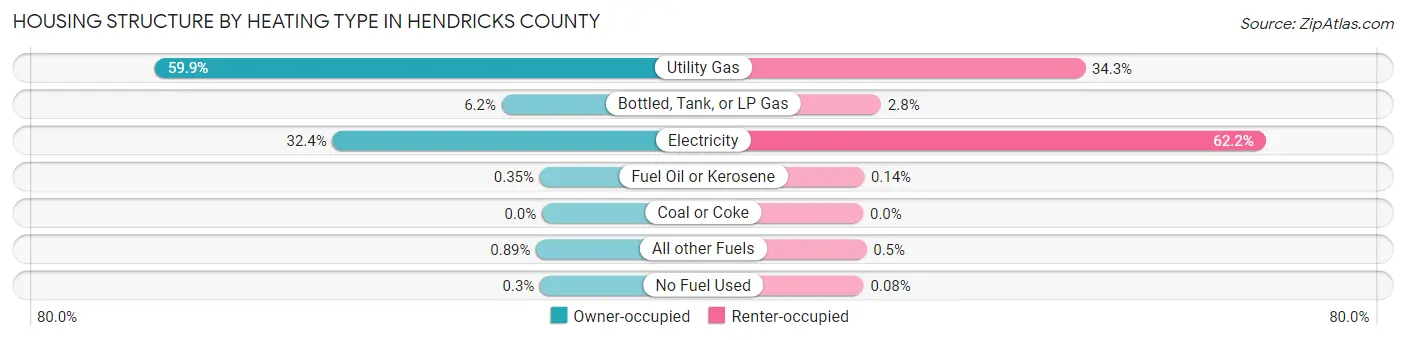
| Heating Type | Owner-occupied | Renter-occupied |
| Utility Gas | 29,919 (59.9%) | 4,942 (34.3%) |
| Bottled, Tank, or LP Gas | 3,114 (6.2%) | 398 (2.8%) |
| Electricity | 16,196 (32.4%) | 8,966 (62.2%) |
| Fuel Oil or Kerosene | 173 (0.4%) | 20 (0.1%) |
| Coal or Coke | 0 (0.0%) | 0 (0.0%) |
| All other Fuels | 444 (0.9%) | 72 (0.5%) |
| No Fuel Used | 148 (0.3%) | 11 (0.1%) |
| Total | 49,994 (100.0%) | 14,409 (100.0%) |
Household Vehicle Usage in Hendricks County
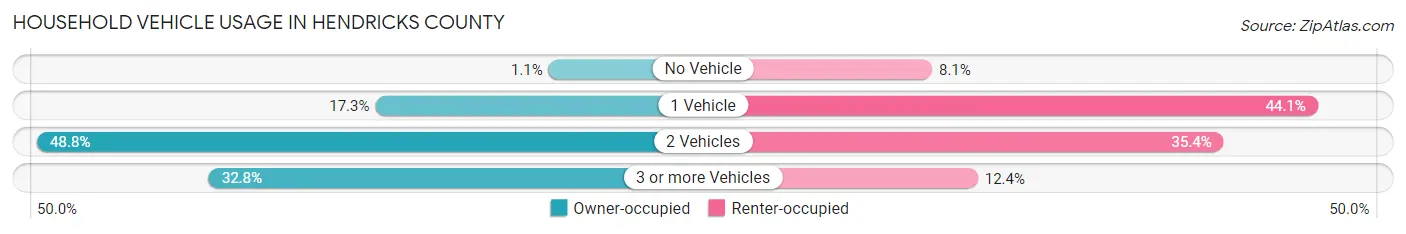
| Vehicles per Household | Owner-occupied | Renter-occupied |
| No Vehicle | 547 (1.1%) | 1,172 (8.1%) |
| 1 Vehicle | 8,631 (17.3%) | 6,358 (44.1%) |
| 2 Vehicles | 24,417 (48.8%) | 5,093 (35.3%) |
| 3 or more Vehicles | 16,399 (32.8%) | 1,786 (12.4%) |
| Total | 49,994 (100.0%) | 14,409 (100.0%) |
Real Estate & Mortgages in Hendricks County
Real Estate and Mortgage Overview in Hendricks County
| Characteristic | Without Mortgage | With Mortgage |
| Housing Units | 13,101 | 36,893 |
| Median Property Value | $256,300 | $258,100 |
| Median Household Income | $85,865 | $11,297 |
| Monthly Housing Costs | $586 | $1,880 |
| Real Estate Taxes | $2,328 | $424 |
Property Value by Mortgage Status in Hendricks County
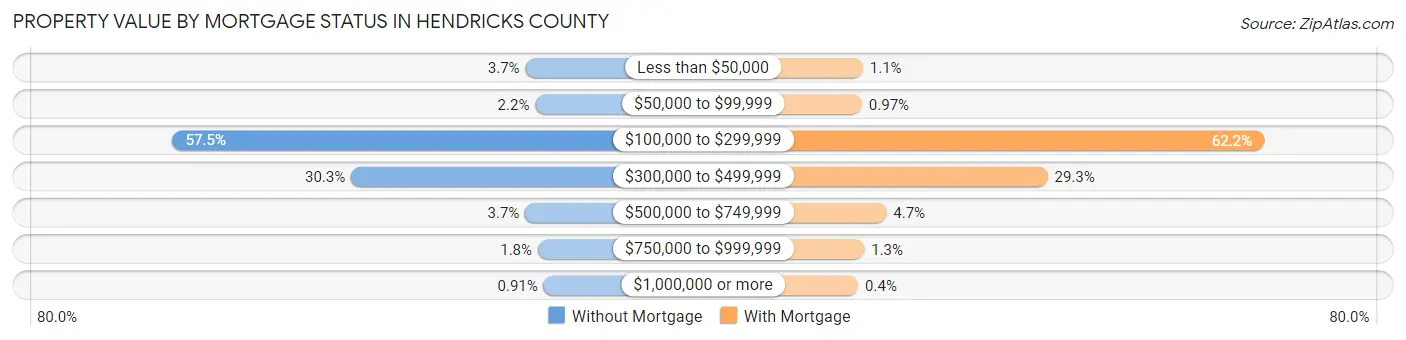
| Property Value | Without Mortgage | With Mortgage |
| Less than $50,000 | 482 (3.7%) | 411 (1.1%) |
| $50,000 to $99,999 | 287 (2.2%) | 359 (1.0%) |
| $100,000 to $299,999 | 7,526 (57.5%) | 22,964 (62.2%) |
| $300,000 to $499,999 | 3,965 (30.3%) | 10,793 (29.2%) |
| $500,000 to $749,999 | 488 (3.7%) | 1,729 (4.7%) |
| $750,000 to $999,999 | 234 (1.8%) | 488 (1.3%) |
| $1,000,000 or more | 119 (0.9%) | 149 (0.4%) |
| Total | 13,101 (100.0%) | 36,893 (100.0%) |
Household Income by Mortgage Status in Hendricks County
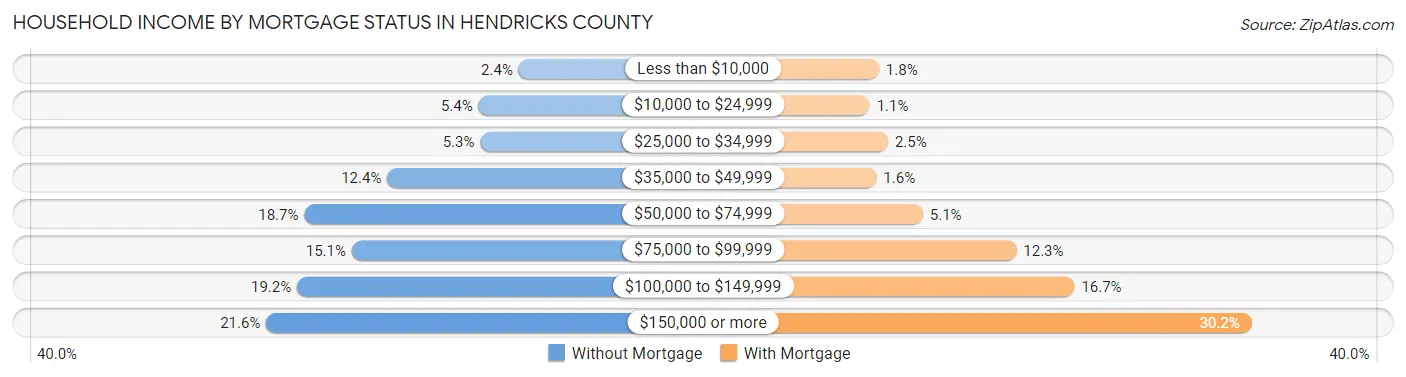
| Household Income | Without Mortgage | With Mortgage |
| Less than $10,000 | 308 (2.4%) | 655 (1.8%) |
| $10,000 to $24,999 | 709 (5.4%) | 397 (1.1%) |
| $25,000 to $34,999 | 692 (5.3%) | 910 (2.5%) |
| $35,000 to $49,999 | 1,621 (12.4%) | 585 (1.6%) |
| $50,000 to $74,999 | 2,449 (18.7%) | 1,892 (5.1%) |
| $75,000 to $99,999 | 1,974 (15.1%) | 4,521 (12.2%) |
| $100,000 to $149,999 | 2,520 (19.2%) | 6,155 (16.7%) |
| $150,000 or more | 2,828 (21.6%) | 11,136 (30.2%) |
| Total | 13,101 (100.0%) | 36,893 (100.0%) |
Property Value to Household Income Ratio in Hendricks County
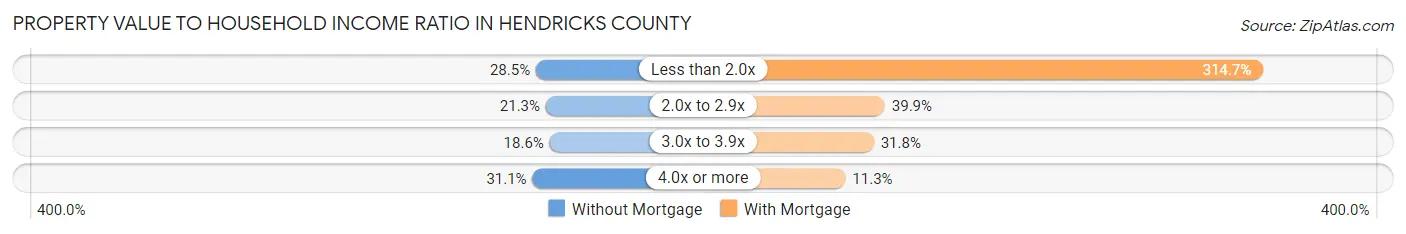
| Value-to-Income Ratio | Without Mortgage | With Mortgage |
| Less than 2.0x | 3,734 (28.5%) | 116,115 (314.7%) |
| 2.0x to 2.9x | 2,794 (21.3%) | 14,728 (39.9%) |
| 3.0x to 3.9x | 2,431 (18.6%) | 11,740 (31.8%) |
| 4.0x or more | 4,070 (31.1%) | 4,151 (11.3%) |
| Total | 13,101 (100.0%) | 36,893 (100.0%) |
Real Estate Taxes by Mortgage Status in Hendricks County
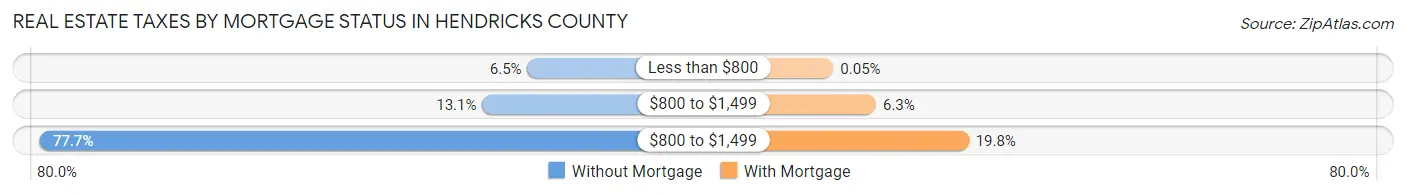
| Property Taxes | Without Mortgage | With Mortgage |
| Less than $800 | 856 (6.5%) | 20 (0.1%) |
| $800 to $1,499 | 1,719 (13.1%) | 2,318 (6.3%) |
| $800 to $1,499 | 10,185 (77.7%) | 7,313 (19.8%) |
| Total | 13,101 (100.0%) | 36,893 (100.0%) |
Health & Disability in Hendricks County
Health Insurance Coverage by Age in Hendricks County
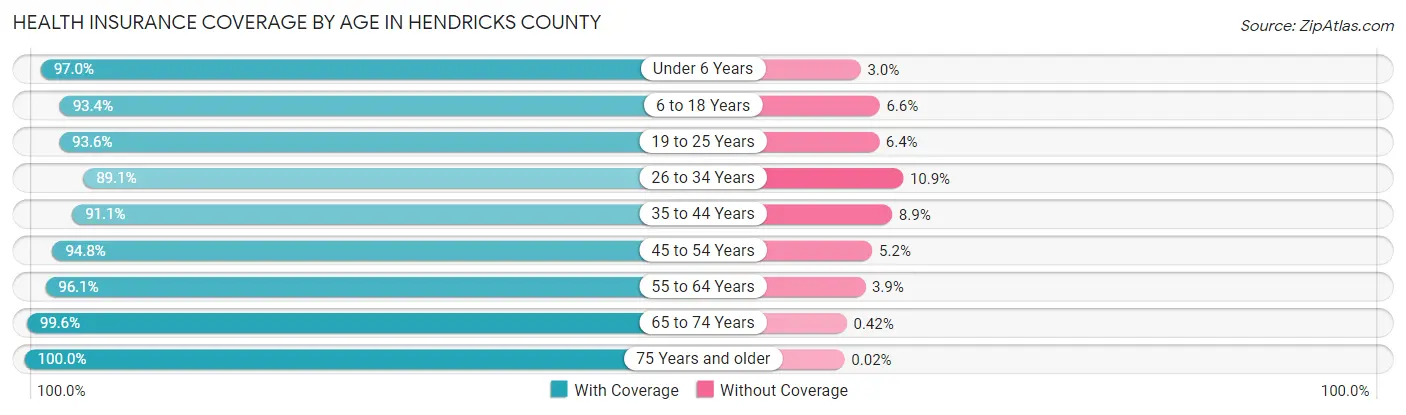
| Age Bracket | With Coverage | Without Coverage |
| Under 6 Years | 11,430 (97.0%) | 355 (3.0%) |
| 6 to 18 Years | 31,566 (93.4%) | 2,216 (6.6%) |
| 19 to 25 Years | 12,774 (93.6%) | 880 (6.4%) |
| 26 to 34 Years | 17,024 (89.1%) | 2,092 (10.9%) |
| 35 to 44 Years | 22,606 (91.1%) | 2,204 (8.9%) |
| 45 to 54 Years | 22,216 (94.8%) | 1,219 (5.2%) |
| 55 to 64 Years | 20,508 (96.1%) | 823 (3.9%) |
| 65 to 74 Years | 15,082 (99.6%) | 64 (0.4%) |
| 75 Years and older | 9,305 (100.0%) | 2 (0.0%) |
| Total | 162,511 (94.3%) | 9,855 (5.7%) |
Health Insurance Coverage by Citizenship Status in Hendricks County
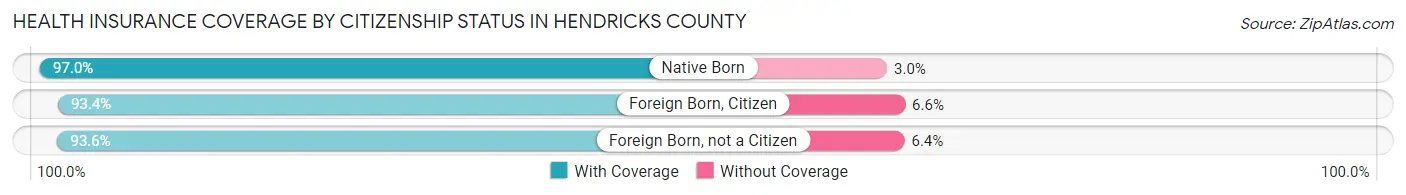
| Citizenship Status | With Coverage | Without Coverage |
| Native Born | 11,430 (97.0%) | 355 (3.0%) |
| Foreign Born, Citizen | 31,566 (93.4%) | 2,216 (6.6%) |
| Foreign Born, not a Citizen | 12,774 (93.6%) | 880 (6.4%) |
Health Insurance Coverage by Household Income in Hendricks County
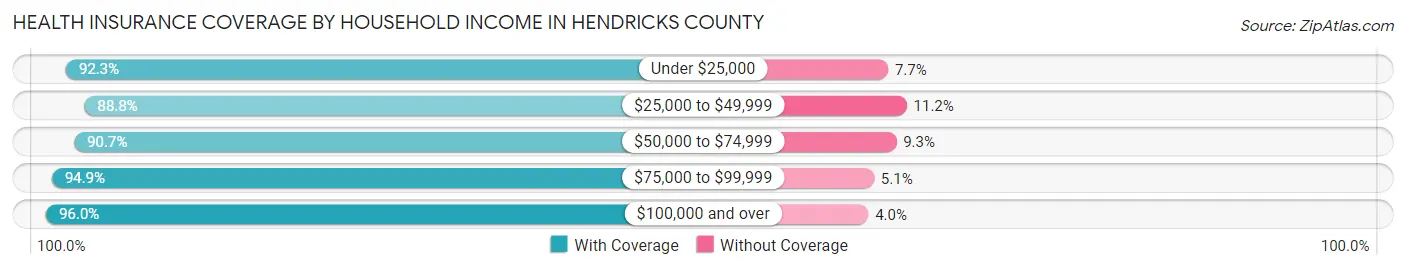
| Household Income | With Coverage | Without Coverage |
| Under $25,000 | 7,171 (92.3%) | 600 (7.7%) |
| $25,000 to $49,999 | 13,674 (88.8%) | 1,726 (11.2%) |
| $50,000 to $74,999 | 21,763 (90.7%) | 2,220 (9.3%) |
| $75,000 to $99,999 | 26,046 (94.9%) | 1,393 (5.1%) |
| $100,000 and over | 93,816 (96.0%) | 3,915 (4.0%) |
Public vs Private Health Insurance Coverage by Age in Hendricks County
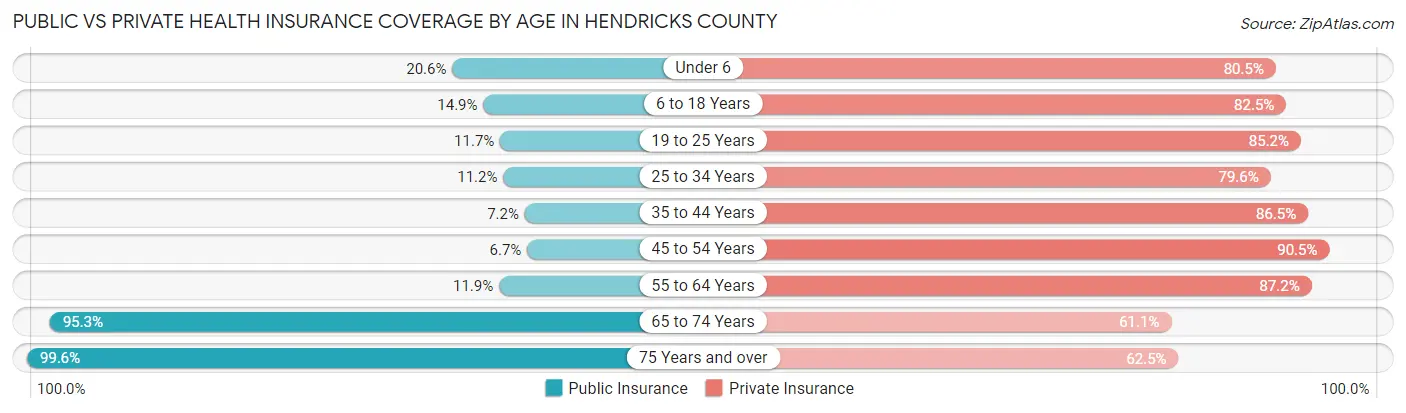
| Age Bracket | Public Insurance | Private Insurance |
| Under 6 | 2,429 (20.6%) | 9,492 (80.5%) |
| 6 to 18 Years | 5,016 (14.8%) | 27,860 (82.5%) |
| 19 to 25 Years | 1,602 (11.7%) | 11,633 (85.2%) |
| 25 to 34 Years | 2,131 (11.2%) | 15,213 (79.6%) |
| 35 to 44 Years | 1,775 (7.1%) | 21,469 (86.5%) |
| 45 to 54 Years | 1,575 (6.7%) | 21,204 (90.5%) |
| 55 to 64 Years | 2,544 (11.9%) | 18,598 (87.2%) |
| 65 to 74 Years | 14,438 (95.3%) | 9,261 (61.1%) |
| 75 Years and over | 9,267 (99.6%) | 5,815 (62.5%) |
| Total | 40,777 (23.7%) | 140,545 (81.5%) |
Disability Status by Sex by Age in Hendricks County
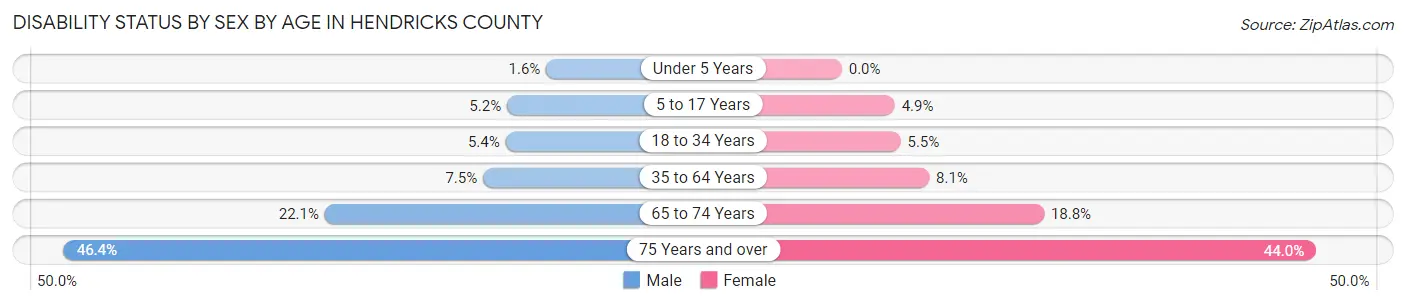
| Age Bracket | Male | Female |
| Under 5 Years | 75 (1.6%) | 0 (0.0%) |
| 5 to 17 Years | 917 (5.2%) | 784 (4.9%) |
| 18 to 34 Years | 960 (5.4%) | 944 (5.4%) |
| 35 to 64 Years | 2,580 (7.4%) | 2,831 (8.1%) |
| 65 to 74 Years | 1,563 (22.1%) | 1,517 (18.8%) |
| 75 Years and over | 1,737 (46.4%) | 2,447 (44.0%) |
Disability Class by Sex by Age in Hendricks County
Disability Class: Hearing Difficulty
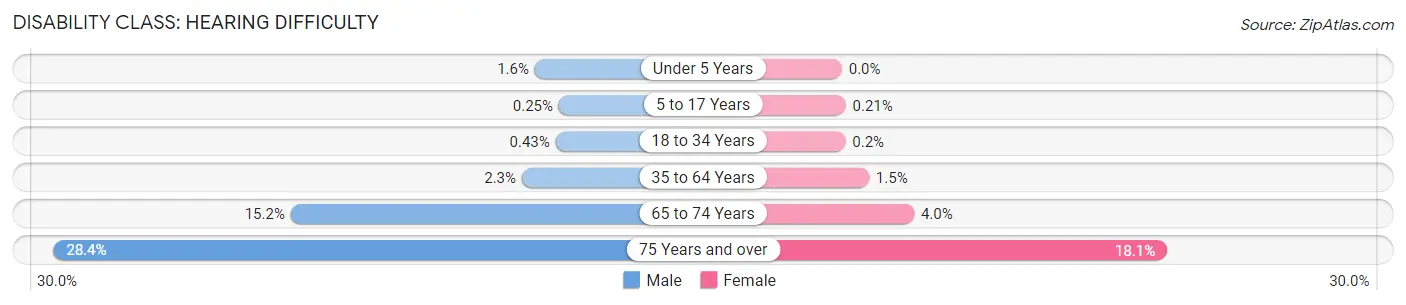
| Age Bracket | Male | Female |
| Under 5 Years | 75 (1.6%) | 0 (0.0%) |
| 5 to 17 Years | 44 (0.3%) | 34 (0.2%) |
| 18 to 34 Years | 77 (0.4%) | 34 (0.2%) |
| 35 to 64 Years | 801 (2.3%) | 528 (1.5%) |
| 65 to 74 Years | 1,072 (15.2%) | 325 (4.0%) |
| 75 Years and over | 1,064 (28.4%) | 1,007 (18.1%) |
Disability Class: Vision Difficulty
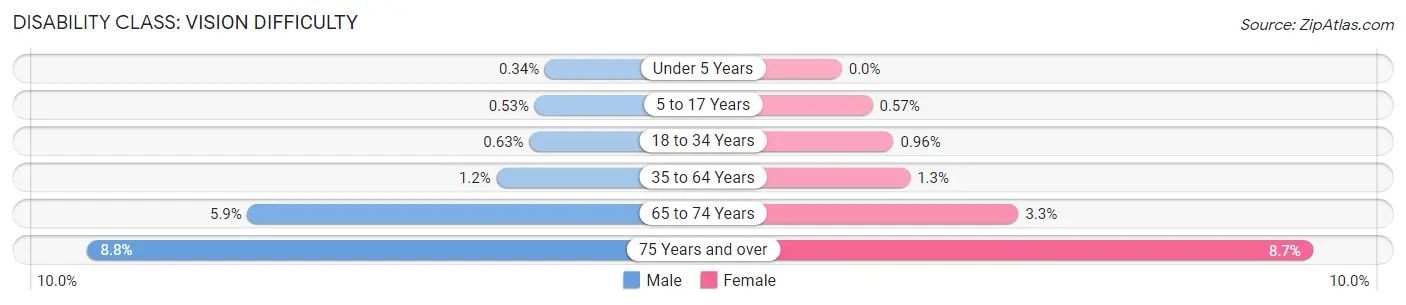
| Age Bracket | Male | Female |
| Under 5 Years | 16 (0.3%) | 0 (0.0%) |
| 5 to 17 Years | 93 (0.5%) | 91 (0.6%) |
| 18 to 34 Years | 113 (0.6%) | 166 (1.0%) |
| 35 to 64 Years | 429 (1.2%) | 443 (1.3%) |
| 65 to 74 Years | 414 (5.9%) | 265 (3.3%) |
| 75 Years and over | 331 (8.8%) | 486 (8.7%) |
Disability Class: Cognitive Difficulty
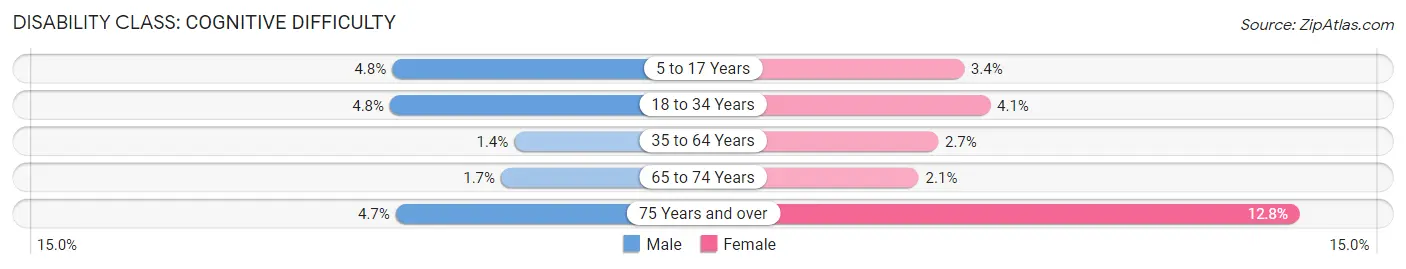
| Age Bracket | Male | Female |
| 5 to 17 Years | 836 (4.8%) | 543 (3.4%) |
| 18 to 34 Years | 865 (4.8%) | 715 (4.1%) |
| 35 to 64 Years | 475 (1.4%) | 938 (2.7%) |
| 65 to 74 Years | 123 (1.7%) | 173 (2.1%) |
| 75 Years and over | 175 (4.7%) | 709 (12.8%) |
Disability Class: Ambulatory Difficulty
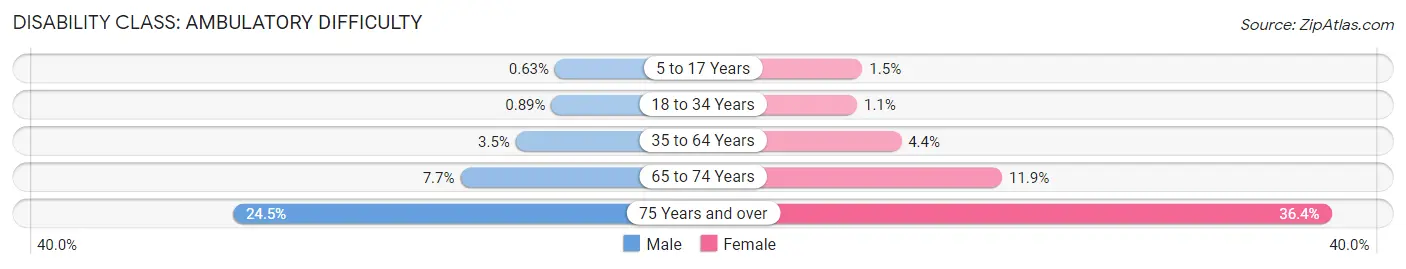
| Age Bracket | Male | Female |
| 5 to 17 Years | 111 (0.6%) | 244 (1.5%) |
| 18 to 34 Years | 159 (0.9%) | 196 (1.1%) |
| 35 to 64 Years | 1,226 (3.5%) | 1,540 (4.4%) |
| 65 to 74 Years | 540 (7.6%) | 962 (11.9%) |
| 75 Years and over | 919 (24.5%) | 2,021 (36.3%) |
Disability Class: Self-Care Difficulty
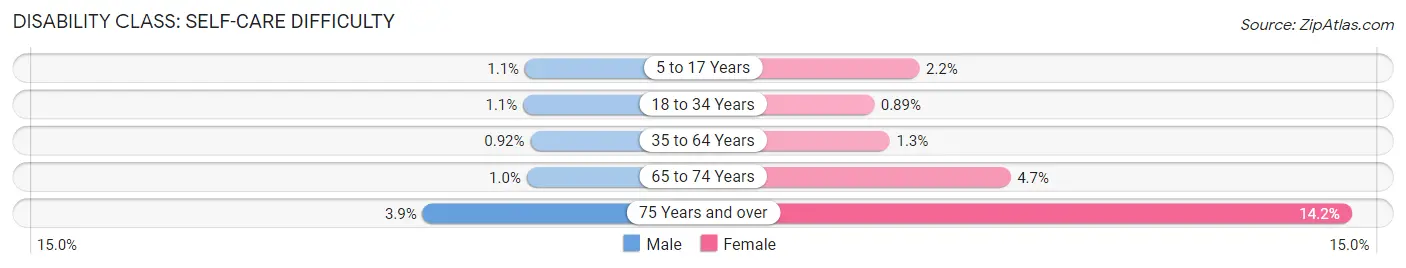
| Age Bracket | Male | Female |
| 5 to 17 Years | 188 (1.1%) | 344 (2.1%) |
| 18 to 34 Years | 201 (1.1%) | 154 (0.9%) |
| 35 to 64 Years | 320 (0.9%) | 466 (1.3%) |
| 65 to 74 Years | 72 (1.0%) | 379 (4.7%) |
| 75 Years and over | 147 (3.9%) | 789 (14.2%) |
Technology Access in Hendricks County
Computing Device Access in Hendricks County
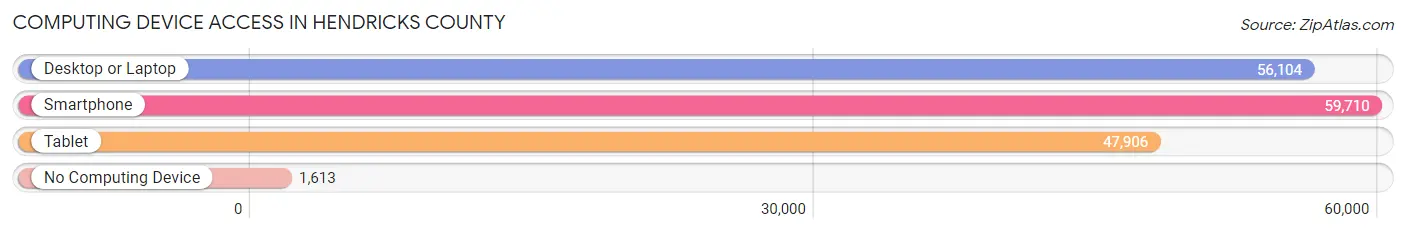
| Device Type | # Households | % Households |
| Desktop or Laptop | 56,104 | 87.1% |
| Smartphone | 59,710 | 92.7% |
| Tablet | 47,906 | 74.4% |
| No Computing Device | 1,613 | 2.5% |
| Total | 64,403 | 100.0% |
Internet Access in Hendricks County
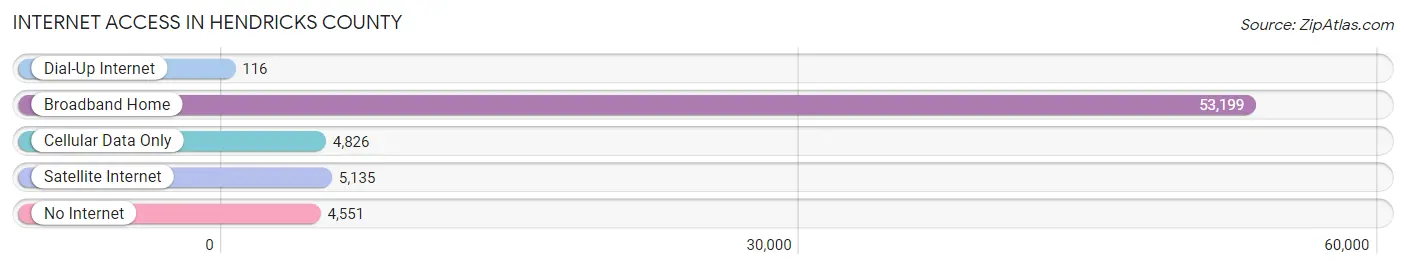
| Internet Type | # Households | % Households |
| Dial-Up Internet | 116 | 0.2% |
| Broadband Home | 53,199 | 82.6% |
| Cellular Data Only | 4,826 | 7.5% |
| Satellite Internet | 5,135 | 8.0% |
| No Internet | 4,551 | 7.1% |
| Total | 64,403 | 100.0% |
Hendricks County Summary
Hendricks County, Indiana is located in the central part of the state, just west of Indianapolis. It is bordered by Marion, Boone, Putnam, Montgomery, and Morgan counties. The county seat is Danville, and the county is named after Indiana's third governor, William Hendricks. The county has a population of about 160,000 people, and is part of the Indianapolis metropolitan area.
Geography
Hendricks County is located in the Central Till Plains region of Indiana. The county is mostly flat, with some rolling hills in the northern and western parts. The county is drained by the White River, which flows through the county from north to south. The county is also home to several small lakes, including Lake Lemon, Lake Freeman, and Lake Shafer.
The county is divided into twelve townships: Amo, Brown, Center, Clay, Franklin, Guilford, Liberty, Lincoln, Marion, Middle, Washington, and Wayne. The county is also home to several small towns, including Avon, Brownsburg, Danville, Lizton, North Salem, Pittsboro, and Plainfield.
Economy
Hendricks County has a diverse economy, with a mix of manufacturing, agriculture, and services. The county is home to several large employers, including Eli Lilly and Company, Rolls-Royce, and Honda Manufacturing of Indiana. The county is also home to several small businesses, including restaurants, retail stores, and professional services.
Agriculture is an important part of the county's economy. The county is home to several large farms, and is a major producer of corn, soybeans, and wheat. The county is also home to several wineries and breweries, and is a popular destination for wine and beer enthusiasts.
Demographics
Hendricks County is home to a diverse population. The county is about 85% white, 8% Hispanic, 4% African American, and 3% Asian. The median household income is about $60,000, and the median home value is about $150,000. The county has a low unemployment rate, and a high rate of educational attainment.
Conclusion
Hendricks County, Indiana is a diverse and vibrant county located in the central part of the state. The county is home to a mix of manufacturing, agriculture, and services, and is a major producer of corn, soybeans, and wheat. The county is home to a diverse population, with a median household income of about $60,000 and a median home value of about $150,000. The county has a low unemployment rate, and a high rate of educational attainment.
Common Questions
What is the Total Population of Hendricks County?
Total Population of Hendricks County is 175,639.
What is the Total Male Population of Hendricks County?
Total Male Population of Hendricks County is 88,267.
What is the Total Female Population of Hendricks County?
Total Female Population of Hendricks County is 87,372.
What is the Ratio of Males per 100 Females in Hendricks County?
There are 101.02 Males per 100 Females in Hendricks County.
What is the Ratio of Females per 100 Males in Hendricks County?
There are 98.99 Females per 100 Males in Hendricks County.
What is the Median Population Age in Hendricks County?
Median Population Age in Hendricks County is 38.4 Years.
What is the Average Family Size in Hendricks County
Average Family Size in Hendricks County is 3.1 People.
What is the Average Household Size in Hendricks County
Average Household Size in Hendricks County is 2.7 People.
What is Per Capita Income in Hendricks County?
Per Capita income in Hendricks County is $43,651.
What is the Median Family Income in Hendricks County?
Median Family Income in Hendricks County is $109,727.
What is the Median Household income in Hendricks County?
Median Household Income in Hendricks County is $95,261.
What is Income or Wage Gap in Hendricks County?
Income or Wage Gap in Hendricks County is 31.8%.
Women in Hendricks County earn 68.2 cents for every dollar earned by a man.
What is Family Income Deficit in Hendricks County?
Family Income Deficit in Hendricks County is $9,725.
Families that are below poverty line in Hendricks County earn $9,725 less on average than the poverty threshold level.
What is Inequality or Gini Index in Hendricks County?
Inequality or Gini Index in Hendricks County is 0.39.
How Large is the Labor Force in Hendricks County?
There are 96,183 People in the Labor Forcein in Hendricks County.
What is the Percentage of People in the Labor Force in Hendricks County?
69.8% of People are in the Labor Force in Hendricks County.
What is the Unemployment Rate in Hendricks County?
Unemployment Rate in Hendricks County is 2.4%.