Hancock County, IN
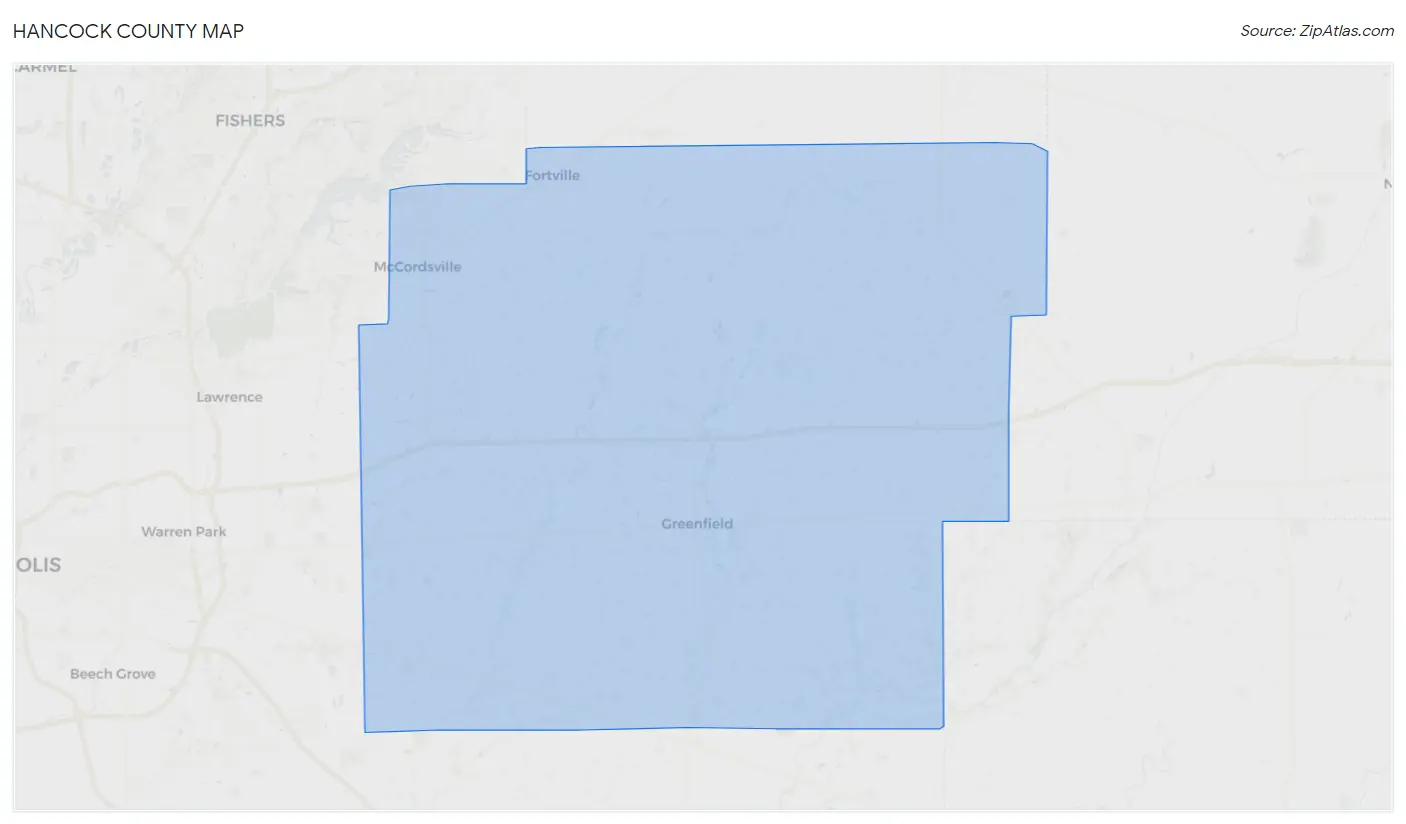
Hancock County Map
Hancock County Overview
80,170
TOTAL POPULATION
39,956
MALE POPULATION
40,214
FEMALE POPULATION
99.36
MALES / 100 FEMALES
100.65
FEMALES / 100 MALES
39.6
MEDIAN AGE
3.0
AVG FAMILY SIZE
2.5
AVG HOUSEHOLD SIZE
$42,666
PER CAPITA INCOME
$103,458
AVG FAMILY INCOME
$85,262
AVG HOUSEHOLD INCOME
32.8%
WAGE / INCOME GAP [ % ]
67.2¢/ $1
WAGE / INCOME GAP [ $ ]
$11,515
FAMILY INCOME DEFICIT
0.39
INEQUALITY / GINI INDEX
43,544
LABOR FORCE [ PEOPLE ]
68.2%
PERCENT IN LABOR FORCE
2.7%
UNEMPLOYMENT RATE
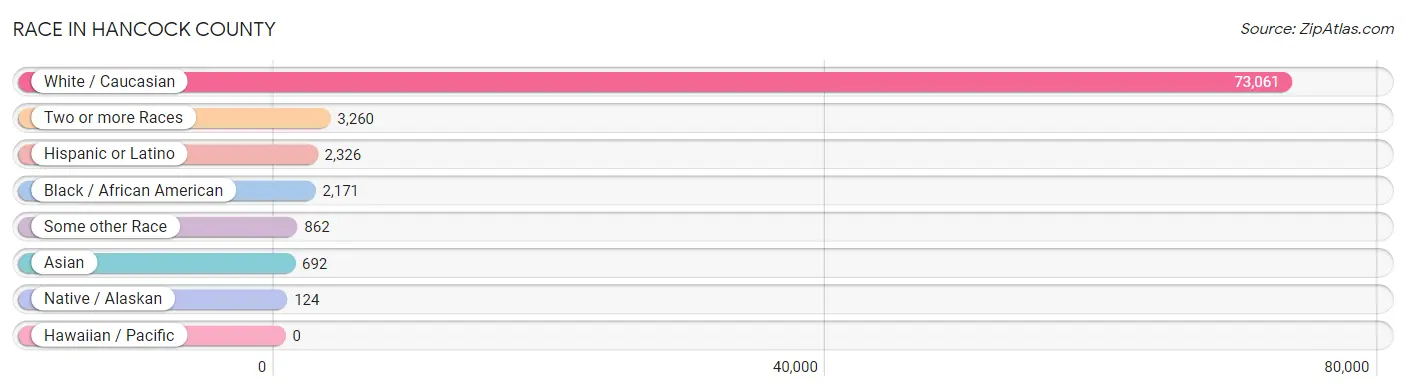
Race in Hancock County
The most populous races in Hancock County are White / Caucasian (73,061 | 91.1%), Two or more Races (3,260 | 4.1%), and Hispanic or Latino (2,326 | 2.9%).
| Race | # Population | % Population |
| Asian | 692 | 0.9% |
| Black / African American | 2,171 | 2.7% |
| Hawaiian / Pacific | 0 | 0.0% |
| Hispanic or Latino | 2,326 | 2.9% |
| Native / Alaskan | 124 | 0.2% |
| White / Caucasian | 73,061 | 91.1% |
| Two or more Races | 3,260 | 4.1% |
| Some other Race | 862 | 1.1% |
| Total | 80,170 | 100.0% |
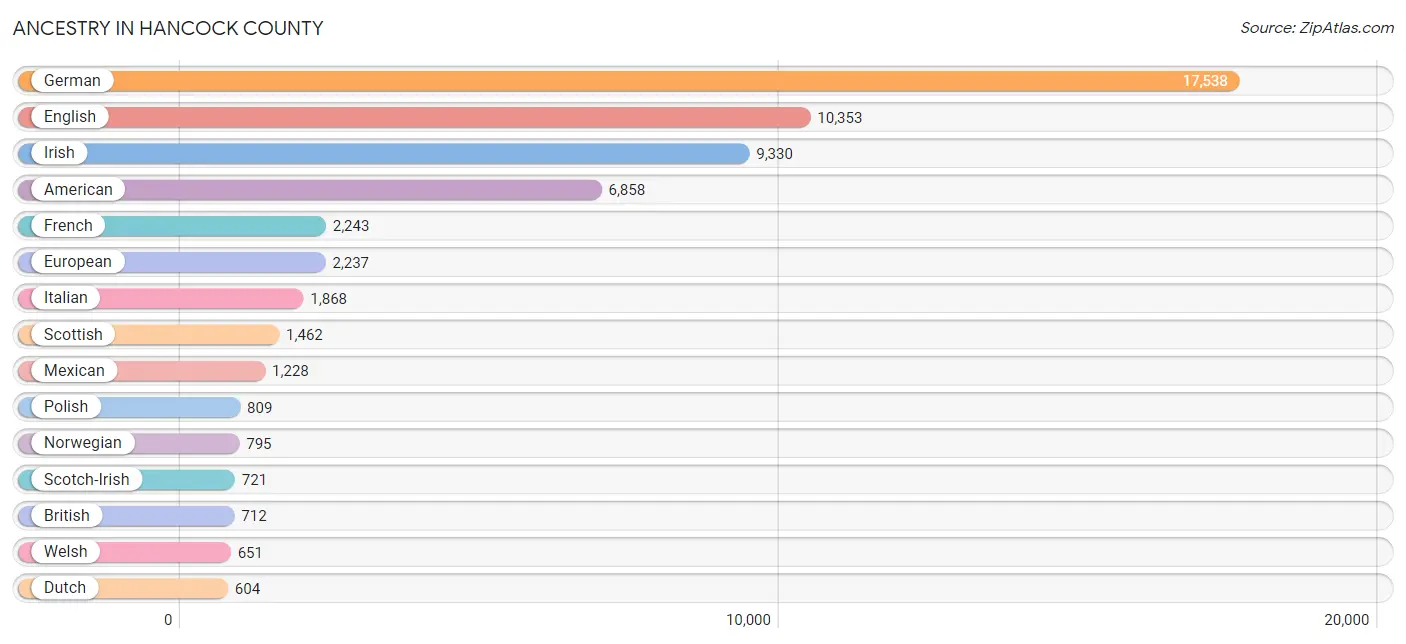
Ancestry in Hancock County
The most populous ancestries reported in Hancock County are German (17,538 | 21.9%), English (10,353 | 12.9%), Irish (9,330 | 11.6%), American (6,858 | 8.6%), and French (2,243 | 2.8%), together accounting for 57.8% of all Hancock County residents.
| Ancestry | # Population | % Population |
| African | 60 | 0.1% |
| Alsatian | 12 | 0.0% |
| American | 6,858 | 8.6% |
| Apache | 29 | 0.0% |
| Arab | 353 | 0.4% |
| Argentinean | 19 | 0.0% |
| Australian | 11 | 0.0% |
| Austrian | 156 | 0.2% |
| Belgian | 33 | 0.0% |
| Bhutanese | 264 | 0.3% |
| Blackfeet | 38 | 0.1% |
| British | 712 | 0.9% |
| Burmese | 146 | 0.2% |
| Canadian | 174 | 0.2% |
| Celtic | 46 | 0.1% |
| Central American | 286 | 0.4% |
| Cherokee | 68 | 0.1% |
| Chippewa | 15 | 0.0% |
| Choctaw | 6 | 0.0% |
| Colombian | 84 | 0.1% |
| Croatian | 58 | 0.1% |
| Cuban | 35 | 0.0% |
| Czech | 149 | 0.2% |
| Czechoslovakian | 109 | 0.1% |
| Danish | 244 | 0.3% |
| Dutch | 604 | 0.7% |
| Eastern European | 346 | 0.4% |
| English | 10,353 | 12.9% |
| Ethiopian | 224 | 0.3% |
| European | 2,237 | 2.8% |
| Finnish | 278 | 0.4% |
| French | 2,243 | 2.8% |
| French Canadian | 106 | 0.1% |
| German | 17,538 | 21.9% |
| Ghanaian | 26 | 0.0% |
| Greek | 53 | 0.1% |
| Guatemalan | 104 | 0.1% |
| Hungarian | 350 | 0.4% |
| Indian (Asian) | 23 | 0.0% |
| Irish | 9,330 | 11.6% |
| Italian | 1,868 | 2.3% |
| Jamaican | 83 | 0.1% |
| Korean | 188 | 0.2% |
| Laotian | 3 | 0.0% |
| Lebanese | 143 | 0.2% |
| Lithuanian | 71 | 0.1% |
| Luxembourger | 10 | 0.0% |
| Mexican | 1,228 | 1.5% |
| New Zealander | 5 | 0.0% |
| Northern European | 153 | 0.2% |
| Norwegian | 795 | 1.0% |
| Pakistani | 18 | 0.0% |
| Pennsylvania German | 34 | 0.0% |
| Peruvian | 39 | 0.1% |
| Polish | 809 | 1.0% |
| Portuguese | 179 | 0.2% |
| Puerto Rican | 324 | 0.4% |
| Romanian | 110 | 0.1% |
| Russian | 99 | 0.1% |
| Salvadoran | 182 | 0.2% |
| Scandinavian | 103 | 0.1% |
| Scotch-Irish | 721 | 0.9% |
| Scottish | 1,462 | 1.8% |
| Serbian | 48 | 0.1% |
| Sioux | 12 | 0.0% |
| Slavic | 148 | 0.2% |
| Slovak | 7 | 0.0% |
| Slovene | 45 | 0.1% |
| South American | 199 | 0.3% |
| Spanish | 140 | 0.2% |
| Sri Lankan | 32 | 0.0% |
| Subsaharan African | 310 | 0.4% |
| Swedish | 376 | 0.5% |
| Swiss | 342 | 0.4% |
| Thai | 271 | 0.3% |
| Turkish | 27 | 0.0% |
| Ukrainian | 58 | 0.1% |
| Venezuelan | 57 | 0.1% |
| Welsh | 651 | 0.8% |
| Yugoslavian | 120 | 0.2% | View All 80 Rows |
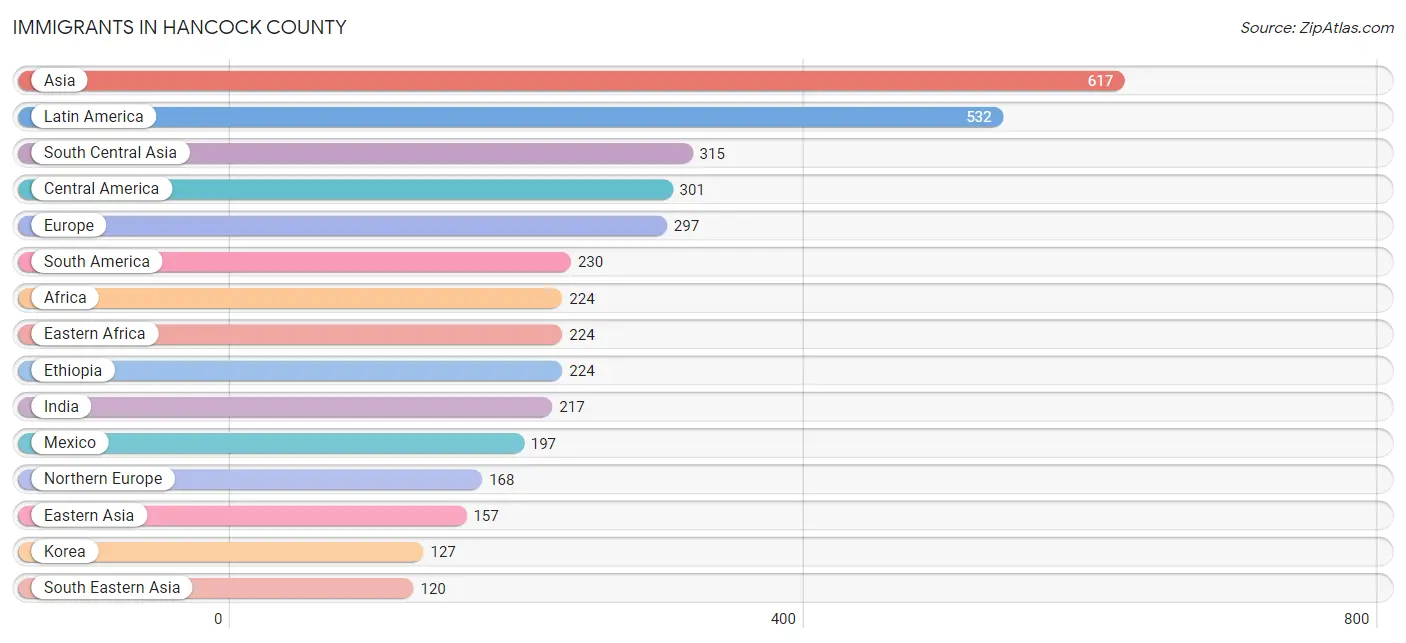
Immigrants in Hancock County
The most numerous immigrant groups reported in Hancock County came from Asia (617 | 0.8%), Latin America (532 | 0.7%), South Central Asia (315 | 0.4%), Central America (301 | 0.4%), and Europe (297 | 0.4%), together accounting for 2.6% of all Hancock County residents.
| Immigration Origin | # Population | % Population |
| Africa | 224 | 0.3% |
| Asia | 617 | 0.8% |
| Brazil | 38 | 0.1% |
| Canada | 9 | 0.0% |
| Caribbean | 1 | 0.0% |
| Central America | 301 | 0.4% |
| China | 19 | 0.0% |
| Colombia | 96 | 0.1% |
| Cuba | 1 | 0.0% |
| Eastern Africa | 224 | 0.3% |
| Eastern Asia | 157 | 0.2% |
| Eastern Europe | 28 | 0.0% |
| El Salvador | 102 | 0.1% |
| England | 89 | 0.1% |
| Ethiopia | 224 | 0.3% |
| Europe | 297 | 0.4% |
| France | 2 | 0.0% |
| Germany | 91 | 0.1% |
| Guatemala | 2 | 0.0% |
| India | 217 | 0.3% |
| Indonesia | 3 | 0.0% |
| Japan | 11 | 0.0% |
| Korea | 127 | 0.2% |
| Kuwait | 17 | 0.0% |
| Latin America | 532 | 0.7% |
| Mexico | 197 | 0.3% |
| Netherlands | 8 | 0.0% |
| Northern Europe | 168 | 0.2% |
| Pakistan | 98 | 0.1% |
| Peru | 39 | 0.1% |
| Philippines | 31 | 0.0% |
| South America | 230 | 0.3% |
| South Central Asia | 315 | 0.4% |
| South Eastern Asia | 120 | 0.2% |
| Thailand | 18 | 0.0% |
| Turkey | 8 | 0.0% |
| Ukraine | 28 | 0.0% |
| Venezuela | 57 | 0.1% |
| Vietnam | 32 | 0.0% |
| Western Asia | 25 | 0.0% |
| Western Europe | 101 | 0.1% | View All 41 Rows |
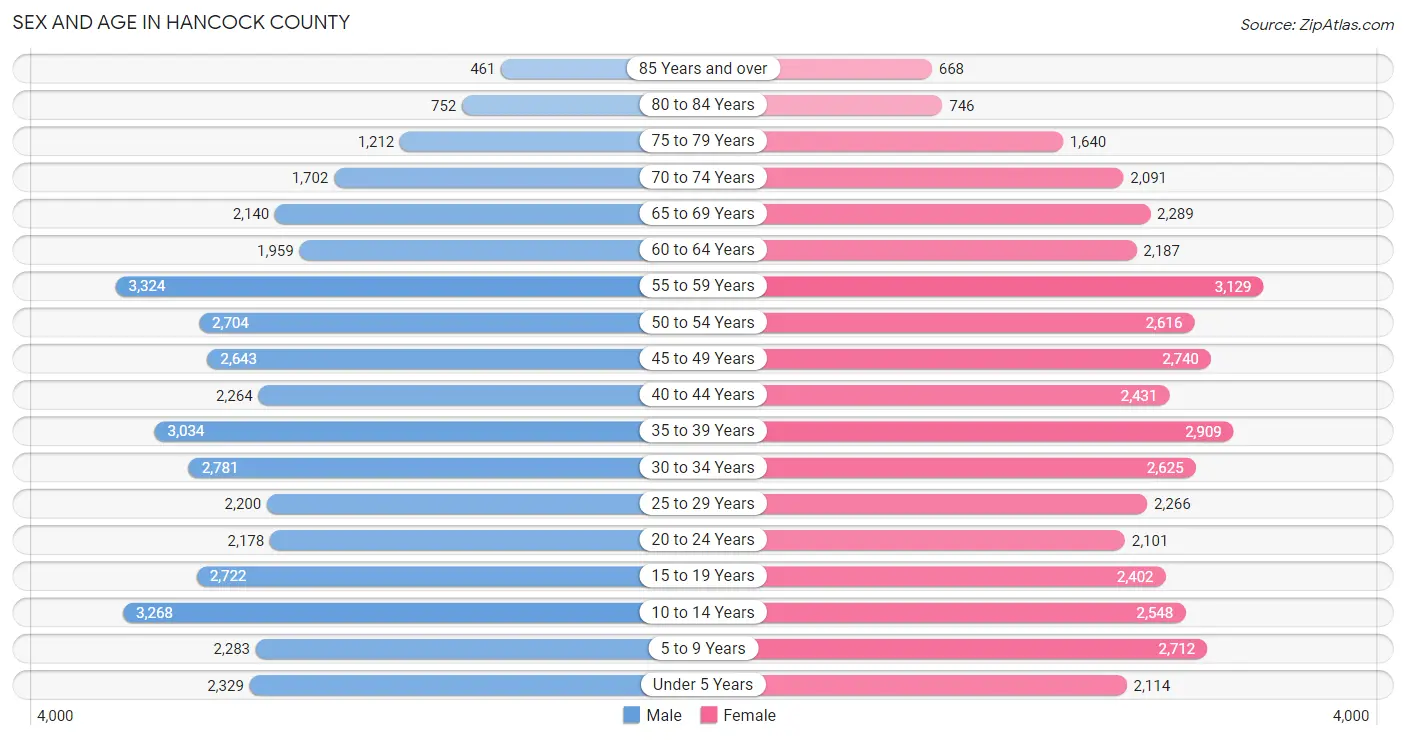
Sex and Age in Hancock County
Sex and Age in Hancock County
The most populous age groups in Hancock County are 55 to 59 Years (3,324 | 8.3%) for men and 55 to 59 Years (3,129 | 7.8%) for women.
| Age Bracket | Male | Female |
| Under 5 Years | 2,329 (5.8%) | 2,114 (5.3%) |
| 5 to 9 Years | 2,283 (5.7%) | 2,712 (6.7%) |
| 10 to 14 Years | 3,268 (8.2%) | 2,548 (6.3%) |
| 15 to 19 Years | 2,722 (6.8%) | 2,402 (6.0%) |
| 20 to 24 Years | 2,178 (5.4%) | 2,101 (5.2%) |
| 25 to 29 Years | 2,200 (5.5%) | 2,266 (5.6%) |
| 30 to 34 Years | 2,781 (7.0%) | 2,625 (6.5%) |
| 35 to 39 Years | 3,034 (7.6%) | 2,909 (7.2%) |
| 40 to 44 Years | 2,264 (5.7%) | 2,431 (6.0%) |
| 45 to 49 Years | 2,643 (6.6%) | 2,740 (6.8%) |
| 50 to 54 Years | 2,704 (6.8%) | 2,616 (6.5%) |
| 55 to 59 Years | 3,324 (8.3%) | 3,129 (7.8%) |
| 60 to 64 Years | 1,959 (4.9%) | 2,187 (5.4%) |
| 65 to 69 Years | 2,140 (5.4%) | 2,289 (5.7%) |
| 70 to 74 Years | 1,702 (4.3%) | 2,091 (5.2%) |
| 75 to 79 Years | 1,212 (3.0%) | 1,640 (4.1%) |
| 80 to 84 Years | 752 (1.9%) | 746 (1.9%) |
| 85 Years and over | 461 (1.1%) | 668 (1.7%) |
| Total | 39,956 (100.0%) | 40,214 (100.0%) |
Families and Households in Hancock County
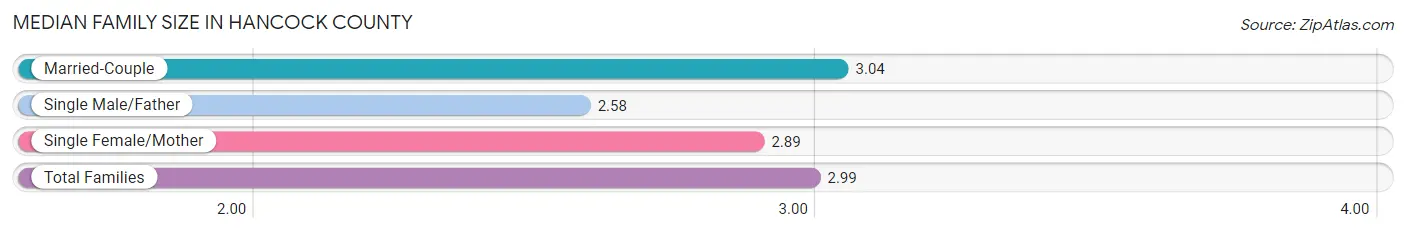
Median Family Size in Hancock County
The median family size in Hancock County is 2.99 persons per family, with married-couple families (18,291 | 82.4%) accounting for the largest median family size of 3.04 persons per family. On the other hand, single male/father families (1,705 | 7.7%) represent the smallest median family size with 2.58 persons per family.
| Family Type | # Families | Family Size |
| Married-Couple | 18,291 (82.4%) | 3.04 |
| Single Male/Father | 1,705 (7.7%) | 2.58 |
| Single Female/Mother | 2,211 (10.0%) | 2.89 |
| Total Families | 22,207 (100.0%) | 2.99 |
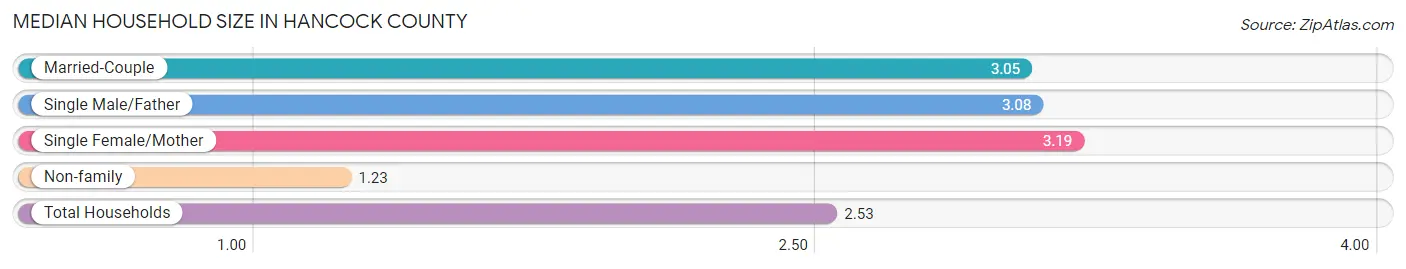
Median Household Size in Hancock County
The median household size in Hancock County is 2.53 persons per household, with single female/mother households (2,211 | 7.0%) accounting for the largest median household size of 3.19 persons per household. non-family households (9,217 | 29.3%) represent the smallest median household size with 1.23 persons per household.
| Household Type | # Households | Household Size |
| Married-Couple | 18,291 (58.2%) | 3.05 |
| Single Male/Father | 1,705 (5.4%) | 3.08 |
| Single Female/Mother | 2,211 (7.0%) | 3.19 |
| Non-family | 9,217 (29.3%) | 1.23 |
| Total Households | 31,424 (100.0%) | 2.53 |
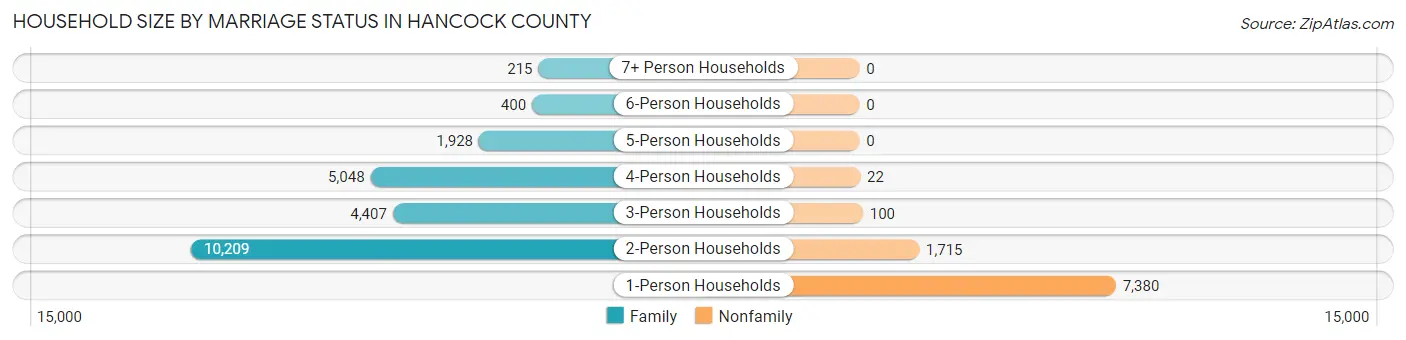
Household Size by Marriage Status in Hancock County
Out of a total of 31,424 households in Hancock County, 22,207 (70.7%) are family households, while 9,217 (29.3%) are nonfamily households. The most numerous type of family households are 2-person households, comprising 10,209, and the most common type of nonfamily households are 1-person households, comprising 7,380.
| Household Size | Family Households | Nonfamily Households |
| 1-Person Households | - | 7,380 (23.5%) |
| 2-Person Households | 10,209 (32.5%) | 1,715 (5.5%) |
| 3-Person Households | 4,407 (14.0%) | 100 (0.3%) |
| 4-Person Households | 5,048 (16.1%) | 22 (0.1%) |
| 5-Person Households | 1,928 (6.1%) | 0 (0.0%) |
| 6-Person Households | 400 (1.3%) | 0 (0.0%) |
| 7+ Person Households | 215 (0.7%) | 0 (0.0%) |
| Total | 22,207 (70.7%) | 9,217 (29.3%) |
Female Fertility in Hancock County
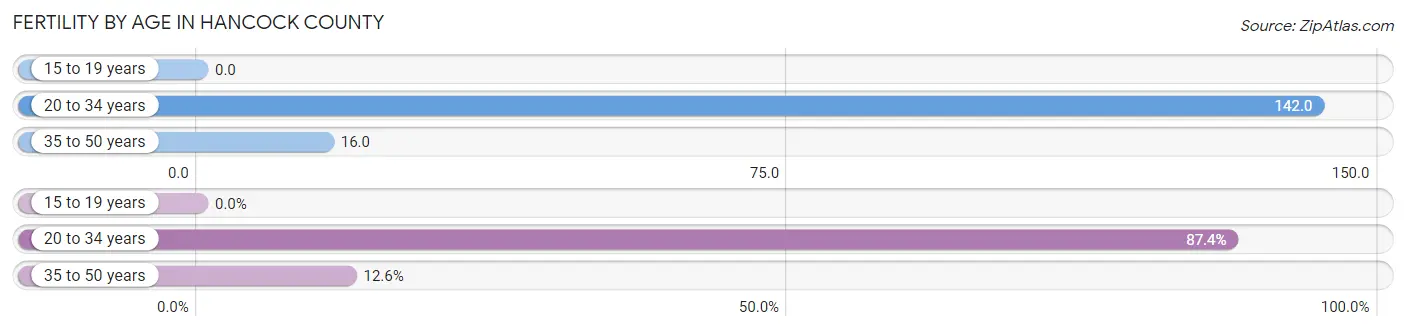
Fertility by Age in Hancock County
Average fertility rate in Hancock County is 63.0 births per 1,000 women. Women in the age bracket of 20 to 34 years have the highest fertility rate with 142.0 births per 1,000 women. Women in the age bracket of 20 to 34 years acount for 87.4% of all women with births.
| Age Bracket | Women with Births | Births / 1,000 Women |
| 15 to 19 years | 0 (0.0%) | 0.0 |
| 20 to 34 years | 992 (87.4%) | 142.0 |
| 35 to 50 years | 143 (12.6%) | 16.0 |
| Total | 1,135 (100.0%) | 63.0 |
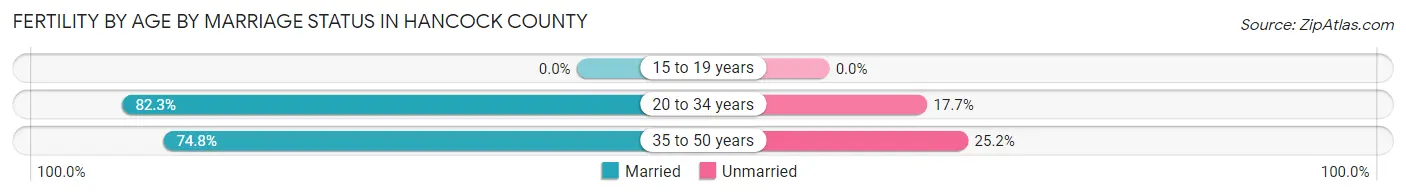
Fertility by Age by Marriage Status in Hancock County
81.3% of women with births (1,135) in Hancock County are married. The highest percentage of unmarried women with births falls into 35 to 50 years age bracket with 25.2% of them unmarried at the time of birth, while the lowest percentage of unmarried women with births belong to 20 to 34 years age bracket with 17.7% of them unmarried.
| Age Bracket | Married | Unmarried |
| 15 to 19 years | 0 (0.0%) | 0 (0.0%) |
| 20 to 34 years | 816 (82.3%) | 176 (17.7%) |
| 35 to 50 years | 107 (74.8%) | 36 (25.2%) |
| Total | 923 (81.3%) | 212 (18.7%) |
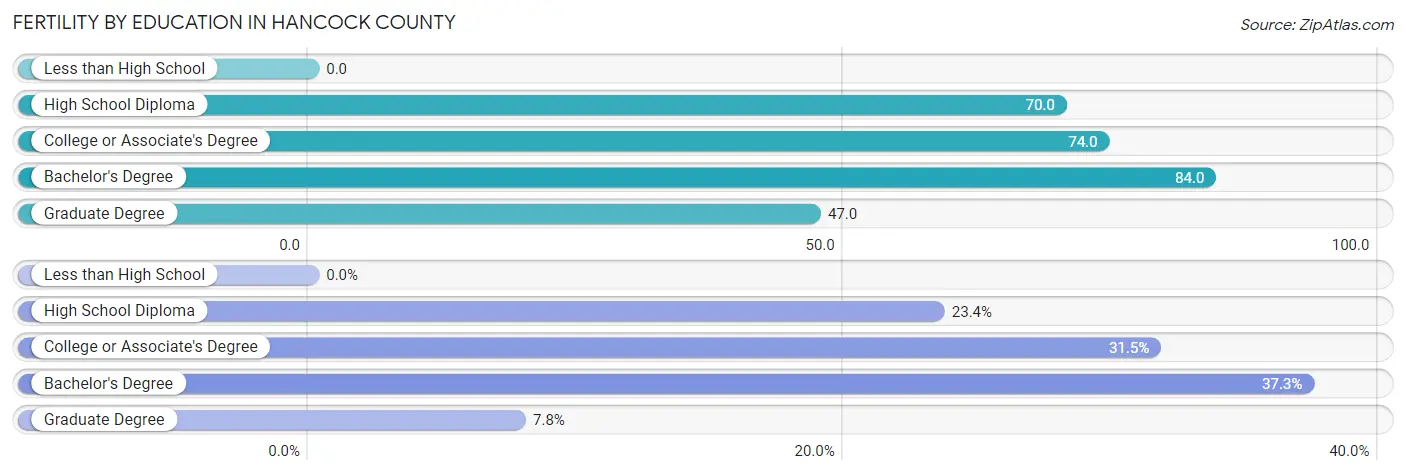
Fertility by Education in Hancock County
| Educational Attainment | Women with Births | Births / 1,000 Women |
| Less than High School | 0 (0.0%) | 0.0 |
| High School Diploma | 266 (23.4%) | 70.0 |
| College or Associate's Degree | 358 (31.5%) | 74.0 |
| Bachelor's Degree | 423 (37.3%) | 84.0 |
| Graduate Degree | 88 (7.7%) | 47.0 |
| Total | 1,135 (100.0%) | 63.0 |
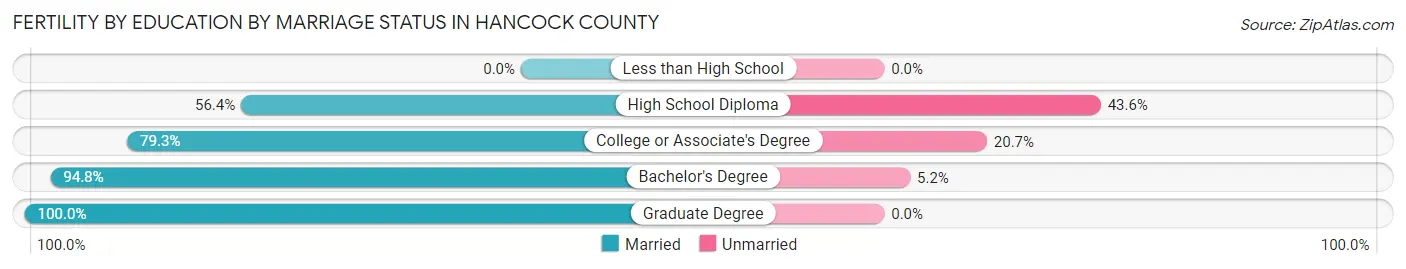
Fertility by Education by Marriage Status in Hancock County
18.7% of women with births in Hancock County are unmarried. Women with the educational attainment of graduate degree are most likely to be married with 100.0% of them married at childbirth, while women with the educational attainment of high school diploma are least likely to be married with 43.6% of them unmarried at childbirth.
| Educational Attainment | Married | Unmarried |
| Less than High School | 0 (0.0%) | 0 (0.0%) |
| High School Diploma | 150 (56.4%) | 116 (43.6%) |
| College or Associate's Degree | 284 (79.3%) | 74 (20.7%) |
| Bachelor's Degree | 401 (94.8%) | 22 (5.2%) |
| Graduate Degree | 88 (100.0%) | 0 (0.0%) |
| Total | 923 (81.3%) | 212 (18.7%) |
Income in Hancock County
Income Overview in Hancock County
Per Capita Income in Hancock County is $42,666, while median incomes of families and households are $103,458 and $85,262 respectively.
| Characteristic | Number | Measure |
| Per Capita Income | 80,170 | $42,666 |
| Median Family Income | 22,207 | $103,458 |
| Mean Family Income | 22,207 | $124,056 |
| Median Household Income | 31,424 | $85,262 |
| Mean Household Income | 31,424 | $106,434 |
| Income Deficit | 22,207 | $11,515 |
| Wage / Income Gap (%) | 80,170 | 32.85% |
| Wage / Income Gap ($) | 80,170 | 67.15¢ per $1 |
| Gini / Inequality Index | 80,170 | 0.39 |
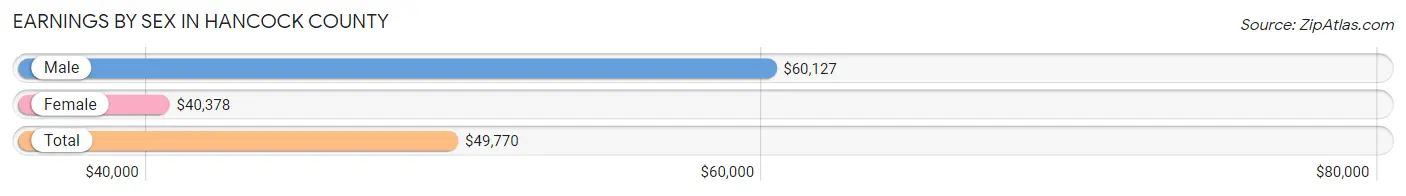
Earnings by Sex in Hancock County
Average Earnings in Hancock County are $49,770, $60,127 for men and $40,378 for women, a difference of 32.9%.
| Sex | Number | Average Earnings |
| Male | 24,305 (53.3%) | $60,127 |
| Female | 21,253 (46.7%) | $40,378 |
| Total | 45,558 (100.0%) | $49,770 |
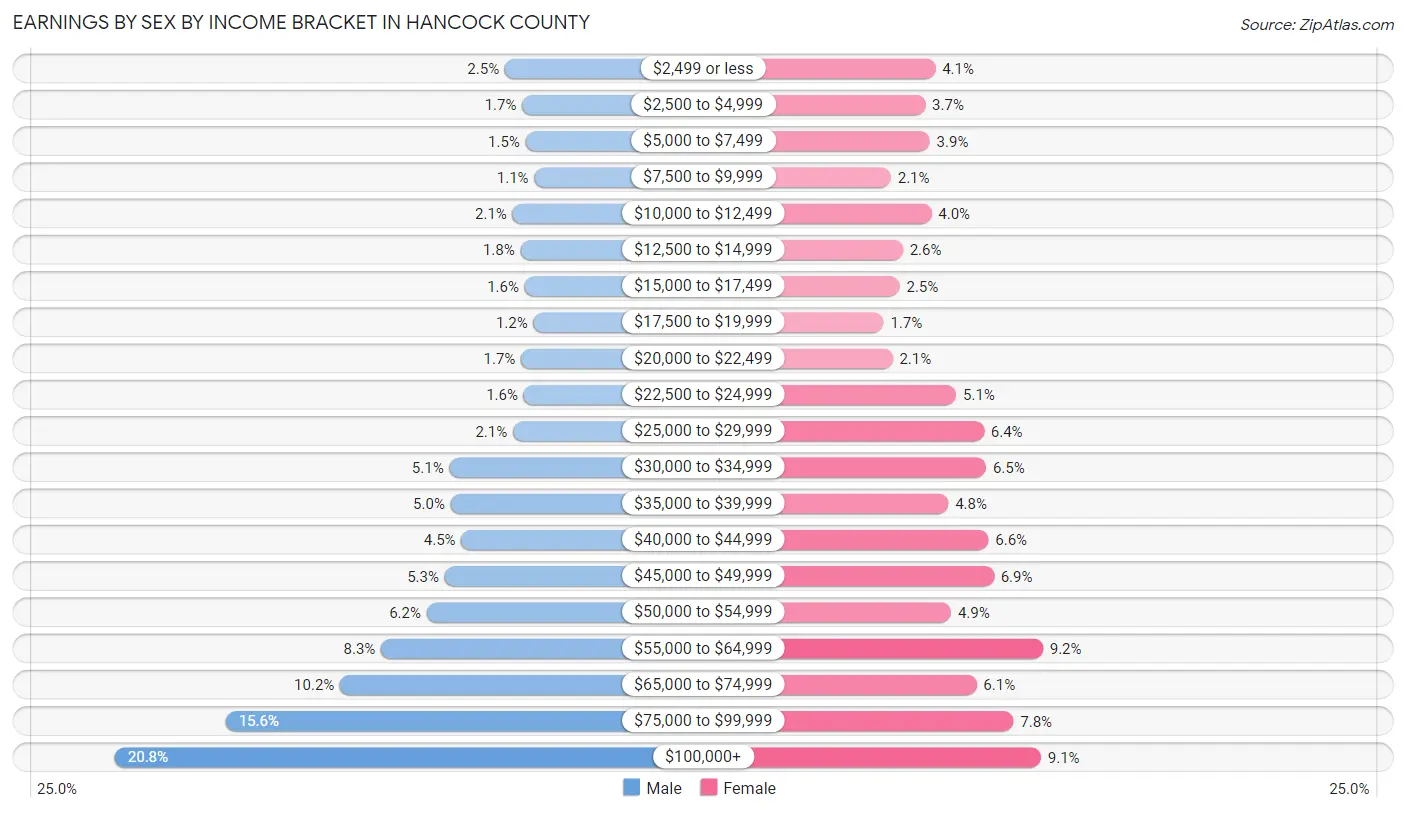
Earnings by Sex by Income Bracket in Hancock County
The most common earnings brackets in Hancock County are $100,000+ for men (5,048 | 20.8%) and $55,000 to $64,999 for women (1,950 | 9.2%).
| Income | Male | Female |
| $2,499 or less | 607 (2.5%) | 880 (4.1%) |
| $2,500 to $4,999 | 410 (1.7%) | 781 (3.7%) |
| $5,000 to $7,499 | 371 (1.5%) | 825 (3.9%) |
| $7,500 to $9,999 | 273 (1.1%) | 438 (2.1%) |
| $10,000 to $12,499 | 520 (2.1%) | 841 (4.0%) |
| $12,500 to $14,999 | 431 (1.8%) | 556 (2.6%) |
| $15,000 to $17,499 | 382 (1.6%) | 526 (2.5%) |
| $17,500 to $19,999 | 283 (1.2%) | 366 (1.7%) |
| $20,000 to $22,499 | 424 (1.7%) | 454 (2.1%) |
| $22,500 to $24,999 | 394 (1.6%) | 1,088 (5.1%) |
| $25,000 to $29,999 | 516 (2.1%) | 1,365 (6.4%) |
| $30,000 to $34,999 | 1,240 (5.1%) | 1,385 (6.5%) |
| $35,000 to $39,999 | 1,226 (5.0%) | 1,009 (4.8%) |
| $40,000 to $44,999 | 1,103 (4.5%) | 1,410 (6.6%) |
| $45,000 to $49,999 | 1,294 (5.3%) | 1,463 (6.9%) |
| $50,000 to $54,999 | 1,497 (6.2%) | 1,037 (4.9%) |
| $55,000 to $64,999 | 2,017 (8.3%) | 1,950 (9.2%) |
| $65,000 to $74,999 | 2,483 (10.2%) | 1,289 (6.1%) |
| $75,000 to $99,999 | 3,786 (15.6%) | 1,658 (7.8%) |
| $100,000+ | 5,048 (20.8%) | 1,932 (9.1%) |
| Total | 24,305 (100.0%) | 21,253 (100.0%) |
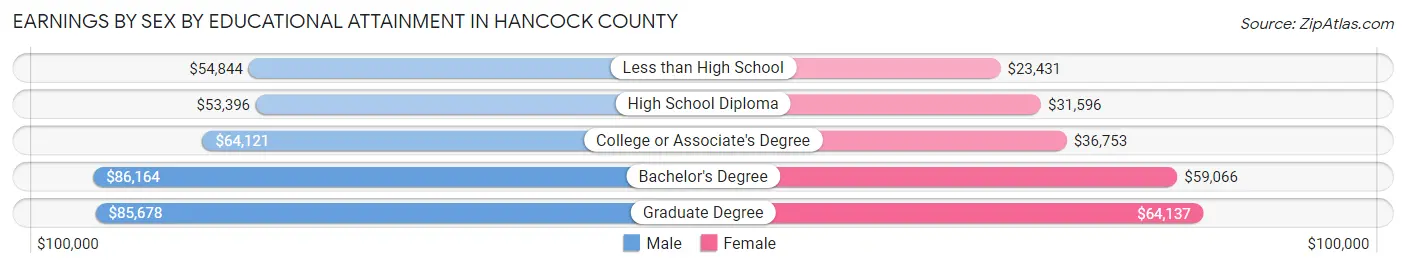
Earnings by Sex by Educational Attainment in Hancock County
Average earnings in Hancock County are $67,067 for men and $45,319 for women, a difference of 32.4%. Men with an educational attainment of bachelor's degree enjoy the highest average annual earnings of $86,164, while those with high school diploma education earn the least with $53,396. Women with an educational attainment of graduate degree earn the most with the average annual earnings of $64,137, while those with less than high school education have the smallest earnings of $23,431.
| Educational Attainment | Male Income | Female Income |
| Less than High School | $54,844 | $23,431 |
| High School Diploma | $53,396 | $31,596 |
| College or Associate's Degree | $64,121 | $36,753 |
| Bachelor's Degree | $86,164 | $59,066 |
| Graduate Degree | $85,678 | $64,137 |
| Total | $67,067 | $45,319 |
Family Income in Hancock County
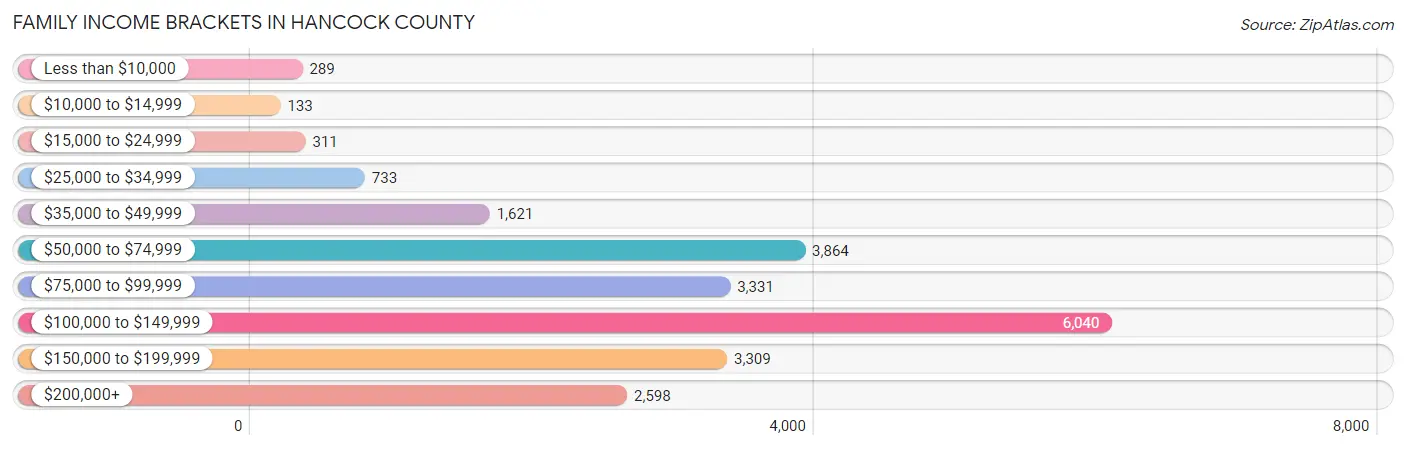
Family Income Brackets in Hancock County
According to the Hancock County family income data, there are 6,040 families falling into the $100,000 to $149,999 income range, which is the most common income bracket and makes up 27.2% of all families. Conversely, the $10,000 to $14,999 income bracket is the least frequent group with only 133 families (0.6%) belonging to this category.
| Income Bracket | # Families | % Families |
| Less than $10,000 | 289 | 1.3% |
| $10,000 to $14,999 | 133 | 0.6% |
| $15,000 to $24,999 | 311 | 1.4% |
| $25,000 to $34,999 | 733 | 3.3% |
| $35,000 to $49,999 | 1,621 | 7.3% |
| $50,000 to $74,999 | 3,864 | 17.4% |
| $75,000 to $99,999 | 3,331 | 15.0% |
| $100,000 to $149,999 | 6,040 | 27.2% |
| $150,000 to $199,999 | 3,309 | 14.9% |
| $200,000+ | 2,598 | 11.7% |
Family Income by Famaliy Size in Hancock County
7+ person families (162 | 0.7%) account for the highest median family income in Hancock County with $142,849 per family, while 2-person families (10,917 | 49.2%) have the highest median income of $43,491 per family member.
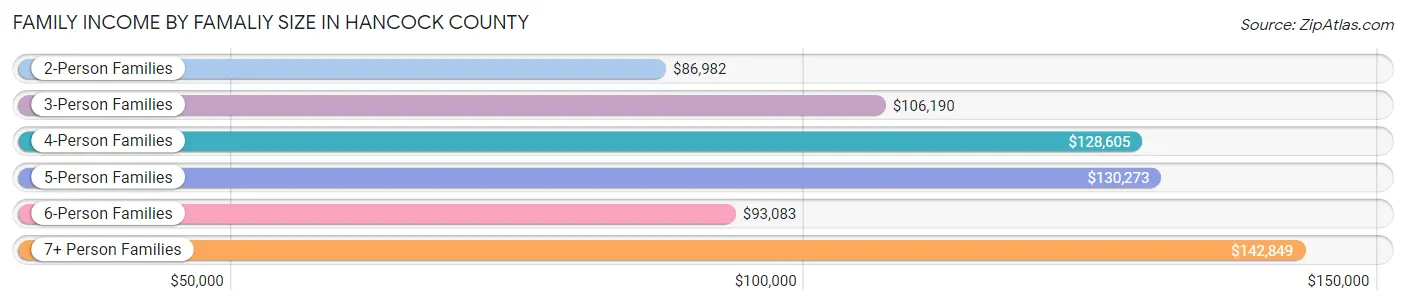
| Income Bracket | # Families | Median Income |
| 2-Person Families | 10,917 (49.2%) | $86,982 |
| 3-Person Families | 4,220 (19.0%) | $106,190 |
| 4-Person Families | 4,719 (21.2%) | $128,605 |
| 5-Person Families | 1,832 (8.3%) | $130,273 |
| 6-Person Families | 357 (1.6%) | $93,083 |
| 7+ Person Families | 162 (0.7%) | $142,849 |
| Total | 22,207 (100.0%) | $103,458 |
Family Income by Number of Earners in Hancock County
The median family income in Hancock County is $103,458, with families comprising 3+ earners (2,648) having the highest median family income of $155,000, while families with no earners (2,949) have the lowest median family income of $67,301, accounting for 11.9% and 13.3% of families, respectively.
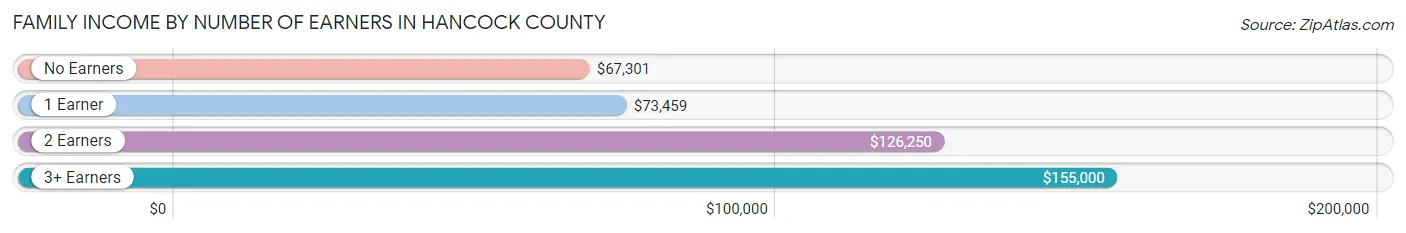
| Number of Earners | # Families | Median Income |
| No Earners | 2,949 (13.3%) | $67,301 |
| 1 Earner | 5,749 (25.9%) | $73,459 |
| 2 Earners | 10,861 (48.9%) | $126,250 |
| 3+ Earners | 2,648 (11.9%) | $155,000 |
| Total | 22,207 (100.0%) | $103,458 |
Household Income in Hancock County
Household Income Brackets in Hancock County
With 7,165 households falling in the category, the $100,000 to $149,999 income range is the most frequent in Hancock County, accounting for 22.8% of all households. In contrast, only 597 households (1.9%) fall into the $10,000 to $14,999 income bracket, making it the least populous group.
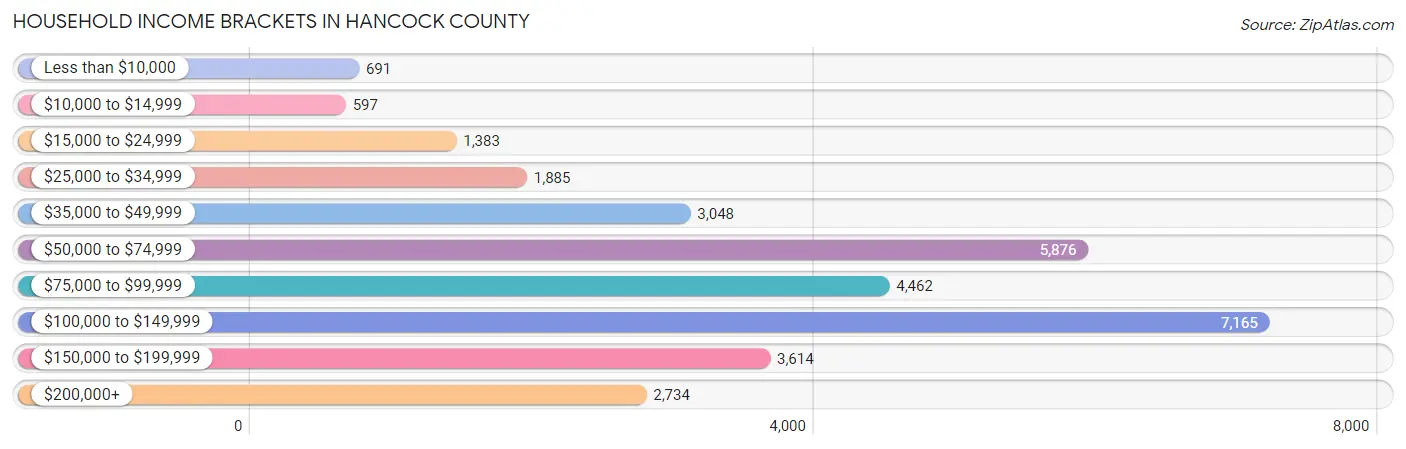
| Income Bracket | # Households | % Households |
| Less than $10,000 | 691 | 2.2% |
| $10,000 to $14,999 | 597 | 1.9% |
| $15,000 to $24,999 | 1,383 | 4.4% |
| $25,000 to $34,999 | 1,885 | 6.0% |
| $35,000 to $49,999 | 3,048 | 9.7% |
| $50,000 to $74,999 | 5,876 | 18.7% |
| $75,000 to $99,999 | 4,462 | 14.2% |
| $100,000 to $149,999 | 7,165 | 22.8% |
| $150,000 to $199,999 | 3,614 | 11.5% |
| $200,000+ | 2,734 | 8.7% |
Household Income by Householder Age in Hancock County
The median household income in Hancock County is $85,262, with the highest median household income of $102,490 found in the 45 to 64 years age bracket for the primary householder. A total of 11,845 households (37.7%) fall into this category. Meanwhile, the 65+ years age bracket for the primary householder has the lowest median household income of $57,195, with 8,614 households (27.4%) in this group.
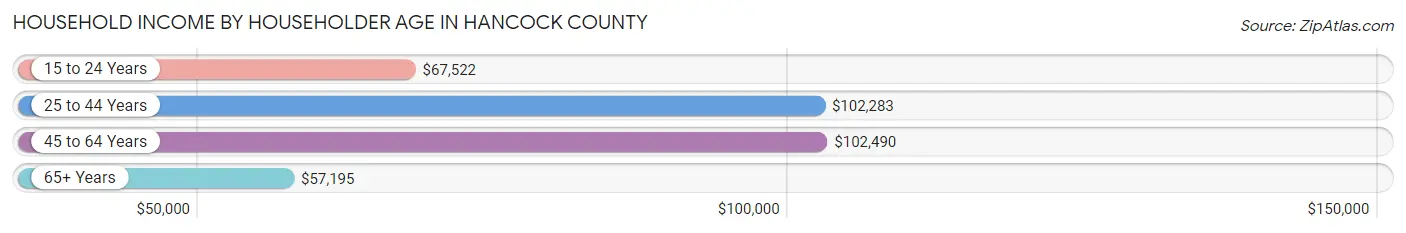
| Income Bracket | # Households | Median Income |
| 15 to 24 Years | 891 (2.8%) | $67,522 |
| 25 to 44 Years | 10,074 (32.1%) | $102,283 |
| 45 to 64 Years | 11,845 (37.7%) | $102,490 |
| 65+ Years | 8,614 (27.4%) | $57,195 |
| Total | 31,424 (100.0%) | $85,262 |
Poverty in Hancock County
Income Below Poverty by Sex and Age in Hancock County
With 3.8% poverty level for males and 6.0% for females among the residents of Hancock County, 18 to 24 year old males and 15 year old females are the most vulnerable to poverty, with 247 males (7.8%) and 69 females (16.3%) in their respective age groups living below the poverty level.
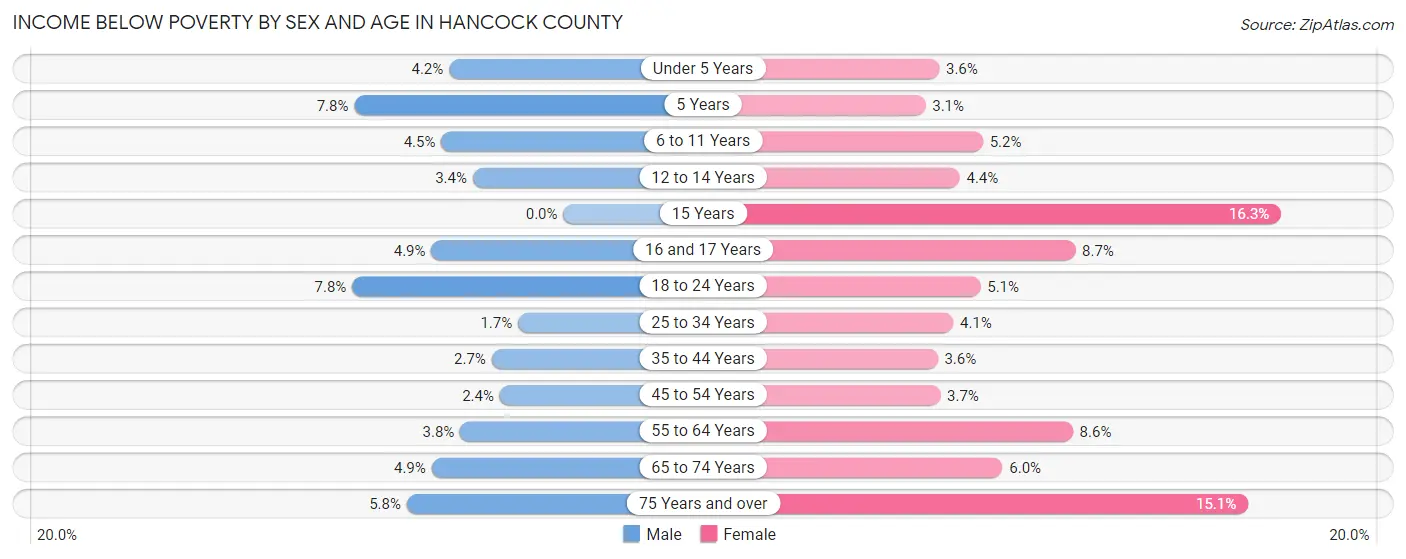
| Age Bracket | Male | Female |
| Under 5 Years | 97 (4.2%) | 76 (3.6%) |
| 5 Years | 38 (7.8%) | 13 (3.1%) |
| 6 to 11 Years | 145 (4.5%) | 175 (5.2%) |
| 12 to 14 Years | 58 (3.4%) | 62 (4.4%) |
| 15 Years | 0 (0.0%) | 69 (16.3%) |
| 16 and 17 Years | 54 (4.9%) | 97 (8.7%) |
| 18 to 24 Years | 247 (7.8%) | 152 (5.1%) |
| 25 to 34 Years | 83 (1.7%) | 201 (4.1%) |
| 35 to 44 Years | 140 (2.7%) | 189 (3.5%) |
| 45 to 54 Years | 125 (2.4%) | 195 (3.6%) |
| 55 to 64 Years | 201 (3.8%) | 449 (8.6%) |
| 65 to 74 Years | 185 (4.9%) | 256 (6.0%) |
| 75 Years and over | 135 (5.8%) | 447 (15.1%) |
| Total | 1,508 (3.8%) | 2,381 (6.0%) |
Income Above Poverty by Sex and Age in Hancock County
According to the poverty statistics in Hancock County, males aged 15 years and females aged 5 years are the age groups that are most secure financially, with 100.0% of males and 96.9% of females in these age groups living above the poverty line.
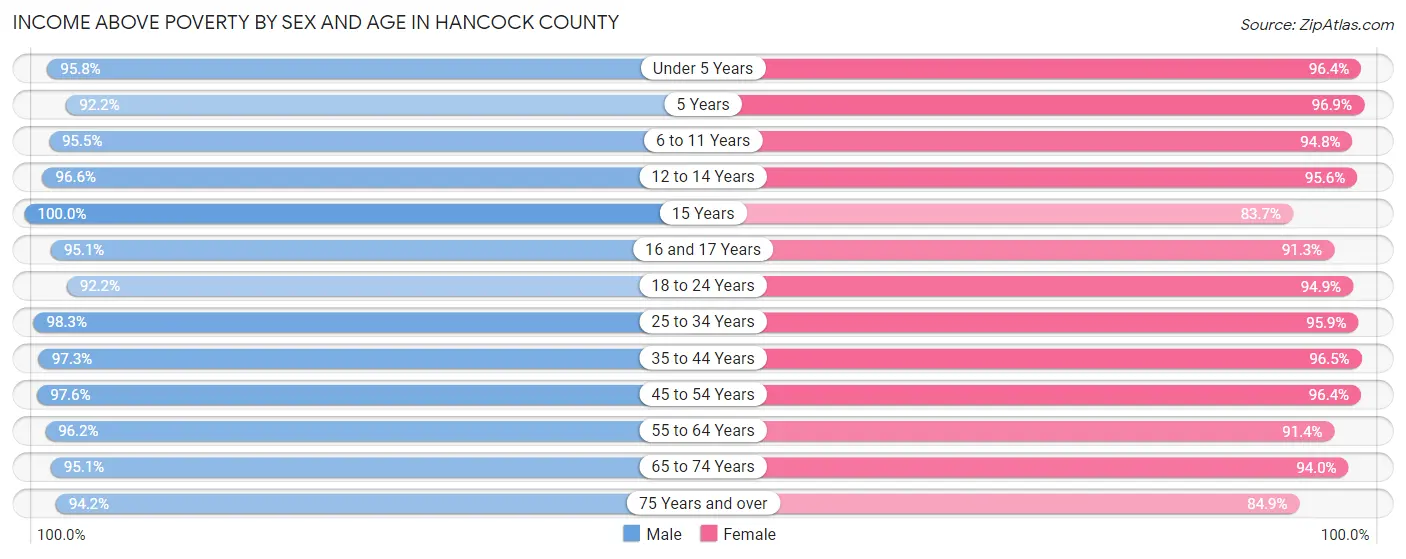
| Age Bracket | Male | Female |
| Under 5 Years | 2,189 (95.8%) | 2,030 (96.4%) |
| 5 Years | 452 (92.2%) | 407 (96.9%) |
| 6 to 11 Years | 3,054 (95.5%) | 3,170 (94.8%) |
| 12 to 14 Years | 1,667 (96.6%) | 1,356 (95.6%) |
| 15 Years | 645 (100.0%) | 354 (83.7%) |
| 16 and 17 Years | 1,047 (95.1%) | 1,023 (91.3%) |
| 18 to 24 Years | 2,905 (92.2%) | 2,808 (94.9%) |
| 25 to 34 Years | 4,859 (98.3%) | 4,665 (95.9%) |
| 35 to 44 Years | 5,125 (97.3%) | 5,140 (96.5%) |
| 45 to 54 Years | 5,172 (97.6%) | 5,152 (96.4%) |
| 55 to 64 Years | 5,042 (96.2%) | 4,788 (91.4%) |
| 65 to 74 Years | 3,595 (95.1%) | 4,042 (94.0%) |
| 75 Years and over | 2,189 (94.2%) | 2,517 (84.9%) |
| Total | 37,941 (96.2%) | 37,452 (94.0%) |
Income Below Poverty Among Married-Couple Families in Hancock County
The poverty statistics for married-couple families in Hancock County show that 1.5% or 270 of the total 18,291 families live below the poverty line. Families with 5 or more children have the highest poverty rate of 9.3%, comprising of 10 families. On the other hand, families with 1 or 2 children have the lowest poverty rate of 0.7%, which includes 46 families.
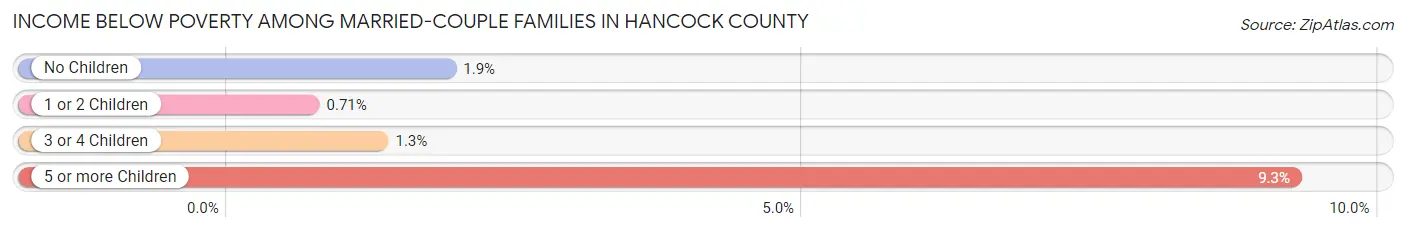
| Children | Above Poverty | Below Poverty |
| No Children | 10,235 (98.1%) | 198 (1.9%) |
| 1 or 2 Children | 6,478 (99.3%) | 46 (0.7%) |
| 3 or 4 Children | 1,210 (98.7%) | 16 (1.3%) |
| 5 or more Children | 98 (90.7%) | 10 (9.3%) |
| Total | 18,021 (98.5%) | 270 (1.5%) |
Income Below Poverty Among Single-Parent Households in Hancock County
According to the poverty data in Hancock County, 4.7% or 80 single-father households and 12.6% or 279 single-mother households are living below the poverty line. Among single-father households, those with 3 or 4 children have the highest poverty rate, with 18 households (14.6%) experiencing poverty. Likewise, among single-mother households, those with 3 or 4 children have the highest poverty rate, with 72 households (41.1%) falling below the poverty line.
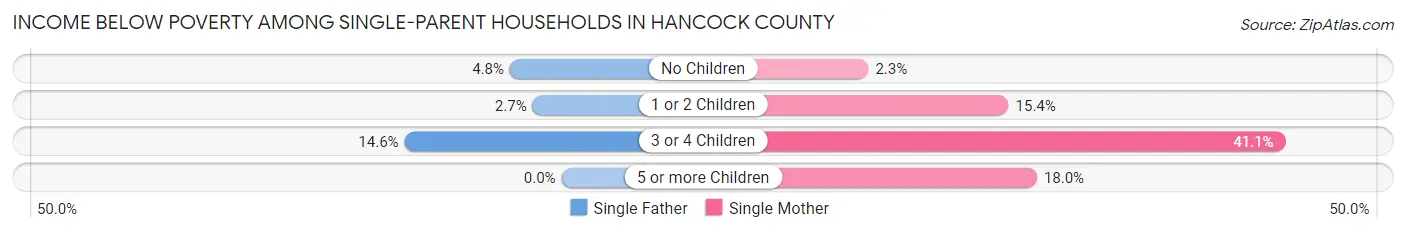
| Children | Single Father | Single Mother |
| No Children | 44 (4.8%) | 19 (2.3%) |
| 1 or 2 Children | 18 (2.7%) | 179 (15.4%) |
| 3 or 4 Children | 18 (14.6%) | 72 (41.1%) |
| 5 or more Children | 0 (0.0%) | 9 (18.0%) |
| Total | 80 (4.7%) | 279 (12.6%) |
Income Below Poverty Among Married-Couple vs Single-Parent Households in Hancock County
The poverty data for Hancock County shows that 270 of the married-couple family households (1.5%) and 359 of the single-parent households (9.2%) are living below the poverty level. Within the married-couple family households, those with 5 or more children have the highest poverty rate, with 10 households (9.3%) falling below the poverty line. Among the single-parent households, those with 3 or 4 children have the highest poverty rate, with 90 household (30.2%) living below poverty.
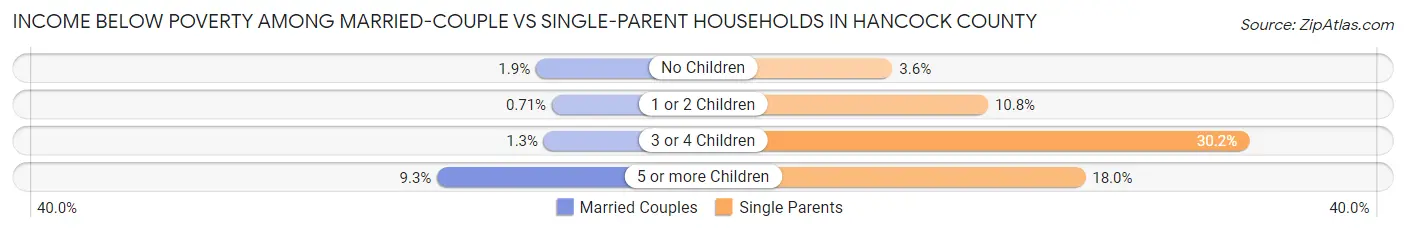
| Children | Married-Couple Families | Single-Parent Households |
| No Children | 198 (1.9%) | 63 (3.6%) |
| 1 or 2 Children | 46 (0.7%) | 197 (10.7%) |
| 3 or 4 Children | 16 (1.3%) | 90 (30.2%) |
| 5 or more Children | 10 (9.3%) | 9 (18.0%) |
| Total | 270 (1.5%) | 359 (9.2%) |
Employment Characteristics in Hancock County
Employment by Class of Employer in Hancock County
Among the 41,586 employed individuals in Hancock County, private company employees (29,607 | 71.2%), not-for-profit organizations (3,292 | 7.9%), and local government employees (3,104 | 7.5%) make up the most common classes of employment.
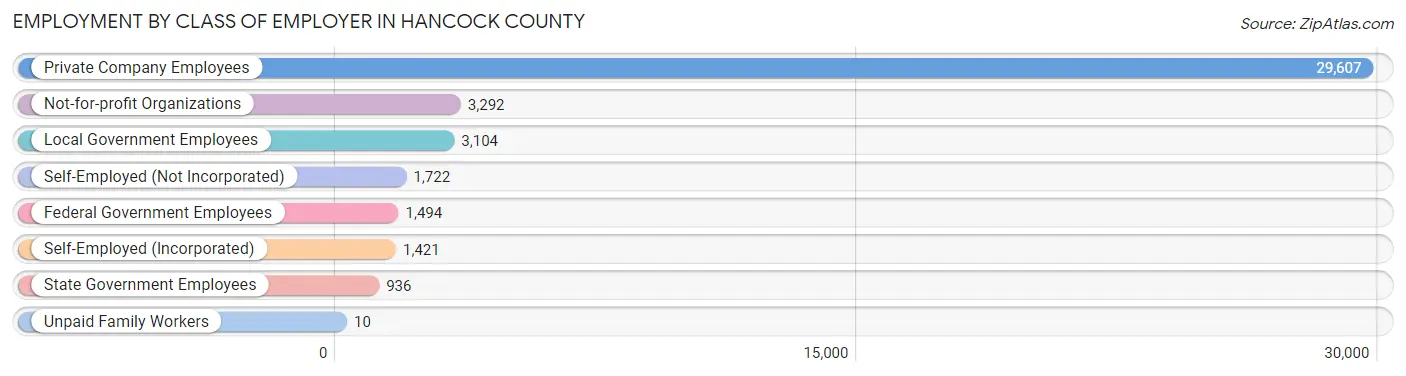
| Employer Class | # Employees | % Employees |
| Private Company Employees | 29,607 | 71.2% |
| Self-Employed (Incorporated) | 1,421 | 3.4% |
| Self-Employed (Not Incorporated) | 1,722 | 4.1% |
| Not-for-profit Organizations | 3,292 | 7.9% |
| Local Government Employees | 3,104 | 7.5% |
| State Government Employees | 936 | 2.2% |
| Federal Government Employees | 1,494 | 3.6% |
| Unpaid Family Workers | 10 | 0.0% |
| Total | 41,586 | 100.0% |
Employment Status by Age in Hancock County
According to the labor force statistics for Hancock County, out of the total population over 16 years of age (63,848), 68.2% or 43,544 individuals are in the labor force, with 2.7% or 1,176 of them unemployed. The age group with the highest labor force participation rate is 35 to 44 years, with 91.2% or 9,702 individuals in the labor force. Within the labor force, the 16 to 19 years age range has the highest percentage of unemployed individuals, with 10.3% or 224 of them being unemployed.
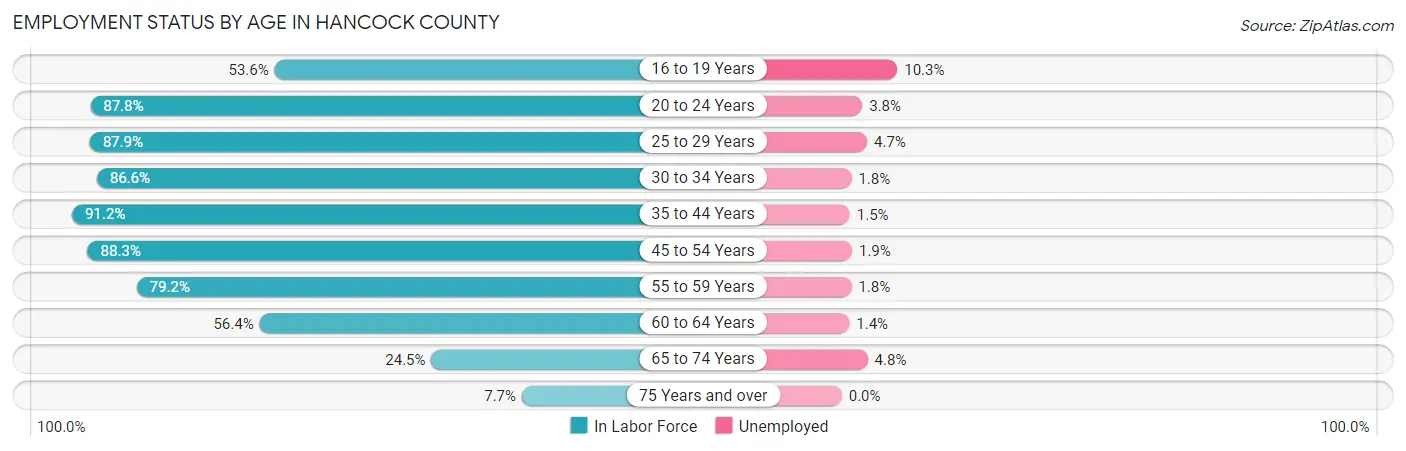
| Age Bracket | In Labor Force | Unemployed |
| 16 to 19 Years | 2,174 (53.6%) | 224 (10.3%) |
| 20 to 24 Years | 3,757 (87.8%) | 143 (3.8%) |
| 25 to 29 Years | 3,926 (87.9%) | 185 (4.7%) |
| 30 to 34 Years | 4,682 (86.6%) | 84 (1.8%) |
| 35 to 44 Years | 9,702 (91.2%) | 146 (1.5%) |
| 45 to 54 Years | 9,451 (88.3%) | 180 (1.9%) |
| 55 to 59 Years | 5,111 (79.2%) | 92 (1.8%) |
| 60 to 64 Years | 2,338 (56.4%) | 33 (1.4%) |
| 65 to 74 Years | 2,014 (24.5%) | 97 (4.8%) |
| 75 Years and over | 422 (7.7%) | 0 (0.0%) |
| Total | 43,544 (68.2%) | 1,176 (2.7%) |
Employment Status by Educational Attainment in Hancock County
According to labor force statistics for Hancock County, 84.2% of individuals (35,206) out of the total population between 25 and 64 years of age (41,812) are in the labor force, with 2.0% or 704 of them being unemployed. The group with the highest labor force participation rate are those with the educational attainment of bachelor's degree or higher, with 90.4% or 13,525 individuals in the labor force. Within the labor force, individuals with high school diploma education have the highest percentage of unemployment, with 3.3% or 294 of them being unemployed.
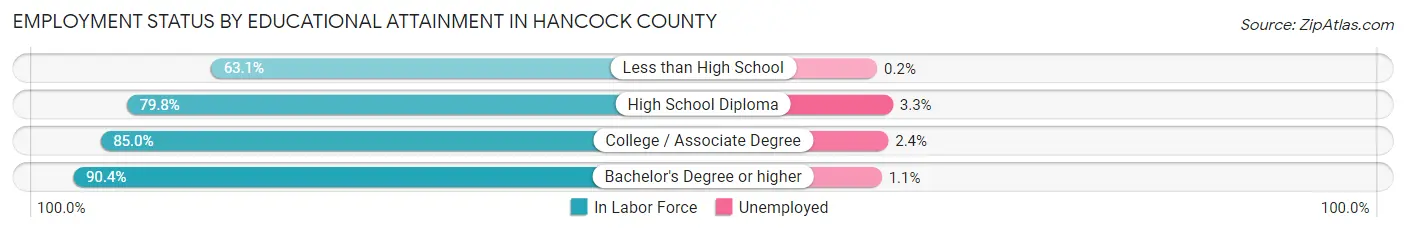
| Educational Attainment | In Labor Force | Unemployed |
| Less than High School | 1,613 (63.1%) | 5 (0.2%) |
| High School Diploma | 8,912 (79.8%) | 369 (3.3%) |
| College / Associate Degree | 11,157 (85.0%) | 315 (2.4%) |
| Bachelor's Degree or higher | 13,525 (90.4%) | 165 (1.1%) |
| Total | 35,206 (84.2%) | 836 (2.0%) |
Employment Occupations by Sex in Hancock County
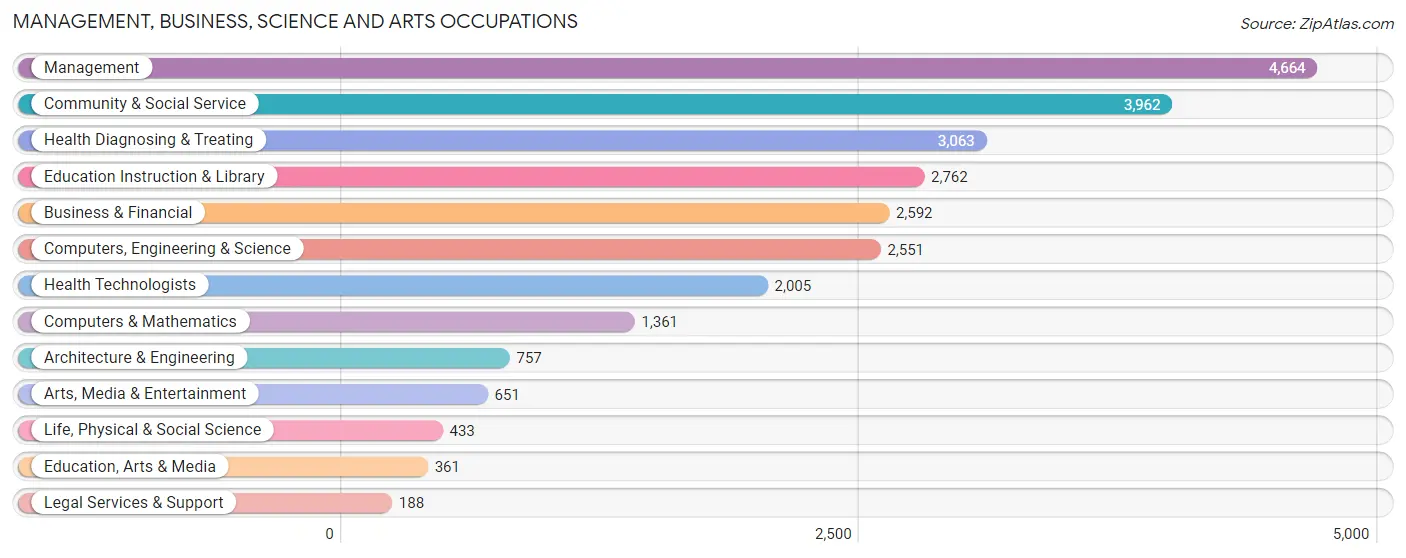
Management, Business, Science and Arts Occupations
The most common Management, Business, Science and Arts occupations in Hancock County are Management (4,664 | 11.1%), Community & Social Service (3,962 | 9.4%), Health Diagnosing & Treating (3,063 | 7.3%), Education Instruction & Library (2,762 | 6.6%), and Business & Financial (2,592 | 6.2%).
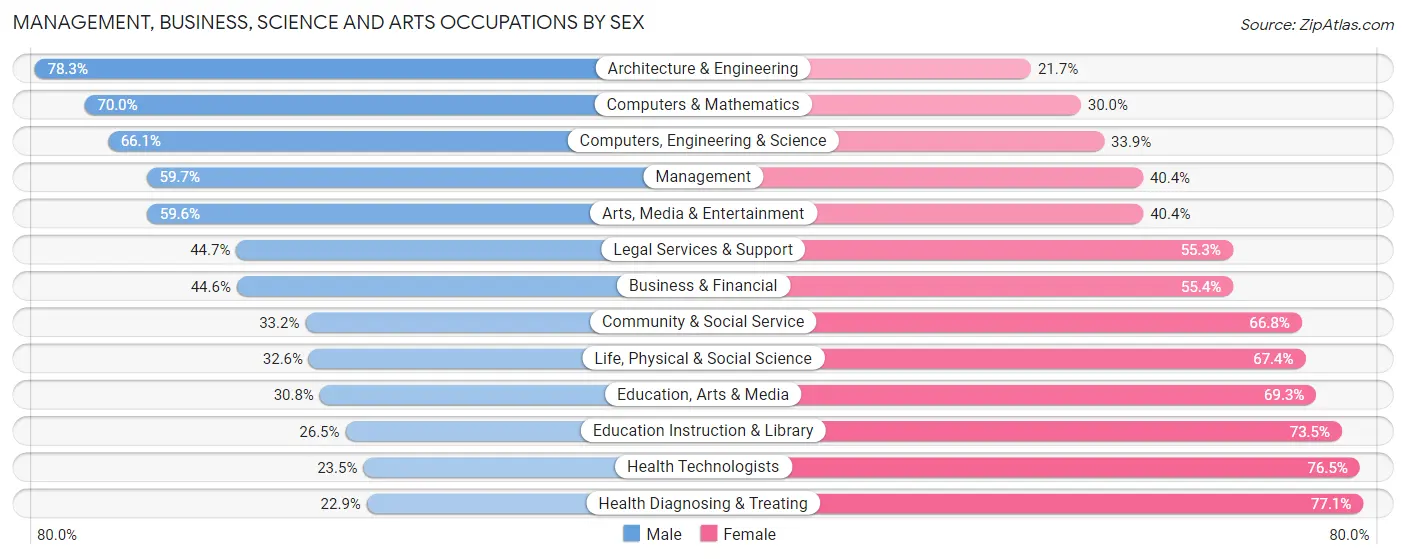
Management, Business, Science and Arts Occupations by Sex
Within the Management, Business, Science and Arts occupations in Hancock County, the most male-oriented occupations are Architecture & Engineering (78.3%), Computers & Mathematics (70.0%), and Computers, Engineering & Science (66.1%), while the most female-oriented occupations are Health Diagnosing & Treating (77.1%), Health Technologists (76.5%), and Education Instruction & Library (73.5%).
| Occupation | Male | Female |
| Management | 2,782 (59.7%) | 1,882 (40.4%) |
| Business & Financial | 1,156 (44.6%) | 1,436 (55.4%) |
| Computers, Engineering & Science | 1,687 (66.1%) | 864 (33.9%) |
| Computers & Mathematics | 953 (70.0%) | 408 (30.0%) |
| Architecture & Engineering | 593 (78.3%) | 164 (21.7%) |
| Life, Physical & Social Science | 141 (32.6%) | 292 (67.4%) |
| Community & Social Service | 1,314 (33.2%) | 2,648 (66.8%) |
| Education, Arts & Media | 111 (30.7%) | 250 (69.3%) |
| Legal Services & Support | 84 (44.7%) | 104 (55.3%) |
| Education Instruction & Library | 731 (26.5%) | 2,031 (73.5%) |
| Arts, Media & Entertainment | 388 (59.6%) | 263 (40.4%) |
| Health Diagnosing & Treating | 702 (22.9%) | 2,361 (77.1%) |
| Health Technologists | 471 (23.5%) | 1,534 (76.5%) |
| Total (Category) | 7,641 (45.4%) | 9,191 (54.6%) |
| Total (Overall) | 22,407 (53.2%) | 19,691 (46.8%) |
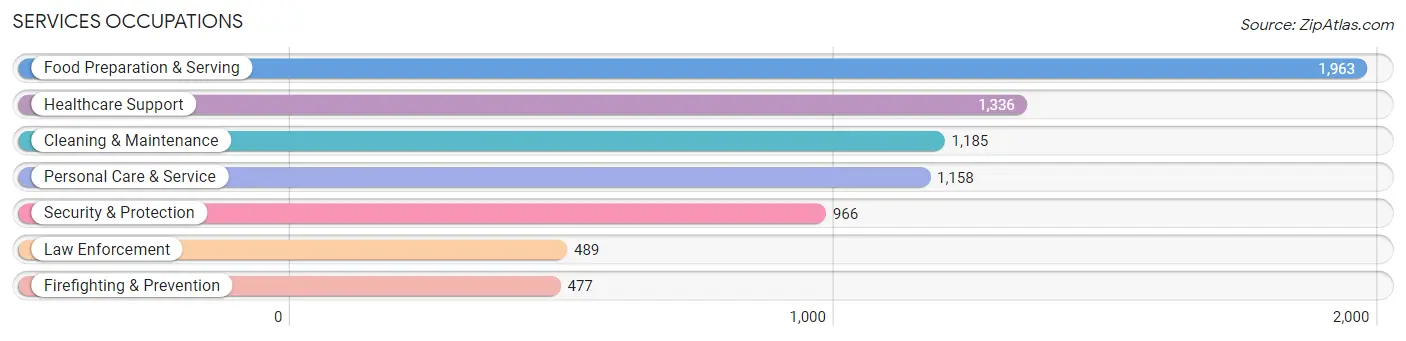
Services Occupations
The most common Services occupations in Hancock County are Food Preparation & Serving (1,963 | 4.7%), Healthcare Support (1,336 | 3.2%), Cleaning & Maintenance (1,185 | 2.8%), Personal Care & Service (1,158 | 2.8%), and Security & Protection (966 | 2.3%).
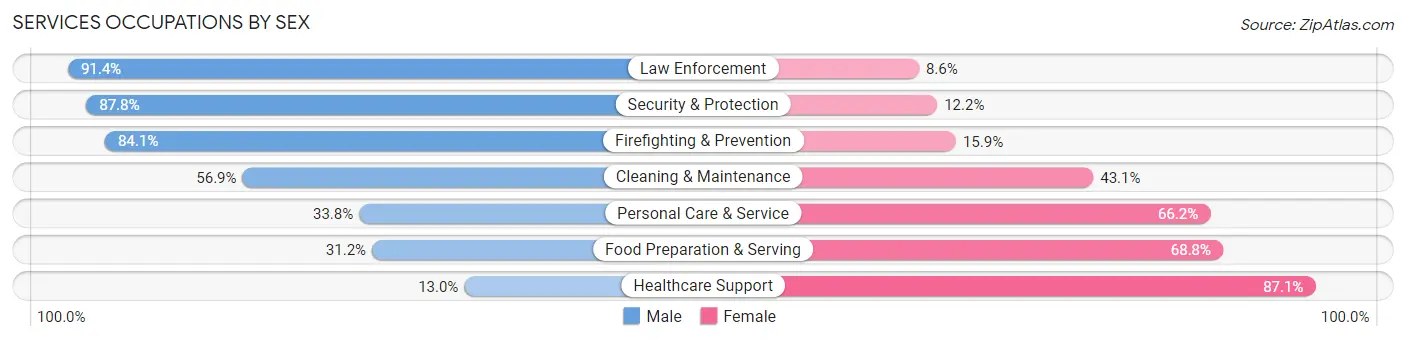
Services Occupations by Sex
Within the Services occupations in Hancock County, the most male-oriented occupations are Law Enforcement (91.4%), Security & Protection (87.8%), and Firefighting & Prevention (84.1%), while the most female-oriented occupations are Healthcare Support (87.1%), Food Preparation & Serving (68.8%), and Personal Care & Service (66.2%).
| Occupation | Male | Female |
| Healthcare Support | 173 (13.0%) | 1,163 (87.1%) |
| Security & Protection | 848 (87.8%) | 118 (12.2%) |
| Firefighting & Prevention | 401 (84.1%) | 76 (15.9%) |
| Law Enforcement | 447 (91.4%) | 42 (8.6%) |
| Food Preparation & Serving | 613 (31.2%) | 1,350 (68.8%) |
| Cleaning & Maintenance | 674 (56.9%) | 511 (43.1%) |
| Personal Care & Service | 391 (33.8%) | 767 (66.2%) |
| Total (Category) | 2,699 (40.8%) | 3,909 (59.2%) |
| Total (Overall) | 22,407 (53.2%) | 19,691 (46.8%) |
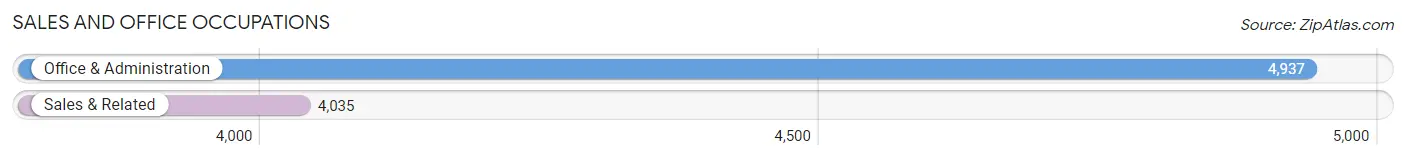
Sales and Office Occupations
The most common Sales and Office occupations in Hancock County are Office & Administration (4,937 | 11.7%), and Sales & Related (4,035 | 9.6%).
Sales and Office Occupations by Sex
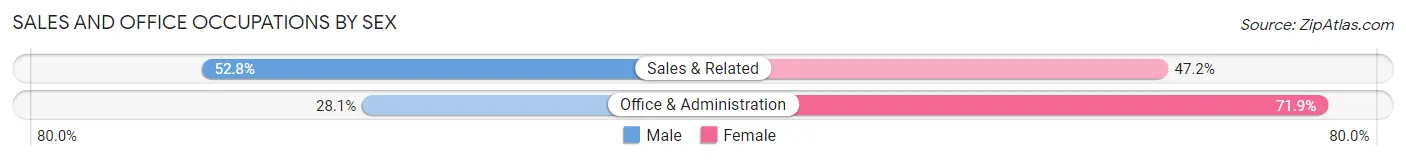
| Occupation | Male | Female |
| Sales & Related | 2,129 (52.8%) | 1,906 (47.2%) |
| Office & Administration | 1,387 (28.1%) | 3,550 (71.9%) |
| Total (Category) | 3,516 (39.2%) | 5,456 (60.8%) |
| Total (Overall) | 22,407 (53.2%) | 19,691 (46.8%) |
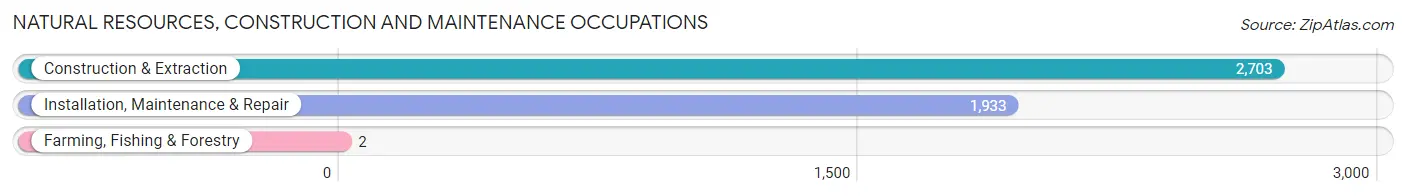
Natural Resources, Construction and Maintenance Occupations
The most common Natural Resources, Construction and Maintenance occupations in Hancock County are Construction & Extraction (2,703 | 6.4%), Installation, Maintenance & Repair (1,933 | 4.6%), and Farming, Fishing & Forestry (2 | 0.0%).
Natural Resources, Construction and Maintenance Occupations by Sex
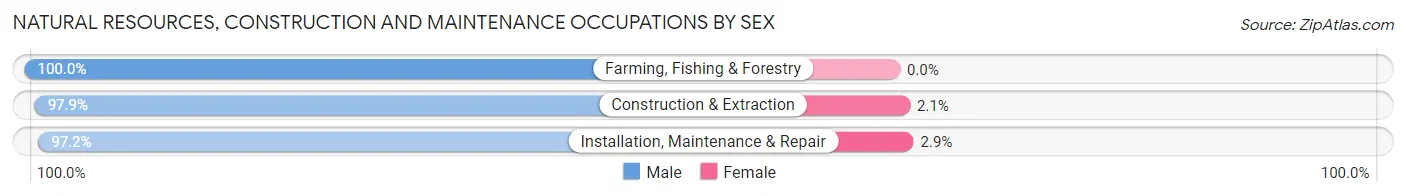
| Occupation | Male | Female |
| Farming, Fishing & Forestry | 2 (100.0%) | 0 (0.0%) |
| Construction & Extraction | 2,646 (97.9%) | 57 (2.1%) |
| Installation, Maintenance & Repair | 1,878 (97.2%) | 55 (2.9%) |
| Total (Category) | 4,526 (97.6%) | 112 (2.4%) |
| Total (Overall) | 22,407 (53.2%) | 19,691 (46.8%) |
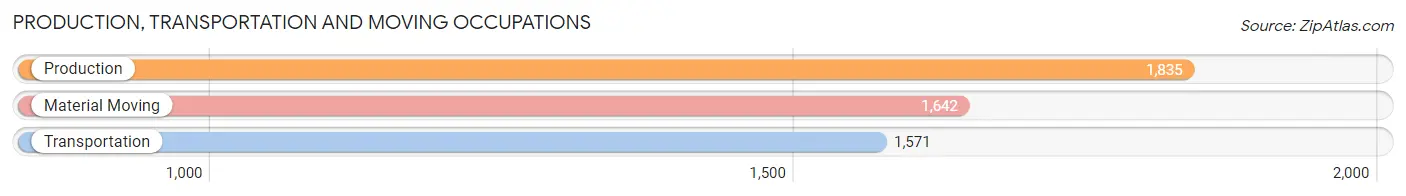
Production, Transportation and Moving Occupations
The most common Production, Transportation and Moving occupations in Hancock County are Production (1,835 | 4.4%), Material Moving (1,642 | 3.9%), and Transportation (1,571 | 3.7%).
Production, Transportation and Moving Occupations by Sex
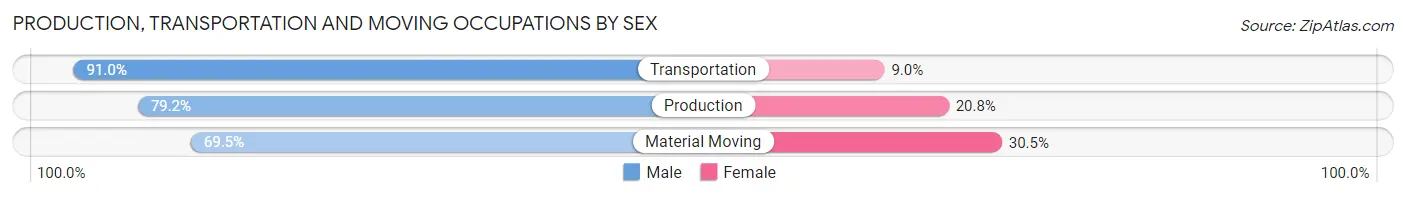
| Occupation | Male | Female |
| Production | 1,454 (79.2%) | 381 (20.8%) |
| Transportation | 1,430 (91.0%) | 141 (9.0%) |
| Material Moving | 1,141 (69.5%) | 501 (30.5%) |
| Total (Category) | 4,025 (79.7%) | 1,023 (20.3%) |
| Total (Overall) | 22,407 (53.2%) | 19,691 (46.8%) |
Employment Industries by Sex in Hancock County
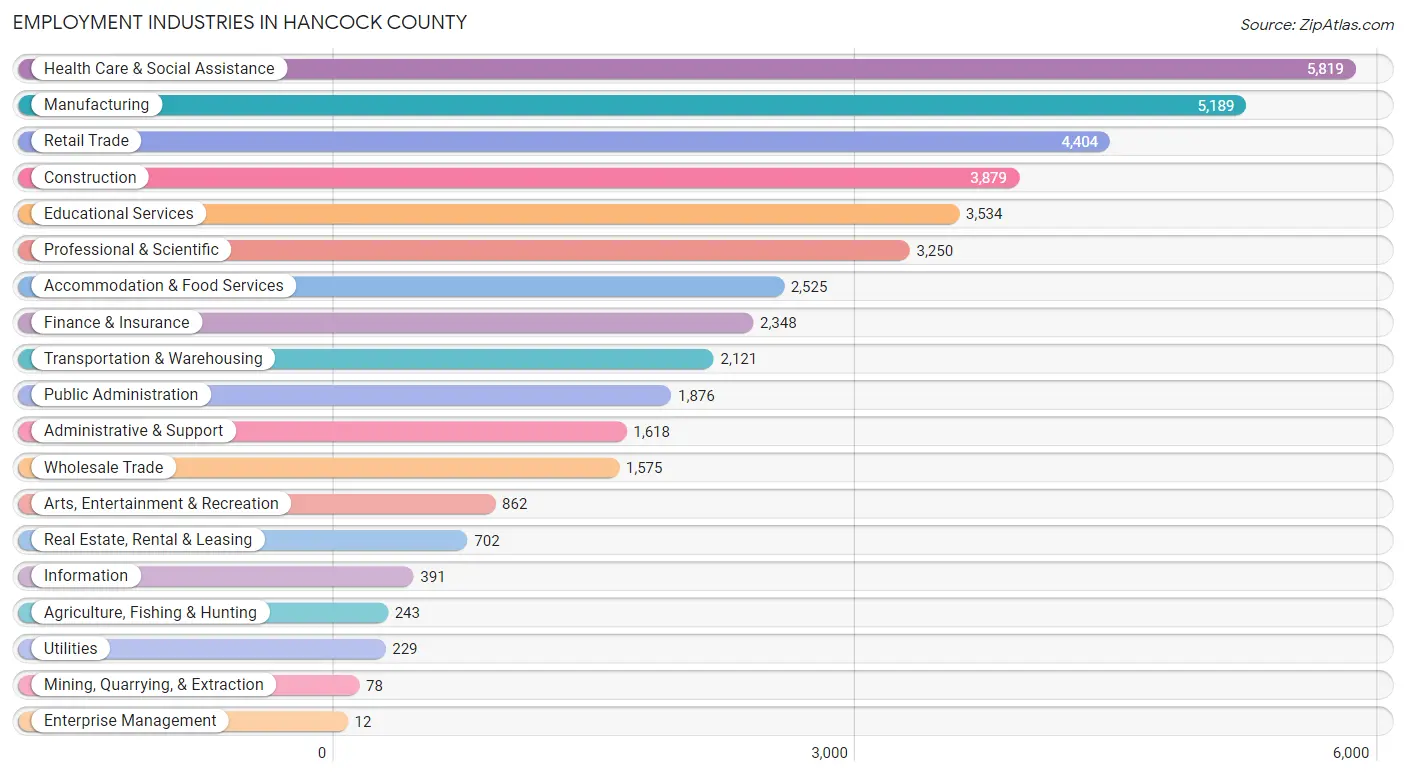
Employment Industries in Hancock County
The major employment industries in Hancock County include Health Care & Social Assistance (5,819 | 13.8%), Manufacturing (5,189 | 12.3%), Retail Trade (4,404 | 10.5%), Construction (3,879 | 9.2%), and Educational Services (3,534 | 8.4%).
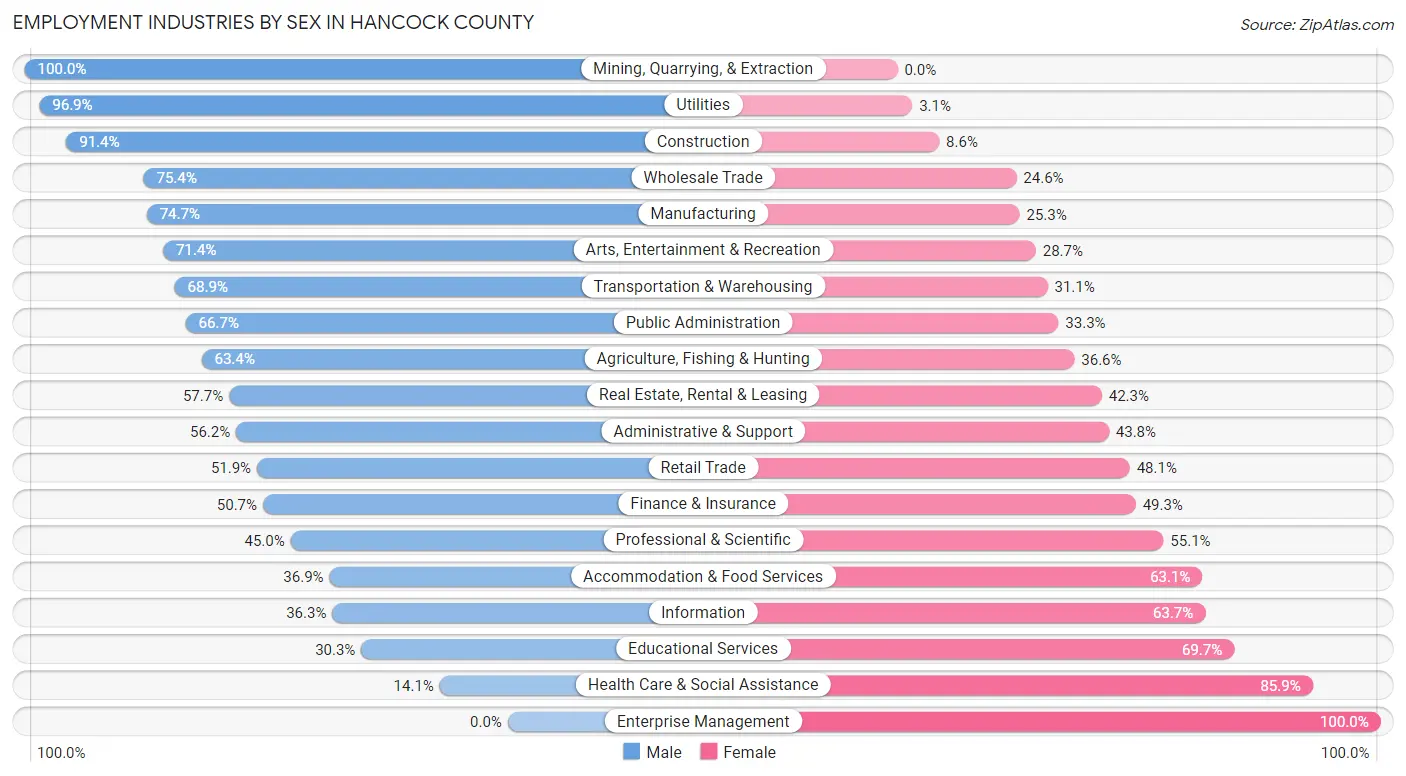
Employment Industries by Sex in Hancock County
The Hancock County industries that see more men than women are Mining, Quarrying, & Extraction (100.0%), Utilities (96.9%), and Construction (91.4%), whereas the industries that tend to have a higher number of women are Enterprise Management (100.0%), Health Care & Social Assistance (85.9%), and Educational Services (69.7%).
| Industry | Male | Female |
| Agriculture, Fishing & Hunting | 154 (63.4%) | 89 (36.6%) |
| Mining, Quarrying, & Extraction | 78 (100.0%) | 0 (0.0%) |
| Construction | 3,544 (91.4%) | 335 (8.6%) |
| Manufacturing | 3,877 (74.7%) | 1,312 (25.3%) |
| Wholesale Trade | 1,187 (75.4%) | 388 (24.6%) |
| Retail Trade | 2,286 (51.9%) | 2,118 (48.1%) |
| Transportation & Warehousing | 1,462 (68.9%) | 659 (31.1%) |
| Utilities | 222 (96.9%) | 7 (3.1%) |
| Information | 142 (36.3%) | 249 (63.7%) |
| Finance & Insurance | 1,190 (50.7%) | 1,158 (49.3%) |
| Real Estate, Rental & Leasing | 405 (57.7%) | 297 (42.3%) |
| Professional & Scientific | 1,461 (45.0%) | 1,789 (55.0%) |
| Enterprise Management | 0 (0.0%) | 12 (100.0%) |
| Administrative & Support | 910 (56.2%) | 708 (43.8%) |
| Educational Services | 1,072 (30.3%) | 2,462 (69.7%) |
| Health Care & Social Assistance | 820 (14.1%) | 4,999 (85.9%) |
| Arts, Entertainment & Recreation | 615 (71.4%) | 247 (28.6%) |
| Accommodation & Food Services | 932 (36.9%) | 1,593 (63.1%) |
| Public Administration | 1,251 (66.7%) | 625 (33.3%) |
| Total | 22,407 (53.2%) | 19,691 (46.8%) |
Education in Hancock County
School Enrollment in Hancock County
The most common levels of schooling among the 18,636 students in Hancock County are high school (4,845 | 26.0%), middle school (4,425 | 23.7%), and elementary school (4,037 | 21.7%).
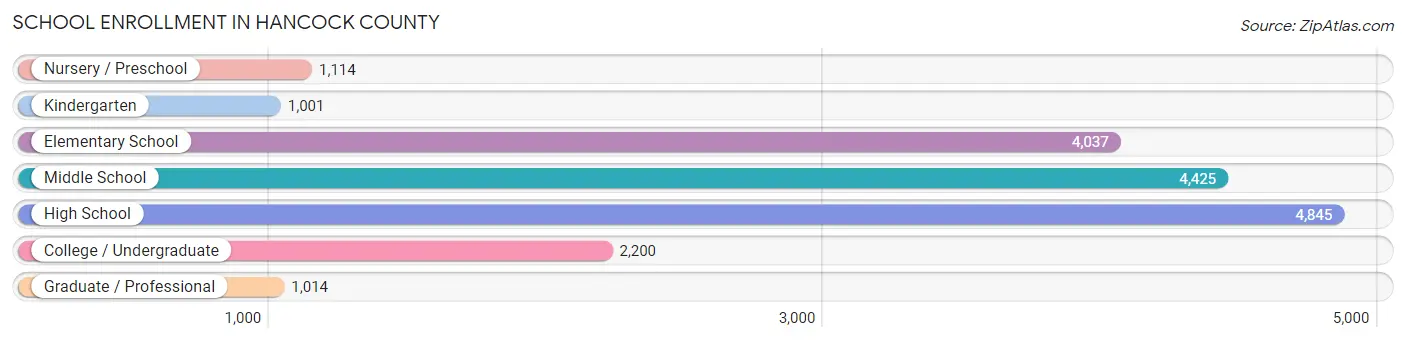
| School Level | # Students | % Students |
| Nursery / Preschool | 1,114 | 6.0% |
| Kindergarten | 1,001 | 5.4% |
| Elementary School | 4,037 | 21.7% |
| Middle School | 4,425 | 23.7% |
| High School | 4,845 | 26.0% |
| College / Undergraduate | 2,200 | 11.8% |
| Graduate / Professional | 1,014 | 5.4% |
| Total | 18,636 | 100.0% |
School Enrollment by Age by Funding Source in Hancock County
Out of a total of 18,636 students who are enrolled in schools in Hancock County, 2,534 (13.6%) attend a private institution, while the remaining 16,102 (86.4%) are enrolled in public schools. The age group of 3 to 4 year olds has the highest likelihood of being enrolled in private schools, with 313 (37.2% in the age bracket) enrolled. Conversely, the age group of 18 to 19 year olds has the lowest likelihood of being enrolled in a private school, with 1,264 (94.5% in the age bracket) attending a public institution.
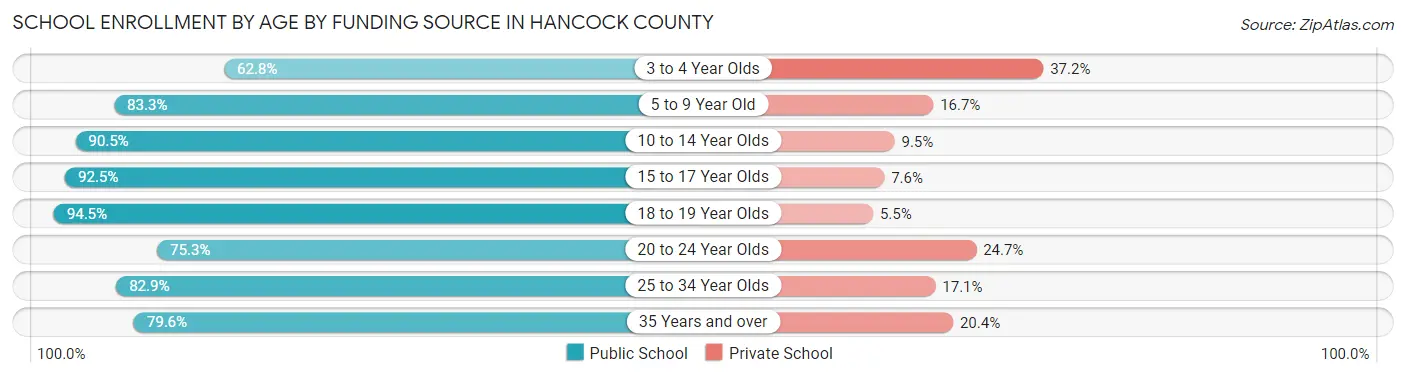
| Age Bracket | Public School | Private School |
| 3 to 4 Year Olds | 529 (62.8%) | 313 (37.2%) |
| 5 to 9 Year Old | 3,916 (83.3%) | 784 (16.7%) |
| 10 to 14 Year Olds | 5,047 (90.5%) | 528 (9.5%) |
| 15 to 17 Year Olds | 3,036 (92.4%) | 248 (7.5%) |
| 18 to 19 Year Olds | 1,264 (94.5%) | 73 (5.5%) |
| 20 to 24 Year Olds | 717 (75.3%) | 235 (24.7%) |
| 25 to 34 Year Olds | 913 (82.9%) | 188 (17.1%) |
| 35 Years and over | 673 (79.6%) | 172 (20.4%) |
| Total | 16,102 (86.4%) | 2,534 (13.6%) |
Educational Attainment by Field of Study in Hancock County
Business (4,591 | 23.2%), education (2,777 | 14.0%), science & technology (2,240 | 11.3%), bio, nature & agricultural (1,772 | 8.9%), and arts & humanities (1,175 | 5.9%) are the most common fields of study among 19,794 individuals in Hancock County who have obtained a bachelor's degree or higher.
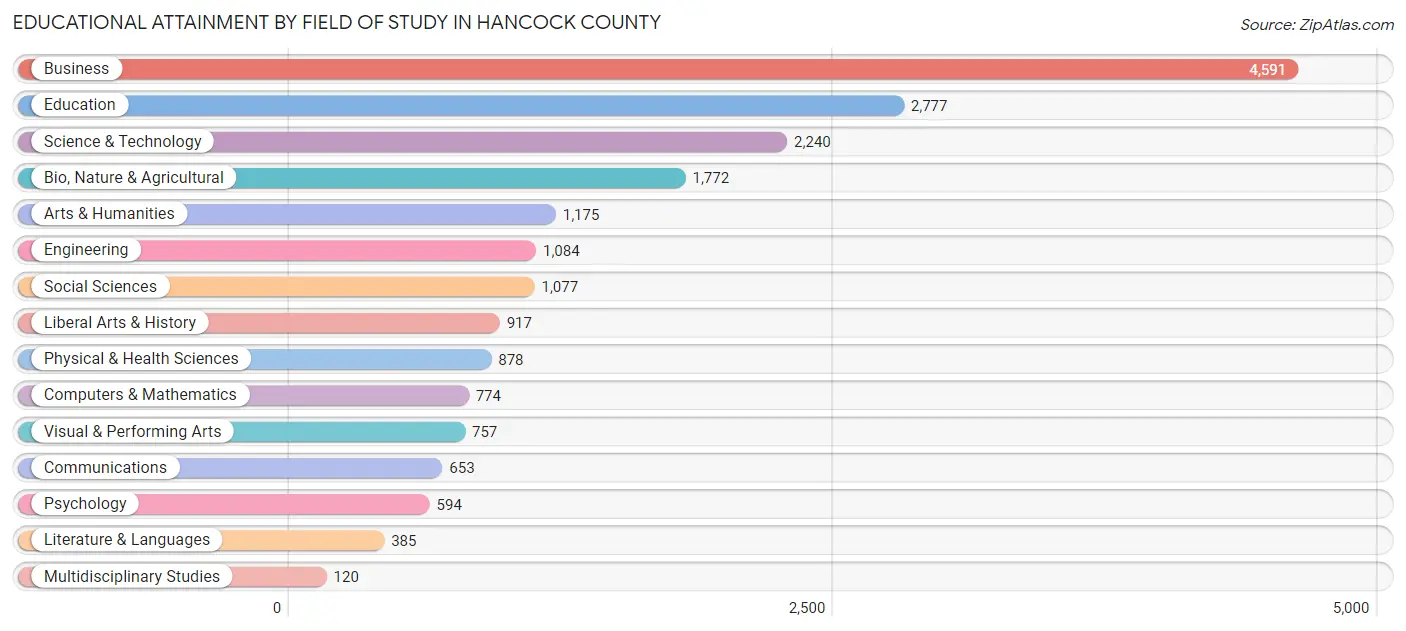
| Field of Study | # Graduates | % Graduates |
| Computers & Mathematics | 774 | 3.9% |
| Bio, Nature & Agricultural | 1,772 | 8.9% |
| Physical & Health Sciences | 878 | 4.4% |
| Psychology | 594 | 3.0% |
| Social Sciences | 1,077 | 5.4% |
| Engineering | 1,084 | 5.5% |
| Multidisciplinary Studies | 120 | 0.6% |
| Science & Technology | 2,240 | 11.3% |
| Business | 4,591 | 23.2% |
| Education | 2,777 | 14.0% |
| Literature & Languages | 385 | 1.9% |
| Liberal Arts & History | 917 | 4.6% |
| Visual & Performing Arts | 757 | 3.8% |
| Communications | 653 | 3.3% |
| Arts & Humanities | 1,175 | 5.9% |
| Total | 19,794 | 100.0% |
Transportation & Commute in Hancock County
Vehicle Availability by Sex in Hancock County
The most prevalent vehicle ownership categories in Hancock County are males with 2 vehicles (10,470, accounting for 46.8%) and females with 2 vehicles (8,504, making up 54.5%).
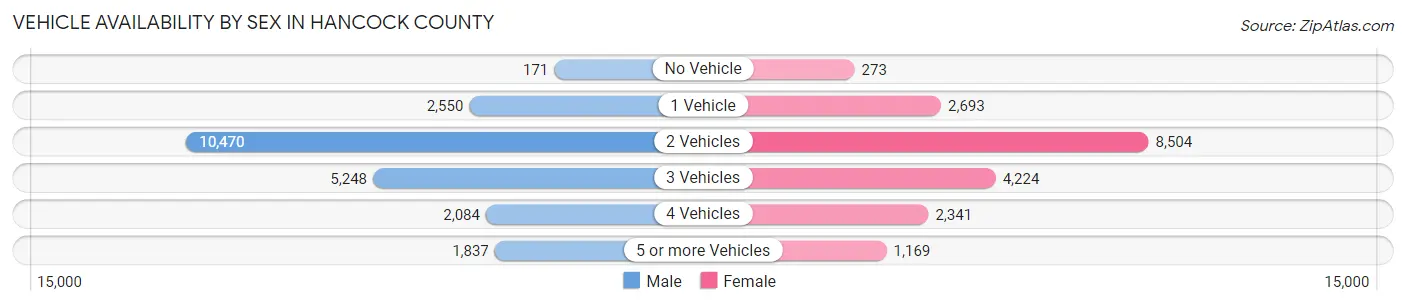
| Vehicles Available | Male | Female |
| No Vehicle | 171 (0.8%) | 273 (1.4%) |
| 1 Vehicle | 2,550 (11.4%) | 2,693 (14.0%) |
| 2 Vehicles | 10,470 (46.8%) | 8,504 (44.3%) |
| 3 Vehicles | 5,248 (23.5%) | 4,224 (22.0%) |
| 4 Vehicles | 2,084 (9.3%) | 2,341 (12.2%) |
| 5 or more Vehicles | 1,837 (8.2%) | 1,169 (6.1%) |
| Total | 22,360 (100.0%) | 19,204 (100.0%) |
Commute Time in Hancock County
The most frequently occuring commute durations in Hancock County are 20 to 24 minutes (5,500 commuters, 15.1%), 30 to 34 minutes (4,995 commuters, 13.8%), and 15 to 19 minutes (4,225 commuters, 11.6%).
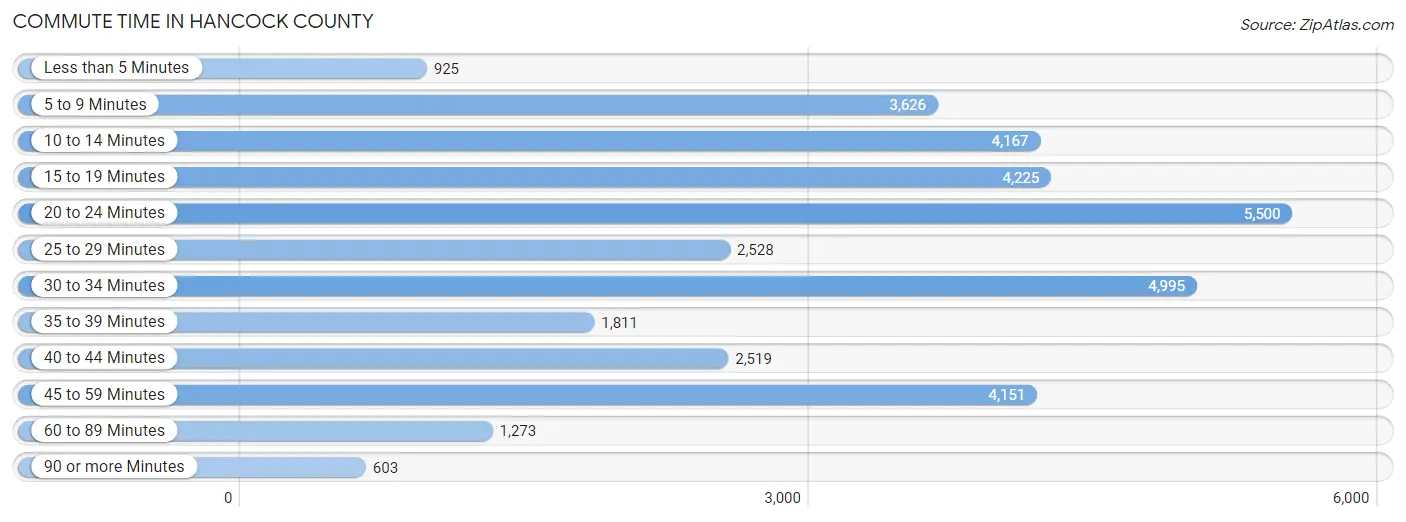
| Commute Time | # Commuters | % Commuters |
| Less than 5 Minutes | 925 | 2.5% |
| 5 to 9 Minutes | 3,626 | 10.0% |
| 10 to 14 Minutes | 4,167 | 11.5% |
| 15 to 19 Minutes | 4,225 | 11.6% |
| 20 to 24 Minutes | 5,500 | 15.1% |
| 25 to 29 Minutes | 2,528 | 7.0% |
| 30 to 34 Minutes | 4,995 | 13.8% |
| 35 to 39 Minutes | 1,811 | 5.0% |
| 40 to 44 Minutes | 2,519 | 6.9% |
| 45 to 59 Minutes | 4,151 | 11.4% |
| 60 to 89 Minutes | 1,273 | 3.5% |
| 90 or more Minutes | 603 | 1.7% |
Commute Time by Sex in Hancock County
The most common commute times in Hancock County are 30 to 34 minutes (2,939 commuters, 14.9%) for males and 20 to 24 minutes (2,848 commuters, 17.1%) for females.
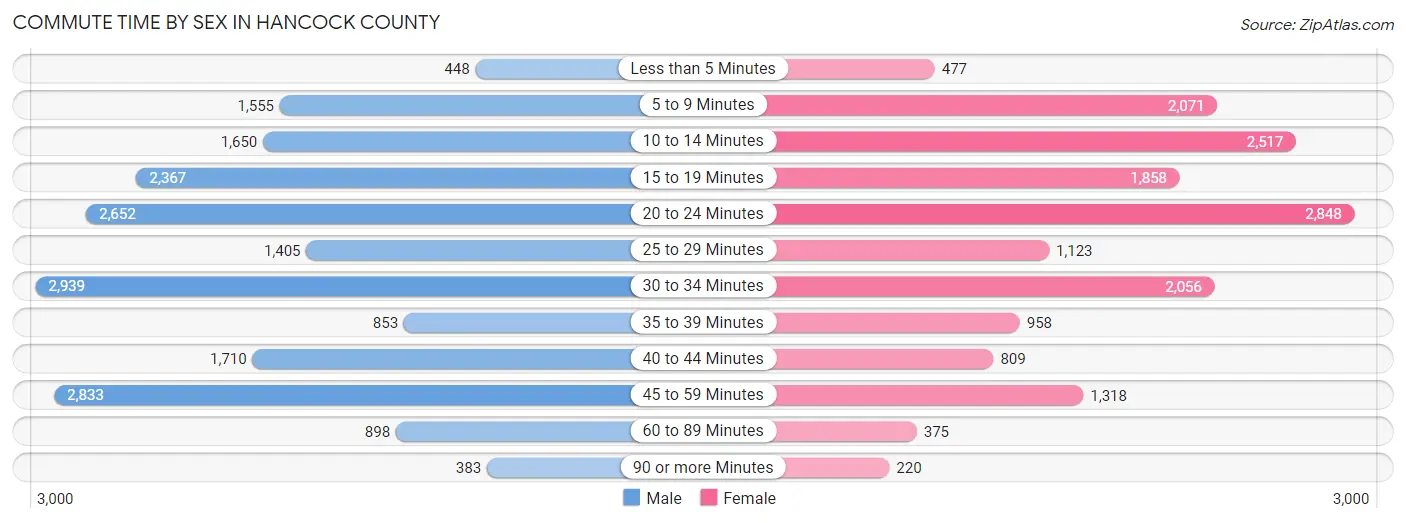
| Commute Time | Male | Female |
| Less than 5 Minutes | 448 (2.3%) | 477 (2.9%) |
| 5 to 9 Minutes | 1,555 (7.9%) | 2,071 (12.4%) |
| 10 to 14 Minutes | 1,650 (8.4%) | 2,517 (15.1%) |
| 15 to 19 Minutes | 2,367 (12.0%) | 1,858 (11.2%) |
| 20 to 24 Minutes | 2,652 (13.5%) | 2,848 (17.1%) |
| 25 to 29 Minutes | 1,405 (7.1%) | 1,123 (6.8%) |
| 30 to 34 Minutes | 2,939 (14.9%) | 2,056 (12.4%) |
| 35 to 39 Minutes | 853 (4.3%) | 958 (5.8%) |
| 40 to 44 Minutes | 1,710 (8.7%) | 809 (4.9%) |
| 45 to 59 Minutes | 2,833 (14.4%) | 1,318 (7.9%) |
| 60 to 89 Minutes | 898 (4.6%) | 375 (2.2%) |
| 90 or more Minutes | 383 (1.9%) | 220 (1.3%) |
Time of Departure to Work by Sex in Hancock County
The most frequent times of departure to work in Hancock County are 7:00 AM to 7:29 AM (3,320, 16.9%) for males and 7:00 AM to 7:29 AM (3,560, 21.4%) for females.
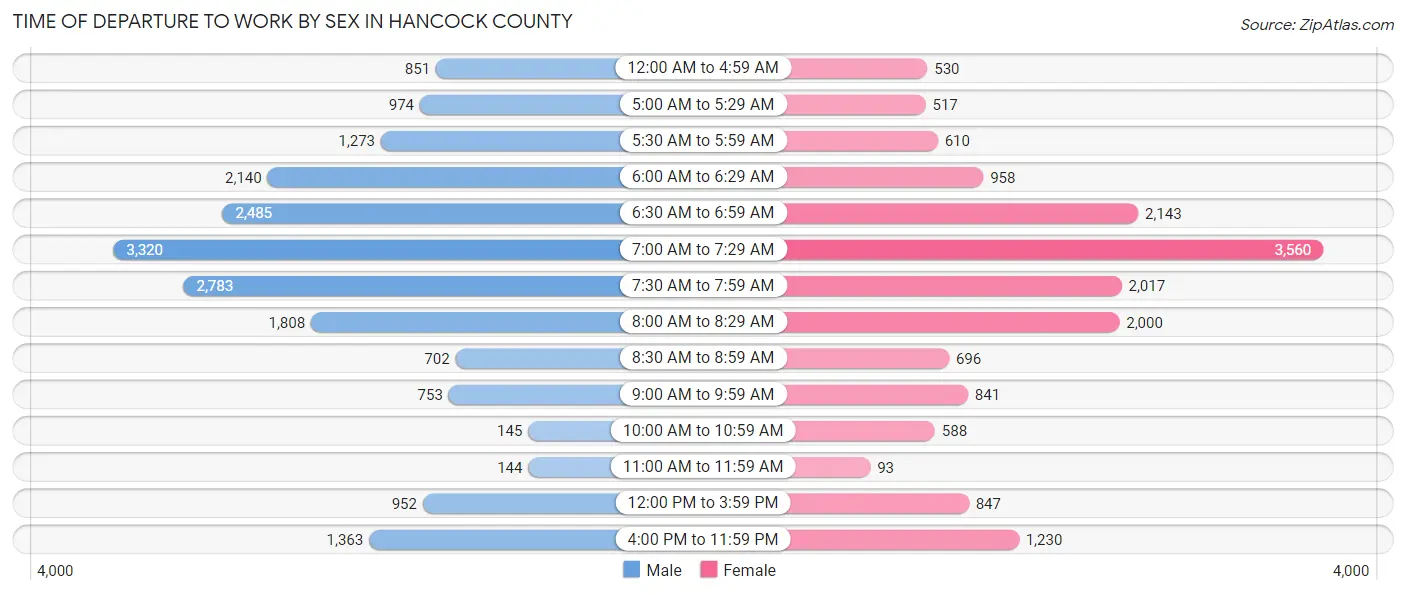
| Time of Departure | Male | Female |
| 12:00 AM to 4:59 AM | 851 (4.3%) | 530 (3.2%) |
| 5:00 AM to 5:29 AM | 974 (5.0%) | 517 (3.1%) |
| 5:30 AM to 5:59 AM | 1,273 (6.5%) | 610 (3.7%) |
| 6:00 AM to 6:29 AM | 2,140 (10.9%) | 958 (5.8%) |
| 6:30 AM to 6:59 AM | 2,485 (12.6%) | 2,143 (12.9%) |
| 7:00 AM to 7:29 AM | 3,320 (16.9%) | 3,560 (21.4%) |
| 7:30 AM to 7:59 AM | 2,783 (14.1%) | 2,017 (12.1%) |
| 8:00 AM to 8:29 AM | 1,808 (9.2%) | 2,000 (12.0%) |
| 8:30 AM to 8:59 AM | 702 (3.6%) | 696 (4.2%) |
| 9:00 AM to 9:59 AM | 753 (3.8%) | 841 (5.1%) |
| 10:00 AM to 10:59 AM | 145 (0.7%) | 588 (3.5%) |
| 11:00 AM to 11:59 AM | 144 (0.7%) | 93 (0.6%) |
| 12:00 PM to 3:59 PM | 952 (4.8%) | 847 (5.1%) |
| 4:00 PM to 11:59 PM | 1,363 (6.9%) | 1,230 (7.4%) |
| Total | 19,693 (100.0%) | 16,630 (100.0%) |
Housing Occupancy in Hancock County
Occupancy by Ownership in Hancock County
Of the total 31,424 dwellings in Hancock County, owner-occupied units account for 25,272 (80.4%), while renter-occupied units make up 6,152 (19.6%).
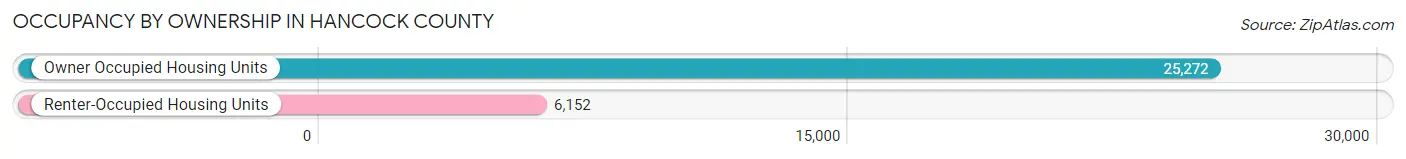
| Occupancy | # Housing Units | % Housing Units |
| Owner Occupied Housing Units | 25,272 | 80.4% |
| Renter-Occupied Housing Units | 6,152 | 19.6% |
| Total Occupied Housing Units | 31,424 | 100.0% |
Occupancy by Household Size in Hancock County
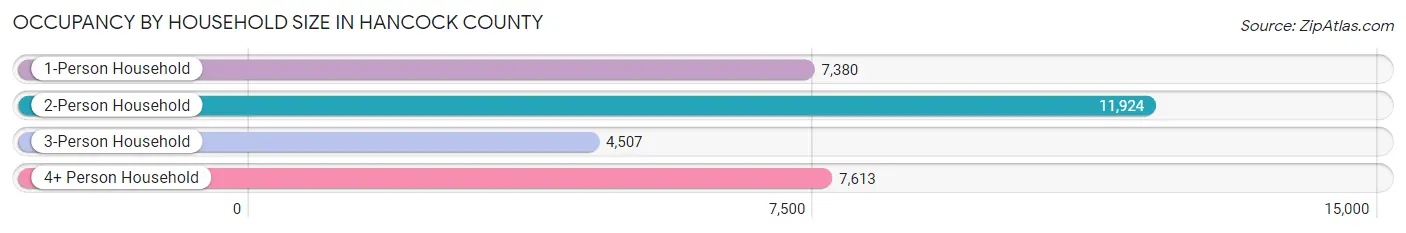
| Household Size | # Housing Units | % Housing Units |
| 1-Person Household | 7,380 | 23.5% |
| 2-Person Household | 11,924 | 38.0% |
| 3-Person Household | 4,507 | 14.3% |
| 4+ Person Household | 7,613 | 24.2% |
| Total Housing Units | 31,424 | 100.0% |
Occupancy by Ownership by Household Size in Hancock County
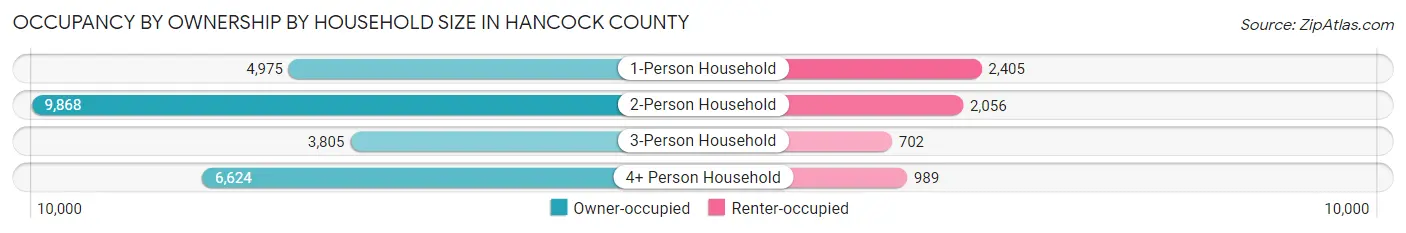
| Household Size | Owner-occupied | Renter-occupied |
| 1-Person Household | 4,975 (67.4%) | 2,405 (32.6%) |
| 2-Person Household | 9,868 (82.8%) | 2,056 (17.2%) |
| 3-Person Household | 3,805 (84.4%) | 702 (15.6%) |
| 4+ Person Household | 6,624 (87.0%) | 989 (13.0%) |
| Total Housing Units | 25,272 (80.4%) | 6,152 (19.6%) |
Occupancy by Educational Attainment in Hancock County
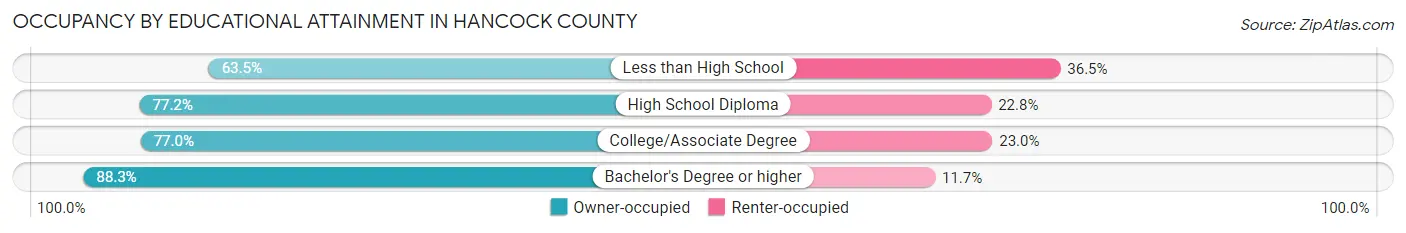
| Household Size | Owner-occupied | Renter-occupied |
| Less than High School | 1,109 (63.5%) | 638 (36.5%) |
| High School Diploma | 6,746 (77.2%) | 1,994 (22.8%) |
| College/Associate Degree | 7,300 (77.0%) | 2,184 (23.0%) |
| Bachelor's Degree or higher | 10,117 (88.3%) | 1,336 (11.7%) |
Occupancy by Age of Householder in Hancock County
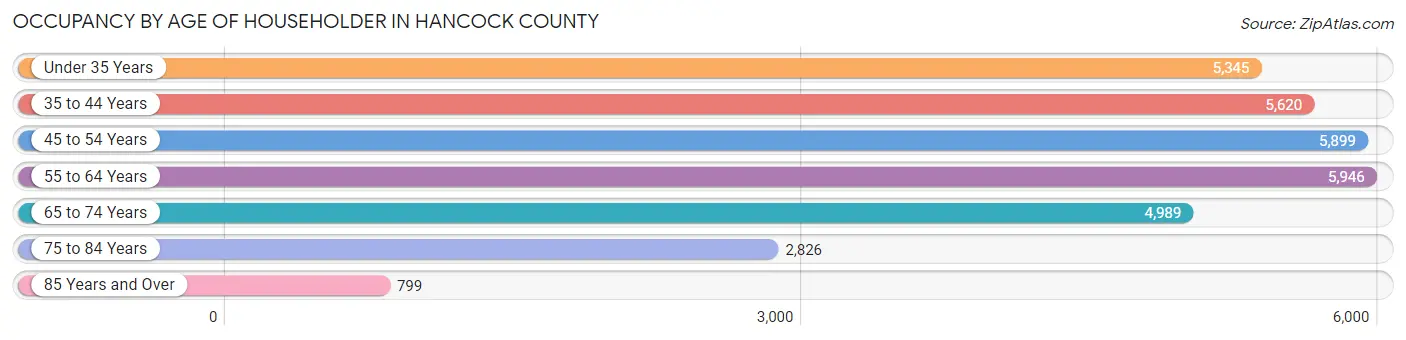
| Age Bracket | # Households | % Households |
| Under 35 Years | 5,345 | 17.0% |
| 35 to 44 Years | 5,620 | 17.9% |
| 45 to 54 Years | 5,899 | 18.8% |
| 55 to 64 Years | 5,946 | 18.9% |
| 65 to 74 Years | 4,989 | 15.9% |
| 75 to 84 Years | 2,826 | 9.0% |
| 85 Years and Over | 799 | 2.5% |
| Total | 31,424 | 100.0% |
Housing Finances in Hancock County
Median Income by Occupancy in Hancock County
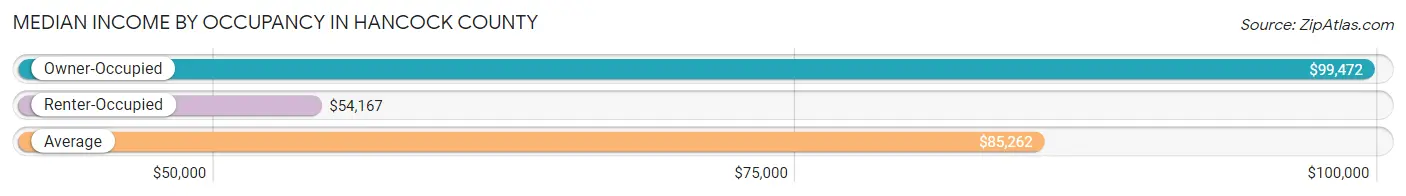
| Occupancy Type | # Households | Median Income |
| Owner-Occupied | 25,272 (80.4%) | $99,472 |
| Renter-Occupied | 6,152 (19.6%) | $54,167 |
| Average | 31,424 (100.0%) | $85,262 |
Occupancy by Householder Income Bracket in Hancock County
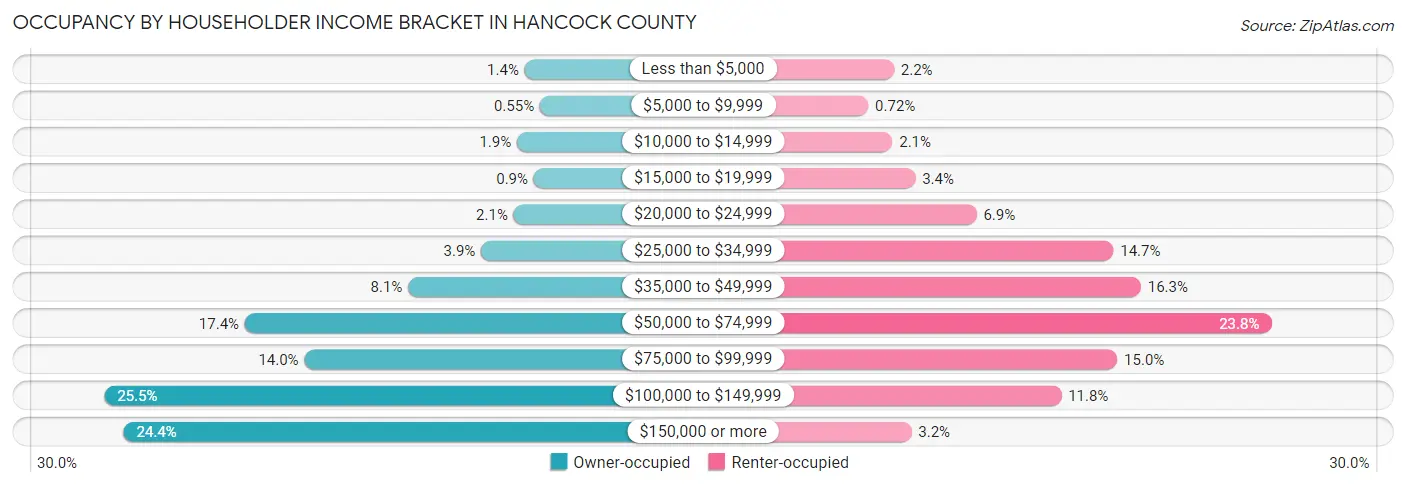
| Income Bracket | Owner-occupied | Renter-occupied |
| Less than $5,000 | 359 (1.4%) | 135 (2.2%) |
| $5,000 to $9,999 | 140 (0.5%) | 44 (0.7%) |
| $10,000 to $14,999 | 469 (1.9%) | 129 (2.1%) |
| $15,000 to $19,999 | 227 (0.9%) | 210 (3.4%) |
| $20,000 to $24,999 | 519 (2.1%) | 425 (6.9%) |
| $25,000 to $34,999 | 989 (3.9%) | 906 (14.7%) |
| $35,000 to $49,999 | 2,043 (8.1%) | 1,003 (16.3%) |
| $50,000 to $74,999 | 4,401 (17.4%) | 1,461 (23.7%) |
| $75,000 to $99,999 | 3,541 (14.0%) | 920 (14.9%) |
| $100,000 to $149,999 | 6,431 (25.5%) | 723 (11.7%) |
| $150,000 or more | 6,153 (24.3%) | 196 (3.2%) |
| Total | 25,272 (100.0%) | 6,152 (100.0%) |
Monthly Housing Cost Tiers in Hancock County
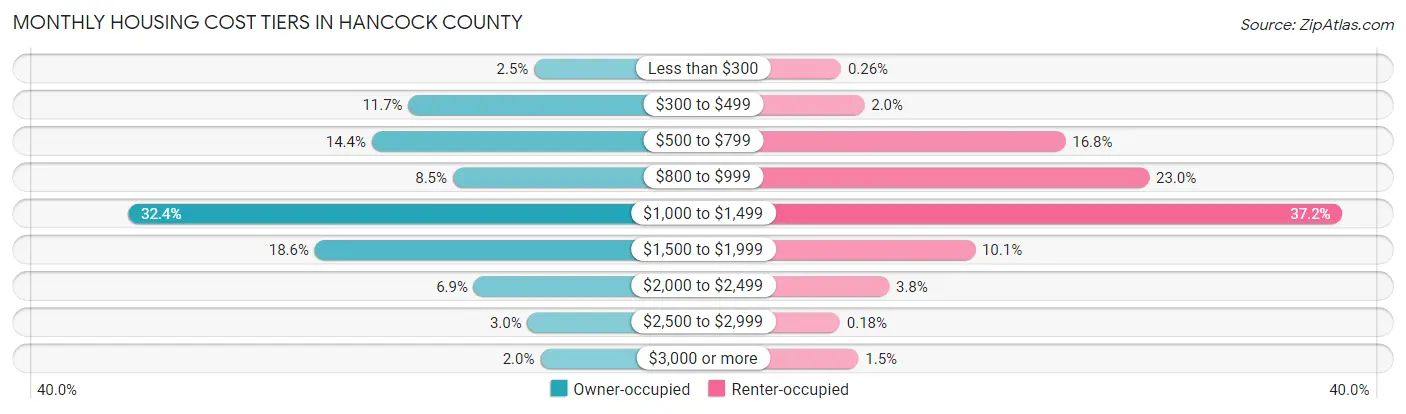
| Monthly Cost | Owner-occupied | Renter-occupied |
| Less than $300 | 625 (2.5%) | 16 (0.3%) |
| $300 to $499 | 2,965 (11.7%) | 122 (2.0%) |
| $500 to $799 | 3,647 (14.4%) | 1,032 (16.8%) |
| $800 to $999 | 2,139 (8.5%) | 1,412 (23.0%) |
| $1,000 to $1,499 | 8,182 (32.4%) | 2,288 (37.2%) |
| $1,500 to $1,999 | 4,708 (18.6%) | 623 (10.1%) |
| $2,000 to $2,499 | 1,748 (6.9%) | 234 (3.8%) |
| $2,500 to $2,999 | 747 (3.0%) | 11 (0.2%) |
| $3,000 or more | 511 (2.0%) | 95 (1.5%) |
| Total | 25,272 (100.0%) | 6,152 (100.0%) |
Physical Housing Characteristics in Hancock County
Housing Structures in Hancock County
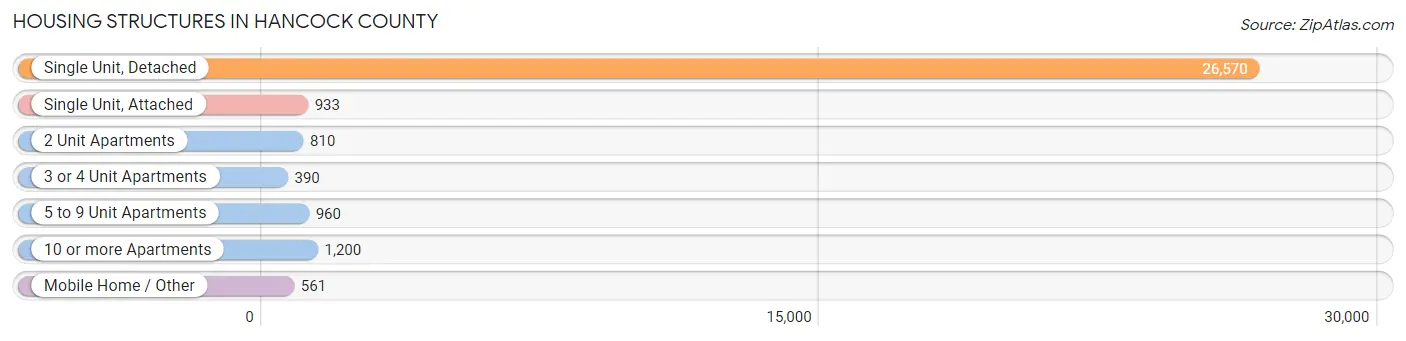
| Structure Type | # Housing Units | % Housing Units |
| Single Unit, Detached | 26,570 | 84.6% |
| Single Unit, Attached | 933 | 3.0% |
| 2 Unit Apartments | 810 | 2.6% |
| 3 or 4 Unit Apartments | 390 | 1.2% |
| 5 to 9 Unit Apartments | 960 | 3.0% |
| 10 or more Apartments | 1,200 | 3.8% |
| Mobile Home / Other | 561 | 1.8% |
| Total | 31,424 | 100.0% |
Housing Structures by Occupancy in Hancock County
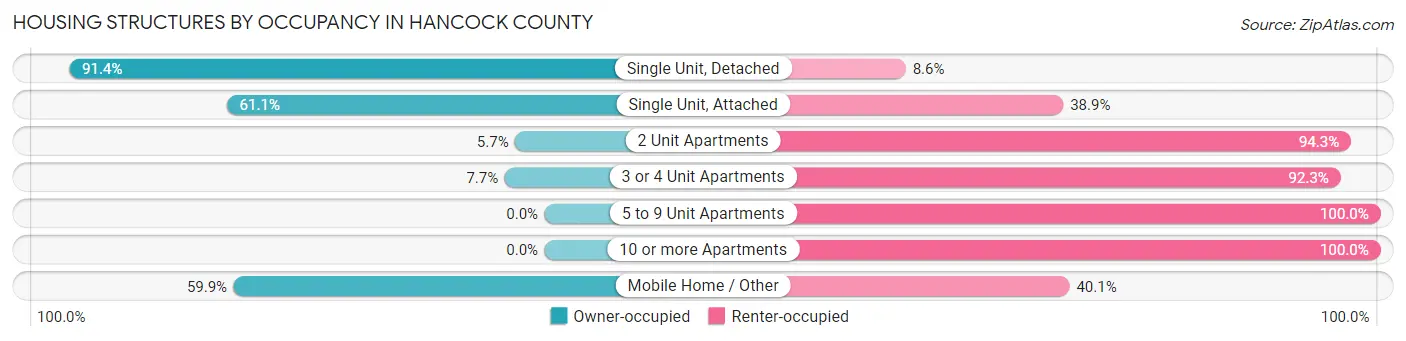
| Structure Type | Owner-occupied | Renter-occupied |
| Single Unit, Detached | 24,290 (91.4%) | 2,280 (8.6%) |
| Single Unit, Attached | 570 (61.1%) | 363 (38.9%) |
| 2 Unit Apartments | 46 (5.7%) | 764 (94.3%) |
| 3 or 4 Unit Apartments | 30 (7.7%) | 360 (92.3%) |
| 5 to 9 Unit Apartments | 0 (0.0%) | 960 (100.0%) |
| 10 or more Apartments | 0 (0.0%) | 1,200 (100.0%) |
| Mobile Home / Other | 336 (59.9%) | 225 (40.1%) |
| Total | 25,272 (80.4%) | 6,152 (19.6%) |
Housing Structures by Number of Rooms in Hancock County
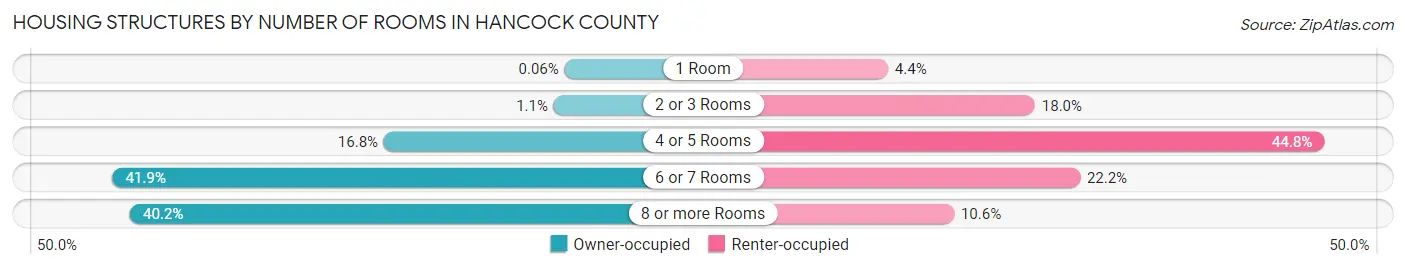
| Number of Rooms | Owner-occupied | Renter-occupied |
| 1 Room | 14 (0.1%) | 273 (4.4%) |
| 2 or 3 Rooms | 269 (1.1%) | 1,109 (18.0%) |
| 4 or 5 Rooms | 4,238 (16.8%) | 2,755 (44.8%) |
| 6 or 7 Rooms | 10,582 (41.9%) | 1,366 (22.2%) |
| 8 or more Rooms | 10,169 (40.2%) | 649 (10.5%) |
| Total | 25,272 (100.0%) | 6,152 (100.0%) |
Housing Structure by Heating Type in Hancock County
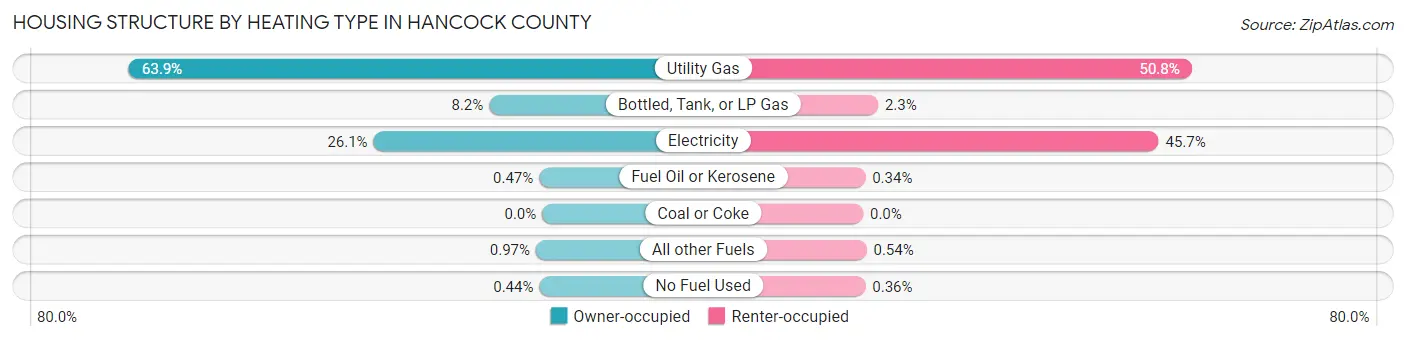
| Heating Type | Owner-occupied | Renter-occupied |
| Utility Gas | 16,142 (63.9%) | 3,124 (50.8%) |
| Bottled, Tank, or LP Gas | 2,070 (8.2%) | 142 (2.3%) |
| Electricity | 6,588 (26.1%) | 2,810 (45.7%) |
| Fuel Oil or Kerosene | 118 (0.5%) | 21 (0.3%) |
| Coal or Coke | 0 (0.0%) | 0 (0.0%) |
| All other Fuels | 244 (1.0%) | 33 (0.5%) |
| No Fuel Used | 110 (0.4%) | 22 (0.4%) |
| Total | 25,272 (100.0%) | 6,152 (100.0%) |
Household Vehicle Usage in Hancock County
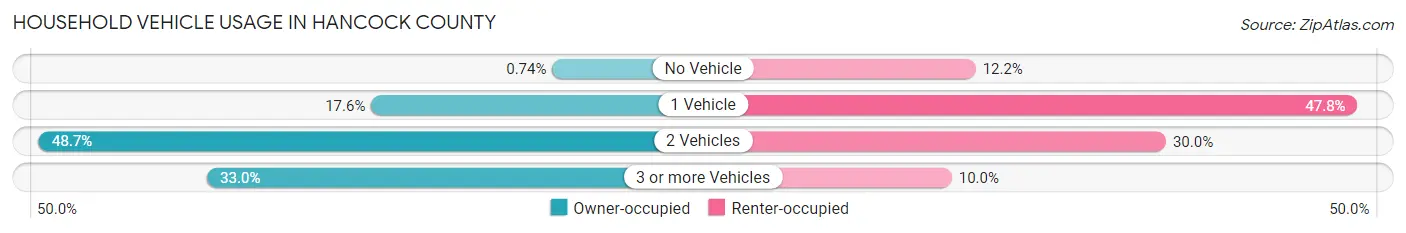
| Vehicles per Household | Owner-occupied | Renter-occupied |
| No Vehicle | 187 (0.7%) | 751 (12.2%) |
| 1 Vehicle | 4,458 (17.6%) | 2,943 (47.8%) |
| 2 Vehicles | 12,297 (48.7%) | 1,844 (30.0%) |
| 3 or more Vehicles | 8,330 (33.0%) | 614 (10.0%) |
| Total | 25,272 (100.0%) | 6,152 (100.0%) |
Real Estate & Mortgages in Hancock County
Real Estate and Mortgage Overview in Hancock County
| Characteristic | Without Mortgage | With Mortgage |
| Housing Units | 7,399 | 17,873 |
| Median Property Value | $238,000 | $234,500 |
| Median Household Income | $72,921 | $4,635 |
| Monthly Housing Costs | $515 | $504 |
| Real Estate Taxes | $1,798 | $442 |
Property Value by Mortgage Status in Hancock County
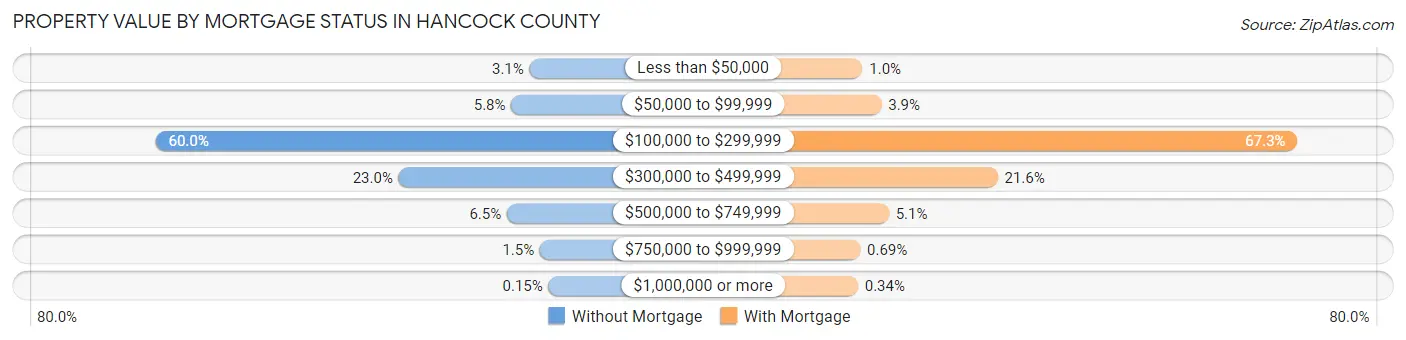
| Property Value | Without Mortgage | With Mortgage |
| Less than $50,000 | 226 (3.0%) | 186 (1.0%) |
| $50,000 to $99,999 | 431 (5.8%) | 700 (3.9%) |
| $100,000 to $299,999 | 4,442 (60.0%) | 12,033 (67.3%) |
| $300,000 to $499,999 | 1,701 (23.0%) | 3,867 (21.6%) |
| $500,000 to $749,999 | 480 (6.5%) | 903 (5.1%) |
| $750,000 to $999,999 | 108 (1.5%) | 123 (0.7%) |
| $1,000,000 or more | 11 (0.2%) | 61 (0.3%) |
| Total | 7,399 (100.0%) | 17,873 (100.0%) |
Household Income by Mortgage Status in Hancock County
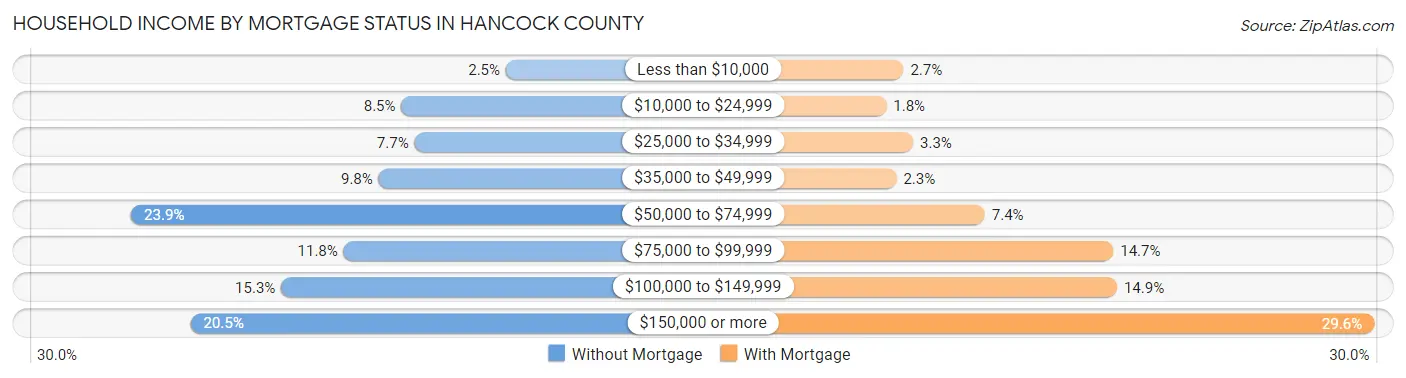
| Household Income | Without Mortgage | With Mortgage |
| Less than $10,000 | 185 (2.5%) | 490 (2.7%) |
| $10,000 to $24,999 | 627 (8.5%) | 314 (1.8%) |
| $25,000 to $34,999 | 571 (7.7%) | 588 (3.3%) |
| $35,000 to $49,999 | 723 (9.8%) | 418 (2.3%) |
| $50,000 to $74,999 | 1,769 (23.9%) | 1,320 (7.4%) |
| $75,000 to $99,999 | 871 (11.8%) | 2,632 (14.7%) |
| $100,000 to $149,999 | 1,135 (15.3%) | 2,670 (14.9%) |
| $150,000 or more | 1,518 (20.5%) | 5,296 (29.6%) |
| Total | 7,399 (100.0%) | 17,873 (100.0%) |
Property Value to Household Income Ratio in Hancock County
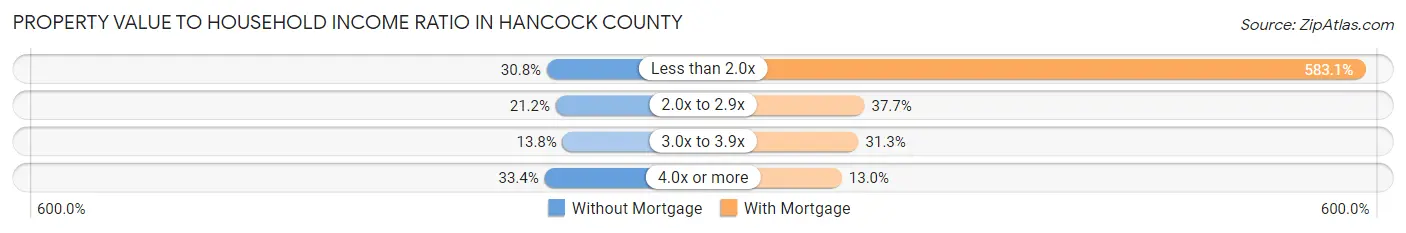
| Value-to-Income Ratio | Without Mortgage | With Mortgage |
| Less than 2.0x | 2,282 (30.8%) | 104,215 (583.1%) |
| 2.0x to 2.9x | 1,566 (21.2%) | 6,743 (37.7%) |
| 3.0x to 3.9x | 1,017 (13.8%) | 5,589 (31.3%) |
| 4.0x or more | 2,474 (33.4%) | 2,329 (13.0%) |
| Total | 7,399 (100.0%) | 17,873 (100.0%) |
Real Estate Taxes by Mortgage Status in Hancock County
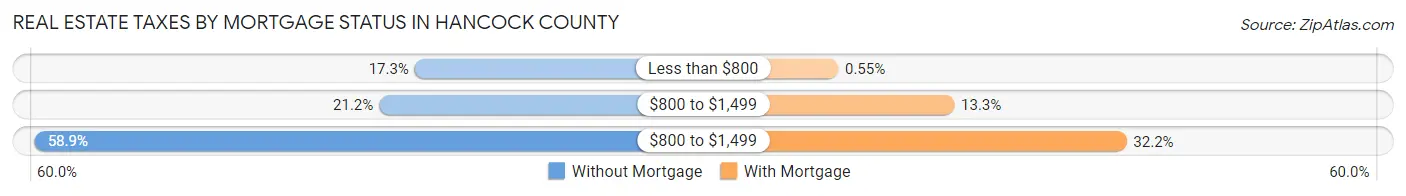
| Property Taxes | Without Mortgage | With Mortgage |
| Less than $800 | 1,276 (17.2%) | 98 (0.5%) |
| $800 to $1,499 | 1,565 (21.1%) | 2,371 (13.3%) |
| $800 to $1,499 | 4,357 (58.9%) | 5,746 (32.2%) |
| Total | 7,399 (100.0%) | 17,873 (100.0%) |
Health & Disability in Hancock County
Health Insurance Coverage by Age in Hancock County
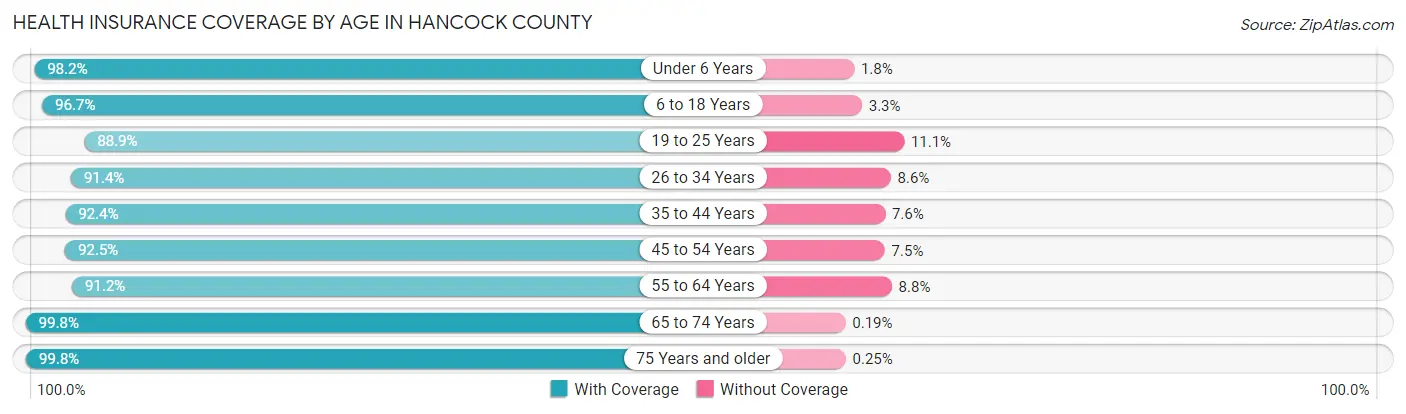
| Age Bracket | With Coverage | Without Coverage |
| Under 6 Years | 5,286 (98.2%) | 97 (1.8%) |
| 6 to 18 Years | 13,938 (96.7%) | 469 (3.3%) |
| 19 to 25 Years | 4,934 (88.9%) | 617 (11.1%) |
| 26 to 34 Years | 8,086 (91.4%) | 765 (8.6%) |
| 35 to 44 Years | 9,762 (92.4%) | 801 (7.6%) |
| 45 to 54 Years | 9,842 (92.5%) | 802 (7.5%) |
| 55 to 64 Years | 9,553 (91.2%) | 925 (8.8%) |
| 65 to 74 Years | 8,063 (99.8%) | 15 (0.2%) |
| 75 Years and older | 5,275 (99.8%) | 13 (0.3%) |
| Total | 74,739 (94.3%) | 4,504 (5.7%) |
Health Insurance Coverage by Citizenship Status in Hancock County
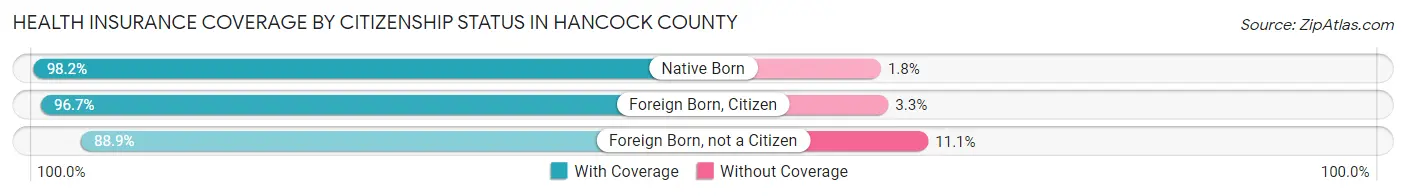
| Citizenship Status | With Coverage | Without Coverage |
| Native Born | 5,286 (98.2%) | 97 (1.8%) |
| Foreign Born, Citizen | 13,938 (96.7%) | 469 (3.3%) |
| Foreign Born, not a Citizen | 4,934 (88.9%) | 617 (11.1%) |
Health Insurance Coverage by Household Income in Hancock County
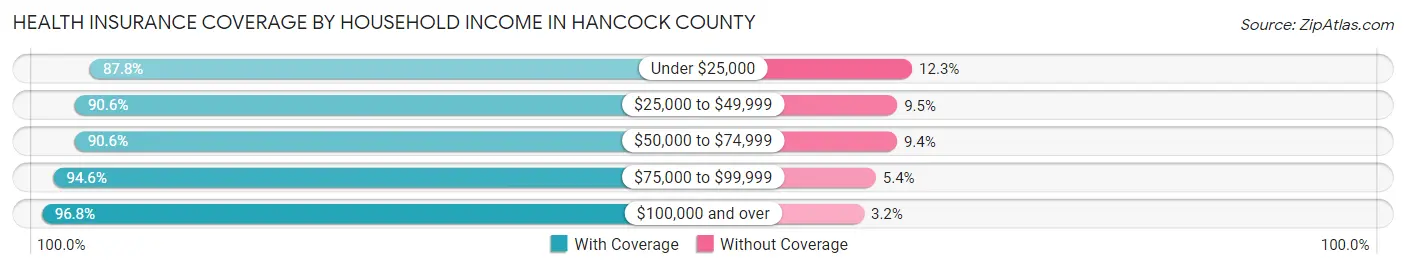
| Household Income | With Coverage | Without Coverage |
| Under $25,000 | 3,409 (87.7%) | 476 (12.2%) |
| $25,000 to $49,999 | 8,213 (90.5%) | 857 (9.5%) |
| $50,000 to $74,999 | 11,376 (90.6%) | 1,180 (9.4%) |
| $75,000 to $99,999 | 10,994 (94.6%) | 633 (5.4%) |
| $100,000 and over | 40,686 (96.8%) | 1,356 (3.2%) |
Public vs Private Health Insurance Coverage by Age in Hancock County
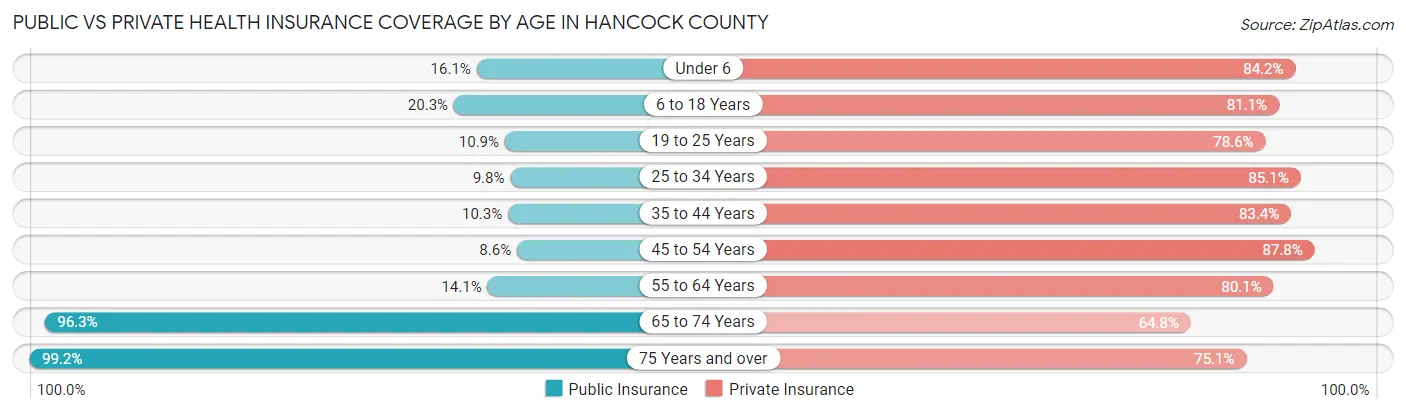
| Age Bracket | Public Insurance | Private Insurance |
| Under 6 | 866 (16.1%) | 4,531 (84.2%) |
| 6 to 18 Years | 2,926 (20.3%) | 11,689 (81.1%) |
| 19 to 25 Years | 603 (10.9%) | 4,364 (78.6%) |
| 25 to 34 Years | 871 (9.8%) | 7,535 (85.1%) |
| 35 to 44 Years | 1,085 (10.3%) | 8,808 (83.4%) |
| 45 to 54 Years | 916 (8.6%) | 9,341 (87.8%) |
| 55 to 64 Years | 1,475 (14.1%) | 8,397 (80.1%) |
| 65 to 74 Years | 7,782 (96.3%) | 5,232 (64.8%) |
| 75 Years and over | 5,244 (99.2%) | 3,970 (75.1%) |
| Total | 21,768 (27.5%) | 63,867 (80.6%) |
Disability Status by Sex by Age in Hancock County
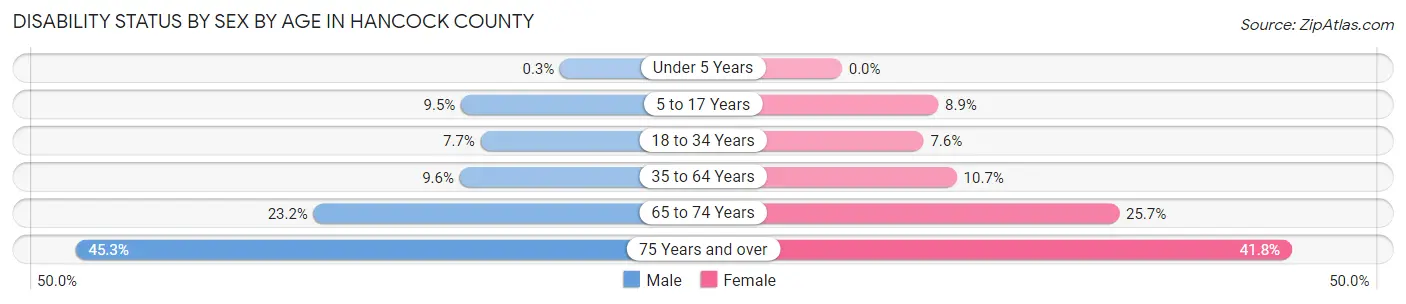
| Age Bracket | Male | Female |
| Under 5 Years | 7 (0.3%) | 0 (0.0%) |
| 5 to 17 Years | 692 (9.5%) | 608 (8.9%) |
| 18 to 34 Years | 608 (7.7%) | 585 (7.6%) |
| 35 to 64 Years | 1,515 (9.6%) | 1,697 (10.7%) |
| 65 to 74 Years | 876 (23.2%) | 1,106 (25.7%) |
| 75 Years and over | 1,052 (45.3%) | 1,238 (41.8%) |
Disability Class by Sex by Age in Hancock County
Disability Class: Hearing Difficulty

| Age Bracket | Male | Female |
| Under 5 Years | 0 (0.0%) | 0 (0.0%) |
| 5 to 17 Years | 207 (2.8%) | 18 (0.3%) |
| 18 to 34 Years | 240 (3.0%) | 93 (1.2%) |
| 35 to 64 Years | 758 (4.8%) | 270 (1.7%) |
| 65 to 74 Years | 315 (8.3%) | 429 (10.0%) |
| 75 Years and over | 620 (26.7%) | 483 (16.3%) |
Disability Class: Vision Difficulty
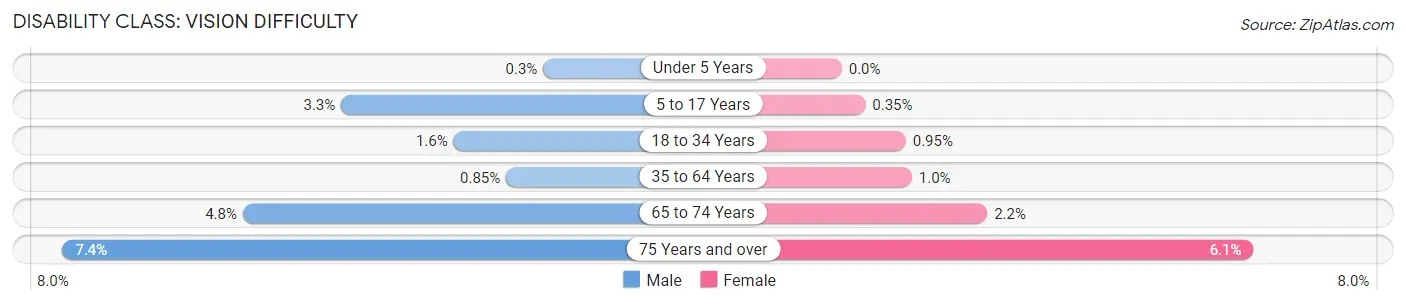
| Age Bracket | Male | Female |
| Under 5 Years | 7 (0.3%) | 0 (0.0%) |
| 5 to 17 Years | 241 (3.3%) | 24 (0.4%) |
| 18 to 34 Years | 129 (1.6%) | 73 (0.9%) |
| 35 to 64 Years | 134 (0.9%) | 166 (1.0%) |
| 65 to 74 Years | 180 (4.8%) | 93 (2.2%) |
| 75 Years and over | 173 (7.4%) | 181 (6.1%) |
Disability Class: Cognitive Difficulty
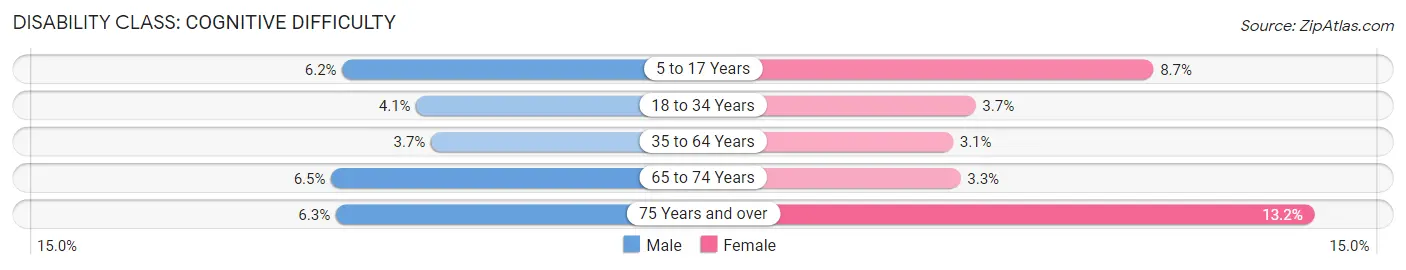
| Age Bracket | Male | Female |
| 5 to 17 Years | 449 (6.1%) | 590 (8.7%) |
| 18 to 34 Years | 324 (4.1%) | 287 (3.7%) |
| 35 to 64 Years | 581 (3.7%) | 492 (3.1%) |
| 65 to 74 Years | 244 (6.5%) | 142 (3.3%) |
| 75 Years and over | 147 (6.3%) | 390 (13.2%) |
Disability Class: Ambulatory Difficulty
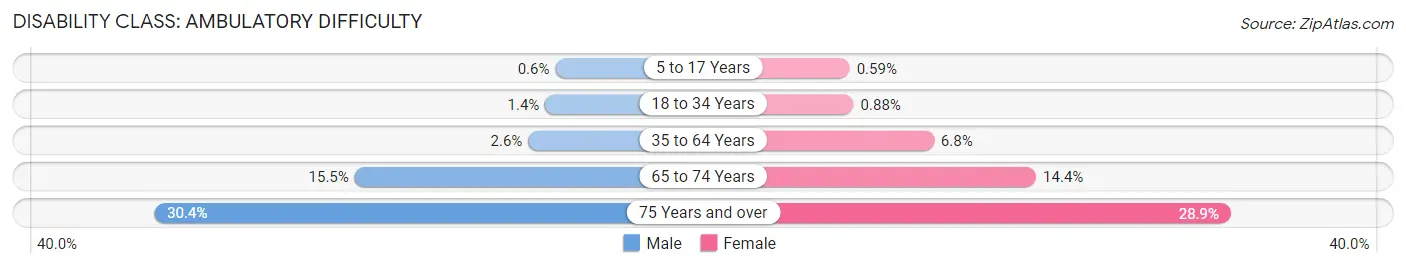
| Age Bracket | Male | Female |
| 5 to 17 Years | 44 (0.6%) | 40 (0.6%) |
| 18 to 34 Years | 107 (1.3%) | 68 (0.9%) |
| 35 to 64 Years | 411 (2.6%) | 1,089 (6.8%) |
| 65 to 74 Years | 586 (15.5%) | 620 (14.4%) |
| 75 Years and over | 706 (30.4%) | 856 (28.9%) |
Disability Class: Self-Care Difficulty
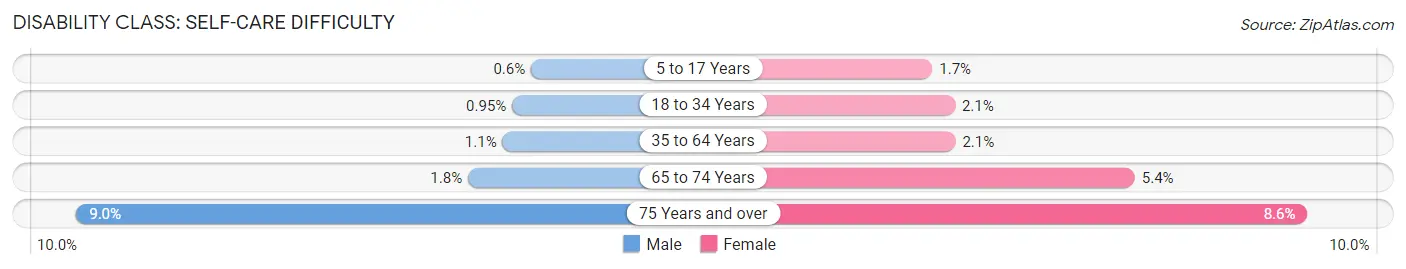
| Age Bracket | Male | Female |
| 5 to 17 Years | 44 (0.6%) | 114 (1.7%) |
| 18 to 34 Years | 75 (0.9%) | 162 (2.1%) |
| 35 to 64 Years | 179 (1.1%) | 335 (2.1%) |
| 65 to 74 Years | 67 (1.8%) | 234 (5.4%) |
| 75 Years and over | 210 (9.0%) | 256 (8.6%) |
Technology Access in Hancock County
Computing Device Access in Hancock County
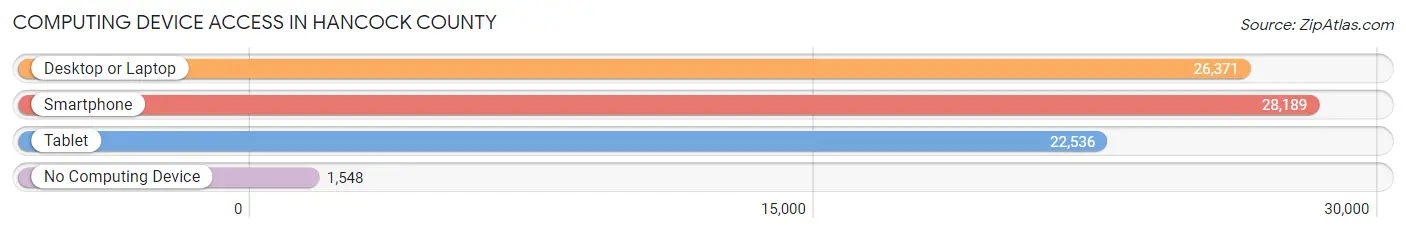
| Device Type | # Households | % Households |
| Desktop or Laptop | 26,371 | 83.9% |
| Smartphone | 28,189 | 89.7% |
| Tablet | 22,536 | 71.7% |
| No Computing Device | 1,548 | 4.9% |
| Total | 31,424 | 100.0% |
Internet Access in Hancock County
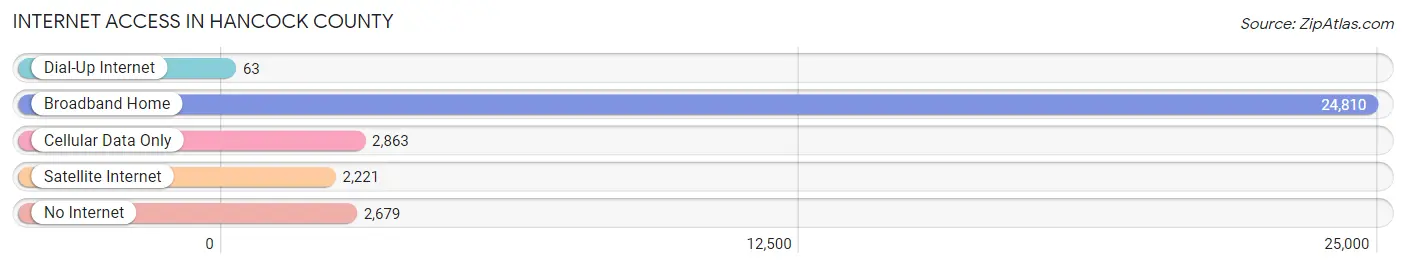
| Internet Type | # Households | % Households |
| Dial-Up Internet | 63 | 0.2% |
| Broadband Home | 24,810 | 78.9% |
| Cellular Data Only | 2,863 | 9.1% |
| Satellite Internet | 2,221 | 7.1% |
| No Internet | 2,679 | 8.5% |
| Total | 31,424 | 100.0% |
Hancock County Summary
Hancock County, Indiana is located in the central part of the state, just east of Indianapolis. It is bordered by Marion, Shelby, Rush, Madison, and Henry counties. The county seat is Greenfield, and the county was named after John Hancock, the first signer of the Declaration of Independence.
History
Hancock County was formed in 1828 from parts of Madison and Shelby counties. The county was named after John Hancock, the first signer of the Declaration of Independence. The first settlers in the area were Quakers, who arrived in the early 1800s. The county was largely agricultural, with corn, wheat, and livestock being the main crops.
In the late 1800s, the county began to industrialize, with the construction of the Indianapolis, Peru, and Chicago Railroad. This railroad connected the county to the rest of the state and allowed for the growth of industry. The county also saw the development of several small towns, such as Greenfield, Fortville, and McCordsville.
Geography
Hancock County is located in the central part of Indiana, just east of Indianapolis. It is bordered by Marion, Shelby, Rush, Madison, and Henry counties. The county has a total area of 441 square miles, of which 437 square miles is land and 4 square miles is water. The county is mostly flat, with some rolling hills in the northern part. The county is drained by the Big Blue River, which flows through the county from north to south.
Economy
Hancock County has a diverse economy, with a mix of manufacturing, agriculture, and services. The county is home to several large employers, including Honda Manufacturing of Indiana, Elanco Animal Health, and the Greenfield-Central Community School Corporation. The county also has a strong agricultural sector, with corn, wheat, and soybeans being the main crops.
Demographics
As of the 2010 census, Hancock County had a population of 71,749. The population was spread out, with 24.3% under the age of 18, 8.2% from 18 to 24, 28.2% from 25 to 44, 25.2% from 45 to 64, and 14.1% who were 65 years of age or older. The median age was 37.5 years. The median income for a household in the county was $50,945, and the median income for a family was $62,917.
Hancock County is largely white, with 87.3% of the population identifying as white. The largest minority group is African American, making up 8.2% of the population. Other minority groups include Hispanic (2.3%), Asian (1.2%), and Native American (0.3%).
Conclusion
Hancock County, Indiana is a diverse county located in the central part of the state. It has a mix of manufacturing, agriculture, and services, and is home to several large employers. The county is largely white, with African Americans making up the largest minority group. The county has a median income of $50,945 and a median age of 37.5 years.
Common Questions
What is the Total Population of Hancock County?
Total Population of Hancock County is 80,170.
What is the Total Male Population of Hancock County?
Total Male Population of Hancock County is 39,956.
What is the Total Female Population of Hancock County?
Total Female Population of Hancock County is 40,214.
What is the Ratio of Males per 100 Females in Hancock County?
There are 99.36 Males per 100 Females in Hancock County.
What is the Ratio of Females per 100 Males in Hancock County?
There are 100.65 Females per 100 Males in Hancock County.
What is the Median Population Age in Hancock County?
Median Population Age in Hancock County is 39.6 Years.
What is the Average Family Size in Hancock County
Average Family Size in Hancock County is 3.0 People.
What is the Average Household Size in Hancock County
Average Household Size in Hancock County is 2.5 People.
What is Per Capita Income in Hancock County?
Per Capita income in Hancock County is $42,666.
What is the Median Family Income in Hancock County?
Median Family Income in Hancock County is $103,458.
What is the Median Household income in Hancock County?
Median Household Income in Hancock County is $85,262.
What is Income or Wage Gap in Hancock County?
Income or Wage Gap in Hancock County is 32.8%.
Women in Hancock County earn 67.2 cents for every dollar earned by a man.
What is Family Income Deficit in Hancock County?
Family Income Deficit in Hancock County is $11,515.
Families that are below poverty line in Hancock County earn $11,515 less on average than the poverty threshold level.
What is Inequality or Gini Index in Hancock County?
Inequality or Gini Index in Hancock County is 0.39.
How Large is the Labor Force in Hancock County?
There are 43,544 People in the Labor Forcein in Hancock County.
What is the Percentage of People in the Labor Force in Hancock County?
68.2% of People are in the Labor Force in Hancock County.
What is the Unemployment Rate in Hancock County?
Unemployment Rate in Hancock County is 2.7%.