Hamilton County, IN
Hamilton County Map
Hamilton County Overview
349,527
TOTAL POPULATION
172,239
MALE POPULATION
177,288
FEMALE POPULATION
97.15
MALES / 100 FEMALES
102.93
FEMALES / 100 MALES
37.8
MEDIAN AGE
3.1
AVG FAMILY SIZE
2.7
AVG HOUSEHOLD SIZE
$56,943
PER CAPITA INCOME
$136,081
AVG FAMILY INCOME
$114,866
AVG HOUSEHOLD INCOME
39.4%
WAGE / INCOME GAP [ % ]
60.6¢/ $1
WAGE / INCOME GAP [ $ ]
$12,356
FAMILY INCOME DEFICIT
0.44
INEQUALITY / GINI INDEX
192,235
LABOR FORCE [ PEOPLE ]
71.3%
PERCENT IN LABOR FORCE
2.7%
UNEMPLOYMENT RATE
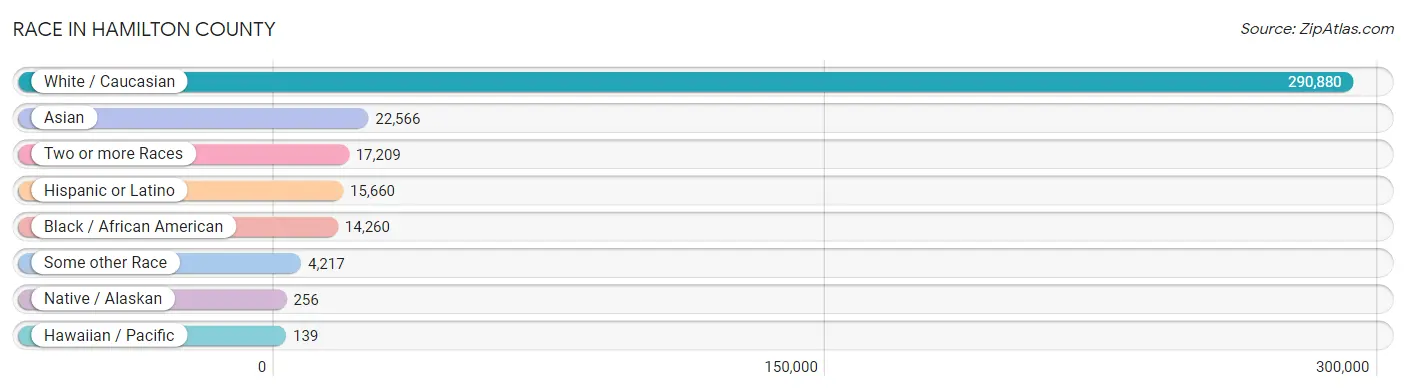
Race in Hamilton County
The most populous races in Hamilton County are White / Caucasian (290,880 | 83.2%), Asian (22,566 | 6.5%), and Two or more Races (17,209 | 4.9%).
| Race | # Population | % Population |
| Asian | 22,566 | 6.5% |
| Black / African American | 14,260 | 4.1% |
| Hawaiian / Pacific | 139 | 0.0% |
| Hispanic or Latino | 15,660 | 4.5% |
| Native / Alaskan | 256 | 0.1% |
| White / Caucasian | 290,880 | 83.2% |
| Two or more Races | 17,209 | 4.9% |
| Some other Race | 4,217 | 1.2% |
| Total | 349,527 | 100.0% |
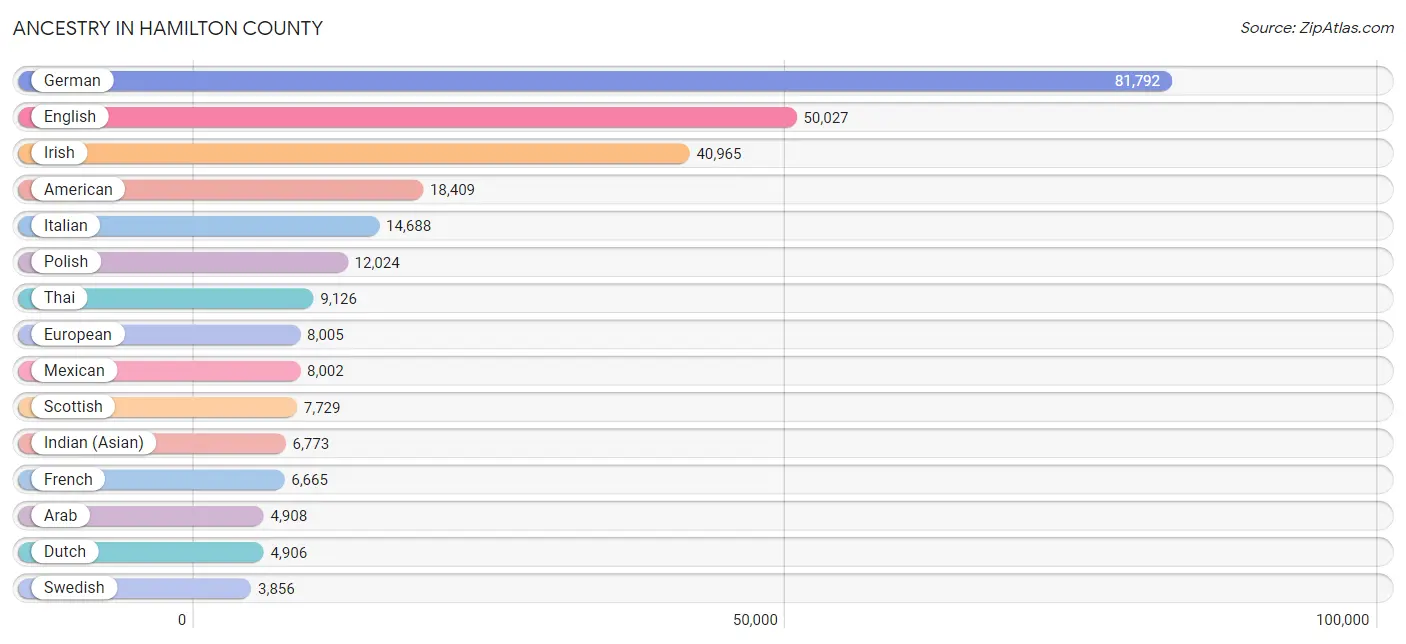
Ancestry in Hamilton County
The most populous ancestries reported in Hamilton County are German (81,792 | 23.4%), English (50,027 | 14.3%), Irish (40,965 | 11.7%), American (18,409 | 5.3%), and Italian (14,688 | 4.2%), together accounting for 58.9% of all Hamilton County residents.
| Ancestry | # Population | % Population |
| Afghan | 382 | 0.1% |
| African | 778 | 0.2% |
| Albanian | 19 | 0.0% |
| Alsatian | 9 | 0.0% |
| American | 18,409 | 5.3% |
| Apache | 15 | 0.0% |
| Arab | 4,908 | 1.4% |
| Arapaho | 6 | 0.0% |
| Argentinean | 523 | 0.2% |
| Armenian | 157 | 0.0% |
| Assyrian / Chaldean / Syriac | 36 | 0.0% |
| Australian | 35 | 0.0% |
| Austrian | 663 | 0.2% |
| Bahamian | 30 | 0.0% |
| Bangladeshi | 187 | 0.1% |
| Barbadian | 59 | 0.0% |
| Belgian | 592 | 0.2% |
| Bhutanese | 1,742 | 0.5% |
| Blackfeet | 18 | 0.0% |
| Bolivian | 12 | 0.0% |
| Brazilian | 543 | 0.2% |
| British | 2,742 | 0.8% |
| Bulgarian | 89 | 0.0% |
| Burmese | 2,067 | 0.6% |
| Cajun | 15 | 0.0% |
| Canadian | 668 | 0.2% |
| Celtic | 33 | 0.0% |
| Central American | 1,239 | 0.4% |
| Central American Indian | 69 | 0.0% |
| Cherokee | 272 | 0.1% |
| Chilean | 96 | 0.0% |
| Chippewa | 10 | 0.0% |
| Colombian | 371 | 0.1% |
| Costa Rican | 88 | 0.0% |
| Creek | 2 | 0.0% |
| Croatian | 413 | 0.1% |
| Cuban | 375 | 0.1% |
| Czech | 1,325 | 0.4% |
| Czechoslovakian | 282 | 0.1% |
| Danish | 1,452 | 0.4% |
| Dominican | 117 | 0.0% |
| Dutch | 4,906 | 1.4% |
| Eastern European | 1,141 | 0.3% |
| Ecuadorian | 122 | 0.0% |
| Egyptian | 1,805 | 0.5% |
| English | 50,027 | 14.3% |
| Ethiopian | 19 | 0.0% |
| European | 8,005 | 2.3% |
| Fijian | 59 | 0.0% |
| Filipino | 140 | 0.0% |
| Finnish | 410 | 0.1% |
| French | 6,665 | 1.9% |
| French American Indian | 22 | 0.0% |
| French Canadian | 1,318 | 0.4% |
| German | 81,792 | 23.4% |
| Ghanaian | 89 | 0.0% |
| Greek | 1,523 | 0.4% |
| Guamanian / Chamorro | 44 | 0.0% |
| Guatemalan | 427 | 0.1% |
| Haitian | 26 | 0.0% |
| Honduran | 182 | 0.1% |
| Hungarian | 1,202 | 0.3% |
| Icelander | 11 | 0.0% |
| Indian (Asian) | 6,773 | 1.9% |
| Indonesian | 152 | 0.0% |
| Iranian | 137 | 0.0% |
| Iraqi | 59 | 0.0% |
| Irish | 40,965 | 11.7% |
| Iroquois | 43 | 0.0% |
| Israeli | 53 | 0.0% |
| Italian | 14,688 | 4.2% |
| Jamaican | 110 | 0.0% |
| Japanese | 231 | 0.1% |
| Jordanian | 671 | 0.2% |
| Kenyan | 12 | 0.0% |
| Korean | 2,119 | 0.6% |
| Laotian | 313 | 0.1% |
| Latvian | 316 | 0.1% |
| Lebanese | 536 | 0.2% |
| Liberian | 237 | 0.1% |
| Lithuanian | 687 | 0.2% |
| Luxembourger | 58 | 0.0% |
| Macedonian | 264 | 0.1% |
| Malaysian | 167 | 0.1% |
| Maltese | 186 | 0.1% |
| Mexican | 8,002 | 2.3% |
| Mexican American Indian | 269 | 0.1% |
| Mongolian | 26 | 0.0% |
| Moroccan | 44 | 0.0% |
| Native Hawaiian | 85 | 0.0% |
| Navajo | 60 | 0.0% |
| New Zealander | 33 | 0.0% |
| Nicaraguan | 97 | 0.0% |
| Nigerian | 1,047 | 0.3% |
| Northern European | 980 | 0.3% |
| Norwegian | 2,930 | 0.8% |
| Okinawan | 15 | 0.0% |
| Osage | 5 | 0.0% |
| Ottawa | 16 | 0.0% |
| Pakistani | 166 | 0.1% |
| Palestinian | 223 | 0.1% |
| Panamanian | 77 | 0.0% |
| Pennsylvania German | 313 | 0.1% |
| Peruvian | 358 | 0.1% |
| Polish | 12,024 | 3.4% |
| Portuguese | 412 | 0.1% |
| Puerto Rican | 1,642 | 0.5% |
| Romanian | 548 | 0.2% |
| Russian | 2,036 | 0.6% |
| Salvadoran | 368 | 0.1% |
| Samoan | 16 | 0.0% |
| Scandinavian | 888 | 0.3% |
| Scotch-Irish | 3,129 | 0.9% |
| Scottish | 7,729 | 2.2% |
| Senegalese | 216 | 0.1% |
| Serbian | 368 | 0.1% |
| Sierra Leonean | 92 | 0.0% |
| Sioux | 21 | 0.0% |
| Slavic | 132 | 0.0% |
| Slovak | 1,276 | 0.4% |
| Slovene | 384 | 0.1% |
| Somali | 47 | 0.0% |
| South African | 184 | 0.1% |
| South American | 3,498 | 1.0% |
| Spaniard | 231 | 0.1% |
| Spanish | 115 | 0.0% |
| Sri Lankan | 1,779 | 0.5% |
| Subsaharan African | 2,766 | 0.8% |
| Swedish | 3,856 | 1.1% |
| Swiss | 1,873 | 0.5% |
| Syrian | 311 | 0.1% |
| Thai | 9,126 | 2.6% |
| Trinidadian and Tobagonian | 46 | 0.0% |
| Turkish | 193 | 0.1% |
| Ukrainian | 1,418 | 0.4% |
| Venezuelan | 2,016 | 0.6% |
| Vietnamese | 135 | 0.0% |
| Welsh | 2,425 | 0.7% |
| Yugoslavian | 156 | 0.0% |
| Zimbabwean | 18 | 0.0% | View All 140 Rows |
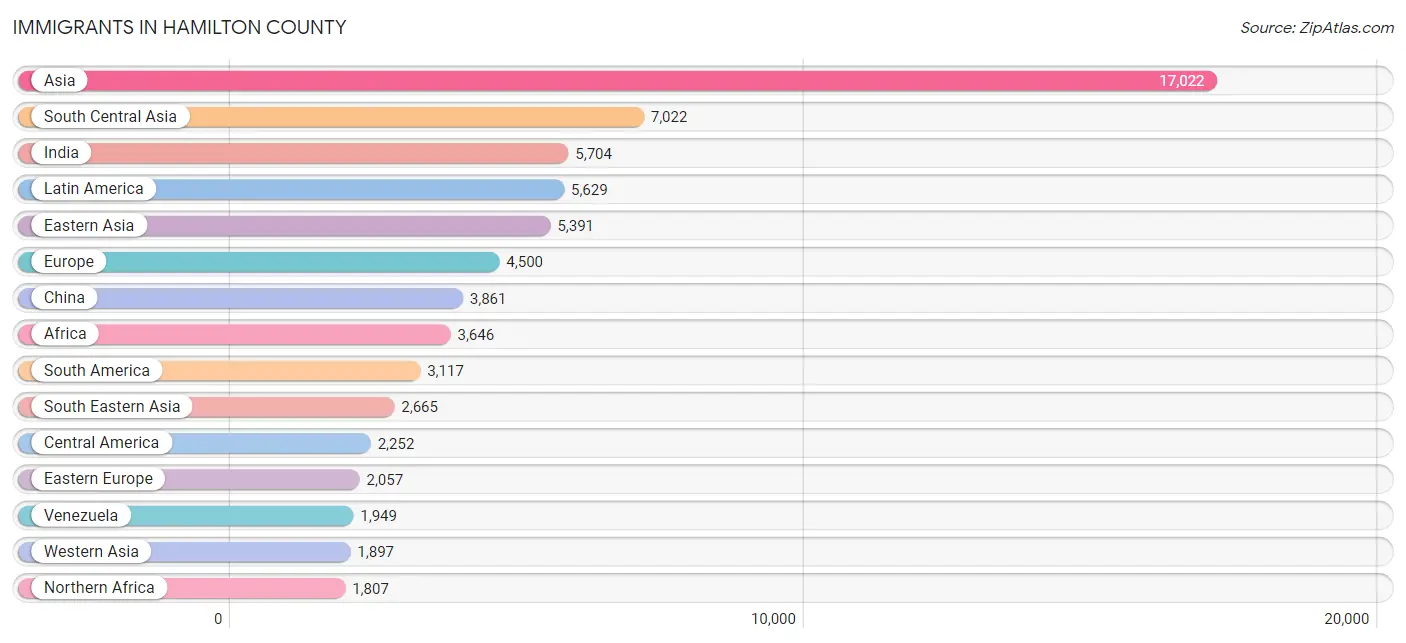
Immigrants in Hamilton County
The most numerous immigrant groups reported in Hamilton County came from Asia (17,022 | 4.9%), South Central Asia (7,022 | 2.0%), India (5,704 | 1.6%), Latin America (5,629 | 1.6%), and Eastern Asia (5,391 | 1.5%), together accounting for 11.7% of all Hamilton County residents.
| Immigration Origin | # Population | % Population |
| Afghanistan | 127 | 0.0% |
| Africa | 3,646 | 1.0% |
| Albania | 19 | 0.0% |
| Argentina | 38 | 0.0% |
| Armenia | 26 | 0.0% |
| Asia | 17,022 | 4.9% |
| Australia | 44 | 0.0% |
| Bangladesh | 130 | 0.0% |
| Barbados | 59 | 0.0% |
| Belarus | 34 | 0.0% |
| Belize | 6 | 0.0% |
| Bosnia and Herzegovina | 100 | 0.0% |
| Brazil | 617 | 0.2% |
| Bulgaria | 38 | 0.0% |
| Cambodia | 200 | 0.1% |
| Canada | 1,128 | 0.3% |
| Caribbean | 260 | 0.1% |
| Central America | 2,252 | 0.6% |
| Chile | 61 | 0.0% |
| China | 3,861 | 1.1% |
| Colombia | 230 | 0.1% |
| Costa Rica | 9 | 0.0% |
| Croatia | 65 | 0.0% |
| Cuba | 43 | 0.0% |
| Dominican Republic | 31 | 0.0% |
| Eastern Africa | 125 | 0.0% |
| Eastern Asia | 5,391 | 1.5% |
| Eastern Europe | 2,057 | 0.6% |
| Egypt | 1,555 | 0.4% |
| England | 588 | 0.2% |
| Ethiopia | 43 | 0.0% |
| Europe | 4,500 | 1.3% |
| France | 115 | 0.0% |
| Germany | 657 | 0.2% |
| Ghana | 89 | 0.0% |
| Greece | 209 | 0.1% |
| Guatemala | 297 | 0.1% |
| Haiti | 49 | 0.0% |
| Honduras | 38 | 0.0% |
| Hong Kong | 240 | 0.1% |
| Hungary | 58 | 0.0% |
| India | 5,704 | 1.6% |
| Indonesia | 263 | 0.1% |
| Iran | 290 | 0.1% |
| Iraq | 124 | 0.0% |
| Ireland | 52 | 0.0% |
| Israel | 23 | 0.0% |
| Italy | 39 | 0.0% |
| Jamaica | 78 | 0.0% |
| Japan | 613 | 0.2% |
| Jordan | 782 | 0.2% |
| Kenya | 28 | 0.0% |
| Korea | 917 | 0.3% |
| Kuwait | 147 | 0.0% |
| Laos | 71 | 0.0% |
| Latin America | 5,629 | 1.6% |
| Latvia | 115 | 0.0% |
| Lebanon | 31 | 0.0% |
| Liberia | 201 | 0.1% |
| Lithuania | 39 | 0.0% |
| Malaysia | 45 | 0.0% |
| Mexico | 1,774 | 0.5% |
| Middle Africa | 21 | 0.0% |
| Morocco | 9 | 0.0% |
| Nepal | 58 | 0.0% |
| Netherlands | 20 | 0.0% |
| Nicaragua | 52 | 0.0% |
| Nigeria | 774 | 0.2% |
| Northern Africa | 1,807 | 0.5% |
| Northern Europe | 1,264 | 0.4% |
| Oceania | 136 | 0.0% |
| Pakistan | 676 | 0.2% |
| Panama | 76 | 0.0% |
| Peru | 190 | 0.1% |
| Philippines | 780 | 0.2% |
| Poland | 174 | 0.1% |
| Portugal | 10 | 0.0% |
| Romania | 129 | 0.0% |
| Russia | 670 | 0.2% |
| Saudi Arabia | 148 | 0.0% |
| Scotland | 94 | 0.0% |
| Senegal | 101 | 0.0% |
| Serbia | 14 | 0.0% |
| Sierra Leone | 87 | 0.0% |
| Singapore | 59 | 0.0% |
| South Africa | 87 | 0.0% |
| South America | 3,117 | 0.9% |
| South Central Asia | 7,022 | 2.0% |
| South Eastern Asia | 2,665 | 0.8% |
| Southern Europe | 350 | 0.1% |
| Spain | 92 | 0.0% |
| Sweden | 77 | 0.0% |
| Switzerland | 37 | 0.0% |
| Syria | 379 | 0.1% |
| Taiwan | 252 | 0.1% |
| Thailand | 81 | 0.0% |
| Turkey | 58 | 0.0% |
| Ukraine | 579 | 0.2% |
| Uzbekistan | 37 | 0.0% |
| Venezuela | 1,949 | 0.6% |
| Vietnam | 1,014 | 0.3% |
| Western Africa | 1,573 | 0.4% |
| Western Asia | 1,897 | 0.5% |
| Western Europe | 829 | 0.2% |
| Yemen | 160 | 0.1% |
| Zaire | 21 | 0.0% |
| Zimbabwe | 13 | 0.0% | View All 107 Rows |
Sex and Age in Hamilton County
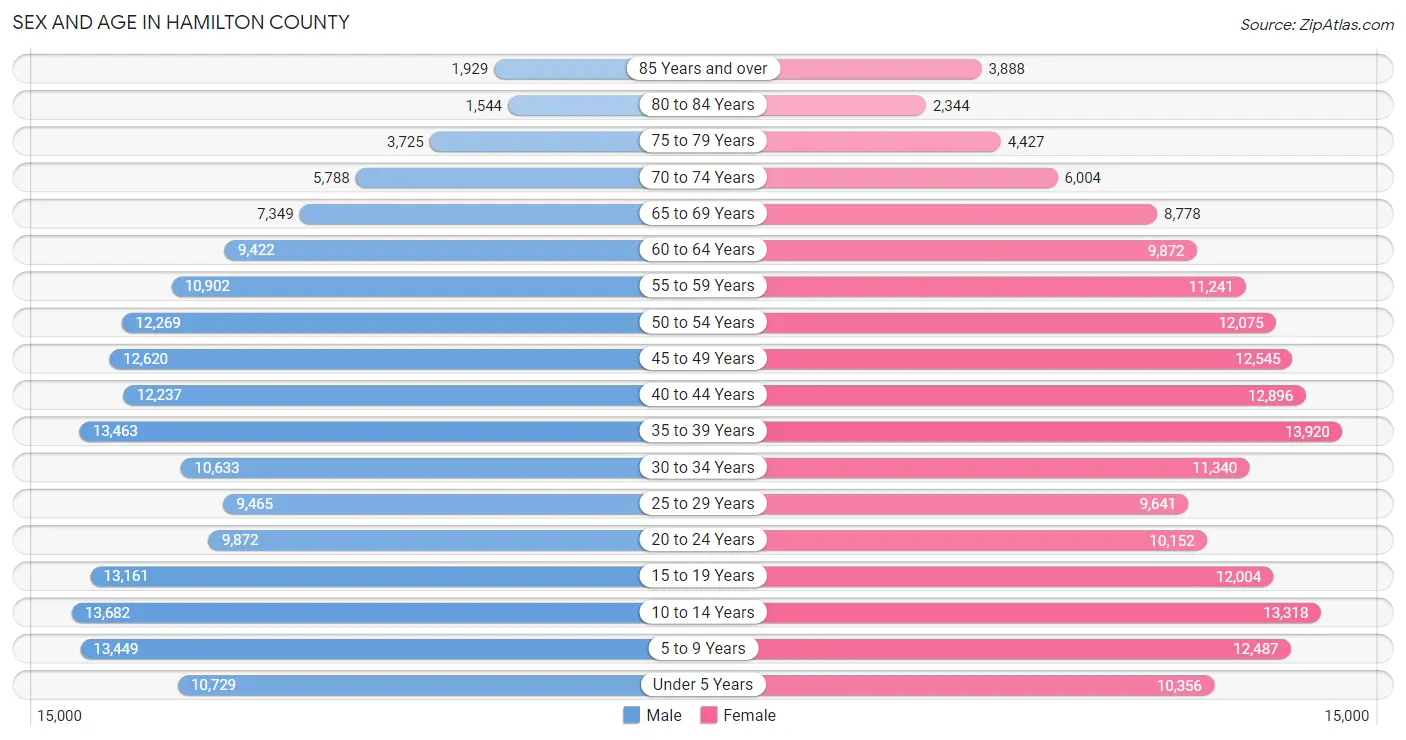
Sex and Age in Hamilton County
The most populous age groups in Hamilton County are 10 to 14 Years (13,682 | 7.9%) for men and 35 to 39 Years (13,920 | 7.9%) for women.
| Age Bracket | Male | Female |
| Under 5 Years | 10,729 (6.2%) | 10,356 (5.8%) |
| 5 to 9 Years | 13,449 (7.8%) | 12,487 (7.0%) |
| 10 to 14 Years | 13,682 (7.9%) | 13,318 (7.5%) |
| 15 to 19 Years | 13,161 (7.6%) | 12,004 (6.8%) |
| 20 to 24 Years | 9,872 (5.7%) | 10,152 (5.7%) |
| 25 to 29 Years | 9,465 (5.5%) | 9,641 (5.4%) |
| 30 to 34 Years | 10,633 (6.2%) | 11,340 (6.4%) |
| 35 to 39 Years | 13,463 (7.8%) | 13,920 (7.9%) |
| 40 to 44 Years | 12,237 (7.1%) | 12,896 (7.3%) |
| 45 to 49 Years | 12,620 (7.3%) | 12,545 (7.1%) |
| 50 to 54 Years | 12,269 (7.1%) | 12,075 (6.8%) |
| 55 to 59 Years | 10,902 (6.3%) | 11,241 (6.3%) |
| 60 to 64 Years | 9,422 (5.5%) | 9,872 (5.6%) |
| 65 to 69 Years | 7,349 (4.3%) | 8,778 (5.0%) |
| 70 to 74 Years | 5,788 (3.4%) | 6,004 (3.4%) |
| 75 to 79 Years | 3,725 (2.2%) | 4,427 (2.5%) |
| 80 to 84 Years | 1,544 (0.9%) | 2,344 (1.3%) |
| 85 Years and over | 1,929 (1.1%) | 3,888 (2.2%) |
| Total | 172,239 (100.0%) | 177,288 (100.0%) |
Families and Households in Hamilton County
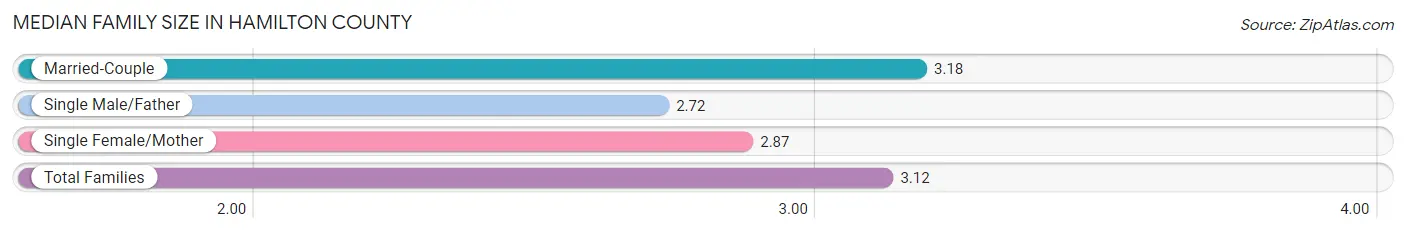
Median Family Size in Hamilton County
The median family size in Hamilton County is 3.12 persons per family, with married-couple families (82,736 | 84.9%) accounting for the largest median family size of 3.18 persons per family. On the other hand, single male/father families (4,675 | 4.8%) represent the smallest median family size with 2.72 persons per family.
| Family Type | # Families | Family Size |
| Married-Couple | 82,736 (84.9%) | 3.18 |
| Single Male/Father | 4,675 (4.8%) | 2.72 |
| Single Female/Mother | 10,030 (10.3%) | 2.87 |
| Total Families | 97,441 (100.0%) | 3.12 |
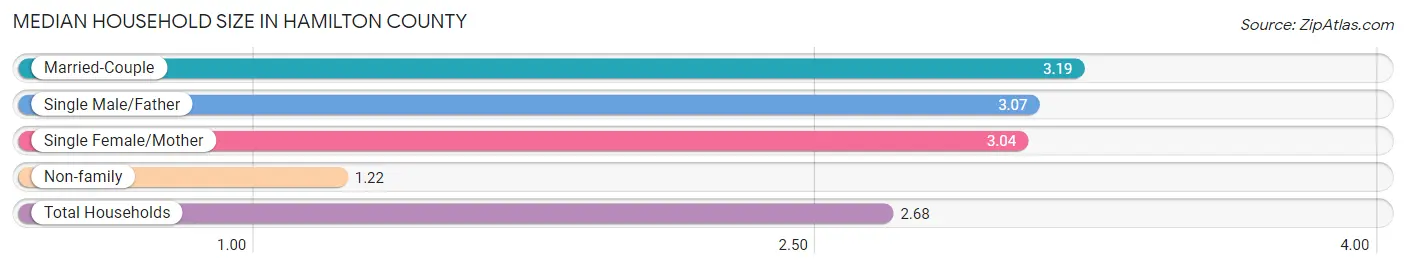
Median Household Size in Hamilton County
The median household size in Hamilton County is 2.68 persons per household, with married-couple households (82,736 | 63.8%) accounting for the largest median household size of 3.19 persons per household. non-family households (32,308 | 24.9%) represent the smallest median household size with 1.22 persons per household.
| Household Type | # Households | Household Size |
| Married-Couple | 82,736 (63.8%) | 3.19 |
| Single Male/Father | 4,675 (3.6%) | 3.07 |
| Single Female/Mother | 10,030 (7.7%) | 3.04 |
| Non-family | 32,308 (24.9%) | 1.22 |
| Total Households | 129,749 (100.0%) | 2.68 |
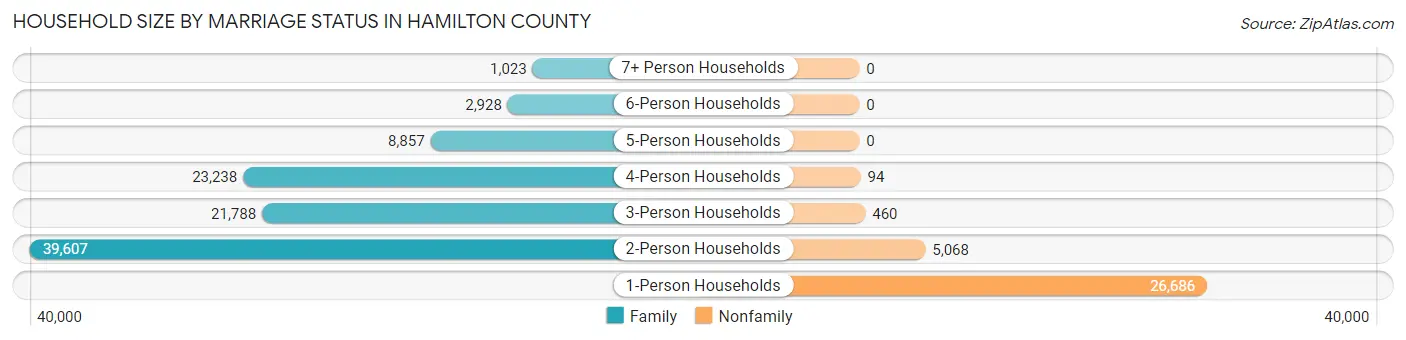
Household Size by Marriage Status in Hamilton County
Out of a total of 129,749 households in Hamilton County, 97,441 (75.1%) are family households, while 32,308 (24.9%) are nonfamily households. The most numerous type of family households are 2-person households, comprising 39,607, and the most common type of nonfamily households are 1-person households, comprising 26,686.
| Household Size | Family Households | Nonfamily Households |
| 1-Person Households | - | 26,686 (20.6%) |
| 2-Person Households | 39,607 (30.5%) | 5,068 (3.9%) |
| 3-Person Households | 21,788 (16.8%) | 460 (0.4%) |
| 4-Person Households | 23,238 (17.9%) | 94 (0.1%) |
| 5-Person Households | 8,857 (6.8%) | 0 (0.0%) |
| 6-Person Households | 2,928 (2.3%) | 0 (0.0%) |
| 7+ Person Households | 1,023 (0.8%) | 0 (0.0%) |
| Total | 97,441 (75.1%) | 32,308 (24.9%) |
Female Fertility in Hamilton County
Fertility by Age in Hamilton County
Average fertility rate in Hamilton County is 53.0 births per 1,000 women. Women in the age bracket of 20 to 34 years have the highest fertility rate with 95.0 births per 1,000 women. Women in the age bracket of 20 to 34 years acount for 66.1% of all women with births.
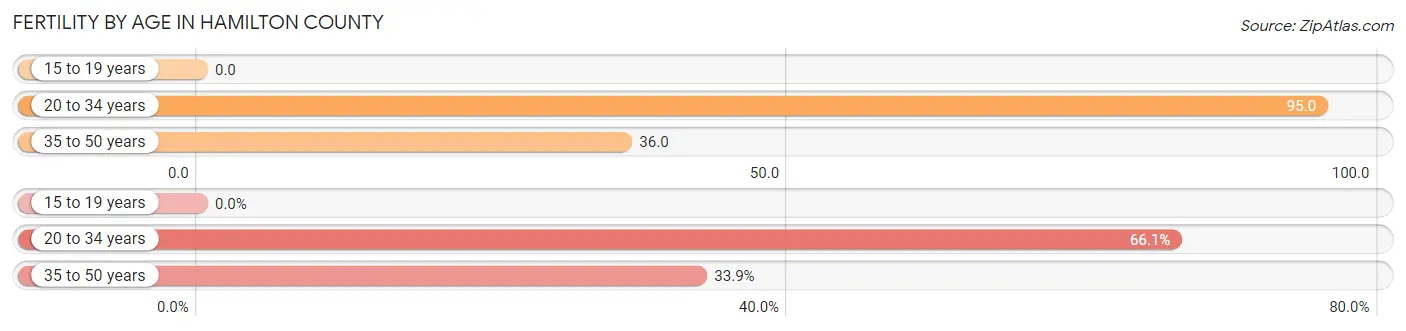
| Age Bracket | Women with Births | Births / 1,000 Women |
| 15 to 19 years | 0 (0.0%) | 0.0 |
| 20 to 34 years | 2,954 (66.1%) | 95.0 |
| 35 to 50 years | 1,514 (33.9%) | 36.0 |
| Total | 4,468 (100.0%) | 53.0 |
Fertility by Age by Marriage Status in Hamilton County
93.4% of women with births (4,468) in Hamilton County are married. The highest percentage of unmarried women with births falls into 20 to 34 years age bracket with 8.2% of them unmarried at the time of birth, while the lowest percentage of unmarried women with births belong to 35 to 50 years age bracket with 3.6% of them unmarried.
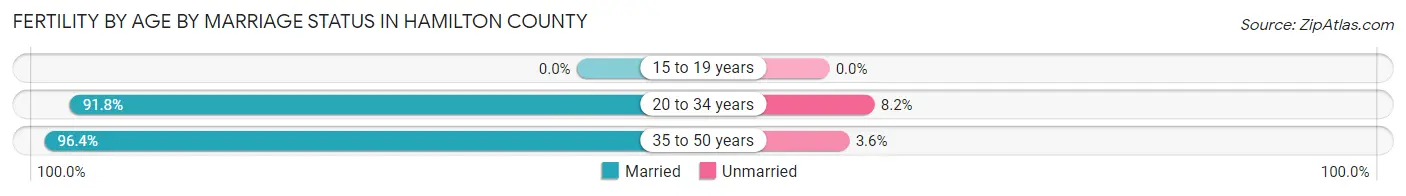
| Age Bracket | Married | Unmarried |
| 15 to 19 years | 0 (0.0%) | 0 (0.0%) |
| 20 to 34 years | 2,712 (91.8%) | 242 (8.2%) |
| 35 to 50 years | 1,459 (96.4%) | 55 (3.6%) |
| Total | 4,173 (93.4%) | 295 (6.6%) |
Fertility by Education in Hamilton County
Average fertility rate in Hamilton County is 53.0 births per 1,000 women. Women with the education attainment of bachelor's degree have the highest fertility rate of 62.0 births per 1,000 women, while women with the education attainment of less than high school have the lowest fertility at 40.0 births per 1,000 women. Women with the education attainment of bachelor's degree represent 41.6% of all women with births.
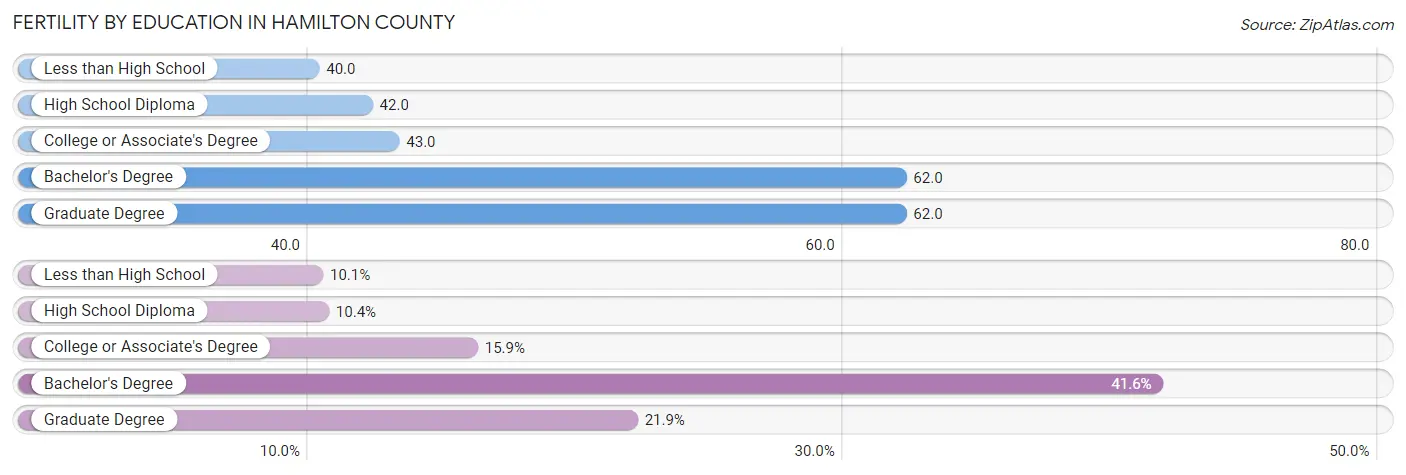
| Educational Attainment | Women with Births | Births / 1,000 Women |
| Less than High School | 453 (10.1%) | 40.0 |
| High School Diploma | 463 (10.4%) | 42.0 |
| College or Associate's Degree | 712 (15.9%) | 43.0 |
| Bachelor's Degree | 1,860 (41.6%) | 62.0 |
| Graduate Degree | 980 (21.9%) | 62.0 |
| Total | 4,468 (100.0%) | 53.0 |
Fertility by Education by Marriage Status in Hamilton County
6.6% of women with births in Hamilton County are unmarried. Women with the educational attainment of less than high school are most likely to be married with 100.0% of them married at childbirth, while women with the educational attainment of college or associate's degree are least likely to be married with 25.4% of them unmarried at childbirth.
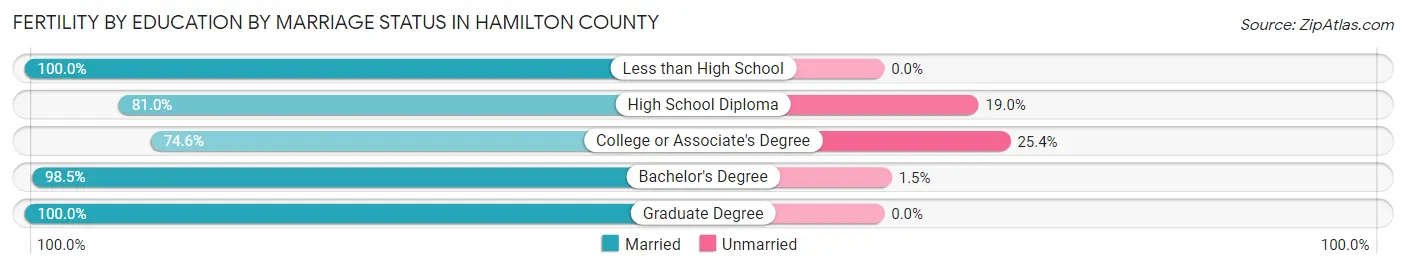
| Educational Attainment | Married | Unmarried |
| Less than High School | 453 (100.0%) | 0 (0.0%) |
| High School Diploma | 375 (81.0%) | 88 (19.0%) |
| College or Associate's Degree | 531 (74.6%) | 181 (25.4%) |
| Bachelor's Degree | 1,832 (98.5%) | 28 (1.5%) |
| Graduate Degree | 980 (100.0%) | 0 (0.0%) |
| Total | 4,173 (93.4%) | 295 (6.6%) |
Income in Hamilton County
Income Overview in Hamilton County
Per Capita Income in Hamilton County is $56,943, while median incomes of families and households are $136,081 and $114,866 respectively.
| Characteristic | Number | Measure |
| Per Capita Income | 349,527 | $56,943 |
| Median Family Income | 97,441 | $136,081 |
| Mean Family Income | 97,441 | $174,898 |
| Median Household Income | 129,749 | $114,866 |
| Mean Household Income | 129,749 | $151,722 |
| Income Deficit | 97,441 | $12,356 |
| Wage / Income Gap (%) | 349,527 | 39.39% |
| Wage / Income Gap ($) | 349,527 | 60.61¢ per $1 |
| Gini / Inequality Index | 349,527 | 0.44 |
Earnings by Sex in Hamilton County
Average Earnings in Hamilton County are $59,204, $75,823 for men and $45,955 for women, a difference of 39.4%.
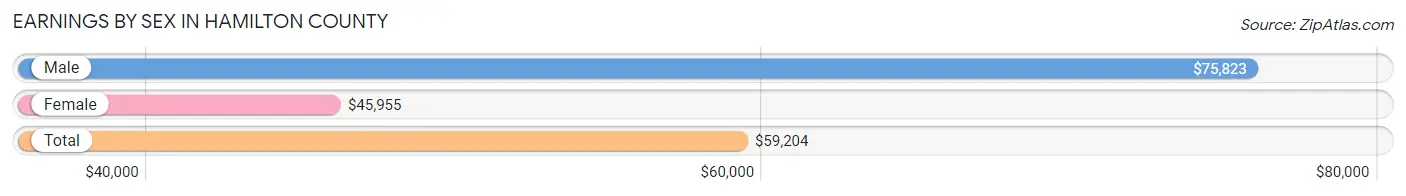
| Sex | Number | Average Earnings |
| Male | 107,034 (53.6%) | $75,823 |
| Female | 92,793 (46.4%) | $45,955 |
| Total | 199,827 (100.0%) | $59,204 |
Earnings by Sex by Income Bracket in Hamilton County
The most common earnings brackets in Hamilton County are $100,000+ for men (40,095 | 37.5%) and $100,000+ for women (15,480 | 16.7%).
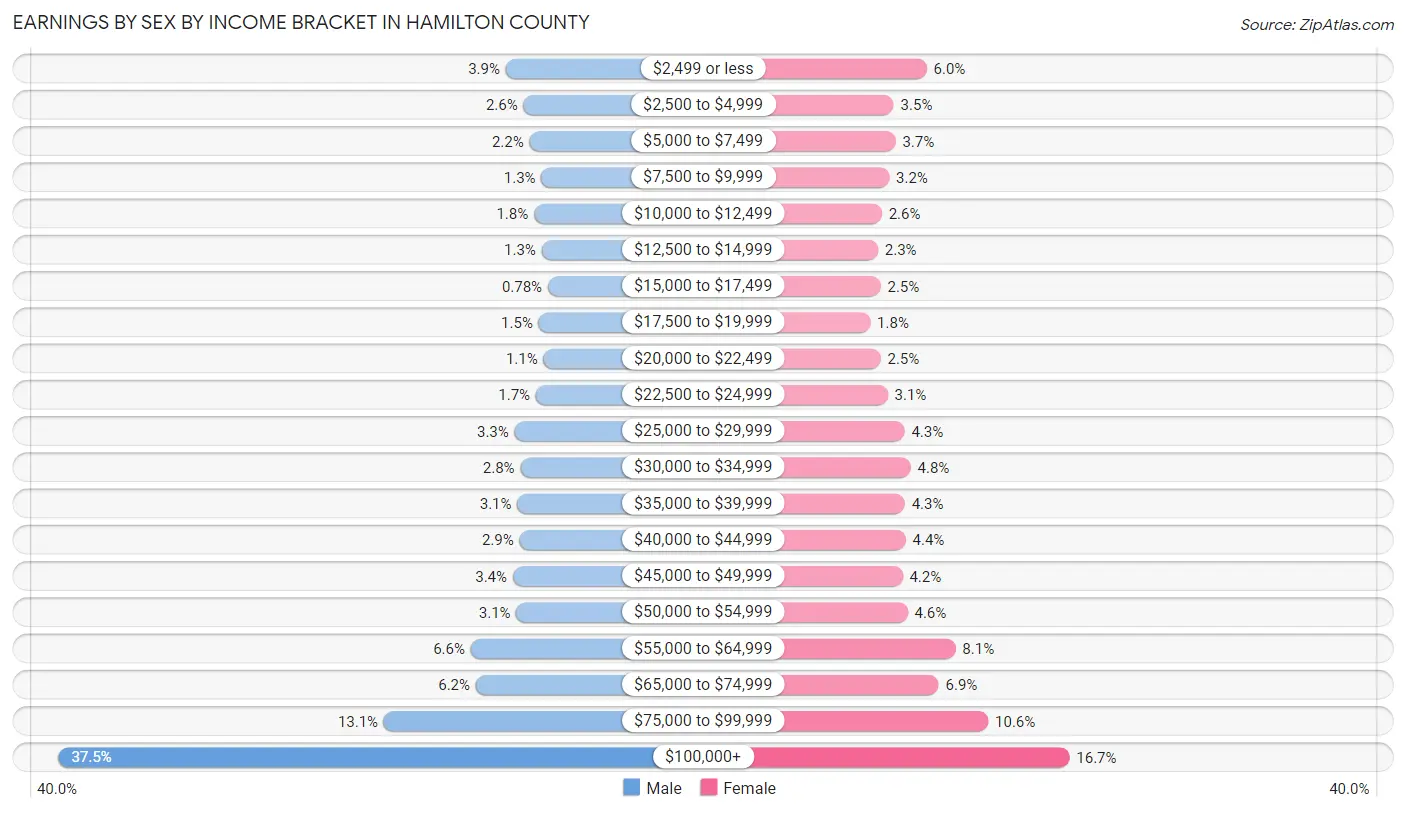
| Income | Male | Female |
| $2,499 or less | 4,216 (3.9%) | 5,551 (6.0%) |
| $2,500 to $4,999 | 2,797 (2.6%) | 3,258 (3.5%) |
| $5,000 to $7,499 | 2,308 (2.2%) | 3,386 (3.6%) |
| $7,500 to $9,999 | 1,356 (1.3%) | 2,940 (3.2%) |
| $10,000 to $12,499 | 1,945 (1.8%) | 2,434 (2.6%) |
| $12,500 to $14,999 | 1,333 (1.3%) | 2,160 (2.3%) |
| $15,000 to $17,499 | 830 (0.8%) | 2,347 (2.5%) |
| $17,500 to $19,999 | 1,572 (1.5%) | 1,628 (1.8%) |
| $20,000 to $22,499 | 1,193 (1.1%) | 2,346 (2.5%) |
| $22,500 to $24,999 | 1,803 (1.7%) | 2,843 (3.1%) |
| $25,000 to $29,999 | 3,514 (3.3%) | 4,007 (4.3%) |
| $30,000 to $34,999 | 3,035 (2.8%) | 4,431 (4.8%) |
| $35,000 to $39,999 | 3,291 (3.1%) | 4,030 (4.3%) |
| $40,000 to $44,999 | 3,110 (2.9%) | 4,090 (4.4%) |
| $45,000 to $49,999 | 3,652 (3.4%) | 3,865 (4.2%) |
| $50,000 to $54,999 | 3,364 (3.1%) | 4,224 (4.5%) |
| $55,000 to $64,999 | 7,017 (6.6%) | 7,557 (8.1%) |
| $65,000 to $74,999 | 6,615 (6.2%) | 6,387 (6.9%) |
| $75,000 to $99,999 | 13,988 (13.1%) | 9,829 (10.6%) |
| $100,000+ | 40,095 (37.5%) | 15,480 (16.7%) |
| Total | 107,034 (100.0%) | 92,793 (100.0%) |
Earnings by Sex by Educational Attainment in Hamilton County
Average earnings in Hamilton County are $87,259 for men and $53,398 for women, a difference of 38.8%. Men with an educational attainment of graduate degree enjoy the highest average annual earnings of $131,177, while those with less than high school education earn the least with $39,949. Women with an educational attainment of graduate degree earn the most with the average annual earnings of $81,087, while those with less than high school education have the smallest earnings of $28,307.
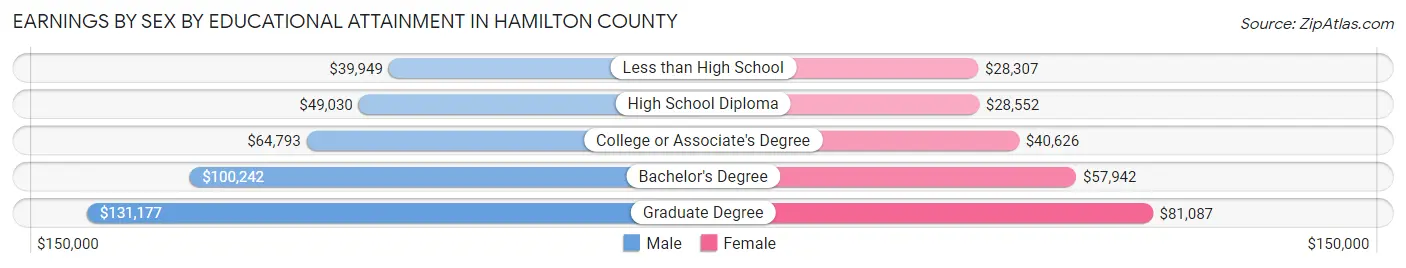
| Educational Attainment | Male Income | Female Income |
| Less than High School | $39,949 | $28,307 |
| High School Diploma | $49,030 | $28,552 |
| College or Associate's Degree | $64,793 | $40,626 |
| Bachelor's Degree | $100,242 | $57,942 |
| Graduate Degree | $131,177 | $81,087 |
| Total | $87,259 | $53,398 |
Family Income in Hamilton County
Family Income Brackets in Hamilton County
According to the Hamilton County family income data, there are 27,673 families falling into the $200,000+ income range, which is the most common income bracket and makes up 28.4% of all families. Conversely, the $10,000 to $14,999 income bracket is the least frequent group with only 585 families (0.6%) belonging to this category.
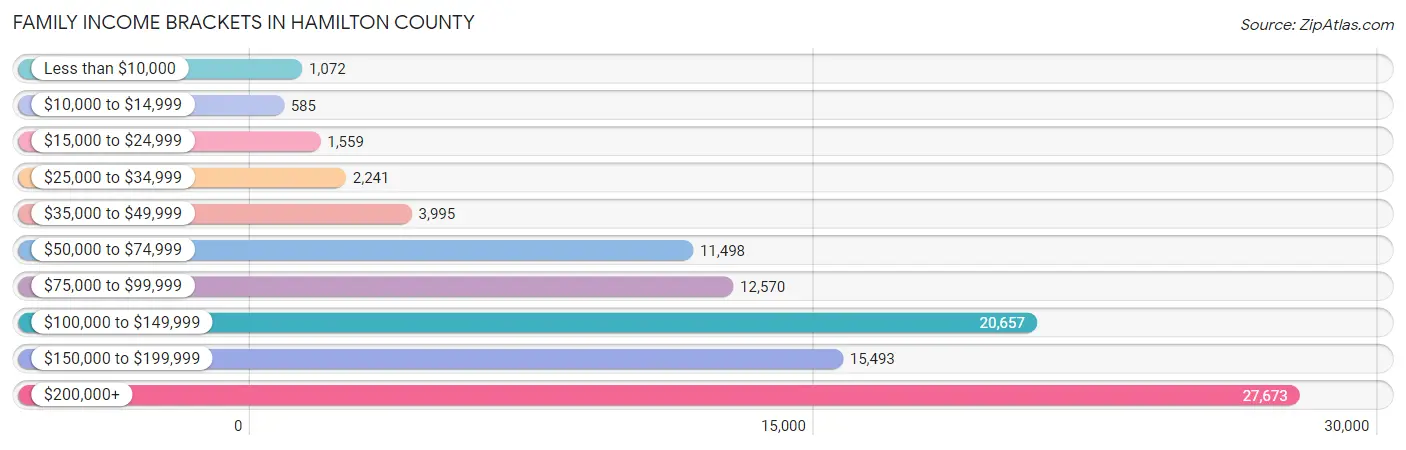
| Income Bracket | # Families | % Families |
| Less than $10,000 | 1,072 | 1.1% |
| $10,000 to $14,999 | 585 | 0.6% |
| $15,000 to $24,999 | 1,559 | 1.6% |
| $25,000 to $34,999 | 2,241 | 2.3% |
| $35,000 to $49,999 | 3,995 | 4.1% |
| $50,000 to $74,999 | 11,498 | 11.8% |
| $75,000 to $99,999 | 12,570 | 12.9% |
| $100,000 to $149,999 | 20,657 | 21.2% |
| $150,000 to $199,999 | 15,493 | 15.9% |
| $200,000+ | 27,673 | 28.4% |
Family Income by Famaliy Size in Hamilton County
5-person families (8,761 | 9.0%) account for the highest median family income in Hamilton County with $168,892 per family, while 2-person families (40,995 | 42.1%) have the highest median income of $56,023 per family member.
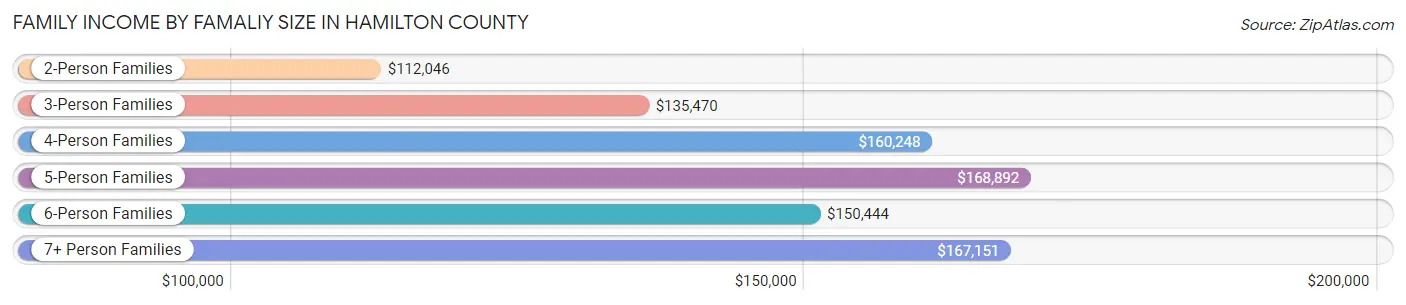
| Income Bracket | # Families | Median Income |
| 2-Person Families | 40,995 (42.1%) | $112,046 |
| 3-Person Families | 21,395 (22.0%) | $135,470 |
| 4-Person Families | 22,865 (23.5%) | $160,248 |
| 5-Person Families | 8,761 (9.0%) | $168,892 |
| 6-Person Families | 2,452 (2.5%) | $150,444 |
| 7+ Person Families | 973 (1.0%) | $167,151 |
| Total | 97,441 (100.0%) | $136,081 |
Family Income by Number of Earners in Hamilton County
The median family income in Hamilton County is $136,081, with families comprising 3+ earners (10,735) having the highest median family income of $188,140, while families with no earners (9,513) have the lowest median family income of $69,978, accounting for 11.0% and 9.8% of families, respectively.
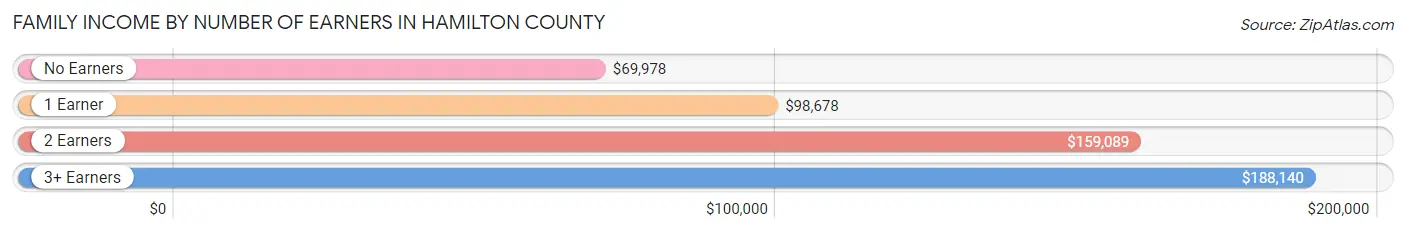
| Number of Earners | # Families | Median Income |
| No Earners | 9,513 (9.8%) | $69,978 |
| 1 Earner | 26,126 (26.8%) | $98,678 |
| 2 Earners | 51,067 (52.4%) | $159,089 |
| 3+ Earners | 10,735 (11.0%) | $188,140 |
| Total | 97,441 (100.0%) | $136,081 |
Household Income in Hamilton County
Household Income Brackets in Hamilton County
With 29,583 households falling in the category, the $200,000+ income range is the most frequent in Hamilton County, accounting for 22.8% of all households. In contrast, only 1,297 households (1.0%) fall into the $10,000 to $14,999 income bracket, making it the least populous group.
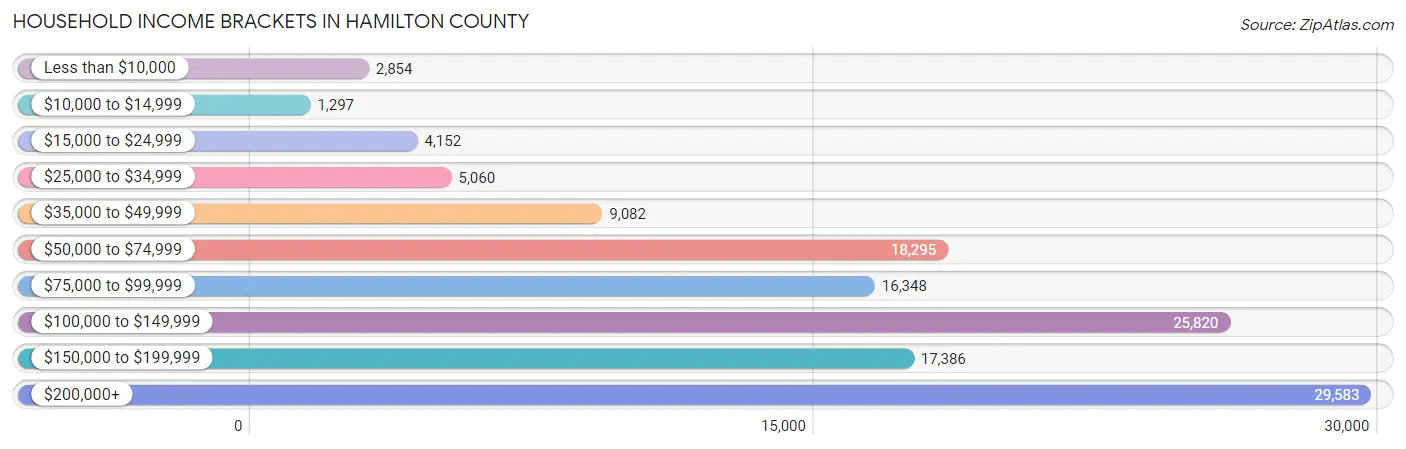
| Income Bracket | # Households | % Households |
| Less than $10,000 | 2,854 | 2.2% |
| $10,000 to $14,999 | 1,297 | 1.0% |
| $15,000 to $24,999 | 4,152 | 3.2% |
| $25,000 to $34,999 | 5,060 | 3.9% |
| $35,000 to $49,999 | 9,082 | 7.0% |
| $50,000 to $74,999 | 18,295 | 14.1% |
| $75,000 to $99,999 | 16,348 | 12.6% |
| $100,000 to $149,999 | 25,820 | 19.9% |
| $150,000 to $199,999 | 17,386 | 13.4% |
| $200,000+ | 29,583 | 22.8% |
Household Income by Householder Age in Hamilton County
The median household income in Hamilton County is $114,866, with the highest median household income of $141,967 found in the 45 to 64 years age bracket for the primary householder. A total of 50,039 households (38.6%) fall into this category. Meanwhile, the 15 to 24 years age bracket for the primary householder has the lowest median household income of $52,900, with 3,645 households (2.8%) in this group.
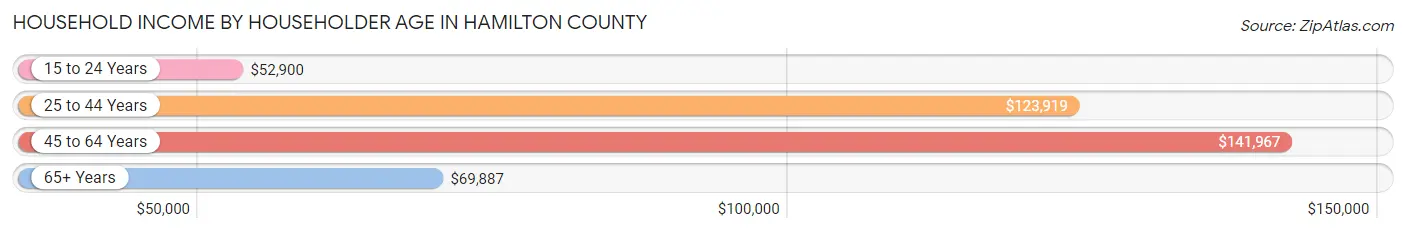
| Income Bracket | # Households | Median Income |
| 15 to 24 Years | 3,645 (2.8%) | $52,900 |
| 25 to 44 Years | 48,562 (37.4%) | $123,919 |
| 45 to 64 Years | 50,039 (38.6%) | $141,967 |
| 65+ Years | 27,503 (21.2%) | $69,887 |
| Total | 129,749 (100.0%) | $114,866 |
Poverty in Hamilton County
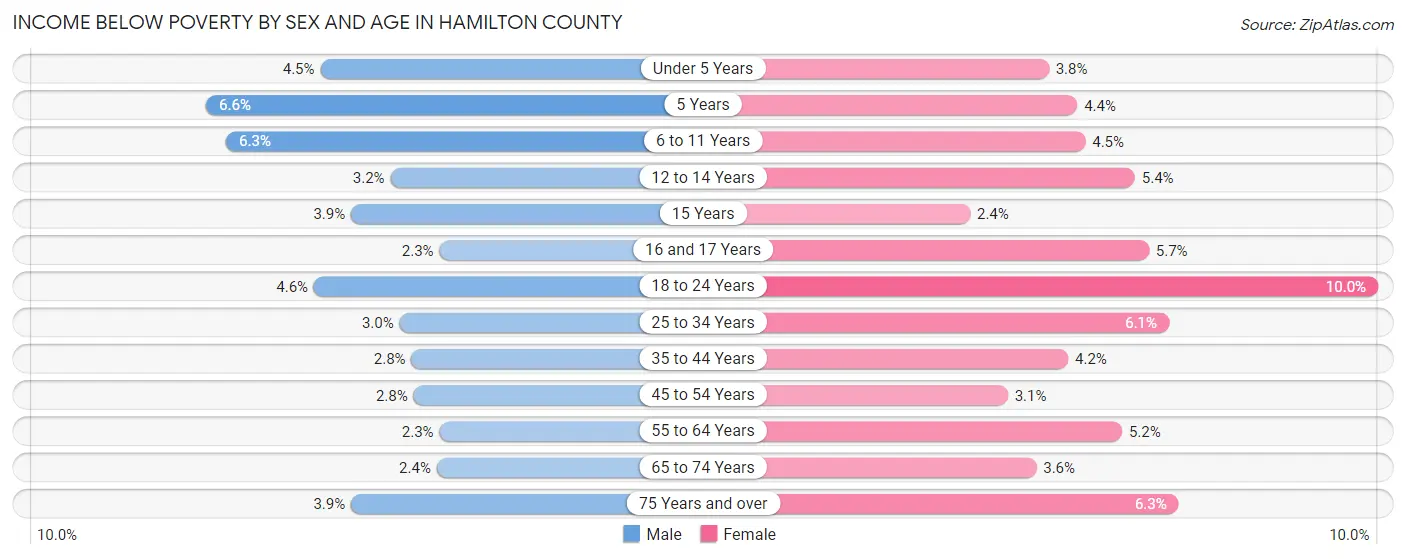
Income Below Poverty by Sex and Age in Hamilton County
With 3.5% poverty level for males and 5.0% for females among the residents of Hamilton County, 5 year old males and 18 to 24 year old females are the most vulnerable to poverty, with 177 males (6.6%) and 1,382 females (10.0%) in their respective age groups living below the poverty level.
| Age Bracket | Male | Female |
| Under 5 Years | 482 (4.5%) | 396 (3.8%) |
| 5 Years | 177 (6.6%) | 98 (4.4%) |
| 6 to 11 Years | 1,016 (6.3%) | 690 (4.5%) |
| 12 to 14 Years | 255 (3.2%) | 440 (5.4%) |
| 15 Years | 116 (3.9%) | 70 (2.4%) |
| 16 and 17 Years | 129 (2.3%) | 302 (5.7%) |
| 18 to 24 Years | 667 (4.6%) | 1,382 (10.0%) |
| 25 to 34 Years | 608 (3.0%) | 1,272 (6.1%) |
| 35 to 44 Years | 723 (2.8%) | 1,125 (4.2%) |
| 45 to 54 Years | 691 (2.8%) | 757 (3.1%) |
| 55 to 64 Years | 467 (2.3%) | 1,092 (5.2%) |
| 65 to 74 Years | 306 (2.4%) | 530 (3.6%) |
| 75 Years and over | 274 (3.9%) | 632 (6.2%) |
| Total | 5,911 (3.5%) | 8,786 (5.0%) |
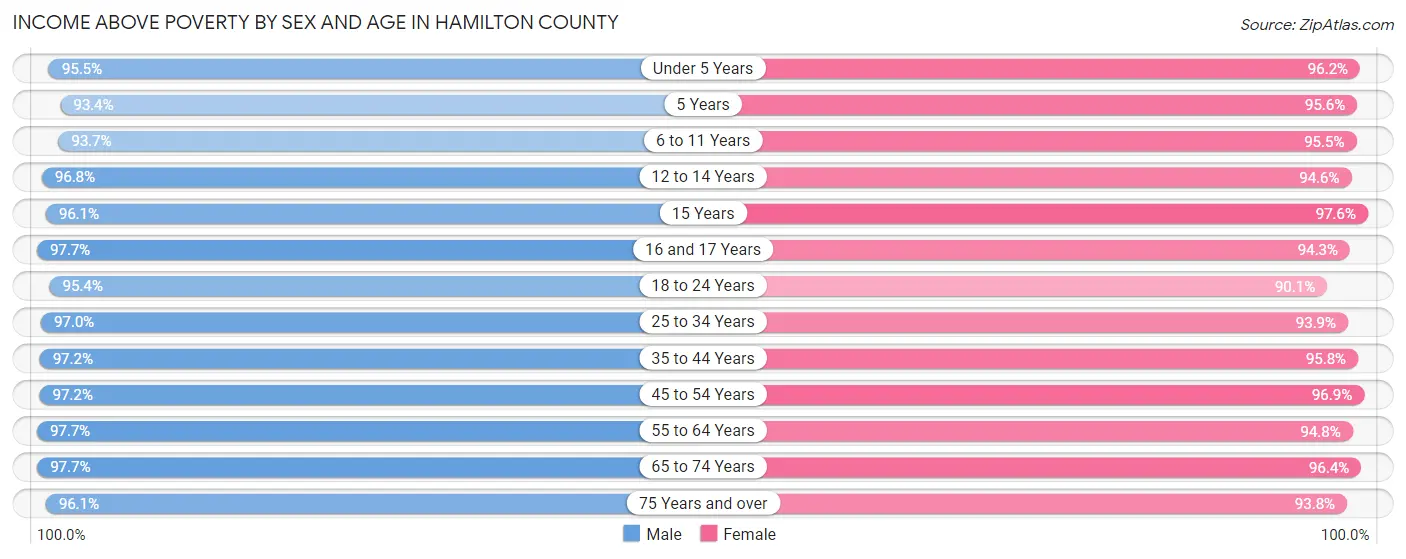
Income Above Poverty by Sex and Age in Hamilton County
According to the poverty statistics in Hamilton County, males aged 16 and 17 years and females aged 15 years are the age groups that are most secure financially, with 97.7% of males and 97.6% of females in these age groups living above the poverty line.
| Age Bracket | Male | Female |
| Under 5 Years | 10,194 (95.5%) | 9,919 (96.2%) |
| 5 Years | 2,491 (93.4%) | 2,145 (95.6%) |
| 6 to 11 Years | 15,211 (93.7%) | 14,570 (95.5%) |
| 12 to 14 Years | 7,697 (96.8%) | 7,653 (94.6%) |
| 15 Years | 2,826 (96.1%) | 2,872 (97.6%) |
| 16 and 17 Years | 5,476 (97.7%) | 4,993 (94.3%) |
| 18 to 24 Years | 13,748 (95.4%) | 12,513 (90.0%) |
| 25 to 34 Years | 19,390 (97.0%) | 19,676 (93.9%) |
| 35 to 44 Years | 24,911 (97.2%) | 25,669 (95.8%) |
| 45 to 54 Years | 24,141 (97.2%) | 23,820 (96.9%) |
| 55 to 64 Years | 19,800 (97.7%) | 19,925 (94.8%) |
| 65 to 74 Years | 12,728 (97.7%) | 14,135 (96.4%) |
| 75 Years and over | 6,676 (96.1%) | 9,473 (93.8%) |
| Total | 165,289 (96.6%) | 167,363 (95.0%) |
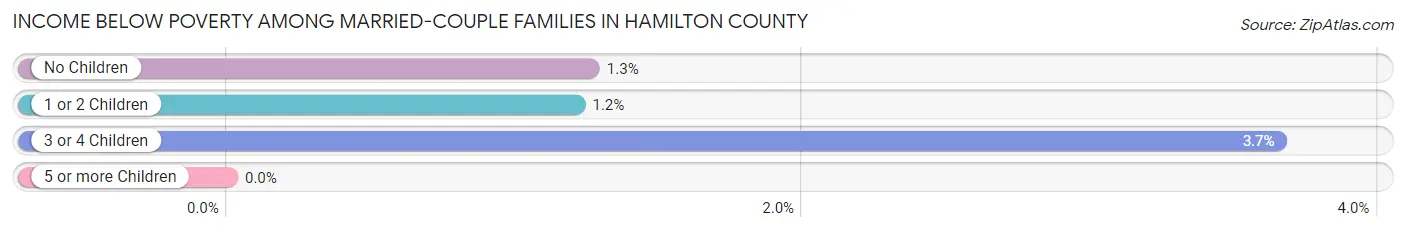
Income Below Poverty Among Married-Couple Families in Hamilton County
The poverty statistics for married-couple families in Hamilton County show that 1.5% or 1,210 of the total 82,736 families live below the poverty line. Families with 3 or 4 children have the highest poverty rate of 3.6%, comprising of 291 families. On the other hand, families with 5 or more children have the lowest poverty rate of 0.0%, which includes 0 families.
| Children | Above Poverty | Below Poverty |
| No Children | 41,464 (98.7%) | 529 (1.3%) |
| 1 or 2 Children | 31,786 (98.8%) | 390 (1.2%) |
| 3 or 4 Children | 7,681 (96.4%) | 291 (3.6%) |
| 5 or more Children | 595 (100.0%) | 0 (0.0%) |
| Total | 81,526 (98.5%) | 1,210 (1.5%) |
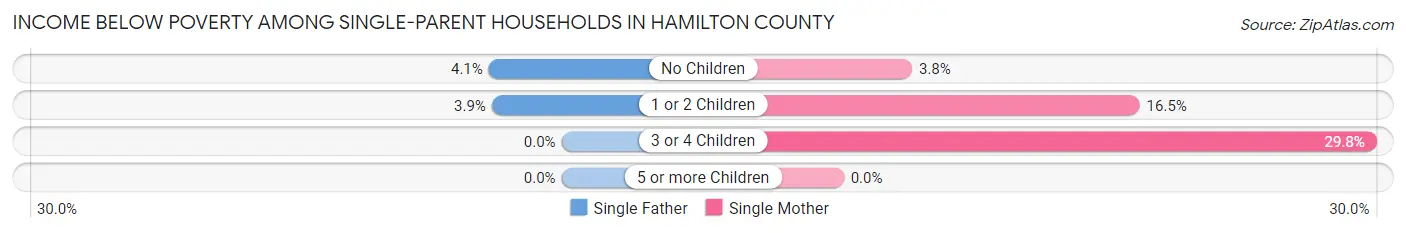
Income Below Poverty Among Single-Parent Households in Hamilton County
According to the poverty data in Hamilton County, 3.6% or 169 single-father households and 14.1% or 1,416 single-mother households are living below the poverty line. Among single-father households, those with no children have the highest poverty rate, with 74 households (4.1%) experiencing poverty. Likewise, among single-mother households, those with 3 or 4 children have the highest poverty rate, with 366 households (29.8%) falling below the poverty line.
| Children | Single Father | Single Mother |
| No Children | 74 (4.1%) | 122 (3.8%) |
| 1 or 2 Children | 95 (3.9%) | 928 (16.5%) |
| 3 or 4 Children | 0 (0.0%) | 366 (29.8%) |
| 5 or more Children | 0 (0.0%) | 0 (0.0%) |
| Total | 169 (3.6%) | 1,416 (14.1%) |
Income Below Poverty Among Married-Couple vs Single-Parent Households in Hamilton County
The poverty data for Hamilton County shows that 1,210 of the married-couple family households (1.5%) and 1,585 of the single-parent households (10.8%) are living below the poverty level. Within the married-couple family households, those with 3 or 4 children have the highest poverty rate, with 291 households (3.6%) falling below the poverty line. Among the single-parent households, those with 3 or 4 children have the highest poverty rate, with 366 household (22.4%) living below poverty.
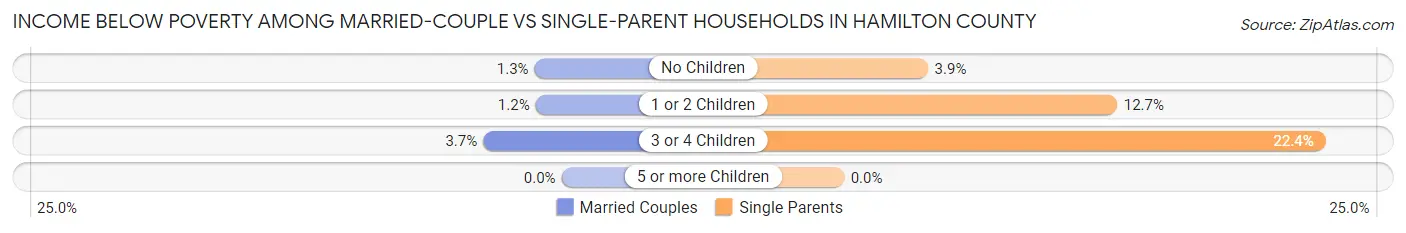
| Children | Married-Couple Families | Single-Parent Households |
| No Children | 529 (1.3%) | 196 (3.9%) |
| 1 or 2 Children | 390 (1.2%) | 1,023 (12.7%) |
| 3 or 4 Children | 291 (3.6%) | 366 (22.4%) |
| 5 or more Children | 0 (0.0%) | 0 (0.0%) |
| Total | 1,210 (1.5%) | 1,585 (10.8%) |
Employment Characteristics in Hamilton County
Employment by Class of Employer in Hamilton County
Among the 184,368 employed individuals in Hamilton County, private company employees (130,653 | 70.9%), not-for-profit organizations (19,035 | 10.3%), and local government employees (11,056 | 6.0%) make up the most common classes of employment.
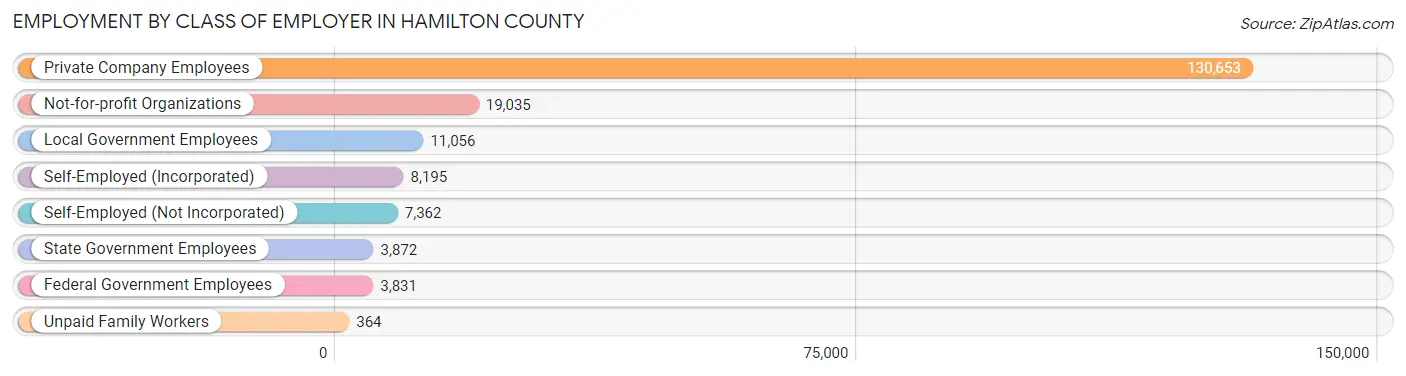
| Employer Class | # Employees | % Employees |
| Private Company Employees | 130,653 | 70.9% |
| Self-Employed (Incorporated) | 8,195 | 4.4% |
| Self-Employed (Not Incorporated) | 7,362 | 4.0% |
| Not-for-profit Organizations | 19,035 | 10.3% |
| Local Government Employees | 11,056 | 6.0% |
| State Government Employees | 3,872 | 2.1% |
| Federal Government Employees | 3,831 | 2.1% |
| Unpaid Family Workers | 364 | 0.2% |
| Total | 184,368 | 100.0% |
Employment Status by Age in Hamilton County
According to the labor force statistics for Hamilton County, out of the total population over 16 years of age (269,614), 71.3% or 192,235 individuals are in the labor force, with 2.7% or 5,190 of them unemployed. The age group with the highest labor force participation rate is 25 to 29 years, with 90.1% or 17,215 individuals in the labor force. Within the labor force, the 20 to 24 years age range has the highest percentage of unemployed individuals, with 8.5% or 1,380 of them being unemployed.
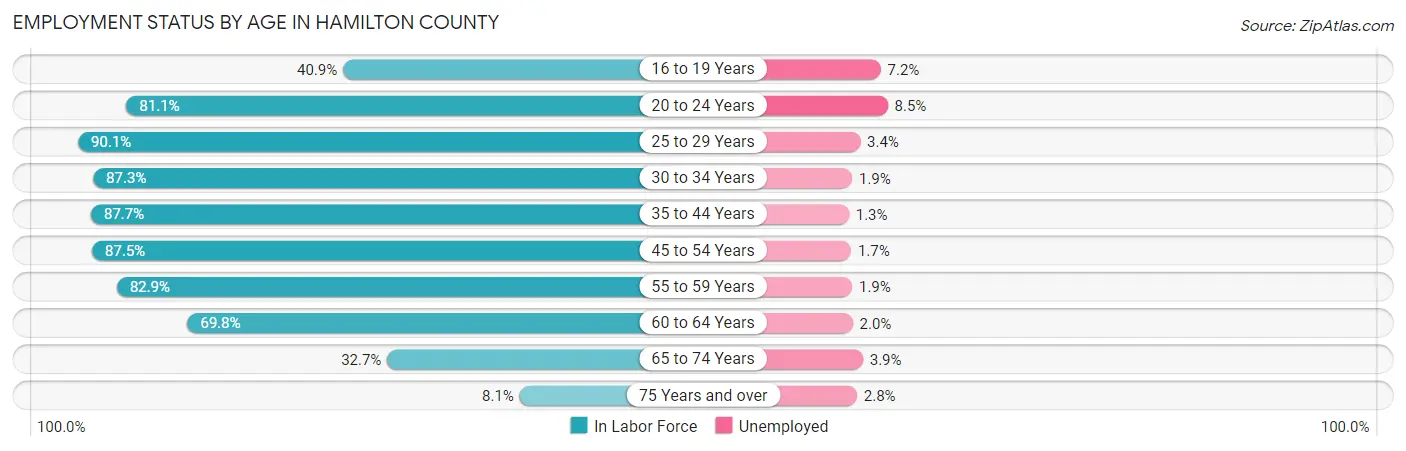
| Age Bracket | In Labor Force | Unemployed |
| 16 to 19 Years | 7,883 (40.9%) | 568 (7.2%) |
| 20 to 24 Years | 16,239 (81.1%) | 1,380 (8.5%) |
| 25 to 29 Years | 17,215 (90.1%) | 585 (3.4%) |
| 30 to 34 Years | 19,182 (87.3%) | 364 (1.9%) |
| 35 to 44 Years | 46,057 (87.7%) | 599 (1.3%) |
| 45 to 54 Years | 43,320 (87.5%) | 736 (1.7%) |
| 55 to 59 Years | 18,357 (82.9%) | 349 (1.9%) |
| 60 to 64 Years | 13,467 (69.8%) | 269 (2.0%) |
| 65 to 74 Years | 9,130 (32.7%) | 356 (3.9%) |
| 75 Years and over | 1,446 (8.1%) | 40 (2.8%) |
| Total | 192,235 (71.3%) | 5,190 (2.7%) |
Employment Status by Educational Attainment in Hamilton County
According to labor force statistics for Hamilton County, 85.4% of individuals (157,598) out of the total population between 25 and 64 years of age (184,541) are in the labor force, with 1.8% or 2,837 of them being unemployed. The group with the highest labor force participation rate are those with the educational attainment of bachelor's degree or higher, with 88.4% or 104,591 individuals in the labor force. Within the labor force, individuals with less than high school education have the highest percentage of unemployment, with 7.3% or 247 of them being unemployed.
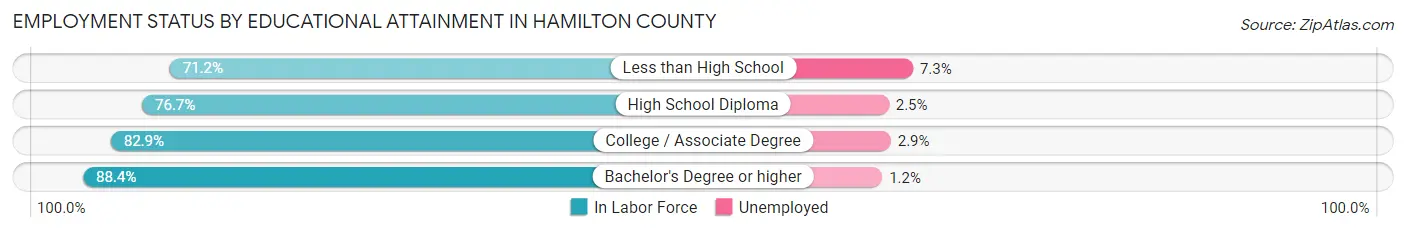
| Educational Attainment | In Labor Force | Unemployed |
| Less than High School | 3,379 (71.2%) | 346 (7.3%) |
| High School Diploma | 17,432 (76.7%) | 568 (2.5%) |
| College / Associate Degree | 32,125 (82.9%) | 1,124 (2.9%) |
| Bachelor's Degree or higher | 104,591 (88.4%) | 1,420 (1.2%) |
| Total | 157,598 (85.4%) | 3,322 (1.8%) |
Employment Occupations by Sex in Hamilton County
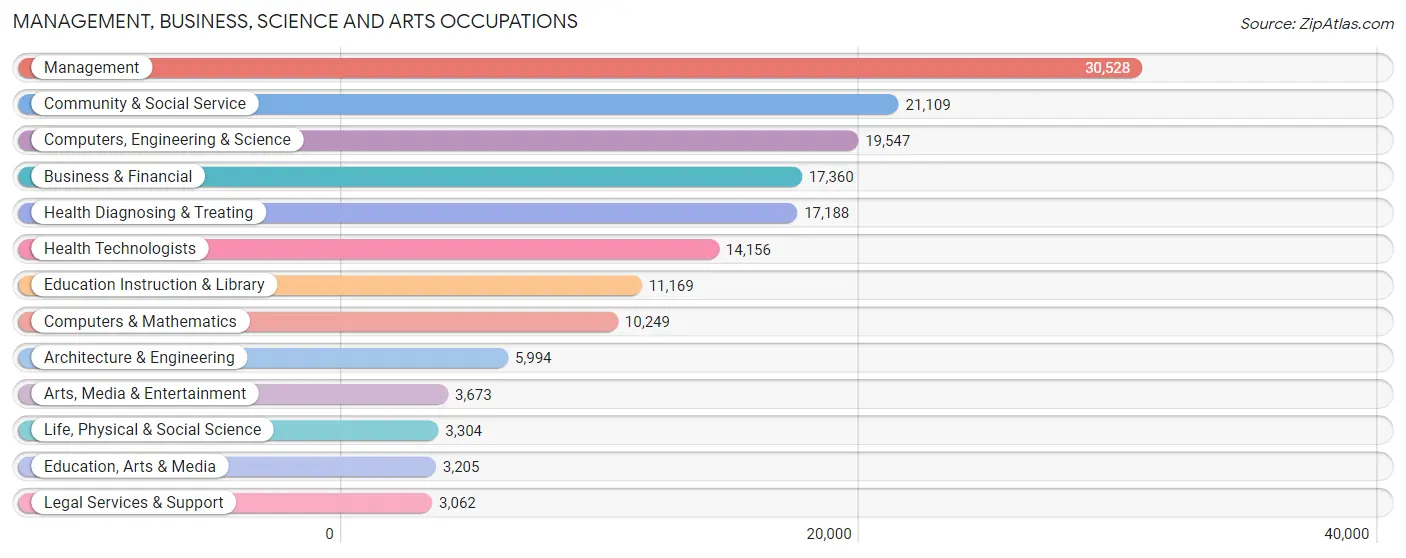
Management, Business, Science and Arts Occupations
The most common Management, Business, Science and Arts occupations in Hamilton County are Management (30,528 | 16.4%), Community & Social Service (21,109 | 11.3%), Computers, Engineering & Science (19,547 | 10.5%), Business & Financial (17,360 | 9.3%), and Health Diagnosing & Treating (17,188 | 9.2%).
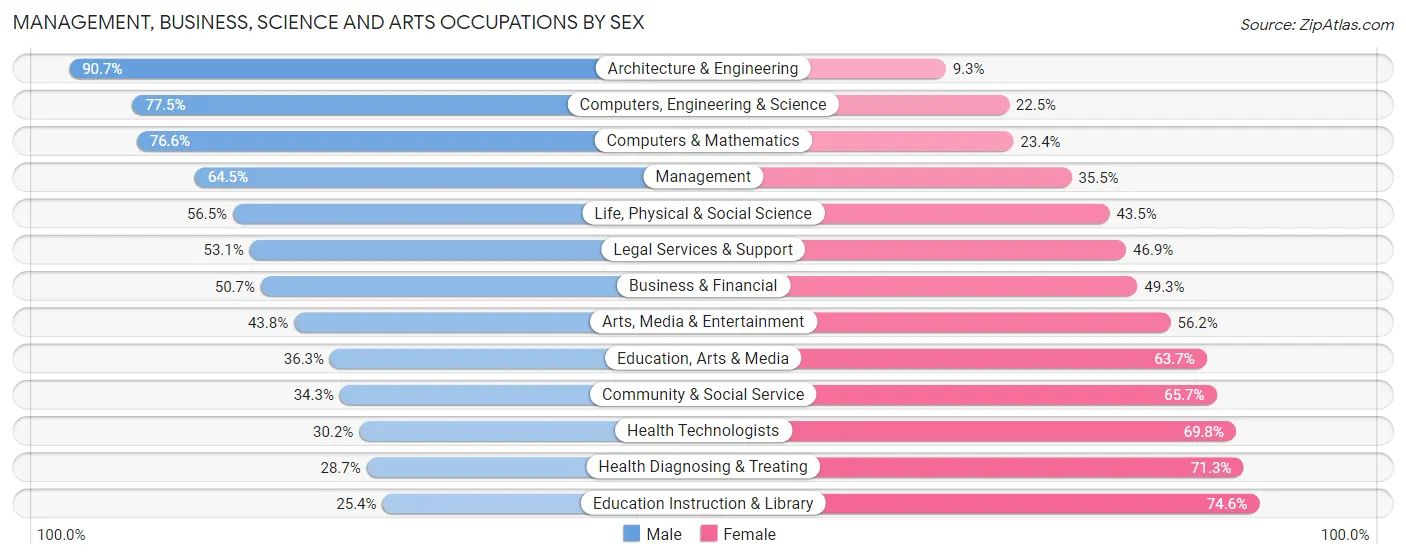
Management, Business, Science and Arts Occupations by Sex
Within the Management, Business, Science and Arts occupations in Hamilton County, the most male-oriented occupations are Architecture & Engineering (90.7%), Computers, Engineering & Science (77.5%), and Computers & Mathematics (76.6%), while the most female-oriented occupations are Education Instruction & Library (74.6%), Health Diagnosing & Treating (71.3%), and Health Technologists (69.8%).
| Occupation | Male | Female |
| Management | 19,684 (64.5%) | 10,844 (35.5%) |
| Business & Financial | 8,807 (50.7%) | 8,553 (49.3%) |
| Computers, Engineering & Science | 15,154 (77.5%) | 4,393 (22.5%) |
| Computers & Mathematics | 7,850 (76.6%) | 2,399 (23.4%) |
| Architecture & Engineering | 5,436 (90.7%) | 558 (9.3%) |
| Life, Physical & Social Science | 1,868 (56.5%) | 1,436 (43.5%) |
| Community & Social Service | 7,232 (34.3%) | 13,877 (65.7%) |
| Education, Arts & Media | 1,164 (36.3%) | 2,041 (63.7%) |
| Legal Services & Support | 1,625 (53.1%) | 1,437 (46.9%) |
| Education Instruction & Library | 2,834 (25.4%) | 8,335 (74.6%) |
| Arts, Media & Entertainment | 1,609 (43.8%) | 2,064 (56.2%) |
| Health Diagnosing & Treating | 4,928 (28.7%) | 12,260 (71.3%) |
| Health Technologists | 4,277 (30.2%) | 9,879 (69.8%) |
| Total (Category) | 55,805 (52.8%) | 49,927 (47.2%) |
| Total (Overall) | 100,293 (53.8%) | 86,080 (46.2%) |
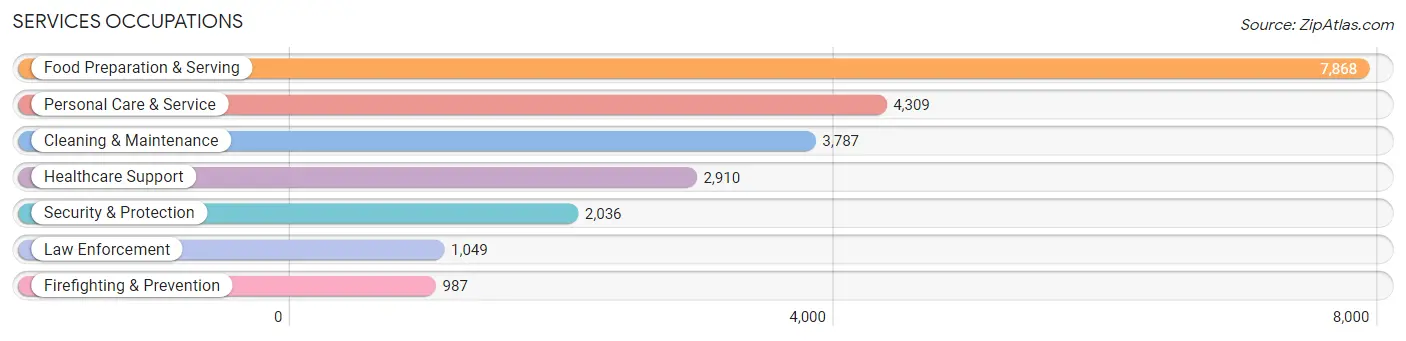
Services Occupations
The most common Services occupations in Hamilton County are Food Preparation & Serving (7,868 | 4.2%), Personal Care & Service (4,309 | 2.3%), Cleaning & Maintenance (3,787 | 2.0%), Healthcare Support (2,910 | 1.6%), and Security & Protection (2,036 | 1.1%).
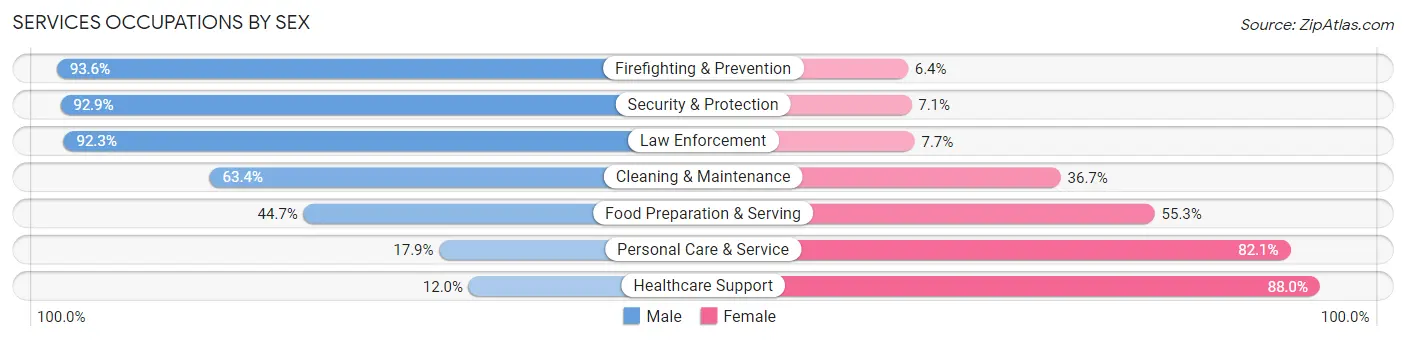
Services Occupations by Sex
Within the Services occupations in Hamilton County, the most male-oriented occupations are Firefighting & Prevention (93.6%), Security & Protection (92.9%), and Law Enforcement (92.3%), while the most female-oriented occupations are Healthcare Support (88.0%), Personal Care & Service (82.1%), and Food Preparation & Serving (55.3%).
| Occupation | Male | Female |
| Healthcare Support | 350 (12.0%) | 2,560 (88.0%) |
| Security & Protection | 1,892 (92.9%) | 144 (7.1%) |
| Firefighting & Prevention | 924 (93.6%) | 63 (6.4%) |
| Law Enforcement | 968 (92.3%) | 81 (7.7%) |
| Food Preparation & Serving | 3,520 (44.7%) | 4,348 (55.3%) |
| Cleaning & Maintenance | 2,399 (63.3%) | 1,388 (36.6%) |
| Personal Care & Service | 770 (17.9%) | 3,539 (82.1%) |
| Total (Category) | 8,931 (42.7%) | 11,979 (57.3%) |
| Total (Overall) | 100,293 (53.8%) | 86,080 (46.2%) |
Sales and Office Occupations
The most common Sales and Office occupations in Hamilton County are Sales & Related (21,705 | 11.7%), and Office & Administration (17,263 | 9.3%).

Sales and Office Occupations by Sex
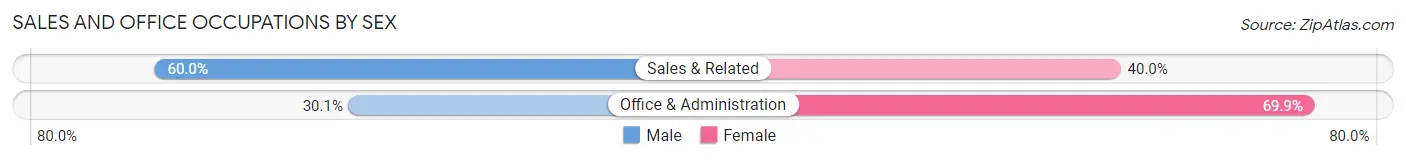
| Occupation | Male | Female |
| Sales & Related | 13,021 (60.0%) | 8,684 (40.0%) |
| Office & Administration | 5,202 (30.1%) | 12,061 (69.9%) |
| Total (Category) | 18,223 (46.8%) | 20,745 (53.2%) |
| Total (Overall) | 100,293 (53.8%) | 86,080 (46.2%) |
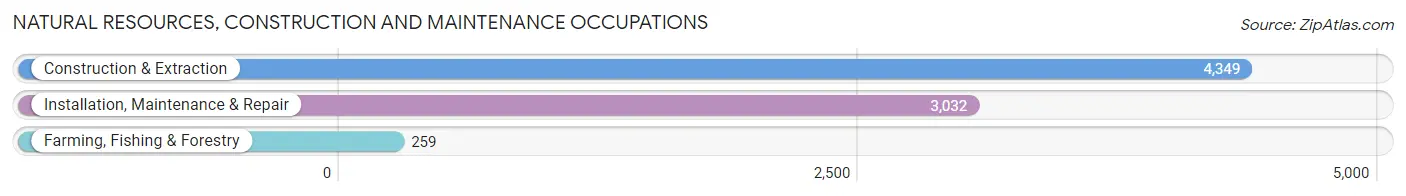
Natural Resources, Construction and Maintenance Occupations
The most common Natural Resources, Construction and Maintenance occupations in Hamilton County are Construction & Extraction (4,349 | 2.3%), Installation, Maintenance & Repair (3,032 | 1.6%), and Farming, Fishing & Forestry (259 | 0.1%).
Natural Resources, Construction and Maintenance Occupations by Sex
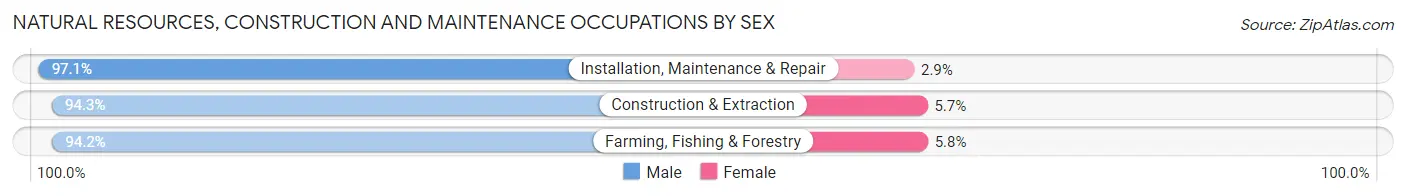
| Occupation | Male | Female |
| Farming, Fishing & Forestry | 244 (94.2%) | 15 (5.8%) |
| Construction & Extraction | 4,100 (94.3%) | 249 (5.7%) |
| Installation, Maintenance & Repair | 2,943 (97.1%) | 89 (2.9%) |
| Total (Category) | 7,287 (95.4%) | 353 (4.6%) |
| Total (Overall) | 100,293 (53.8%) | 86,080 (46.2%) |
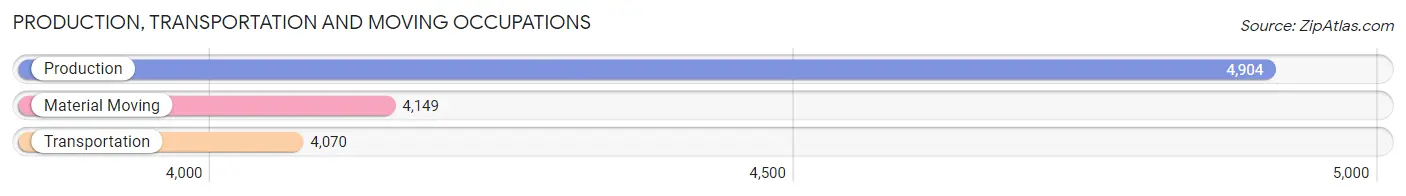
Production, Transportation and Moving Occupations
The most common Production, Transportation and Moving occupations in Hamilton County are Production (4,904 | 2.6%), Material Moving (4,149 | 2.2%), and Transportation (4,070 | 2.2%).
Production, Transportation and Moving Occupations by Sex
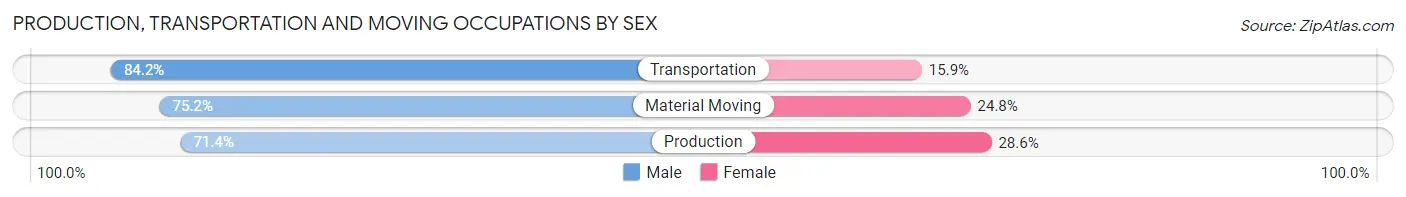
| Occupation | Male | Female |
| Production | 3,501 (71.4%) | 1,403 (28.6%) |
| Transportation | 3,425 (84.2%) | 645 (15.9%) |
| Material Moving | 3,121 (75.2%) | 1,028 (24.8%) |
| Total (Category) | 10,047 (76.6%) | 3,076 (23.4%) |
| Total (Overall) | 100,293 (53.8%) | 86,080 (46.2%) |
Employment Industries by Sex in Hamilton County
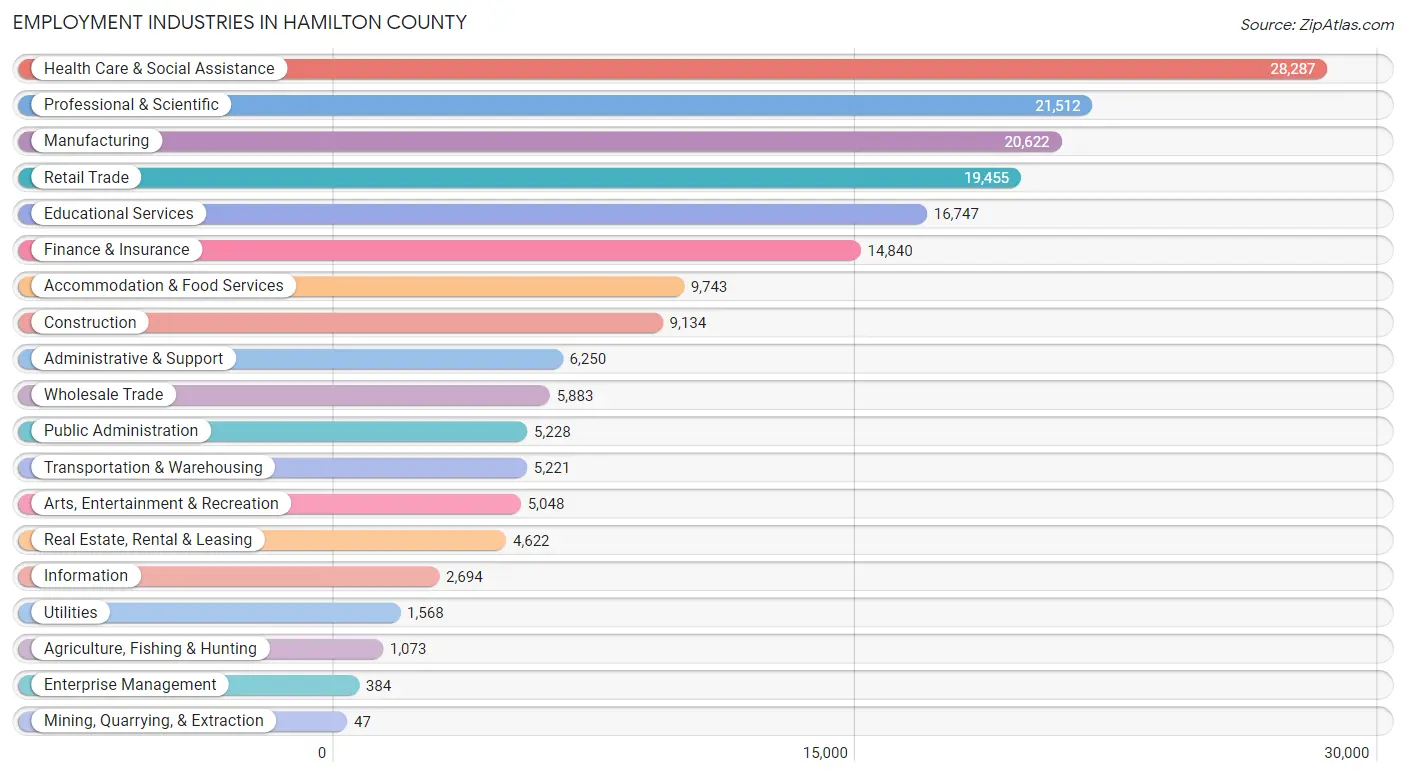
Employment Industries in Hamilton County
The major employment industries in Hamilton County include Health Care & Social Assistance (28,287 | 15.2%), Professional & Scientific (21,512 | 11.5%), Manufacturing (20,622 | 11.1%), Retail Trade (19,455 | 10.4%), and Educational Services (16,747 | 9.0%).
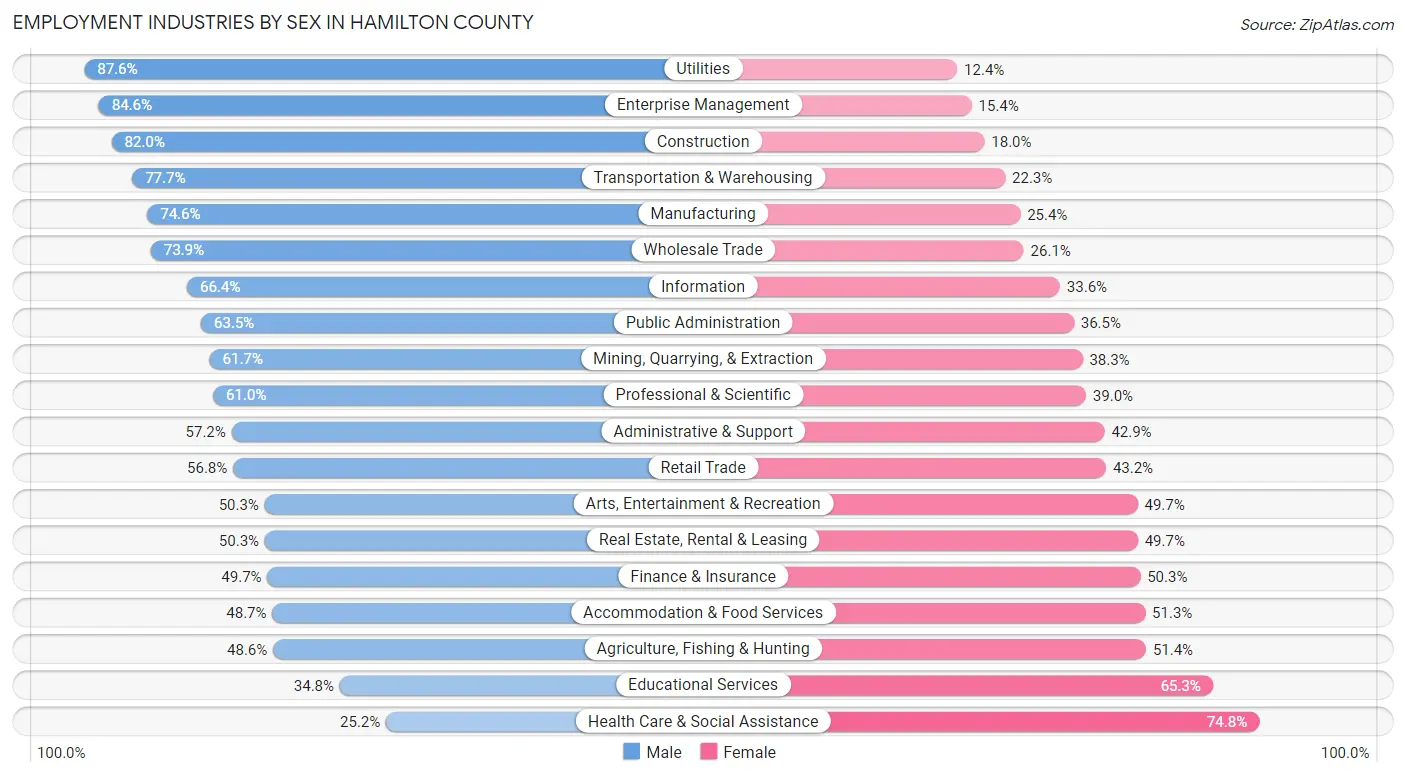
Employment Industries by Sex in Hamilton County
The Hamilton County industries that see more men than women are Utilities (87.6%), Enterprise Management (84.6%), and Construction (82.0%), whereas the industries that tend to have a higher number of women are Health Care & Social Assistance (74.8%), Educational Services (65.2%), and Agriculture, Fishing & Hunting (51.4%).
| Industry | Male | Female |
| Agriculture, Fishing & Hunting | 521 (48.6%) | 552 (51.4%) |
| Mining, Quarrying, & Extraction | 29 (61.7%) | 18 (38.3%) |
| Construction | 7,491 (82.0%) | 1,643 (18.0%) |
| Manufacturing | 15,381 (74.6%) | 5,241 (25.4%) |
| Wholesale Trade | 4,346 (73.9%) | 1,537 (26.1%) |
| Retail Trade | 11,058 (56.8%) | 8,397 (43.2%) |
| Transportation & Warehousing | 4,057 (77.7%) | 1,164 (22.3%) |
| Utilities | 1,374 (87.6%) | 194 (12.4%) |
| Information | 1,788 (66.4%) | 906 (33.6%) |
| Finance & Insurance | 7,382 (49.7%) | 7,458 (50.3%) |
| Real Estate, Rental & Leasing | 2,323 (50.3%) | 2,299 (49.7%) |
| Professional & Scientific | 13,119 (61.0%) | 8,393 (39.0%) |
| Enterprise Management | 325 (84.6%) | 59 (15.4%) |
| Administrative & Support | 3,572 (57.2%) | 2,678 (42.8%) |
| Educational Services | 5,820 (34.7%) | 10,927 (65.2%) |
| Health Care & Social Assistance | 7,119 (25.2%) | 21,168 (74.8%) |
| Arts, Entertainment & Recreation | 2,539 (50.3%) | 2,509 (49.7%) |
| Accommodation & Food Services | 4,747 (48.7%) | 4,996 (51.3%) |
| Public Administration | 3,320 (63.5%) | 1,908 (36.5%) |
| Total | 100,293 (53.8%) | 86,080 (46.2%) |
Education in Hamilton County
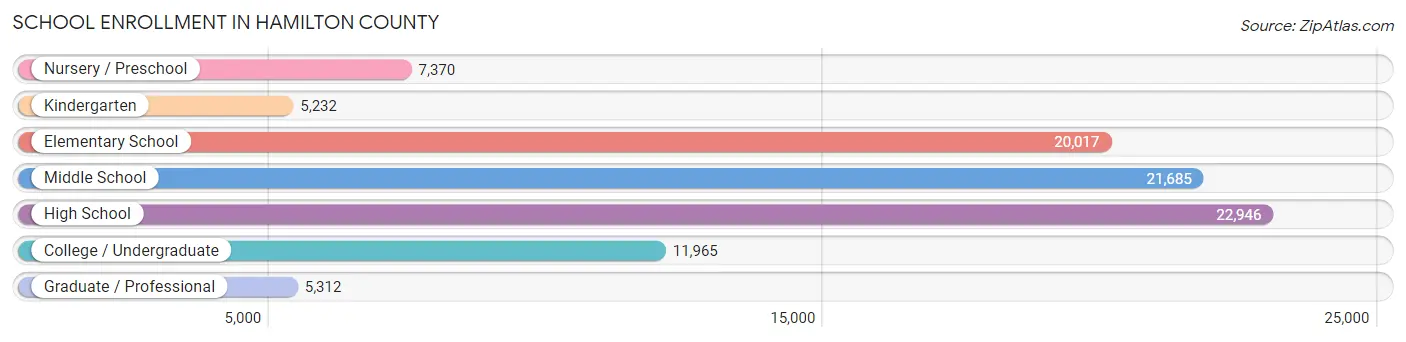
School Enrollment in Hamilton County
The most common levels of schooling among the 94,527 students in Hamilton County are high school (22,946 | 24.3%), middle school (21,685 | 22.9%), and elementary school (20,017 | 21.2%).
| School Level | # Students | % Students |
| Nursery / Preschool | 7,370 | 7.8% |
| Kindergarten | 5,232 | 5.5% |
| Elementary School | 20,017 | 21.2% |
| Middle School | 21,685 | 22.9% |
| High School | 22,946 | 24.3% |
| College / Undergraduate | 11,965 | 12.7% |
| Graduate / Professional | 5,312 | 5.6% |
| Total | 94,527 | 100.0% |
School Enrollment by Age by Funding Source in Hamilton County
Out of a total of 94,527 students who are enrolled in schools in Hamilton County, 18,527 (19.6%) attend a private institution, while the remaining 76,000 (80.4%) are enrolled in public schools. The age group of 3 to 4 year olds has the highest likelihood of being enrolled in private schools, with 3,502 (65.9% in the age bracket) enrolled. Conversely, the age group of 10 to 14 year olds has the lowest likelihood of being enrolled in a private school, with 23,497 (88.4% in the age bracket) attending a public institution.
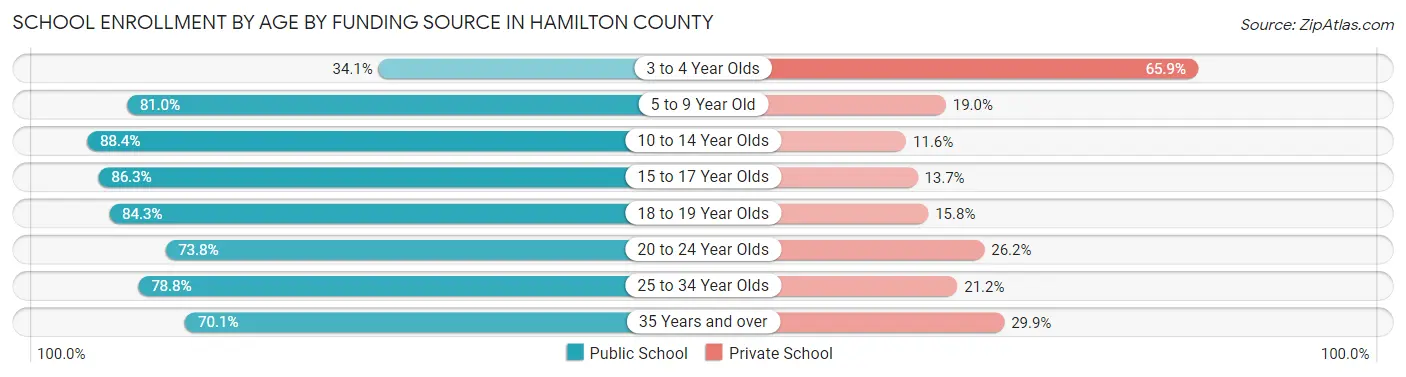
| Age Bracket | Public School | Private School |
| 3 to 4 Year Olds | 1,809 (34.1%) | 3,502 (65.9%) |
| 5 to 9 Year Old | 19,860 (81.0%) | 4,668 (19.0%) |
| 10 to 14 Year Olds | 23,497 (88.4%) | 3,092 (11.6%) |
| 15 to 17 Year Olds | 14,187 (86.3%) | 2,259 (13.7%) |
| 18 to 19 Year Olds | 5,708 (84.3%) | 1,067 (15.8%) |
| 20 to 24 Year Olds | 5,106 (73.8%) | 1,813 (26.2%) |
| 25 to 34 Year Olds | 2,551 (78.8%) | 685 (21.2%) |
| 35 Years and over | 3,311 (70.1%) | 1,412 (29.9%) |
| Total | 76,000 (80.4%) | 18,527 (19.6%) |
Educational Attainment by Field of Study in Hamilton County
Business (36,632 | 24.3%), science & technology (19,442 | 12.9%), education (16,279 | 10.8%), engineering (11,073 | 7.3%), and bio, nature & agricultural (10,209 | 6.8%) are the most common fields of study among 150,573 individuals in Hamilton County who have obtained a bachelor's degree or higher.
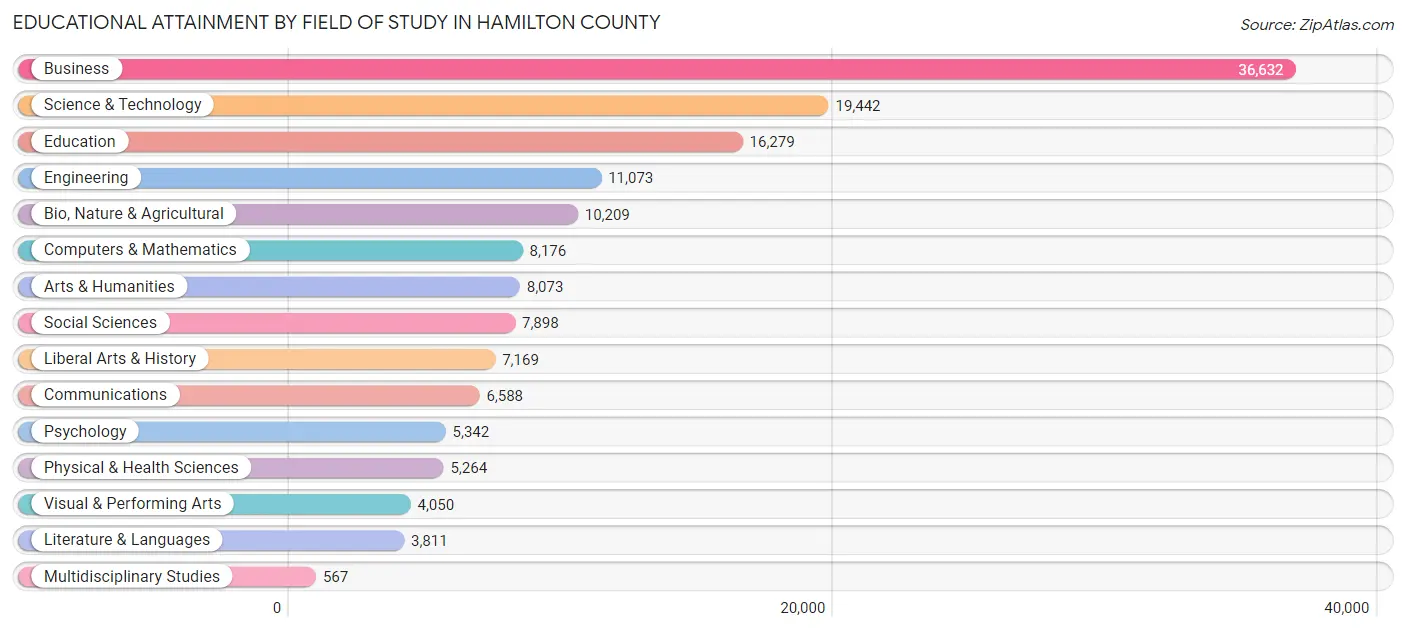
| Field of Study | # Graduates | % Graduates |
| Computers & Mathematics | 8,176 | 5.4% |
| Bio, Nature & Agricultural | 10,209 | 6.8% |
| Physical & Health Sciences | 5,264 | 3.5% |
| Psychology | 5,342 | 3.5% |
| Social Sciences | 7,898 | 5.2% |
| Engineering | 11,073 | 7.3% |
| Multidisciplinary Studies | 567 | 0.4% |
| Science & Technology | 19,442 | 12.9% |
| Business | 36,632 | 24.3% |
| Education | 16,279 | 10.8% |
| Literature & Languages | 3,811 | 2.5% |
| Liberal Arts & History | 7,169 | 4.8% |
| Visual & Performing Arts | 4,050 | 2.7% |
| Communications | 6,588 | 4.4% |
| Arts & Humanities | 8,073 | 5.4% |
| Total | 150,573 | 100.0% |
Transportation & Commute in Hamilton County
Vehicle Availability by Sex in Hamilton County
The most prevalent vehicle ownership categories in Hamilton County are males with 2 vehicles (52,255, accounting for 52.3%) and females with 2 vehicles (43,426, making up 61.9%).
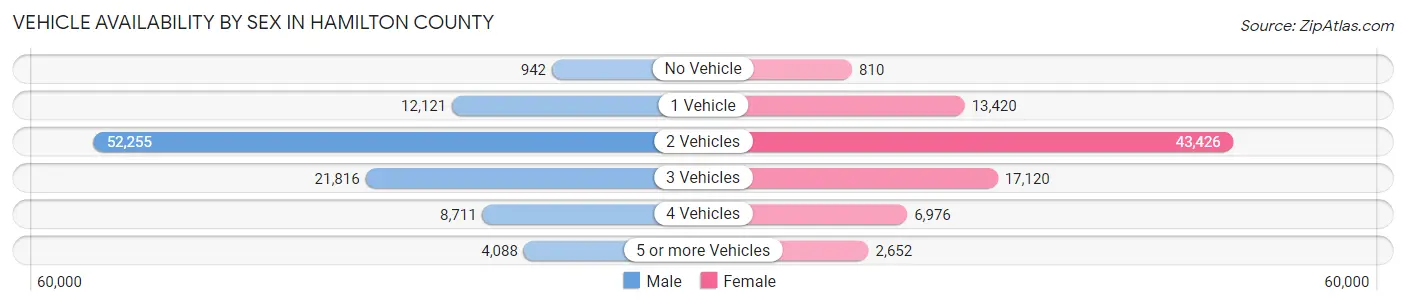
| Vehicles Available | Male | Female |
| No Vehicle | 942 (0.9%) | 810 (1.0%) |
| 1 Vehicle | 12,121 (12.1%) | 13,420 (15.9%) |
| 2 Vehicles | 52,255 (52.3%) | 43,426 (51.4%) |
| 3 Vehicles | 21,816 (21.8%) | 17,120 (20.3%) |
| 4 Vehicles | 8,711 (8.7%) | 6,976 (8.3%) |
| 5 or more Vehicles | 4,088 (4.1%) | 2,652 (3.1%) |
| Total | 99,933 (100.0%) | 84,404 (100.0%) |
Commute Time in Hamilton County
The most frequently occuring commute durations in Hamilton County are 30 to 34 minutes (26,167 commuters, 17.2%), 15 to 19 minutes (24,532 commuters, 16.1%), and 20 to 24 minutes (18,930 commuters, 12.4%).
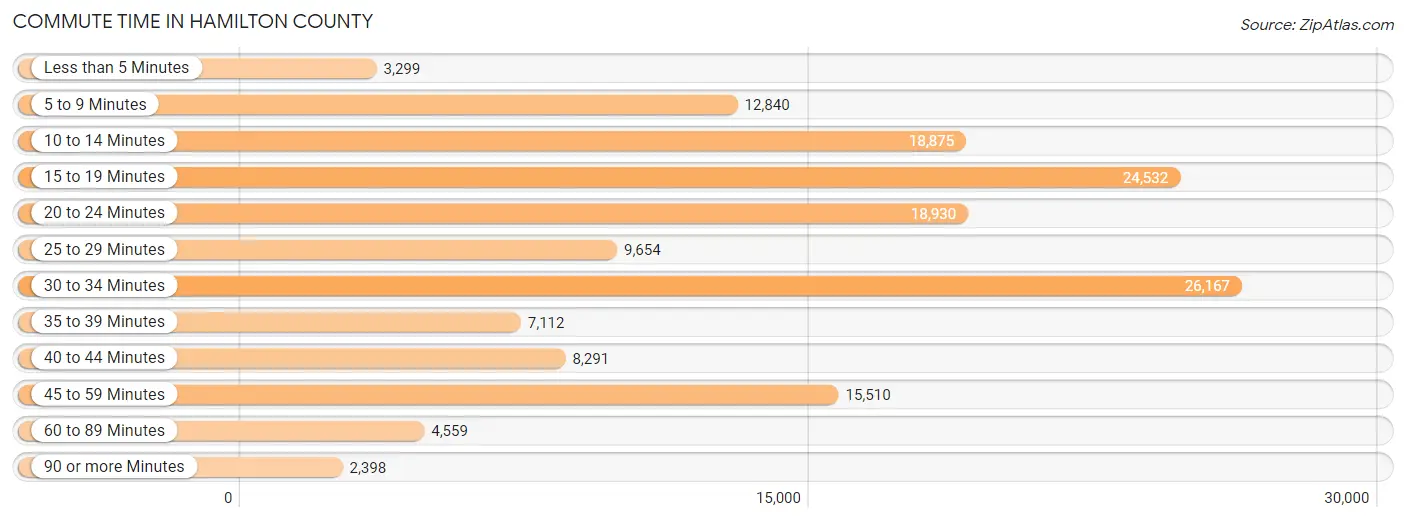
| Commute Time | # Commuters | % Commuters |
| Less than 5 Minutes | 3,299 | 2.2% |
| 5 to 9 Minutes | 12,840 | 8.4% |
| 10 to 14 Minutes | 18,875 | 12.4% |
| 15 to 19 Minutes | 24,532 | 16.1% |
| 20 to 24 Minutes | 18,930 | 12.4% |
| 25 to 29 Minutes | 9,654 | 6.3% |
| 30 to 34 Minutes | 26,167 | 17.2% |
| 35 to 39 Minutes | 7,112 | 4.7% |
| 40 to 44 Minutes | 8,291 | 5.4% |
| 45 to 59 Minutes | 15,510 | 10.2% |
| 60 to 89 Minutes | 4,559 | 3.0% |
| 90 or more Minutes | 2,398 | 1.6% |
Commute Time by Sex in Hamilton County
The most common commute times in Hamilton County are 30 to 34 minutes (15,792 commuters, 19.0%) for males and 15 to 19 minutes (12,594 commuters, 18.2%) for females.
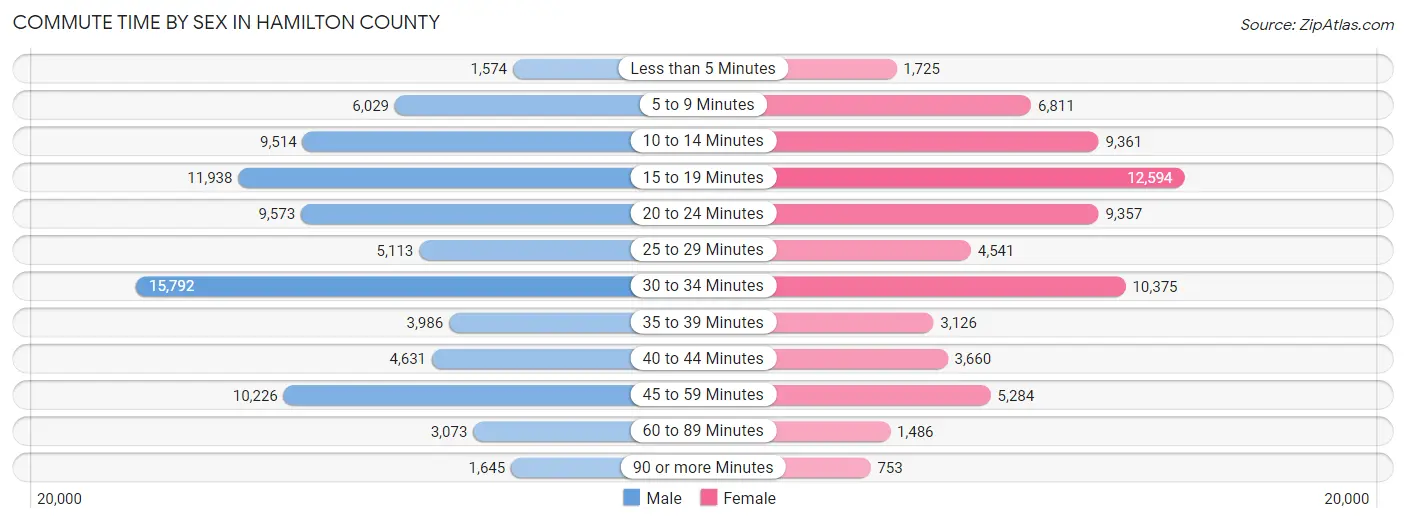
| Commute Time | Male | Female |
| Less than 5 Minutes | 1,574 (1.9%) | 1,725 (2.5%) |
| 5 to 9 Minutes | 6,029 (7.3%) | 6,811 (9.9%) |
| 10 to 14 Minutes | 9,514 (11.5%) | 9,361 (13.6%) |
| 15 to 19 Minutes | 11,938 (14.4%) | 12,594 (18.2%) |
| 20 to 24 Minutes | 9,573 (11.5%) | 9,357 (13.6%) |
| 25 to 29 Minutes | 5,113 (6.1%) | 4,541 (6.6%) |
| 30 to 34 Minutes | 15,792 (19.0%) | 10,375 (15.0%) |
| 35 to 39 Minutes | 3,986 (4.8%) | 3,126 (4.5%) |
| 40 to 44 Minutes | 4,631 (5.6%) | 3,660 (5.3%) |
| 45 to 59 Minutes | 10,226 (12.3%) | 5,284 (7.6%) |
| 60 to 89 Minutes | 3,073 (3.7%) | 1,486 (2.1%) |
| 90 or more Minutes | 1,645 (2.0%) | 753 (1.1%) |
Time of Departure to Work by Sex in Hamilton County
The most frequent times of departure to work in Hamilton County are 7:00 AM to 7:29 AM (15,833, 19.1%) for males and 7:00 AM to 7:29 AM (13,288, 19.2%) for females.
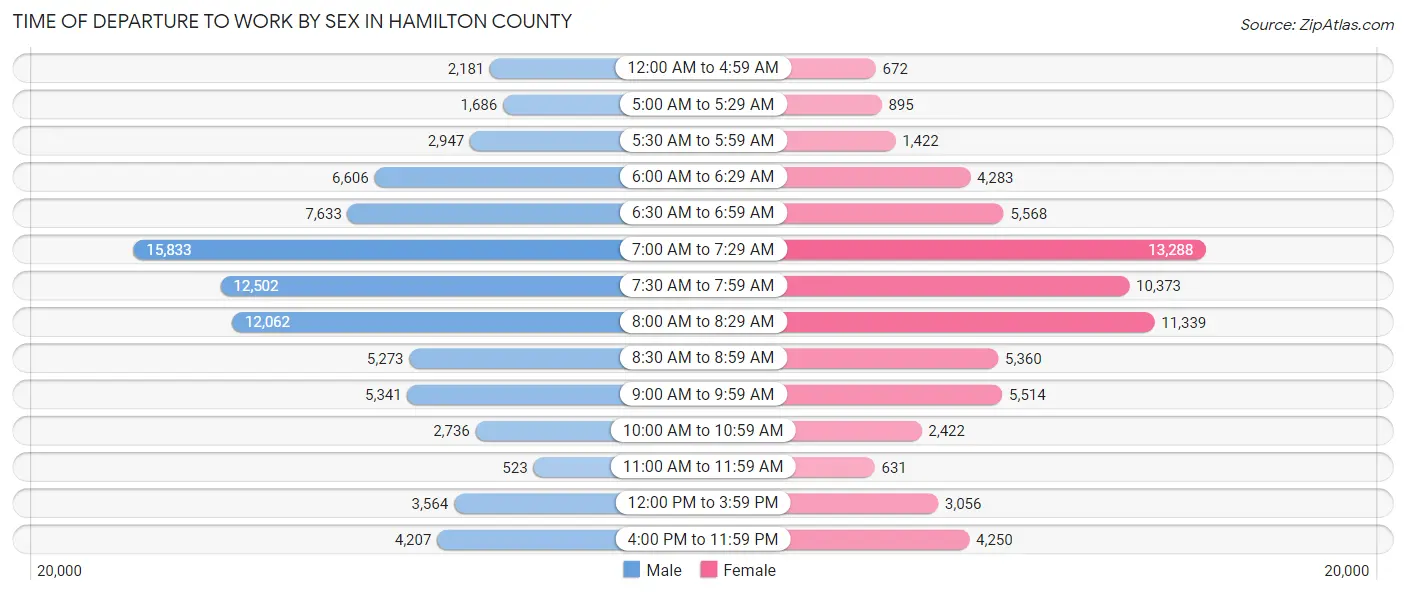
| Time of Departure | Male | Female |
| 12:00 AM to 4:59 AM | 2,181 (2.6%) | 672 (1.0%) |
| 5:00 AM to 5:29 AM | 1,686 (2.0%) | 895 (1.3%) |
| 5:30 AM to 5:59 AM | 2,947 (3.5%) | 1,422 (2.1%) |
| 6:00 AM to 6:29 AM | 6,606 (8.0%) | 4,283 (6.2%) |
| 6:30 AM to 6:59 AM | 7,633 (9.2%) | 5,568 (8.1%) |
| 7:00 AM to 7:29 AM | 15,833 (19.1%) | 13,288 (19.2%) |
| 7:30 AM to 7:59 AM | 12,502 (15.0%) | 10,373 (15.0%) |
| 8:00 AM to 8:29 AM | 12,062 (14.5%) | 11,339 (16.4%) |
| 8:30 AM to 8:59 AM | 5,273 (6.4%) | 5,360 (7.8%) |
| 9:00 AM to 9:59 AM | 5,341 (6.4%) | 5,514 (8.0%) |
| 10:00 AM to 10:59 AM | 2,736 (3.3%) | 2,422 (3.5%) |
| 11:00 AM to 11:59 AM | 523 (0.6%) | 631 (0.9%) |
| 12:00 PM to 3:59 PM | 3,564 (4.3%) | 3,056 (4.4%) |
| 4:00 PM to 11:59 PM | 4,207 (5.1%) | 4,250 (6.1%) |
| Total | 83,094 (100.0%) | 69,073 (100.0%) |
Housing Occupancy in Hamilton County
Occupancy by Ownership in Hamilton County
Of the total 129,749 dwellings in Hamilton County, owner-occupied units account for 99,007 (76.3%), while renter-occupied units make up 30,742 (23.7%).
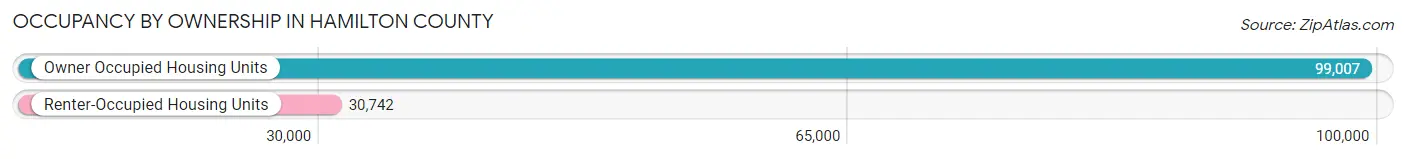
| Occupancy | # Housing Units | % Housing Units |
| Owner Occupied Housing Units | 99,007 | 76.3% |
| Renter-Occupied Housing Units | 30,742 | 23.7% |
| Total Occupied Housing Units | 129,749 | 100.0% |
Occupancy by Household Size in Hamilton County
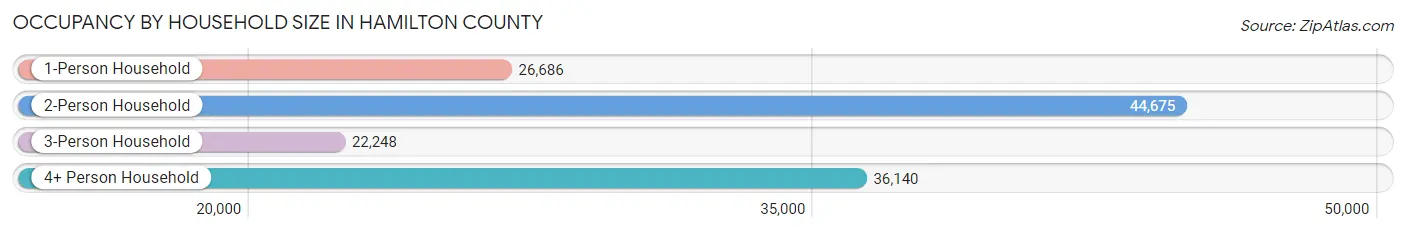
| Household Size | # Housing Units | % Housing Units |
| 1-Person Household | 26,686 | 20.6% |
| 2-Person Household | 44,675 | 34.4% |
| 3-Person Household | 22,248 | 17.2% |
| 4+ Person Household | 36,140 | 27.9% |
| Total Housing Units | 129,749 | 100.0% |
Occupancy by Ownership by Household Size in Hamilton County
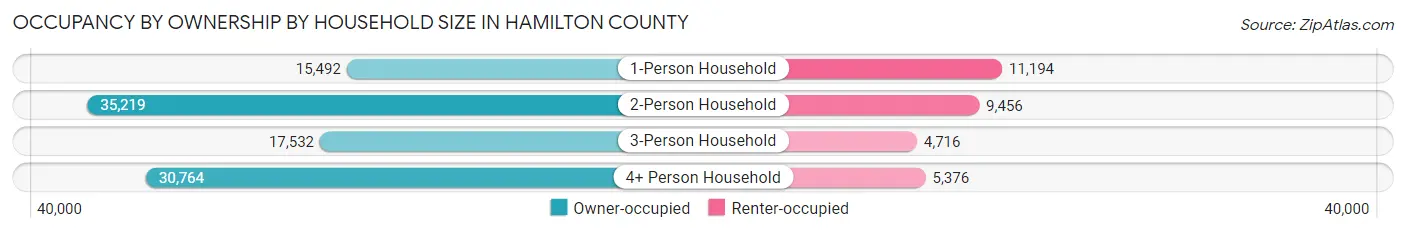
| Household Size | Owner-occupied | Renter-occupied |
| 1-Person Household | 15,492 (58.1%) | 11,194 (41.9%) |
| 2-Person Household | 35,219 (78.8%) | 9,456 (21.2%) |
| 3-Person Household | 17,532 (78.8%) | 4,716 (21.2%) |
| 4+ Person Household | 30,764 (85.1%) | 5,376 (14.9%) |
| Total Housing Units | 99,007 (76.3%) | 30,742 (23.7%) |
Occupancy by Educational Attainment in Hamilton County
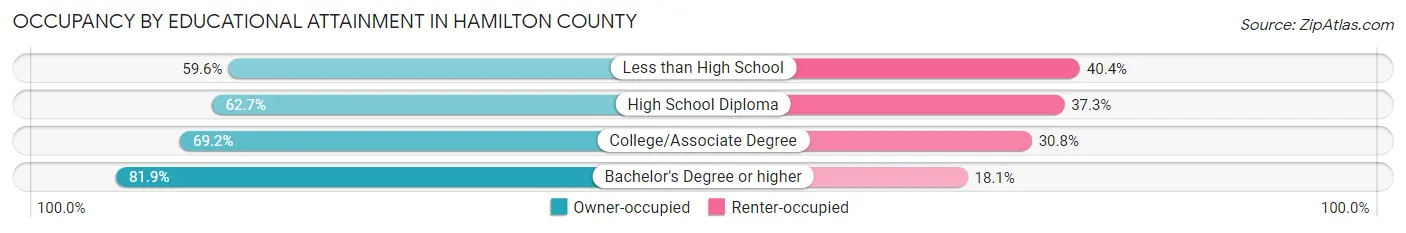
| Household Size | Owner-occupied | Renter-occupied |
| Less than High School | 1,653 (59.6%) | 1,120 (40.4%) |
| High School Diploma | 10,072 (62.7%) | 5,986 (37.3%) |
| College/Associate Degree | 19,182 (69.2%) | 8,554 (30.8%) |
| Bachelor's Degree or higher | 68,100 (81.9%) | 15,082 (18.1%) |
Occupancy by Age of Householder in Hamilton County
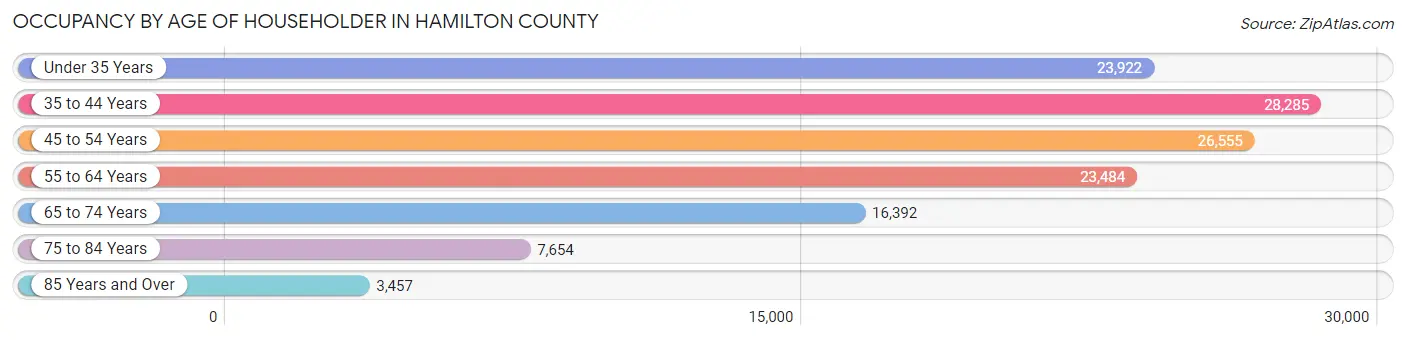
| Age Bracket | # Households | % Households |
| Under 35 Years | 23,922 | 18.4% |
| 35 to 44 Years | 28,285 | 21.8% |
| 45 to 54 Years | 26,555 | 20.5% |
| 55 to 64 Years | 23,484 | 18.1% |
| 65 to 74 Years | 16,392 | 12.6% |
| 75 to 84 Years | 7,654 | 5.9% |
| 85 Years and Over | 3,457 | 2.7% |
| Total | 129,749 | 100.0% |
Housing Finances in Hamilton County
Median Income by Occupancy in Hamilton County
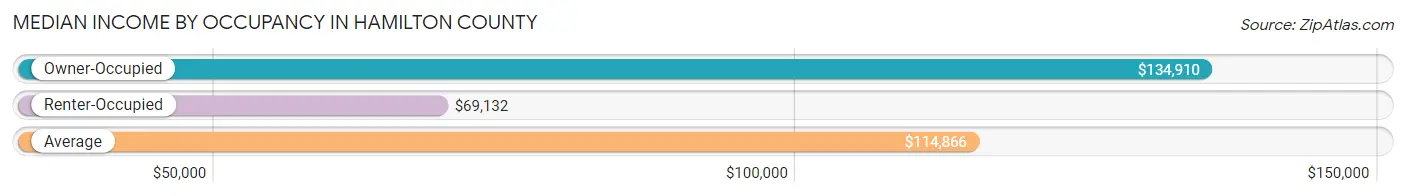
| Occupancy Type | # Households | Median Income |
| Owner-Occupied | 99,007 (76.3%) | $134,910 |
| Renter-Occupied | 30,742 (23.7%) | $69,132 |
| Average | 129,749 (100.0%) | $114,866 |
Occupancy by Householder Income Bracket in Hamilton County
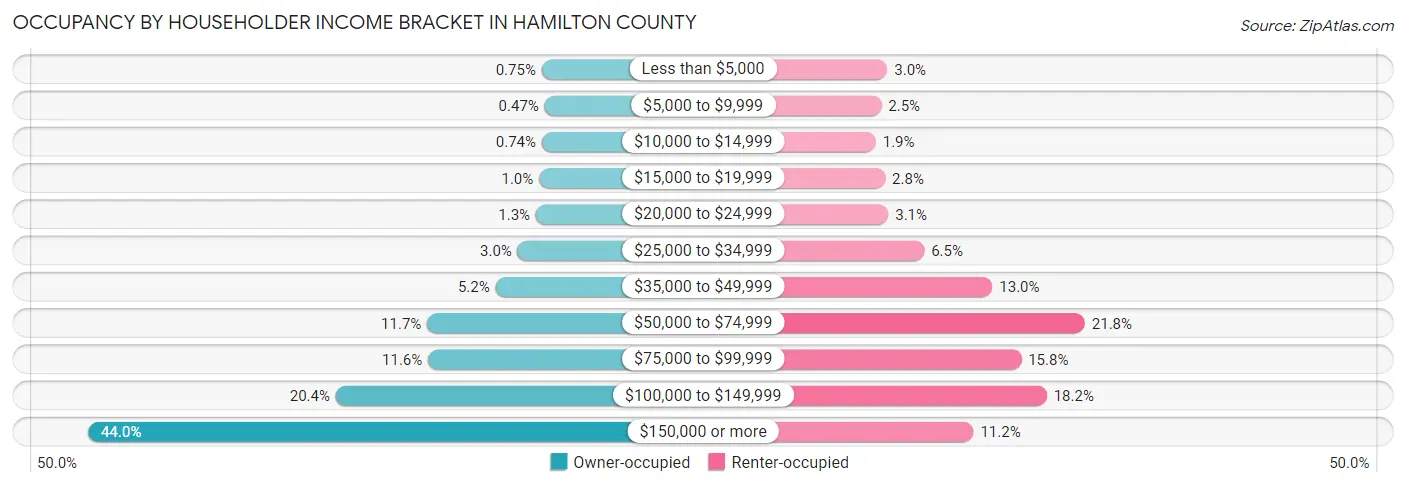
| Income Bracket | Owner-occupied | Renter-occupied |
| Less than $5,000 | 739 (0.7%) | 933 (3.0%) |
| $5,000 to $9,999 | 464 (0.5%) | 757 (2.5%) |
| $10,000 to $14,999 | 735 (0.7%) | 593 (1.9%) |
| $15,000 to $19,999 | 990 (1.0%) | 867 (2.8%) |
| $20,000 to $24,999 | 1,286 (1.3%) | 960 (3.1%) |
| $25,000 to $34,999 | 3,009 (3.0%) | 2,011 (6.5%) |
| $35,000 to $49,999 | 5,101 (5.1%) | 4,006 (13.0%) |
| $50,000 to $74,999 | 11,548 (11.7%) | 6,713 (21.8%) |
| $75,000 to $99,999 | 11,452 (11.6%) | 4,852 (15.8%) |
| $100,000 to $149,999 | 20,159 (20.4%) | 5,599 (18.2%) |
| $150,000 or more | 43,524 (44.0%) | 3,451 (11.2%) |
| Total | 99,007 (100.0%) | 30,742 (100.0%) |
Monthly Housing Cost Tiers in Hamilton County
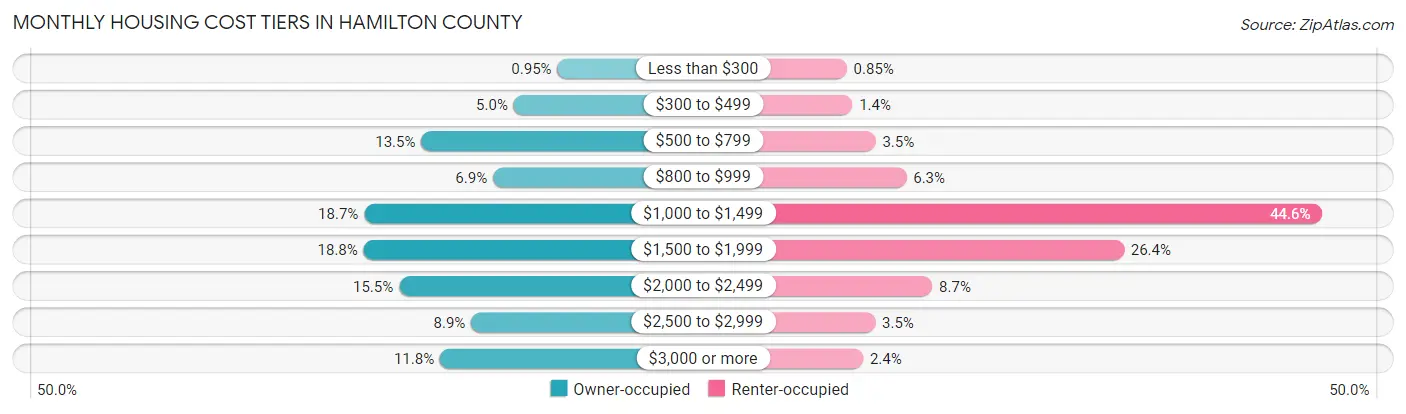
| Monthly Cost | Owner-occupied | Renter-occupied |
| Less than $300 | 941 (0.9%) | 261 (0.9%) |
| $300 to $499 | 4,924 (5.0%) | 417 (1.4%) |
| $500 to $799 | 13,349 (13.5%) | 1,075 (3.5%) |
| $800 to $999 | 6,812 (6.9%) | 1,948 (6.3%) |
| $1,000 to $1,499 | 18,558 (18.7%) | 13,720 (44.6%) |
| $1,500 to $1,999 | 18,600 (18.8%) | 8,104 (26.4%) |
| $2,000 to $2,499 | 15,379 (15.5%) | 2,682 (8.7%) |
| $2,500 to $2,999 | 8,804 (8.9%) | 1,067 (3.5%) |
| $3,000 or more | 11,640 (11.8%) | 723 (2.4%) |
| Total | 99,007 (100.0%) | 30,742 (100.0%) |
Physical Housing Characteristics in Hamilton County
Housing Structures in Hamilton County
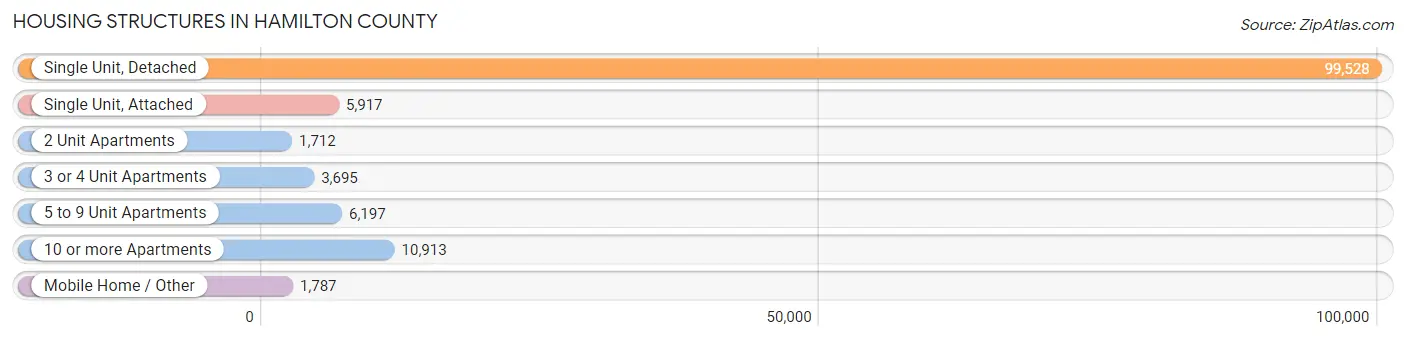
| Structure Type | # Housing Units | % Housing Units |
| Single Unit, Detached | 99,528 | 76.7% |
| Single Unit, Attached | 5,917 | 4.6% |
| 2 Unit Apartments | 1,712 | 1.3% |
| 3 or 4 Unit Apartments | 3,695 | 2.9% |
| 5 to 9 Unit Apartments | 6,197 | 4.8% |
| 10 or more Apartments | 10,913 | 8.4% |
| Mobile Home / Other | 1,787 | 1.4% |
| Total | 129,749 | 100.0% |
Housing Structures by Occupancy in Hamilton County
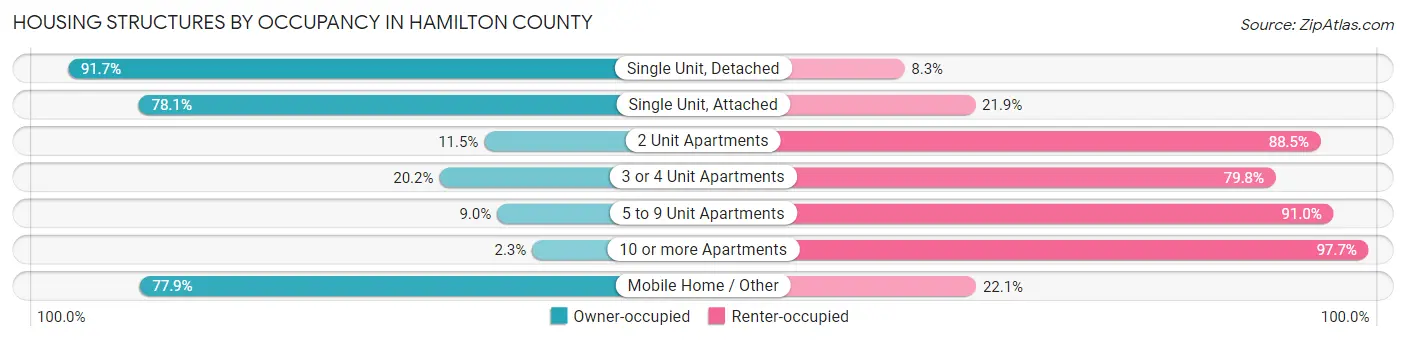
| Structure Type | Owner-occupied | Renter-occupied |
| Single Unit, Detached | 91,244 (91.7%) | 8,284 (8.3%) |
| Single Unit, Attached | 4,619 (78.1%) | 1,298 (21.9%) |
| 2 Unit Apartments | 197 (11.5%) | 1,515 (88.5%) |
| 3 or 4 Unit Apartments | 745 (20.2%) | 2,950 (79.8%) |
| 5 to 9 Unit Apartments | 560 (9.0%) | 5,637 (91.0%) |
| 10 or more Apartments | 250 (2.3%) | 10,663 (97.7%) |
| Mobile Home / Other | 1,392 (77.9%) | 395 (22.1%) |
| Total | 99,007 (76.3%) | 30,742 (23.7%) |
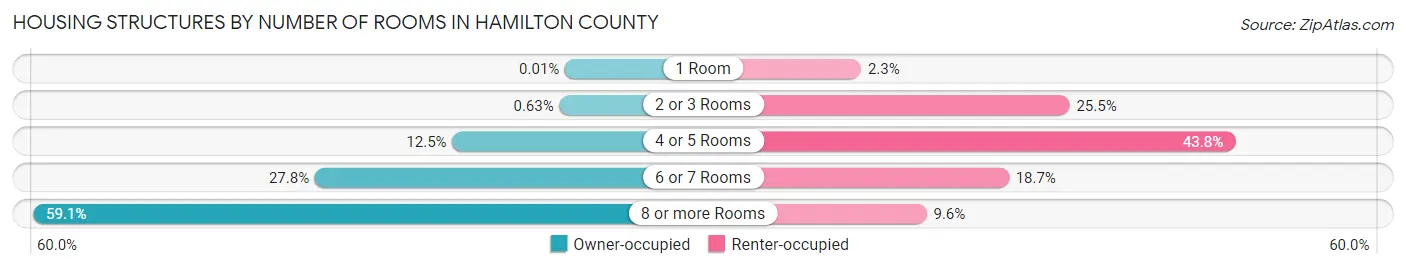
Housing Structures by Number of Rooms in Hamilton County
| Number of Rooms | Owner-occupied | Renter-occupied |
| 1 Room | 11 (0.0%) | 719 (2.3%) |
| 2 or 3 Rooms | 626 (0.6%) | 7,834 (25.5%) |
| 4 or 5 Rooms | 12,395 (12.5%) | 13,476 (43.8%) |
| 6 or 7 Rooms | 27,499 (27.8%) | 5,758 (18.7%) |
| 8 or more Rooms | 58,476 (59.1%) | 2,955 (9.6%) |
| Total | 99,007 (100.0%) | 30,742 (100.0%) |
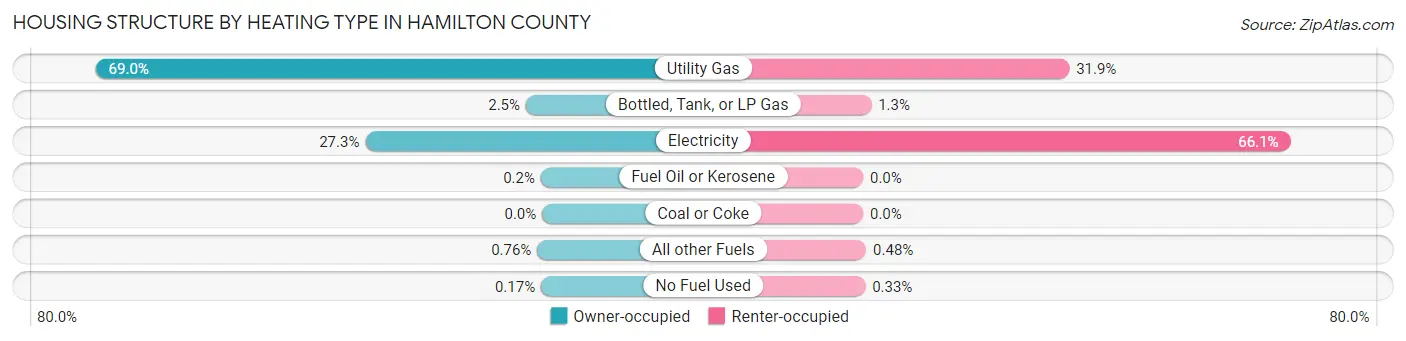
Housing Structure by Heating Type in Hamilton County
| Heating Type | Owner-occupied | Renter-occupied |
| Utility Gas | 68,328 (69.0%) | 9,799 (31.9%) |
| Bottled, Tank, or LP Gas | 2,489 (2.5%) | 387 (1.3%) |
| Electricity | 27,064 (27.3%) | 20,309 (66.1%) |
| Fuel Oil or Kerosene | 200 (0.2%) | 0 (0.0%) |
| Coal or Coke | 0 (0.0%) | 0 (0.0%) |
| All other Fuels | 754 (0.8%) | 147 (0.5%) |
| No Fuel Used | 172 (0.2%) | 100 (0.3%) |
| Total | 99,007 (100.0%) | 30,742 (100.0%) |
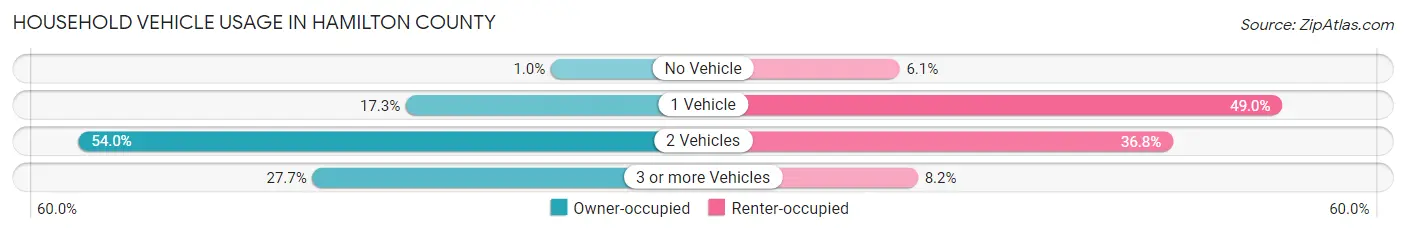
Household Vehicle Usage in Hamilton County
| Vehicles per Household | Owner-occupied | Renter-occupied |
| No Vehicle | 1,017 (1.0%) | 1,879 (6.1%) |
| 1 Vehicle | 17,096 (17.3%) | 15,060 (49.0%) |
| 2 Vehicles | 53,431 (54.0%) | 11,297 (36.7%) |
| 3 or more Vehicles | 27,463 (27.7%) | 2,506 (8.2%) |
| Total | 99,007 (100.0%) | 30,742 (100.0%) |
Real Estate & Mortgages in Hamilton County
Real Estate and Mortgage Overview in Hamilton County
| Characteristic | Without Mortgage | With Mortgage |
| Housing Units | 25,532 | 73,475 |
| Median Property Value | $330,000 | $357,400 |
| Median Household Income | $90,606 | $36,137 |
| Monthly Housing Costs | $664 | $11,557 |
| Real Estate Taxes | $3,044 | $713 |
Property Value by Mortgage Status in Hamilton County
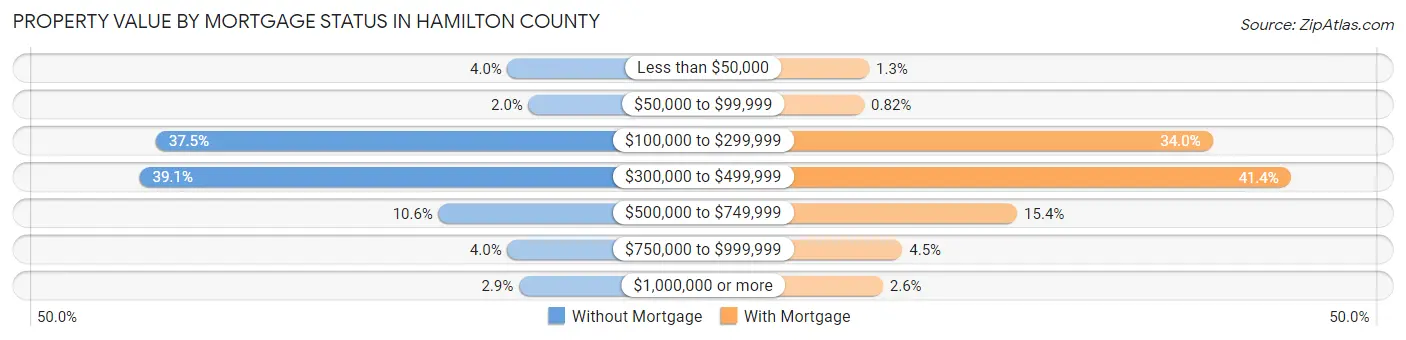
| Property Value | Without Mortgage | With Mortgage |
| Less than $50,000 | 1,018 (4.0%) | 945 (1.3%) |
| $50,000 to $99,999 | 509 (2.0%) | 606 (0.8%) |
| $100,000 to $299,999 | 9,574 (37.5%) | 24,978 (34.0%) |
| $300,000 to $499,999 | 9,970 (39.1%) | 30,451 (41.4%) |
| $500,000 to $749,999 | 2,696 (10.6%) | 11,305 (15.4%) |
| $750,000 to $999,999 | 1,023 (4.0%) | 3,277 (4.5%) |
| $1,000,000 or more | 742 (2.9%) | 1,913 (2.6%) |
| Total | 25,532 (100.0%) | 73,475 (100.0%) |
Household Income by Mortgage Status in Hamilton County
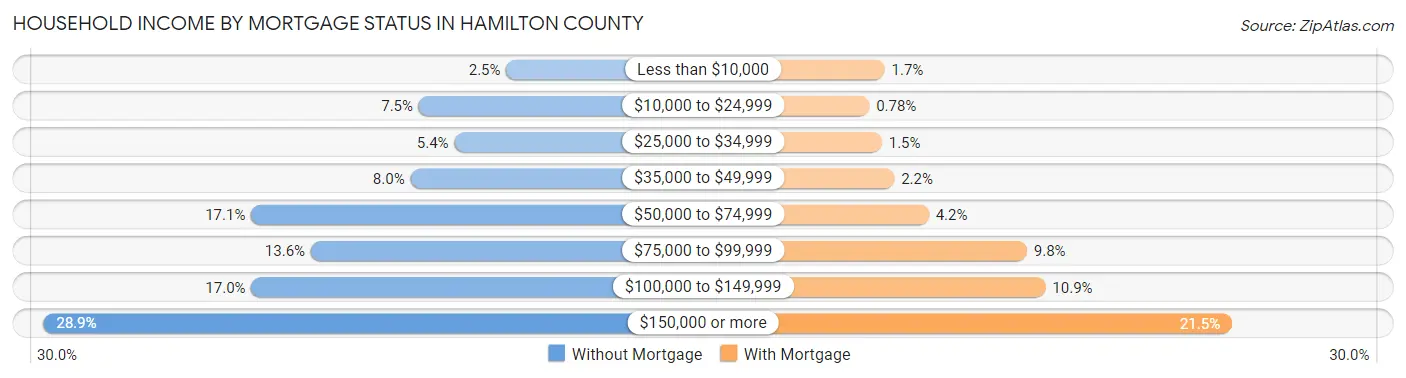
| Household Income | Without Mortgage | With Mortgage |
| Less than $10,000 | 631 (2.5%) | 1,219 (1.7%) |
| $10,000 to $24,999 | 1,907 (7.5%) | 572 (0.8%) |
| $25,000 to $34,999 | 1,388 (5.4%) | 1,104 (1.5%) |
| $35,000 to $49,999 | 2,031 (8.0%) | 1,621 (2.2%) |
| $50,000 to $74,999 | 4,354 (17.1%) | 3,070 (4.2%) |
| $75,000 to $99,999 | 3,483 (13.6%) | 7,194 (9.8%) |
| $100,000 to $149,999 | 4,351 (17.0%) | 7,969 (10.8%) |
| $150,000 or more | 7,387 (28.9%) | 15,808 (21.5%) |
| Total | 25,532 (100.0%) | 73,475 (100.0%) |
Property Value to Household Income Ratio in Hamilton County
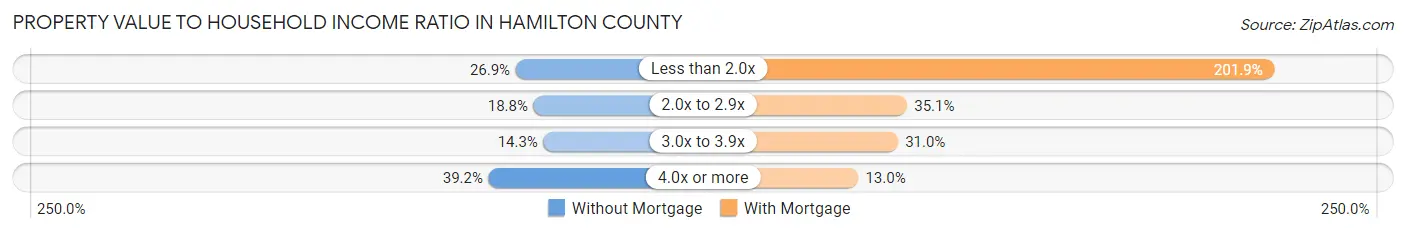
| Value-to-Income Ratio | Without Mortgage | With Mortgage |
| Less than 2.0x | 6,871 (26.9%) | 148,334 (201.9%) |
| 2.0x to 2.9x | 4,802 (18.8%) | 25,819 (35.1%) |
| 3.0x to 3.9x | 3,653 (14.3%) | 22,780 (31.0%) |
| 4.0x or more | 10,016 (39.2%) | 9,530 (13.0%) |
| Total | 25,532 (100.0%) | 73,475 (100.0%) |
Real Estate Taxes by Mortgage Status in Hamilton County
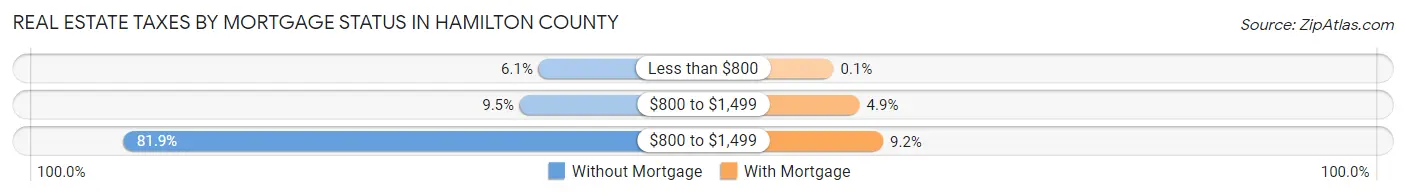
| Property Taxes | Without Mortgage | With Mortgage |
| Less than $800 | 1,556 (6.1%) | 74 (0.1%) |
| $800 to $1,499 | 2,435 (9.5%) | 3,572 (4.9%) |
| $800 to $1,499 | 20,901 (81.9%) | 6,723 (9.1%) |
| Total | 25,532 (100.0%) | 73,475 (100.0%) |
Health & Disability in Hamilton County
Health Insurance Coverage by Age in Hamilton County
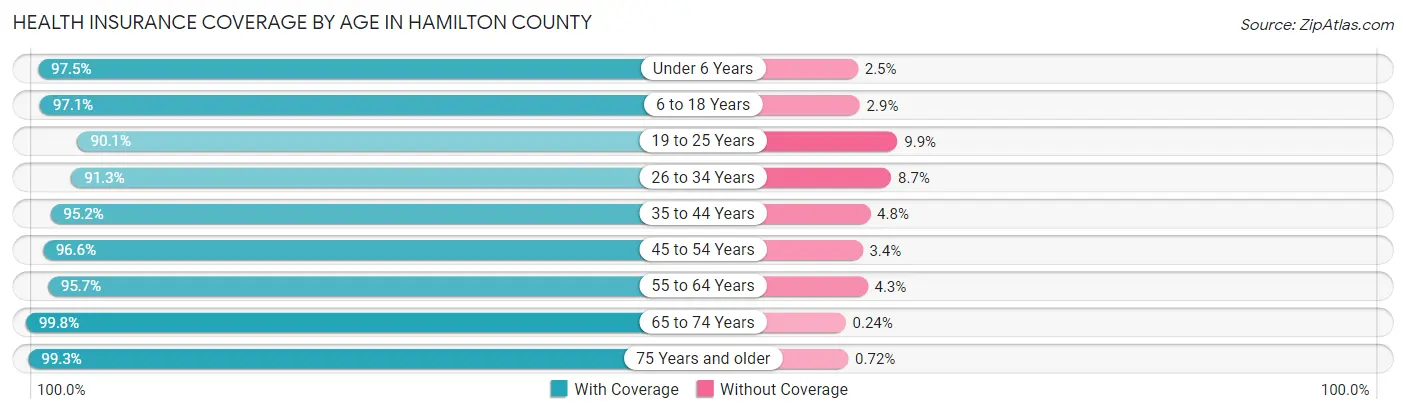
| Age Bracket | With Coverage | Without Coverage |
| Under 6 Years | 25,383 (97.5%) | 657 (2.5%) |
| 6 to 18 Years | 68,385 (97.1%) | 2,016 (2.9%) |
| 19 to 25 Years | 23,359 (90.1%) | 2,565 (9.9%) |
| 26 to 34 Years | 34,366 (91.3%) | 3,283 (8.7%) |
| 35 to 44 Years | 49,385 (95.2%) | 2,499 (4.8%) |
| 45 to 54 Years | 47,654 (96.6%) | 1,670 (3.4%) |
| 55 to 64 Years | 39,497 (95.7%) | 1,787 (4.3%) |
| 65 to 74 Years | 27,632 (99.8%) | 67 (0.2%) |
| 75 Years and older | 16,932 (99.3%) | 123 (0.7%) |
| Total | 332,593 (95.8%) | 14,667 (4.2%) |
Health Insurance Coverage by Citizenship Status in Hamilton County
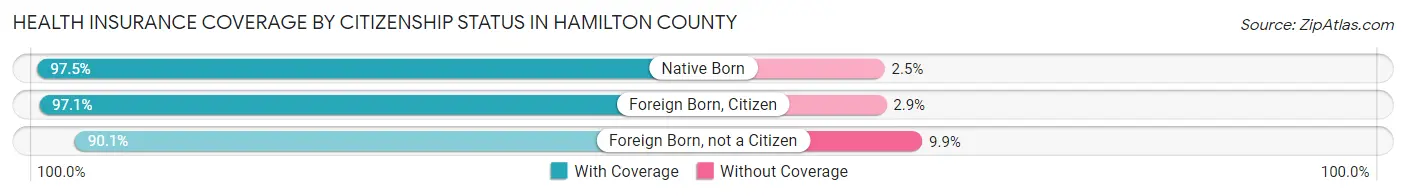
| Citizenship Status | With Coverage | Without Coverage |
| Native Born | 25,383 (97.5%) | 657 (2.5%) |
| Foreign Born, Citizen | 68,385 (97.1%) | 2,016 (2.9%) |
| Foreign Born, not a Citizen | 23,359 (90.1%) | 2,565 (9.9%) |
Health Insurance Coverage by Household Income in Hamilton County
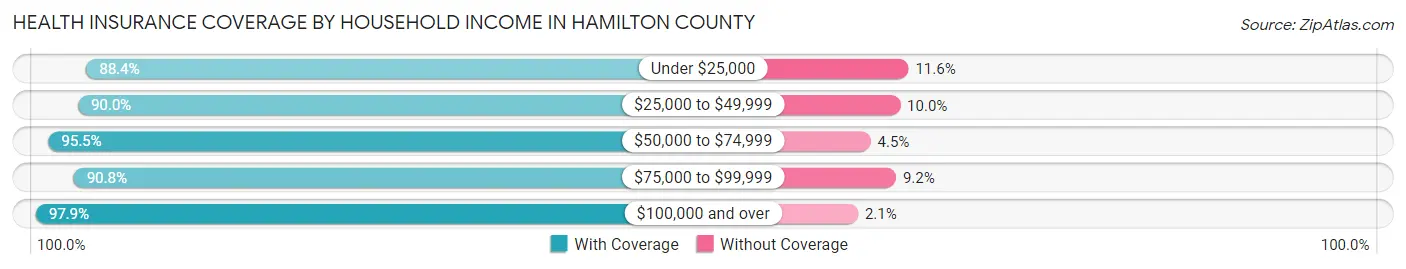
| Household Income | With Coverage | Without Coverage |
| Under $25,000 | 13,170 (88.4%) | 1,722 (11.6%) |
| $25,000 to $49,999 | 22,190 (90.0%) | 2,465 (10.0%) |
| $50,000 to $74,999 | 37,921 (95.5%) | 1,769 (4.5%) |
| $75,000 to $99,999 | 39,204 (90.8%) | 3,975 (9.2%) |
| $100,000 and over | 219,953 (97.9%) | 4,728 (2.1%) |
Public vs Private Health Insurance Coverage by Age in Hamilton County
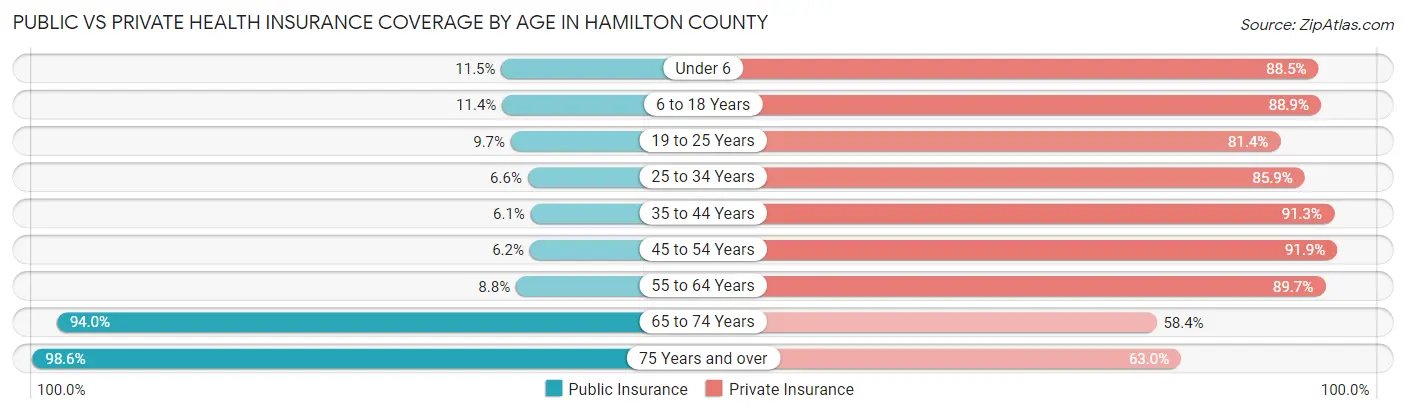
| Age Bracket | Public Insurance | Private Insurance |
| Under 6 | 2,996 (11.5%) | 23,034 (88.5%) |
| 6 to 18 Years | 8,000 (11.4%) | 62,583 (88.9%) |
| 19 to 25 Years | 2,524 (9.7%) | 21,091 (81.4%) |
| 25 to 34 Years | 2,490 (6.6%) | 32,339 (85.9%) |
| 35 to 44 Years | 3,145 (6.1%) | 47,383 (91.3%) |
| 45 to 54 Years | 3,071 (6.2%) | 45,343 (91.9%) |
| 55 to 64 Years | 3,630 (8.8%) | 37,032 (89.7%) |
| 65 to 74 Years | 26,049 (94.0%) | 16,175 (58.4%) |
| 75 Years and over | 16,810 (98.6%) | 10,736 (62.9%) |
| Total | 68,715 (19.8%) | 295,716 (85.2%) |
Disability Status by Sex by Age in Hamilton County
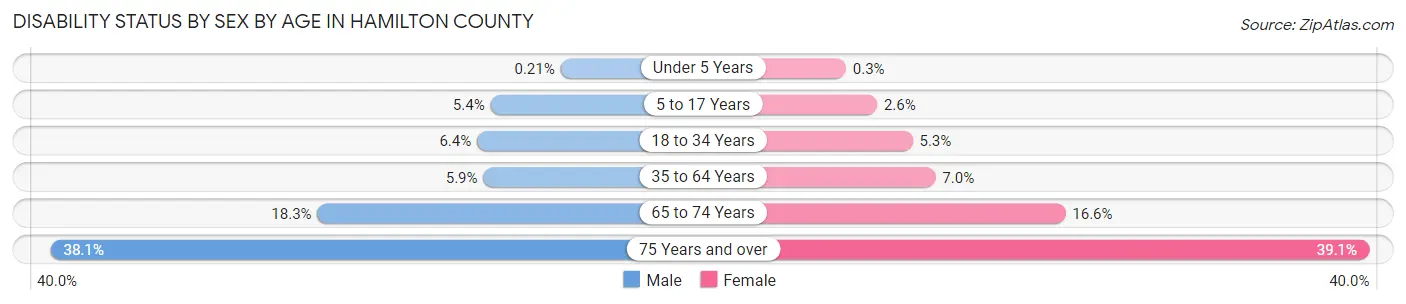
| Age Bracket | Male | Female |
| Under 5 Years | 22 (0.2%) | 31 (0.3%) |
| 5 to 17 Years | 1,930 (5.4%) | 888 (2.6%) |
| 18 to 34 Years | 2,201 (6.4%) | 1,832 (5.2%) |
| 35 to 64 Years | 4,165 (5.9%) | 5,025 (7.0%) |
| 65 to 74 Years | 2,380 (18.3%) | 2,435 (16.6%) |
| 75 Years and over | 2,646 (38.1%) | 3,954 (39.1%) |
Disability Class by Sex by Age in Hamilton County
Disability Class: Hearing Difficulty
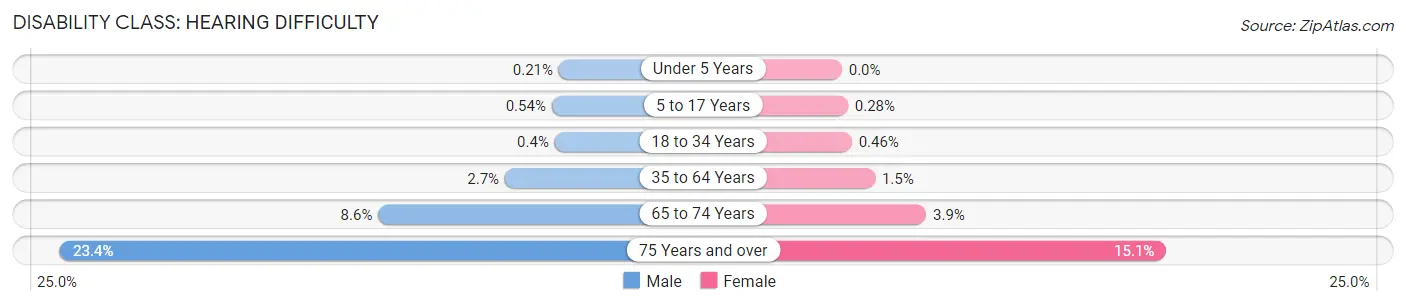
| Age Bracket | Male | Female |
| Under 5 Years | 22 (0.2%) | 0 (0.0%) |
| 5 to 17 Years | 192 (0.5%) | 95 (0.3%) |
| 18 to 34 Years | 137 (0.4%) | 161 (0.5%) |
| 35 to 64 Years | 1,904 (2.7%) | 1,115 (1.5%) |
| 65 to 74 Years | 1,119 (8.6%) | 573 (3.9%) |
| 75 Years and over | 1,623 (23.4%) | 1,521 (15.0%) |
Disability Class: Vision Difficulty
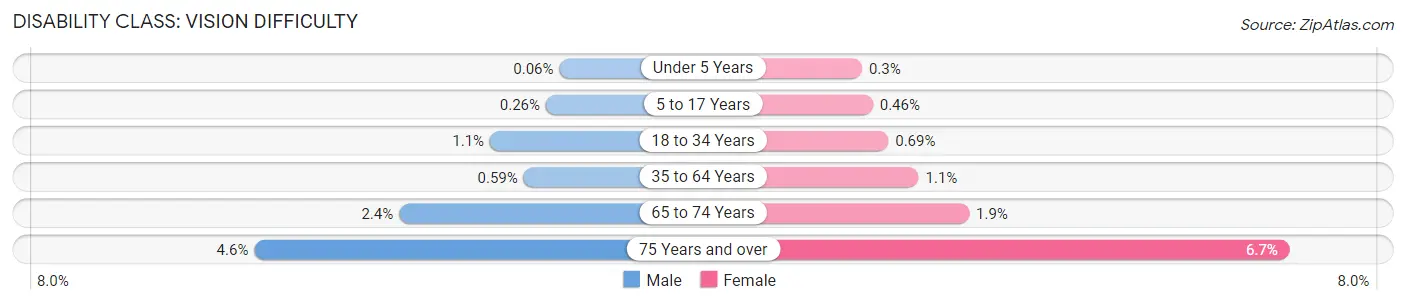
| Age Bracket | Male | Female |
| Under 5 Years | 6 (0.1%) | 31 (0.3%) |
| 5 to 17 Years | 91 (0.3%) | 157 (0.5%) |
| 18 to 34 Years | 376 (1.1%) | 240 (0.7%) |
| 35 to 64 Years | 413 (0.6%) | 825 (1.1%) |
| 65 to 74 Years | 318 (2.4%) | 277 (1.9%) |
| 75 Years and over | 319 (4.6%) | 672 (6.7%) |
Disability Class: Cognitive Difficulty
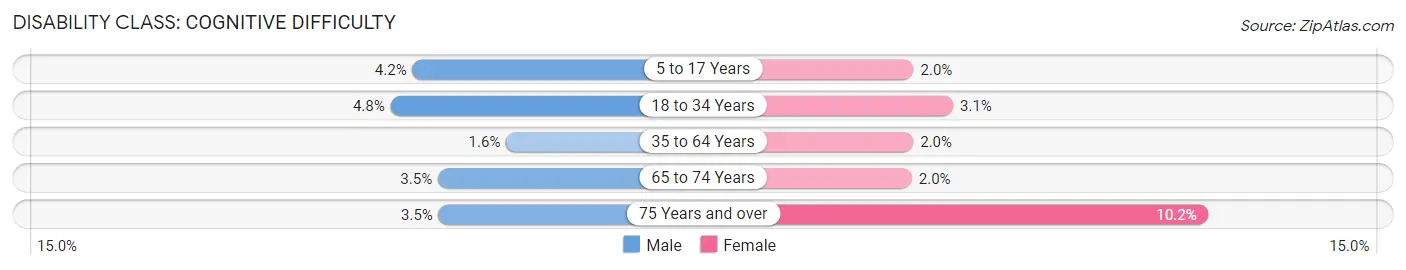
| Age Bracket | Male | Female |
| 5 to 17 Years | 1,499 (4.2%) | 681 (2.0%) |
| 18 to 34 Years | 1,652 (4.8%) | 1,080 (3.1%) |
| 35 to 64 Years | 1,113 (1.6%) | 1,441 (2.0%) |
| 65 to 74 Years | 455 (3.5%) | 286 (1.9%) |
| 75 Years and over | 241 (3.5%) | 1,032 (10.2%) |
Disability Class: Ambulatory Difficulty
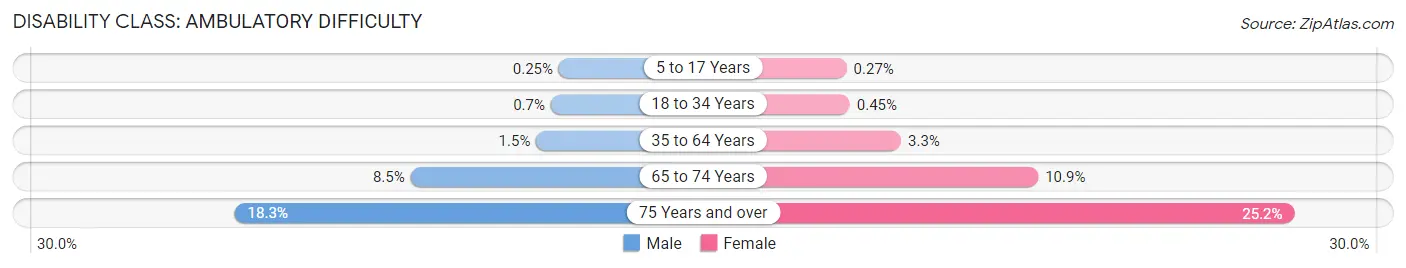
| Age Bracket | Male | Female |
| 5 to 17 Years | 88 (0.3%) | 92 (0.3%) |
| 18 to 34 Years | 242 (0.7%) | 157 (0.4%) |
| 35 to 64 Years | 1,061 (1.5%) | 2,385 (3.3%) |
| 65 to 74 Years | 1,109 (8.5%) | 1,604 (10.9%) |
| 75 Years and over | 1,272 (18.3%) | 2,546 (25.2%) |
Disability Class: Self-Care Difficulty
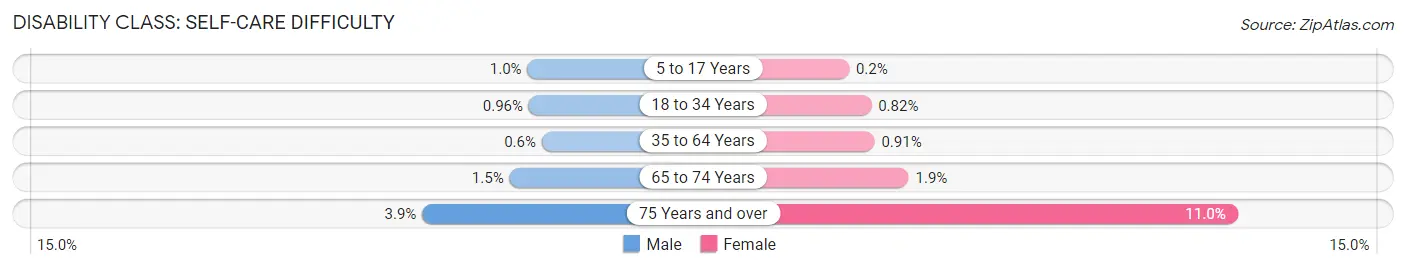
| Age Bracket | Male | Female |
| 5 to 17 Years | 357 (1.0%) | 68 (0.2%) |
| 18 to 34 Years | 331 (1.0%) | 285 (0.8%) |
| 35 to 64 Years | 421 (0.6%) | 655 (0.9%) |
| 65 to 74 Years | 195 (1.5%) | 273 (1.9%) |
| 75 Years and over | 273 (3.9%) | 1,114 (11.0%) |
Technology Access in Hamilton County
Computing Device Access in Hamilton County
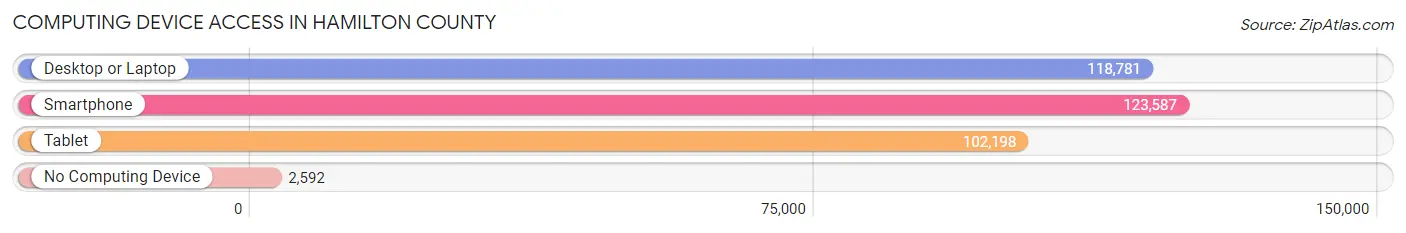
| Device Type | # Households | % Households |
| Desktop or Laptop | 118,781 | 91.5% |
| Smartphone | 123,587 | 95.3% |
| Tablet | 102,198 | 78.8% |
| No Computing Device | 2,592 | 2.0% |
| Total | 129,749 | 100.0% |
Internet Access in Hamilton County
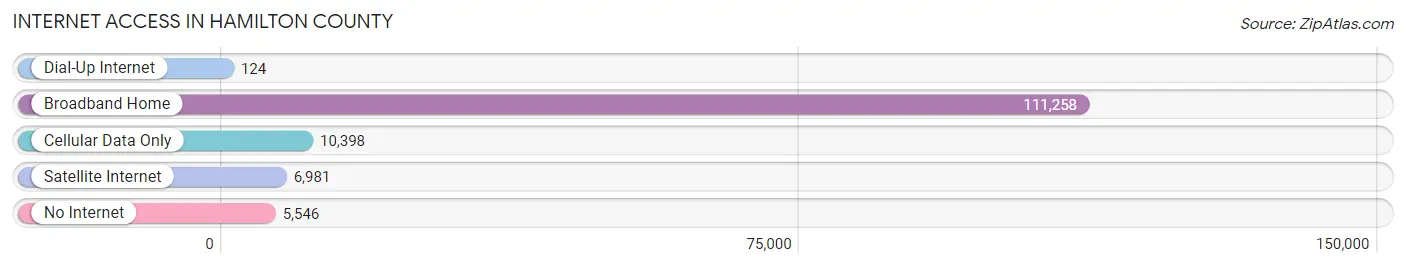
| Internet Type | # Households | % Households |
| Dial-Up Internet | 124 | 0.1% |
| Broadband Home | 111,258 | 85.8% |
| Cellular Data Only | 10,398 | 8.0% |
| Satellite Internet | 6,981 | 5.4% |
| No Internet | 5,546 | 4.3% |
| Total | 129,749 | 100.0% |
Hamilton County Summary
Hamilton County, Indiana is located in the central part of the state, just north of Indianapolis. It is bordered by Marion, Boone, Madison, Hancock, and Tipton counties. Hamilton County is part of the Indianapolis metropolitan area and is home to a population of over 300,000 people.
History
Hamilton County was formed in 1823 from parts of Marion and Madison counties. It was named after Alexander Hamilton, the first Secretary of the Treasury. The county seat is Noblesville, which was founded in 1823.
The first settlers in the area were Quakers, who arrived in the early 1800s. They were followed by German immigrants in the 1840s. The county was largely agricultural until the late 19th century, when the railroad arrived and industry began to develop.
Geography
Hamilton County is located in the central part of Indiana, just north of Indianapolis. It is bordered by Marion, Boone, Madison, Hancock, and Tipton counties. The county covers an area of 441 square miles and is home to a population of over 300,000 people.
The county is mostly flat, with some rolling hills in the northern part. The White River runs through the county, and there are several small lakes and ponds. The climate is humid continental, with hot summers and cold winters.
Economy
Hamilton County is part of the Indianapolis metropolitan area, and the economy is largely based on services and manufacturing. The county is home to several large companies, including Allison Transmission, Conner Prairie, and the Indianapolis Motor Speedway.
The county also has a strong agricultural sector, with corn, soybeans, and wheat being the main crops. Livestock production is also important, with cattle, hogs, and poultry being the main animals raised.
Demographics
As of the 2010 census, Hamilton County had a population of 288,918 people. The racial makeup of the county was 87.3% White, 8.2% African American, 0.7% Native American, 1.7% Asian, 0.1% Pacific Islander, and 1.9% from other races. Hispanic or Latino of any race were 3.3% of the population.
The median household income was $60,945, and the median family income was $71,945. The per capita income was $29,945. About 8.2% of the population was below the poverty line.
Hamilton County is home to a diverse population, with a variety of cultures and backgrounds. The county is also home to several universities and colleges, including Butler University, Indiana University-Purdue University Indianapolis, and Ivy Tech Community College.
Common Questions
What is the Total Population of Hamilton County?
Total Population of Hamilton County is 349,527.
What is the Total Male Population of Hamilton County?
Total Male Population of Hamilton County is 172,239.
What is the Total Female Population of Hamilton County?
Total Female Population of Hamilton County is 177,288.
What is the Ratio of Males per 100 Females in Hamilton County?
There are 97.15 Males per 100 Females in Hamilton County.
What is the Ratio of Females per 100 Males in Hamilton County?
There are 102.93 Females per 100 Males in Hamilton County.
What is the Median Population Age in Hamilton County?
Median Population Age in Hamilton County is 37.8 Years.
What is the Average Family Size in Hamilton County
Average Family Size in Hamilton County is 3.1 People.
What is the Average Household Size in Hamilton County
Average Household Size in Hamilton County is 2.7 People.
What is Per Capita Income in Hamilton County?
Per Capita income in Hamilton County is $56,943.
What is the Median Family Income in Hamilton County?
Median Family Income in Hamilton County is $136,081.
What is the Median Household income in Hamilton County?
Median Household Income in Hamilton County is $114,866.
What is Income or Wage Gap in Hamilton County?
Income or Wage Gap in Hamilton County is 39.4%.
Women in Hamilton County earn 60.6 cents for every dollar earned by a man.
What is Family Income Deficit in Hamilton County?
Family Income Deficit in Hamilton County is $12,356.
Families that are below poverty line in Hamilton County earn $12,356 less on average than the poverty threshold level.
What is Inequality or Gini Index in Hamilton County?
Inequality or Gini Index in Hamilton County is 0.44.
How Large is the Labor Force in Hamilton County?
There are 192,235 People in the Labor Forcein in Hamilton County.
What is the Percentage of People in the Labor Force in Hamilton County?
71.3% of People are in the Labor Force in Hamilton County.
What is the Unemployment Rate in Hamilton County?
Unemployment Rate in Hamilton County is 2.7%.