Grant County, IN
Grant County Map
Grant County Overview
66,560
TOTAL POPULATION
31,961
MALE POPULATION
34,599
FEMALE POPULATION
92.38
MALES / 100 FEMALES
108.25
FEMALES / 100 MALES
40.1
MEDIAN AGE
2.9
AVG FAMILY SIZE
2.3
AVG HOUSEHOLD SIZE
$27,725
PER CAPITA INCOME
$68,385
AVG FAMILY INCOME
$53,033
AVG HOUSEHOLD INCOME
38.3%
WAGE / INCOME GAP [ % ]
61.7¢/ $1
WAGE / INCOME GAP [ $ ]
$12,803
FAMILY INCOME DEFICIT
0.43
INEQUALITY / GINI INDEX
31,930
LABOR FORCE [ PEOPLE ]
58.8%
PERCENT IN LABOR FORCE
7.3%
UNEMPLOYMENT RATE
Grant County Area Codes
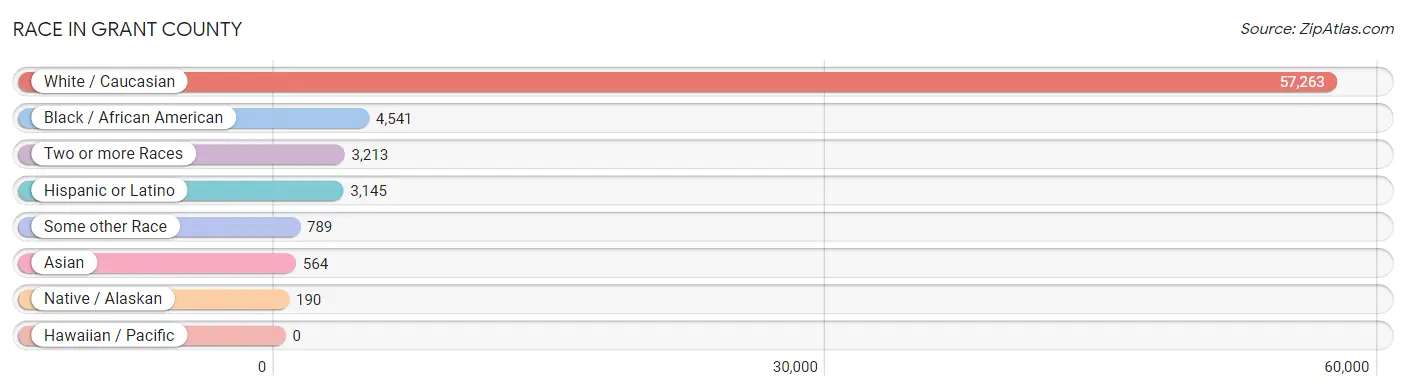
Race in Grant County
The most populous races in Grant County are White / Caucasian (57,263 | 86.0%), Black / African American (4,541 | 6.8%), and Two or more Races (3,213 | 4.8%).
| Race | # Population | % Population |
| Asian | 564 | 0.9% |
| Black / African American | 4,541 | 6.8% |
| Hawaiian / Pacific | 0 | 0.0% |
| Hispanic or Latino | 3,145 | 4.7% |
| Native / Alaskan | 190 | 0.3% |
| White / Caucasian | 57,263 | 86.0% |
| Two or more Races | 3,213 | 4.8% |
| Some other Race | 789 | 1.2% |
| Total | 66,560 | 100.0% |
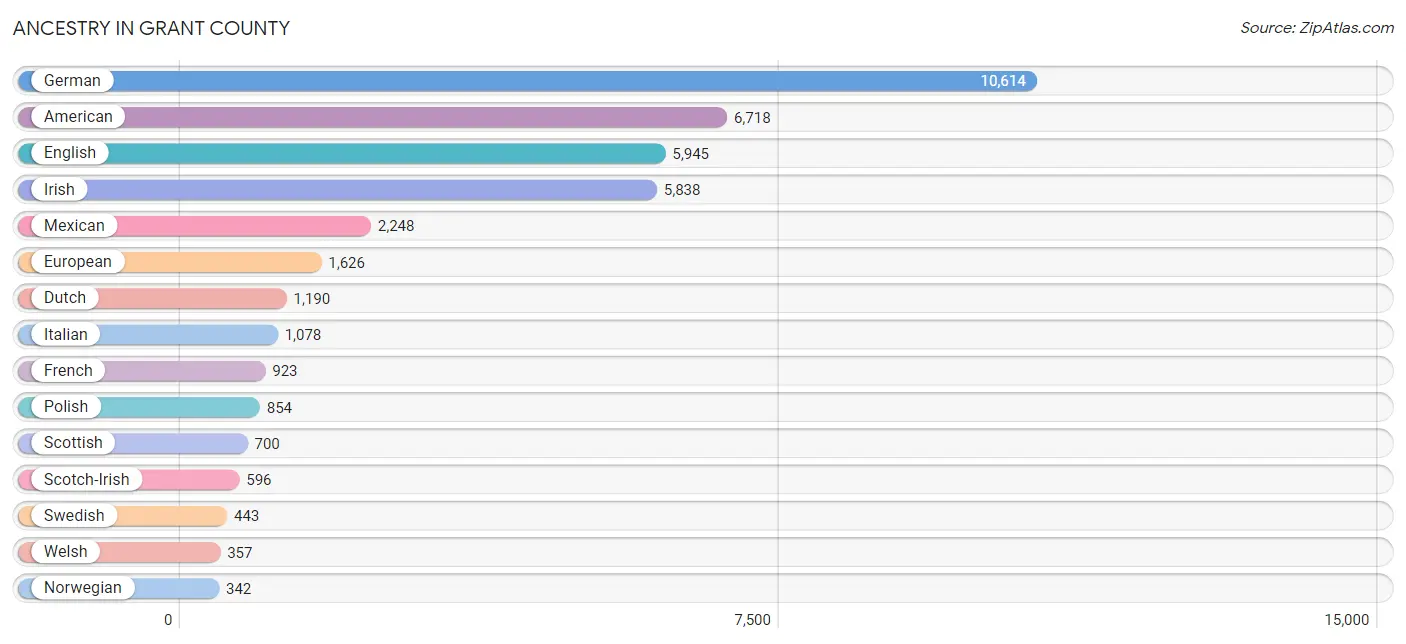
Ancestry in Grant County
The most populous ancestries reported in Grant County are German (10,614 | 16.0%), American (6,718 | 10.1%), English (5,945 | 8.9%), Irish (5,838 | 8.8%), and Mexican (2,248 | 3.4%), together accounting for 47.1% of all Grant County residents.
| Ancestry | # Population | % Population |
| African | 188 | 0.3% |
| American | 6,718 | 10.1% |
| Apache | 185 | 0.3% |
| Arab | 48 | 0.1% |
| Argentinean | 15 | 0.0% |
| Australian | 2 | 0.0% |
| Austrian | 34 | 0.1% |
| Bahamian | 16 | 0.0% |
| Barbadian | 7 | 0.0% |
| Belgian | 7 | 0.0% |
| Bhutanese | 30 | 0.1% |
| Blackfeet | 146 | 0.2% |
| Brazilian | 20 | 0.0% |
| British | 295 | 0.4% |
| Bulgarian | 4 | 0.0% |
| Burmese | 76 | 0.1% |
| Canadian | 42 | 0.1% |
| Cape Verdean | 16 | 0.0% |
| Celtic | 15 | 0.0% |
| Central American | 206 | 0.3% |
| Cherokee | 150 | 0.2% |
| Cheyenne | 23 | 0.0% |
| Chilean | 23 | 0.0% |
| Chippewa | 10 | 0.0% |
| Choctaw | 4 | 0.0% |
| Croatian | 31 | 0.1% |
| Crow | 2 | 0.0% |
| Cuban | 9 | 0.0% |
| Czech | 29 | 0.0% |
| Czechoslovakian | 10 | 0.0% |
| Danish | 5 | 0.0% |
| Dutch | 1,190 | 1.8% |
| Eastern European | 52 | 0.1% |
| Ecuadorian | 130 | 0.2% |
| English | 5,945 | 8.9% |
| Ethiopian | 79 | 0.1% |
| European | 1,626 | 2.4% |
| Finnish | 71 | 0.1% |
| French | 923 | 1.4% |
| French American Indian | 1 | 0.0% |
| French Canadian | 95 | 0.1% |
| German | 10,614 | 16.0% |
| German Russian | 20 | 0.0% |
| Greek | 152 | 0.2% |
| Guatemalan | 201 | 0.3% |
| Haitian | 3 | 0.0% |
| Hungarian | 33 | 0.1% |
| Indian (Asian) | 340 | 0.5% |
| Indonesian | 44 | 0.1% |
| Iranian | 26 | 0.0% |
| Irish | 5,838 | 8.8% |
| Italian | 1,078 | 1.6% |
| Jamaican | 18 | 0.0% |
| Japanese | 2 | 0.0% |
| Korean | 11 | 0.0% |
| Lithuanian | 17 | 0.0% |
| Macedonian | 3 | 0.0% |
| Mexican | 2,248 | 3.4% |
| Mexican American Indian | 92 | 0.1% |
| Native Hawaiian | 59 | 0.1% |
| Navajo | 5 | 0.0% |
| Northern European | 41 | 0.1% |
| Norwegian | 342 | 0.5% |
| Ottawa | 3 | 0.0% |
| Pakistani | 4 | 0.0% |
| Panamanian | 5 | 0.0% |
| Pennsylvania German | 135 | 0.2% |
| Polish | 854 | 1.3% |
| Portuguese | 122 | 0.2% |
| Potawatomi | 52 | 0.1% |
| Puerto Rican | 181 | 0.3% |
| Romanian | 11 | 0.0% |
| Russian | 109 | 0.2% |
| Scandinavian | 163 | 0.2% |
| Scotch-Irish | 596 | 0.9% |
| Scottish | 700 | 1.1% |
| Seminole | 3 | 0.0% |
| Sioux | 13 | 0.0% |
| Slovak | 54 | 0.1% |
| Slovene | 5 | 0.0% |
| South American | 243 | 0.4% |
| Spaniard | 40 | 0.1% |
| Spanish | 52 | 0.1% |
| Sri Lankan | 76 | 0.1% |
| Subsaharan African | 267 | 0.4% |
| Swedish | 443 | 0.7% |
| Swiss | 239 | 0.4% |
| Syrian | 18 | 0.0% |
| Thai | 158 | 0.2% |
| Trinidadian and Tobagonian | 10 | 0.0% |
| Turkish | 14 | 0.0% |
| Ukrainian | 50 | 0.1% |
| Venezuelan | 75 | 0.1% |
| Vietnamese | 28 | 0.0% |
| Welsh | 357 | 0.5% |
| Yugoslavian | 18 | 0.0% | View All 96 Rows |
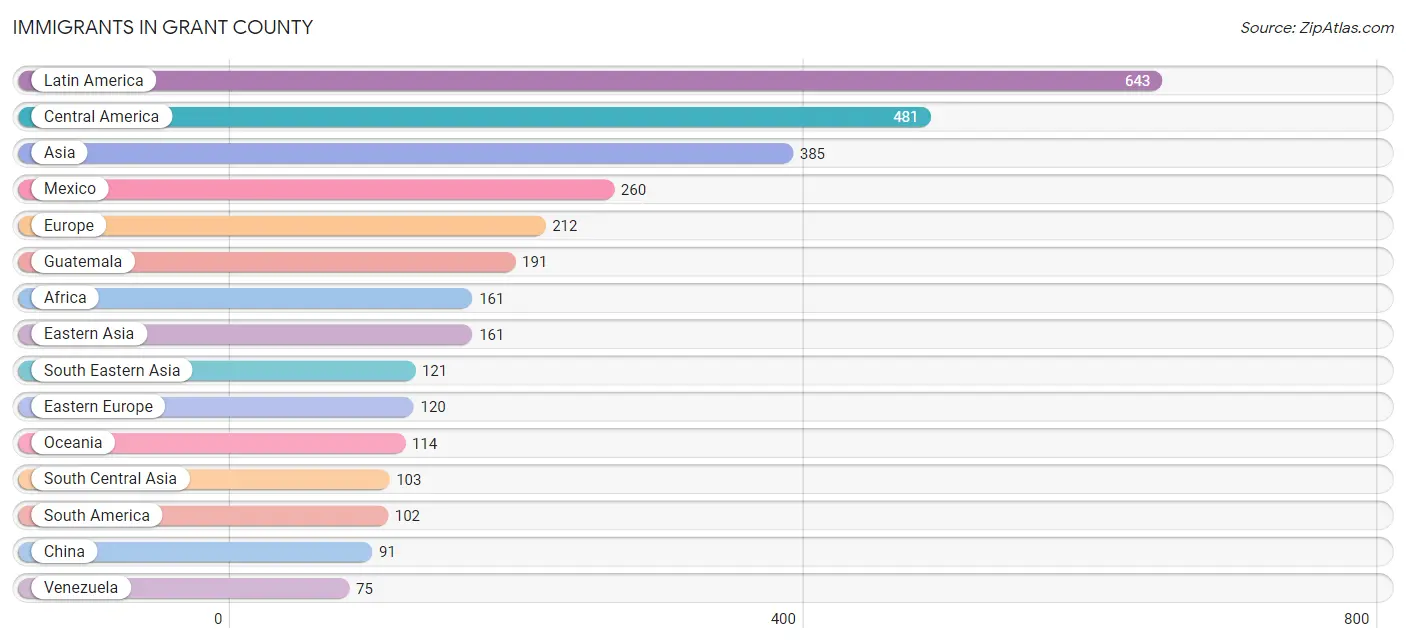
Immigrants in Grant County
The most numerous immigrant groups reported in Grant County came from Latin America (643 | 1.0%), Central America (481 | 0.7%), Asia (385 | 0.6%), Mexico (260 | 0.4%), and Europe (212 | 0.3%), together accounting for 3.0% of all Grant County residents.
| Immigration Origin | # Population | % Population |
| Africa | 161 | 0.2% |
| Argentina | 6 | 0.0% |
| Asia | 385 | 0.6% |
| Australia | 20 | 0.0% |
| Bahamas | 7 | 0.0% |
| Bangladesh | 28 | 0.0% |
| Barbados | 7 | 0.0% |
| Belize | 25 | 0.0% |
| Bulgaria | 4 | 0.0% |
| Cambodia | 2 | 0.0% |
| Canada | 38 | 0.1% |
| Caribbean | 60 | 0.1% |
| Central America | 481 | 0.7% |
| China | 91 | 0.1% |
| Congo | 45 | 0.1% |
| Eastern Africa | 37 | 0.1% |
| Eastern Asia | 161 | 0.2% |
| Eastern Europe | 120 | 0.2% |
| Ecuador | 21 | 0.0% |
| England | 20 | 0.0% |
| Eritrea | 19 | 0.0% |
| Ethiopia | 18 | 0.0% |
| Europe | 212 | 0.3% |
| Fiji | 70 | 0.1% |
| Germany | 37 | 0.1% |
| Guatemala | 191 | 0.3% |
| Haiti | 3 | 0.0% |
| India | 32 | 0.1% |
| Indonesia | 6 | 0.0% |
| Jamaica | 39 | 0.1% |
| Korea | 70 | 0.1% |
| Latin America | 643 | 1.0% |
| Malaysia | 37 | 0.1% |
| Mexico | 260 | 0.4% |
| Middle Africa | 56 | 0.1% |
| Nigeria | 68 | 0.1% |
| Northern Europe | 20 | 0.0% |
| Oceania | 114 | 0.2% |
| Panama | 5 | 0.0% |
| Poland | 44 | 0.1% |
| Russia | 42 | 0.1% |
| South America | 102 | 0.2% |
| South Central Asia | 103 | 0.2% |
| South Eastern Asia | 121 | 0.2% |
| Southern Europe | 35 | 0.1% |
| Spain | 35 | 0.1% |
| Sri Lanka | 43 | 0.1% |
| Ukraine | 30 | 0.1% |
| Venezuela | 75 | 0.1% |
| Vietnam | 32 | 0.1% |
| Western Africa | 68 | 0.1% |
| Western Europe | 37 | 0.1% |
| Zaire | 11 | 0.0% | View All 53 Rows |
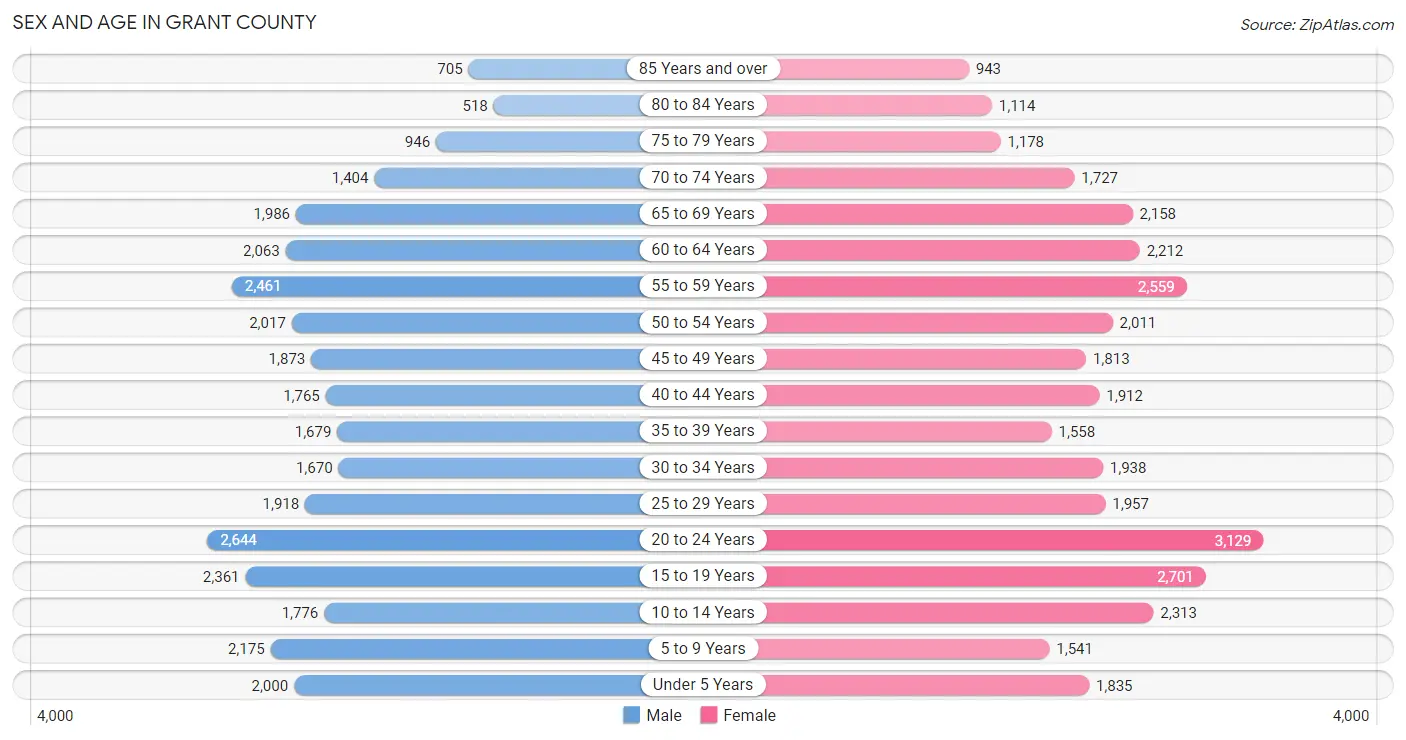
Sex and Age in Grant County
Sex and Age in Grant County
The most populous age groups in Grant County are 20 to 24 Years (2,644 | 8.3%) for men and 20 to 24 Years (3,129 | 9.0%) for women.
| Age Bracket | Male | Female |
| Under 5 Years | 2,000 (6.3%) | 1,835 (5.3%) |
| 5 to 9 Years | 2,175 (6.8%) | 1,541 (4.4%) |
| 10 to 14 Years | 1,776 (5.6%) | 2,313 (6.7%) |
| 15 to 19 Years | 2,361 (7.4%) | 2,701 (7.8%) |
| 20 to 24 Years | 2,644 (8.3%) | 3,129 (9.0%) |
| 25 to 29 Years | 1,918 (6.0%) | 1,957 (5.7%) |
| 30 to 34 Years | 1,670 (5.2%) | 1,938 (5.6%) |
| 35 to 39 Years | 1,679 (5.2%) | 1,558 (4.5%) |
| 40 to 44 Years | 1,765 (5.5%) | 1,912 (5.5%) |
| 45 to 49 Years | 1,873 (5.9%) | 1,813 (5.2%) |
| 50 to 54 Years | 2,017 (6.3%) | 2,011 (5.8%) |
| 55 to 59 Years | 2,461 (7.7%) | 2,559 (7.4%) |
| 60 to 64 Years | 2,063 (6.5%) | 2,212 (6.4%) |
| 65 to 69 Years | 1,986 (6.2%) | 2,158 (6.2%) |
| 70 to 74 Years | 1,404 (4.4%) | 1,727 (5.0%) |
| 75 to 79 Years | 946 (3.0%) | 1,178 (3.4%) |
| 80 to 84 Years | 518 (1.6%) | 1,114 (3.2%) |
| 85 Years and over | 705 (2.2%) | 943 (2.7%) |
| Total | 31,961 (100.0%) | 34,599 (100.0%) |
Families and Households in Grant County
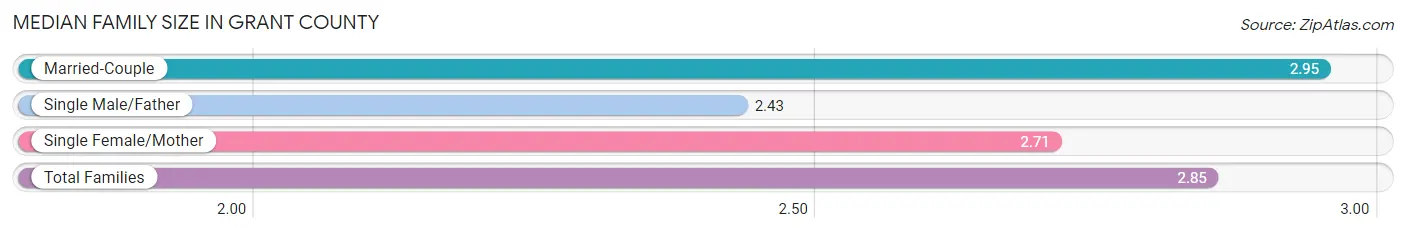
Median Family Size in Grant County
The median family size in Grant County is 2.85 persons per family, with married-couple families (11,605 | 70.1%) accounting for the largest median family size of 2.95 persons per family. On the other hand, single male/father families (1,723 | 10.4%) represent the smallest median family size with 2.43 persons per family.
| Family Type | # Families | Family Size |
| Married-Couple | 11,605 (70.1%) | 2.95 |
| Single Male/Father | 1,723 (10.4%) | 2.43 |
| Single Female/Mother | 3,220 (19.5%) | 2.71 |
| Total Families | 16,548 (100.0%) | 2.85 |
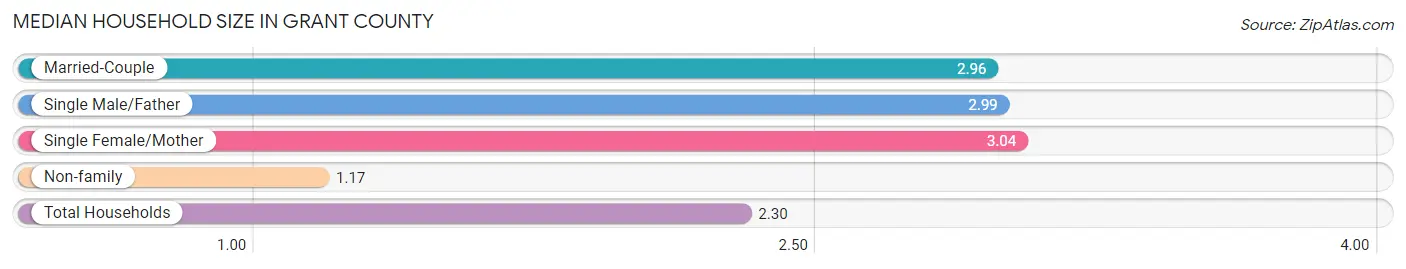
Median Household Size in Grant County
The median household size in Grant County is 2.30 persons per household, with single female/mother households (3,220 | 12.1%) accounting for the largest median household size of 3.04 persons per household. non-family households (10,002 | 37.7%) represent the smallest median household size with 1.17 persons per household.
| Household Type | # Households | Household Size |
| Married-Couple | 11,605 (43.7%) | 2.96 |
| Single Male/Father | 1,723 (6.5%) | 2.99 |
| Single Female/Mother | 3,220 (12.1%) | 3.04 |
| Non-family | 10,002 (37.7%) | 1.17 |
| Total Households | 26,550 (100.0%) | 2.30 |
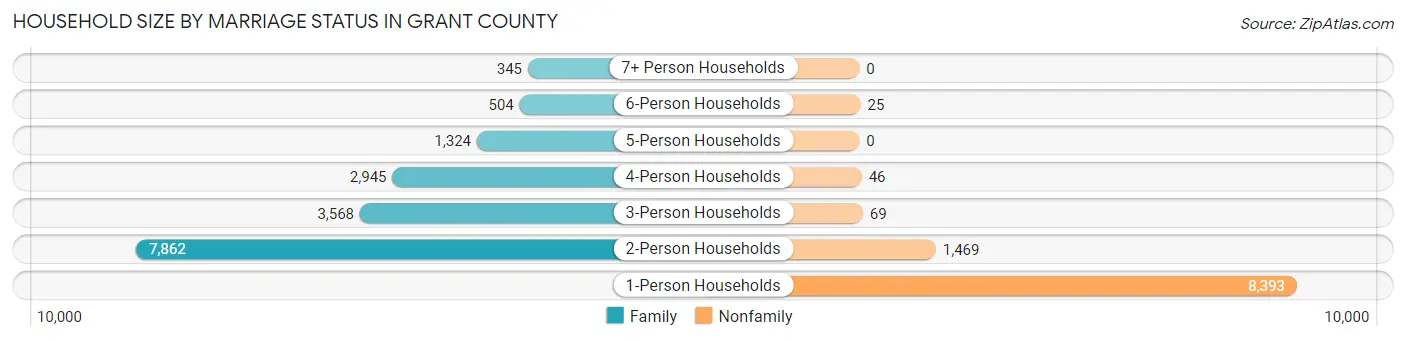
Household Size by Marriage Status in Grant County
Out of a total of 26,550 households in Grant County, 16,548 (62.3%) are family households, while 10,002 (37.7%) are nonfamily households. The most numerous type of family households are 2-person households, comprising 7,862, and the most common type of nonfamily households are 1-person households, comprising 8,393.
| Household Size | Family Households | Nonfamily Households |
| 1-Person Households | - | 8,393 (31.6%) |
| 2-Person Households | 7,862 (29.6%) | 1,469 (5.5%) |
| 3-Person Households | 3,568 (13.4%) | 69 (0.3%) |
| 4-Person Households | 2,945 (11.1%) | 46 (0.2%) |
| 5-Person Households | 1,324 (5.0%) | 0 (0.0%) |
| 6-Person Households | 504 (1.9%) | 25 (0.1%) |
| 7+ Person Households | 345 (1.3%) | 0 (0.0%) |
| Total | 16,548 (62.3%) | 10,002 (37.7%) |
Female Fertility in Grant County
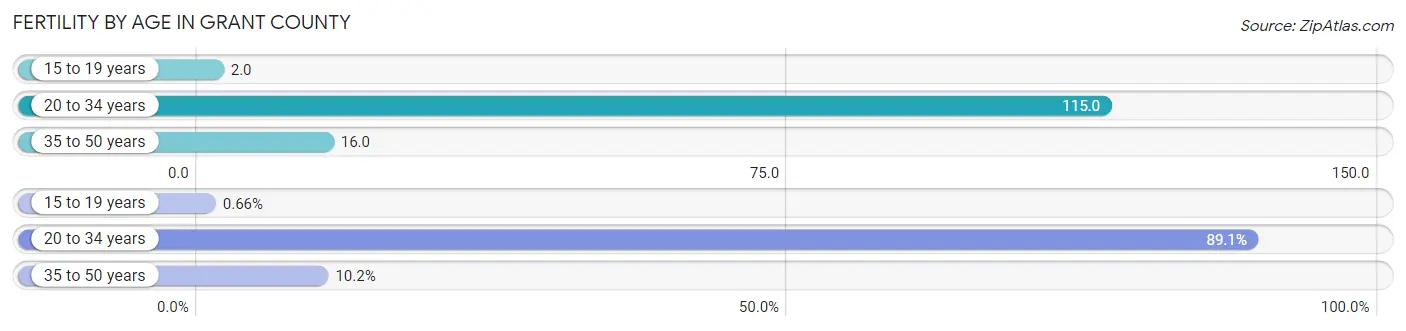
Fertility by Age in Grant County
Average fertility rate in Grant County is 59.0 births per 1,000 women. Women in the age bracket of 20 to 34 years have the highest fertility rate with 115.0 births per 1,000 women. Women in the age bracket of 20 to 34 years acount for 89.1% of all women with births.
| Age Bracket | Women with Births | Births / 1,000 Women |
| 15 to 19 years | 6 (0.7%) | 2.0 |
| 20 to 34 years | 811 (89.1%) | 115.0 |
| 35 to 50 years | 93 (10.2%) | 16.0 |
| Total | 910 (100.0%) | 59.0 |
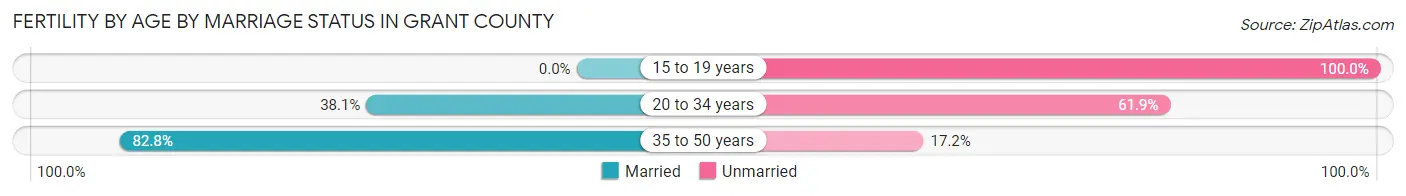
Fertility by Age by Marriage Status in Grant County
42.4% of women with births (910) in Grant County are married. The highest percentage of unmarried women with births falls into 15 to 19 years age bracket with 100.0% of them unmarried at the time of birth, while the lowest percentage of unmarried women with births belong to 35 to 50 years age bracket with 17.2% of them unmarried.
| Age Bracket | Married | Unmarried |
| 15 to 19 years | 0 (0.0%) | 6 (100.0%) |
| 20 to 34 years | 309 (38.1%) | 502 (61.9%) |
| 35 to 50 years | 77 (82.8%) | 16 (17.2%) |
| Total | 386 (42.4%) | 524 (57.6%) |
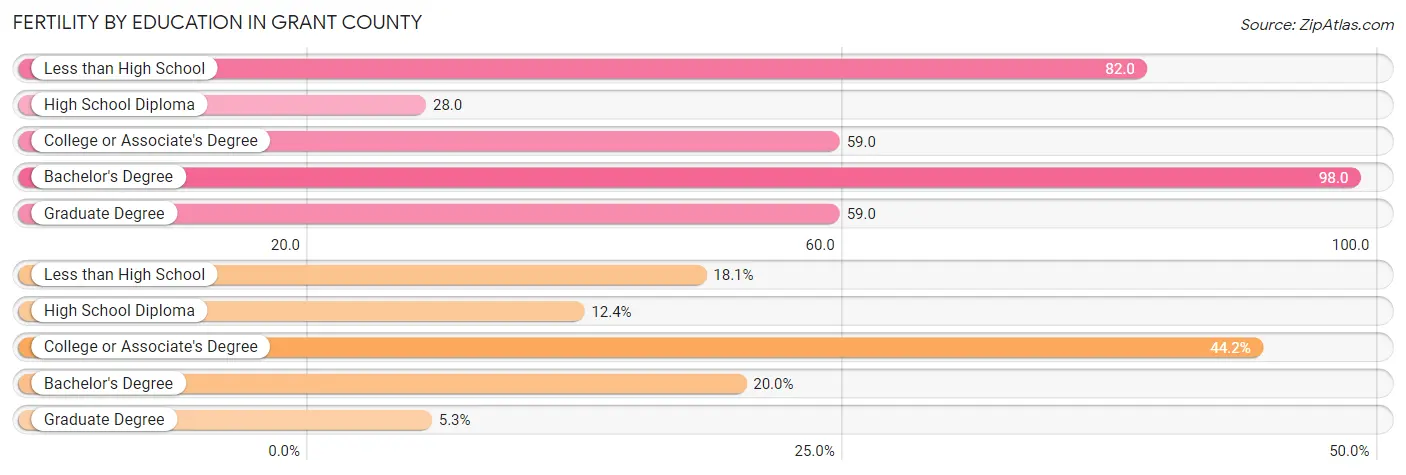
Fertility by Education in Grant County
Average fertility rate in Grant County is 59.0 births per 1,000 women. Women with the education attainment of bachelor's degree have the highest fertility rate of 98.0 births per 1,000 women, while women with the education attainment of high school diploma have the lowest fertility at 28.0 births per 1,000 women. Women with the education attainment of college or associate's degree represent 44.2% of all women with births.
| Educational Attainment | Women with Births | Births / 1,000 Women |
| Less than High School | 165 (18.1%) | 82.0 |
| High School Diploma | 113 (12.4%) | 28.0 |
| College or Associate's Degree | 402 (44.2%) | 59.0 |
| Bachelor's Degree | 182 (20.0%) | 98.0 |
| Graduate Degree | 48 (5.3%) | 59.0 |
| Total | 910 (100.0%) | 59.0 |
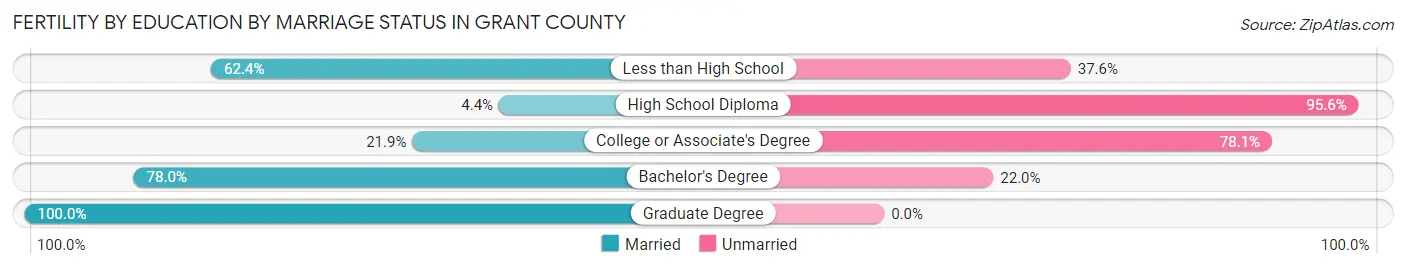
Fertility by Education by Marriage Status in Grant County
57.6% of women with births in Grant County are unmarried. Women with the educational attainment of graduate degree are most likely to be married with 100.0% of them married at childbirth, while women with the educational attainment of high school diploma are least likely to be married with 95.6% of them unmarried at childbirth.
| Educational Attainment | Married | Unmarried |
| Less than High School | 103 (62.4%) | 62 (37.6%) |
| High School Diploma | 5 (4.4%) | 108 (95.6%) |
| College or Associate's Degree | 88 (21.9%) | 314 (78.1%) |
| Bachelor's Degree | 142 (78.0%) | 40 (22.0%) |
| Graduate Degree | 48 (100.0%) | 0 (0.0%) |
| Total | 386 (42.4%) | 524 (57.6%) |
Income in Grant County
Income Overview in Grant County
Per Capita Income in Grant County is $27,725, while median incomes of families and households are $68,385 and $53,033 respectively.
| Characteristic | Number | Measure |
| Per Capita Income | 66,560 | $27,725 |
| Median Family Income | 16,548 | $68,385 |
| Mean Family Income | 16,548 | $80,928 |
| Median Household Income | 26,550 | $53,033 |
| Mean Household Income | 26,550 | $68,397 |
| Income Deficit | 16,548 | $12,803 |
| Wage / Income Gap (%) | 66,560 | 38.30% |
| Wage / Income Gap ($) | 66,560 | 61.70¢ per $1 |
| Gini / Inequality Index | 66,560 | 0.43 |
Earnings by Sex in Grant County
Average Earnings in Grant County are $31,660, $38,946 for men and $24,031 for women, a difference of 38.3%.
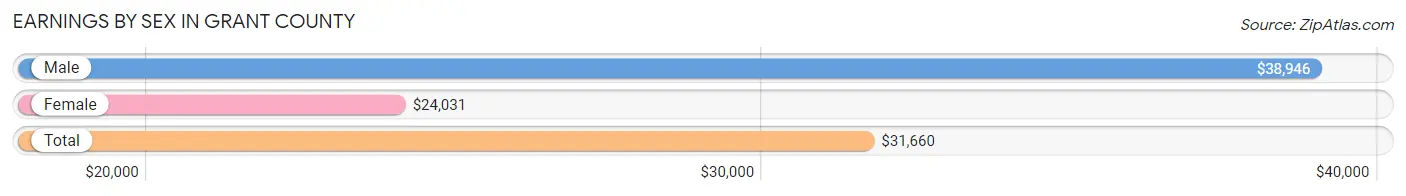
| Sex | Number | Average Earnings |
| Male | 17,248 (49.9%) | $38,946 |
| Female | 17,319 (50.1%) | $24,031 |
| Total | 34,567 (100.0%) | $31,660 |
Earnings by Sex by Income Bracket in Grant County
The most common earnings brackets in Grant County are $55,000 to $64,999 for men (1,607 | 9.3%) and $2,499 or less for women (1,530 | 8.8%).
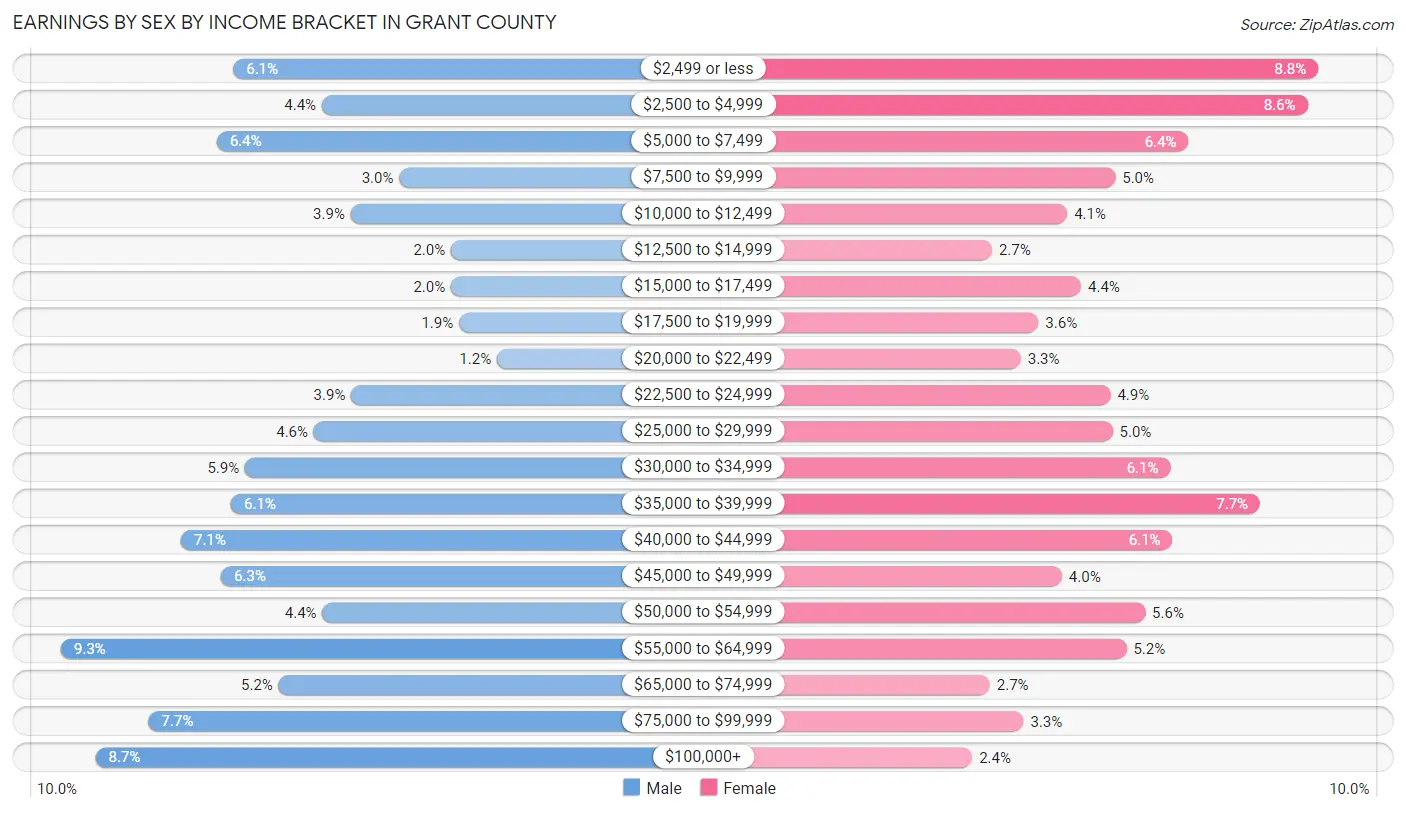
| Income | Male | Female |
| $2,499 or less | 1,051 (6.1%) | 1,530 (8.8%) |
| $2,500 to $4,999 | 764 (4.4%) | 1,494 (8.6%) |
| $5,000 to $7,499 | 1,104 (6.4%) | 1,109 (6.4%) |
| $7,500 to $9,999 | 514 (3.0%) | 871 (5.0%) |
| $10,000 to $12,499 | 671 (3.9%) | 716 (4.1%) |
| $12,500 to $14,999 | 346 (2.0%) | 471 (2.7%) |
| $15,000 to $17,499 | 347 (2.0%) | 760 (4.4%) |
| $17,500 to $19,999 | 320 (1.9%) | 621 (3.6%) |
| $20,000 to $22,499 | 198 (1.1%) | 564 (3.3%) |
| $22,500 to $24,999 | 670 (3.9%) | 855 (4.9%) |
| $25,000 to $29,999 | 790 (4.6%) | 862 (5.0%) |
| $30,000 to $34,999 | 1,013 (5.9%) | 1,050 (6.1%) |
| $35,000 to $39,999 | 1,057 (6.1%) | 1,341 (7.7%) |
| $40,000 to $44,999 | 1,220 (7.1%) | 1,056 (6.1%) |
| $45,000 to $49,999 | 1,090 (6.3%) | 698 (4.0%) |
| $50,000 to $54,999 | 763 (4.4%) | 968 (5.6%) |
| $55,000 to $64,999 | 1,607 (9.3%) | 907 (5.2%) |
| $65,000 to $74,999 | 904 (5.2%) | 465 (2.7%) |
| $75,000 to $99,999 | 1,324 (7.7%) | 574 (3.3%) |
| $100,000+ | 1,495 (8.7%) | 407 (2.4%) |
| Total | 17,248 (100.0%) | 17,319 (100.0%) |
Earnings by Sex by Educational Attainment in Grant County
Average earnings in Grant County are $45,964 for men and $33,801 for women, a difference of 26.5%. Men with an educational attainment of graduate degree enjoy the highest average annual earnings of $71,392, while those with less than high school education earn the least with $33,800. Women with an educational attainment of graduate degree earn the most with the average annual earnings of $54,171, while those with less than high school education have the smallest earnings of $18,125.
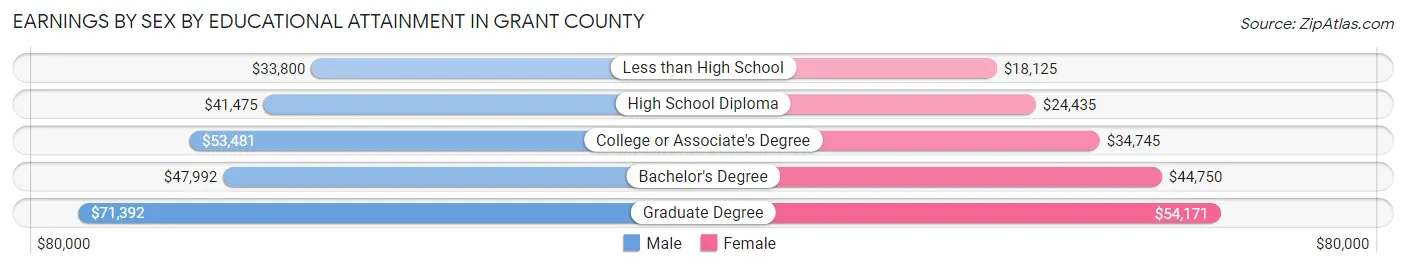
| Educational Attainment | Male Income | Female Income |
| Less than High School | $33,800 | $18,125 |
| High School Diploma | $41,475 | $24,435 |
| College or Associate's Degree | $53,481 | $34,745 |
| Bachelor's Degree | $47,992 | $44,750 |
| Graduate Degree | $71,392 | $54,171 |
| Total | $45,964 | $33,801 |
Family Income in Grant County
Family Income Brackets in Grant County
According to the Grant County family income data, there are 3,558 families falling into the $100,000 to $149,999 income range, which is the most common income bracket and makes up 21.5% of all families. Conversely, the $200,000+ income bracket is the least frequent group with only 463 families (2.8%) belonging to this category.
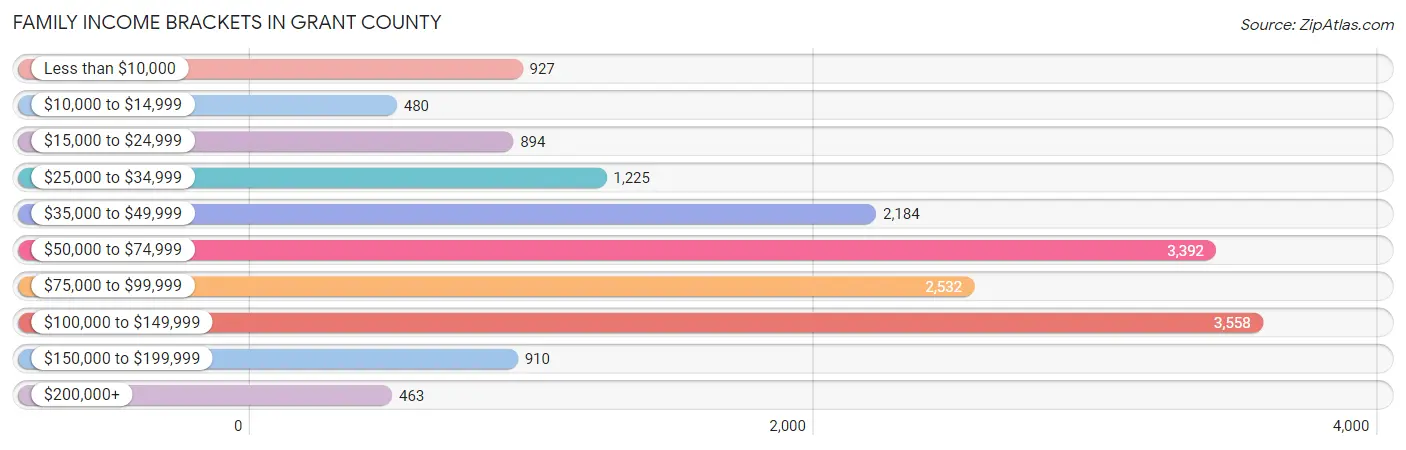
| Income Bracket | # Families | % Families |
| Less than $10,000 | 927 | 5.6% |
| $10,000 to $14,999 | 480 | 2.9% |
| $15,000 to $24,999 | 894 | 5.4% |
| $25,000 to $34,999 | 1,225 | 7.4% |
| $35,000 to $49,999 | 2,184 | 13.2% |
| $50,000 to $74,999 | 3,392 | 20.5% |
| $75,000 to $99,999 | 2,532 | 15.3% |
| $100,000 to $149,999 | 3,558 | 21.5% |
| $150,000 to $199,999 | 910 | 5.5% |
| $200,000+ | 463 | 2.8% |
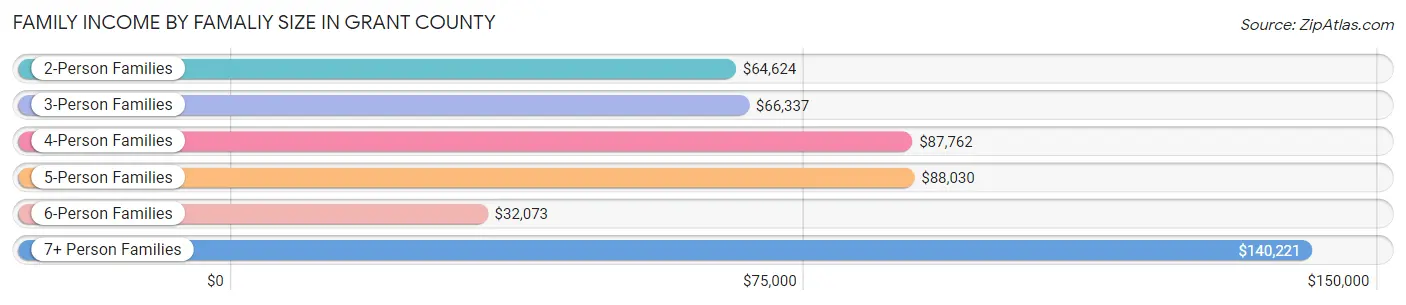
Family Income by Famaliy Size in Grant County
7+ person families (204 | 1.2%) account for the highest median family income in Grant County with $140,221 per family, while 2-person families (8,577 | 51.8%) have the highest median income of $32,312 per family member.
| Income Bracket | # Families | Median Income |
| 2-Person Families | 8,577 (51.8%) | $64,624 |
| 3-Person Families | 3,514 (21.2%) | $66,337 |
| 4-Person Families | 2,687 (16.2%) | $87,762 |
| 5-Person Families | 998 (6.0%) | $88,030 |
| 6-Person Families | 568 (3.4%) | $32,073 |
| 7+ Person Families | 204 (1.2%) | $140,221 |
| Total | 16,548 (100.0%) | $68,385 |
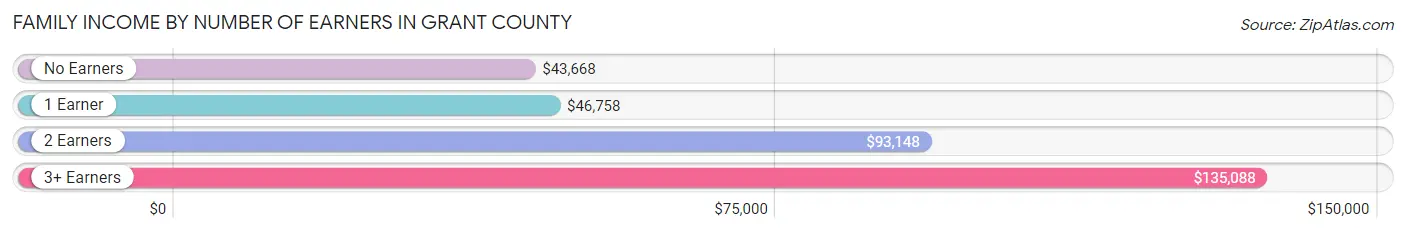
Family Income by Number of Earners in Grant County
The median family income in Grant County is $68,385, with families comprising 3+ earners (1,412) having the highest median family income of $135,088, while families with no earners (3,416) have the lowest median family income of $43,668, accounting for 8.5% and 20.6% of families, respectively.
| Number of Earners | # Families | Median Income |
| No Earners | 3,416 (20.6%) | $43,668 |
| 1 Earner | 5,391 (32.6%) | $46,758 |
| 2 Earners | 6,329 (38.3%) | $93,148 |
| 3+ Earners | 1,412 (8.5%) | $135,088 |
| Total | 16,548 (100.0%) | $68,385 |
Household Income in Grant County
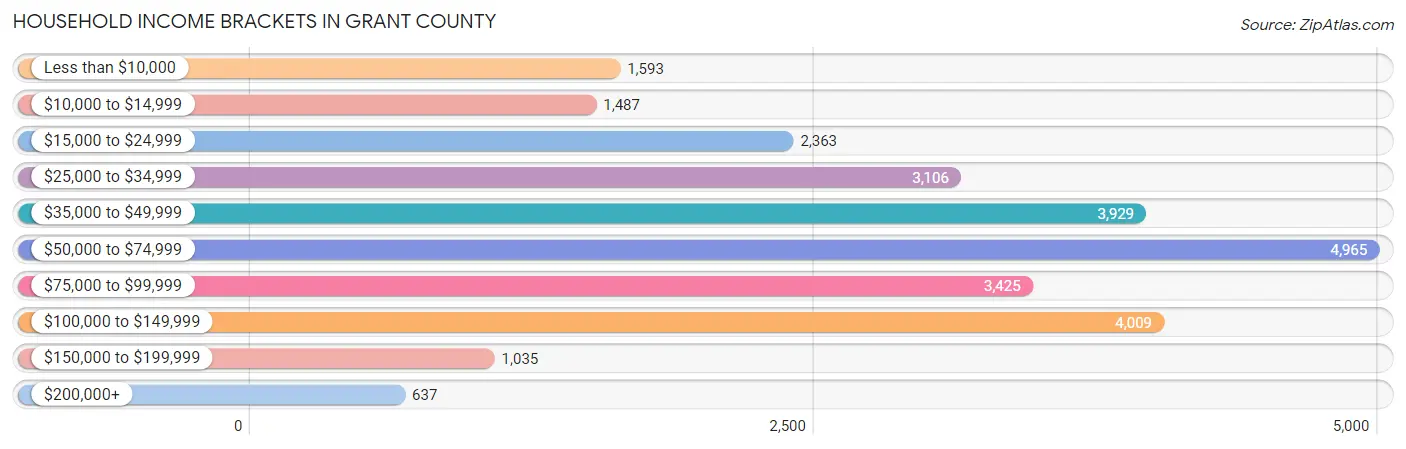
Household Income Brackets in Grant County
With 4,965 households falling in the category, the $50,000 to $74,999 income range is the most frequent in Grant County, accounting for 18.7% of all households. In contrast, only 637 households (2.4%) fall into the $200,000+ income bracket, making it the least populous group.
| Income Bracket | # Households | % Households |
| Less than $10,000 | 1,593 | 6.0% |
| $10,000 to $14,999 | 1,487 | 5.6% |
| $15,000 to $24,999 | 2,363 | 8.9% |
| $25,000 to $34,999 | 3,106 | 11.7% |
| $35,000 to $49,999 | 3,929 | 14.8% |
| $50,000 to $74,999 | 4,965 | 18.7% |
| $75,000 to $99,999 | 3,425 | 12.9% |
| $100,000 to $149,999 | 4,009 | 15.1% |
| $150,000 to $199,999 | 1,035 | 3.9% |
| $200,000+ | 637 | 2.4% |
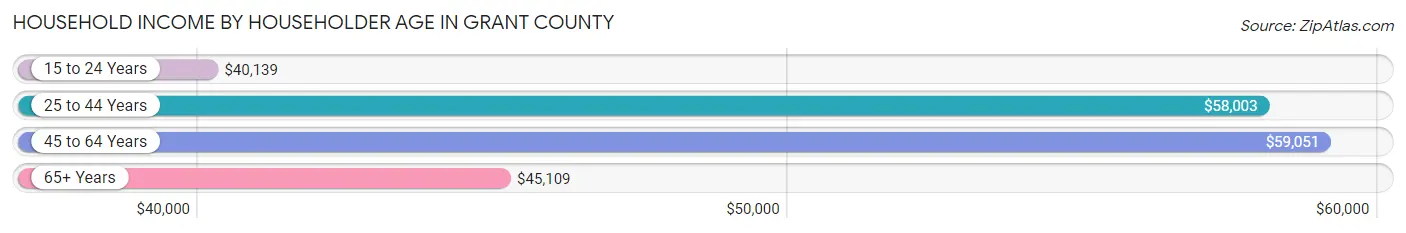
Household Income by Householder Age in Grant County
The median household income in Grant County is $53,033, with the highest median household income of $59,051 found in the 45 to 64 years age bracket for the primary householder. A total of 9,959 households (37.5%) fall into this category. Meanwhile, the 15 to 24 years age bracket for the primary householder has the lowest median household income of $40,139, with 790 households (3.0%) in this group.
| Income Bracket | # Households | Median Income |
| 15 to 24 Years | 790 (3.0%) | $40,139 |
| 25 to 44 Years | 7,683 (28.9%) | $58,003 |
| 45 to 64 Years | 9,959 (37.5%) | $59,051 |
| 65+ Years | 8,118 (30.6%) | $45,109 |
| Total | 26,550 (100.0%) | $53,033 |
Poverty in Grant County
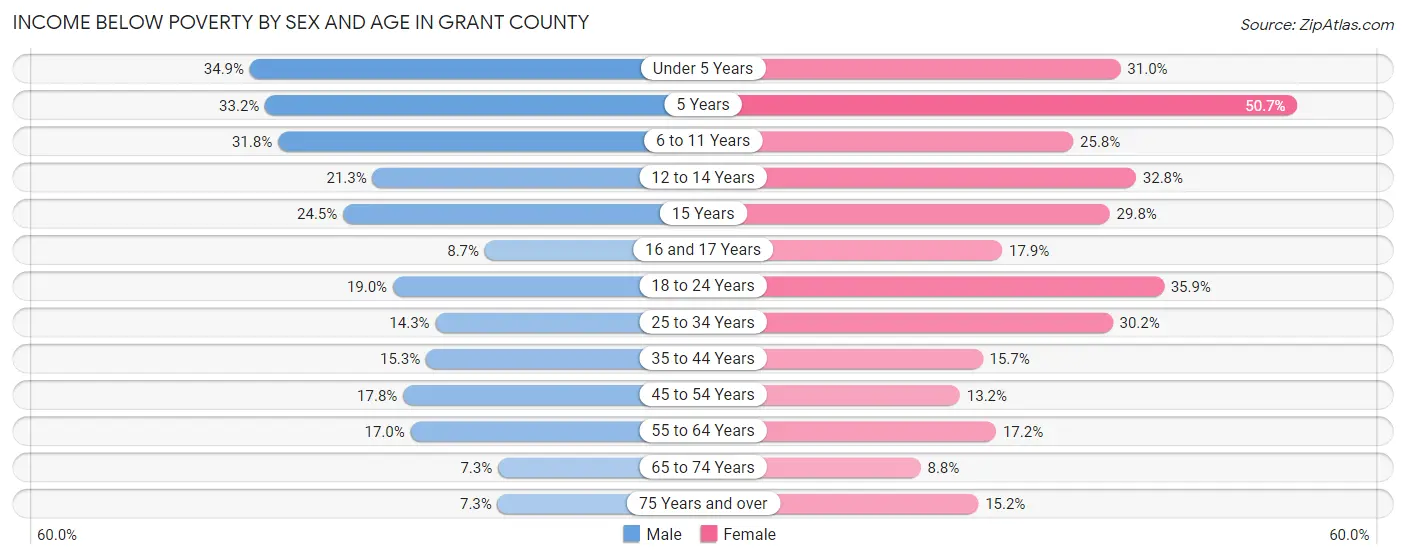
Income Below Poverty by Sex and Age in Grant County
With 17.6% poverty level for males and 20.4% for females among the residents of Grant County, under 5 year old males and 5 year old females are the most vulnerable to poverty, with 688 males (34.9%) and 172 females (50.7%) in their respective age groups living below the poverty level.
| Age Bracket | Male | Female |
| Under 5 Years | 688 (34.9%) | 562 (31.0%) |
| 5 Years | 91 (33.2%) | 172 (50.7%) |
| 6 to 11 Years | 817 (31.8%) | 541 (25.8%) |
| 12 to 14 Years | 227 (21.2%) | 430 (32.8%) |
| 15 Years | 79 (24.5%) | 88 (29.8%) |
| 16 and 17 Years | 65 (8.7%) | 174 (17.8%) |
| 18 to 24 Years | 469 (19.0%) | 598 (35.8%) |
| 25 to 34 Years | 493 (14.2%) | 1,162 (30.1%) |
| 35 to 44 Years | 512 (15.3%) | 541 (15.7%) |
| 45 to 54 Years | 689 (17.8%) | 503 (13.2%) |
| 55 to 64 Years | 763 (17.0%) | 817 (17.2%) |
| 65 to 74 Years | 238 (7.3%) | 339 (8.8%) |
| 75 Years and over | 153 (7.3%) | 459 (15.2%) |
| Total | 5,284 (17.6%) | 6,386 (20.4%) |
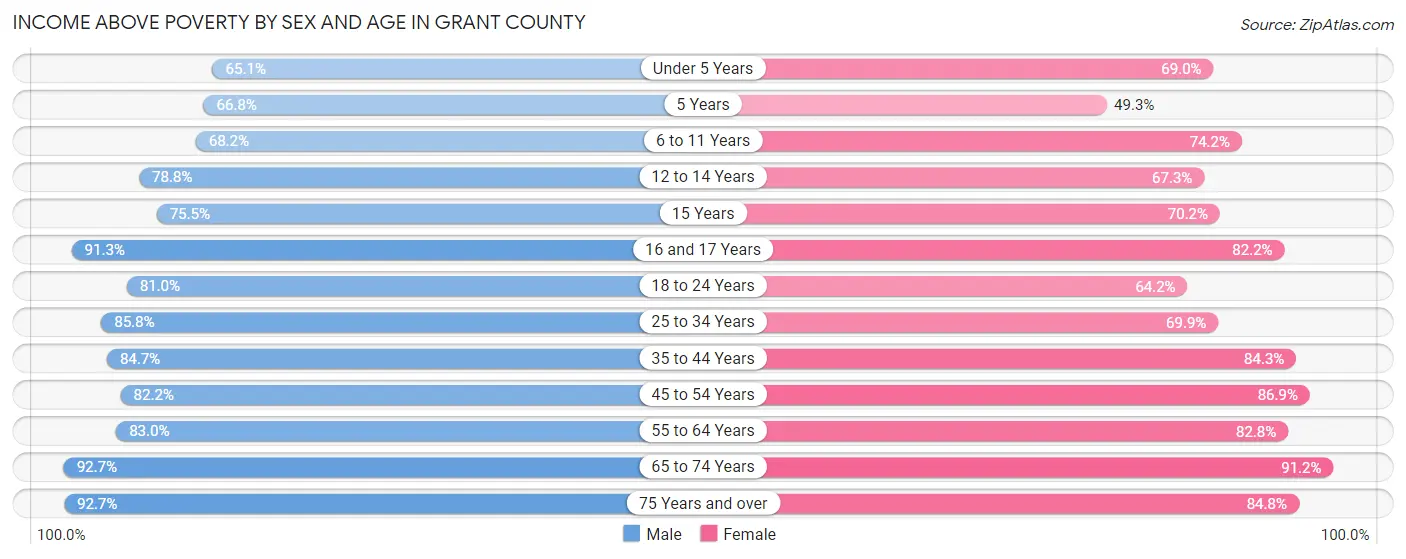
Income Above Poverty by Sex and Age in Grant County
According to the poverty statistics in Grant County, males aged 65 to 74 years and females aged 65 to 74 years are the age groups that are most secure financially, with 92.7% of males and 91.2% of females in these age groups living above the poverty line.
| Age Bracket | Male | Female |
| Under 5 Years | 1,283 (65.1%) | 1,249 (69.0%) |
| 5 Years | 183 (66.8%) | 167 (49.3%) |
| 6 to 11 Years | 1,754 (68.2%) | 1,559 (74.2%) |
| 12 to 14 Years | 841 (78.7%) | 883 (67.2%) |
| 15 Years | 243 (75.5%) | 207 (70.2%) |
| 16 and 17 Years | 679 (91.3%) | 801 (82.2%) |
| 18 to 24 Years | 2,002 (81.0%) | 1,070 (64.1%) |
| 25 to 34 Years | 2,967 (85.8%) | 2,692 (69.9%) |
| 35 to 44 Years | 2,837 (84.7%) | 2,912 (84.3%) |
| 45 to 54 Years | 3,174 (82.2%) | 3,321 (86.9%) |
| 55 to 64 Years | 3,719 (83.0%) | 3,942 (82.8%) |
| 65 to 74 Years | 3,037 (92.7%) | 3,526 (91.2%) |
| 75 Years and over | 1,937 (92.7%) | 2,563 (84.8%) |
| Total | 24,656 (82.4%) | 24,892 (79.6%) |
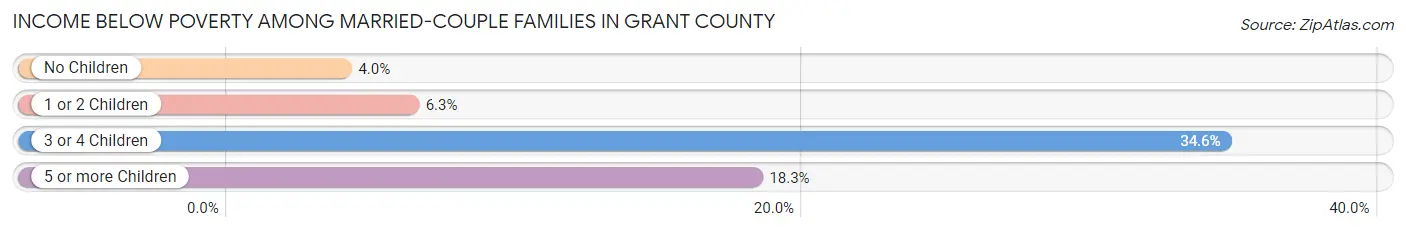
Income Below Poverty Among Married-Couple Families in Grant County
The poverty statistics for married-couple families in Grant County show that 7.2% or 840 of the total 11,605 families live below the poverty line. Families with 3 or 4 children have the highest poverty rate of 34.6%, comprising of 323 families. On the other hand, families with no children have the lowest poverty rate of 4.0%, which includes 284 families.
| Children | Above Poverty | Below Poverty |
| No Children | 6,905 (96.1%) | 284 (4.0%) |
| 1 or 2 Children | 3,156 (93.7%) | 212 (6.3%) |
| 3 or 4 Children | 610 (65.4%) | 323 (34.6%) |
| 5 or more Children | 94 (81.7%) | 21 (18.3%) |
| Total | 10,765 (92.8%) | 840 (7.2%) |
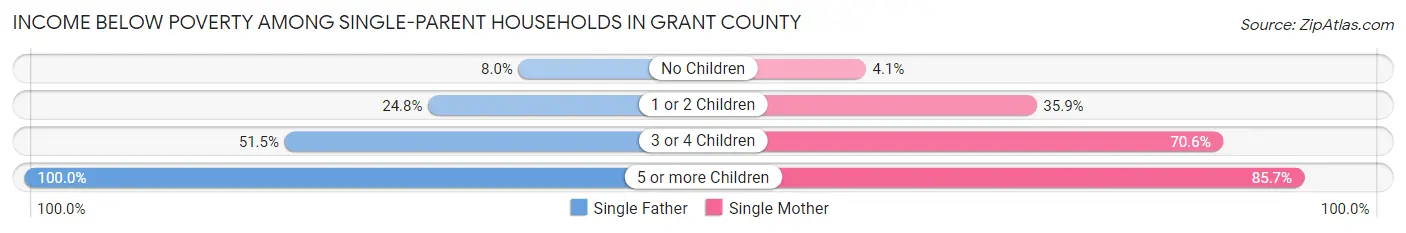
Income Below Poverty Among Single-Parent Households in Grant County
According to the poverty data in Grant County, 24.5% or 423 single-father households and 33.1% or 1,066 single-mother households are living below the poverty line. Among single-father households, those with 5 or more children have the highest poverty rate, with 74 households (100.0%) experiencing poverty. Likewise, among single-mother households, those with 5 or more children have the highest poverty rate, with 12 households (85.7%) falling below the poverty line.
| Children | Single Father | Single Mother |
| No Children | 49 (8.0%) | 37 (4.1%) |
| 1 or 2 Children | 216 (24.8%) | 629 (35.9%) |
| 3 or 4 Children | 84 (51.5%) | 388 (70.6%) |
| 5 or more Children | 74 (100.0%) | 12 (85.7%) |
| Total | 423 (24.5%) | 1,066 (33.1%) |
Income Below Poverty Among Married-Couple vs Single-Parent Households in Grant County
The poverty data for Grant County shows that 840 of the married-couple family households (7.2%) and 1,489 of the single-parent households (30.1%) are living below the poverty level. Within the married-couple family households, those with 3 or 4 children have the highest poverty rate, with 323 households (34.6%) falling below the poverty line. Among the single-parent households, those with 5 or more children have the highest poverty rate, with 86 household (97.7%) living below poverty.
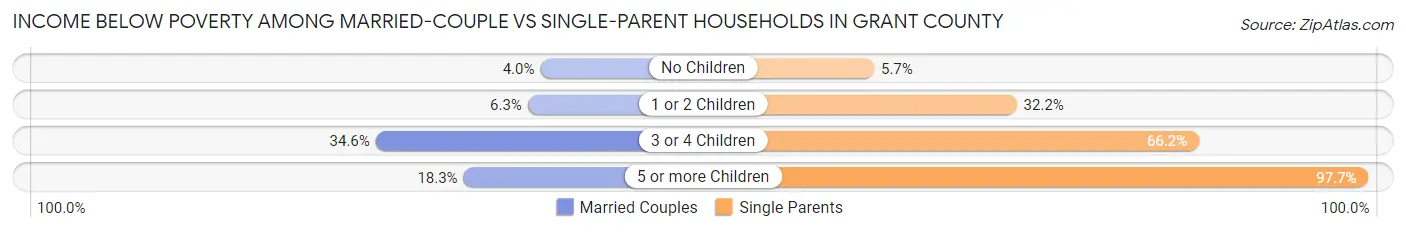
| Children | Married-Couple Families | Single-Parent Households |
| No Children | 284 (4.0%) | 86 (5.7%) |
| 1 or 2 Children | 212 (6.3%) | 845 (32.2%) |
| 3 or 4 Children | 323 (34.6%) | 472 (66.2%) |
| 5 or more Children | 21 (18.3%) | 86 (97.7%) |
| Total | 840 (7.2%) | 1,489 (30.1%) |
Employment Characteristics in Grant County
Employment by Class of Employer in Grant County
Among the 28,661 employed individuals in Grant County, private company employees (19,386 | 67.6%), not-for-profit organizations (3,764 | 13.1%), and local government employees (1,721 | 6.0%) make up the most common classes of employment.
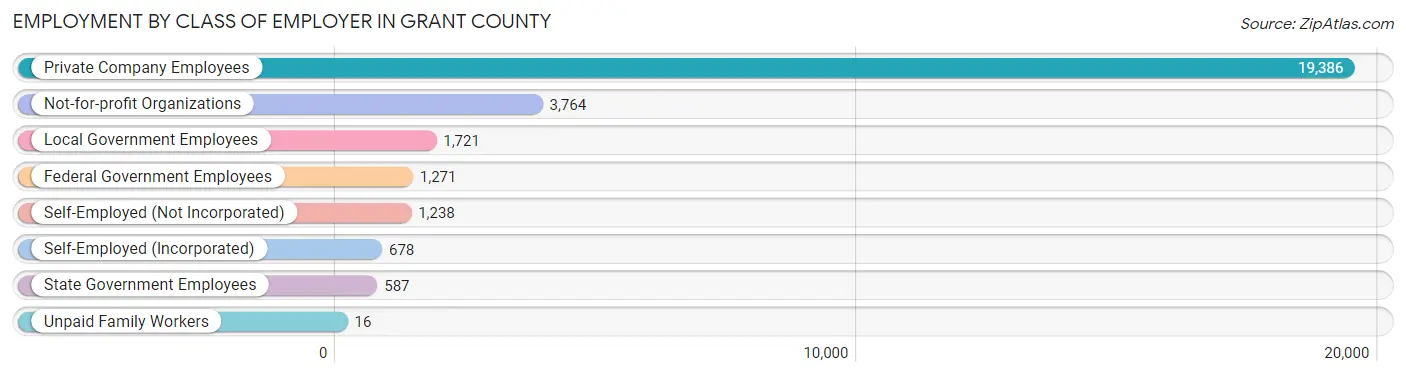
| Employer Class | # Employees | % Employees |
| Private Company Employees | 19,386 | 67.6% |
| Self-Employed (Incorporated) | 678 | 2.4% |
| Self-Employed (Not Incorporated) | 1,238 | 4.3% |
| Not-for-profit Organizations | 3,764 | 13.1% |
| Local Government Employees | 1,721 | 6.0% |
| State Government Employees | 587 | 2.1% |
| Federal Government Employees | 1,271 | 4.4% |
| Unpaid Family Workers | 16 | 0.1% |
| Total | 28,661 | 100.0% |
Employment Status by Age in Grant County
According to the labor force statistics for Grant County, out of the total population over 16 years of age (54,303), 58.8% or 31,930 individuals are in the labor force, with 7.3% or 2,331 of them unemployed. The age group with the highest labor force participation rate is 25 to 29 years, with 85.6% or 3,317 individuals in the labor force. Within the labor force, the 16 to 19 years age range has the highest percentage of unemployed individuals, with 19.9% or 402 of them being unemployed.
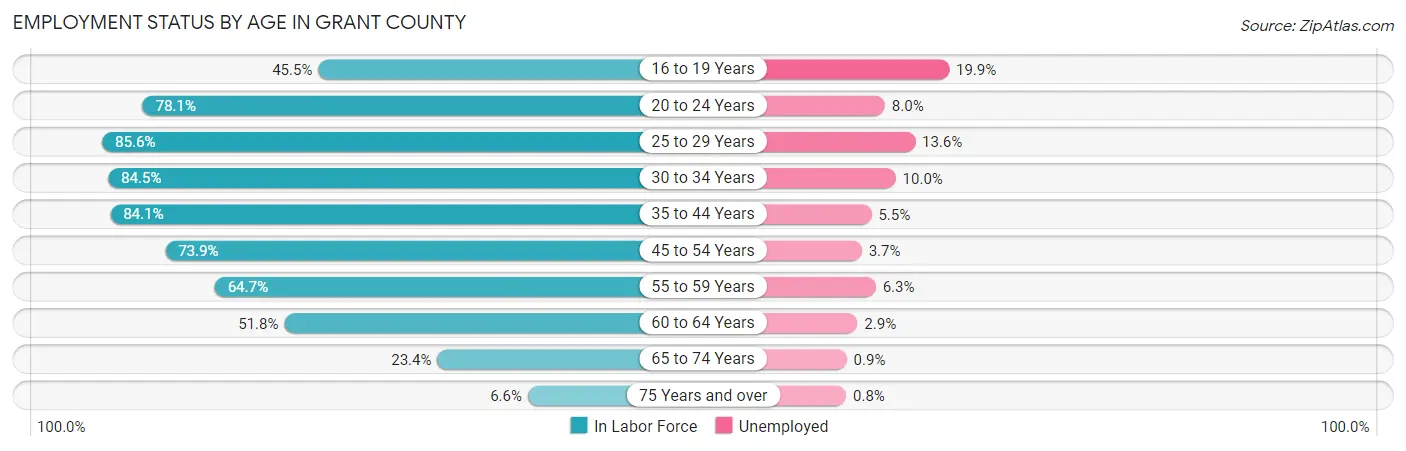
| Age Bracket | In Labor Force | Unemployed |
| 16 to 19 Years | 2,022 (45.5%) | 402 (19.9%) |
| 20 to 24 Years | 4,509 (78.1%) | 361 (8.0%) |
| 25 to 29 Years | 3,317 (85.6%) | 451 (13.6%) |
| 30 to 34 Years | 3,049 (84.5%) | 305 (10.0%) |
| 35 to 44 Years | 5,815 (84.1%) | 320 (5.5%) |
| 45 to 54 Years | 5,701 (73.9%) | 211 (3.7%) |
| 55 to 59 Years | 3,248 (64.7%) | 205 (6.3%) |
| 60 to 64 Years | 2,214 (51.8%) | 64 (2.9%) |
| 65 to 74 Years | 1,702 (23.4%) | 15 (0.9%) |
| 75 Years and over | 357 (6.6%) | 3 (0.8%) |
| Total | 31,930 (58.8%) | 2,331 (7.3%) |
Employment Status by Educational Attainment in Grant County
According to labor force statistics for Grant County, 74.3% of individuals (23,335) out of the total population between 25 and 64 years of age (31,406) are in the labor force, with 6.7% or 1,563 of them being unemployed. The group with the highest labor force participation rate are those with the educational attainment of bachelor's degree or higher, with 87.2% or 5,526 individuals in the labor force. Within the labor force, individuals with less than high school education have the highest percentage of unemployment, with 13.6% or 213 of them being unemployed.
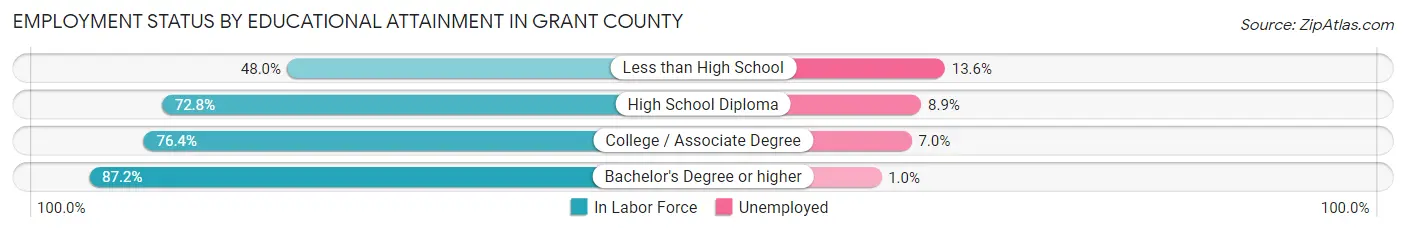
| Educational Attainment | In Labor Force | Unemployed |
| Less than High School | 1,565 (48.0%) | 443 (13.6%) |
| High School Diploma | 8,050 (72.8%) | 984 (8.9%) |
| College / Associate Degree | 8,214 (76.4%) | 753 (7.0%) |
| Bachelor's Degree or higher | 5,526 (87.2%) | 63 (1.0%) |
| Total | 23,335 (74.3%) | 2,104 (6.7%) |
Employment Occupations by Sex in Grant County
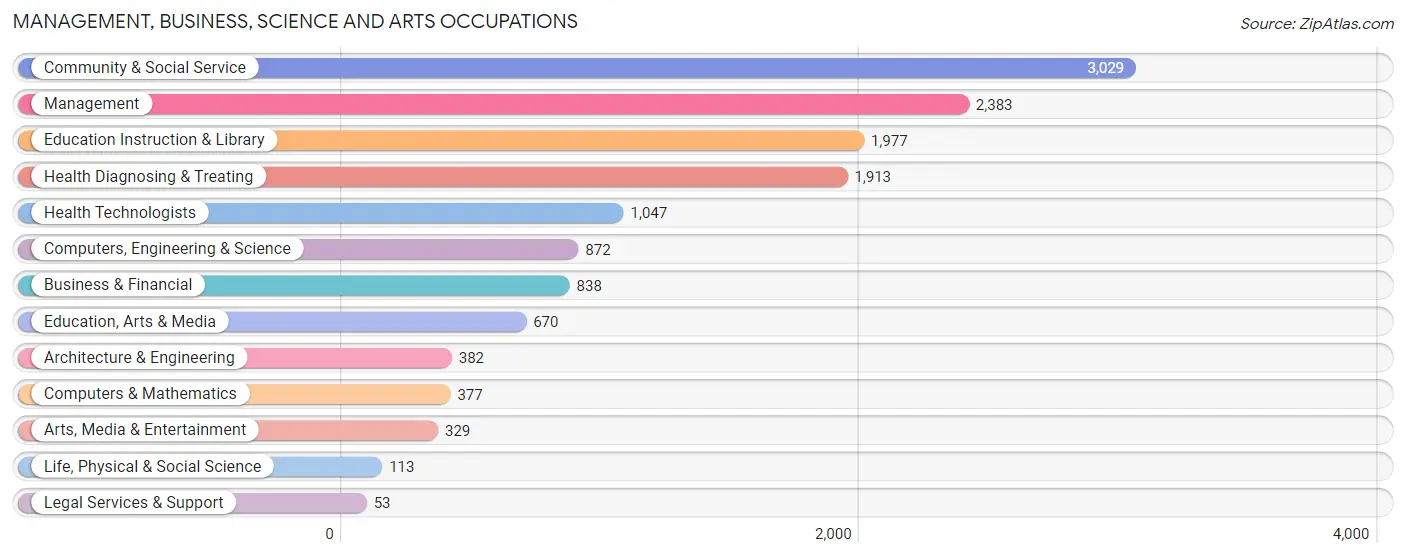
Management, Business, Science and Arts Occupations
The most common Management, Business, Science and Arts occupations in Grant County are Community & Social Service (3,029 | 10.2%), Management (2,383 | 8.1%), Education Instruction & Library (1,977 | 6.7%), Health Diagnosing & Treating (1,913 | 6.5%), and Health Technologists (1,047 | 3.5%).
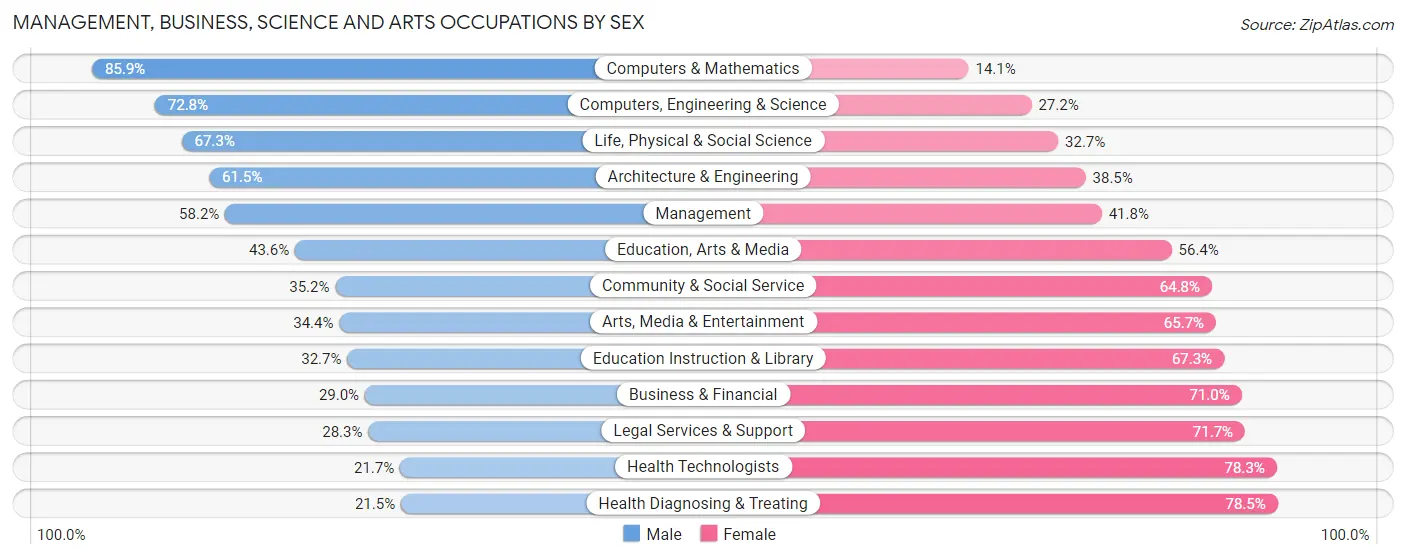
Management, Business, Science and Arts Occupations by Sex
Within the Management, Business, Science and Arts occupations in Grant County, the most male-oriented occupations are Computers & Mathematics (85.9%), Computers, Engineering & Science (72.8%), and Life, Physical & Social Science (67.3%), while the most female-oriented occupations are Health Diagnosing & Treating (78.5%), Health Technologists (78.3%), and Legal Services & Support (71.7%).
| Occupation | Male | Female |
| Management | 1,386 (58.2%) | 997 (41.8%) |
| Business & Financial | 243 (29.0%) | 595 (71.0%) |
| Computers, Engineering & Science | 635 (72.8%) | 237 (27.2%) |
| Computers & Mathematics | 324 (85.9%) | 53 (14.1%) |
| Architecture & Engineering | 235 (61.5%) | 147 (38.5%) |
| Life, Physical & Social Science | 76 (67.3%) | 37 (32.7%) |
| Community & Social Service | 1,066 (35.2%) | 1,963 (64.8%) |
| Education, Arts & Media | 292 (43.6%) | 378 (56.4%) |
| Legal Services & Support | 15 (28.3%) | 38 (71.7%) |
| Education Instruction & Library | 646 (32.7%) | 1,331 (67.3%) |
| Arts, Media & Entertainment | 113 (34.4%) | 216 (65.6%) |
| Health Diagnosing & Treating | 411 (21.5%) | 1,502 (78.5%) |
| Health Technologists | 227 (21.7%) | 820 (78.3%) |
| Total (Category) | 3,741 (41.4%) | 5,294 (58.6%) |
| Total (Overall) | 14,710 (49.7%) | 14,885 (50.3%) |
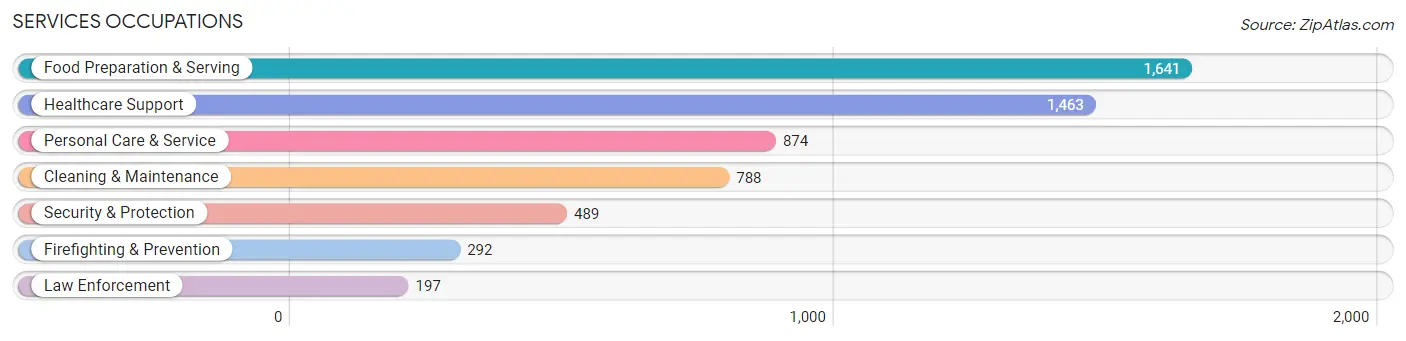
Services Occupations
The most common Services occupations in Grant County are Food Preparation & Serving (1,641 | 5.5%), Healthcare Support (1,463 | 4.9%), Personal Care & Service (874 | 2.9%), Cleaning & Maintenance (788 | 2.7%), and Security & Protection (489 | 1.7%).
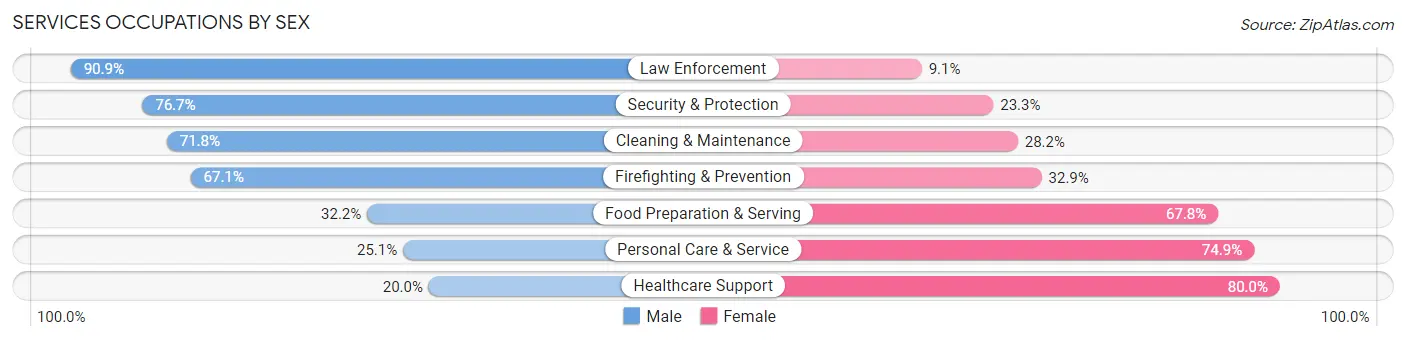
Services Occupations by Sex
Within the Services occupations in Grant County, the most male-oriented occupations are Law Enforcement (90.9%), Security & Protection (76.7%), and Cleaning & Maintenance (71.8%), while the most female-oriented occupations are Healthcare Support (80.0%), Personal Care & Service (74.9%), and Food Preparation & Serving (67.8%).
| Occupation | Male | Female |
| Healthcare Support | 292 (20.0%) | 1,171 (80.0%) |
| Security & Protection | 375 (76.7%) | 114 (23.3%) |
| Firefighting & Prevention | 196 (67.1%) | 96 (32.9%) |
| Law Enforcement | 179 (90.9%) | 18 (9.1%) |
| Food Preparation & Serving | 528 (32.2%) | 1,113 (67.8%) |
| Cleaning & Maintenance | 566 (71.8%) | 222 (28.2%) |
| Personal Care & Service | 219 (25.1%) | 655 (74.9%) |
| Total (Category) | 1,980 (37.7%) | 3,275 (62.3%) |
| Total (Overall) | 14,710 (49.7%) | 14,885 (50.3%) |
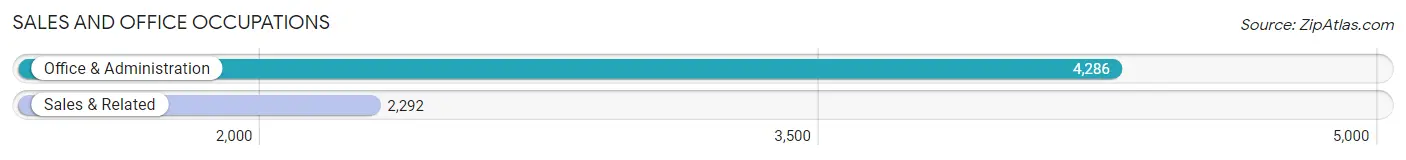
Sales and Office Occupations
The most common Sales and Office occupations in Grant County are Office & Administration (4,286 | 14.5%), and Sales & Related (2,292 | 7.7%).
Sales and Office Occupations by Sex
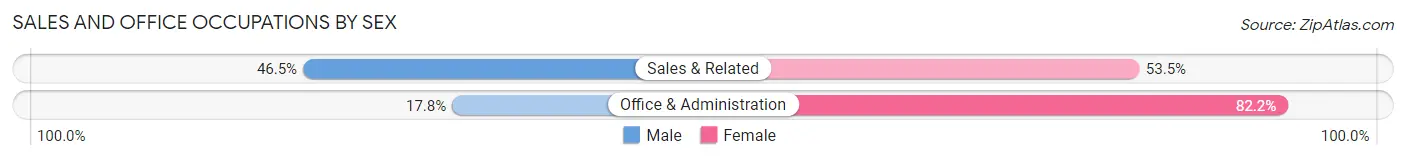
| Occupation | Male | Female |
| Sales & Related | 1,065 (46.5%) | 1,227 (53.5%) |
| Office & Administration | 763 (17.8%) | 3,523 (82.2%) |
| Total (Category) | 1,828 (27.8%) | 4,750 (72.2%) |
| Total (Overall) | 14,710 (49.7%) | 14,885 (50.3%) |
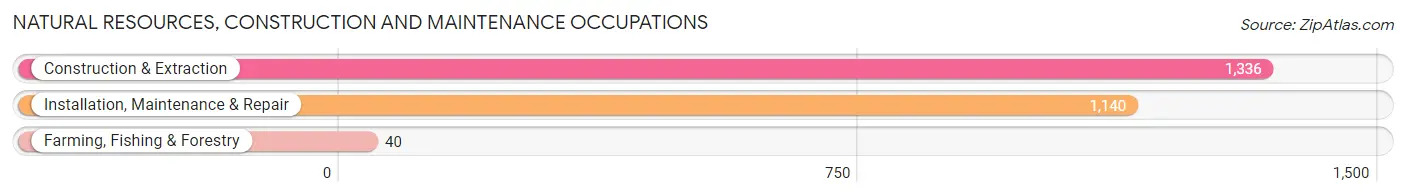
Natural Resources, Construction and Maintenance Occupations
The most common Natural Resources, Construction and Maintenance occupations in Grant County are Construction & Extraction (1,336 | 4.5%), Installation, Maintenance & Repair (1,140 | 3.8%), and Farming, Fishing & Forestry (40 | 0.1%).
Natural Resources, Construction and Maintenance Occupations by Sex
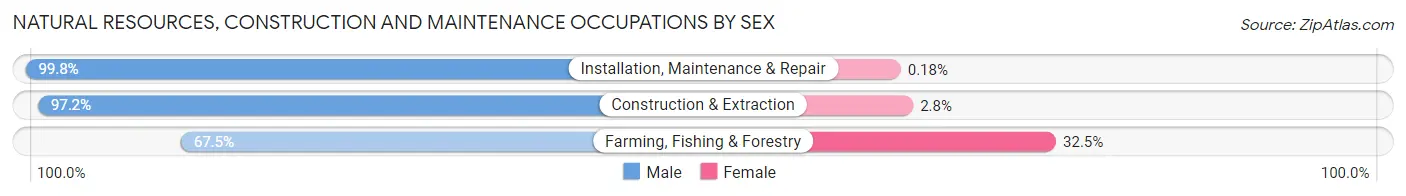
| Occupation | Male | Female |
| Farming, Fishing & Forestry | 27 (67.5%) | 13 (32.5%) |
| Construction & Extraction | 1,299 (97.2%) | 37 (2.8%) |
| Installation, Maintenance & Repair | 1,138 (99.8%) | 2 (0.2%) |
| Total (Category) | 2,464 (97.9%) | 52 (2.1%) |
| Total (Overall) | 14,710 (49.7%) | 14,885 (50.3%) |
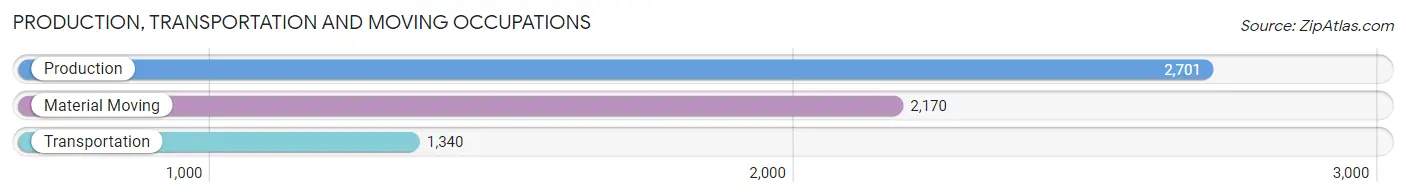
Production, Transportation and Moving Occupations
The most common Production, Transportation and Moving occupations in Grant County are Production (2,701 | 9.1%), Material Moving (2,170 | 7.3%), and Transportation (1,340 | 4.5%).
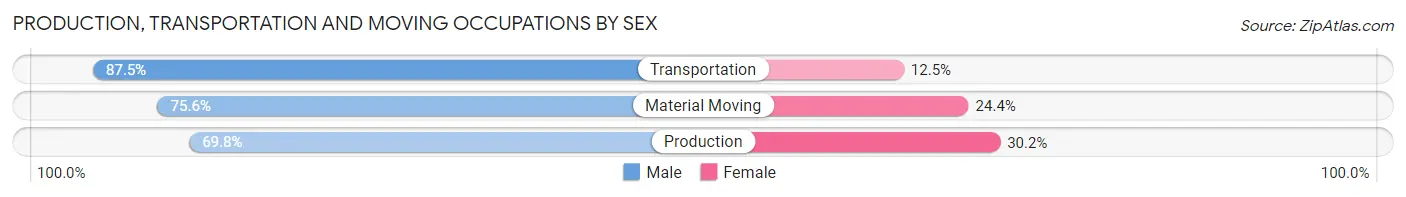
Production, Transportation and Moving Occupations by Sex
| Occupation | Male | Female |
| Production | 1,885 (69.8%) | 816 (30.2%) |
| Transportation | 1,172 (87.5%) | 168 (12.5%) |
| Material Moving | 1,640 (75.6%) | 530 (24.4%) |
| Total (Category) | 4,697 (75.6%) | 1,514 (24.4%) |
| Total (Overall) | 14,710 (49.7%) | 14,885 (50.3%) |
Employment Industries by Sex in Grant County
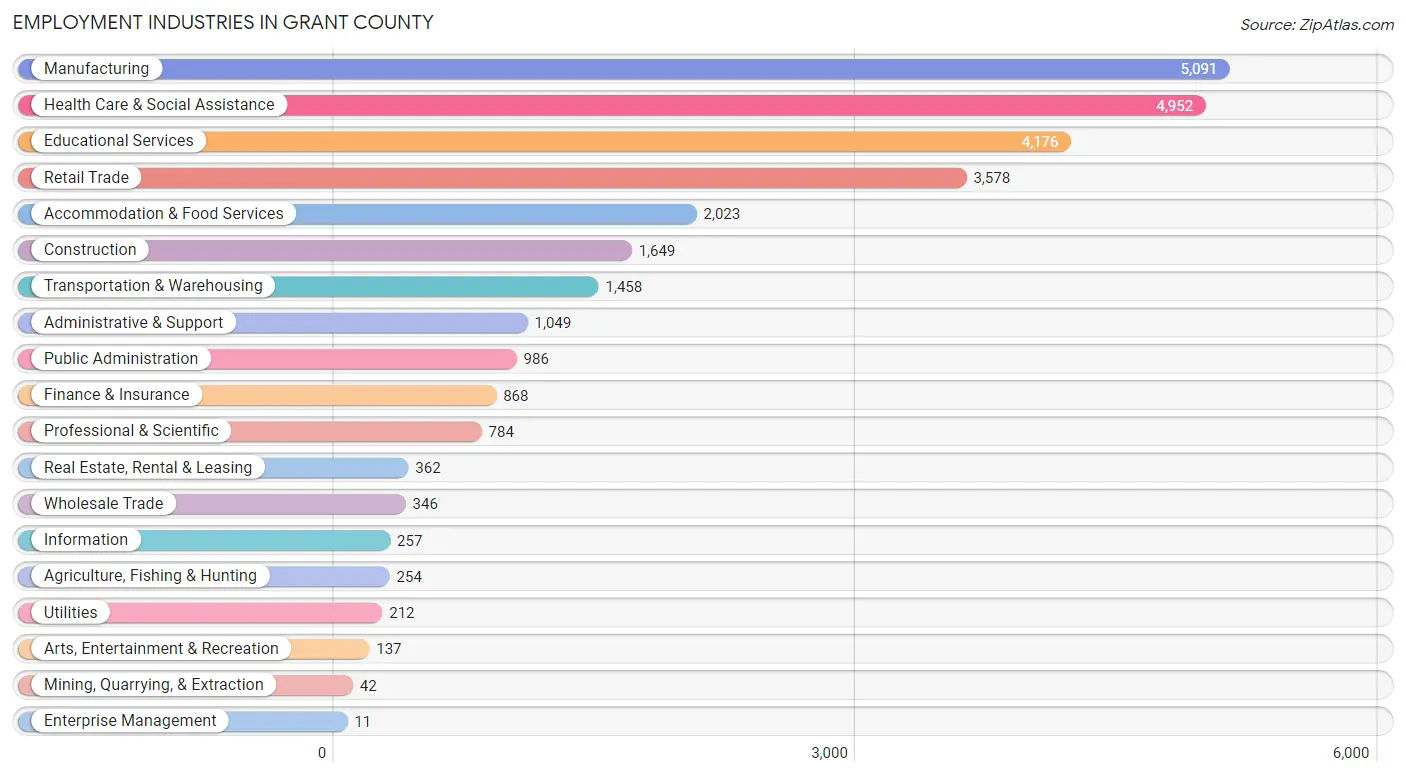
Employment Industries in Grant County
The major employment industries in Grant County include Manufacturing (5,091 | 17.2%), Health Care & Social Assistance (4,952 | 16.7%), Educational Services (4,176 | 14.1%), Retail Trade (3,578 | 12.1%), and Accommodation & Food Services (2,023 | 6.8%).
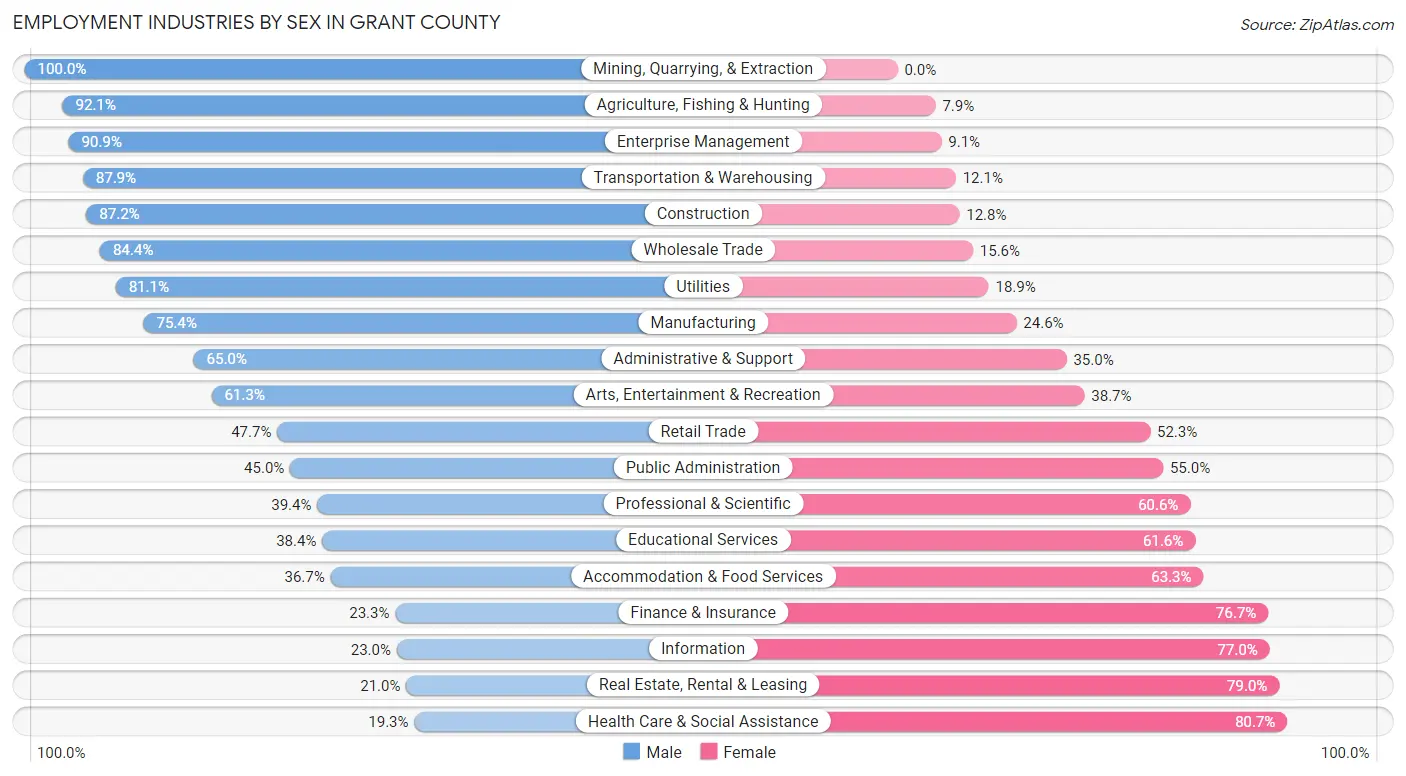
Employment Industries by Sex in Grant County
The Grant County industries that see more men than women are Mining, Quarrying, & Extraction (100.0%), Agriculture, Fishing & Hunting (92.1%), and Enterprise Management (90.9%), whereas the industries that tend to have a higher number of women are Health Care & Social Assistance (80.7%), Real Estate, Rental & Leasing (79.0%), and Information (77.0%).
| Industry | Male | Female |
| Agriculture, Fishing & Hunting | 234 (92.1%) | 20 (7.9%) |
| Mining, Quarrying, & Extraction | 42 (100.0%) | 0 (0.0%) |
| Construction | 1,438 (87.2%) | 211 (12.8%) |
| Manufacturing | 3,837 (75.4%) | 1,254 (24.6%) |
| Wholesale Trade | 292 (84.4%) | 54 (15.6%) |
| Retail Trade | 1,707 (47.7%) | 1,871 (52.3%) |
| Transportation & Warehousing | 1,282 (87.9%) | 176 (12.1%) |
| Utilities | 172 (81.1%) | 40 (18.9%) |
| Information | 59 (23.0%) | 198 (77.0%) |
| Finance & Insurance | 202 (23.3%) | 666 (76.7%) |
| Real Estate, Rental & Leasing | 76 (21.0%) | 286 (79.0%) |
| Professional & Scientific | 309 (39.4%) | 475 (60.6%) |
| Enterprise Management | 10 (90.9%) | 1 (9.1%) |
| Administrative & Support | 682 (65.0%) | 367 (35.0%) |
| Educational Services | 1,603 (38.4%) | 2,573 (61.6%) |
| Health Care & Social Assistance | 957 (19.3%) | 3,995 (80.7%) |
| Arts, Entertainment & Recreation | 84 (61.3%) | 53 (38.7%) |
| Accommodation & Food Services | 742 (36.7%) | 1,281 (63.3%) |
| Public Administration | 444 (45.0%) | 542 (55.0%) |
| Total | 14,710 (49.7%) | 14,885 (50.3%) |
Education in Grant County
School Enrollment in Grant County
The most common levels of schooling among the 17,576 students in Grant County are college / undergraduate (6,078 | 34.6%), elementary school (3,186 | 18.1%), and high school (3,173 | 18.0%).
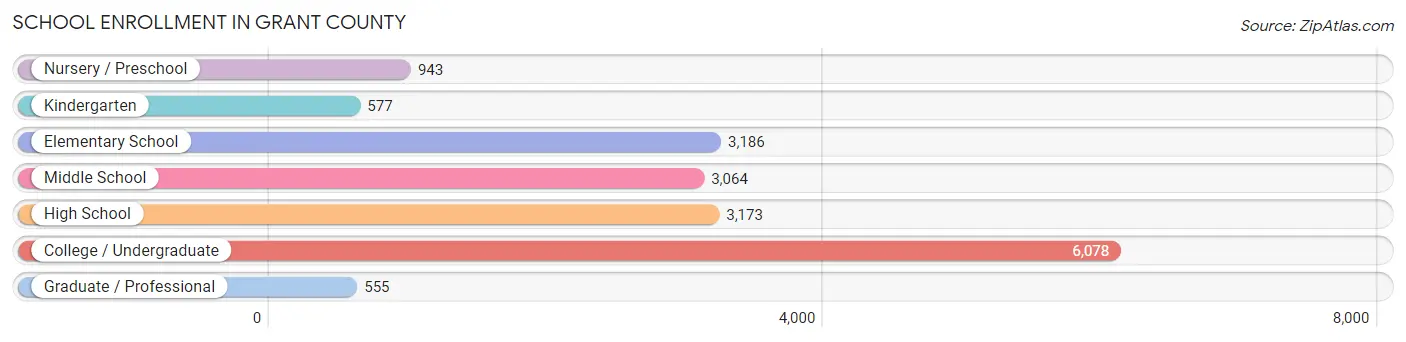
| School Level | # Students | % Students |
| Nursery / Preschool | 943 | 5.4% |
| Kindergarten | 577 | 3.3% |
| Elementary School | 3,186 | 18.1% |
| Middle School | 3,064 | 17.4% |
| High School | 3,173 | 18.0% |
| College / Undergraduate | 6,078 | 34.6% |
| Graduate / Professional | 555 | 3.2% |
| Total | 17,576 | 100.0% |
School Enrollment by Age by Funding Source in Grant County
Out of a total of 17,576 students who are enrolled in schools in Grant County, 5,607 (31.9%) attend a private institution, while the remaining 11,969 (68.1%) are enrolled in public schools. The age group of 20 to 24 year olds has the highest likelihood of being enrolled in private schools, with 3,023 (86.1% in the age bracket) enrolled. Conversely, the age group of 10 to 14 year olds has the lowest likelihood of being enrolled in a private school, with 3,762 (94.7% in the age bracket) attending a public institution.
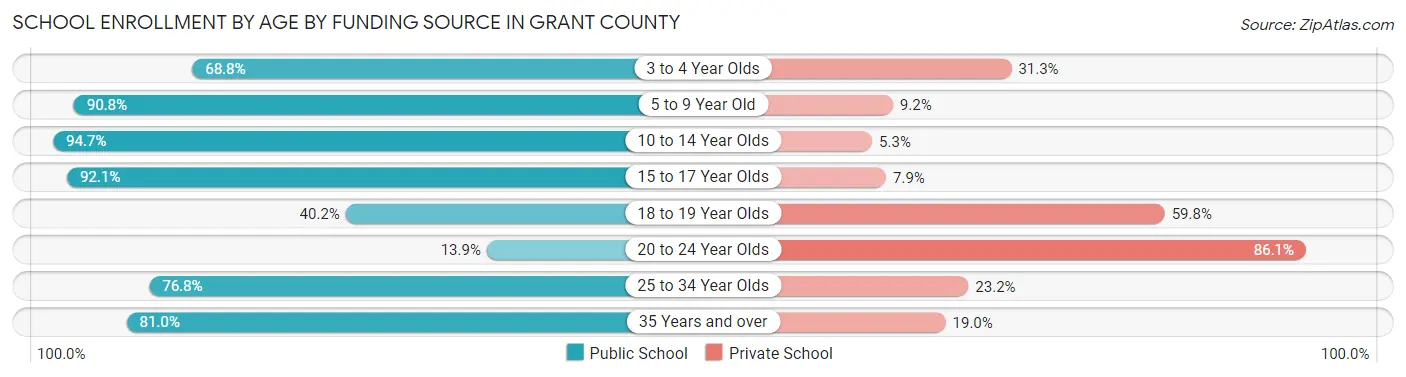
| Age Bracket | Public School | Private School |
| 3 to 4 Year Olds | 517 (68.8%) | 235 (31.2%) |
| 5 to 9 Year Old | 3,129 (90.8%) | 316 (9.2%) |
| 10 to 14 Year Olds | 3,762 (94.7%) | 211 (5.3%) |
| 15 to 17 Year Olds | 2,086 (92.1%) | 179 (7.9%) |
| 18 to 19 Year Olds | 907 (40.2%) | 1,349 (59.8%) |
| 20 to 24 Year Olds | 489 (13.9%) | 3,023 (86.1%) |
| 25 to 34 Year Olds | 585 (76.8%) | 177 (23.2%) |
| 35 Years and over | 495 (81.0%) | 116 (19.0%) |
| Total | 11,969 (68.1%) | 5,607 (31.9%) |
Educational Attainment by Field of Study in Grant County
Education (1,849 | 20.8%), business (1,838 | 20.7%), science & technology (1,440 | 16.2%), arts & humanities (696 | 7.8%), and liberal arts & history (668 | 7.5%) are the most common fields of study among 8,873 individuals in Grant County who have obtained a bachelor's degree or higher.
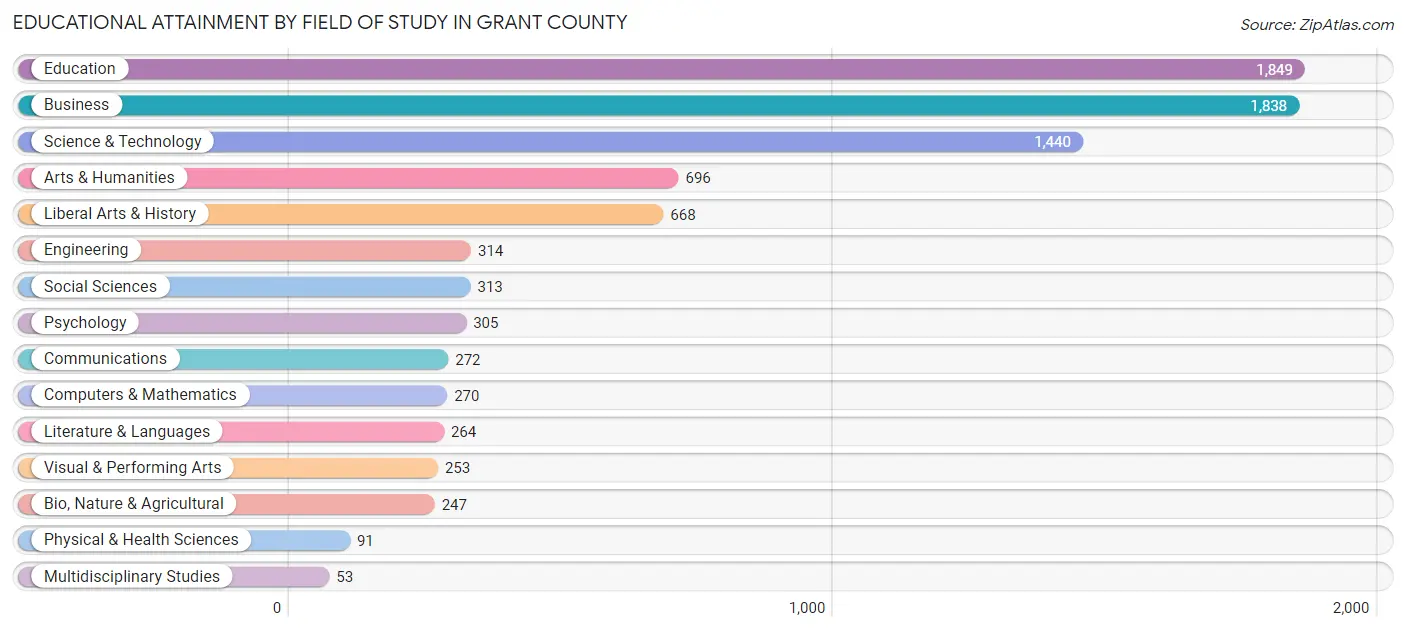
| Field of Study | # Graduates | % Graduates |
| Computers & Mathematics | 270 | 3.0% |
| Bio, Nature & Agricultural | 247 | 2.8% |
| Physical & Health Sciences | 91 | 1.0% |
| Psychology | 305 | 3.4% |
| Social Sciences | 313 | 3.5% |
| Engineering | 314 | 3.5% |
| Multidisciplinary Studies | 53 | 0.6% |
| Science & Technology | 1,440 | 16.2% |
| Business | 1,838 | 20.7% |
| Education | 1,849 | 20.8% |
| Literature & Languages | 264 | 3.0% |
| Liberal Arts & History | 668 | 7.5% |
| Visual & Performing Arts | 253 | 2.9% |
| Communications | 272 | 3.1% |
| Arts & Humanities | 696 | 7.8% |
| Total | 8,873 | 100.0% |
Transportation & Commute in Grant County
Vehicle Availability by Sex in Grant County
The most prevalent vehicle ownership categories in Grant County are males with 2 vehicles (5,610, accounting for 41.5%) and females with 2 vehicles (4,598, making up 44.3%).
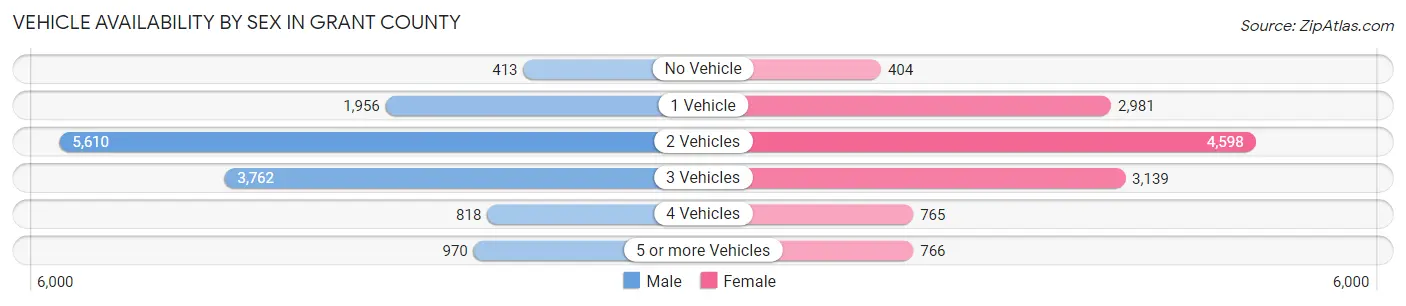
| Vehicles Available | Male | Female |
| No Vehicle | 413 (3.0%) | 404 (3.2%) |
| 1 Vehicle | 1,956 (14.5%) | 2,981 (23.6%) |
| 2 Vehicles | 5,610 (41.5%) | 4,598 (36.3%) |
| 3 Vehicles | 3,762 (27.8%) | 3,139 (24.8%) |
| 4 Vehicles | 818 (6.0%) | 765 (6.0%) |
| 5 or more Vehicles | 970 (7.2%) | 766 (6.0%) |
| Total | 13,529 (100.0%) | 12,653 (100.0%) |
Commute Time in Grant County
The most frequently occuring commute durations in Grant County are 10 to 14 minutes (5,134 commuters, 19.2%), 5 to 9 minutes (4,977 commuters, 18.6%), and 15 to 19 minutes (4,460 commuters, 16.7%).
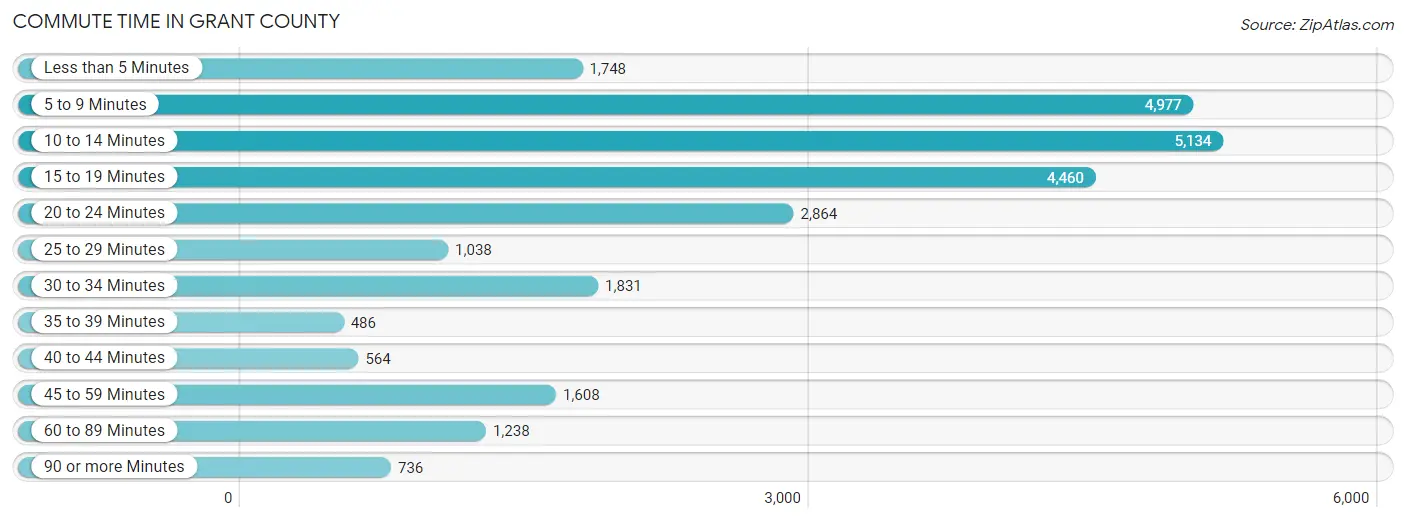
| Commute Time | # Commuters | % Commuters |
| Less than 5 Minutes | 1,748 | 6.6% |
| 5 to 9 Minutes | 4,977 | 18.6% |
| 10 to 14 Minutes | 5,134 | 19.2% |
| 15 to 19 Minutes | 4,460 | 16.7% |
| 20 to 24 Minutes | 2,864 | 10.7% |
| 25 to 29 Minutes | 1,038 | 3.9% |
| 30 to 34 Minutes | 1,831 | 6.9% |
| 35 to 39 Minutes | 486 | 1.8% |
| 40 to 44 Minutes | 564 | 2.1% |
| 45 to 59 Minutes | 1,608 | 6.0% |
| 60 to 89 Minutes | 1,238 | 4.6% |
| 90 or more Minutes | 736 | 2.8% |
Commute Time by Sex in Grant County
The most common commute times in Grant County are 10 to 14 minutes (2,391 commuters, 17.9%) for males and 5 to 9 minutes (3,068 commuters, 23.0%) for females.
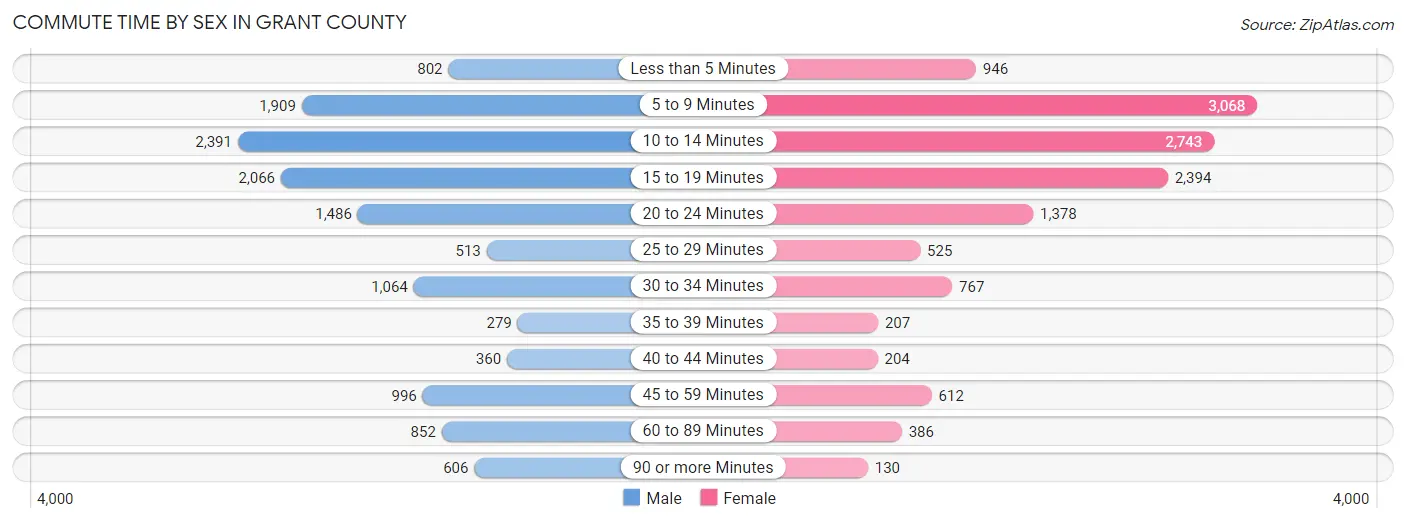
| Commute Time | Male | Female |
| Less than 5 Minutes | 802 (6.0%) | 946 (7.1%) |
| 5 to 9 Minutes | 1,909 (14.3%) | 3,068 (23.0%) |
| 10 to 14 Minutes | 2,391 (17.9%) | 2,743 (20.5%) |
| 15 to 19 Minutes | 2,066 (15.5%) | 2,394 (17.9%) |
| 20 to 24 Minutes | 1,486 (11.2%) | 1,378 (10.3%) |
| 25 to 29 Minutes | 513 (3.8%) | 525 (3.9%) |
| 30 to 34 Minutes | 1,064 (8.0%) | 767 (5.7%) |
| 35 to 39 Minutes | 279 (2.1%) | 207 (1.5%) |
| 40 to 44 Minutes | 360 (2.7%) | 204 (1.5%) |
| 45 to 59 Minutes | 996 (7.5%) | 612 (4.6%) |
| 60 to 89 Minutes | 852 (6.4%) | 386 (2.9%) |
| 90 or more Minutes | 606 (4.5%) | 130 (1.0%) |
Time of Departure to Work by Sex in Grant County
The most frequent times of departure to work in Grant County are 4:00 PM to 11:59 PM (1,712, 12.9%) for males and 7:30 AM to 7:59 AM (2,236, 16.7%) for females.
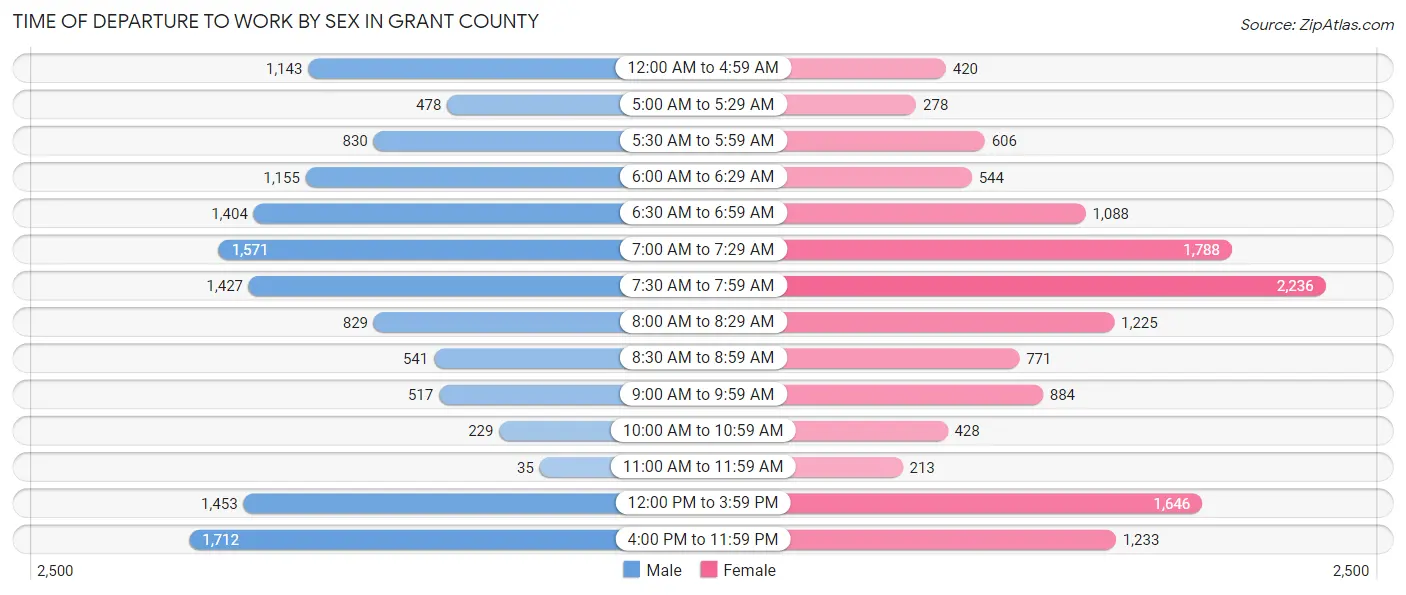
| Time of Departure | Male | Female |
| 12:00 AM to 4:59 AM | 1,143 (8.6%) | 420 (3.1%) |
| 5:00 AM to 5:29 AM | 478 (3.6%) | 278 (2.1%) |
| 5:30 AM to 5:59 AM | 830 (6.2%) | 606 (4.5%) |
| 6:00 AM to 6:29 AM | 1,155 (8.7%) | 544 (4.1%) |
| 6:30 AM to 6:59 AM | 1,404 (10.5%) | 1,088 (8.1%) |
| 7:00 AM to 7:29 AM | 1,571 (11.8%) | 1,788 (13.4%) |
| 7:30 AM to 7:59 AM | 1,427 (10.7%) | 2,236 (16.7%) |
| 8:00 AM to 8:29 AM | 829 (6.2%) | 1,225 (9.2%) |
| 8:30 AM to 8:59 AM | 541 (4.1%) | 771 (5.8%) |
| 9:00 AM to 9:59 AM | 517 (3.9%) | 884 (6.6%) |
| 10:00 AM to 10:59 AM | 229 (1.7%) | 428 (3.2%) |
| 11:00 AM to 11:59 AM | 35 (0.3%) | 213 (1.6%) |
| 12:00 PM to 3:59 PM | 1,453 (10.9%) | 1,646 (12.3%) |
| 4:00 PM to 11:59 PM | 1,712 (12.9%) | 1,233 (9.2%) |
| Total | 13,324 (100.0%) | 13,360 (100.0%) |
Housing Occupancy in Grant County
Occupancy by Ownership in Grant County
Of the total 26,550 dwellings in Grant County, owner-occupied units account for 19,124 (72.0%), while renter-occupied units make up 7,426 (28.0%).
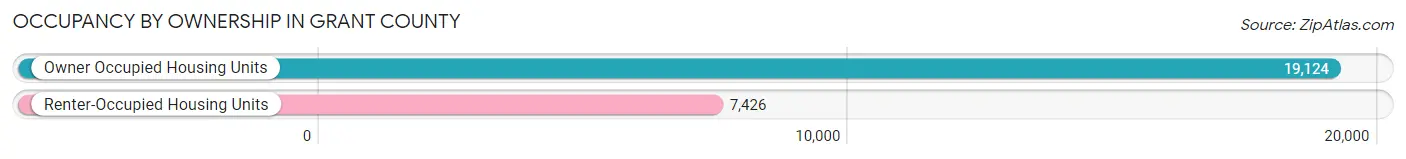
| Occupancy | # Housing Units | % Housing Units |
| Owner Occupied Housing Units | 19,124 | 72.0% |
| Renter-Occupied Housing Units | 7,426 | 28.0% |
| Total Occupied Housing Units | 26,550 | 100.0% |
Occupancy by Household Size in Grant County
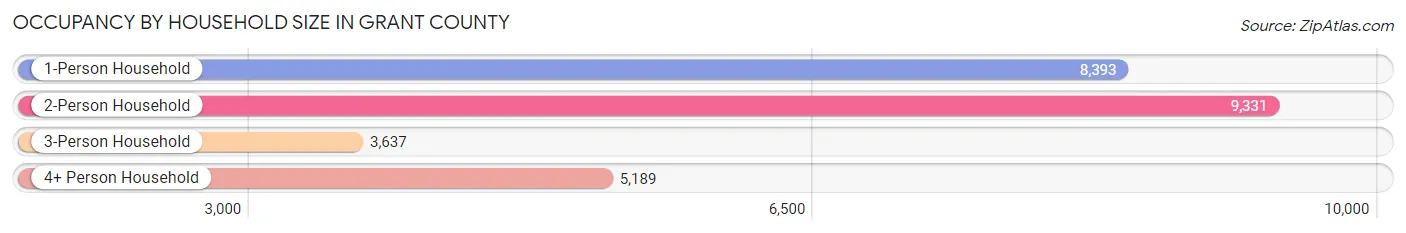
| Household Size | # Housing Units | % Housing Units |
| 1-Person Household | 8,393 | 31.6% |
| 2-Person Household | 9,331 | 35.1% |
| 3-Person Household | 3,637 | 13.7% |
| 4+ Person Household | 5,189 | 19.5% |
| Total Housing Units | 26,550 | 100.0% |
Occupancy by Ownership by Household Size in Grant County
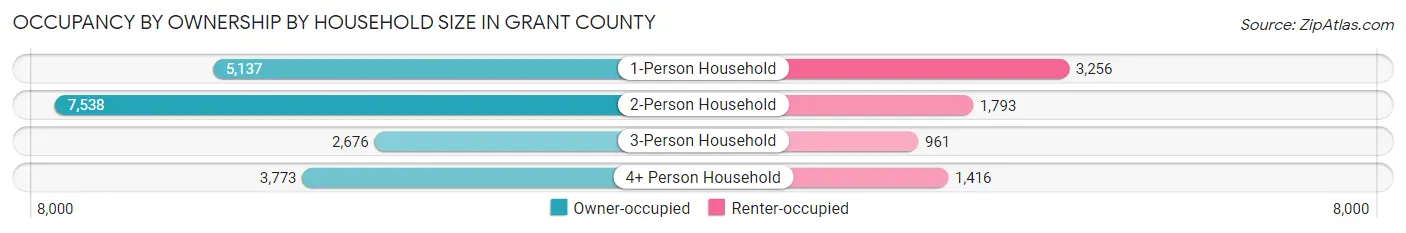
| Household Size | Owner-occupied | Renter-occupied |
| 1-Person Household | 5,137 (61.2%) | 3,256 (38.8%) |
| 2-Person Household | 7,538 (80.8%) | 1,793 (19.2%) |
| 3-Person Household | 2,676 (73.6%) | 961 (26.4%) |
| 4+ Person Household | 3,773 (72.7%) | 1,416 (27.3%) |
| Total Housing Units | 19,124 (72.0%) | 7,426 (28.0%) |
Occupancy by Educational Attainment in Grant County
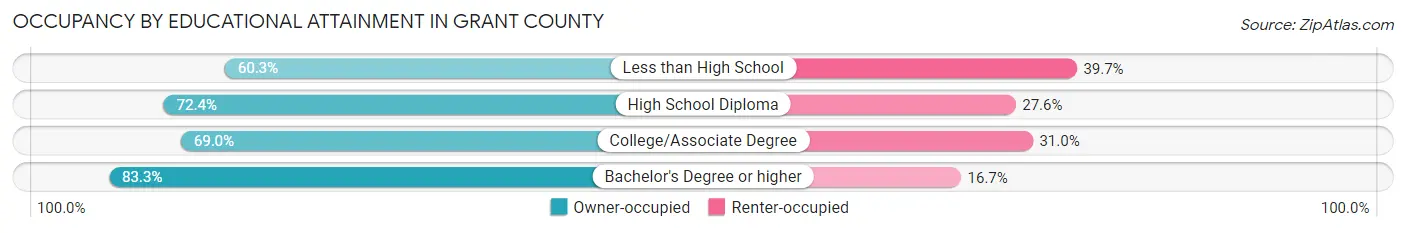
| Household Size | Owner-occupied | Renter-occupied |
| Less than High School | 1,702 (60.3%) | 1,121 (39.7%) |
| High School Diploma | 6,975 (72.4%) | 2,656 (27.6%) |
| College/Associate Degree | 6,244 (69.0%) | 2,804 (31.0%) |
| Bachelor's Degree or higher | 4,203 (83.3%) | 845 (16.7%) |
Occupancy by Age of Householder in Grant County
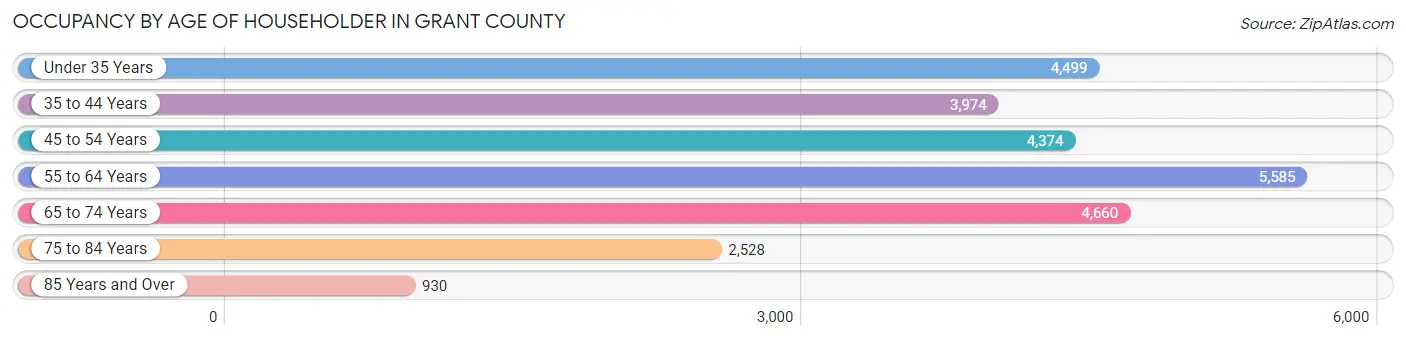
| Age Bracket | # Households | % Households |
| Under 35 Years | 4,499 | 17.0% |
| 35 to 44 Years | 3,974 | 15.0% |
| 45 to 54 Years | 4,374 | 16.5% |
| 55 to 64 Years | 5,585 | 21.0% |
| 65 to 74 Years | 4,660 | 17.5% |
| 75 to 84 Years | 2,528 | 9.5% |
| 85 Years and Over | 930 | 3.5% |
| Total | 26,550 | 100.0% |
Housing Finances in Grant County
Median Income by Occupancy in Grant County
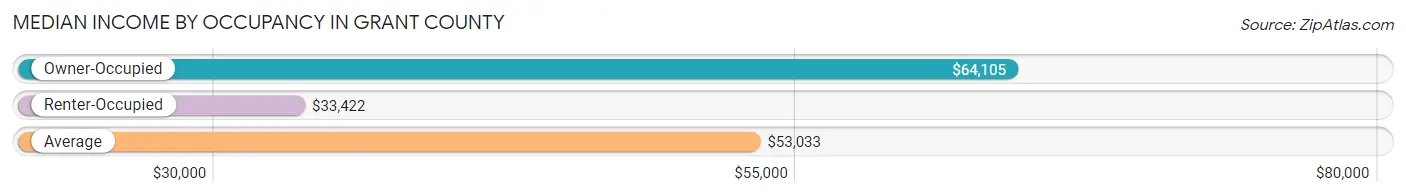
| Occupancy Type | # Households | Median Income |
| Owner-Occupied | 19,124 (72.0%) | $64,105 |
| Renter-Occupied | 7,426 (28.0%) | $33,422 |
| Average | 26,550 (100.0%) | $53,033 |
Occupancy by Householder Income Bracket in Grant County
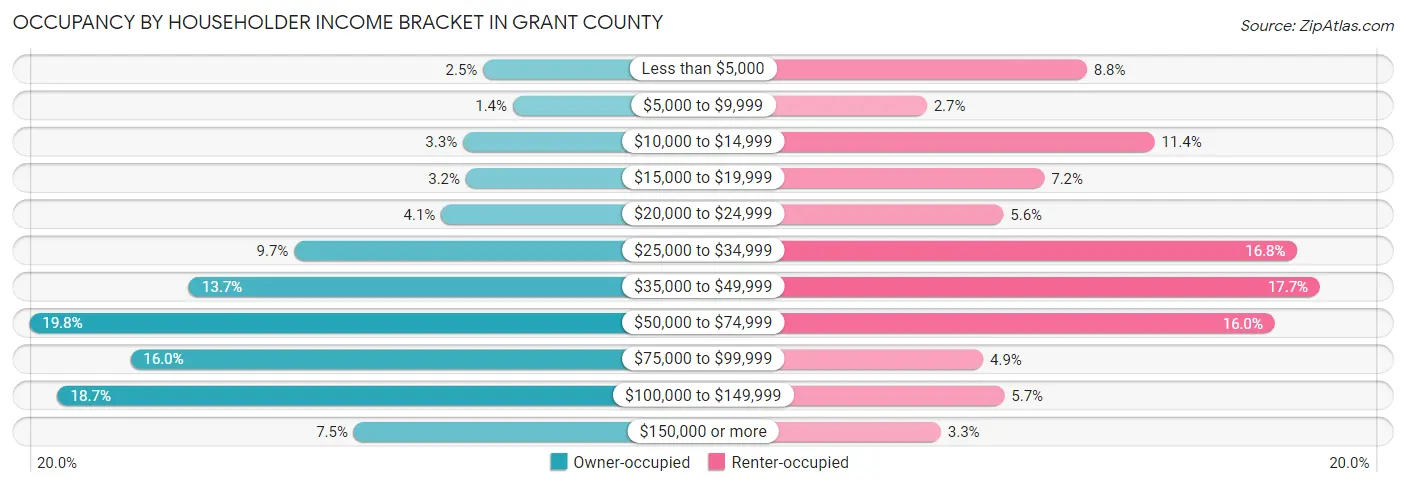
| Income Bracket | Owner-occupied | Renter-occupied |
| Less than $5,000 | 483 (2.5%) | 654 (8.8%) |
| $5,000 to $9,999 | 267 (1.4%) | 201 (2.7%) |
| $10,000 to $14,999 | 632 (3.3%) | 846 (11.4%) |
| $15,000 to $19,999 | 610 (3.2%) | 534 (7.2%) |
| $20,000 to $24,999 | 790 (4.1%) | 418 (5.6%) |
| $25,000 to $34,999 | 1,860 (9.7%) | 1,250 (16.8%) |
| $35,000 to $49,999 | 2,628 (13.7%) | 1,314 (17.7%) |
| $50,000 to $74,999 | 3,790 (19.8%) | 1,186 (16.0%) |
| $75,000 to $99,999 | 3,054 (16.0%) | 361 (4.9%) |
| $100,000 to $149,999 | 3,584 (18.7%) | 421 (5.7%) |
| $150,000 or more | 1,426 (7.5%) | 241 (3.3%) |
| Total | 19,124 (100.0%) | 7,426 (100.0%) |
Monthly Housing Cost Tiers in Grant County
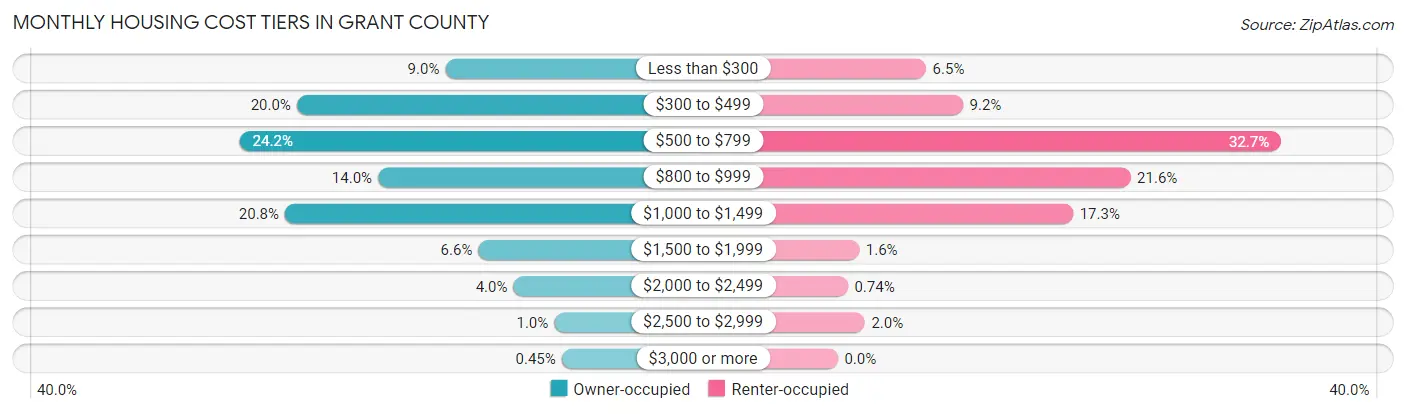
| Monthly Cost | Owner-occupied | Renter-occupied |
| Less than $300 | 1,725 (9.0%) | 483 (6.5%) |
| $300 to $499 | 3,818 (20.0%) | 685 (9.2%) |
| $500 to $799 | 4,620 (24.2%) | 2,426 (32.7%) |
| $800 to $999 | 2,673 (14.0%) | 1,601 (21.6%) |
| $1,000 to $1,499 | 3,984 (20.8%) | 1,287 (17.3%) |
| $1,500 to $1,999 | 1,260 (6.6%) | 117 (1.6%) |
| $2,000 to $2,499 | 766 (4.0%) | 55 (0.7%) |
| $2,500 to $2,999 | 191 (1.0%) | 148 (2.0%) |
| $3,000 or more | 87 (0.4%) | 0 (0.0%) |
| Total | 19,124 (100.0%) | 7,426 (100.0%) |
Physical Housing Characteristics in Grant County
Housing Structures in Grant County
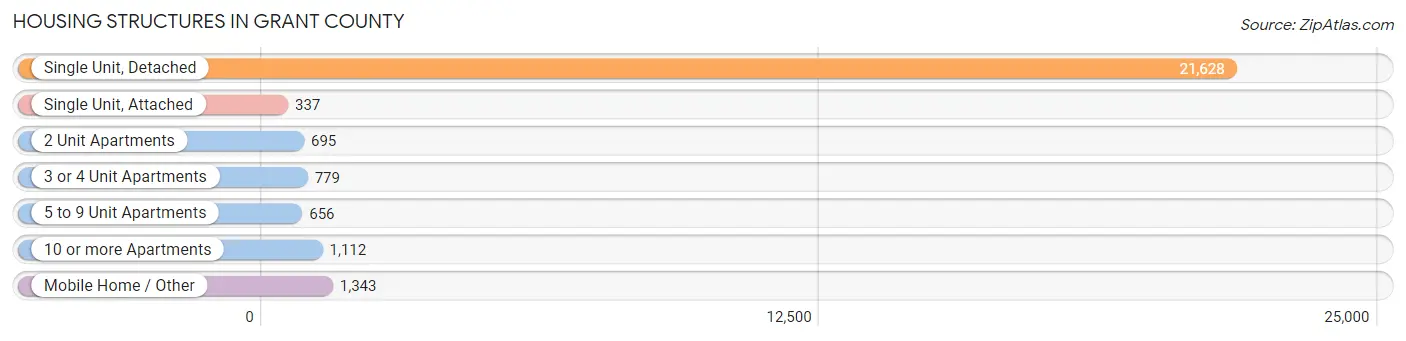
| Structure Type | # Housing Units | % Housing Units |
| Single Unit, Detached | 21,628 | 81.5% |
| Single Unit, Attached | 337 | 1.3% |
| 2 Unit Apartments | 695 | 2.6% |
| 3 or 4 Unit Apartments | 779 | 2.9% |
| 5 to 9 Unit Apartments | 656 | 2.5% |
| 10 or more Apartments | 1,112 | 4.2% |
| Mobile Home / Other | 1,343 | 5.1% |
| Total | 26,550 | 100.0% |
Housing Structures by Occupancy in Grant County
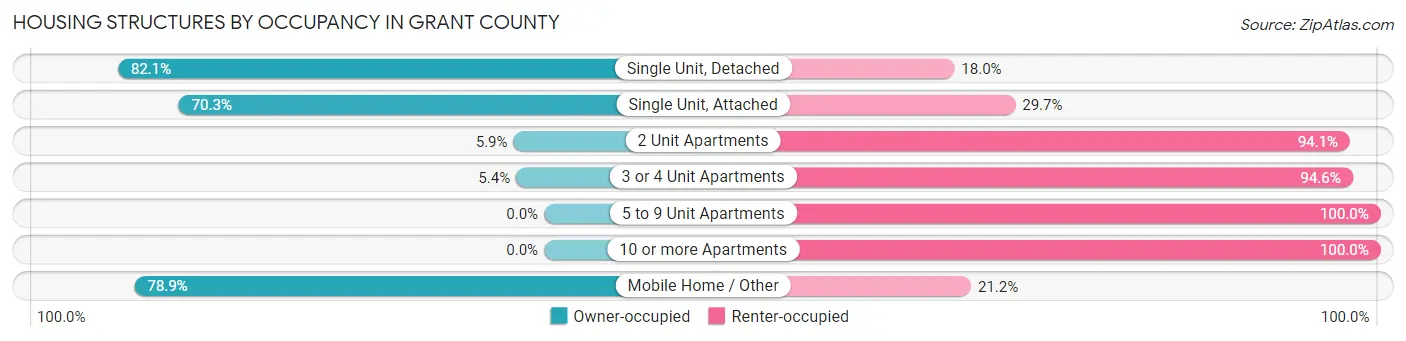
| Structure Type | Owner-occupied | Renter-occupied |
| Single Unit, Detached | 17,745 (82.1%) | 3,883 (17.9%) |
| Single Unit, Attached | 237 (70.3%) | 100 (29.7%) |
| 2 Unit Apartments | 41 (5.9%) | 654 (94.1%) |
| 3 or 4 Unit Apartments | 42 (5.4%) | 737 (94.6%) |
| 5 to 9 Unit Apartments | 0 (0.0%) | 656 (100.0%) |
| 10 or more Apartments | 0 (0.0%) | 1,112 (100.0%) |
| Mobile Home / Other | 1,059 (78.8%) | 284 (21.1%) |
| Total | 19,124 (72.0%) | 7,426 (28.0%) |
Housing Structures by Number of Rooms in Grant County
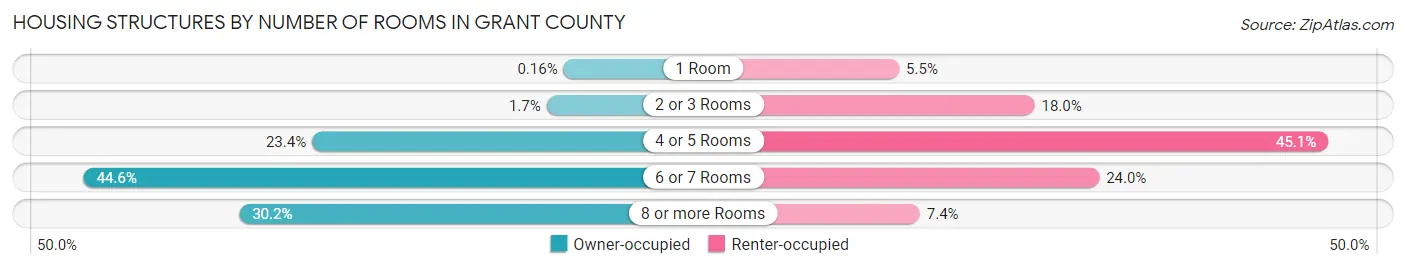
| Number of Rooms | Owner-occupied | Renter-occupied |
| 1 Room | 30 (0.2%) | 407 (5.5%) |
| 2 or 3 Rooms | 330 (1.7%) | 1,337 (18.0%) |
| 4 or 5 Rooms | 4,478 (23.4%) | 3,352 (45.1%) |
| 6 or 7 Rooms | 8,520 (44.6%) | 1,781 (24.0%) |
| 8 or more Rooms | 5,766 (30.1%) | 549 (7.4%) |
| Total | 19,124 (100.0%) | 7,426 (100.0%) |
Housing Structure by Heating Type in Grant County
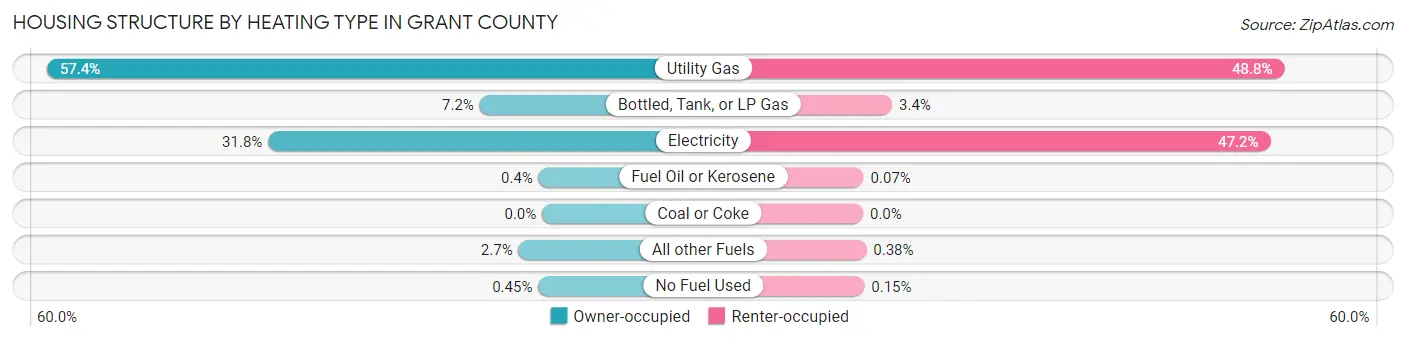
| Heating Type | Owner-occupied | Renter-occupied |
| Utility Gas | 10,979 (57.4%) | 3,626 (48.8%) |
| Bottled, Tank, or LP Gas | 1,385 (7.2%) | 250 (3.4%) |
| Electricity | 6,073 (31.8%) | 3,506 (47.2%) |
| Fuel Oil or Kerosene | 77 (0.4%) | 5 (0.1%) |
| Coal or Coke | 0 (0.0%) | 0 (0.0%) |
| All other Fuels | 524 (2.7%) | 28 (0.4%) |
| No Fuel Used | 86 (0.4%) | 11 (0.2%) |
| Total | 19,124 (100.0%) | 7,426 (100.0%) |
Household Vehicle Usage in Grant County
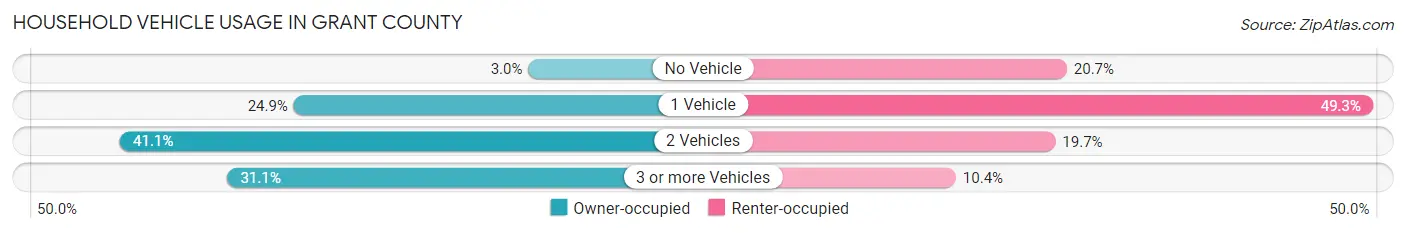
| Vehicles per Household | Owner-occupied | Renter-occupied |
| No Vehicle | 569 (3.0%) | 1,539 (20.7%) |
| 1 Vehicle | 4,758 (24.9%) | 3,659 (49.3%) |
| 2 Vehicles | 7,857 (41.1%) | 1,459 (19.7%) |
| 3 or more Vehicles | 5,940 (31.1%) | 769 (10.4%) |
| Total | 19,124 (100.0%) | 7,426 (100.0%) |
Real Estate & Mortgages in Grant County
Real Estate and Mortgage Overview in Grant County
| Characteristic | Without Mortgage | With Mortgage |
| Housing Units | 7,787 | 11,337 |
| Median Property Value | $91,300 | $120,200 |
| Median Household Income | $50,798 | $1,044 |
| Monthly Housing Costs | $400 | $78 |
| Real Estate Taxes | $663 | $683 |
Property Value by Mortgage Status in Grant County
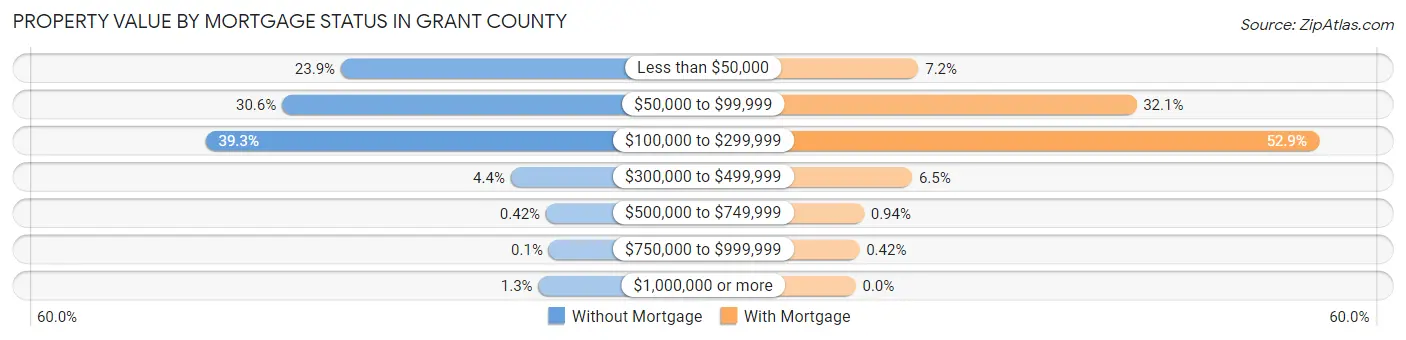
| Property Value | Without Mortgage | With Mortgage |
| Less than $50,000 | 1,857 (23.8%) | 813 (7.2%) |
| $50,000 to $99,999 | 2,381 (30.6%) | 3,637 (32.1%) |
| $100,000 to $299,999 | 3,062 (39.3%) | 6,001 (52.9%) |
| $300,000 to $499,999 | 346 (4.4%) | 731 (6.5%) |
| $500,000 to $749,999 | 33 (0.4%) | 107 (0.9%) |
| $750,000 to $999,999 | 8 (0.1%) | 48 (0.4%) |
| $1,000,000 or more | 100 (1.3%) | 0 (0.0%) |
| Total | 7,787 (100.0%) | 11,337 (100.0%) |
Household Income by Mortgage Status in Grant County
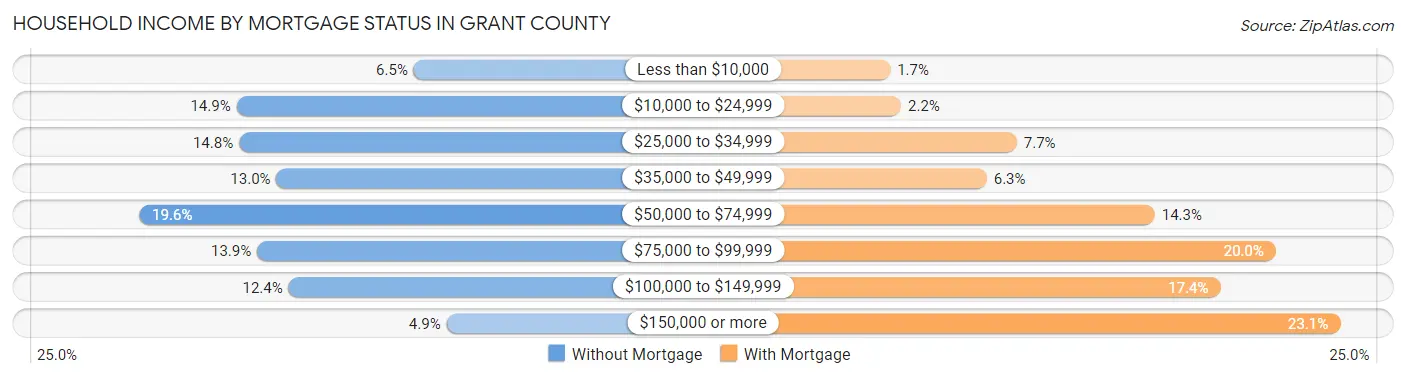
| Household Income | Without Mortgage | With Mortgage |
| Less than $10,000 | 504 (6.5%) | 187 (1.7%) |
| $10,000 to $24,999 | 1,161 (14.9%) | 246 (2.2%) |
| $25,000 to $34,999 | 1,152 (14.8%) | 871 (7.7%) |
| $35,000 to $49,999 | 1,013 (13.0%) | 708 (6.2%) |
| $50,000 to $74,999 | 1,522 (19.6%) | 1,615 (14.2%) |
| $75,000 to $99,999 | 1,085 (13.9%) | 2,268 (20.0%) |
| $100,000 to $149,999 | 968 (12.4%) | 1,969 (17.4%) |
| $150,000 or more | 382 (4.9%) | 2,616 (23.1%) |
| Total | 7,787 (100.0%) | 11,337 (100.0%) |
Property Value to Household Income Ratio in Grant County
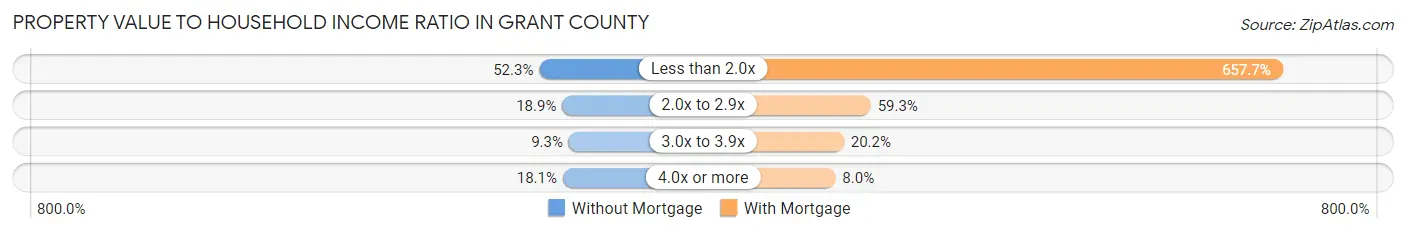
| Value-to-Income Ratio | Without Mortgage | With Mortgage |
| Less than 2.0x | 4,071 (52.3%) | 74,567 (657.7%) |
| 2.0x to 2.9x | 1,470 (18.9%) | 6,717 (59.3%) |
| 3.0x to 3.9x | 724 (9.3%) | 2,287 (20.2%) |
| 4.0x or more | 1,406 (18.1%) | 905 (8.0%) |
| Total | 7,787 (100.0%) | 11,337 (100.0%) |
Real Estate Taxes by Mortgage Status in Grant County
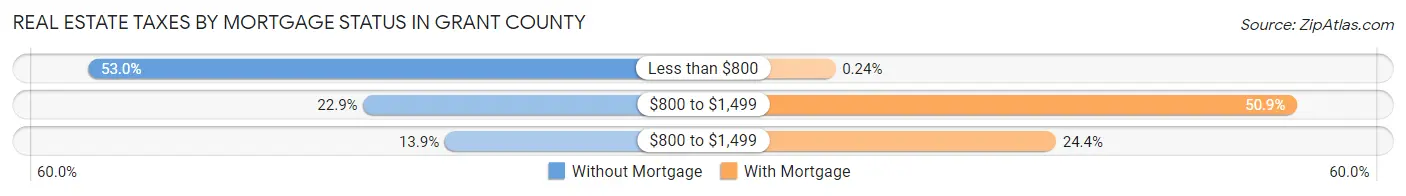
| Property Taxes | Without Mortgage | With Mortgage |
| Less than $800 | 4,130 (53.0%) | 27 (0.2%) |
| $800 to $1,499 | 1,781 (22.9%) | 5,767 (50.9%) |
| $800 to $1,499 | 1,085 (13.9%) | 2,767 (24.4%) |
| Total | 7,787 (100.0%) | 11,337 (100.0%) |
Health & Disability in Grant County
Health Insurance Coverage by Age in Grant County
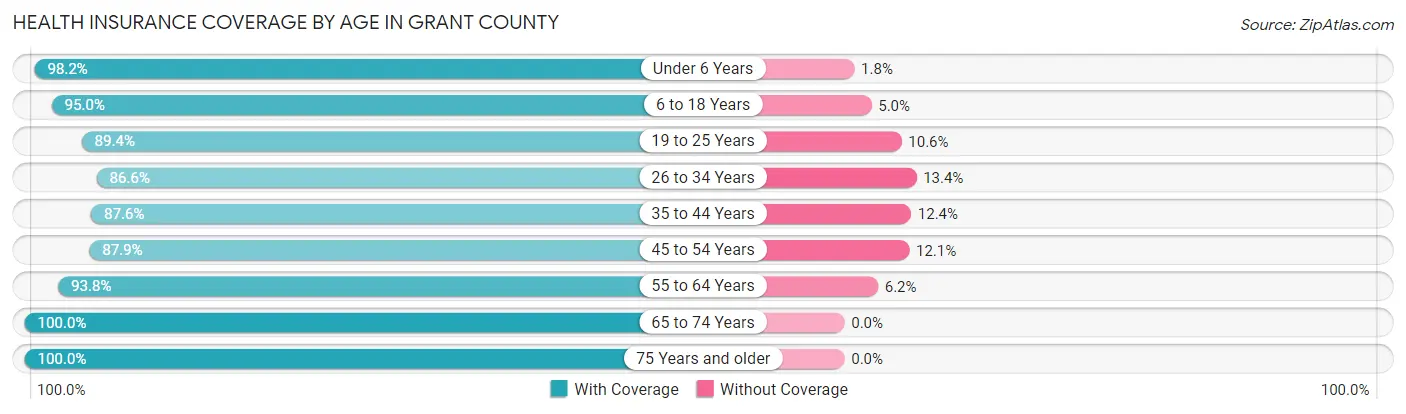
| Age Bracket | With Coverage | Without Coverage |
| Under 6 Years | 4,382 (98.2%) | 82 (1.8%) |
| 6 to 18 Years | 10,286 (95.0%) | 545 (5.0%) |
| 19 to 25 Years | 7,140 (89.4%) | 850 (10.6%) |
| 26 to 34 Years | 5,639 (86.6%) | 873 (13.4%) |
| 35 to 44 Years | 5,958 (87.6%) | 844 (12.4%) |
| 45 to 54 Years | 6,759 (87.9%) | 928 (12.1%) |
| 55 to 64 Years | 8,664 (93.8%) | 577 (6.2%) |
| 65 to 74 Years | 7,140 (100.0%) | 0 (0.0%) |
| 75 Years and older | 5,112 (100.0%) | 0 (0.0%) |
| Total | 61,080 (92.9%) | 4,699 (7.1%) |
Health Insurance Coverage by Citizenship Status in Grant County
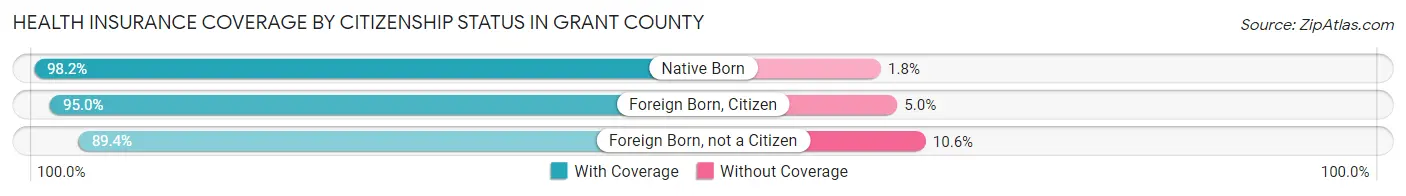
| Citizenship Status | With Coverage | Without Coverage |
| Native Born | 4,382 (98.2%) | 82 (1.8%) |
| Foreign Born, Citizen | 10,286 (95.0%) | 545 (5.0%) |
| Foreign Born, not a Citizen | 7,140 (89.4%) | 850 (10.6%) |
Health Insurance Coverage by Household Income in Grant County
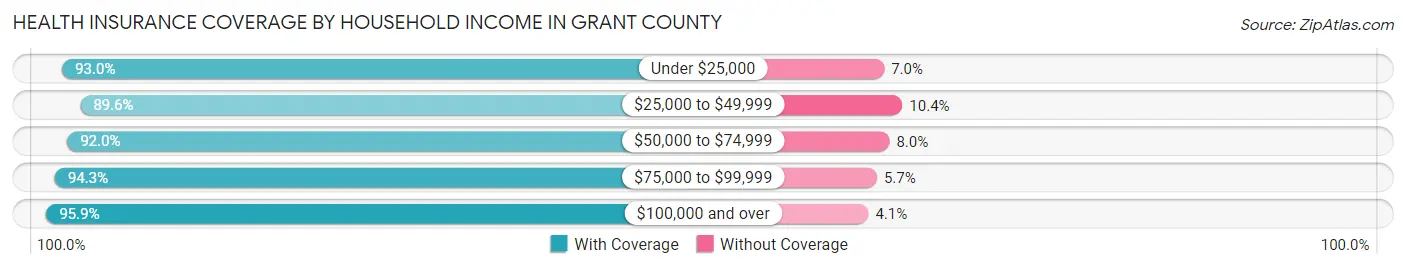
| Household Income | With Coverage | Without Coverage |
| Under $25,000 | 8,774 (93.0%) | 661 (7.0%) |
| $25,000 to $49,999 | 12,766 (89.6%) | 1,485 (10.4%) |
| $50,000 to $74,999 | 10,877 (92.0%) | 945 (8.0%) |
| $75,000 to $99,999 | 8,478 (94.3%) | 509 (5.7%) |
| $100,000 and over | 15,868 (95.9%) | 671 (4.1%) |
Public vs Private Health Insurance Coverage by Age in Grant County
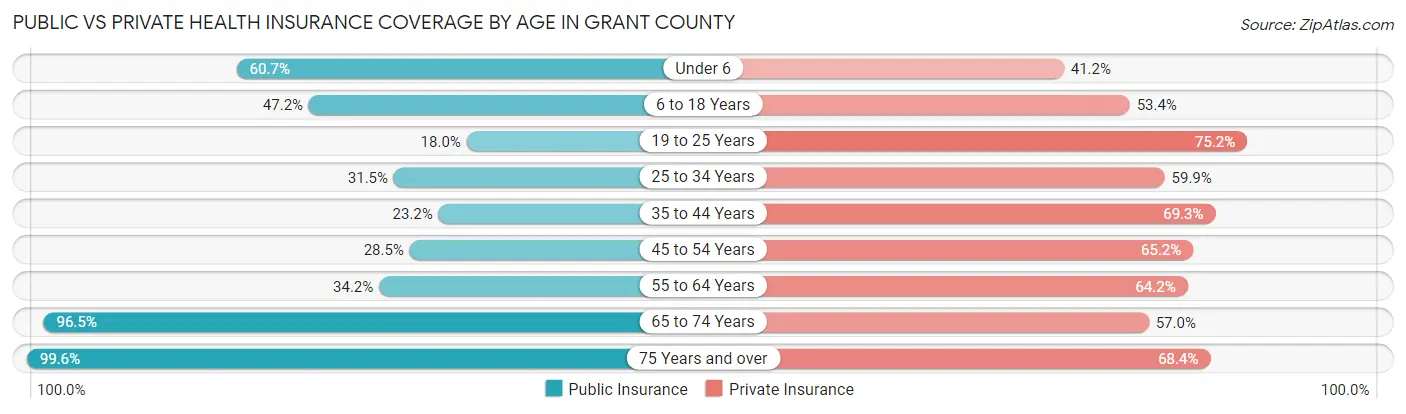
| Age Bracket | Public Insurance | Private Insurance |
| Under 6 | 2,708 (60.7%) | 1,839 (41.2%) |
| 6 to 18 Years | 5,116 (47.2%) | 5,788 (53.4%) |
| 19 to 25 Years | 1,434 (17.9%) | 6,011 (75.2%) |
| 25 to 34 Years | 2,049 (31.5%) | 3,902 (59.9%) |
| 35 to 44 Years | 1,575 (23.2%) | 4,715 (69.3%) |
| 45 to 54 Years | 2,192 (28.5%) | 5,012 (65.2%) |
| 55 to 64 Years | 3,160 (34.2%) | 5,929 (64.2%) |
| 65 to 74 Years | 6,889 (96.5%) | 4,068 (57.0%) |
| 75 Years and over | 5,091 (99.6%) | 3,495 (68.4%) |
| Total | 30,214 (45.9%) | 40,759 (62.0%) |
Disability Status by Sex by Age in Grant County
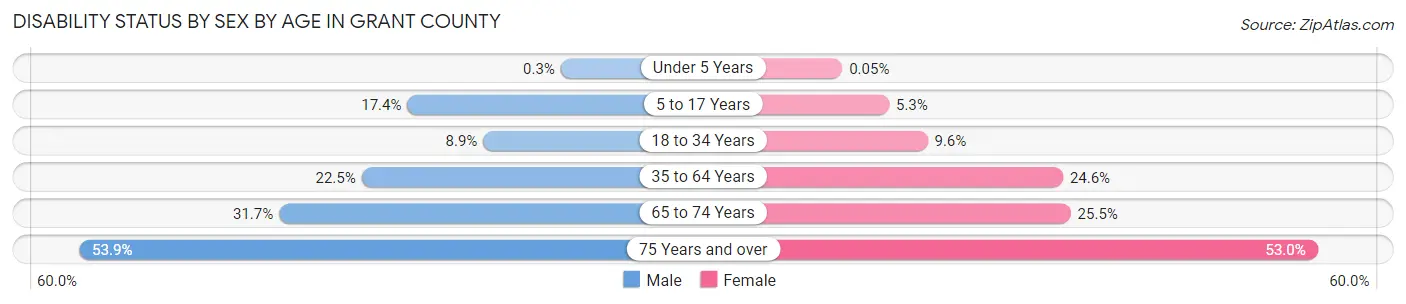
| Age Bracket | Male | Female |
| Under 5 Years | 6 (0.3%) | 1 (0.1%) |
| 5 to 17 Years | 872 (17.4%) | 271 (5.3%) |
| 18 to 34 Years | 660 (8.9%) | 802 (9.6%) |
| 35 to 64 Years | 2,628 (22.5%) | 2,964 (24.6%) |
| 65 to 74 Years | 1,037 (31.7%) | 985 (25.5%) |
| 75 Years and over | 1,127 (53.9%) | 1,601 (53.0%) |
Disability Class by Sex by Age in Grant County
Disability Class: Hearing Difficulty
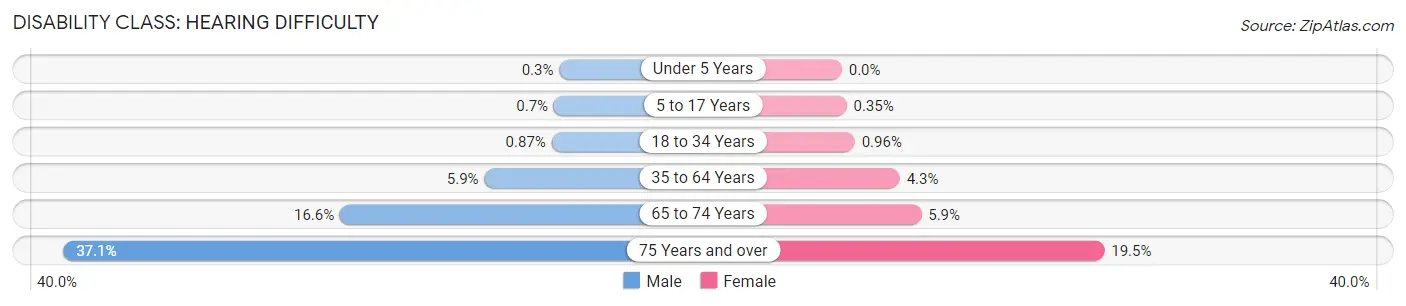
| Age Bracket | Male | Female |
| Under 5 Years | 6 (0.3%) | 0 (0.0%) |
| 5 to 17 Years | 35 (0.7%) | 18 (0.4%) |
| 18 to 34 Years | 64 (0.9%) | 81 (1.0%) |
| 35 to 64 Years | 685 (5.9%) | 517 (4.3%) |
| 65 to 74 Years | 543 (16.6%) | 228 (5.9%) |
| 75 Years and over | 776 (37.1%) | 589 (19.5%) |
Disability Class: Vision Difficulty
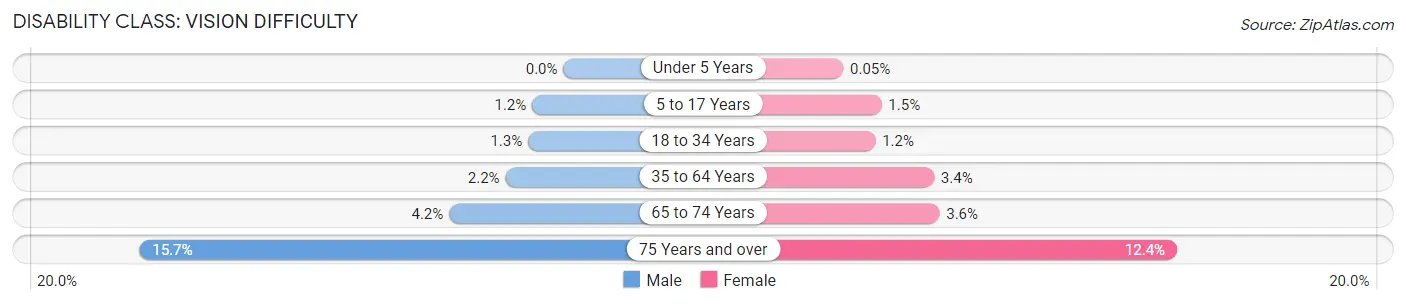
| Age Bracket | Male | Female |
| Under 5 Years | 0 (0.0%) | 1 (0.1%) |
| 5 to 17 Years | 58 (1.2%) | 76 (1.5%) |
| 18 to 34 Years | 97 (1.3%) | 104 (1.2%) |
| 35 to 64 Years | 251 (2.1%) | 412 (3.4%) |
| 65 to 74 Years | 139 (4.2%) | 140 (3.6%) |
| 75 Years and over | 329 (15.7%) | 376 (12.4%) |
Disability Class: Cognitive Difficulty
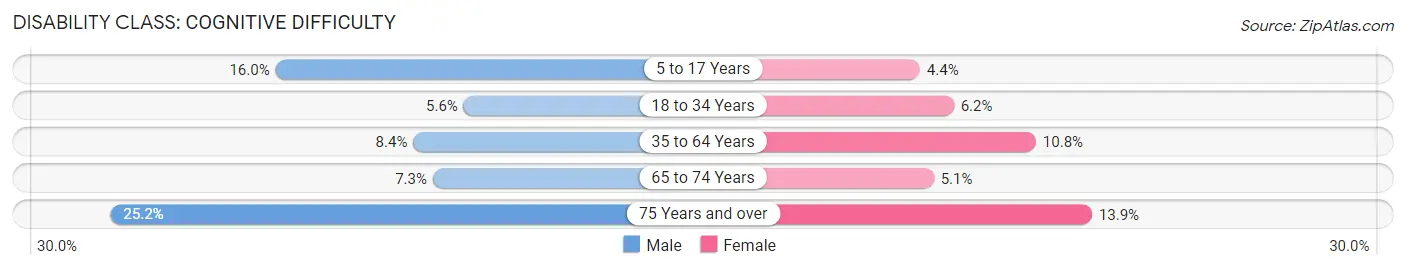
| Age Bracket | Male | Female |
| 5 to 17 Years | 804 (16.0%) | 224 (4.3%) |
| 18 to 34 Years | 410 (5.6%) | 523 (6.2%) |
| 35 to 64 Years | 978 (8.4%) | 1,301 (10.8%) |
| 65 to 74 Years | 238 (7.3%) | 198 (5.1%) |
| 75 Years and over | 527 (25.2%) | 421 (13.9%) |
Disability Class: Ambulatory Difficulty
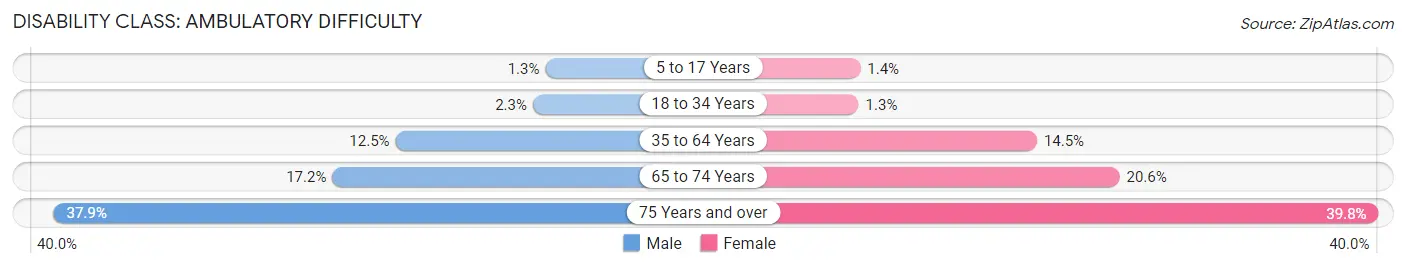
| Age Bracket | Male | Female |
| 5 to 17 Years | 67 (1.3%) | 71 (1.4%) |
| 18 to 34 Years | 168 (2.3%) | 105 (1.3%) |
| 35 to 64 Years | 1,458 (12.5%) | 1,744 (14.5%) |
| 65 to 74 Years | 562 (17.2%) | 797 (20.6%) |
| 75 Years and over | 791 (37.9%) | 1,204 (39.8%) |
Disability Class: Self-Care Difficulty
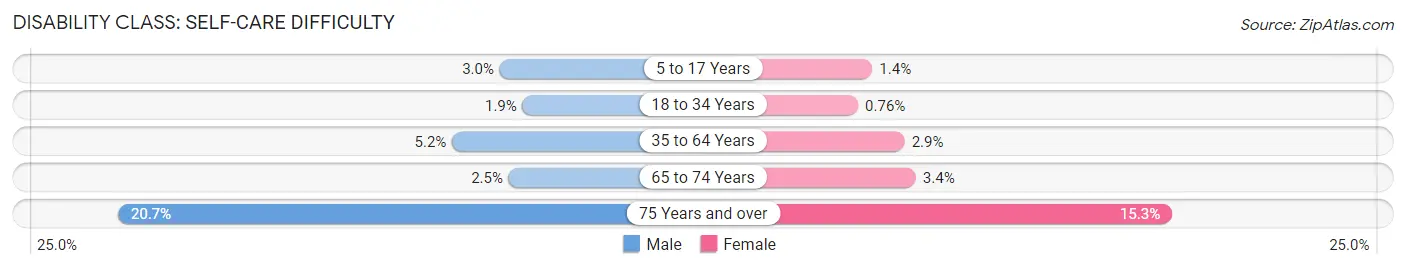
| Age Bracket | Male | Female |
| 5 to 17 Years | 148 (2.9%) | 73 (1.4%) |
| 18 to 34 Years | 140 (1.9%) | 64 (0.8%) |
| 35 to 64 Years | 603 (5.2%) | 352 (2.9%) |
| 65 to 74 Years | 83 (2.5%) | 133 (3.4%) |
| 75 Years and over | 432 (20.7%) | 463 (15.3%) |
Technology Access in Grant County
Computing Device Access in Grant County
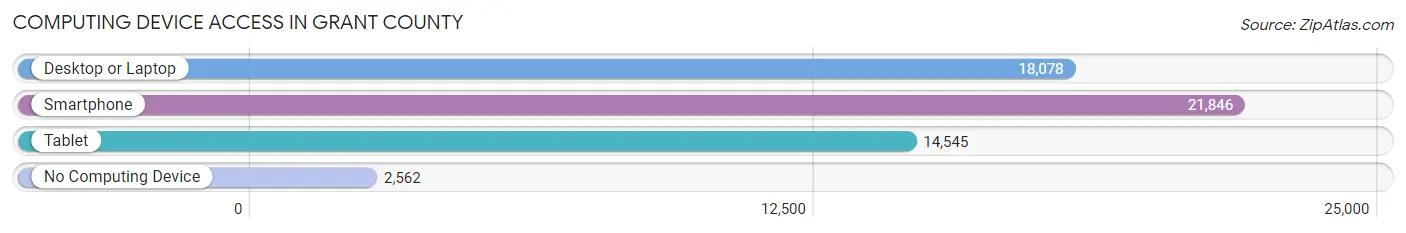
| Device Type | # Households | % Households |
| Desktop or Laptop | 18,078 | 68.1% |
| Smartphone | 21,846 | 82.3% |
| Tablet | 14,545 | 54.8% |
| No Computing Device | 2,562 | 9.7% |
| Total | 26,550 | 100.0% |
Internet Access in Grant County
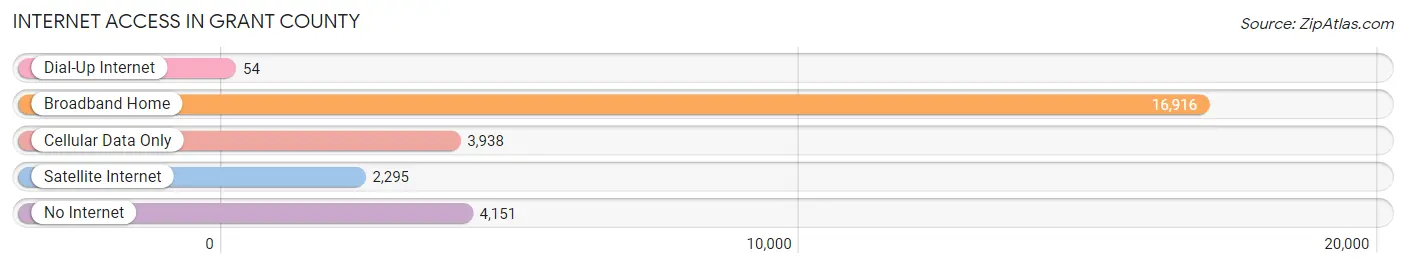
| Internet Type | # Households | % Households |
| Dial-Up Internet | 54 | 0.2% |
| Broadband Home | 16,916 | 63.7% |
| Cellular Data Only | 3,938 | 14.8% |
| Satellite Internet | 2,295 | 8.6% |
| No Internet | 4,151 | 15.6% |
| Total | 26,550 | 100.0% |
Grant County Summary
County History
Grant County, Indiana is located in the east-central part of the state and is part of the Indianapolis metropolitan area. The county was established in 1831 and named after U.S. President Ulysses S. Grant. The county seat is Marion, which is also the largest city in the county.
The area that is now Grant County was originally inhabited by the Miami and Potawatomi Native American tribes. The first European settlers arrived in the area in the early 1800s. The first county seat was established in 1831 in Marion, which was then known as Marion County. The county was renamed Grant County in 1836 in honor of Ulysses S. Grant.
The county experienced rapid growth in the late 1800s and early 1900s due to the development of the railroads and the discovery of natural gas in the area. The county was also home to several manufacturing plants, including the Marion Power Shovel Company, which was the largest employer in the county for many years.
The county has a rich history of agriculture, with corn, soybeans, and wheat being the main crops. The county is also home to several wineries and vineyards, as well as a number of historic sites, including the Grant County Courthouse, the Grant County Museum, and the Grant County Historical Society.
Geography
Grant County is located in east-central Indiana and is part of the Indianapolis metropolitan area. The county is bordered by Madison County to the north, Delaware County to the east, Randolph County to the south, and Howard County to the west. The county covers an area of 441 square miles and has a population of over 70,000 people.
The county is mostly flat, with some rolling hills in the northern and western parts of the county. The county is drained by the Mississinewa River, which flows through the county from north to south. The county is also home to several lakes, including Mississinewa Lake, which is the largest lake in the county.
Economy
Grant County has a diverse economy, with a mix of manufacturing, agriculture, and service industries. The county is home to several large employers, including the Marion Power Shovel Company, which is the largest employer in the county. Other major employers include the Grant County Hospital, the Grant County School Corporation, and the Grant County Sheriff’s Office.
Agriculture is an important part of the county’s economy, with corn, soybeans, and wheat being the main crops. The county is also home to several wineries and vineyards, as well as a number of historic sites, including the Grant County Courthouse, the Grant County Museum, and the Grant County Historical Society.
Demographics
As of the 2010 census, Grant County had a population of 70,061 people. The population is spread out with a median age of 38.7 years. The racial makeup of the county is 90.2% White, 4.3% African American, 0.5% Native American, 1.2% Asian, 0.1% Pacific Islander, 1.7% from other races, and 2.1% from two or more races.
The largest ancestry groups in the county are German (25.3%), Irish (17.2%), English (14.2%), and American (10.2%). The county also has a large Hispanic population, with 11.3% of the population being of Hispanic or Latino origin.
The median household income in Grant County is $48,945, and the median family income is $58,945. The per capita income is $24,945. The unemployment rate in the county is 4.2%.
Conclusion
Grant County, Indiana is located in the east-central part of the state and is part of the Indianapolis metropolitan area. The county was established in 1831 and named after U.S. President Ulysses S. Grant. The county has a diverse economy, with a mix of manufacturing, agriculture, and service industries. The county is mostly flat, with some rolling hills in the northern and western parts of the county. The population of the county is 70,061, with a median age of 38.7 years. The largest ancestry groups in the county are German, Irish, English, and American. The median household income in Grant County is $48,945, and the median family income is $58,945. The per capita income is $24,945. The unemployment rate in the county is 4.2%.
Common Questions
What is the Total Population of Grant County?
Total Population of Grant County is 66,560.
What is the Total Male Population of Grant County?
Total Male Population of Grant County is 31,961.
What is the Total Female Population of Grant County?
Total Female Population of Grant County is 34,599.
What is the Ratio of Males per 100 Females in Grant County?
There are 92.38 Males per 100 Females in Grant County.
What is the Ratio of Females per 100 Males in Grant County?
There are 108.25 Females per 100 Males in Grant County.
What is the Median Population Age in Grant County?
Median Population Age in Grant County is 40.1 Years.
What is the Average Family Size in Grant County
Average Family Size in Grant County is 2.9 People.
What is the Average Household Size in Grant County
Average Household Size in Grant County is 2.3 People.
What is Per Capita Income in Grant County?
Per Capita income in Grant County is $27,725.
What is the Median Family Income in Grant County?
Median Family Income in Grant County is $68,385.
What is the Median Household income in Grant County?
Median Household Income in Grant County is $53,033.
What is Income or Wage Gap in Grant County?
Income or Wage Gap in Grant County is 38.3%.
Women in Grant County earn 61.7 cents for every dollar earned by a man.
What is Family Income Deficit in Grant County?
Family Income Deficit in Grant County is $12,803.
Families that are below poverty line in Grant County earn $12,803 less on average than the poverty threshold level.
What is Inequality or Gini Index in Grant County?
Inequality or Gini Index in Grant County is 0.43.
How Large is the Labor Force in Grant County?
There are 31,930 People in the Labor Forcein in Grant County.
What is the Percentage of People in the Labor Force in Grant County?
58.8% of People are in the Labor Force in Grant County.
What is the Unemployment Rate in Grant County?
Unemployment Rate in Grant County is 7.3%.