Gibson County, IN
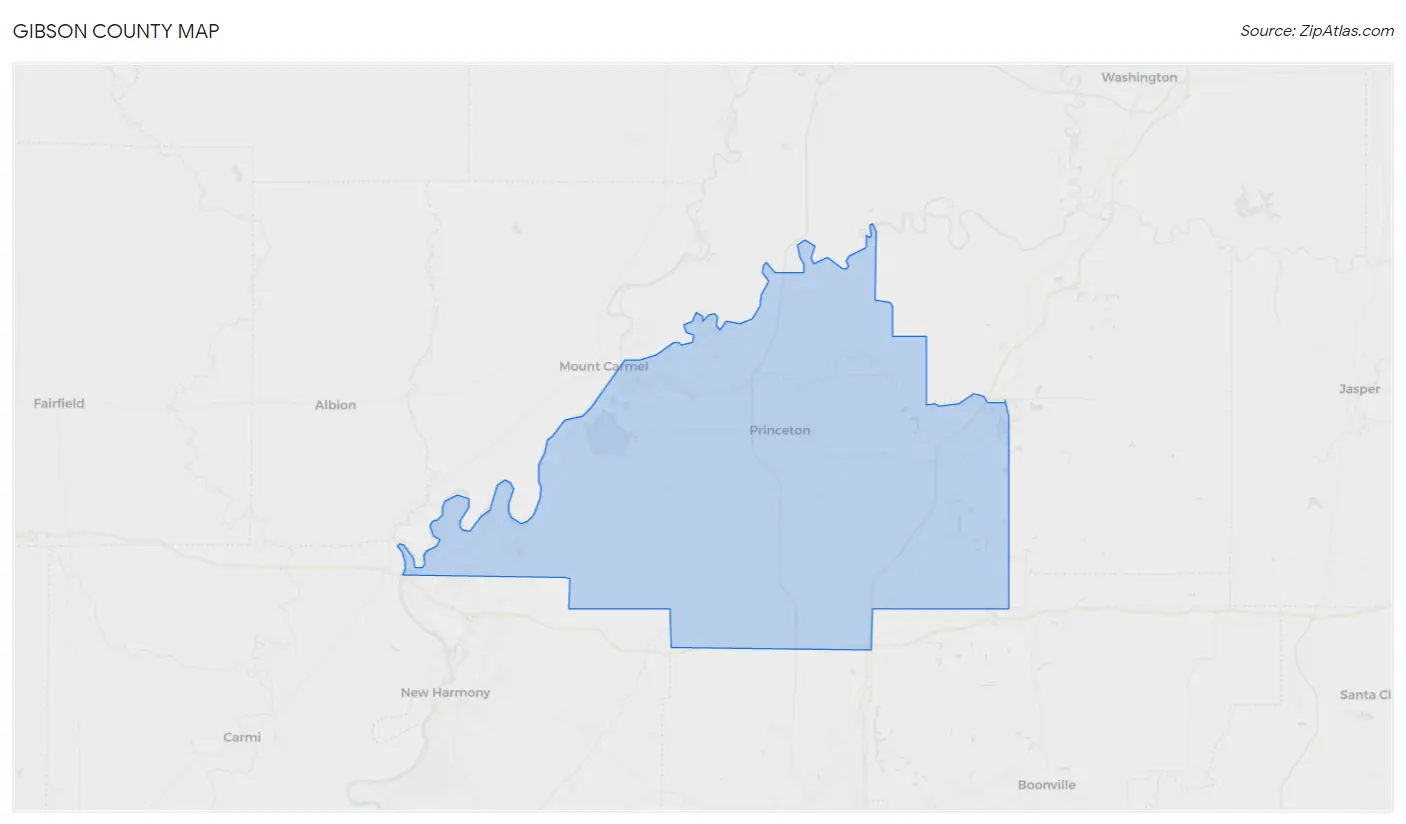
Gibson County Map
Gibson County Overview
33,006
TOTAL POPULATION
16,739
MALE POPULATION
16,267
FEMALE POPULATION
102.90
MALES / 100 FEMALES
97.18
FEMALES / 100 MALES
40.4
MEDIAN AGE
3.0
AVG FAMILY SIZE
2.5
AVG HOUSEHOLD SIZE
$31,602
PER CAPITA INCOME
$81,143
AVG FAMILY INCOME
$64,153
AVG HOUSEHOLD INCOME
40.9%
WAGE / INCOME GAP [ % ]
59.1¢/ $1
WAGE / INCOME GAP [ $ ]
$8,741
FAMILY INCOME DEFICIT
0.40
INEQUALITY / GINI INDEX
16,320
LABOR FORCE [ PEOPLE ]
62.5%
PERCENT IN LABOR FORCE
2.8%
UNEMPLOYMENT RATE
Gibson County Area Codes
Race in Gibson County
The most populous races in Gibson County are White / Caucasian (30,186 | 91.5%), Two or more Races (1,208 | 3.7%), and Some other Race (666 | 2.0%).
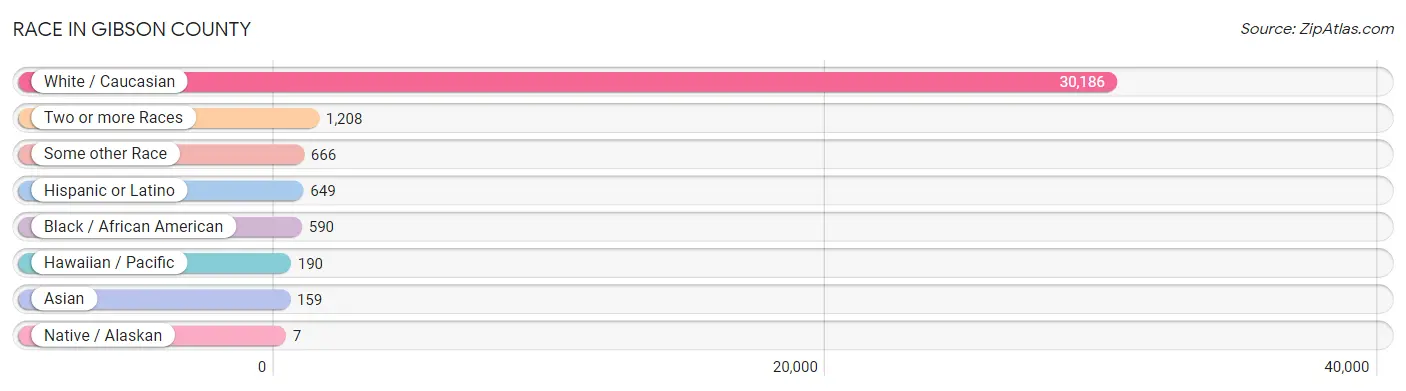
| Race | # Population | % Population |
| Asian | 159 | 0.5% |
| Black / African American | 590 | 1.8% |
| Hawaiian / Pacific | 190 | 0.6% |
| Hispanic or Latino | 649 | 2.0% |
| Native / Alaskan | 7 | 0.0% |
| White / Caucasian | 30,186 | 91.5% |
| Two or more Races | 1,208 | 3.7% |
| Some other Race | 666 | 2.0% |
| Total | 33,006 | 100.0% |
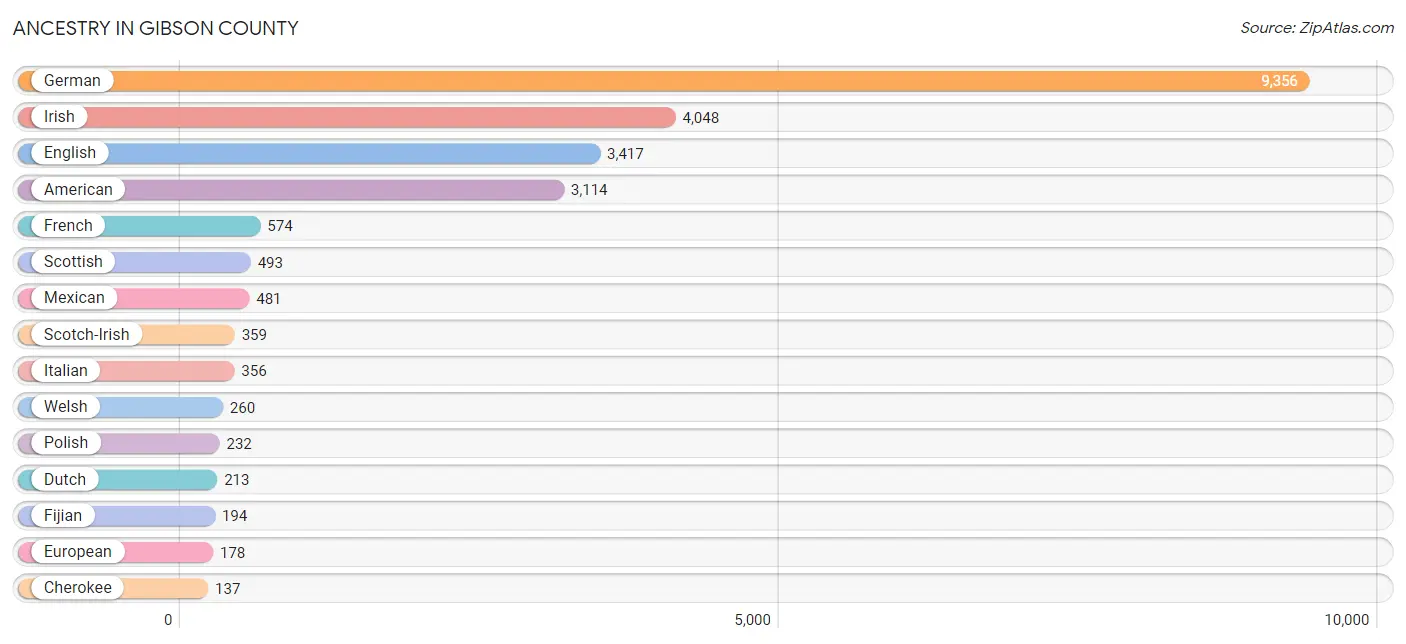
Ancestry in Gibson County
The most populous ancestries reported in Gibson County are German (9,356 | 28.3%), Irish (4,048 | 12.3%), English (3,417 | 10.3%), American (3,114 | 9.4%), and French (574 | 1.7%), together accounting for 62.1% of all Gibson County residents.
| Ancestry | # Population | % Population |
| American | 3,114 | 9.4% |
| Apache | 10 | 0.0% |
| Austrian | 9 | 0.0% |
| Bangladeshi | 24 | 0.1% |
| Belgian | 12 | 0.0% |
| Bhutanese | 36 | 0.1% |
| Blackfeet | 16 | 0.1% |
| Brazilian | 4 | 0.0% |
| British | 92 | 0.3% |
| Burmese | 4 | 0.0% |
| Central American | 45 | 0.1% |
| Cherokee | 137 | 0.4% |
| Chippewa | 16 | 0.1% |
| Choctaw | 6 | 0.0% |
| Colombian | 8 | 0.0% |
| Costa Rican | 9 | 0.0% |
| Cuban | 27 | 0.1% |
| Czech | 17 | 0.1% |
| Czechoslovakian | 14 | 0.0% |
| Danish | 19 | 0.1% |
| Dutch | 213 | 0.6% |
| Eastern European | 37 | 0.1% |
| English | 3,417 | 10.3% |
| European | 178 | 0.5% |
| Fijian | 194 | 0.6% |
| Finnish | 15 | 0.1% |
| French | 574 | 1.7% |
| French American Indian | 1 | 0.0% |
| French Canadian | 14 | 0.0% |
| German | 9,356 | 28.3% |
| Greek | 81 | 0.3% |
| Guatemalan | 2 | 0.0% |
| Haitian | 24 | 0.1% |
| Honduran | 31 | 0.1% |
| Hungarian | 13 | 0.0% |
| Indian (Asian) | 13 | 0.0% |
| Indonesian | 31 | 0.1% |
| Irish | 4,048 | 12.3% |
| Iroquois | 3 | 0.0% |
| Italian | 356 | 1.1% |
| Korean | 81 | 0.3% |
| Laotian | 6 | 0.0% |
| Latvian | 8 | 0.0% |
| Lithuanian | 23 | 0.1% |
| Mexican | 481 | 1.5% |
| Nigerian | 2 | 0.0% |
| Northern European | 12 | 0.0% |
| Norwegian | 91 | 0.3% |
| Pakistani | 16 | 0.1% |
| Polish | 232 | 0.7% |
| Portuguese | 9 | 0.0% |
| Puerto Rican | 71 | 0.2% |
| Russian | 57 | 0.2% |
| Salvadoran | 3 | 0.0% |
| Scandinavian | 41 | 0.1% |
| Scotch-Irish | 359 | 1.1% |
| Scottish | 493 | 1.5% |
| Slovak | 5 | 0.0% |
| South American | 8 | 0.0% |
| Spaniard | 9 | 0.0% |
| Sri Lankan | 6 | 0.0% |
| Subsaharan African | 2 | 0.0% |
| Swedish | 59 | 0.2% |
| Swiss | 85 | 0.3% |
| Thai | 53 | 0.2% |
| Welsh | 260 | 0.8% | View All 66 Rows |
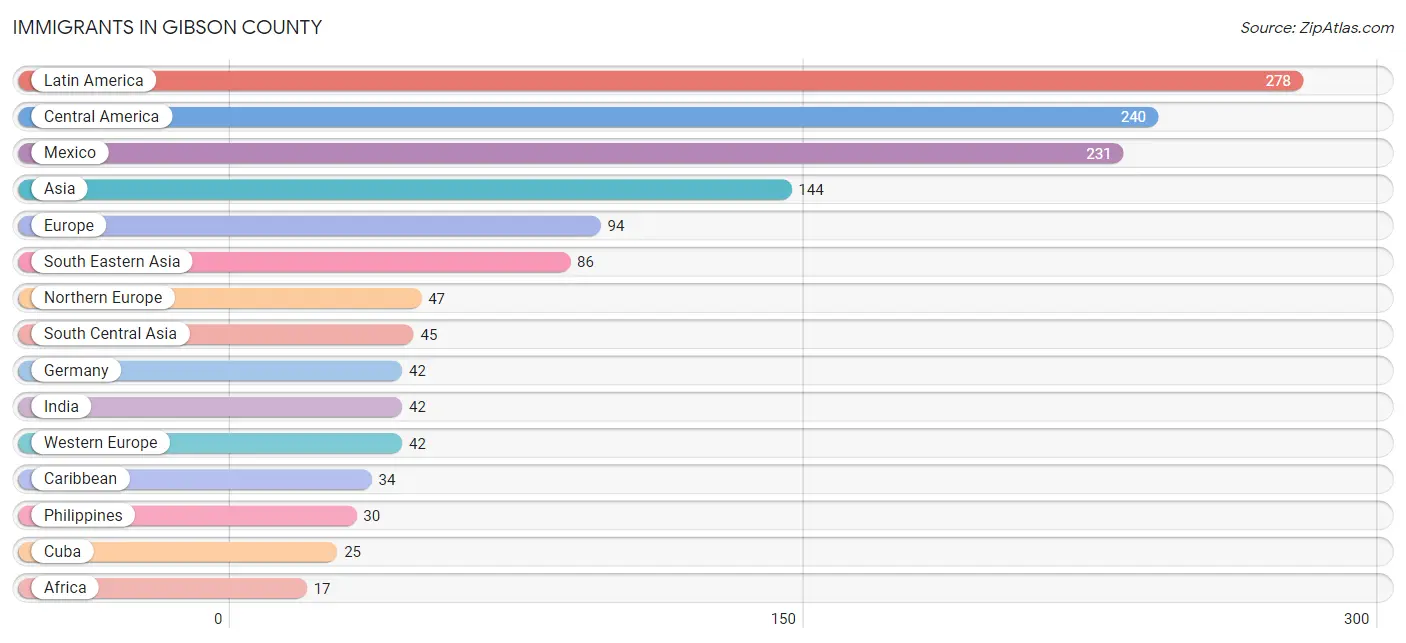
Immigrants in Gibson County
The most numerous immigrant groups reported in Gibson County came from Latin America (278 | 0.8%), Central America (240 | 0.7%), Mexico (231 | 0.7%), Asia (144 | 0.4%), and Europe (94 | 0.3%), together accounting for 3.0% of all Gibson County residents.
| Immigration Origin | # Population | % Population |
| Africa | 17 | 0.1% |
| Asia | 144 | 0.4% |
| Brazil | 4 | 0.0% |
| Canada | 9 | 0.0% |
| Caribbean | 34 | 0.1% |
| Central America | 240 | 0.7% |
| China | 13 | 0.0% |
| Costa Rica | 9 | 0.0% |
| Cuba | 25 | 0.1% |
| Eastern Asia | 13 | 0.0% |
| Eastern Europe | 5 | 0.0% |
| England | 13 | 0.0% |
| Europe | 94 | 0.3% |
| Germany | 42 | 0.1% |
| Ghana | 15 | 0.1% |
| Haiti | 9 | 0.0% |
| India | 42 | 0.1% |
| Indonesia | 2 | 0.0% |
| Laos | 12 | 0.0% |
| Latin America | 278 | 0.8% |
| Mexico | 231 | 0.7% |
| Nigeria | 2 | 0.0% |
| Northern Europe | 47 | 0.1% |
| Pakistan | 3 | 0.0% |
| Philippines | 30 | 0.1% |
| Russia | 5 | 0.0% |
| South America | 4 | 0.0% |
| South Central Asia | 45 | 0.1% |
| South Eastern Asia | 86 | 0.3% |
| Vietnam | 5 | 0.0% |
| Western Africa | 17 | 0.1% |
| Western Europe | 42 | 0.1% | View All 32 Rows |
Sex and Age in Gibson County
Sex and Age in Gibson County
The most populous age groups in Gibson County are 55 to 59 Years (1,257 | 7.5%) for men and 60 to 64 Years (1,154 | 7.1%) for women.
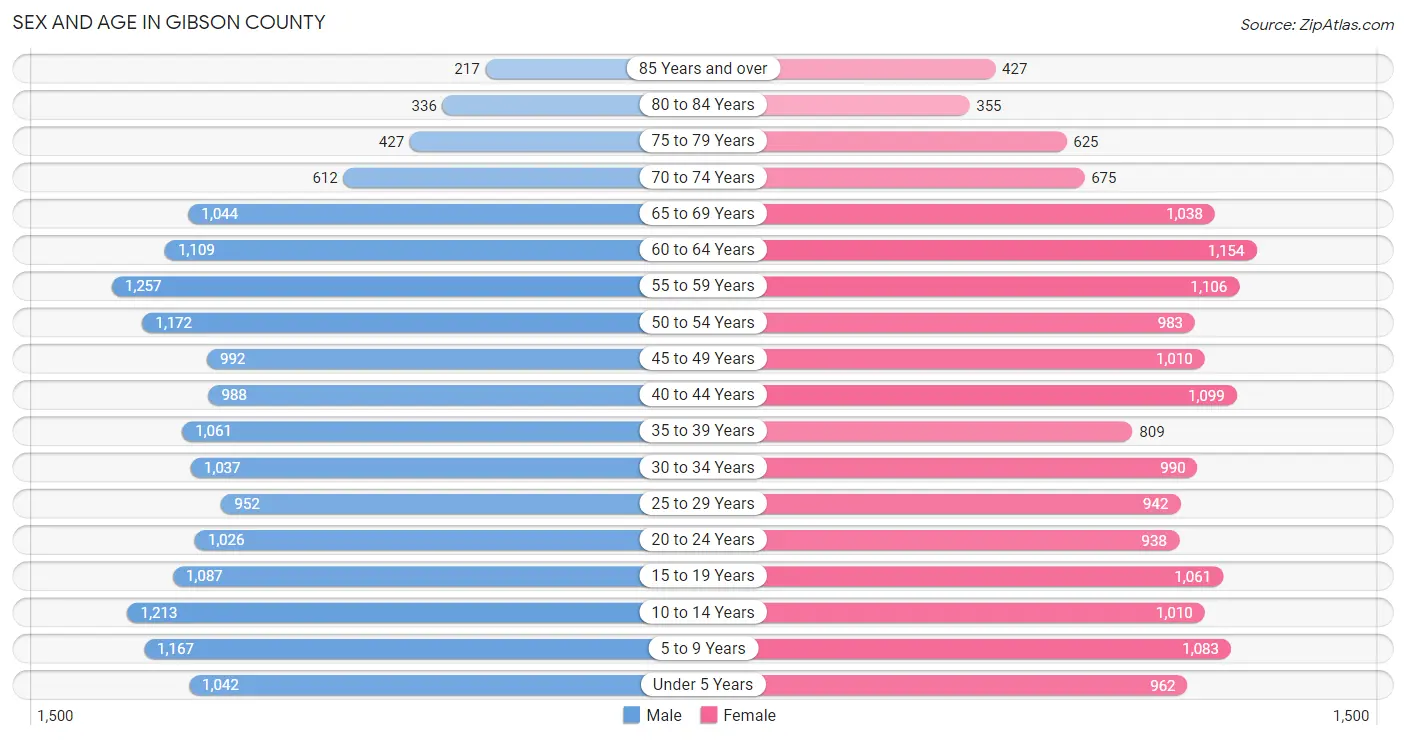
| Age Bracket | Male | Female |
| Under 5 Years | 1,042 (6.2%) | 962 (5.9%) |
| 5 to 9 Years | 1,167 (7.0%) | 1,083 (6.7%) |
| 10 to 14 Years | 1,213 (7.2%) | 1,010 (6.2%) |
| 15 to 19 Years | 1,087 (6.5%) | 1,061 (6.5%) |
| 20 to 24 Years | 1,026 (6.1%) | 938 (5.8%) |
| 25 to 29 Years | 952 (5.7%) | 942 (5.8%) |
| 30 to 34 Years | 1,037 (6.2%) | 990 (6.1%) |
| 35 to 39 Years | 1,061 (6.3%) | 809 (5.0%) |
| 40 to 44 Years | 988 (5.9%) | 1,099 (6.8%) |
| 45 to 49 Years | 992 (5.9%) | 1,010 (6.2%) |
| 50 to 54 Years | 1,172 (7.0%) | 983 (6.0%) |
| 55 to 59 Years | 1,257 (7.5%) | 1,106 (6.8%) |
| 60 to 64 Years | 1,109 (6.6%) | 1,154 (7.1%) |
| 65 to 69 Years | 1,044 (6.2%) | 1,038 (6.4%) |
| 70 to 74 Years | 612 (3.7%) | 675 (4.2%) |
| 75 to 79 Years | 427 (2.5%) | 625 (3.8%) |
| 80 to 84 Years | 336 (2.0%) | 355 (2.2%) |
| 85 Years and over | 217 (1.3%) | 427 (2.6%) |
| Total | 16,739 (100.0%) | 16,267 (100.0%) |
Families and Households in Gibson County
Median Family Size in Gibson County
The median family size in Gibson County is 3.03 persons per family, with married-couple families (6,777 | 77.9%) accounting for the largest median family size of 3.12 persons per family. On the other hand, single male/father families (835 | 9.6%) represent the smallest median family size with 2.55 persons per family.
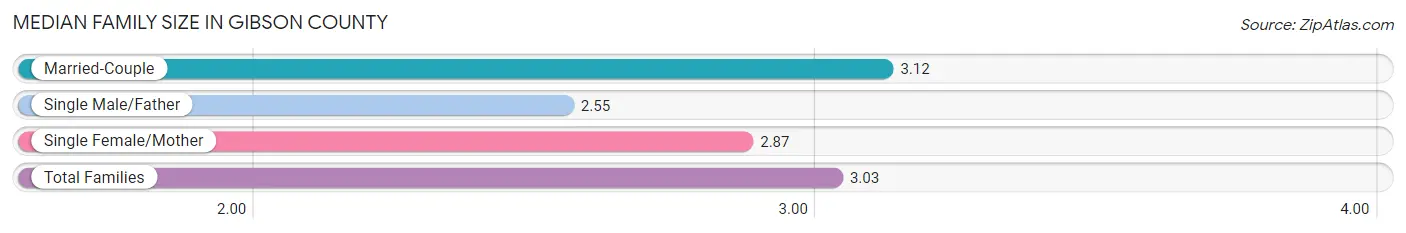
| Family Type | # Families | Family Size |
| Married-Couple | 6,777 (77.9%) | 3.12 |
| Single Male/Father | 835 (9.6%) | 2.55 |
| Single Female/Mother | 1,085 (12.5%) | 2.87 |
| Total Families | 8,697 (100.0%) | 3.03 |
Median Household Size in Gibson County
The median household size in Gibson County is 2.48 persons per household, with married-couple households (6,777 | 52.2%) accounting for the largest median household size of 3.13 persons per household. non-family households (4,281 | 33.0%) represent the smallest median household size with 1.23 persons per household.

| Household Type | # Households | Household Size |
| Married-Couple | 6,777 (52.2%) | 3.13 |
| Single Male/Father | 835 (6.4%) | 2.97 |
| Single Female/Mother | 1,085 (8.4%) | 3.02 |
| Non-family | 4,281 (33.0%) | 1.23 |
| Total Households | 12,978 (100.0%) | 2.48 |
Household Size by Marriage Status in Gibson County
Out of a total of 12,978 households in Gibson County, 8,697 (67.0%) are family households, while 4,281 (33.0%) are nonfamily households. The most numerous type of family households are 2-person households, comprising 4,349, and the most common type of nonfamily households are 1-person households, comprising 3,445.
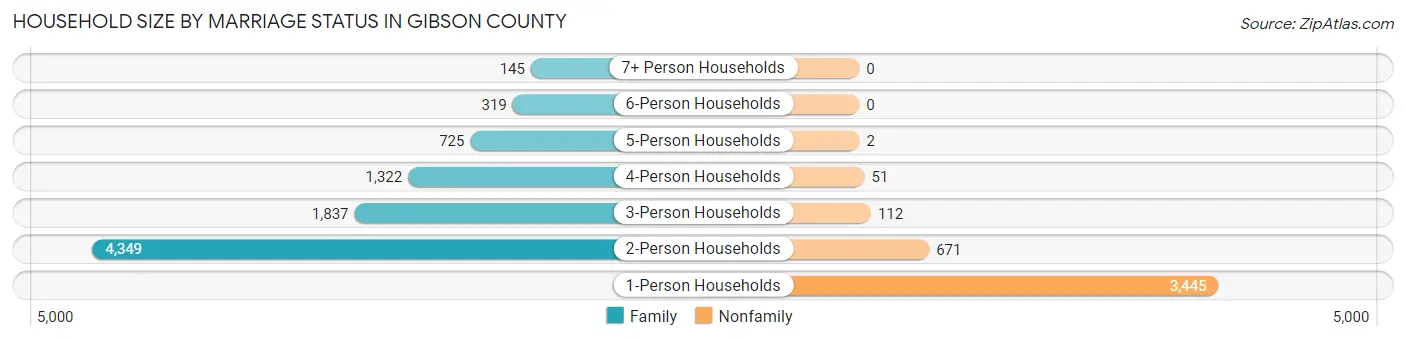
| Household Size | Family Households | Nonfamily Households |
| 1-Person Households | - | 3,445 (26.5%) |
| 2-Person Households | 4,349 (33.5%) | 671 (5.2%) |
| 3-Person Households | 1,837 (14.1%) | 112 (0.9%) |
| 4-Person Households | 1,322 (10.2%) | 51 (0.4%) |
| 5-Person Households | 725 (5.6%) | 2 (0.0%) |
| 6-Person Households | 319 (2.5%) | 0 (0.0%) |
| 7+ Person Households | 145 (1.1%) | 0 (0.0%) |
| Total | 8,697 (67.0%) | 4,281 (33.0%) |
Female Fertility in Gibson County
Fertility by Age in Gibson County
Average fertility rate in Gibson County is 74.0 births per 1,000 women. Women in the age bracket of 20 to 34 years have the highest fertility rate with 144.0 births per 1,000 women. Women in the age bracket of 20 to 34 years acount for 78.6% of all women with births.
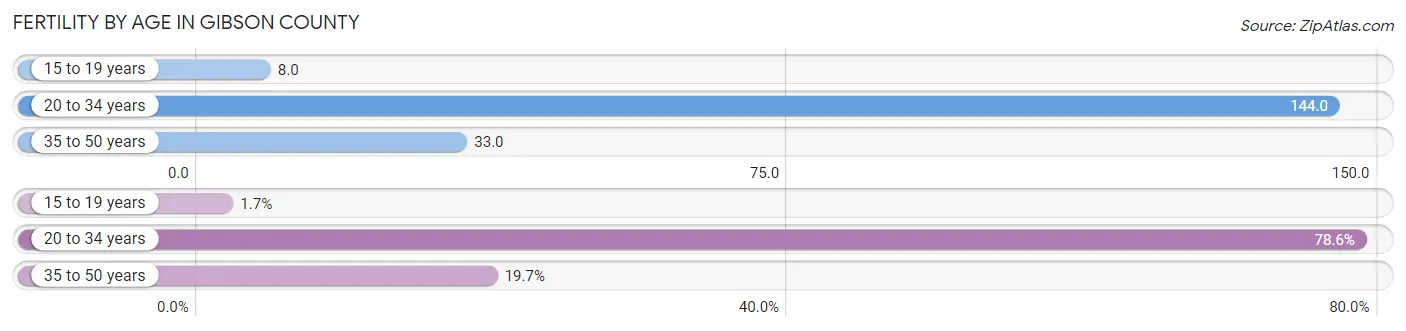
| Age Bracket | Women with Births | Births / 1,000 Women |
| 15 to 19 years | 9 (1.7%) | 8.0 |
| 20 to 34 years | 412 (78.6%) | 144.0 |
| 35 to 50 years | 103 (19.7%) | 33.0 |
| Total | 524 (100.0%) | 74.0 |
Fertility by Age by Marriage Status in Gibson County
67.9% of women with births (524) in Gibson County are married. The highest percentage of unmarried women with births falls into 15 to 19 years age bracket with 100.0% of them unmarried at the time of birth, while the lowest percentage of unmarried women with births belong to 35 to 50 years age bracket with 0.0% of them unmarried.
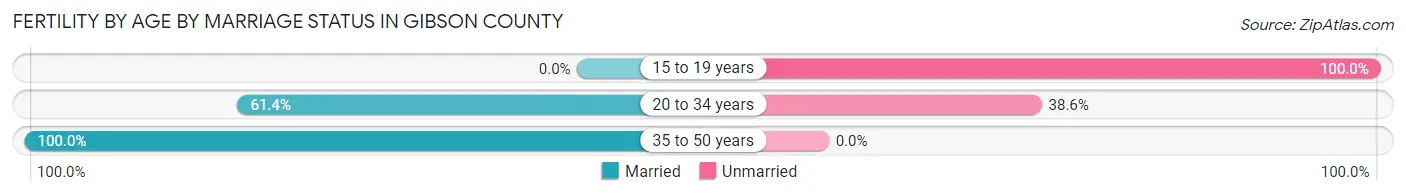
| Age Bracket | Married | Unmarried |
| 15 to 19 years | 0 (0.0%) | 9 (100.0%) |
| 20 to 34 years | 253 (61.4%) | 159 (38.6%) |
| 35 to 50 years | 103 (100.0%) | 0 (0.0%) |
| Total | 356 (67.9%) | 168 (32.1%) |
Fertility by Education in Gibson County
Average fertility rate in Gibson County is 74.0 births per 1,000 women. Women with the education attainment of bachelor's degree have the highest fertility rate of 99.0 births per 1,000 women, while women with the education attainment of less than high school have the lowest fertility at 52.0 births per 1,000 women. Women with the education attainment of college or associate's degree represent 36.1% of all women with births.

| Educational Attainment | Women with Births | Births / 1,000 Women |
| Less than High School | 66 (12.6%) | 52.0 |
| High School Diploma | 117 (22.3%) | 67.0 |
| College or Associate's Degree | 189 (36.1%) | 78.0 |
| Bachelor's Degree | 120 (22.9%) | 99.0 |
| Graduate Degree | 32 (6.1%) | 84.0 |
| Total | 524 (100.0%) | 74.0 |
Fertility by Education by Marriage Status in Gibson County
32.1% of women with births in Gibson County are unmarried. Women with the educational attainment of graduate degree are most likely to be married with 100.0% of them married at childbirth, while women with the educational attainment of less than high school are least likely to be married with 78.8% of them unmarried at childbirth.
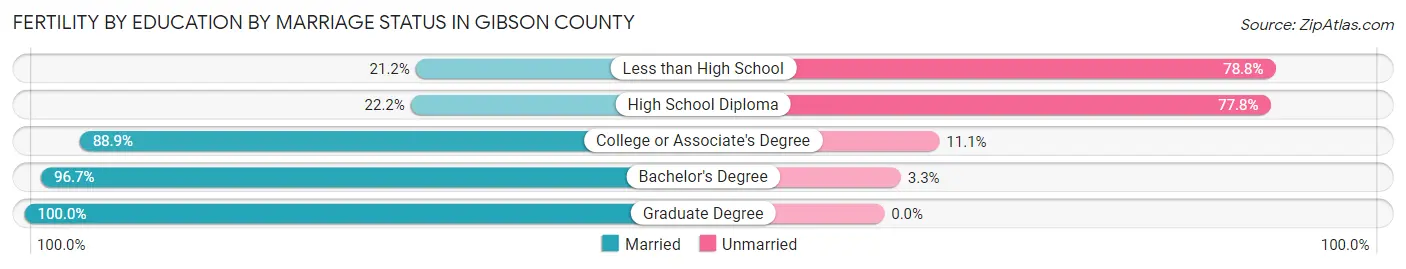
| Educational Attainment | Married | Unmarried |
| Less than High School | 14 (21.2%) | 52 (78.8%) |
| High School Diploma | 26 (22.2%) | 91 (77.8%) |
| College or Associate's Degree | 168 (88.9%) | 21 (11.1%) |
| Bachelor's Degree | 116 (96.7%) | 4 (3.3%) |
| Graduate Degree | 32 (100.0%) | 0 (0.0%) |
| Total | 356 (67.9%) | 168 (32.1%) |
Income in Gibson County
Income Overview in Gibson County
Per Capita Income in Gibson County is $31,602, while median incomes of families and households are $81,143 and $64,153 respectively.
| Characteristic | Number | Measure |
| Per Capita Income | 33,006 | $31,602 |
| Median Family Income | 8,697 | $81,143 |
| Mean Family Income | 8,697 | $91,100 |
| Median Household Income | 12,978 | $64,153 |
| Mean Household Income | 12,978 | $79,276 |
| Income Deficit | 8,697 | $8,741 |
| Wage / Income Gap (%) | 33,006 | 40.86% |
| Wage / Income Gap ($) | 33,006 | 59.14¢ per $1 |
| Gini / Inequality Index | 33,006 | 0.40 |
Earnings by Sex in Gibson County
Average Earnings in Gibson County are $40,073, $49,625 for men and $29,350 for women, a difference of 40.9%.
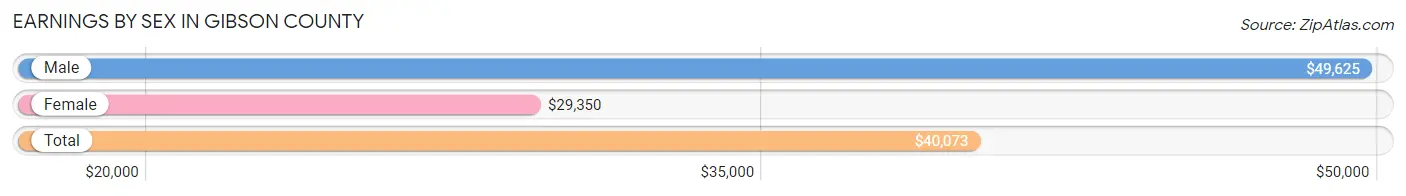
| Sex | Number | Average Earnings |
| Male | 9,694 (56.3%) | $49,625 |
| Female | 7,533 (43.7%) | $29,350 |
| Total | 17,227 (100.0%) | $40,073 |
Earnings by Sex by Income Bracket in Gibson County
The most common earnings brackets in Gibson County are $75,000 to $99,999 for men (1,472 | 15.2%) and $5,000 to $7,499 for women (591 | 7.9%).
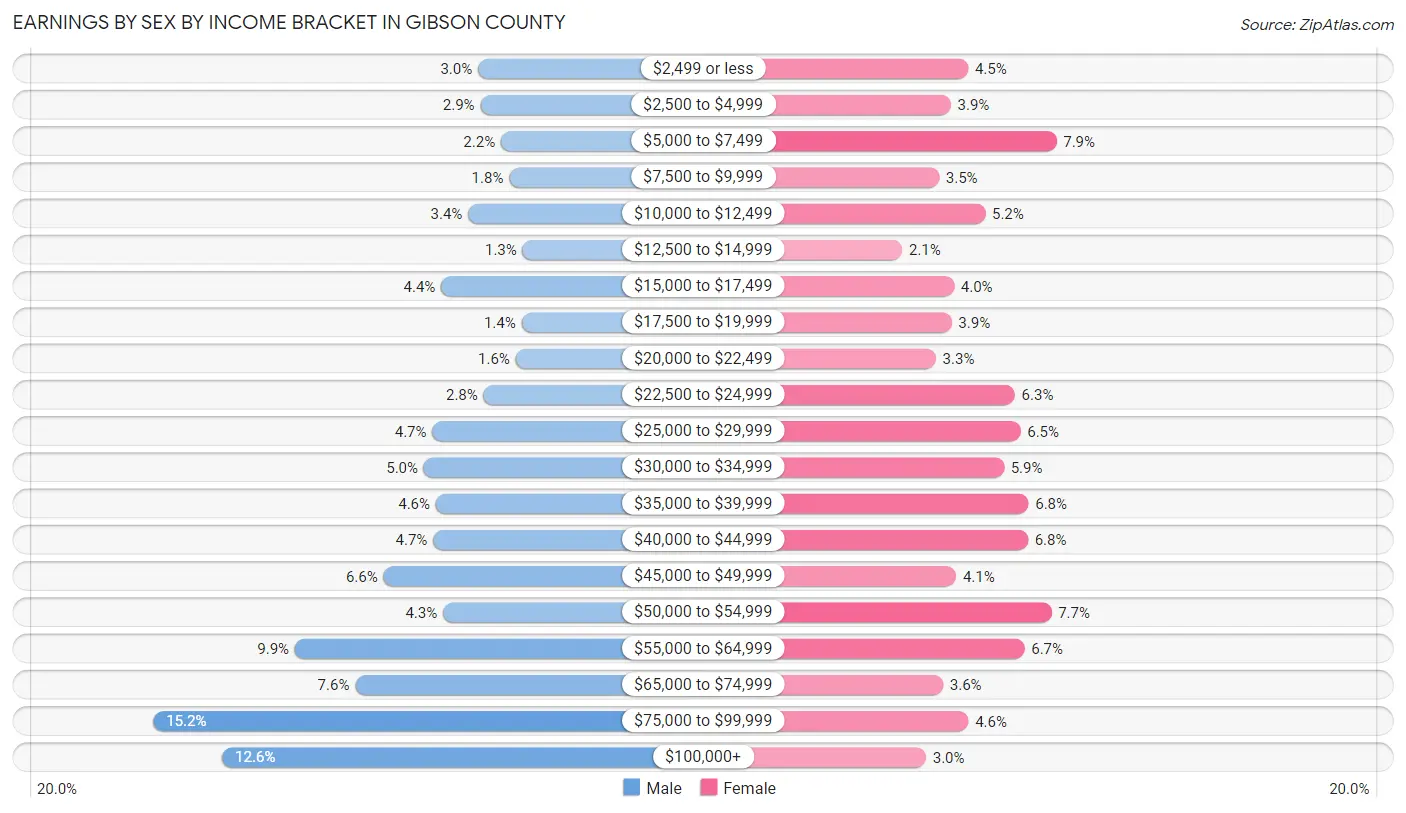
| Income | Male | Female |
| $2,499 or less | 292 (3.0%) | 342 (4.5%) |
| $2,500 to $4,999 | 283 (2.9%) | 293 (3.9%) |
| $5,000 to $7,499 | 208 (2.1%) | 591 (7.9%) |
| $7,500 to $9,999 | 178 (1.8%) | 260 (3.5%) |
| $10,000 to $12,499 | 328 (3.4%) | 390 (5.2%) |
| $12,500 to $14,999 | 130 (1.3%) | 156 (2.1%) |
| $15,000 to $17,499 | 426 (4.4%) | 302 (4.0%) |
| $17,500 to $19,999 | 134 (1.4%) | 295 (3.9%) |
| $20,000 to $22,499 | 155 (1.6%) | 251 (3.3%) |
| $22,500 to $24,999 | 271 (2.8%) | 474 (6.3%) |
| $25,000 to $29,999 | 458 (4.7%) | 490 (6.5%) |
| $30,000 to $34,999 | 489 (5.0%) | 443 (5.9%) |
| $35,000 to $39,999 | 445 (4.6%) | 512 (6.8%) |
| $40,000 to $44,999 | 455 (4.7%) | 511 (6.8%) |
| $45,000 to $49,999 | 635 (6.6%) | 308 (4.1%) |
| $50,000 to $54,999 | 419 (4.3%) | 577 (7.7%) |
| $55,000 to $64,999 | 957 (9.9%) | 501 (6.7%) |
| $65,000 to $74,999 | 738 (7.6%) | 271 (3.6%) |
| $75,000 to $99,999 | 1,472 (15.2%) | 343 (4.5%) |
| $100,000+ | 1,221 (12.6%) | 223 (3.0%) |
| Total | 9,694 (100.0%) | 7,533 (100.0%) |
Earnings by Sex by Educational Attainment in Gibson County
Average earnings in Gibson County are $55,979 for men and $35,316 for women, a difference of 36.9%. Men with an educational attainment of graduate degree enjoy the highest average annual earnings of $86,172, while those with less than high school education earn the least with $23,658. Women with an educational attainment of bachelor's degree earn the most with the average annual earnings of $48,068, while those with less than high school education have the smallest earnings of $22,353.
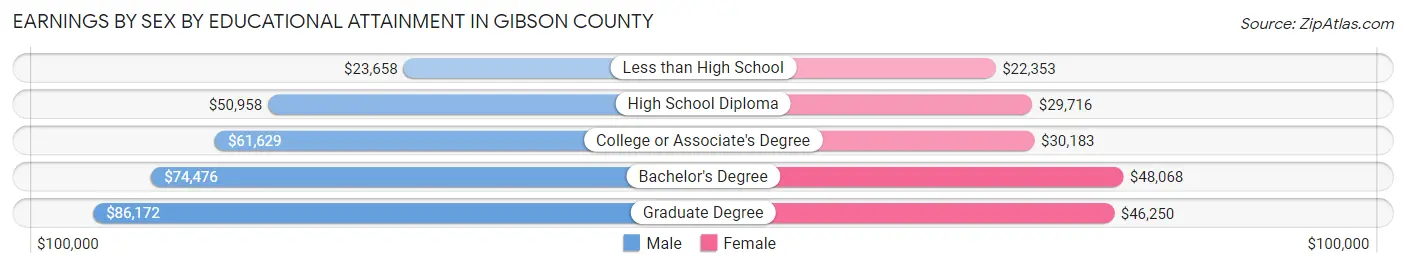
| Educational Attainment | Male Income | Female Income |
| Less than High School | $23,658 | $22,353 |
| High School Diploma | $50,958 | $29,716 |
| College or Associate's Degree | $61,629 | $30,183 |
| Bachelor's Degree | $74,476 | $48,068 |
| Graduate Degree | $86,172 | $46,250 |
| Total | $55,979 | $35,316 |
Family Income in Gibson County
Family Income Brackets in Gibson County
According to the Gibson County family income data, there are 1,948 families falling into the $100,000 to $149,999 income range, which is the most common income bracket and makes up 22.4% of all families. Conversely, the $10,000 to $14,999 income bracket is the least frequent group with only 157 families (1.8%) belonging to this category.
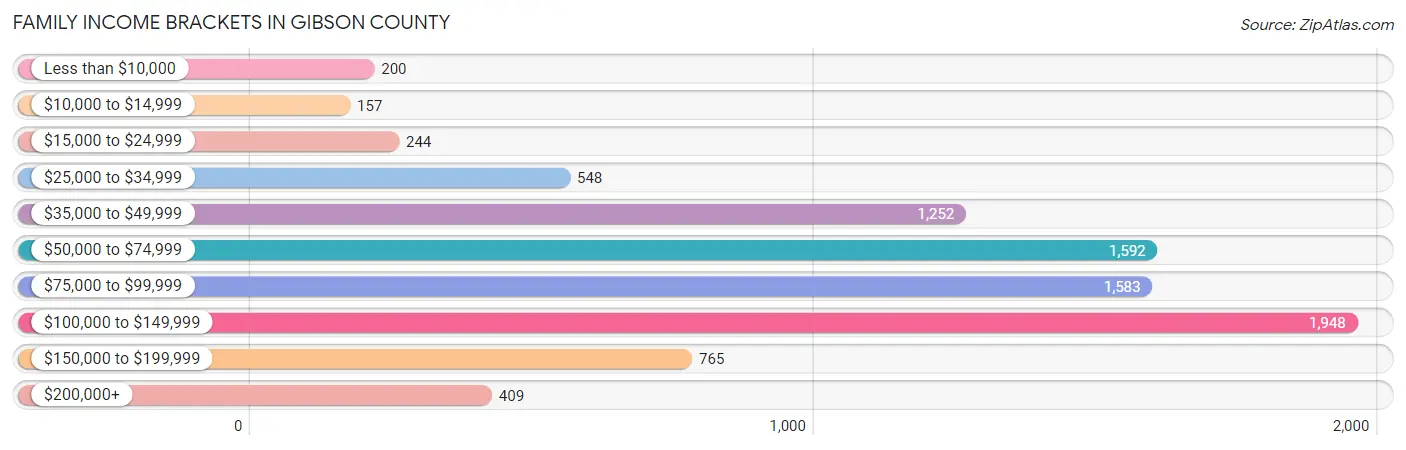
| Income Bracket | # Families | % Families |
| Less than $10,000 | 200 | 2.3% |
| $10,000 to $14,999 | 157 | 1.8% |
| $15,000 to $24,999 | 244 | 2.8% |
| $25,000 to $34,999 | 548 | 6.3% |
| $35,000 to $49,999 | 1,252 | 14.4% |
| $50,000 to $74,999 | 1,592 | 18.3% |
| $75,000 to $99,999 | 1,583 | 18.2% |
| $100,000 to $149,999 | 1,948 | 22.4% |
| $150,000 to $199,999 | 765 | 8.8% |
| $200,000+ | 409 | 4.7% |
Family Income by Famaliy Size in Gibson County
6-person families (301 | 3.5%) account for the highest median family income in Gibson County with $99,345 per family, while 2-person families (4,660 | 53.6%) have the highest median income of $33,587 per family member.
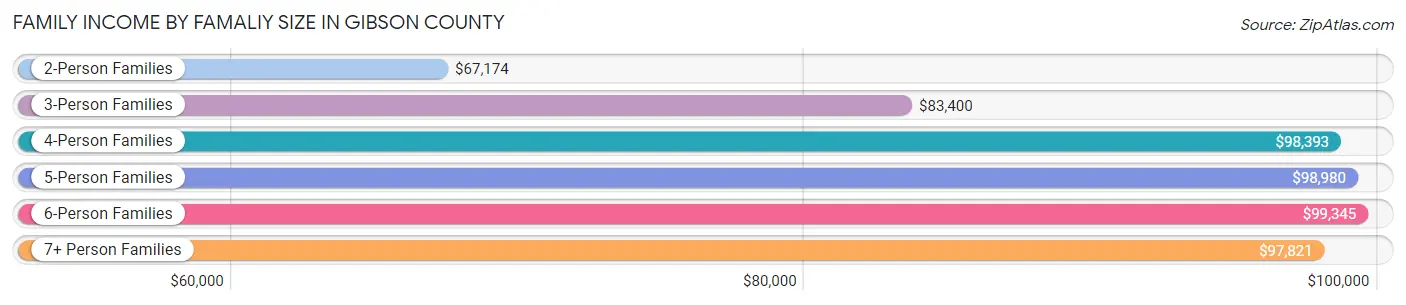
| Income Bracket | # Families | Median Income |
| 2-Person Families | 4,660 (53.6%) | $67,174 |
| 3-Person Families | 1,670 (19.2%) | $83,400 |
| 4-Person Families | 1,260 (14.5%) | $98,393 |
| 5-Person Families | 661 (7.6%) | $98,980 |
| 6-Person Families | 301 (3.5%) | $99,345 |
| 7+ Person Families | 145 (1.7%) | $97,821 |
| Total | 8,697 (100.0%) | $81,143 |
Family Income by Number of Earners in Gibson County
The median family income in Gibson County is $81,143, with families comprising 3+ earners (855) having the highest median family income of $128,406, while families with no earners (1,301) have the lowest median family income of $42,674, accounting for 9.8% and 15.0% of families, respectively.
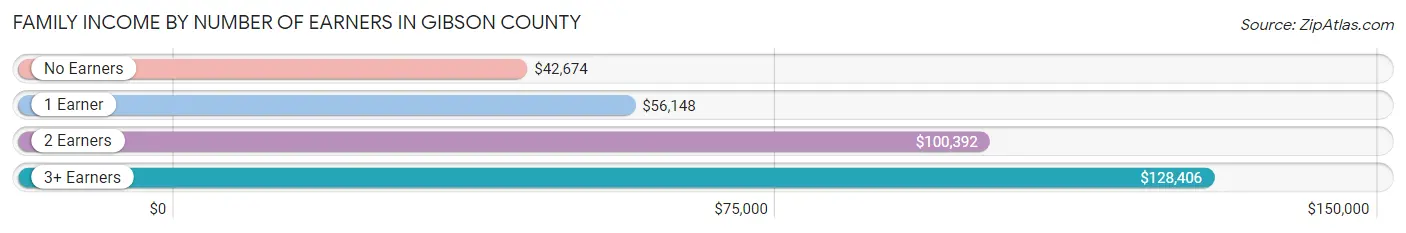
| Number of Earners | # Families | Median Income |
| No Earners | 1,301 (15.0%) | $42,674 |
| 1 Earner | 2,769 (31.8%) | $56,148 |
| 2 Earners | 3,772 (43.4%) | $100,392 |
| 3+ Earners | 855 (9.8%) | $128,406 |
| Total | 8,697 (100.0%) | $81,143 |
Household Income in Gibson County
Household Income Brackets in Gibson County
With 2,492 households falling in the category, the $50,000 to $74,999 income range is the most frequent in Gibson County, accounting for 19.2% of all households. In contrast, only 402 households (3.1%) fall into the $10,000 to $14,999 income bracket, making it the least populous group.
| Income Bracket | # Households | % Households |
| Less than $10,000 | 493 | 3.8% |
| $10,000 to $14,999 | 402 | 3.1% |
| $15,000 to $24,999 | 883 | 6.8% |
| $25,000 to $34,999 | 1,194 | 9.2% |
| $35,000 to $49,999 | 1,830 | 14.1% |
| $50,000 to $74,999 | 2,492 | 19.2% |
| $75,000 to $99,999 | 1,999 | 15.4% |
| $100,000 to $149,999 | 2,401 | 18.5% |
| $150,000 to $199,999 | 805 | 6.2% |
| $200,000+ | 480 | 3.7% |
Household Income by Householder Age in Gibson County
The median household income in Gibson County is $64,153, with the highest median household income of $81,301 found in the 25 to 44 years age bracket for the primary householder. A total of 3,961 households (30.5%) fall into this category. Meanwhile, the 15 to 24 years age bracket for the primary householder has the lowest median household income of $42,097, with 432 households (3.3%) in this group.
| Income Bracket | # Households | Median Income |
| 15 to 24 Years | 432 (3.3%) | $42,097 |
| 25 to 44 Years | 3,961 (30.5%) | $81,301 |
| 45 to 64 Years | 5,081 (39.2%) | $72,325 |
| 65+ Years | 3,504 (27.0%) | $45,431 |
| Total | 12,978 (100.0%) | $64,153 |
Poverty in Gibson County
Income Below Poverty by Sex and Age in Gibson County
With 8.0% poverty level for males and 12.0% for females among the residents of Gibson County, 12 to 14 year old males and 18 to 24 year old females are the most vulnerable to poverty, with 164 males (20.8%) and 349 females (29.3%) in their respective age groups living below the poverty level.
| Age Bracket | Male | Female |
| Under 5 Years | 89 (8.5%) | 41 (4.3%) |
| 5 Years | 11 (3.6%) | 24 (9.8%) |
| 6 to 11 Years | 157 (12.7%) | 195 (13.4%) |
| 12 to 14 Years | 164 (20.8%) | 27 (7.3%) |
| 15 Years | 31 (12.6%) | 30 (17.5%) |
| 16 and 17 Years | 22 (4.6%) | 55 (10.6%) |
| 18 to 24 Years | 192 (14.5%) | 349 (29.3%) |
| 25 to 34 Years | 99 (5.2%) | 248 (12.9%) |
| 35 to 44 Years | 180 (8.9%) | 298 (15.7%) |
| 45 to 54 Years | 134 (6.3%) | 125 (6.3%) |
| 55 to 64 Years | 91 (3.9%) | 186 (8.2%) |
| 65 to 74 Years | 94 (5.8%) | 162 (9.5%) |
| 75 Years and over | 38 (4.4%) | 168 (13.8%) |
| Total | 1,302 (8.0%) | 1,908 (12.0%) |
Income Above Poverty by Sex and Age in Gibson County
According to the poverty statistics in Gibson County, males aged 5 years and females aged under 5 years are the age groups that are most secure financially, with 96.4% of males and 95.7% of females in these age groups living above the poverty line.
| Age Bracket | Male | Female |
| Under 5 Years | 953 (91.5%) | 910 (95.7%) |
| 5 Years | 297 (96.4%) | 220 (90.2%) |
| 6 to 11 Years | 1,080 (87.3%) | 1,262 (86.6%) |
| 12 to 14 Years | 625 (79.2%) | 345 (92.7%) |
| 15 Years | 215 (87.4%) | 141 (82.5%) |
| 16 and 17 Years | 457 (95.4%) | 465 (89.4%) |
| 18 to 24 Years | 1,134 (85.5%) | 842 (70.7%) |
| 25 to 34 Years | 1,811 (94.8%) | 1,677 (87.1%) |
| 35 to 44 Years | 1,847 (91.1%) | 1,606 (84.4%) |
| 45 to 54 Years | 1,980 (93.7%) | 1,863 (93.7%) |
| 55 to 64 Years | 2,269 (96.1%) | 2,070 (91.8%) |
| 65 to 74 Years | 1,516 (94.2%) | 1,536 (90.5%) |
| 75 Years and over | 819 (95.6%) | 1,048 (86.2%) |
| Total | 15,003 (92.0%) | 13,985 (88.0%) |
Income Below Poverty Among Married-Couple Families in Gibson County
The poverty statistics for married-couple families in Gibson County show that 4.3% or 291 of the total 6,777 families live below the poverty line. Families with 5 or more children have the highest poverty rate of 17.8%, comprising of 8 families. On the other hand, families with 1 or 2 children have the lowest poverty rate of 2.5%, which includes 46 families.
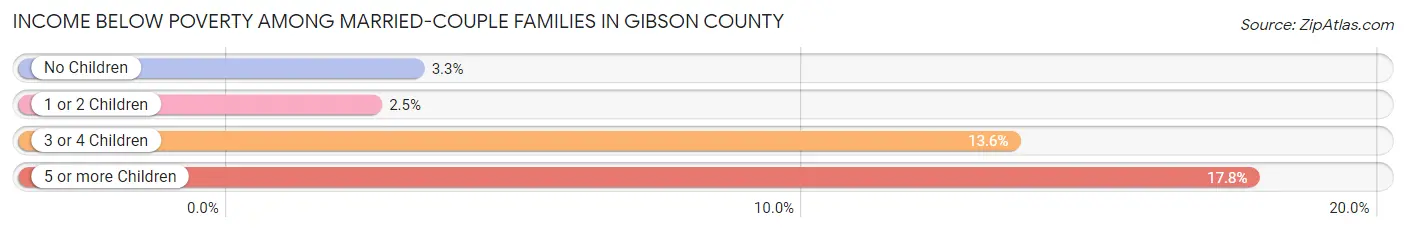
| Children | Above Poverty | Below Poverty |
| No Children | 4,015 (96.8%) | 135 (3.3%) |
| 1 or 2 Children | 1,787 (97.5%) | 46 (2.5%) |
| 3 or 4 Children | 647 (86.4%) | 102 (13.6%) |
| 5 or more Children | 37 (82.2%) | 8 (17.8%) |
| Total | 6,486 (95.7%) | 291 (4.3%) |
Income Below Poverty Among Single-Parent Households in Gibson County
According to the poverty data in Gibson County, 8.5% or 71 single-father households and 21.4% or 232 single-mother households are living below the poverty line. Among single-father households, those with 1 or 2 children have the highest poverty rate, with 68 households (20.0%) experiencing poverty. Likewise, among single-mother households, those with 1 or 2 children have the highest poverty rate, with 152 households (25.9%) falling below the poverty line.
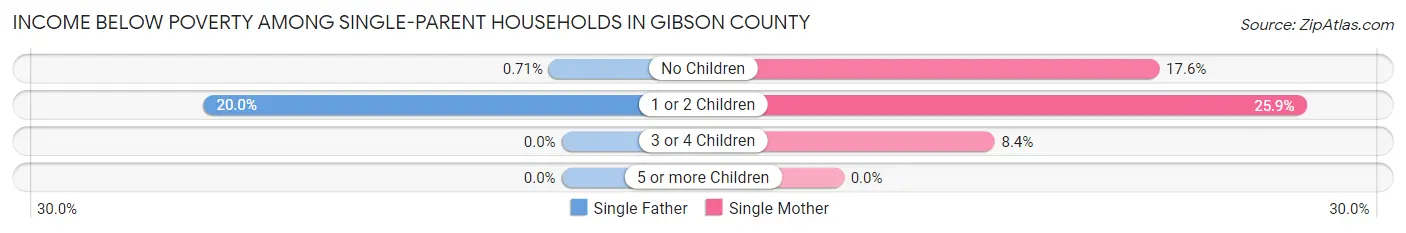
| Children | Single Father | Single Mother |
| No Children | 3 (0.7%) | 73 (17.6%) |
| 1 or 2 Children | 68 (20.0%) | 152 (25.9%) |
| 3 or 4 Children | 0 (0.0%) | 7 (8.4%) |
| 5 or more Children | 0 (0.0%) | 0 (0.0%) |
| Total | 71 (8.5%) | 232 (21.4%) |
Income Below Poverty Among Married-Couple vs Single-Parent Households in Gibson County
The poverty data for Gibson County shows that 291 of the married-couple family households (4.3%) and 303 of the single-parent households (15.8%) are living below the poverty level. Within the married-couple family households, those with 5 or more children have the highest poverty rate, with 8 households (17.8%) falling below the poverty line. Among the single-parent households, those with 1 or 2 children have the highest poverty rate, with 220 household (23.7%) living below poverty.
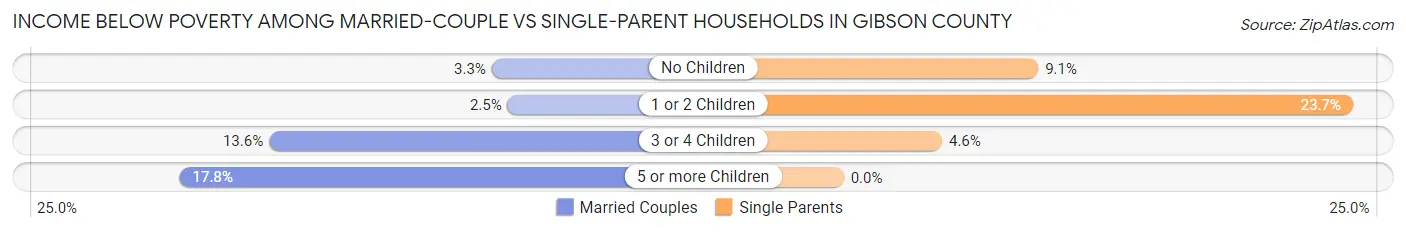
| Children | Married-Couple Families | Single-Parent Households |
| No Children | 135 (3.3%) | 76 (9.1%) |
| 1 or 2 Children | 46 (2.5%) | 220 (23.7%) |
| 3 or 4 Children | 102 (13.6%) | 7 (4.6%) |
| 5 or more Children | 8 (17.8%) | 0 (0.0%) |
| Total | 291 (4.3%) | 303 (15.8%) |
Employment Characteristics in Gibson County
Employment by Class of Employer in Gibson County
Among the 15,614 employed individuals in Gibson County, private company employees (11,862 | 76.0%), not-for-profit organizations (1,403 | 9.0%), and local government employees (947 | 6.1%) make up the most common classes of employment.
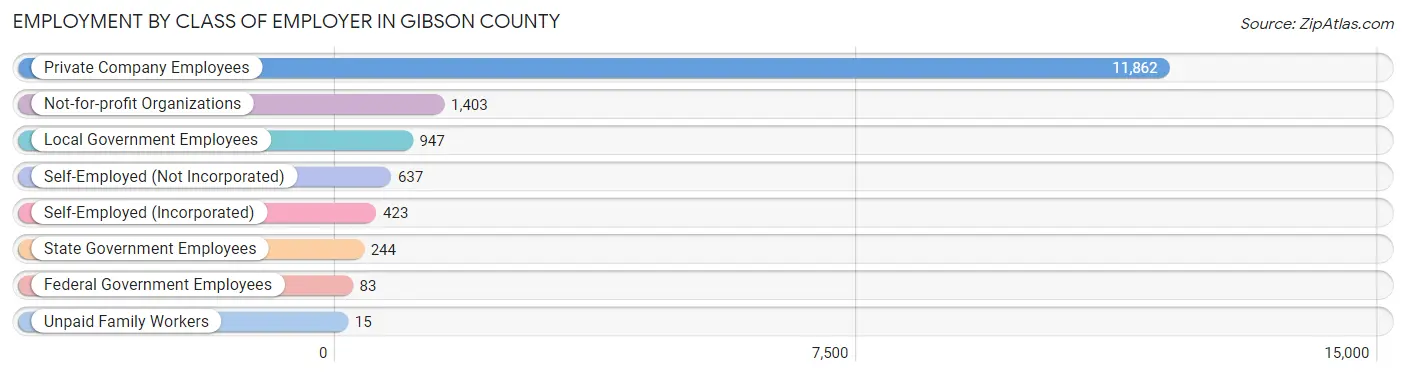
| Employer Class | # Employees | % Employees |
| Private Company Employees | 11,862 | 76.0% |
| Self-Employed (Incorporated) | 423 | 2.7% |
| Self-Employed (Not Incorporated) | 637 | 4.1% |
| Not-for-profit Organizations | 1,403 | 9.0% |
| Local Government Employees | 947 | 6.1% |
| State Government Employees | 244 | 1.6% |
| Federal Government Employees | 83 | 0.5% |
| Unpaid Family Workers | 15 | 0.1% |
| Total | 15,614 | 100.0% |
Employment Status by Age in Gibson County
According to the labor force statistics for Gibson County, out of the total population over 16 years of age (26,112), 62.5% or 16,320 individuals are in the labor force, with 2.8% or 457 of them unemployed. The age group with the highest labor force participation rate is 30 to 34 years, with 87.0% or 1,763 individuals in the labor force. Within the labor force, the 16 to 19 years age range has the highest percentage of unemployed individuals, with 6.1% or 51 of them being unemployed.
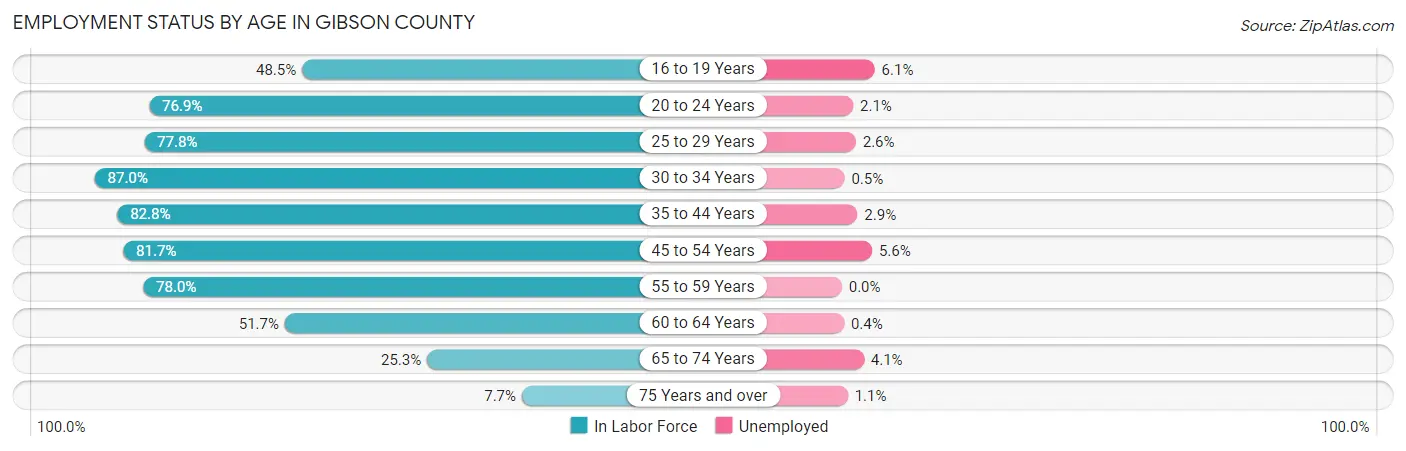
| Age Bracket | In Labor Force | Unemployed |
| 16 to 19 Years | 840 (48.5%) | 51 (6.1%) |
| 20 to 24 Years | 1,510 (76.9%) | 32 (2.1%) |
| 25 to 29 Years | 1,474 (77.8%) | 38 (2.6%) |
| 30 to 34 Years | 1,763 (87.0%) | 9 (0.5%) |
| 35 to 44 Years | 3,276 (82.8%) | 95 (2.9%) |
| 45 to 54 Years | 3,396 (81.7%) | 190 (5.6%) |
| 55 to 59 Years | 1,843 (78.0%) | 0 (0.0%) |
| 60 to 64 Years | 1,170 (51.7%) | 5 (0.4%) |
| 65 to 74 Years | 852 (25.3%) | 35 (4.1%) |
| 75 Years and over | 184 (7.7%) | 2 (1.1%) |
| Total | 16,320 (62.5%) | 457 (2.8%) |
Employment Status by Educational Attainment in Gibson County
According to labor force statistics for Gibson County, 77.6% of individuals (12,929) out of the total population between 25 and 64 years of age (16,661) are in the labor force, with 2.6% or 336 of them being unemployed. The group with the highest labor force participation rate are those with the educational attainment of bachelor's degree or higher, with 90.7% or 2,892 individuals in the labor force. Within the labor force, individuals with high school diploma education have the highest percentage of unemployment, with 2.9% or 141 of them being unemployed.
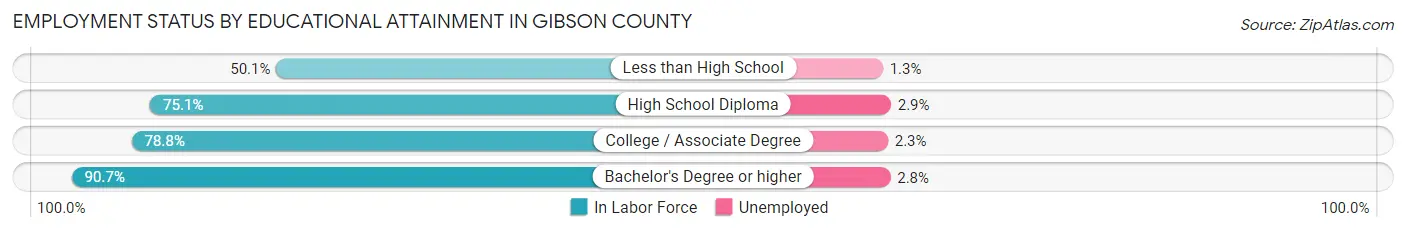
| Educational Attainment | In Labor Force | Unemployed |
| Less than High School | 602 (50.1%) | 16 (1.3%) |
| High School Diploma | 4,845 (75.1%) | 187 (2.9%) |
| College / Associate Degree | 4,586 (78.8%) | 134 (2.3%) |
| Bachelor's Degree or higher | 2,892 (90.7%) | 89 (2.8%) |
| Total | 12,929 (77.6%) | 433 (2.6%) |
Employment Occupations by Sex in Gibson County
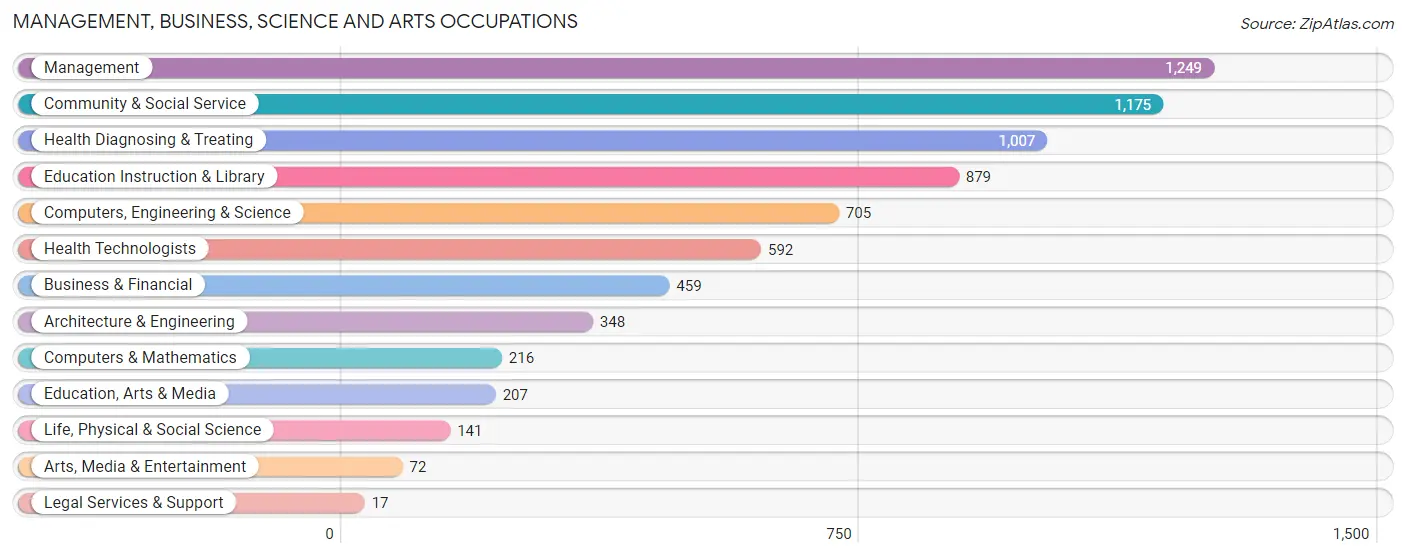
Management, Business, Science and Arts Occupations
The most common Management, Business, Science and Arts occupations in Gibson County are Management (1,249 | 7.9%), Community & Social Service (1,175 | 7.4%), Health Diagnosing & Treating (1,007 | 6.4%), Education Instruction & Library (879 | 5.5%), and Computers, Engineering & Science (705 | 4.4%).
Management, Business, Science and Arts Occupations by Sex
Within the Management, Business, Science and Arts occupations in Gibson County, the most male-oriented occupations are Legal Services & Support (94.1%), Architecture & Engineering (87.6%), and Computers, Engineering & Science (68.6%), while the most female-oriented occupations are Health Technologists (89.4%), Health Diagnosing & Treating (89.3%), and Education Instruction & Library (78.8%).
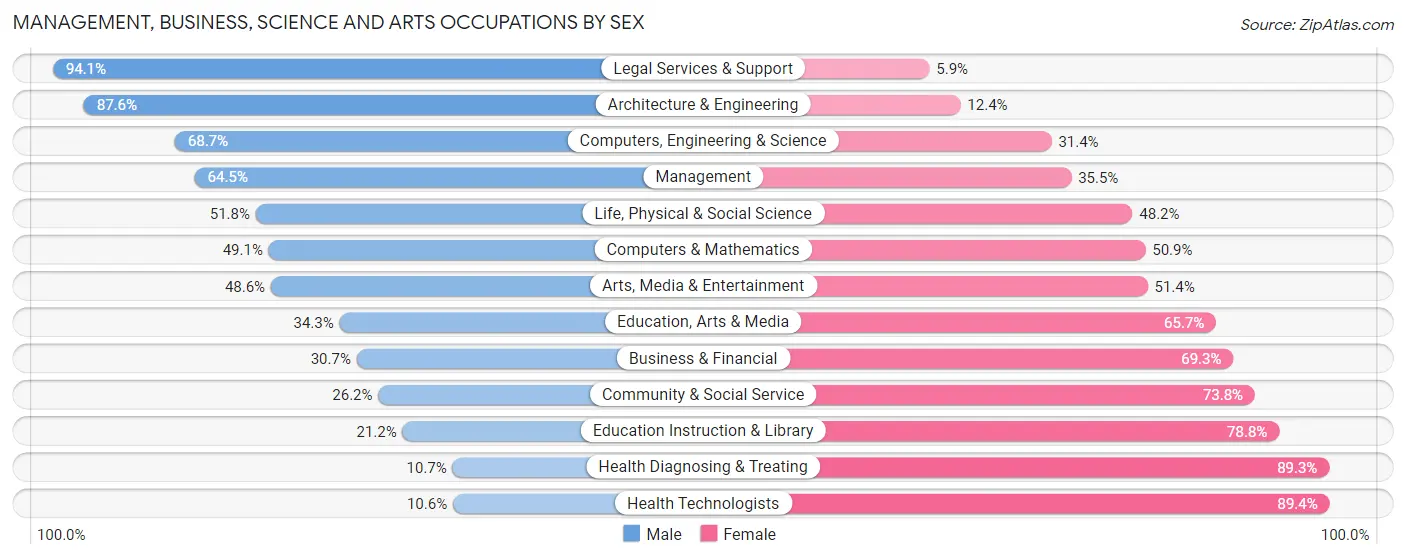
| Occupation | Male | Female |
| Management | 806 (64.5%) | 443 (35.5%) |
| Business & Financial | 141 (30.7%) | 318 (69.3%) |
| Computers, Engineering & Science | 484 (68.6%) | 221 (31.4%) |
| Computers & Mathematics | 106 (49.1%) | 110 (50.9%) |
| Architecture & Engineering | 305 (87.6%) | 43 (12.4%) |
| Life, Physical & Social Science | 73 (51.8%) | 68 (48.2%) |
| Community & Social Service | 308 (26.2%) | 867 (73.8%) |
| Education, Arts & Media | 71 (34.3%) | 136 (65.7%) |
| Legal Services & Support | 16 (94.1%) | 1 (5.9%) |
| Education Instruction & Library | 186 (21.2%) | 693 (78.8%) |
| Arts, Media & Entertainment | 35 (48.6%) | 37 (51.4%) |
| Health Diagnosing & Treating | 108 (10.7%) | 899 (89.3%) |
| Health Technologists | 63 (10.6%) | 529 (89.4%) |
| Total (Category) | 1,847 (40.2%) | 2,748 (59.8%) |
| Total (Overall) | 8,991 (56.7%) | 6,868 (43.3%) |
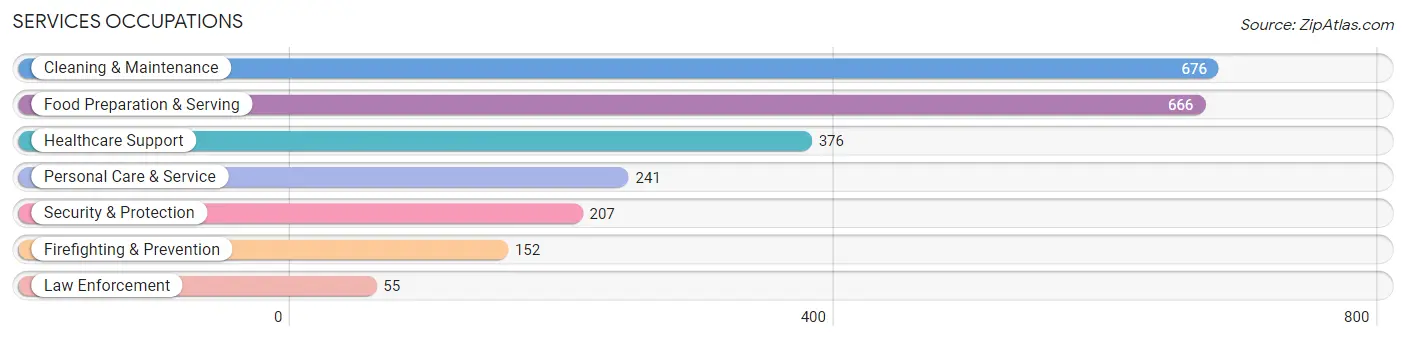
Services Occupations
The most common Services occupations in Gibson County are Cleaning & Maintenance (676 | 4.3%), Food Preparation & Serving (666 | 4.2%), Healthcare Support (376 | 2.4%), Personal Care & Service (241 | 1.5%), and Security & Protection (207 | 1.3%).
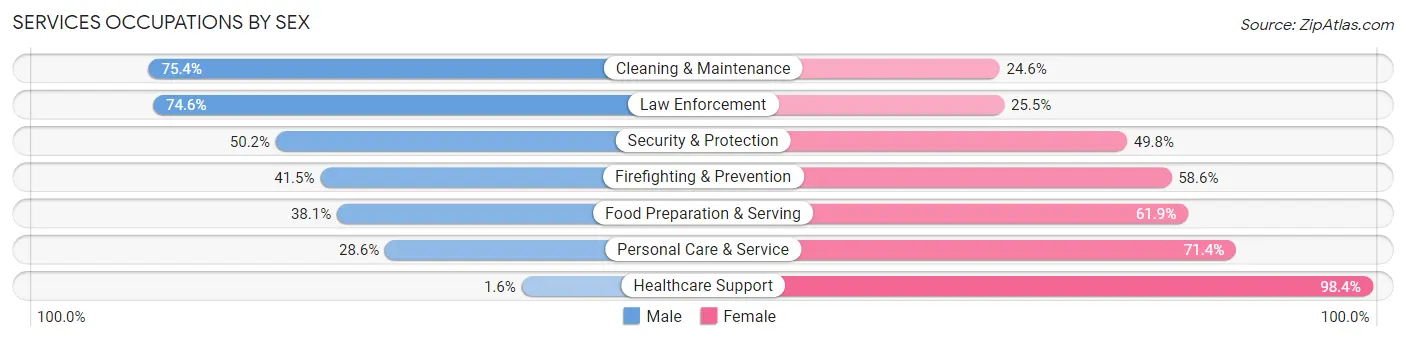
Services Occupations by Sex
Within the Services occupations in Gibson County, the most male-oriented occupations are Cleaning & Maintenance (75.4%), Law Enforcement (74.6%), and Security & Protection (50.2%), while the most female-oriented occupations are Healthcare Support (98.4%), Personal Care & Service (71.4%), and Food Preparation & Serving (61.9%).
| Occupation | Male | Female |
| Healthcare Support | 6 (1.6%) | 370 (98.4%) |
| Security & Protection | 104 (50.2%) | 103 (49.8%) |
| Firefighting & Prevention | 63 (41.4%) | 89 (58.6%) |
| Law Enforcement | 41 (74.6%) | 14 (25.5%) |
| Food Preparation & Serving | 254 (38.1%) | 412 (61.9%) |
| Cleaning & Maintenance | 510 (75.4%) | 166 (24.6%) |
| Personal Care & Service | 69 (28.6%) | 172 (71.4%) |
| Total (Category) | 943 (43.5%) | 1,223 (56.5%) |
| Total (Overall) | 8,991 (56.7%) | 6,868 (43.3%) |
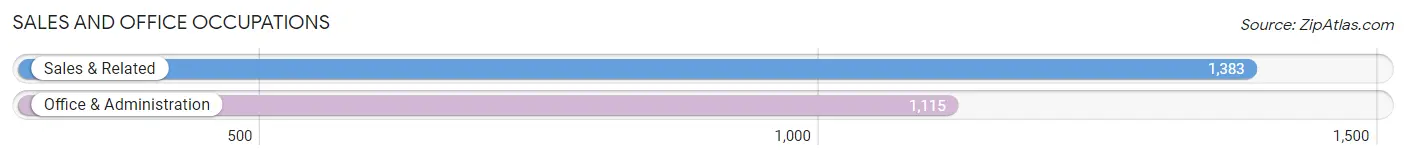
Sales and Office Occupations
The most common Sales and Office occupations in Gibson County are Sales & Related (1,383 | 8.7%), and Office & Administration (1,115 | 7.0%).
Sales and Office Occupations by Sex

| Occupation | Male | Female |
| Sales & Related | 683 (49.4%) | 700 (50.6%) |
| Office & Administration | 228 (20.4%) | 887 (79.5%) |
| Total (Category) | 911 (36.5%) | 1,587 (63.5%) |
| Total (Overall) | 8,991 (56.7%) | 6,868 (43.3%) |
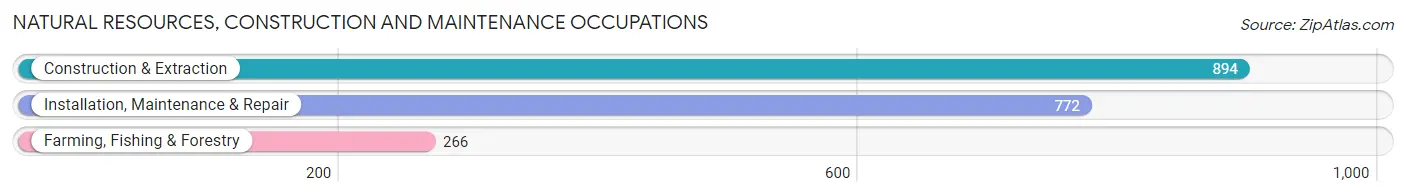
Natural Resources, Construction and Maintenance Occupations
The most common Natural Resources, Construction and Maintenance occupations in Gibson County are Construction & Extraction (894 | 5.6%), Installation, Maintenance & Repair (772 | 4.9%), and Farming, Fishing & Forestry (266 | 1.7%).
Natural Resources, Construction and Maintenance Occupations by Sex
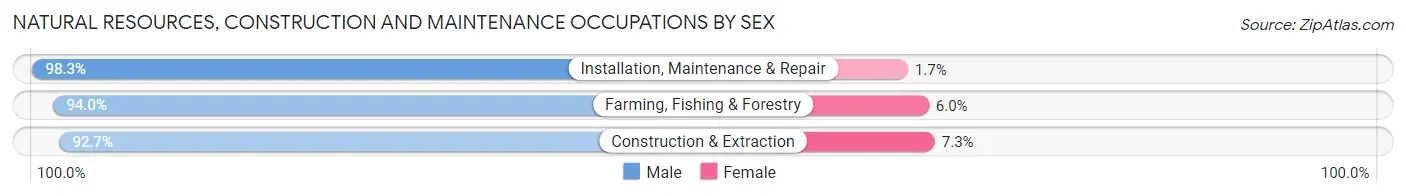
| Occupation | Male | Female |
| Farming, Fishing & Forestry | 250 (94.0%) | 16 (6.0%) |
| Construction & Extraction | 829 (92.7%) | 65 (7.3%) |
| Installation, Maintenance & Repair | 759 (98.3%) | 13 (1.7%) |
| Total (Category) | 1,838 (95.1%) | 94 (4.9%) |
| Total (Overall) | 8,991 (56.7%) | 6,868 (43.3%) |
Production, Transportation and Moving Occupations
The most common Production, Transportation and Moving occupations in Gibson County are Production (2,964 | 18.7%), Transportation (922 | 5.8%), and Material Moving (782 | 4.9%).
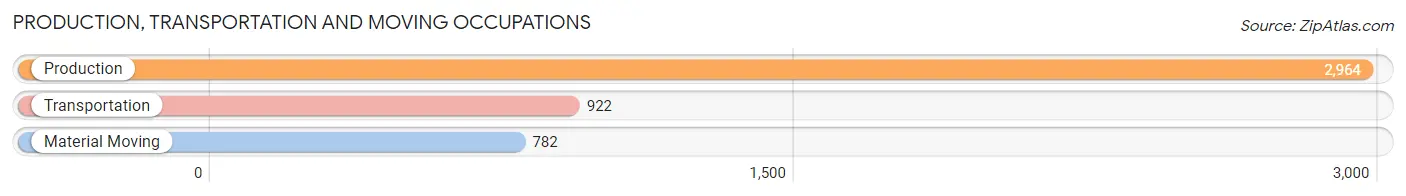
Production, Transportation and Moving Occupations by Sex
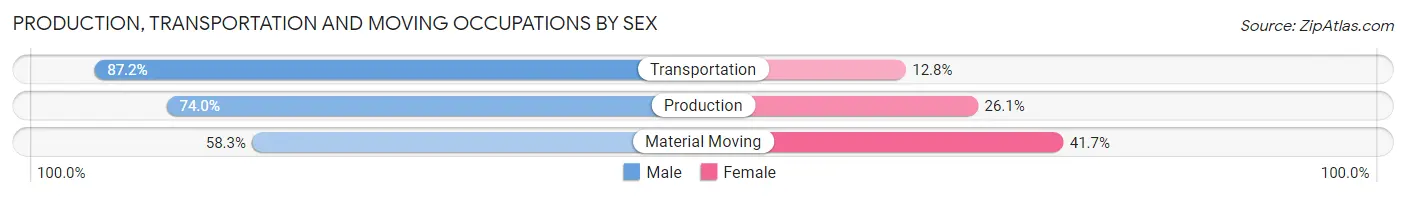
| Occupation | Male | Female |
| Production | 2,192 (74.0%) | 772 (26.1%) |
| Transportation | 804 (87.2%) | 118 (12.8%) |
| Material Moving | 456 (58.3%) | 326 (41.7%) |
| Total (Category) | 3,452 (74.0%) | 1,216 (26.1%) |
| Total (Overall) | 8,991 (56.7%) | 6,868 (43.3%) |
Employment Industries by Sex in Gibson County
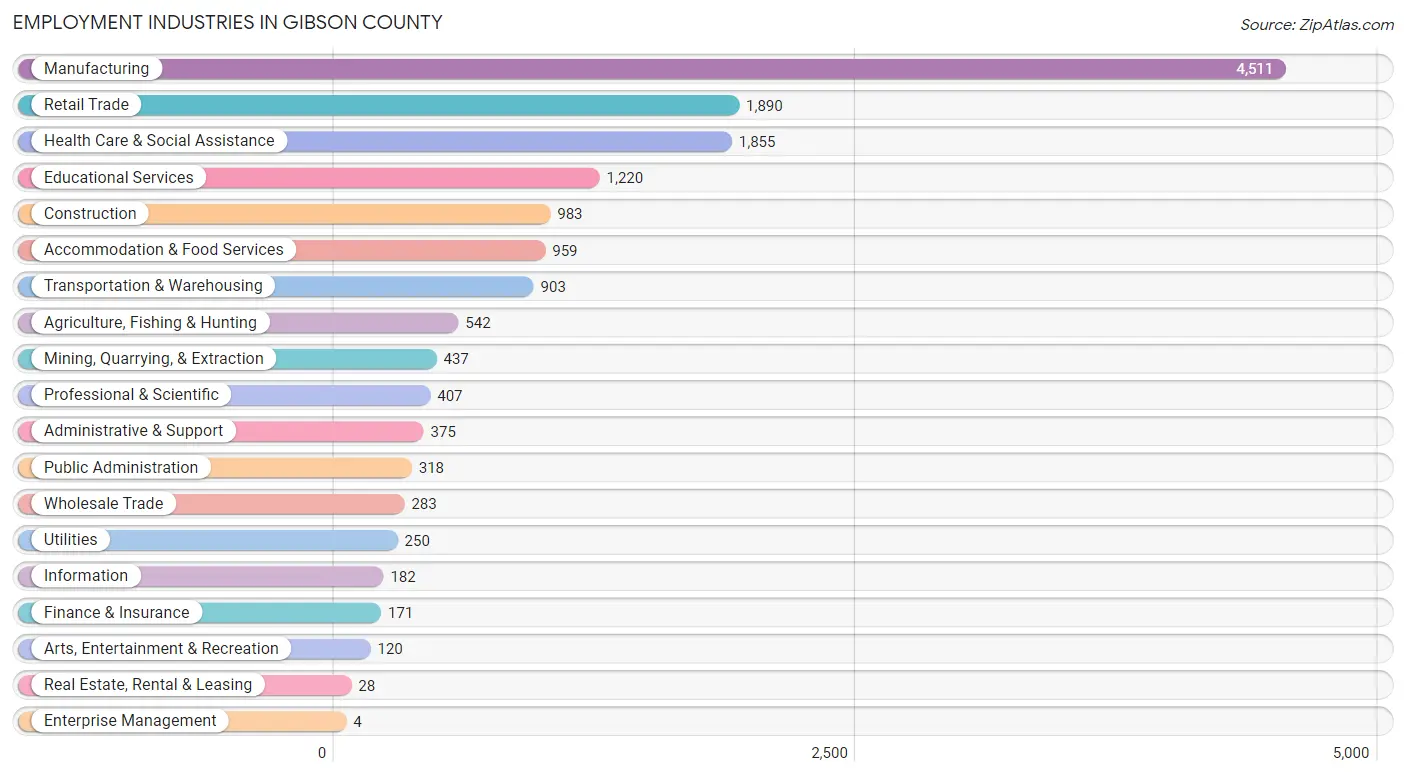
Employment Industries in Gibson County
The major employment industries in Gibson County include Manufacturing (4,511 | 28.4%), Retail Trade (1,890 | 11.9%), Health Care & Social Assistance (1,855 | 11.7%), Educational Services (1,220 | 7.7%), and Construction (983 | 6.2%).
Employment Industries by Sex in Gibson County
The Gibson County industries that see more men than women are Agriculture, Fishing & Hunting (94.1%), Wholesale Trade (86.2%), and Utilities (82.8%), whereas the industries that tend to have a higher number of women are Enterprise Management (100.0%), Health Care & Social Assistance (90.2%), and Real Estate, Rental & Leasing (85.7%).
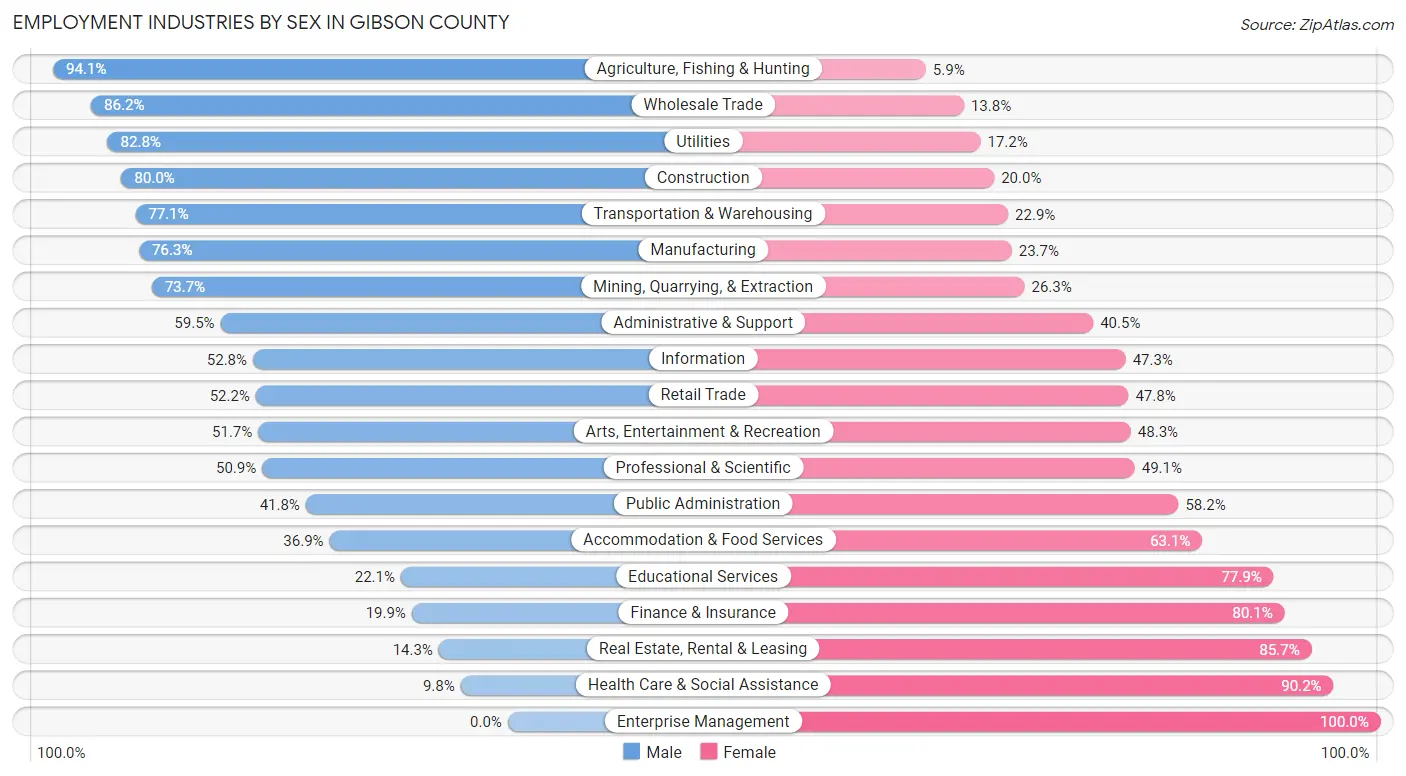
| Industry | Male | Female |
| Agriculture, Fishing & Hunting | 510 (94.1%) | 32 (5.9%) |
| Mining, Quarrying, & Extraction | 322 (73.7%) | 115 (26.3%) |
| Construction | 786 (80.0%) | 197 (20.0%) |
| Manufacturing | 3,443 (76.3%) | 1,068 (23.7%) |
| Wholesale Trade | 244 (86.2%) | 39 (13.8%) |
| Retail Trade | 986 (52.2%) | 904 (47.8%) |
| Transportation & Warehousing | 696 (77.1%) | 207 (22.9%) |
| Utilities | 207 (82.8%) | 43 (17.2%) |
| Information | 96 (52.7%) | 86 (47.2%) |
| Finance & Insurance | 34 (19.9%) | 137 (80.1%) |
| Real Estate, Rental & Leasing | 4 (14.3%) | 24 (85.7%) |
| Professional & Scientific | 207 (50.9%) | 200 (49.1%) |
| Enterprise Management | 0 (0.0%) | 4 (100.0%) |
| Administrative & Support | 223 (59.5%) | 152 (40.5%) |
| Educational Services | 270 (22.1%) | 950 (77.9%) |
| Health Care & Social Assistance | 181 (9.8%) | 1,674 (90.2%) |
| Arts, Entertainment & Recreation | 62 (51.7%) | 58 (48.3%) |
| Accommodation & Food Services | 354 (36.9%) | 605 (63.1%) |
| Public Administration | 133 (41.8%) | 185 (58.2%) |
| Total | 8,991 (56.7%) | 6,868 (43.3%) |
Education in Gibson County
School Enrollment in Gibson County
The most common levels of schooling among the 7,639 students in Gibson County are middle school (1,851 | 24.2%), high school (1,761 | 23.1%), and elementary school (1,727 | 22.6%).
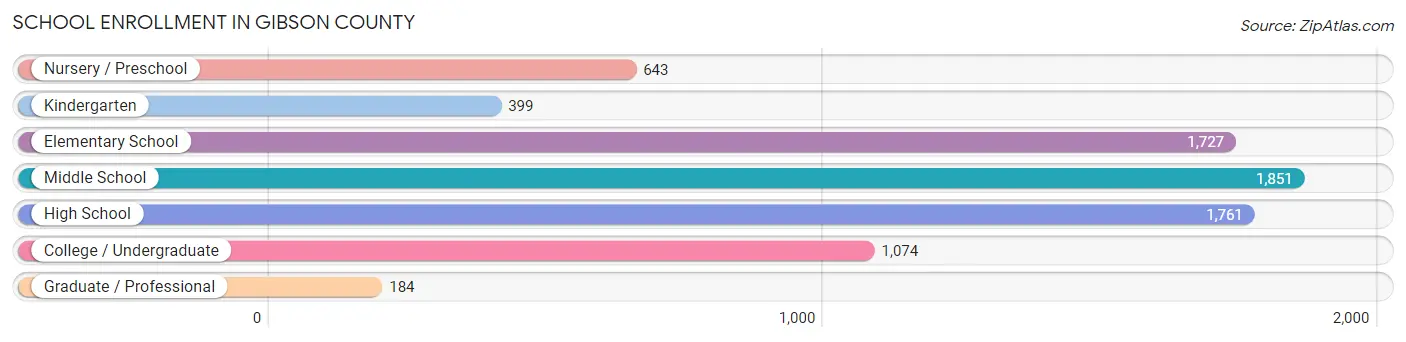
| School Level | # Students | % Students |
| Nursery / Preschool | 643 | 8.4% |
| Kindergarten | 399 | 5.2% |
| Elementary School | 1,727 | 22.6% |
| Middle School | 1,851 | 24.2% |
| High School | 1,761 | 23.1% |
| College / Undergraduate | 1,074 | 14.1% |
| Graduate / Professional | 184 | 2.4% |
| Total | 7,639 | 100.0% |
School Enrollment by Age by Funding Source in Gibson County
Out of a total of 7,639 students who are enrolled in schools in Gibson County, 1,451 (19.0%) attend a private institution, while the remaining 6,188 (81.0%) are enrolled in public schools. The age group of 3 to 4 year olds has the highest likelihood of being enrolled in private schools, with 309 (69.0% in the age bracket) enrolled. Conversely, the age group of 25 to 34 year olds has the lowest likelihood of being enrolled in a private school, with 190 (96.5% in the age bracket) attending a public institution.
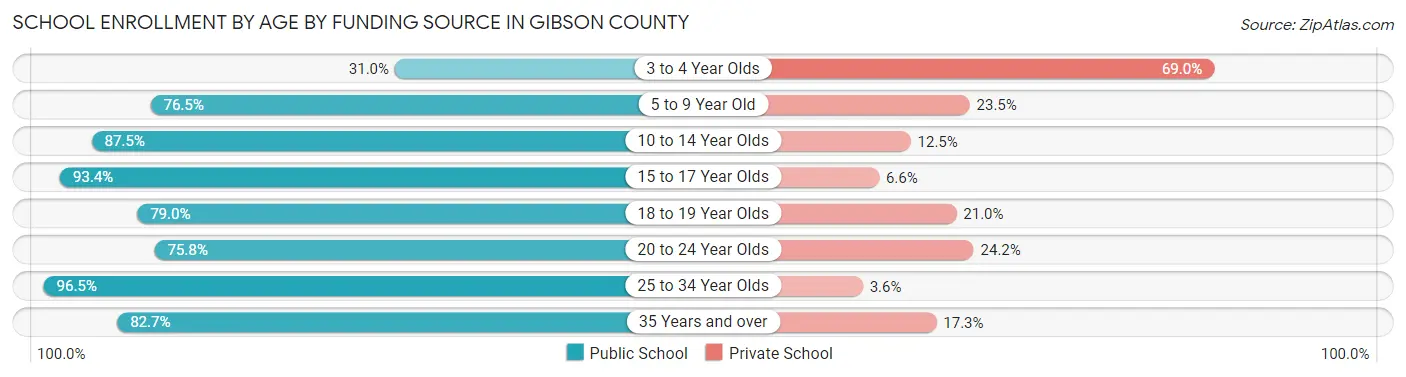
| Age Bracket | Public School | Private School |
| 3 to 4 Year Olds | 139 (31.0%) | 309 (69.0%) |
| 5 to 9 Year Old | 1,576 (76.5%) | 483 (23.5%) |
| 10 to 14 Year Olds | 1,924 (87.5%) | 274 (12.5%) |
| 15 to 17 Year Olds | 1,277 (93.4%) | 90 (6.6%) |
| 18 to 19 Year Olds | 350 (79.0%) | 93 (21.0%) |
| 20 to 24 Year Olds | 426 (75.8%) | 136 (24.2%) |
| 25 to 34 Year Olds | 190 (96.5%) | 7 (3.5%) |
| 35 Years and over | 302 (82.7%) | 63 (17.3%) |
| Total | 6,188 (81.0%) | 1,451 (19.0%) |
Educational Attainment by Field of Study in Gibson County
Education (902 | 20.5%), science & technology (729 | 16.6%), business (676 | 15.4%), engineering (318 | 7.2%), and bio, nature & agricultural (298 | 6.8%) are the most common fields of study among 4,393 individuals in Gibson County who have obtained a bachelor's degree or higher.
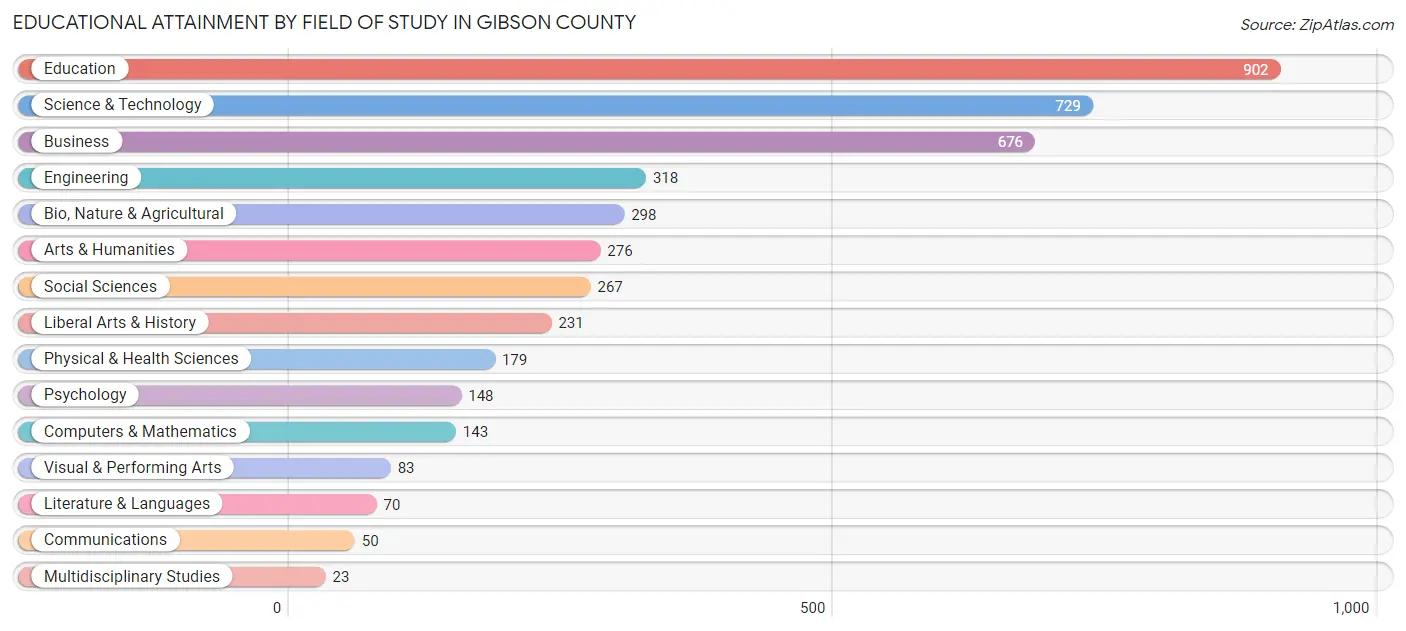
| Field of Study | # Graduates | % Graduates |
| Computers & Mathematics | 143 | 3.3% |
| Bio, Nature & Agricultural | 298 | 6.8% |
| Physical & Health Sciences | 179 | 4.1% |
| Psychology | 148 | 3.4% |
| Social Sciences | 267 | 6.1% |
| Engineering | 318 | 7.2% |
| Multidisciplinary Studies | 23 | 0.5% |
| Science & Technology | 729 | 16.6% |
| Business | 676 | 15.4% |
| Education | 902 | 20.5% |
| Literature & Languages | 70 | 1.6% |
| Liberal Arts & History | 231 | 5.3% |
| Visual & Performing Arts | 83 | 1.9% |
| Communications | 50 | 1.1% |
| Arts & Humanities | 276 | 6.3% |
| Total | 4,393 | 100.0% |
Transportation & Commute in Gibson County
Vehicle Availability by Sex in Gibson County
The most prevalent vehicle ownership categories in Gibson County are males with 2 vehicles (3,026, accounting for 34.3%) and females with 2 vehicles (2,557, making up 45.2%).
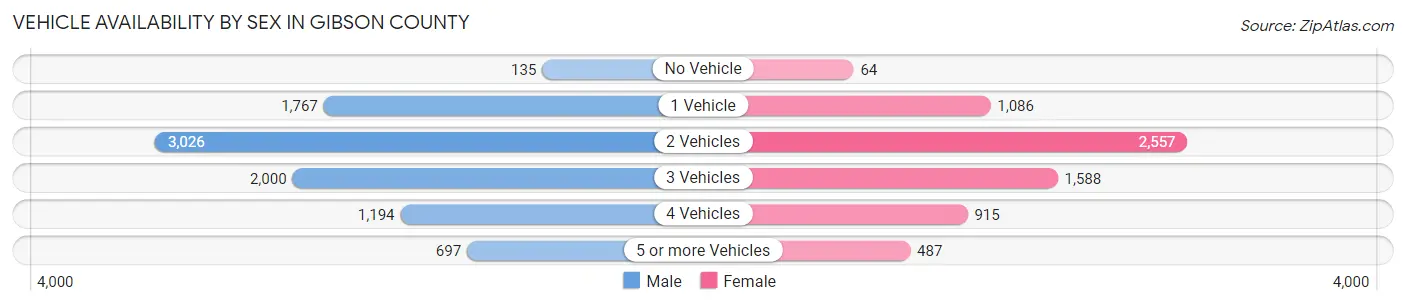
| Vehicles Available | Male | Female |
| No Vehicle | 135 (1.5%) | 64 (1.0%) |
| 1 Vehicle | 1,767 (20.0%) | 1,086 (16.2%) |
| 2 Vehicles | 3,026 (34.3%) | 2,557 (38.2%) |
| 3 Vehicles | 2,000 (22.7%) | 1,588 (23.7%) |
| 4 Vehicles | 1,194 (13.5%) | 915 (13.7%) |
| 5 or more Vehicles | 697 (7.9%) | 487 (7.3%) |
| Total | 8,819 (100.0%) | 6,697 (100.0%) |
Commute Time in Gibson County
The most frequently occuring commute durations in Gibson County are 10 to 14 minutes (2,976 commuters, 19.8%), 5 to 9 minutes (2,340 commuters, 15.6%), and 15 to 19 minutes (2,263 commuters, 15.0%).
| Commute Time | # Commuters | % Commuters |
| Less than 5 Minutes | 834 | 5.5% |
| 5 to 9 Minutes | 2,340 | 15.6% |
| 10 to 14 Minutes | 2,976 | 19.8% |
| 15 to 19 Minutes | 2,263 | 15.0% |
| 20 to 24 Minutes | 1,713 | 11.4% |
| 25 to 29 Minutes | 850 | 5.7% |
| 30 to 34 Minutes | 1,489 | 9.9% |
| 35 to 39 Minutes | 585 | 3.9% |
| 40 to 44 Minutes | 585 | 3.9% |
| 45 to 59 Minutes | 1,006 | 6.7% |
| 60 to 89 Minutes | 230 | 1.5% |
| 90 or more Minutes | 171 | 1.1% |
Commute Time by Sex in Gibson County
The most common commute times in Gibson County are 10 to 14 minutes (1,813 commuters, 21.2%) for males and 10 to 14 minutes (1,163 commuters, 17.9%) for females.
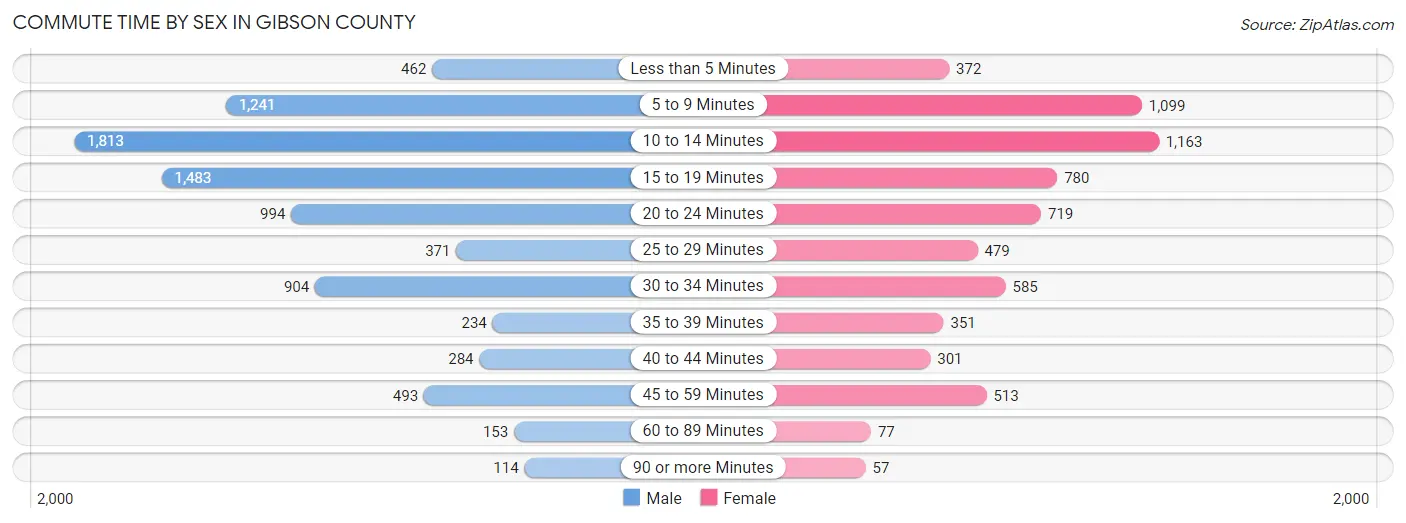
| Commute Time | Male | Female |
| Less than 5 Minutes | 462 (5.4%) | 372 (5.7%) |
| 5 to 9 Minutes | 1,241 (14.5%) | 1,099 (16.9%) |
| 10 to 14 Minutes | 1,813 (21.2%) | 1,163 (17.9%) |
| 15 to 19 Minutes | 1,483 (17.3%) | 780 (12.0%) |
| 20 to 24 Minutes | 994 (11.6%) | 719 (11.1%) |
| 25 to 29 Minutes | 371 (4.3%) | 479 (7.4%) |
| 30 to 34 Minutes | 904 (10.6%) | 585 (9.0%) |
| 35 to 39 Minutes | 234 (2.7%) | 351 (5.4%) |
| 40 to 44 Minutes | 284 (3.3%) | 301 (4.6%) |
| 45 to 59 Minutes | 493 (5.8%) | 513 (7.9%) |
| 60 to 89 Minutes | 153 (1.8%) | 77 (1.2%) |
| 90 or more Minutes | 114 (1.3%) | 57 (0.9%) |
Time of Departure to Work by Sex in Gibson County
The most frequent times of departure to work in Gibson County are 4:00 PM to 11:59 PM (1,567, 18.3%) for males and 6:30 AM to 6:59 AM (906, 14.0%) for females.
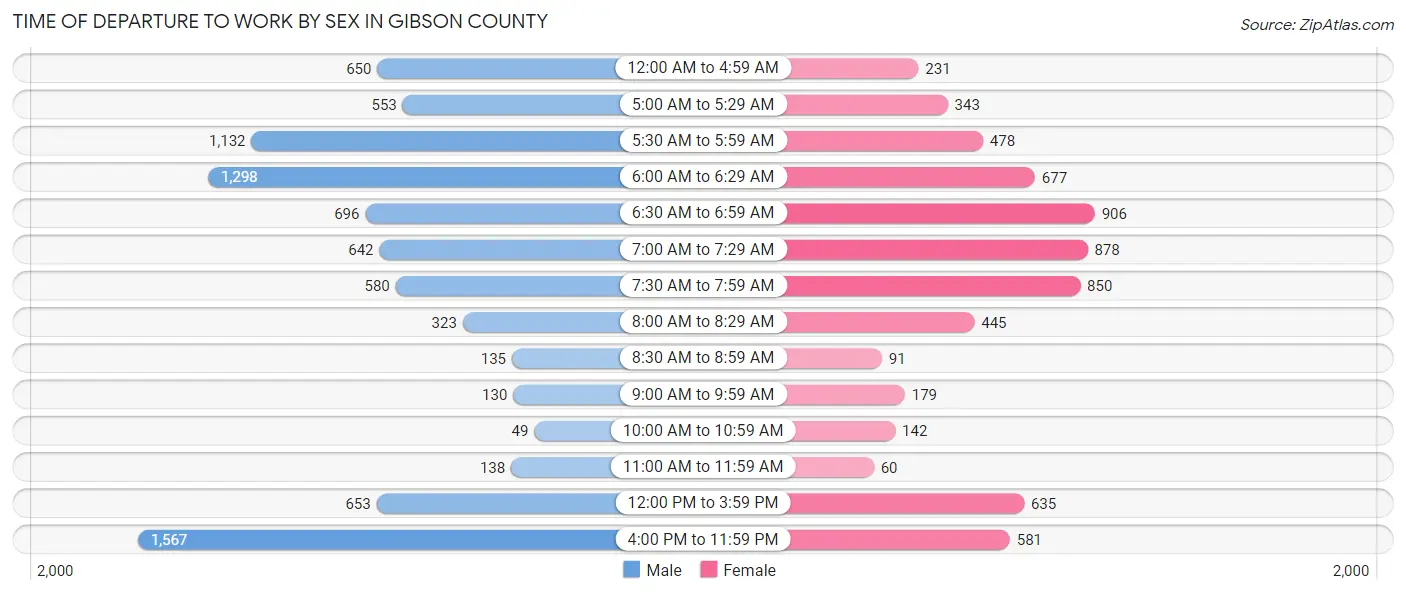
| Time of Departure | Male | Female |
| 12:00 AM to 4:59 AM | 650 (7.6%) | 231 (3.6%) |
| 5:00 AM to 5:29 AM | 553 (6.5%) | 343 (5.3%) |
| 5:30 AM to 5:59 AM | 1,132 (13.3%) | 478 (7.4%) |
| 6:00 AM to 6:29 AM | 1,298 (15.2%) | 677 (10.4%) |
| 6:30 AM to 6:59 AM | 696 (8.1%) | 906 (14.0%) |
| 7:00 AM to 7:29 AM | 642 (7.5%) | 878 (13.5%) |
| 7:30 AM to 7:59 AM | 580 (6.8%) | 850 (13.1%) |
| 8:00 AM to 8:29 AM | 323 (3.8%) | 445 (6.9%) |
| 8:30 AM to 8:59 AM | 135 (1.6%) | 91 (1.4%) |
| 9:00 AM to 9:59 AM | 130 (1.5%) | 179 (2.8%) |
| 10:00 AM to 10:59 AM | 49 (0.6%) | 142 (2.2%) |
| 11:00 AM to 11:59 AM | 138 (1.6%) | 60 (0.9%) |
| 12:00 PM to 3:59 PM | 653 (7.6%) | 635 (9.8%) |
| 4:00 PM to 11:59 PM | 1,567 (18.3%) | 581 (8.9%) |
| Total | 8,546 (100.0%) | 6,496 (100.0%) |
Housing Occupancy in Gibson County
Occupancy by Ownership in Gibson County
Of the total 12,978 dwellings in Gibson County, owner-occupied units account for 9,871 (76.1%), while renter-occupied units make up 3,107 (23.9%).
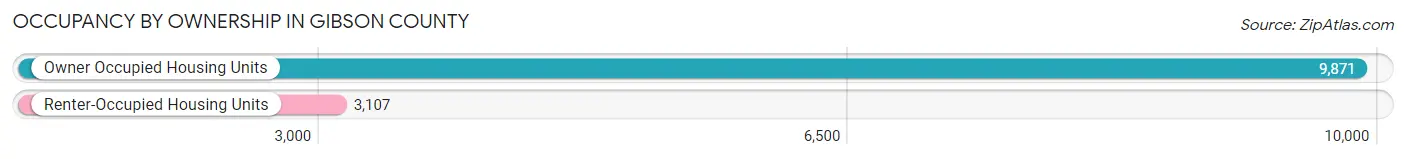
| Occupancy | # Housing Units | % Housing Units |
| Owner Occupied Housing Units | 9,871 | 76.1% |
| Renter-Occupied Housing Units | 3,107 | 23.9% |
| Total Occupied Housing Units | 12,978 | 100.0% |
Occupancy by Household Size in Gibson County
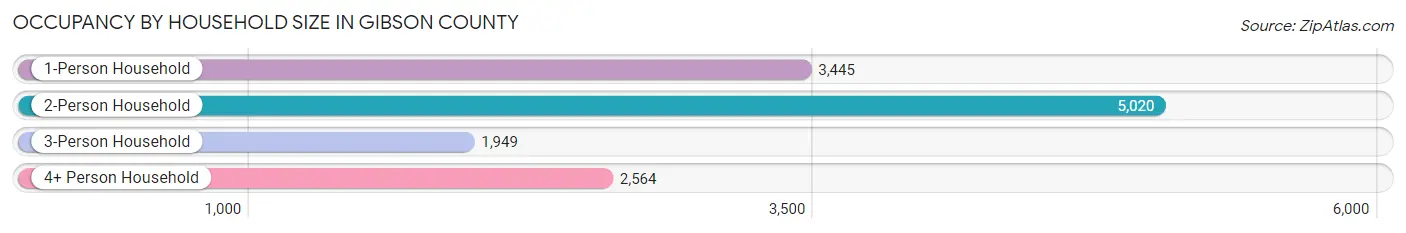
| Household Size | # Housing Units | % Housing Units |
| 1-Person Household | 3,445 | 26.5% |
| 2-Person Household | 5,020 | 38.7% |
| 3-Person Household | 1,949 | 15.0% |
| 4+ Person Household | 2,564 | 19.8% |
| Total Housing Units | 12,978 | 100.0% |
Occupancy by Ownership by Household Size in Gibson County
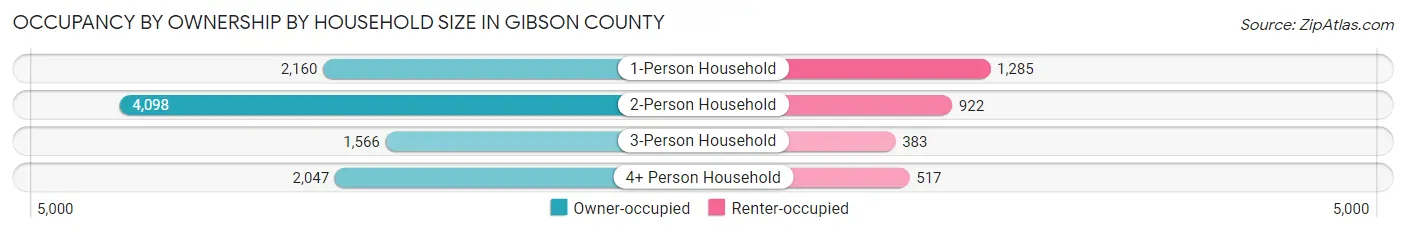
| Household Size | Owner-occupied | Renter-occupied |
| 1-Person Household | 2,160 (62.7%) | 1,285 (37.3%) |
| 2-Person Household | 4,098 (81.6%) | 922 (18.4%) |
| 3-Person Household | 1,566 (80.3%) | 383 (19.7%) |
| 4+ Person Household | 2,047 (79.8%) | 517 (20.2%) |
| Total Housing Units | 9,871 (76.1%) | 3,107 (23.9%) |
Occupancy by Educational Attainment in Gibson County

| Household Size | Owner-occupied | Renter-occupied |
| Less than High School | 496 (51.3%) | 470 (48.6%) |
| High School Diploma | 3,876 (72.7%) | 1,453 (27.3%) |
| College/Associate Degree | 3,419 (80.6%) | 825 (19.4%) |
| Bachelor's Degree or higher | 2,080 (85.3%) | 359 (14.7%) |
Occupancy by Age of Householder in Gibson County

| Age Bracket | # Households | % Households |
| Under 35 Years | 2,252 | 17.3% |
| 35 to 44 Years | 2,141 | 16.5% |
| 45 to 54 Years | 2,513 | 19.4% |
| 55 to 64 Years | 2,568 | 19.8% |
| 65 to 74 Years | 2,166 | 16.7% |
| 75 to 84 Years | 1,010 | 7.8% |
| 85 Years and Over | 328 | 2.5% |
| Total | 12,978 | 100.0% |
Housing Finances in Gibson County
Median Income by Occupancy in Gibson County
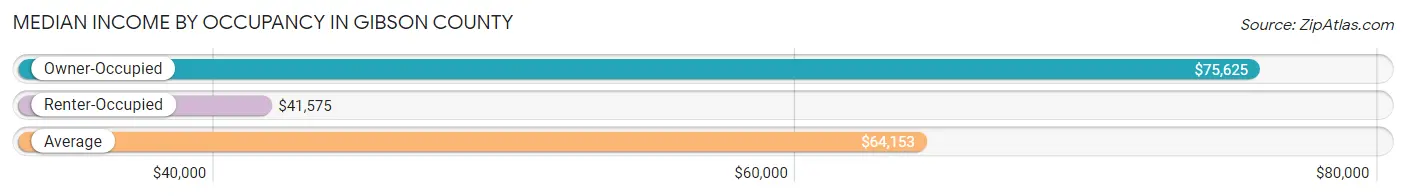
| Occupancy Type | # Households | Median Income |
| Owner-Occupied | 9,871 (76.1%) | $75,625 |
| Renter-Occupied | 3,107 (23.9%) | $41,575 |
| Average | 12,978 (100.0%) | $64,153 |
Occupancy by Householder Income Bracket in Gibson County

| Income Bracket | Owner-occupied | Renter-occupied |
| Less than $5,000 | 234 (2.4%) | 75 (2.4%) |
| $5,000 to $9,999 | 107 (1.1%) | 82 (2.6%) |
| $10,000 to $14,999 | 213 (2.2%) | 184 (5.9%) |
| $15,000 to $19,999 | 277 (2.8%) | 296 (9.5%) |
| $20,000 to $24,999 | 199 (2.0%) | 111 (3.6%) |
| $25,000 to $34,999 | 783 (7.9%) | 405 (13.0%) |
| $35,000 to $49,999 | 1,195 (12.1%) | 639 (20.6%) |
| $50,000 to $74,999 | 1,890 (19.2%) | 596 (19.2%) |
| $75,000 to $99,999 | 1,590 (16.1%) | 414 (13.3%) |
| $100,000 to $149,999 | 2,141 (21.7%) | 260 (8.4%) |
| $150,000 or more | 1,242 (12.6%) | 45 (1.5%) |
| Total | 9,871 (100.0%) | 3,107 (100.0%) |
Monthly Housing Cost Tiers in Gibson County
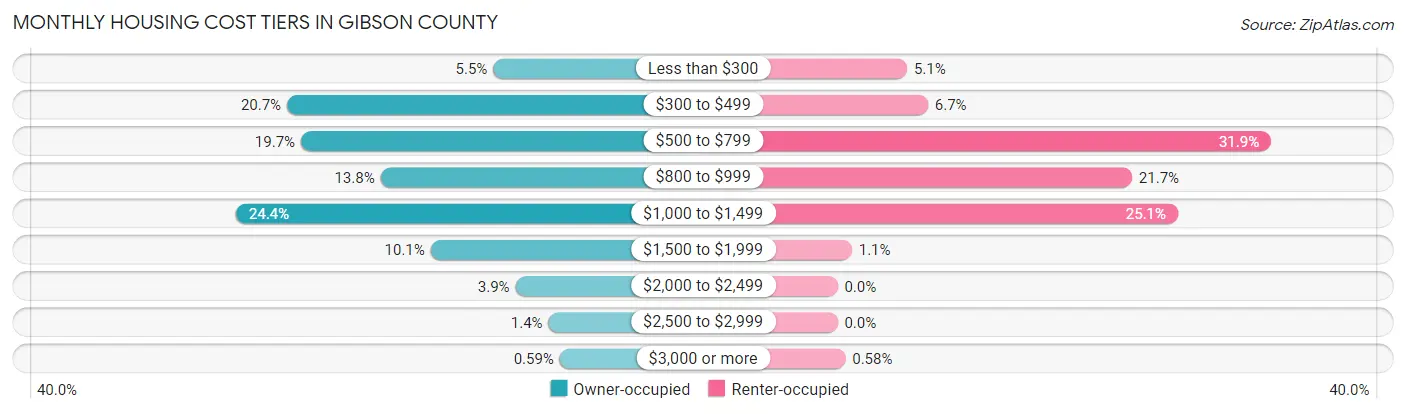
| Monthly Cost | Owner-occupied | Renter-occupied |
| Less than $300 | 542 (5.5%) | 159 (5.1%) |
| $300 to $499 | 2,041 (20.7%) | 207 (6.7%) |
| $500 to $799 | 1,940 (19.7%) | 992 (31.9%) |
| $800 to $999 | 1,361 (13.8%) | 674 (21.7%) |
| $1,000 to $1,499 | 2,412 (24.4%) | 779 (25.1%) |
| $1,500 to $1,999 | 997 (10.1%) | 33 (1.1%) |
| $2,000 to $2,499 | 380 (3.8%) | 0 (0.0%) |
| $2,500 to $2,999 | 140 (1.4%) | 0 (0.0%) |
| $3,000 or more | 58 (0.6%) | 18 (0.6%) |
| Total | 9,871 (100.0%) | 3,107 (100.0%) |
Physical Housing Characteristics in Gibson County
Housing Structures in Gibson County

| Structure Type | # Housing Units | % Housing Units |
| Single Unit, Detached | 10,211 | 78.7% |
| Single Unit, Attached | 124 | 1.0% |
| 2 Unit Apartments | 244 | 1.9% |
| 3 or 4 Unit Apartments | 360 | 2.8% |
| 5 to 9 Unit Apartments | 320 | 2.5% |
| 10 or more Apartments | 581 | 4.5% |
| Mobile Home / Other | 1,138 | 8.8% |
| Total | 12,978 | 100.0% |
Housing Structures by Occupancy in Gibson County
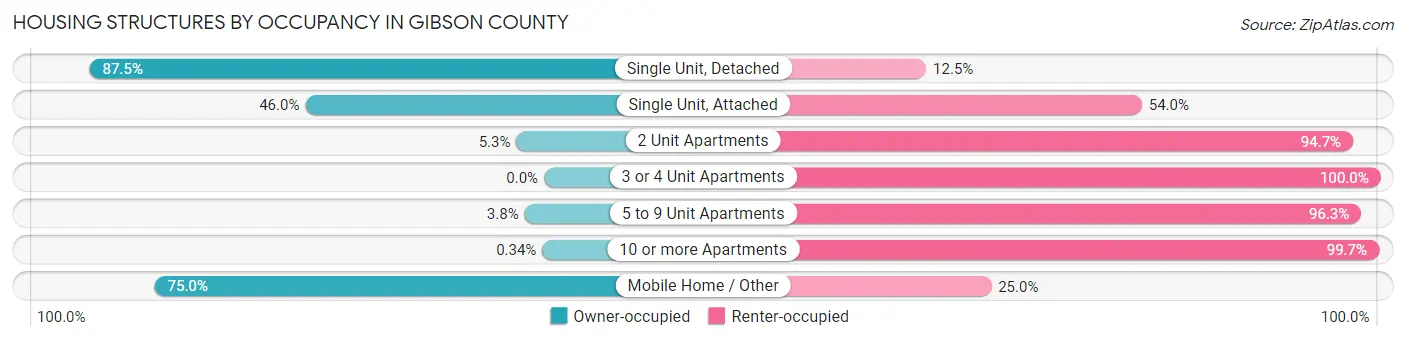
| Structure Type | Owner-occupied | Renter-occupied |
| Single Unit, Detached | 8,934 (87.5%) | 1,277 (12.5%) |
| Single Unit, Attached | 57 (46.0%) | 67 (54.0%) |
| 2 Unit Apartments | 13 (5.3%) | 231 (94.7%) |
| 3 or 4 Unit Apartments | 0 (0.0%) | 360 (100.0%) |
| 5 to 9 Unit Apartments | 12 (3.7%) | 308 (96.3%) |
| 10 or more Apartments | 2 (0.3%) | 579 (99.7%) |
| Mobile Home / Other | 853 (75.0%) | 285 (25.0%) |
| Total | 9,871 (76.1%) | 3,107 (23.9%) |
Housing Structures by Number of Rooms in Gibson County
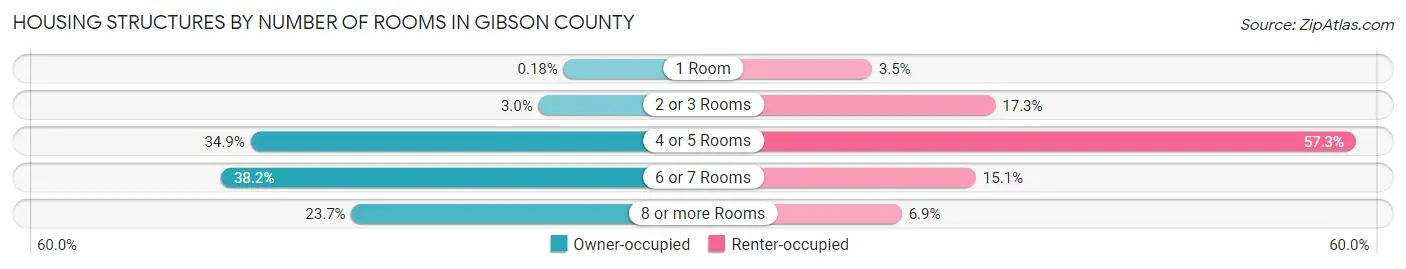
| Number of Rooms | Owner-occupied | Renter-occupied |
| 1 Room | 18 (0.2%) | 110 (3.5%) |
| 2 or 3 Rooms | 292 (3.0%) | 536 (17.2%) |
| 4 or 5 Rooms | 3,448 (34.9%) | 1,779 (57.3%) |
| 6 or 7 Rooms | 3,771 (38.2%) | 469 (15.1%) |
| 8 or more Rooms | 2,342 (23.7%) | 213 (6.9%) |
| Total | 9,871 (100.0%) | 3,107 (100.0%) |
Housing Structure by Heating Type in Gibson County
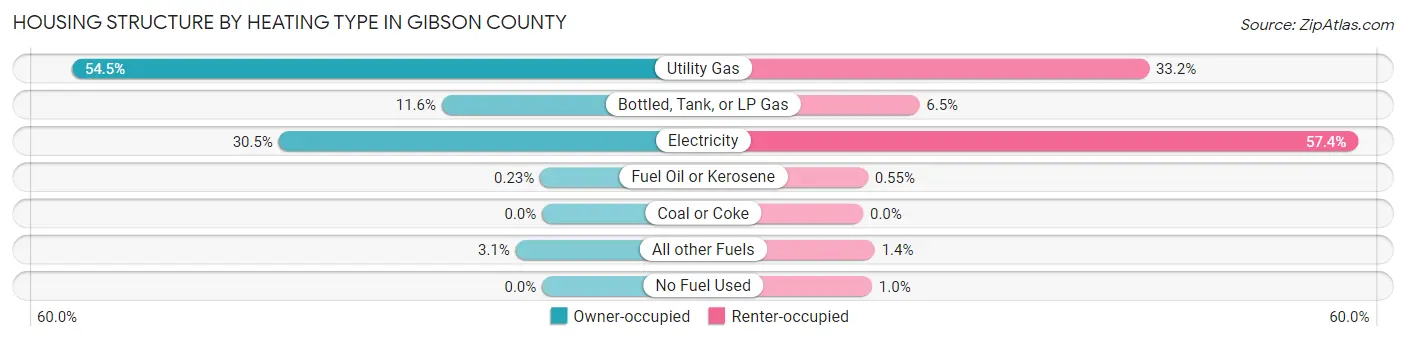
| Heating Type | Owner-occupied | Renter-occupied |
| Utility Gas | 5,382 (54.5%) | 1,030 (33.2%) |
| Bottled, Tank, or LP Gas | 1,148 (11.6%) | 203 (6.5%) |
| Electricity | 3,015 (30.5%) | 1,783 (57.4%) |
| Fuel Oil or Kerosene | 23 (0.2%) | 17 (0.5%) |
| Coal or Coke | 0 (0.0%) | 0 (0.0%) |
| All other Fuels | 303 (3.1%) | 42 (1.3%) |
| No Fuel Used | 0 (0.0%) | 32 (1.0%) |
| Total | 9,871 (100.0%) | 3,107 (100.0%) |
Household Vehicle Usage in Gibson County
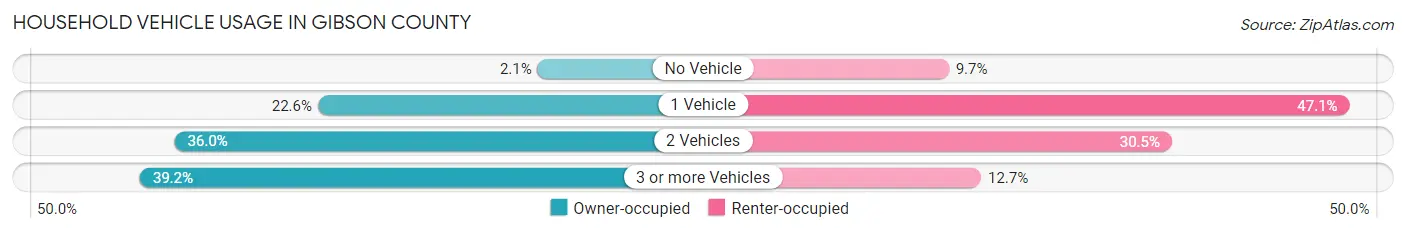
| Vehicles per Household | Owner-occupied | Renter-occupied |
| No Vehicle | 209 (2.1%) | 301 (9.7%) |
| 1 Vehicle | 2,234 (22.6%) | 1,463 (47.1%) |
| 2 Vehicles | 3,555 (36.0%) | 948 (30.5%) |
| 3 or more Vehicles | 3,873 (39.2%) | 395 (12.7%) |
| Total | 9,871 (100.0%) | 3,107 (100.0%) |
Real Estate & Mortgages in Gibson County
Real Estate and Mortgage Overview in Gibson County
| Characteristic | Without Mortgage | With Mortgage |
| Housing Units | 4,214 | 5,657 |
| Median Property Value | $155,000 | $164,600 |
| Median Household Income | $52,114 | $915 |
| Monthly Housing Costs | $459 | $48 |
| Real Estate Taxes | $1,030 | $200 |
Property Value by Mortgage Status in Gibson County

| Property Value | Without Mortgage | With Mortgage |
| Less than $50,000 | 584 (13.9%) | 271 (4.8%) |
| $50,000 to $99,999 | 730 (17.3%) | 1,138 (20.1%) |
| $100,000 to $299,999 | 2,402 (57.0%) | 3,446 (60.9%) |
| $300,000 to $499,999 | 383 (9.1%) | 652 (11.5%) |
| $500,000 to $749,999 | 63 (1.5%) | 119 (2.1%) |
| $750,000 to $999,999 | 16 (0.4%) | 19 (0.3%) |
| $1,000,000 or more | 36 (0.9%) | 12 (0.2%) |
| Total | 4,214 (100.0%) | 5,657 (100.0%) |
Household Income by Mortgage Status in Gibson County
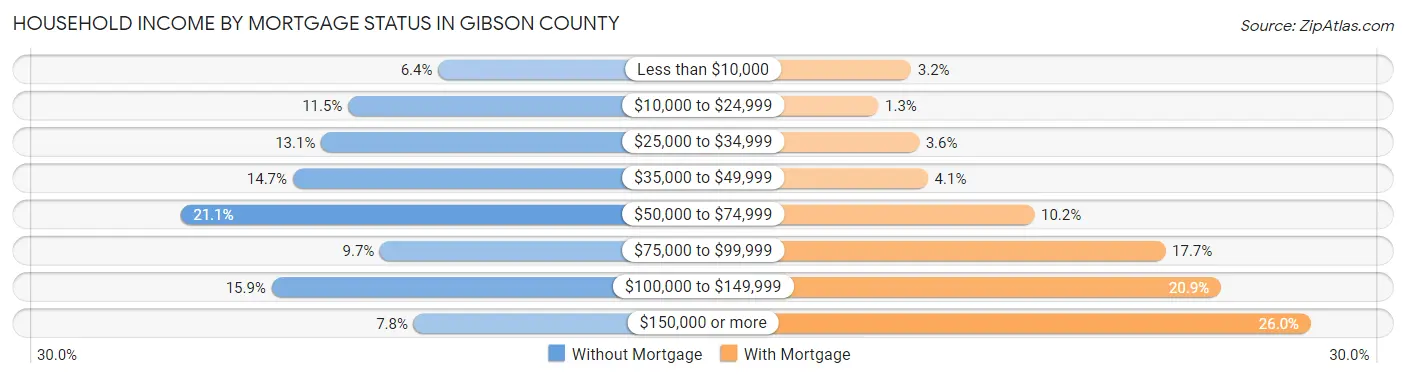
| Household Income | Without Mortgage | With Mortgage |
| Less than $10,000 | 268 (6.4%) | 179 (3.2%) |
| $10,000 to $24,999 | 485 (11.5%) | 73 (1.3%) |
| $25,000 to $34,999 | 550 (13.1%) | 204 (3.6%) |
| $35,000 to $49,999 | 618 (14.7%) | 233 (4.1%) |
| $50,000 to $74,999 | 889 (21.1%) | 577 (10.2%) |
| $75,000 to $99,999 | 408 (9.7%) | 1,001 (17.7%) |
| $100,000 to $149,999 | 669 (15.9%) | 1,182 (20.9%) |
| $150,000 or more | 327 (7.8%) | 1,472 (26.0%) |
| Total | 4,214 (100.0%) | 5,657 (100.0%) |
Property Value to Household Income Ratio in Gibson County
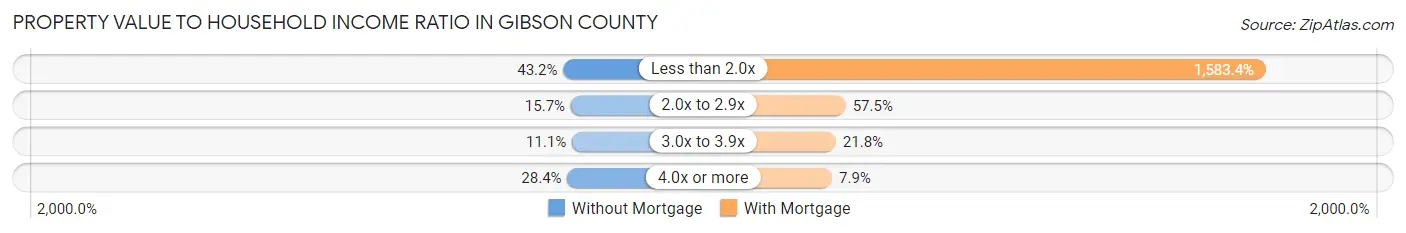
| Value-to-Income Ratio | Without Mortgage | With Mortgage |
| Less than 2.0x | 1,821 (43.2%) | 89,571 (1,583.4%) |
| 2.0x to 2.9x | 660 (15.7%) | 3,252 (57.5%) |
| 3.0x to 3.9x | 468 (11.1%) | 1,231 (21.8%) |
| 4.0x or more | 1,197 (28.4%) | 447 (7.9%) |
| Total | 4,214 (100.0%) | 5,657 (100.0%) |
Real Estate Taxes by Mortgage Status in Gibson County
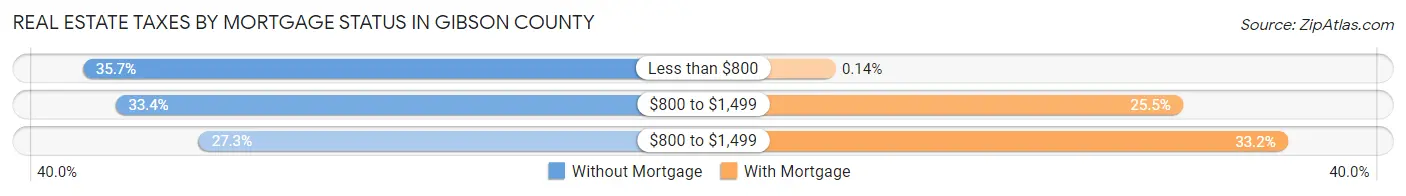
| Property Taxes | Without Mortgage | With Mortgage |
| Less than $800 | 1,506 (35.7%) | 8 (0.1%) |
| $800 to $1,499 | 1,406 (33.4%) | 1,445 (25.5%) |
| $800 to $1,499 | 1,149 (27.3%) | 1,878 (33.2%) |
| Total | 4,214 (100.0%) | 5,657 (100.0%) |
Health & Disability in Gibson County
Health Insurance Coverage by Age in Gibson County
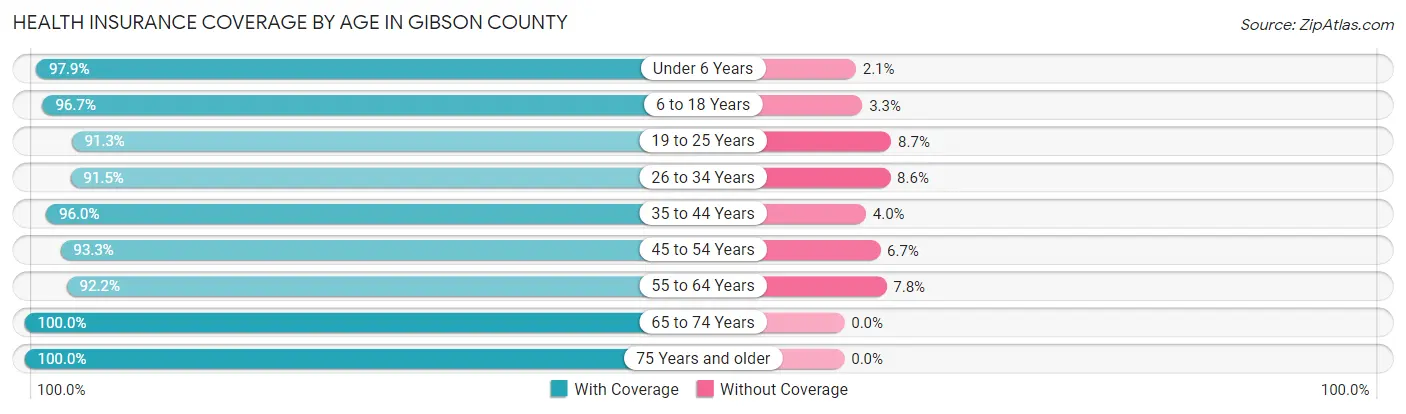
| Age Bracket | With Coverage | Without Coverage |
| Under 6 Years | 2,512 (97.9%) | 55 (2.1%) |
| 6 to 18 Years | 5,609 (96.7%) | 194 (3.3%) |
| 19 to 25 Years | 2,371 (91.3%) | 227 (8.7%) |
| 26 to 34 Years | 3,155 (91.4%) | 295 (8.6%) |
| 35 to 44 Years | 3,773 (96.0%) | 158 (4.0%) |
| 45 to 54 Years | 3,828 (93.3%) | 274 (6.7%) |
| 55 to 64 Years | 4,254 (92.2%) | 362 (7.8%) |
| 65 to 74 Years | 3,308 (100.0%) | 0 (0.0%) |
| 75 Years and older | 2,073 (100.0%) | 0 (0.0%) |
| Total | 30,883 (95.2%) | 1,565 (4.8%) |
Health Insurance Coverage by Citizenship Status in Gibson County
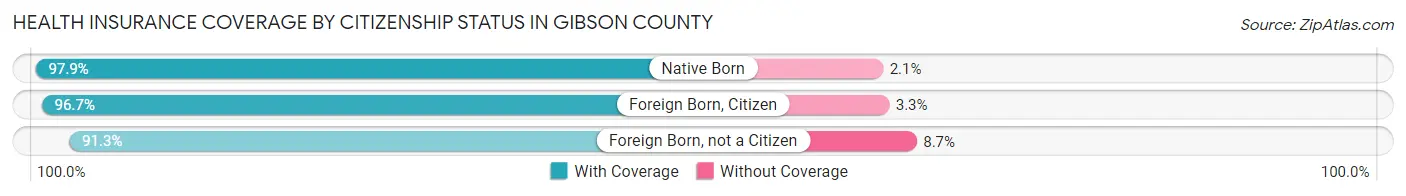
| Citizenship Status | With Coverage | Without Coverage |
| Native Born | 2,512 (97.9%) | 55 (2.1%) |
| Foreign Born, Citizen | 5,609 (96.7%) | 194 (3.3%) |
| Foreign Born, not a Citizen | 2,371 (91.3%) | 227 (8.7%) |
Health Insurance Coverage by Household Income in Gibson County
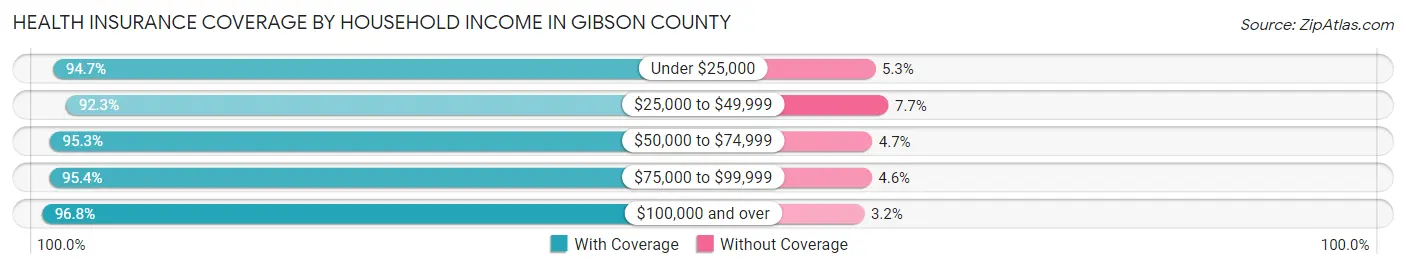
| Household Income | With Coverage | Without Coverage |
| Under $25,000 | 2,560 (94.7%) | 143 (5.3%) |
| $25,000 to $49,999 | 5,981 (92.3%) | 501 (7.7%) |
| $50,000 to $74,999 | 5,461 (95.3%) | 269 (4.7%) |
| $75,000 to $99,999 | 5,491 (95.4%) | 265 (4.6%) |
| $100,000 and over | 11,166 (96.8%) | 372 (3.2%) |
Public vs Private Health Insurance Coverage by Age in Gibson County
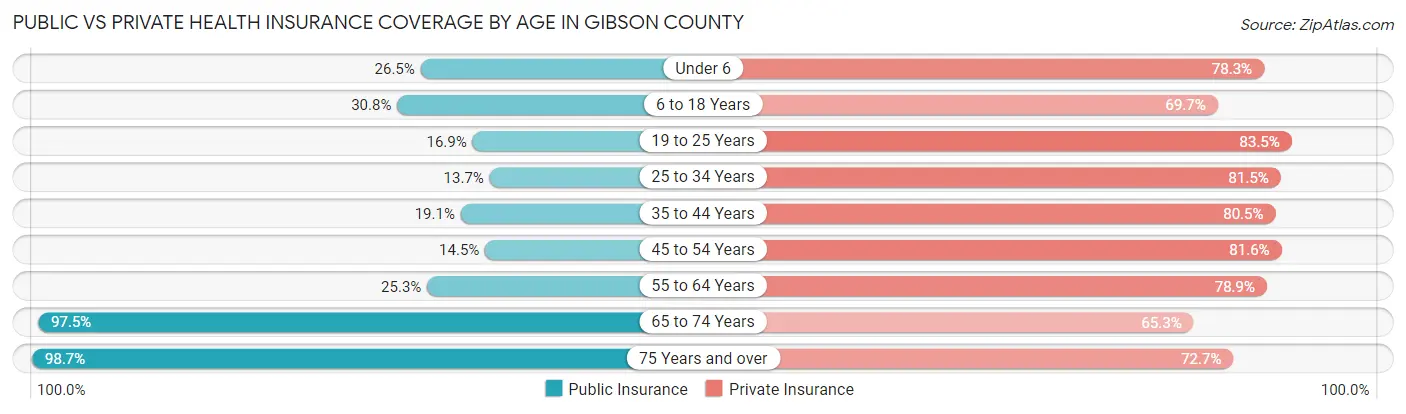
| Age Bracket | Public Insurance | Private Insurance |
| Under 6 | 680 (26.5%) | 2,011 (78.3%) |
| 6 to 18 Years | 1,789 (30.8%) | 4,047 (69.7%) |
| 19 to 25 Years | 438 (16.9%) | 2,169 (83.5%) |
| 25 to 34 Years | 472 (13.7%) | 2,810 (81.5%) |
| 35 to 44 Years | 749 (19.1%) | 3,163 (80.5%) |
| 45 to 54 Years | 595 (14.5%) | 3,347 (81.6%) |
| 55 to 64 Years | 1,167 (25.3%) | 3,641 (78.9%) |
| 65 to 74 Years | 3,226 (97.5%) | 2,159 (65.3%) |
| 75 Years and over | 2,045 (98.7%) | 1,506 (72.7%) |
| Total | 11,161 (34.4%) | 24,853 (76.6%) |
Disability Status by Sex by Age in Gibson County
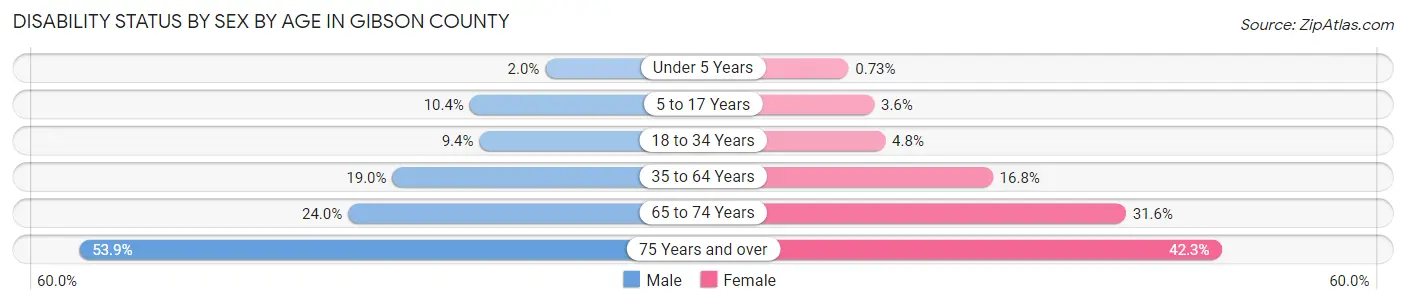
| Age Bracket | Male | Female |
| Under 5 Years | 21 (2.0%) | 7 (0.7%) |
| 5 to 17 Years | 324 (10.4%) | 100 (3.6%) |
| 18 to 34 Years | 308 (9.4%) | 156 (4.8%) |
| 35 to 64 Years | 1,238 (19.0%) | 1,033 (16.8%) |
| 65 to 74 Years | 386 (24.0%) | 537 (31.6%) |
| 75 Years and over | 462 (53.9%) | 514 (42.3%) |
Disability Class by Sex by Age in Gibson County
Disability Class: Hearing Difficulty
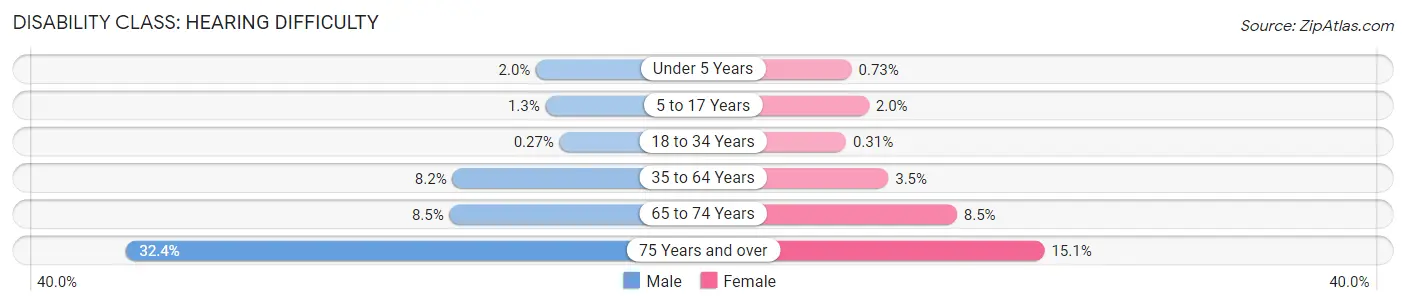
| Age Bracket | Male | Female |
| Under 5 Years | 21 (2.0%) | 7 (0.7%) |
| 5 to 17 Years | 41 (1.3%) | 56 (2.0%) |
| 18 to 34 Years | 9 (0.3%) | 10 (0.3%) |
| 35 to 64 Years | 535 (8.2%) | 212 (3.5%) |
| 65 to 74 Years | 136 (8.5%) | 145 (8.5%) |
| 75 Years and over | 278 (32.4%) | 183 (15.0%) |
Disability Class: Vision Difficulty

| Age Bracket | Male | Female |
| Under 5 Years | 13 (1.3%) | 0 (0.0%) |
| 5 to 17 Years | 20 (0.6%) | 11 (0.4%) |
| 18 to 34 Years | 77 (2.3%) | 56 (1.7%) |
| 35 to 64 Years | 345 (5.3%) | 123 (2.0%) |
| 65 to 74 Years | 63 (3.9%) | 122 (7.2%) |
| 75 Years and over | 54 (6.3%) | 146 (12.0%) |
Disability Class: Cognitive Difficulty
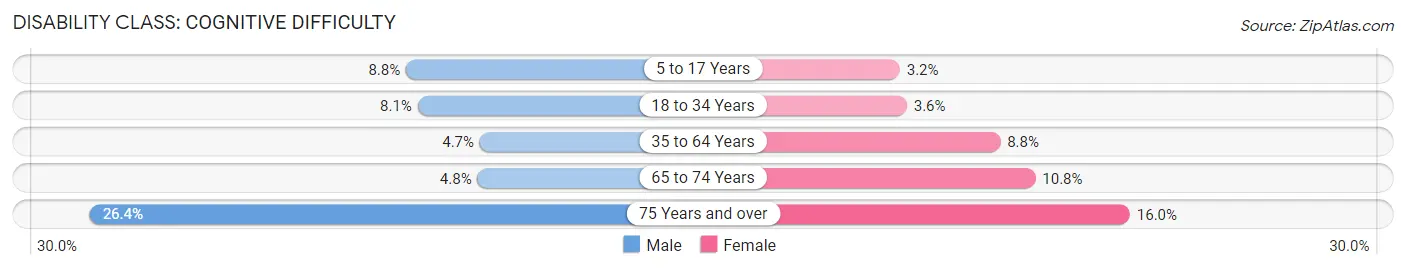
| Age Bracket | Male | Female |
| 5 to 17 Years | 272 (8.8%) | 90 (3.2%) |
| 18 to 34 Years | 267 (8.1%) | 117 (3.6%) |
| 35 to 64 Years | 302 (4.6%) | 542 (8.8%) |
| 65 to 74 Years | 77 (4.8%) | 183 (10.8%) |
| 75 Years and over | 226 (26.4%) | 195 (16.0%) |
Disability Class: Ambulatory Difficulty

| Age Bracket | Male | Female |
| 5 to 17 Years | 19 (0.6%) | 10 (0.4%) |
| 18 to 34 Years | 23 (0.7%) | 12 (0.4%) |
| 35 to 64 Years | 499 (7.7%) | 629 (10.2%) |
| 65 to 74 Years | 263 (16.3%) | 325 (19.1%) |
| 75 Years and over | 332 (38.7%) | 343 (28.2%) |
Disability Class: Self-Care Difficulty

| Age Bracket | Male | Female |
| 5 to 17 Years | 55 (1.8%) | 11 (0.4%) |
| 18 to 34 Years | 18 (0.5%) | 0 (0.0%) |
| 35 to 64 Years | 169 (2.6%) | 178 (2.9%) |
| 65 to 74 Years | 47 (2.9%) | 81 (4.8%) |
| 75 Years and over | 54 (6.3%) | 113 (9.3%) |
Technology Access in Gibson County
Computing Device Access in Gibson County

| Device Type | # Households | % Households |
| Desktop or Laptop | 9,096 | 70.1% |
| Smartphone | 11,231 | 86.5% |
| Tablet | 7,583 | 58.4% |
| No Computing Device | 976 | 7.5% |
| Total | 12,978 | 100.0% |
Internet Access in Gibson County
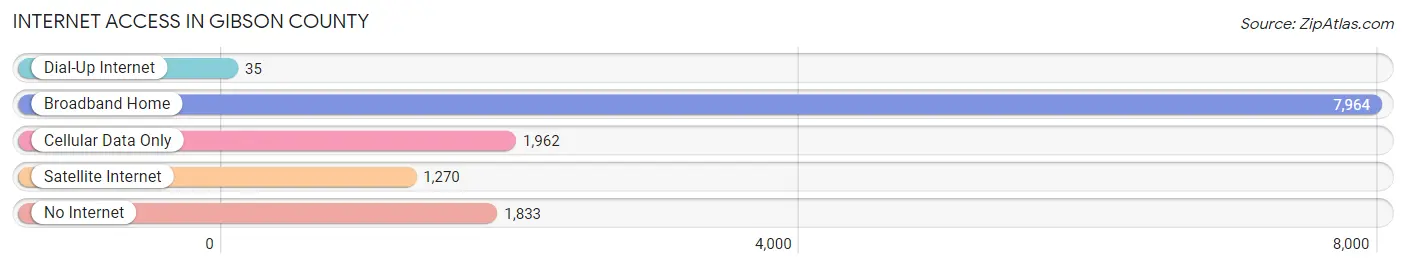
| Internet Type | # Households | % Households |
| Dial-Up Internet | 35 | 0.3% |
| Broadband Home | 7,964 | 61.4% |
| Cellular Data Only | 1,962 | 15.1% |
| Satellite Internet | 1,270 | 9.8% |
| No Internet | 1,833 | 14.1% |
| Total | 12,978 | 100.0% |
Gibson County Summary
Gibson County is located in the southwestern corner of Indiana, and is part of the Evansville, Indiana metropolitan area. The county was established in 1813 and named after John Gibson, the first Governor of Indiana. The county seat is Princeton, Indiana. As of the 2010 census, the population was 33,503.
Geography
Gibson County is located in the southwestern corner of Indiana, and is bordered by Posey County to the north, Vanderburgh County to the east, Warrick County to the south, and White County, Illinois to the west. The county has a total area of 441 square miles, of which 437 square miles is land and 4.2 square miles is water. The terrain is mostly flat, with some rolling hills in the northern part of the county. The Wabash River forms the western border of the county.
Demographics
As of the 2010 census, there were 33,503 people, 12,945 households, and 9,072 families residing in the county. The population density was 76.3 people per square mile. The racial makeup of the county was 95.2% White, 1.7% African American, 0.3% Native American, 0.4% Asian, 0.1% Pacific Islander, 1.2% from other races, and 1.1% from two or more races. Hispanic or Latino of any race were 2.7% of the population.
The median income for a household in the county was $41,945, and the median income for a family was $50,945. The per capita income for the county was $20,845. About 11.2% of families and 14.3% of the population were below the poverty line, including 19.2% of those under age 18 and 8.7% of those age 65 or over.
Economy
Gibson County is home to a variety of industries, including manufacturing, agriculture, and tourism. The county is home to several large manufacturing companies, including Toyota Motor Manufacturing Indiana, which produces the Toyota Highlander and Sienna minivans. Other major employers in the county include Gibson Generating Station, a coal-fired power plant, and Princeton Community Hospital.
Agriculture is also an important part of the economy in Gibson County. The county is home to several large farms, including the Gibson County Farm Bureau, which produces corn, soybeans, wheat, and hay. The county is also home to several wineries, including the Gibson County Winery, which produces a variety of wines.
Tourism is also an important part of the economy in Gibson County. The county is home to several attractions, including the Gibson County Fairgrounds, which hosts a variety of events throughout the year, and the Gibson County Historical Museum, which features exhibits on the county's history. The county is also home to several parks, including the Patoka River National Wildlife Refuge, which offers a variety of outdoor activities.
Conclusion
Gibson County is a rural county located in the southwestern corner of Indiana. The county is home to a variety of industries, including manufacturing, agriculture, and tourism. The county is also home to several attractions, including the Gibson County Fairgrounds and the Gibson County Historical Museum. The county has a population of 33,503, and the median income for a household is $41,945. Gibson County is an important part of the Evansville, Indiana metropolitan area, and is an important contributor to the region's economy.
Common Questions
What is the Total Population of Gibson County?
Total Population of Gibson County is 33,006.
What is the Total Male Population of Gibson County?
Total Male Population of Gibson County is 16,739.
What is the Total Female Population of Gibson County?
Total Female Population of Gibson County is 16,267.
What is the Ratio of Males per 100 Females in Gibson County?
There are 102.90 Males per 100 Females in Gibson County.
What is the Ratio of Females per 100 Males in Gibson County?
There are 97.18 Females per 100 Males in Gibson County.
What is the Median Population Age in Gibson County?
Median Population Age in Gibson County is 40.4 Years.
What is the Average Family Size in Gibson County
Average Family Size in Gibson County is 3.0 People.
What is the Average Household Size in Gibson County
Average Household Size in Gibson County is 2.5 People.
What is Per Capita Income in Gibson County?
Per Capita income in Gibson County is $31,602.
What is the Median Family Income in Gibson County?
Median Family Income in Gibson County is $81,143.
What is the Median Household income in Gibson County?
Median Household Income in Gibson County is $64,153.
What is Income or Wage Gap in Gibson County?
Income or Wage Gap in Gibson County is 40.9%.
Women in Gibson County earn 59.1 cents for every dollar earned by a man.
What is Family Income Deficit in Gibson County?
Family Income Deficit in Gibson County is $8,741.
Families that are below poverty line in Gibson County earn $8,741 less on average than the poverty threshold level.
What is Inequality or Gini Index in Gibson County?
Inequality or Gini Index in Gibson County is 0.40.
How Large is the Labor Force in Gibson County?
There are 16,320 People in the Labor Forcein in Gibson County.
What is the Percentage of People in the Labor Force in Gibson County?
62.5% of People are in the Labor Force in Gibson County.
What is the Unemployment Rate in Gibson County?
Unemployment Rate in Gibson County is 2.8%.