Fulton County, IN
Fulton County Map

Fulton County Overview
20,420
TOTAL POPULATION
10,257
MALE POPULATION
10,163
FEMALE POPULATION
100.92
MALES / 100 FEMALES
99.08
FEMALES / 100 MALES
40.9
MEDIAN AGE
3.0
AVG FAMILY SIZE
2.6
AVG HOUSEHOLD SIZE
$32,479
PER CAPITA INCOME
$75,020
AVG FAMILY INCOME
$62,644
AVG HOUSEHOLD INCOME
24.1%
WAGE / INCOME GAP [ % ]
75.9¢/ $1
WAGE / INCOME GAP [ $ ]
$6,547
FAMILY INCOME DEFICIT
0.44
INEQUALITY / GINI INDEX
9,572
LABOR FORCE [ PEOPLE ]
59.5%
PERCENT IN LABOR FORCE
7.2%
UNEMPLOYMENT RATE
Fulton County Area Codes
Race in Fulton County
The most populous races in Fulton County are White / Caucasian (18,623 | 91.2%), Hispanic or Latino (1,121 | 5.5%), and Some other Race (1,026 | 5.0%).
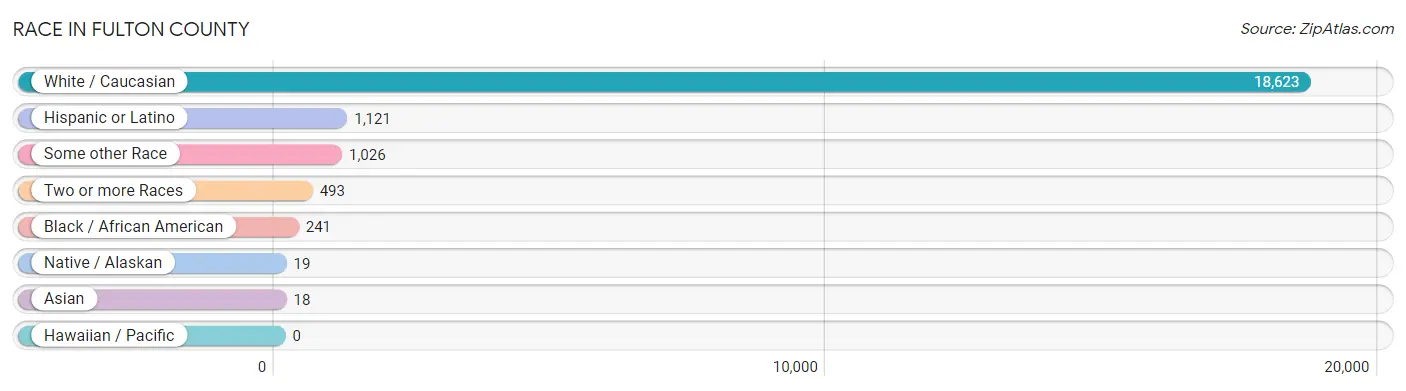
| Race | # Population | % Population |
| Asian | 18 | 0.1% |
| Black / African American | 241 | 1.2% |
| Hawaiian / Pacific | 0 | 0.0% |
| Hispanic or Latino | 1,121 | 5.5% |
| Native / Alaskan | 19 | 0.1% |
| White / Caucasian | 18,623 | 91.2% |
| Two or more Races | 493 | 2.4% |
| Some other Race | 1,026 | 5.0% |
| Total | 20,420 | 100.0% |
Ancestry in Fulton County
The most populous ancestries reported in Fulton County are German (4,659 | 22.8%), Irish (1,831 | 9.0%), English (1,643 | 8.1%), American (1,293 | 6.3%), and Mexican (1,069 | 5.2%), together accounting for 51.4% of all Fulton County residents.
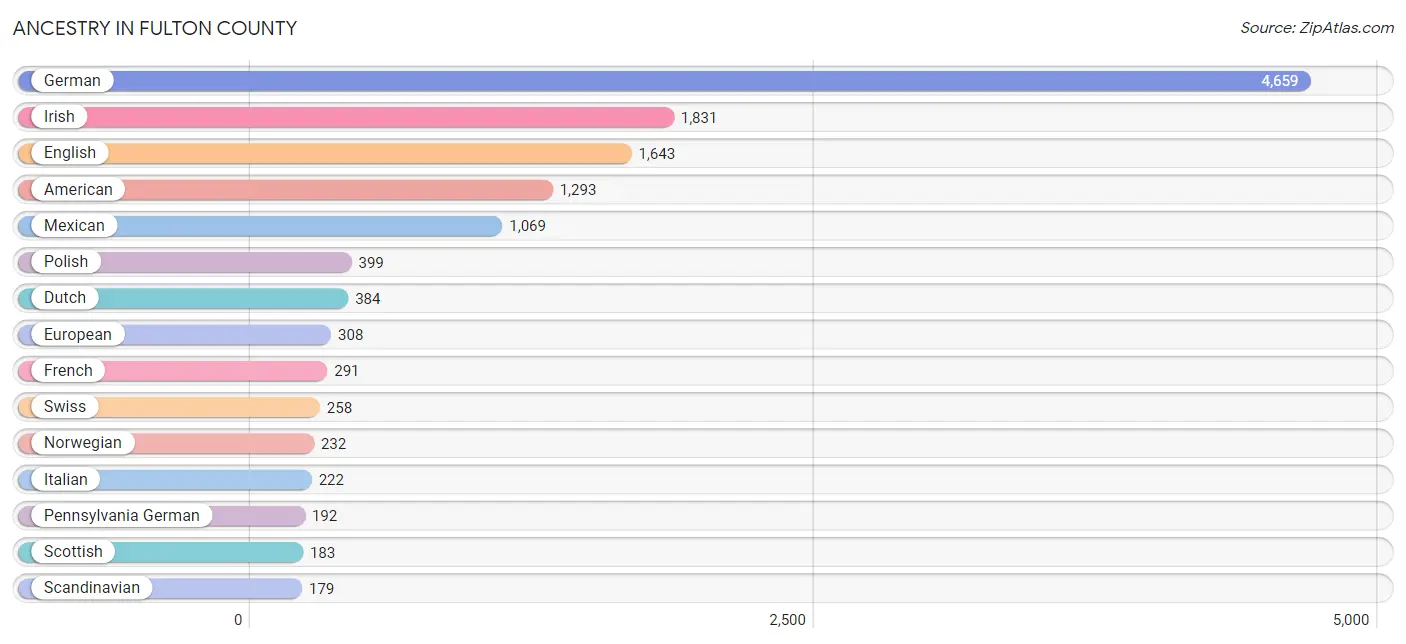
| Ancestry | # Population | % Population |
| American | 1,293 | 6.3% |
| Apache | 1 | 0.0% |
| Arab | 27 | 0.1% |
| Austrian | 6 | 0.0% |
| Belgian | 69 | 0.3% |
| Blackfeet | 2 | 0.0% |
| Brazilian | 62 | 0.3% |
| British | 136 | 0.7% |
| Burmese | 29 | 0.1% |
| Canadian | 117 | 0.6% |
| Cherokee | 16 | 0.1% |
| Croatian | 24 | 0.1% |
| Czech | 53 | 0.3% |
| Dominican | 7 | 0.0% |
| Dutch | 384 | 1.9% |
| English | 1,643 | 8.1% |
| European | 308 | 1.5% |
| French | 291 | 1.4% |
| French Canadian | 63 | 0.3% |
| German | 4,659 | 22.8% |
| Greek | 18 | 0.1% |
| Hungarian | 72 | 0.4% |
| Irish | 1,831 | 9.0% |
| Iroquois | 1 | 0.0% |
| Italian | 222 | 1.1% |
| Laotian | 8 | 0.0% |
| Lithuanian | 13 | 0.1% |
| Luxembourger | 26 | 0.1% |
| Mexican | 1,069 | 5.2% |
| Mexican American Indian | 4 | 0.0% |
| Navajo | 6 | 0.0% |
| Norwegian | 232 | 1.1% |
| Palestinian | 27 | 0.1% |
| Pennsylvania German | 192 | 0.9% |
| Polish | 399 | 1.9% |
| Portuguese | 51 | 0.3% |
| Puerto Rican | 10 | 0.1% |
| Romanian | 17 | 0.1% |
| Russian | 15 | 0.1% |
| Scandinavian | 179 | 0.9% |
| Scotch-Irish | 104 | 0.5% |
| Scottish | 183 | 0.9% |
| Sioux | 13 | 0.1% |
| Slovene | 20 | 0.1% |
| South African | 48 | 0.2% |
| Subsaharan African | 48 | 0.2% |
| Swedish | 146 | 0.7% |
| Swiss | 258 | 1.3% |
| Welsh | 163 | 0.8% | View All 49 Rows |
Immigrants in Fulton County
The most numerous immigrant groups reported in Fulton County came from Latin America (402 | 2.0%), Central America (333 | 1.6%), Mexico (313 | 1.5%), Asia (73 | 0.4%), and Brazil (62 | 0.3%), together accounting for 5.8% of all Fulton County residents.
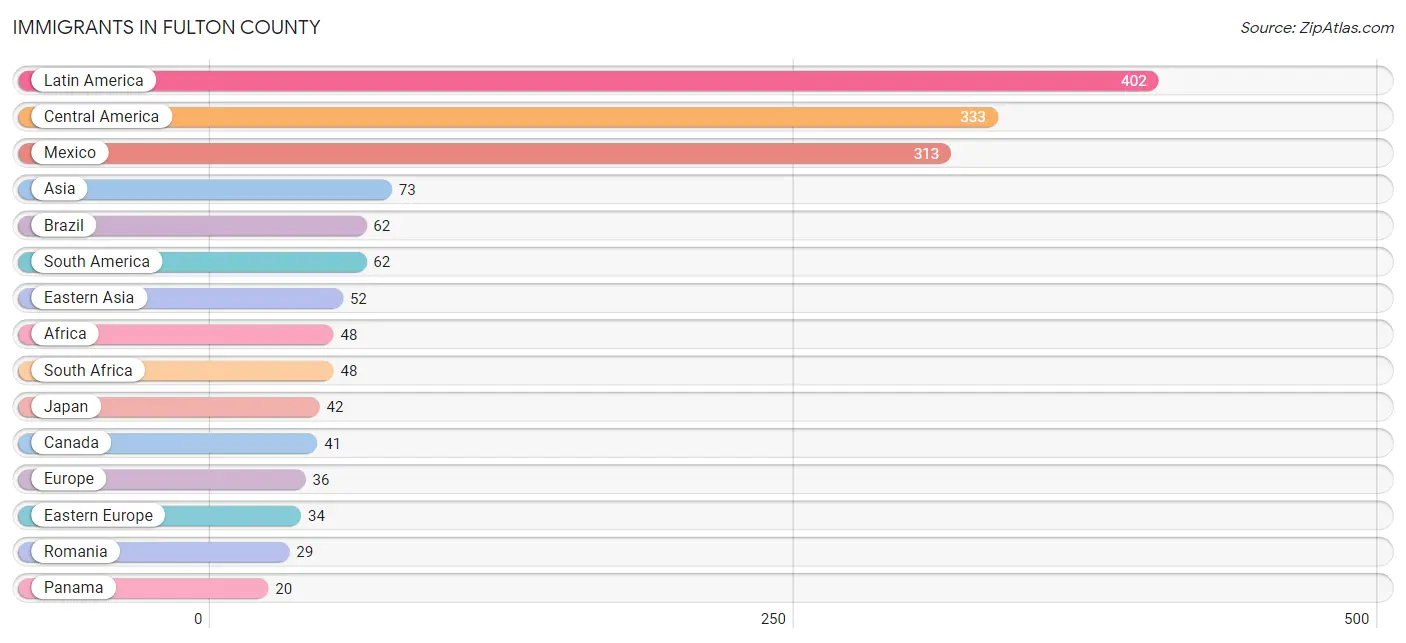
| Immigration Origin | # Population | % Population |
| Africa | 48 | 0.2% |
| Asia | 73 | 0.4% |
| Brazil | 62 | 0.3% |
| Canada | 41 | 0.2% |
| Caribbean | 7 | 0.0% |
| Central America | 333 | 1.6% |
| Dominican Republic | 7 | 0.0% |
| Eastern Asia | 52 | 0.3% |
| Eastern Europe | 34 | 0.2% |
| Europe | 36 | 0.2% |
| Germany | 2 | 0.0% |
| Indonesia | 8 | 0.0% |
| Japan | 42 | 0.2% |
| Jordan | 13 | 0.1% |
| Korea | 10 | 0.1% |
| Latin America | 402 | 2.0% |
| Mexico | 313 | 1.5% |
| Panama | 20 | 0.1% |
| Poland | 5 | 0.0% |
| Romania | 29 | 0.1% |
| South Africa | 48 | 0.2% |
| South America | 62 | 0.3% |
| South Eastern Asia | 8 | 0.0% |
| Western Asia | 13 | 0.1% |
| Western Europe | 2 | 0.0% | View All 25 Rows |
Sex and Age in Fulton County
Sex and Age in Fulton County
The most populous age groups in Fulton County are 55 to 59 Years (827 | 8.1%) for men and 55 to 59 Years (851 | 8.4%) for women.
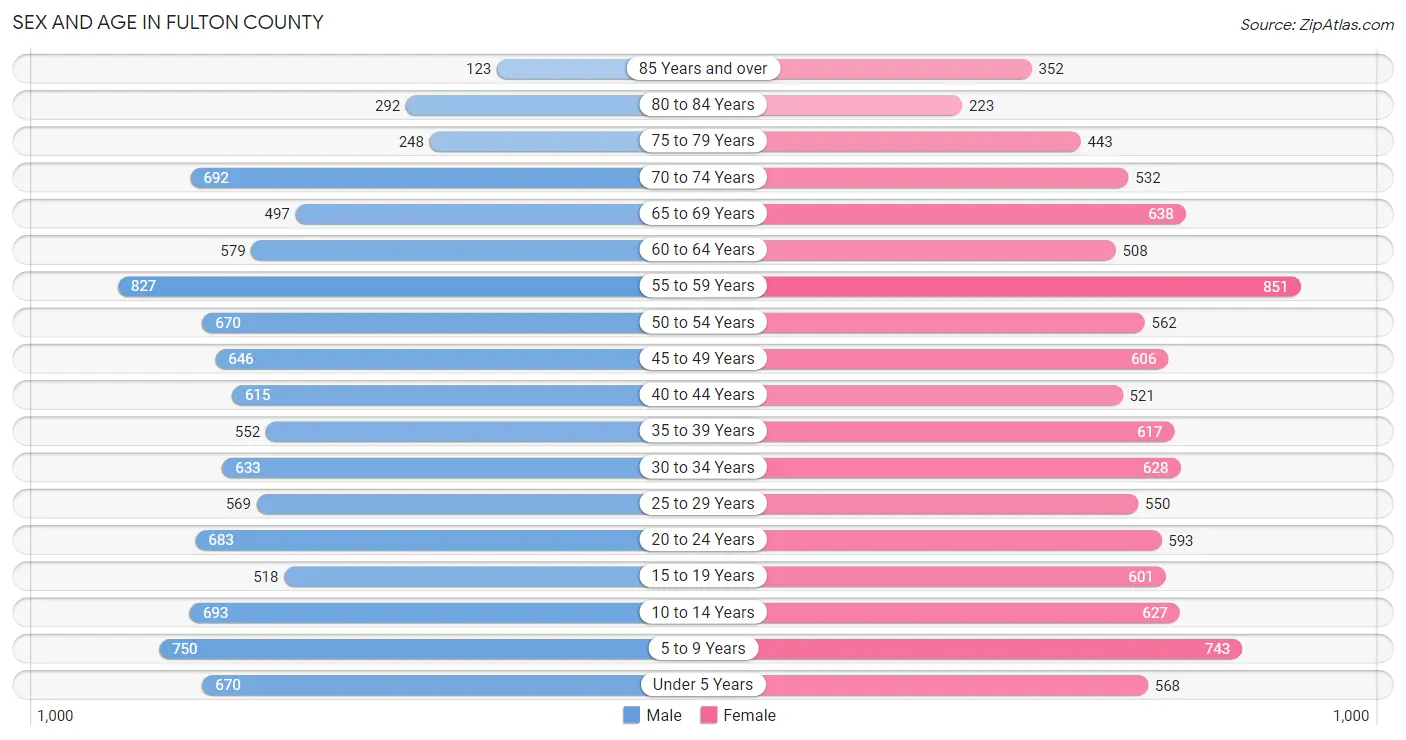
| Age Bracket | Male | Female |
| Under 5 Years | 670 (6.5%) | 568 (5.6%) |
| 5 to 9 Years | 750 (7.3%) | 743 (7.3%) |
| 10 to 14 Years | 693 (6.8%) | 627 (6.2%) |
| 15 to 19 Years | 518 (5.1%) | 601 (5.9%) |
| 20 to 24 Years | 683 (6.7%) | 593 (5.8%) |
| 25 to 29 Years | 569 (5.6%) | 550 (5.4%) |
| 30 to 34 Years | 633 (6.2%) | 628 (6.2%) |
| 35 to 39 Years | 552 (5.4%) | 617 (6.1%) |
| 40 to 44 Years | 615 (6.0%) | 521 (5.1%) |
| 45 to 49 Years | 646 (6.3%) | 606 (6.0%) |
| 50 to 54 Years | 670 (6.5%) | 562 (5.5%) |
| 55 to 59 Years | 827 (8.1%) | 851 (8.4%) |
| 60 to 64 Years | 579 (5.6%) | 508 (5.0%) |
| 65 to 69 Years | 497 (4.9%) | 638 (6.3%) |
| 70 to 74 Years | 692 (6.8%) | 532 (5.2%) |
| 75 to 79 Years | 248 (2.4%) | 443 (4.4%) |
| 80 to 84 Years | 292 (2.9%) | 223 (2.2%) |
| 85 Years and over | 123 (1.2%) | 352 (3.5%) |
| Total | 10,257 (100.0%) | 10,163 (100.0%) |
Families and Households in Fulton County
Median Family Size in Fulton County
The median family size in Fulton County is 3.04 persons per family, with married-couple families (4,031 | 74.0%) accounting for the largest median family size of 3.14 persons per family. On the other hand, single male/father families (370 | 6.8%) represent the smallest median family size with 2.54 persons per family.
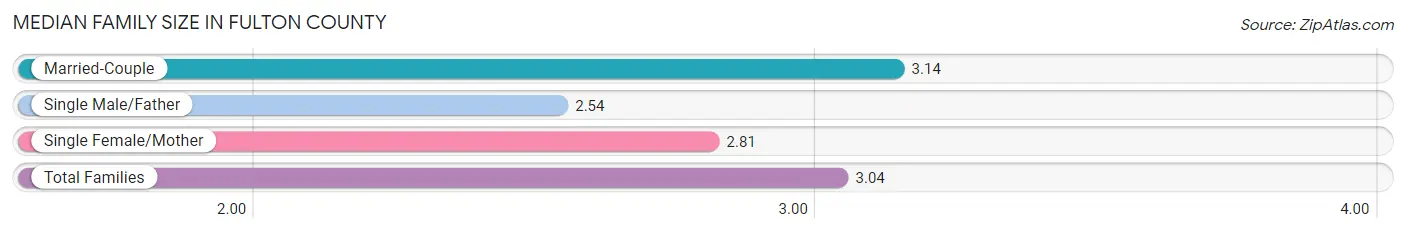
| Family Type | # Families | Family Size |
| Married-Couple | 4,031 (74.0%) | 3.14 |
| Single Male/Father | 370 (6.8%) | 2.54 |
| Single Female/Mother | 1,049 (19.3%) | 2.81 |
| Total Families | 5,450 (100.0%) | 3.04 |
Median Household Size in Fulton County
The median household size in Fulton County is 2.60 persons per household, with married-couple households (4,031 | 51.7%) accounting for the largest median household size of 3.2 persons per household. non-family households (2,344 | 30.1%) represent the smallest median household size with 1.24 persons per household.
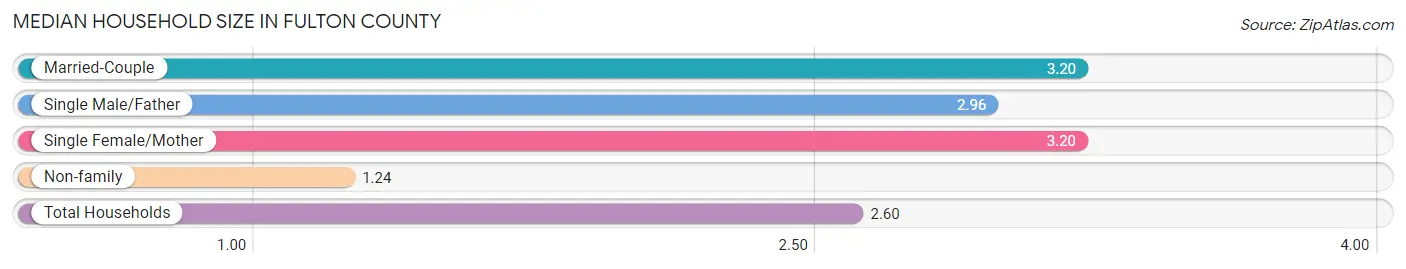
| Household Type | # Households | Household Size |
| Married-Couple | 4,031 (51.7%) | 3.20 |
| Single Male/Father | 370 (4.8%) | 2.96 |
| Single Female/Mother | 1,049 (13.5%) | 3.20 |
| Non-family | 2,344 (30.1%) | 1.24 |
| Total Households | 7,794 (100.0%) | 2.60 |
Household Size by Marriage Status in Fulton County
Out of a total of 7,794 households in Fulton County, 5,450 (69.9%) are family households, while 2,344 (30.1%) are nonfamily households. The most numerous type of family households are 2-person households, comprising 2,656, and the most common type of nonfamily households are 1-person households, comprising 2,072.
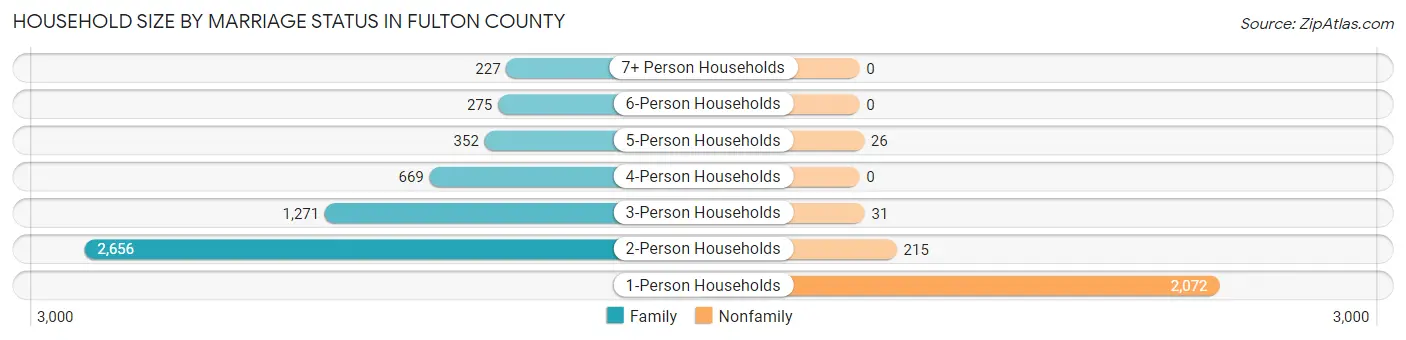
| Household Size | Family Households | Nonfamily Households |
| 1-Person Households | - | 2,072 (26.6%) |
| 2-Person Households | 2,656 (34.1%) | 215 (2.8%) |
| 3-Person Households | 1,271 (16.3%) | 31 (0.4%) |
| 4-Person Households | 669 (8.6%) | 0 (0.0%) |
| 5-Person Households | 352 (4.5%) | 26 (0.3%) |
| 6-Person Households | 275 (3.5%) | 0 (0.0%) |
| 7+ Person Households | 227 (2.9%) | 0 (0.0%) |
| Total | 5,450 (69.9%) | 2,344 (30.1%) |
Female Fertility in Fulton County
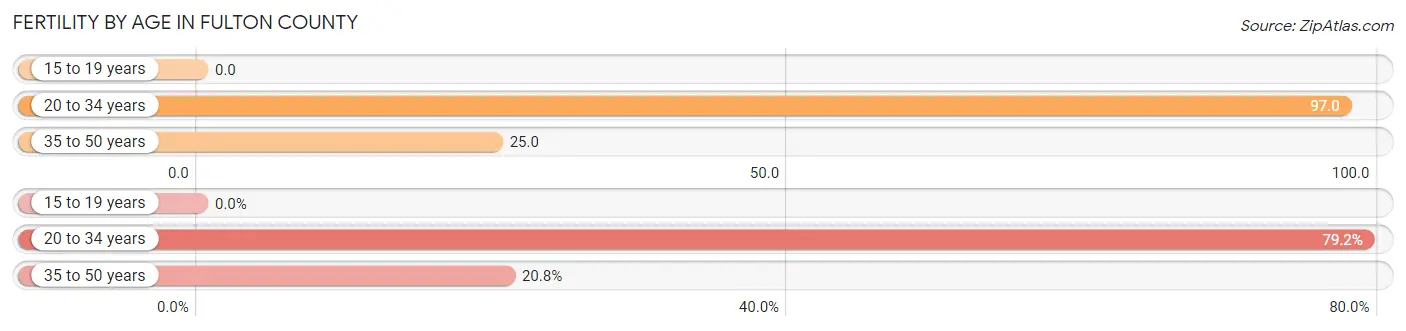
Fertility by Age in Fulton County
Average fertility rate in Fulton County is 51.0 births per 1,000 women. Women in the age bracket of 20 to 34 years have the highest fertility rate with 97.0 births per 1,000 women. Women in the age bracket of 20 to 34 years acount for 79.2% of all women with births.
| Age Bracket | Women with Births | Births / 1,000 Women |
| 15 to 19 years | 0 (0.0%) | 0.0 |
| 20 to 34 years | 171 (79.2%) | 97.0 |
| 35 to 50 years | 45 (20.8%) | 25.0 |
| Total | 216 (100.0%) | 51.0 |
Fertility by Age by Marriage Status in Fulton County
57.4% of women with births (216) in Fulton County are married. The highest percentage of unmarried women with births falls into 20 to 34 years age bracket with 53.8% of them unmarried at the time of birth, while the lowest percentage of unmarried women with births belong to 35 to 50 years age bracket with 0.0% of them unmarried.
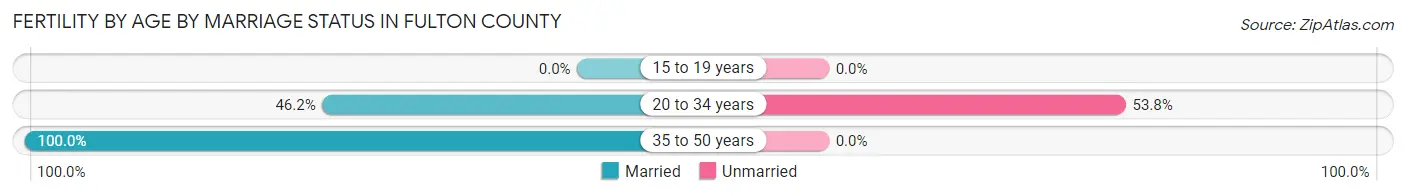
| Age Bracket | Married | Unmarried |
| 15 to 19 years | 0 (0.0%) | 0 (0.0%) |
| 20 to 34 years | 79 (46.2%) | 92 (53.8%) |
| 35 to 50 years | 45 (100.0%) | 0 (0.0%) |
| Total | 124 (57.4%) | 92 (42.6%) |
Fertility by Education in Fulton County
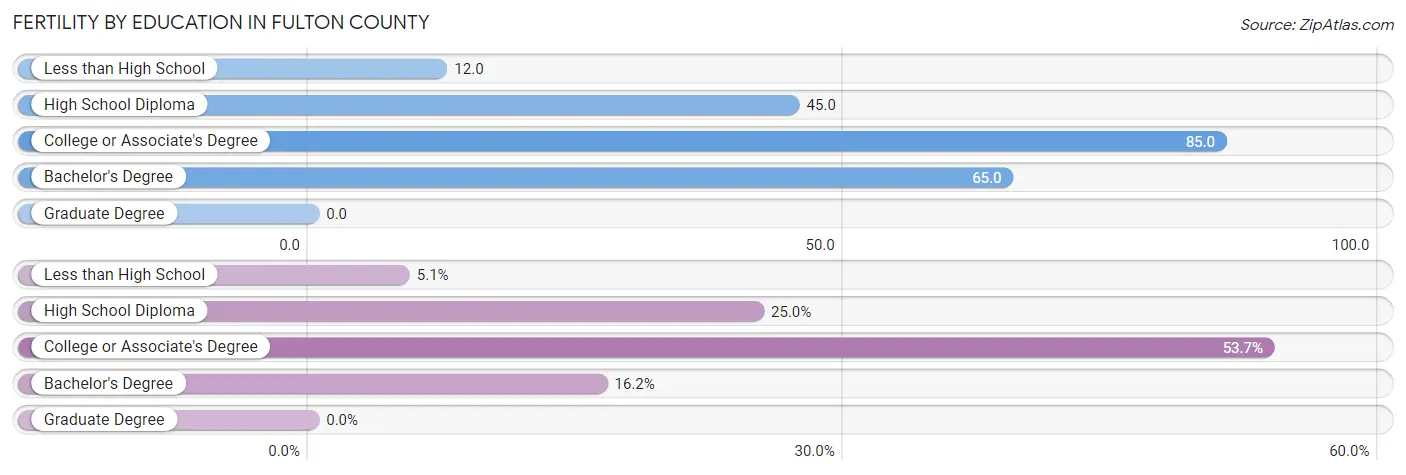
| Educational Attainment | Women with Births | Births / 1,000 Women |
| Less than High School | 11 (5.1%) | 12.0 |
| High School Diploma | 54 (25.0%) | 45.0 |
| College or Associate's Degree | 116 (53.7%) | 85.0 |
| Bachelor's Degree | 35 (16.2%) | 65.0 |
| Graduate Degree | 0 (0.0%) | 0.0 |
| Total | 216 (100.0%) | 51.0 |
Fertility by Education by Marriage Status in Fulton County
42.6% of women with births in Fulton County are unmarried. Women with the educational attainment of bachelor's degree are most likely to be married with 100.0% of them married at childbirth, while women with the educational attainment of less than high school are least likely to be married with 100.0% of them unmarried at childbirth.
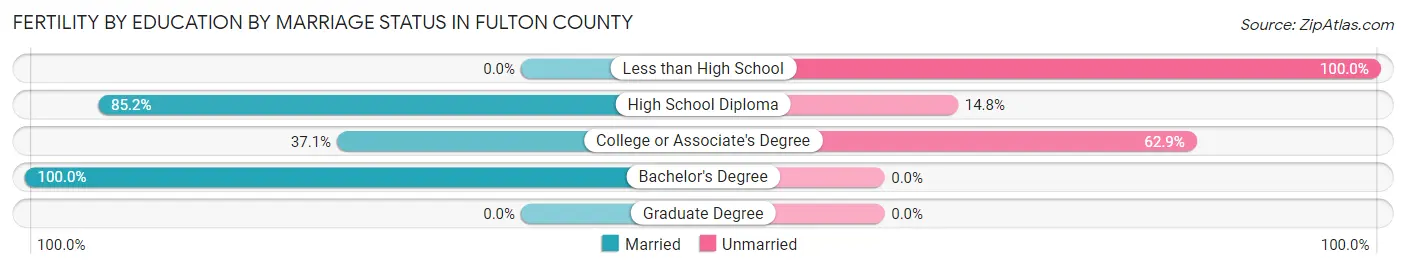
| Educational Attainment | Married | Unmarried |
| Less than High School | 0 (0.0%) | 11 (100.0%) |
| High School Diploma | 46 (85.2%) | 8 (14.8%) |
| College or Associate's Degree | 43 (37.1%) | 73 (62.9%) |
| Bachelor's Degree | 35 (100.0%) | 0 (0.0%) |
| Graduate Degree | 0 (0.0%) | 0 (0.0%) |
| Total | 124 (57.4%) | 92 (42.6%) |
Income in Fulton County
Income Overview in Fulton County
Per Capita Income in Fulton County is $32,479, while median incomes of families and households are $75,020 and $62,644 respectively.
| Characteristic | Number | Measure |
| Per Capita Income | 20,420 | $32,479 |
| Median Family Income | 5,450 | $75,020 |
| Mean Family Income | 5,450 | $91,022 |
| Median Household Income | 7,794 | $62,644 |
| Mean Household Income | 7,794 | $81,844 |
| Income Deficit | 5,450 | $6,547 |
| Wage / Income Gap (%) | 20,420 | 24.13% |
| Wage / Income Gap ($) | 20,420 | 75.87¢ per $1 |
| Gini / Inequality Index | 20,420 | 0.44 |
Earnings by Sex in Fulton County
Average Earnings in Fulton County are $38,439, $43,611 for men and $33,086 for women, a difference of 24.1%.
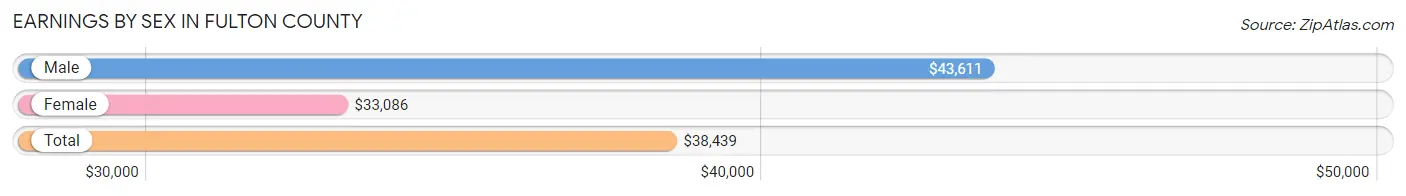
| Sex | Number | Average Earnings |
| Male | 5,446 (53.4%) | $43,611 |
| Female | 4,748 (46.6%) | $33,086 |
| Total | 10,194 (100.0%) | $38,439 |
Earnings by Sex by Income Bracket in Fulton County
The most common earnings brackets in Fulton County are $100,000+ for men (790 | 14.5%) and $40,000 to $44,999 for women (684 | 14.4%).
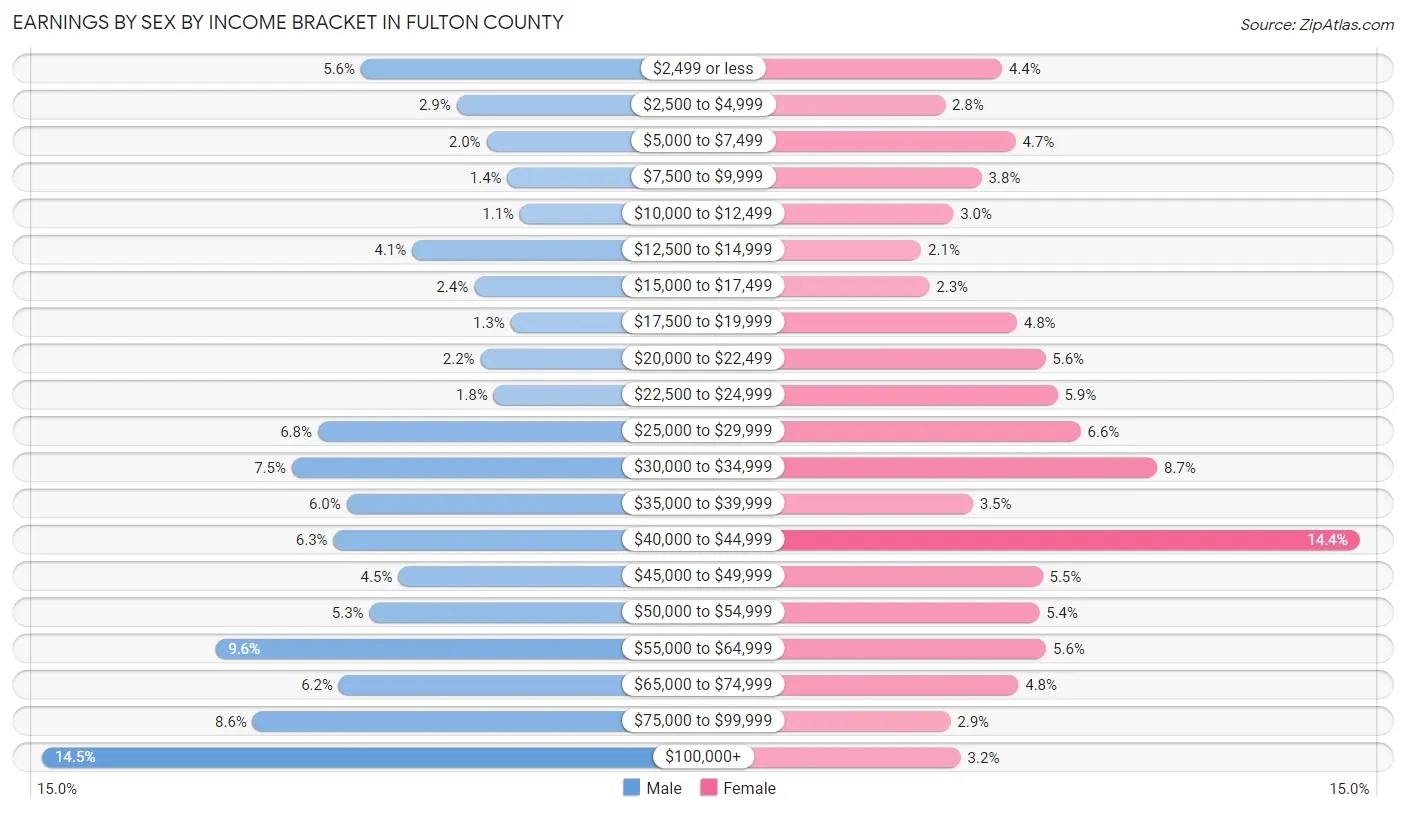
| Income | Male | Female |
| $2,499 or less | 302 (5.6%) | 207 (4.4%) |
| $2,500 to $4,999 | 156 (2.9%) | 131 (2.8%) |
| $5,000 to $7,499 | 110 (2.0%) | 225 (4.7%) |
| $7,500 to $9,999 | 78 (1.4%) | 180 (3.8%) |
| $10,000 to $12,499 | 59 (1.1%) | 142 (3.0%) |
| $12,500 to $14,999 | 224 (4.1%) | 99 (2.1%) |
| $15,000 to $17,499 | 129 (2.4%) | 110 (2.3%) |
| $17,500 to $19,999 | 73 (1.3%) | 227 (4.8%) |
| $20,000 to $22,499 | 119 (2.2%) | 265 (5.6%) |
| $22,500 to $24,999 | 99 (1.8%) | 281 (5.9%) |
| $25,000 to $29,999 | 368 (6.8%) | 312 (6.6%) |
| $30,000 to $34,999 | 408 (7.5%) | 414 (8.7%) |
| $35,000 to $39,999 | 324 (5.9%) | 168 (3.5%) |
| $40,000 to $44,999 | 344 (6.3%) | 684 (14.4%) |
| $45,000 to $49,999 | 245 (4.5%) | 261 (5.5%) |
| $50,000 to $54,999 | 289 (5.3%) | 257 (5.4%) |
| $55,000 to $64,999 | 525 (9.6%) | 266 (5.6%) |
| $65,000 to $74,999 | 336 (6.2%) | 229 (4.8%) |
| $75,000 to $99,999 | 468 (8.6%) | 138 (2.9%) |
| $100,000+ | 790 (14.5%) | 152 (3.2%) |
| Total | 5,446 (100.0%) | 4,748 (100.0%) |
Earnings by Sex by Educational Attainment in Fulton County
Average earnings in Fulton County are $47,692 for men and $37,349 for women, a difference of 21.7%. Men with an educational attainment of bachelor's degree enjoy the highest average annual earnings of $59,911, while those with less than high school education earn the least with $31,618. Women with an educational attainment of graduate degree earn the most with the average annual earnings of $65,515, while those with high school diploma education have the smallest earnings of $28,496.
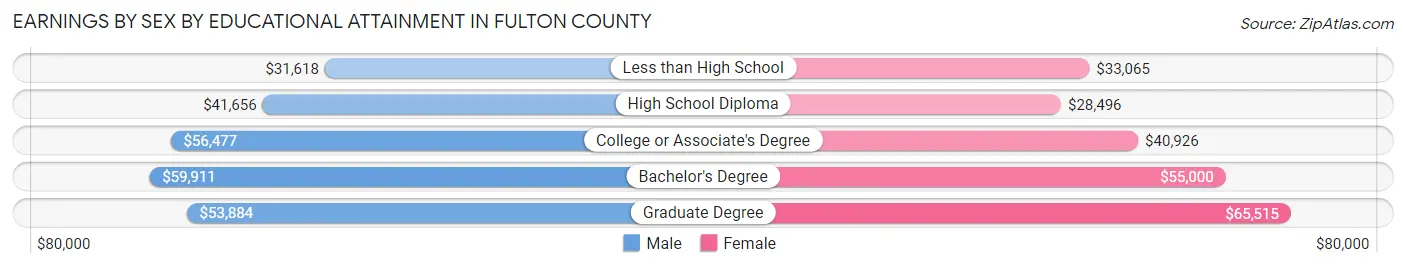
| Educational Attainment | Male Income | Female Income |
| Less than High School | $31,618 | $33,065 |
| High School Diploma | $41,656 | $28,496 |
| College or Associate's Degree | $56,477 | $40,926 |
| Bachelor's Degree | $59,911 | $55,000 |
| Graduate Degree | $53,884 | $65,515 |
| Total | $47,692 | $37,349 |
Family Income in Fulton County
Family Income Brackets in Fulton County
According to the Fulton County family income data, there are 1,177 families falling into the $100,000 to $149,999 income range, which is the most common income bracket and makes up 21.6% of all families. Conversely, the $10,000 to $14,999 income bracket is the least frequent group with only 71 families (1.3%) belonging to this category.
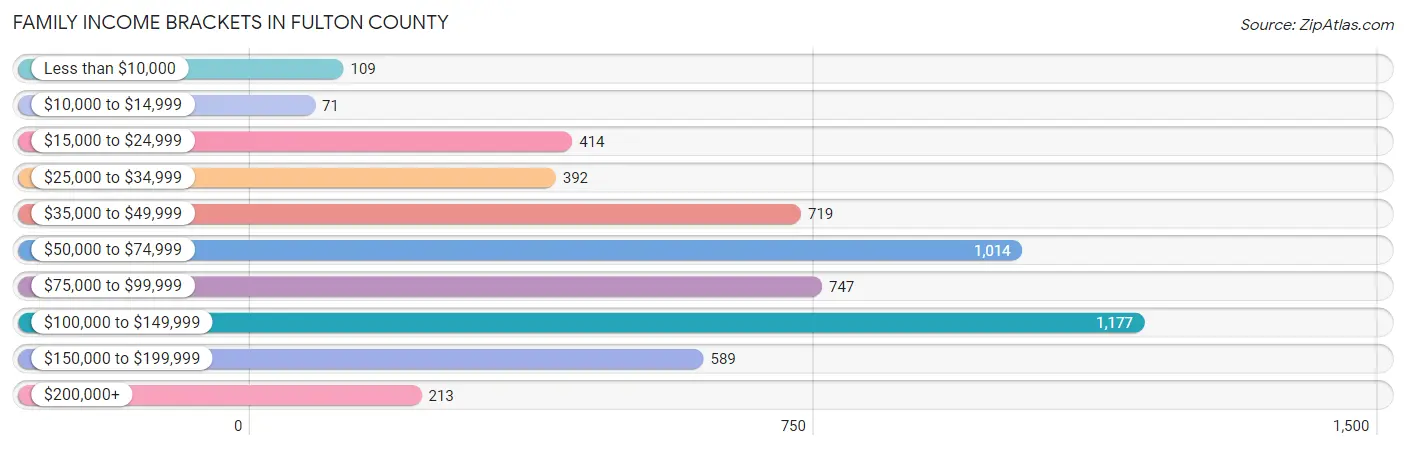
| Income Bracket | # Families | % Families |
| Less than $10,000 | 109 | 2.0% |
| $10,000 to $14,999 | 71 | 1.3% |
| $15,000 to $24,999 | 414 | 7.6% |
| $25,000 to $34,999 | 392 | 7.2% |
| $35,000 to $49,999 | 719 | 13.2% |
| $50,000 to $74,999 | 1,014 | 18.6% |
| $75,000 to $99,999 | 747 | 13.7% |
| $100,000 to $149,999 | 1,177 | 21.6% |
| $150,000 to $199,999 | 589 | 10.8% |
| $200,000+ | 213 | 3.9% |
Family Income by Famaliy Size in Fulton County
6-person families (205 | 3.8%) account for the highest median family income in Fulton County with $132,132 per family, while 2-person families (3,025 | 55.5%) have the highest median income of $32,360 per family member.
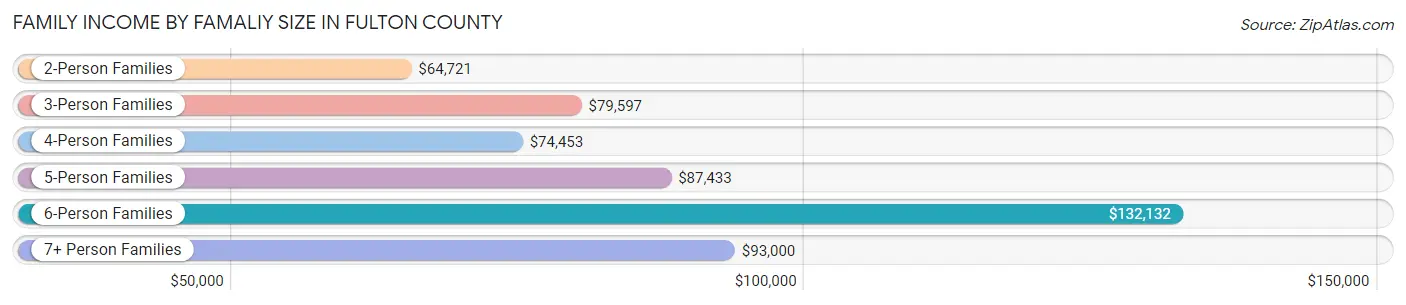
| Income Bracket | # Families | Median Income |
| 2-Person Families | 3,025 (55.5%) | $64,721 |
| 3-Person Families | 962 (17.6%) | $79,597 |
| 4-Person Families | 651 (11.9%) | $74,453 |
| 5-Person Families | 443 (8.1%) | $87,433 |
| 6-Person Families | 205 (3.8%) | $132,132 |
| 7+ Person Families | 164 (3.0%) | $93,000 |
| Total | 5,450 (100.0%) | $75,020 |
Family Income by Number of Earners in Fulton County
The median family income in Fulton County is $75,020, with families comprising 3+ earners (418) having the highest median family income of $126,034, while families with no earners (996) have the lowest median family income of $36,484, accounting for 7.7% and 18.3% of families, respectively.
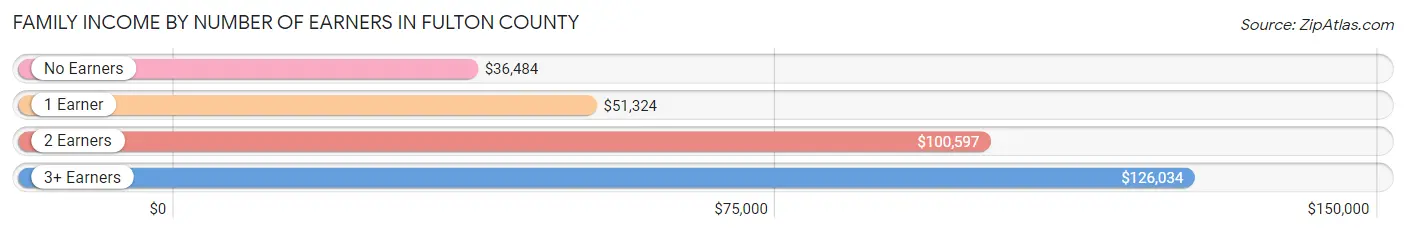
| Number of Earners | # Families | Median Income |
| No Earners | 996 (18.3%) | $36,484 |
| 1 Earner | 1,544 (28.3%) | $51,324 |
| 2 Earners | 2,492 (45.7%) | $100,597 |
| 3+ Earners | 418 (7.7%) | $126,034 |
| Total | 5,450 (100.0%) | $75,020 |
Household Income in Fulton County
Household Income Brackets in Fulton County
With 1,403 households falling in the category, the $50,000 to $74,999 income range is the most frequent in Fulton County, accounting for 18.0% of all households. In contrast, only 281 households (3.6%) fall into the $200,000+ income bracket, making it the least populous group.
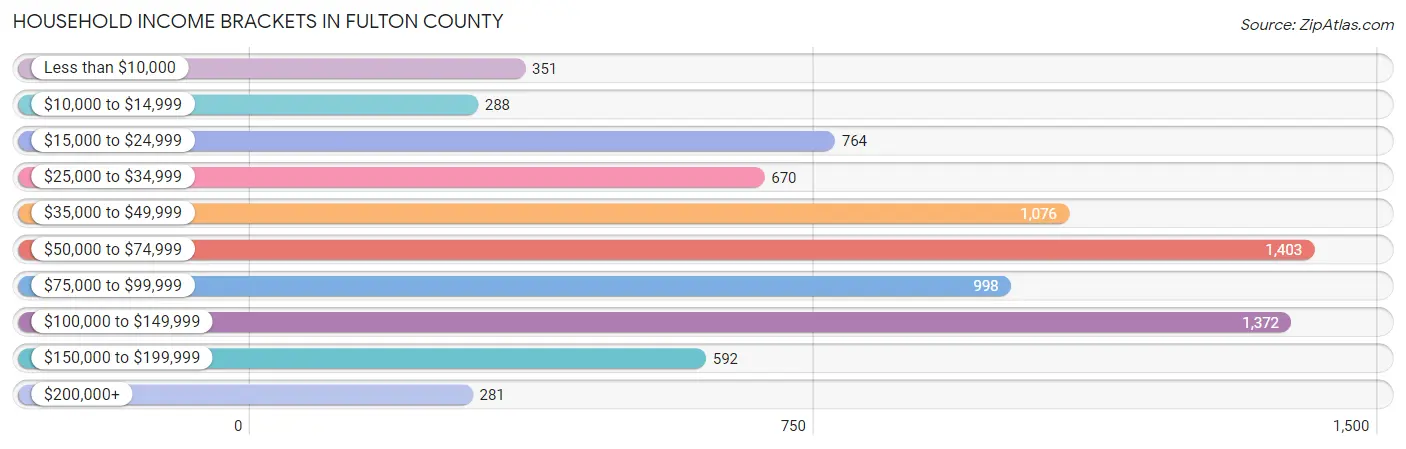
| Income Bracket | # Households | % Households |
| Less than $10,000 | 351 | 4.5% |
| $10,000 to $14,999 | 288 | 3.7% |
| $15,000 to $24,999 | 764 | 9.8% |
| $25,000 to $34,999 | 670 | 8.6% |
| $35,000 to $49,999 | 1,076 | 13.8% |
| $50,000 to $74,999 | 1,403 | 18.0% |
| $75,000 to $99,999 | 998 | 12.8% |
| $100,000 to $149,999 | 1,372 | 17.6% |
| $150,000 to $199,999 | 592 | 7.6% |
| $200,000+ | 281 | 3.6% |
Household Income by Householder Age in Fulton County
The median household income in Fulton County is $62,644, with the highest median household income of $80,208 found in the 45 to 64 years age bracket for the primary householder. A total of 2,971 households (38.1%) fall into this category. Meanwhile, the 65+ years age bracket for the primary householder has the lowest median household income of $39,145, with 2,470 households (31.7%) in this group.

| Income Bracket | # Households | Median Income |
| 15 to 24 Years | 276 (3.5%) | $62,803 |
| 25 to 44 Years | 2,077 (26.7%) | $73,891 |
| 45 to 64 Years | 2,971 (38.1%) | $80,208 |
| 65+ Years | 2,470 (31.7%) | $39,145 |
| Total | 7,794 (100.0%) | $62,644 |
Poverty in Fulton County
Income Below Poverty by Sex and Age in Fulton County
With 15.5% poverty level for males and 14.1% for females among the residents of Fulton County, 6 to 11 year old males and 16 and 17 year old females are the most vulnerable to poverty, with 265 males (30.1%) and 133 females (57.1%) in their respective age groups living below the poverty level.

| Age Bracket | Male | Female |
| Under 5 Years | 188 (29.8%) | 46 (8.5%) |
| 5 Years | 45 (27.8%) | 35 (21.7%) |
| 6 to 11 Years | 265 (30.1%) | 160 (18.9%) |
| 12 to 14 Years | 24 (6.4%) | 34 (10.6%) |
| 15 Years | 15 (13.3%) | 7 (4.2%) |
| 16 and 17 Years | 60 (21.3%) | 133 (57.1%) |
| 18 to 24 Years | 88 (11.0%) | 143 (18.2%) |
| 25 to 34 Years | 202 (17.1%) | 298 (25.3%) |
| 35 to 44 Years | 93 (8.0%) | 75 (6.6%) |
| 45 to 54 Years | 197 (15.1%) | 107 (9.2%) |
| 55 to 64 Years | 223 (16.0%) | 157 (11.6%) |
| 65 to 74 Years | 84 (7.1%) | 128 (11.0%) |
| 75 Years and over | 82 (12.8%) | 88 (9.2%) |
| Total | 1,566 (15.5%) | 1,411 (14.1%) |
Income Above Poverty by Sex and Age in Fulton County
According to the poverty statistics in Fulton County, males aged 12 to 14 years and females aged 15 years are the age groups that are most secure financially, with 93.6% of males and 95.8% of females in these age groups living above the poverty line.
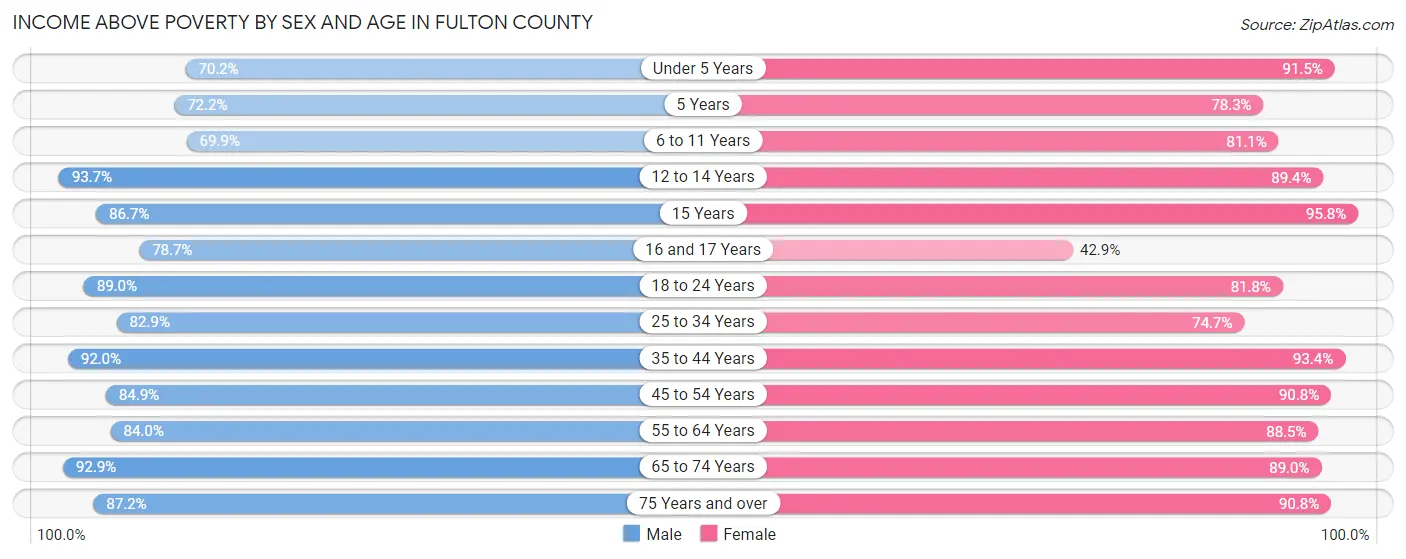
| Age Bracket | Male | Female |
| Under 5 Years | 442 (70.2%) | 494 (91.5%) |
| 5 Years | 117 (72.2%) | 126 (78.3%) |
| 6 to 11 Years | 616 (69.9%) | 685 (81.1%) |
| 12 to 14 Years | 354 (93.6%) | 286 (89.4%) |
| 15 Years | 98 (86.7%) | 161 (95.8%) |
| 16 and 17 Years | 222 (78.7%) | 100 (42.9%) |
| 18 to 24 Years | 713 (89.0%) | 644 (81.8%) |
| 25 to 34 Years | 982 (82.9%) | 880 (74.7%) |
| 35 to 44 Years | 1,067 (92.0%) | 1,063 (93.4%) |
| 45 to 54 Years | 1,108 (84.9%) | 1,058 (90.8%) |
| 55 to 64 Years | 1,174 (84.0%) | 1,202 (88.4%) |
| 65 to 74 Years | 1,095 (92.9%) | 1,036 (89.0%) |
| 75 Years and over | 560 (87.2%) | 869 (90.8%) |
| Total | 8,548 (84.5%) | 8,604 (85.9%) |
Income Below Poverty Among Married-Couple Families in Fulton County
The poverty statistics for married-couple families in Fulton County show that 6.2% or 251 of the total 4,031 families live below the poverty line. Families with 5 or more children have the highest poverty rate of 16.4%, comprising of 12 families. On the other hand, families with no children have the lowest poverty rate of 3.6%, which includes 85 families.
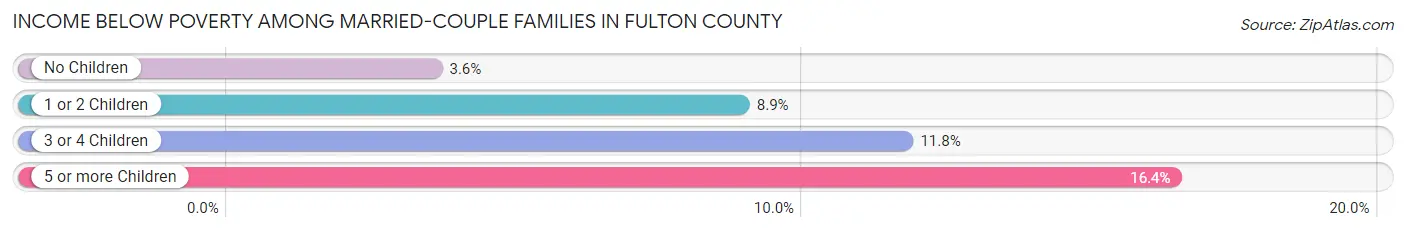
| Children | Above Poverty | Below Poverty |
| No Children | 2,302 (96.4%) | 85 (3.6%) |
| 1 or 2 Children | 982 (91.1%) | 96 (8.9%) |
| 3 or 4 Children | 435 (88.2%) | 58 (11.8%) |
| 5 or more Children | 61 (83.6%) | 12 (16.4%) |
| Total | 3,780 (93.8%) | 251 (6.2%) |
Income Below Poverty Among Single-Parent Households in Fulton County
According to the poverty data in Fulton County, 16.5% or 61 single-father households and 25.4% or 266 single-mother households are living below the poverty line. Among single-father households, those with 3 or 4 children have the highest poverty rate, with 5 households (100.0%) experiencing poverty. Likewise, among single-mother households, those with 5 or more children have the highest poverty rate, with 11 households (100.0%) falling below the poverty line.
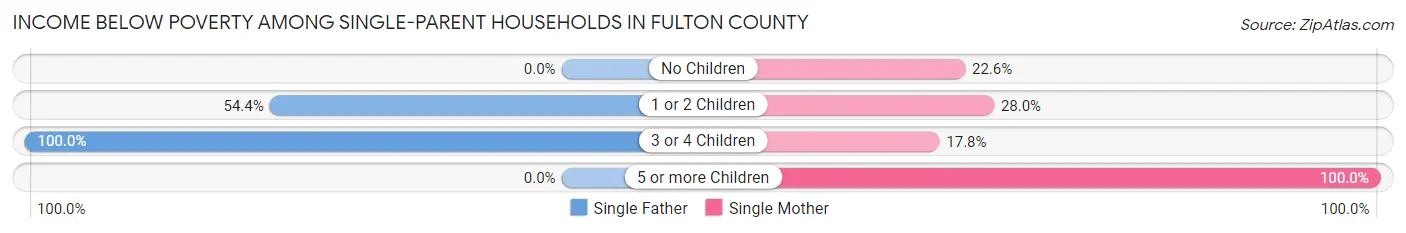
| Children | Single Father | Single Mother |
| No Children | 0 (0.0%) | 106 (22.6%) |
| 1 or 2 Children | 56 (54.4%) | 131 (28.0%) |
| 3 or 4 Children | 5 (100.0%) | 18 (17.8%) |
| 5 or more Children | 0 (0.0%) | 11 (100.0%) |
| Total | 61 (16.5%) | 266 (25.4%) |
Income Below Poverty Among Married-Couple vs Single-Parent Households in Fulton County
The poverty data for Fulton County shows that 251 of the married-couple family households (6.2%) and 327 of the single-parent households (23.0%) are living below the poverty level. Within the married-couple family households, those with 5 or more children have the highest poverty rate, with 12 households (16.4%) falling below the poverty line. Among the single-parent households, those with 5 or more children have the highest poverty rate, with 11 household (100.0%) living below poverty.
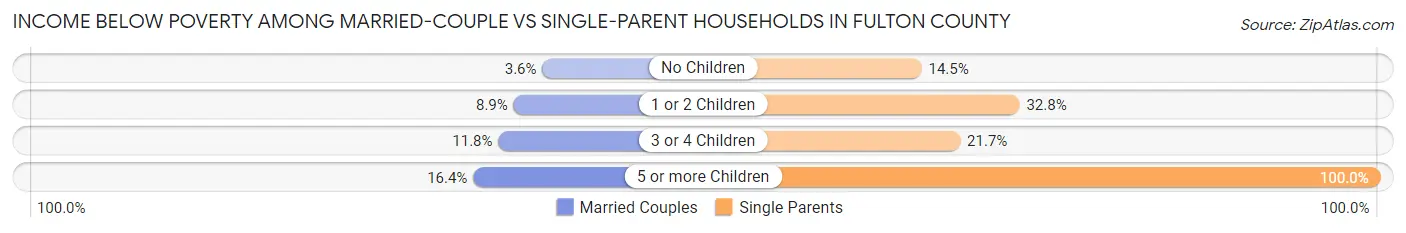
| Children | Married-Couple Families | Single-Parent Households |
| No Children | 85 (3.6%) | 106 (14.5%) |
| 1 or 2 Children | 96 (8.9%) | 187 (32.8%) |
| 3 or 4 Children | 58 (11.8%) | 23 (21.7%) |
| 5 or more Children | 12 (16.4%) | 11 (100.0%) |
| Total | 251 (6.2%) | 327 (23.0%) |
Employment Characteristics in Fulton County
Employment by Class of Employer in Fulton County
Among the 8,674 employed individuals in Fulton County, private company employees (6,235 | 71.9%), local government employees (781 | 9.0%), and not-for-profit organizations (614 | 7.1%) make up the most common classes of employment.
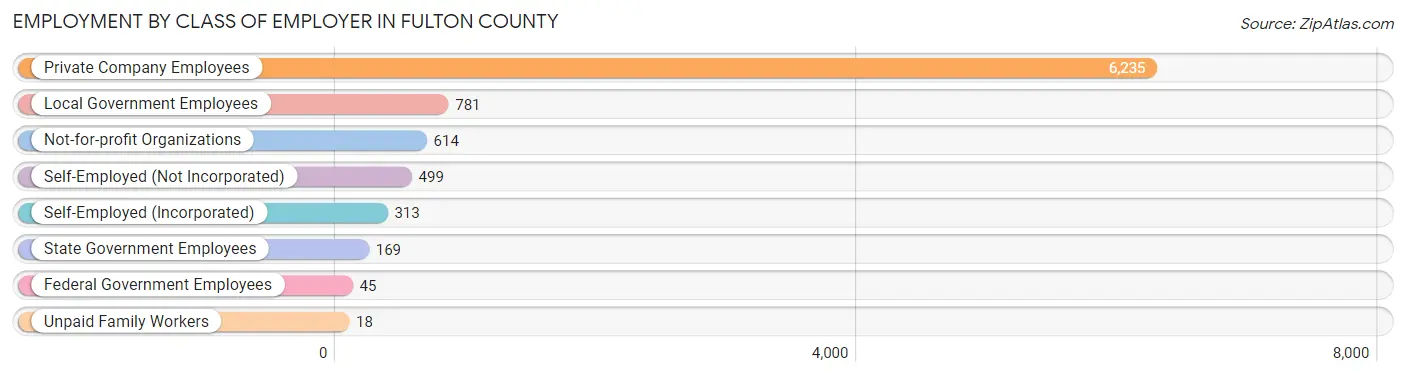
| Employer Class | # Employees | % Employees |
| Private Company Employees | 6,235 | 71.9% |
| Self-Employed (Incorporated) | 313 | 3.6% |
| Self-Employed (Not Incorporated) | 499 | 5.8% |
| Not-for-profit Organizations | 614 | 7.1% |
| Local Government Employees | 781 | 9.0% |
| State Government Employees | 169 | 1.9% |
| Federal Government Employees | 45 | 0.5% |
| Unpaid Family Workers | 18 | 0.2% |
| Total | 8,674 | 100.0% |
Employment Status by Age in Fulton County
According to the labor force statistics for Fulton County, out of the total population over 16 years of age (16,088), 59.5% or 9,572 individuals are in the labor force, with 7.2% or 689 of them unemployed. The age group with the highest labor force participation rate is 35 to 44 years, with 88.1% or 2,031 individuals in the labor force. Within the labor force, the 25 to 29 years age range has the highest percentage of unemployed individuals, with 18.9% or 168 of them being unemployed.
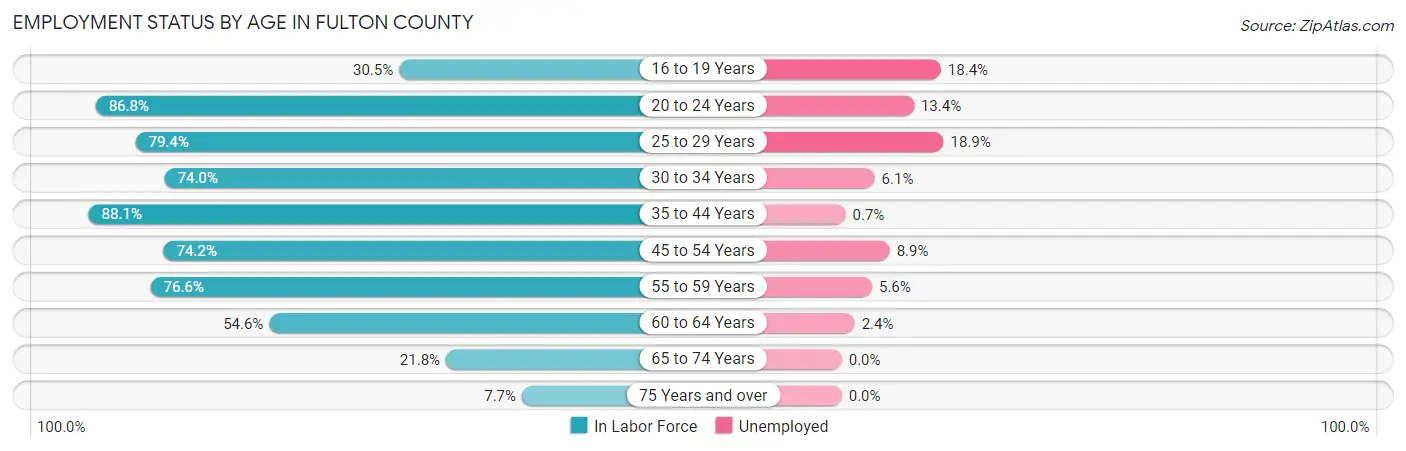
| Age Bracket | In Labor Force | Unemployed |
| 16 to 19 Years | 256 (30.5%) | 47 (18.4%) |
| 20 to 24 Years | 1,108 (86.8%) | 148 (13.4%) |
| 25 to 29 Years | 888 (79.4%) | 168 (18.9%) |
| 30 to 34 Years | 933 (74.0%) | 57 (6.1%) |
| 35 to 44 Years | 2,031 (88.1%) | 14 (0.7%) |
| 45 to 54 Years | 1,843 (74.2%) | 164 (8.9%) |
| 55 to 59 Years | 1,285 (76.6%) | 72 (5.6%) |
| 60 to 64 Years | 594 (54.6%) | 14 (2.4%) |
| 65 to 74 Years | 514 (21.8%) | 0 (0.0%) |
| 75 Years and over | 129 (7.7%) | 0 (0.0%) |
| Total | 9,572 (59.5%) | 689 (7.2%) |
Employment Status by Educational Attainment in Fulton County
According to labor force statistics for Fulton County, 76.2% of individuals (7,570) out of the total population between 25 and 64 years of age (9,934) are in the labor force, with 6.5% or 492 of them being unemployed. The group with the highest labor force participation rate are those with the educational attainment of bachelor's degree or higher, with 86.7% or 1,544 individuals in the labor force. Within the labor force, individuals with less than high school education have the highest percentage of unemployment, with 13.3% or 80 of them being unemployed.

| Educational Attainment | In Labor Force | Unemployed |
| Less than High School | 603 (45.6%) | 176 (13.3%) |
| High School Diploma | 2,567 (73.9%) | 462 (13.3%) |
| College / Associate Degree | 2,861 (85.2%) | 74 (2.2%) |
| Bachelor's Degree or higher | 1,544 (86.7%) | 9 (0.5%) |
| Total | 7,570 (76.2%) | 646 (6.5%) |
Employment Occupations by Sex in Fulton County
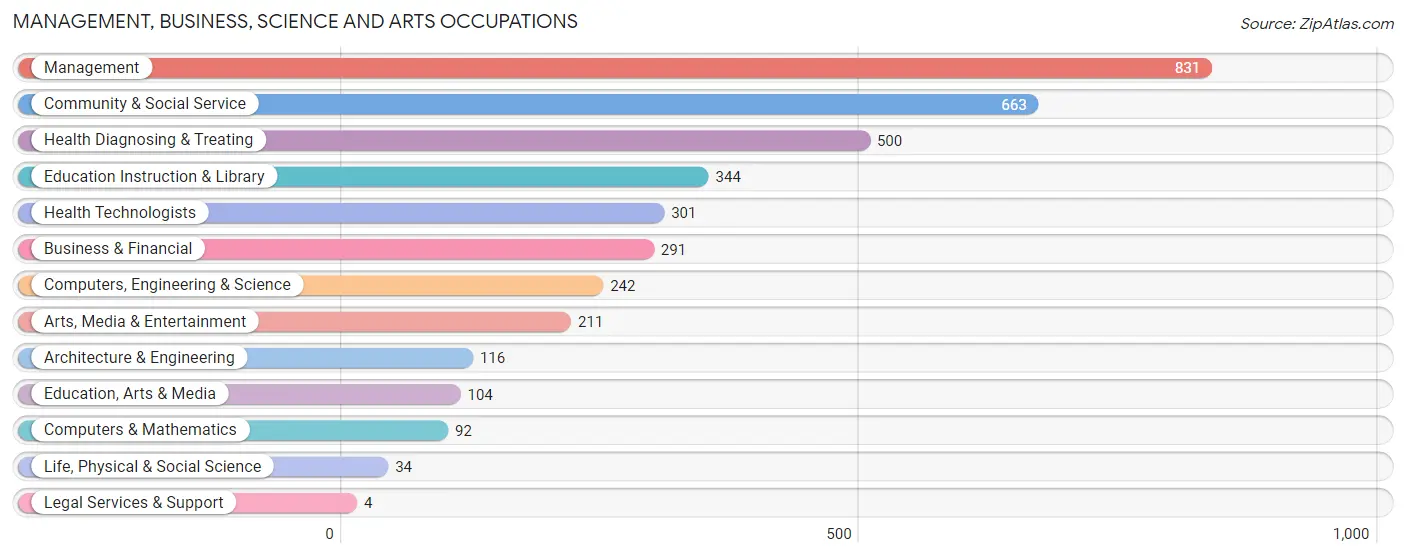
Management, Business, Science and Arts Occupations
The most common Management, Business, Science and Arts occupations in Fulton County are Management (831 | 9.3%), Community & Social Service (663 | 7.5%), Health Diagnosing & Treating (500 | 5.6%), Education Instruction & Library (344 | 3.9%), and Health Technologists (301 | 3.4%).
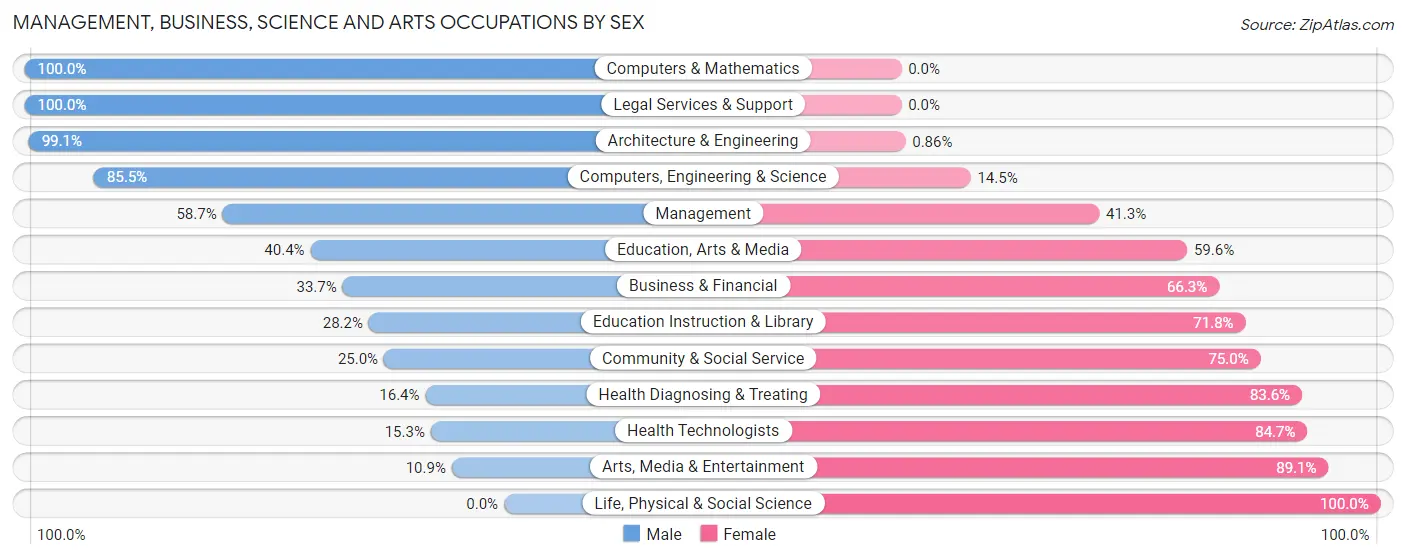
Management, Business, Science and Arts Occupations by Sex
Within the Management, Business, Science and Arts occupations in Fulton County, the most male-oriented occupations are Computers & Mathematics (100.0%), Legal Services & Support (100.0%), and Architecture & Engineering (99.1%), while the most female-oriented occupations are Life, Physical & Social Science (100.0%), Arts, Media & Entertainment (89.1%), and Health Technologists (84.7%).
| Occupation | Male | Female |
| Management | 488 (58.7%) | 343 (41.3%) |
| Business & Financial | 98 (33.7%) | 193 (66.3%) |
| Computers, Engineering & Science | 207 (85.5%) | 35 (14.5%) |
| Computers & Mathematics | 92 (100.0%) | 0 (0.0%) |
| Architecture & Engineering | 115 (99.1%) | 1 (0.9%) |
| Life, Physical & Social Science | 0 (0.0%) | 34 (100.0%) |
| Community & Social Service | 166 (25.0%) | 497 (75.0%) |
| Education, Arts & Media | 42 (40.4%) | 62 (59.6%) |
| Legal Services & Support | 4 (100.0%) | 0 (0.0%) |
| Education Instruction & Library | 97 (28.2%) | 247 (71.8%) |
| Arts, Media & Entertainment | 23 (10.9%) | 188 (89.1%) |
| Health Diagnosing & Treating | 82 (16.4%) | 418 (83.6%) |
| Health Technologists | 46 (15.3%) | 255 (84.7%) |
| Total (Category) | 1,041 (41.2%) | 1,486 (58.8%) |
| Total (Overall) | 4,703 (52.9%) | 4,184 (47.1%) |
Services Occupations
The most common Services occupations in Fulton County are Cleaning & Maintenance (400 | 4.5%), Healthcare Support (297 | 3.3%), Food Preparation & Serving (267 | 3.0%), Personal Care & Service (233 | 2.6%), and Security & Protection (212 | 2.4%).

Services Occupations by Sex
Within the Services occupations in Fulton County, the most male-oriented occupations are Firefighting & Prevention (100.0%), Security & Protection (73.6%), and Cleaning & Maintenance (65.0%), while the most female-oriented occupations are Healthcare Support (99.0%), Personal Care & Service (85.4%), and Food Preparation & Serving (56.2%).

| Occupation | Male | Female |
| Healthcare Support | 3 (1.0%) | 294 (99.0%) |
| Security & Protection | 156 (73.6%) | 56 (26.4%) |
| Firefighting & Prevention | 69 (100.0%) | 0 (0.0%) |
| Law Enforcement | 87 (60.8%) | 56 (39.2%) |
| Food Preparation & Serving | 117 (43.8%) | 150 (56.2%) |
| Cleaning & Maintenance | 260 (65.0%) | 140 (35.0%) |
| Personal Care & Service | 34 (14.6%) | 199 (85.4%) |
| Total (Category) | 570 (40.5%) | 839 (59.6%) |
| Total (Overall) | 4,703 (52.9%) | 4,184 (47.1%) |
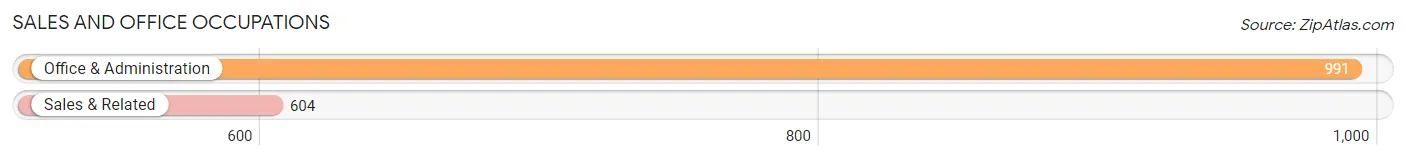
Sales and Office Occupations
The most common Sales and Office occupations in Fulton County are Office & Administration (991 | 11.2%), and Sales & Related (604 | 6.8%).
Sales and Office Occupations by Sex

| Occupation | Male | Female |
| Sales & Related | 288 (47.7%) | 316 (52.3%) |
| Office & Administration | 62 (6.3%) | 929 (93.7%) |
| Total (Category) | 350 (21.9%) | 1,245 (78.1%) |
| Total (Overall) | 4,703 (52.9%) | 4,184 (47.1%) |
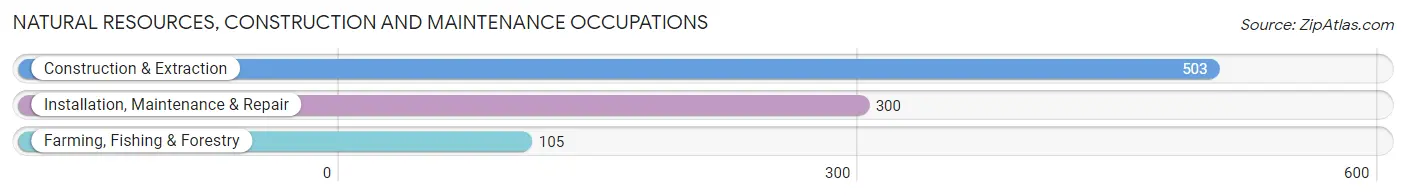
Natural Resources, Construction and Maintenance Occupations
The most common Natural Resources, Construction and Maintenance occupations in Fulton County are Construction & Extraction (503 | 5.7%), Installation, Maintenance & Repair (300 | 3.4%), and Farming, Fishing & Forestry (105 | 1.2%).
Natural Resources, Construction and Maintenance Occupations by Sex
| Occupation | Male | Female |
| Farming, Fishing & Forestry | 81 (77.1%) | 24 (22.9%) |
| Construction & Extraction | 411 (81.7%) | 92 (18.3%) |
| Installation, Maintenance & Repair | 281 (93.7%) | 19 (6.3%) |
| Total (Category) | 773 (85.1%) | 135 (14.9%) |
| Total (Overall) | 4,703 (52.9%) | 4,184 (47.1%) |
Production, Transportation and Moving Occupations
The most common Production, Transportation and Moving occupations in Fulton County are Production (1,678 | 18.9%), Material Moving (601 | 6.8%), and Transportation (169 | 1.9%).
Production, Transportation and Moving Occupations by Sex
| Occupation | Male | Female |
| Production | 1,366 (81.4%) | 312 (18.6%) |
| Transportation | 157 (92.9%) | 12 (7.1%) |
| Material Moving | 446 (74.2%) | 155 (25.8%) |
| Total (Category) | 1,969 (80.4%) | 479 (19.6%) |
| Total (Overall) | 4,703 (52.9%) | 4,184 (47.1%) |
Employment Industries by Sex in Fulton County
Employment Industries in Fulton County
The major employment industries in Fulton County include Manufacturing (2,616 | 29.4%), Health Care & Social Assistance (995 | 11.2%), Retail Trade (956 | 10.8%), Construction (538 | 6.0%), and Public Administration (464 | 5.2%).
Employment Industries by Sex in Fulton County
The Fulton County industries that see more men than women are Wholesale Trade (81.4%), Manufacturing (73.7%), and Construction (72.5%), whereas the industries that tend to have a higher number of women are Health Care & Social Assistance (76.7%), Public Administration (73.9%), and Educational Services (72.4%).
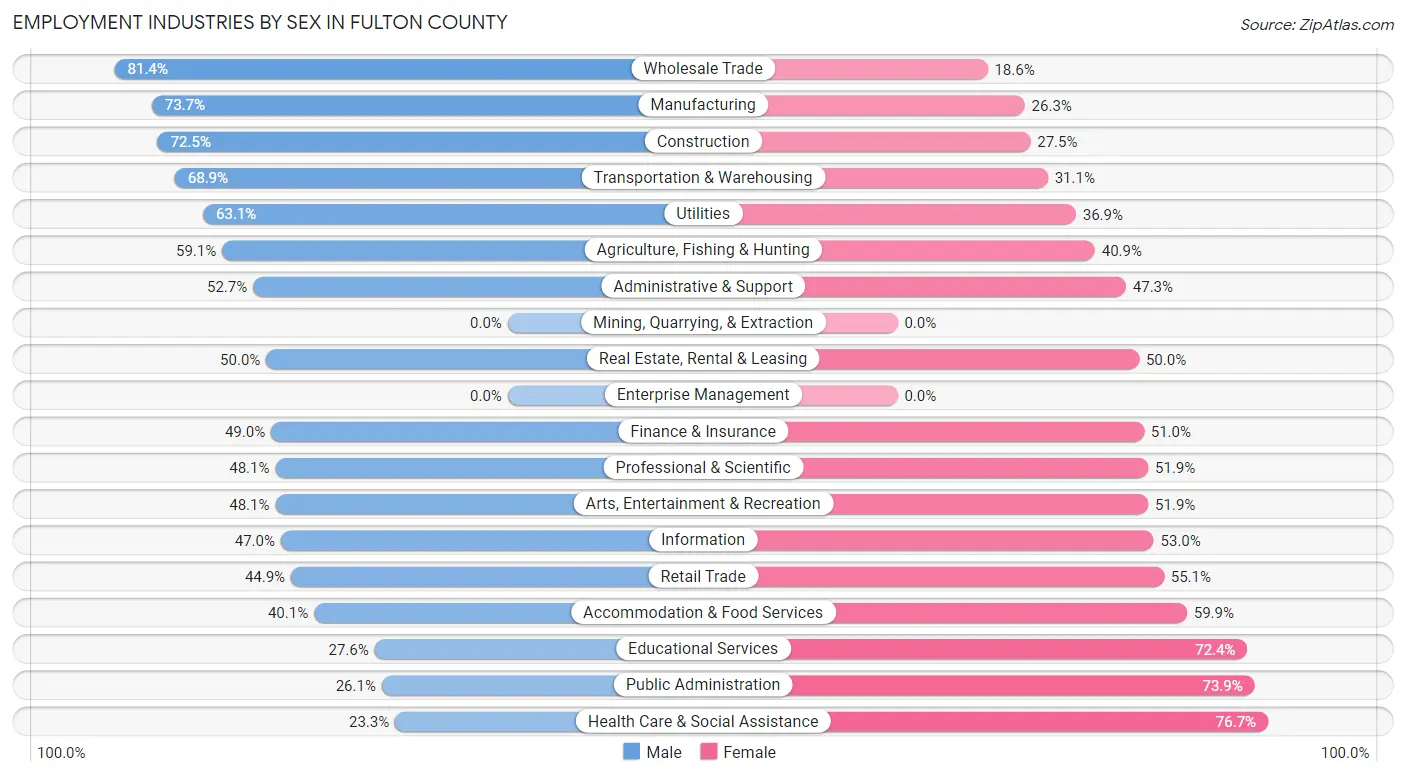
| Industry | Male | Female |
| Agriculture, Fishing & Hunting | 178 (59.1%) | 123 (40.9%) |
| Mining, Quarrying, & Extraction | 0 (0.0%) | 0 (0.0%) |
| Construction | 390 (72.5%) | 148 (27.5%) |
| Manufacturing | 1,927 (73.7%) | 689 (26.3%) |
| Wholesale Trade | 144 (81.4%) | 33 (18.6%) |
| Retail Trade | 429 (44.9%) | 527 (55.1%) |
| Transportation & Warehousing | 93 (68.9%) | 42 (31.1%) |
| Utilities | 82 (63.1%) | 48 (36.9%) |
| Information | 62 (47.0%) | 70 (53.0%) |
| Finance & Insurance | 171 (49.0%) | 178 (51.0%) |
| Real Estate, Rental & Leasing | 49 (50.0%) | 49 (50.0%) |
| Professional & Scientific | 127 (48.1%) | 137 (51.9%) |
| Enterprise Management | 0 (0.0%) | 0 (0.0%) |
| Administrative & Support | 184 (52.7%) | 165 (47.3%) |
| Educational Services | 126 (27.6%) | 331 (72.4%) |
| Health Care & Social Assistance | 232 (23.3%) | 763 (76.7%) |
| Arts, Entertainment & Recreation | 38 (48.1%) | 41 (51.9%) |
| Accommodation & Food Services | 154 (40.1%) | 230 (59.9%) |
| Public Administration | 121 (26.1%) | 343 (73.9%) |
| Total | 4,703 (52.9%) | 4,184 (47.1%) |
Education in Fulton County
School Enrollment in Fulton County
The most common levels of schooling among the 4,393 students in Fulton County are elementary school (1,292 | 29.4%), middle school (960 | 21.8%), and high school (892 | 20.3%).
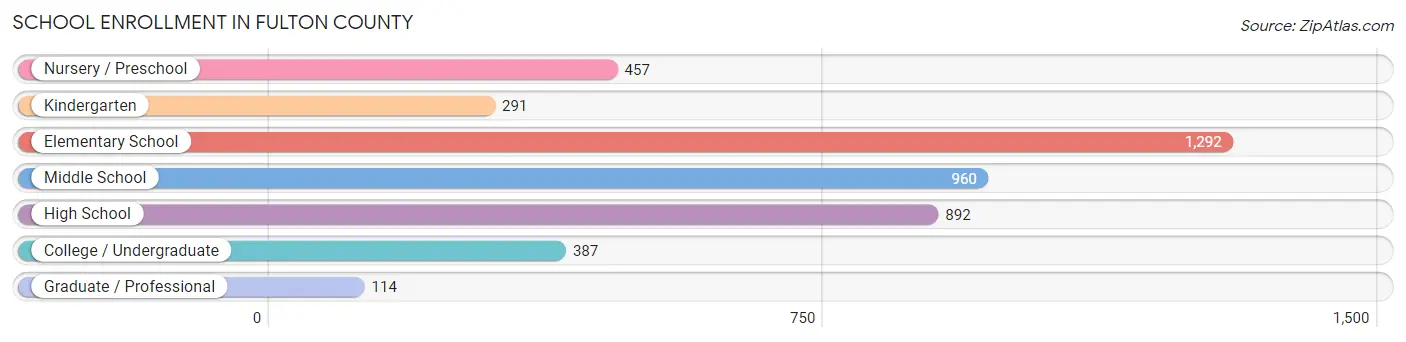
| School Level | # Students | % Students |
| Nursery / Preschool | 457 | 10.4% |
| Kindergarten | 291 | 6.6% |
| Elementary School | 1,292 | 29.4% |
| Middle School | 960 | 21.8% |
| High School | 892 | 20.3% |
| College / Undergraduate | 387 | 8.8% |
| Graduate / Professional | 114 | 2.6% |
| Total | 4,393 | 100.0% |
School Enrollment by Age by Funding Source in Fulton County
Out of a total of 4,393 students who are enrolled in schools in Fulton County, 540 (12.3%) attend a private institution, while the remaining 3,853 (87.7%) are enrolled in public schools. The age group of 35 years and over has the highest likelihood of being enrolled in private schools, with 78 (33.3% in the age bracket) enrolled. Conversely, the age group of 10 to 14 year olds has the lowest likelihood of being enrolled in a private school, with 1,183 (93.1% in the age bracket) attending a public institution.
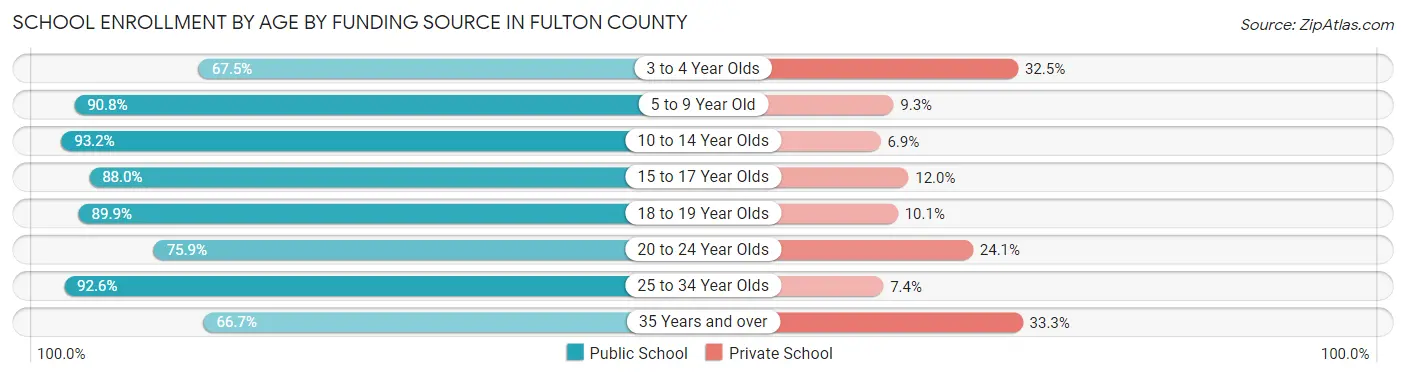
| Age Bracket | Public School | Private School |
| 3 to 4 Year Olds | 208 (67.5%) | 100 (32.5%) |
| 5 to 9 Year Old | 1,275 (90.7%) | 130 (9.2%) |
| 10 to 14 Year Olds | 1,183 (93.1%) | 87 (6.9%) |
| 15 to 17 Year Olds | 643 (88.0%) | 88 (12.0%) |
| 18 to 19 Year Olds | 134 (89.9%) | 15 (10.1%) |
| 20 to 24 Year Olds | 101 (75.9%) | 32 (24.1%) |
| 25 to 34 Year Olds | 151 (92.6%) | 12 (7.4%) |
| 35 Years and over | 156 (66.7%) | 78 (33.3%) |
| Total | 3,853 (87.7%) | 540 (12.3%) |
Educational Attainment by Field of Study in Fulton County
Education (737 | 28.2%), business (485 | 18.5%), science & technology (359 | 13.7%), bio, nature & agricultural (225 | 8.6%), and arts & humanities (155 | 5.9%) are the most common fields of study among 2,615 individuals in Fulton County who have obtained a bachelor's degree or higher.
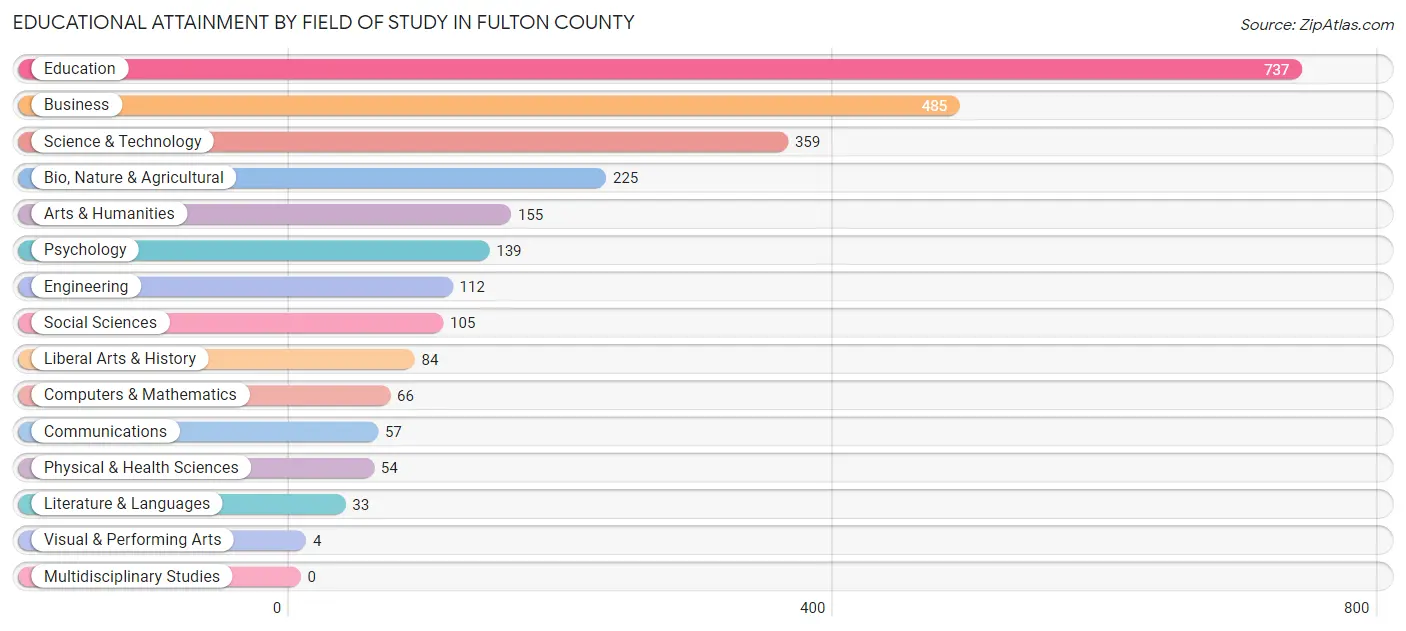
| Field of Study | # Graduates | % Graduates |
| Computers & Mathematics | 66 | 2.5% |
| Bio, Nature & Agricultural | 225 | 8.6% |
| Physical & Health Sciences | 54 | 2.1% |
| Psychology | 139 | 5.3% |
| Social Sciences | 105 | 4.0% |
| Engineering | 112 | 4.3% |
| Multidisciplinary Studies | 0 | 0.0% |
| Science & Technology | 359 | 13.7% |
| Business | 485 | 18.5% |
| Education | 737 | 28.2% |
| Literature & Languages | 33 | 1.3% |
| Liberal Arts & History | 84 | 3.2% |
| Visual & Performing Arts | 4 | 0.2% |
| Communications | 57 | 2.2% |
| Arts & Humanities | 155 | 5.9% |
| Total | 2,615 | 100.0% |
Transportation & Commute in Fulton County
Vehicle Availability by Sex in Fulton County
The most prevalent vehicle ownership categories in Fulton County are males with 2 vehicles (1,873, accounting for 40.5%) and females with 2 vehicles (1,356, making up 46.4%).
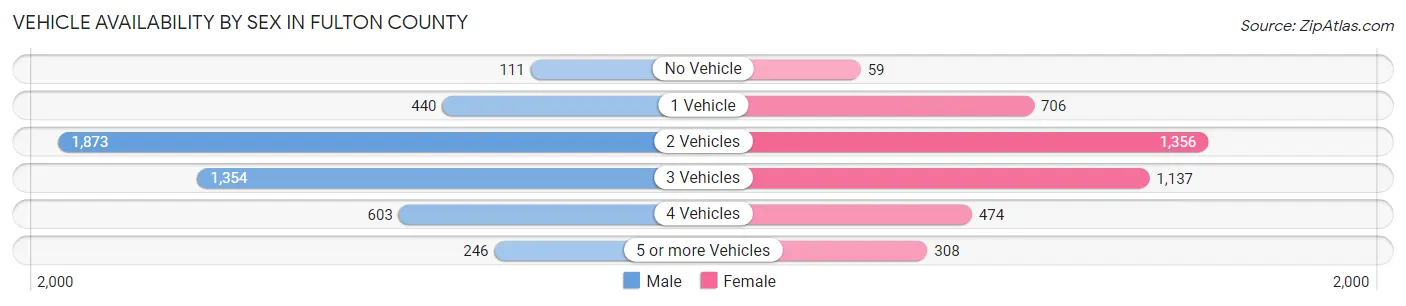
| Vehicles Available | Male | Female |
| No Vehicle | 111 (2.4%) | 59 (1.5%) |
| 1 Vehicle | 440 (9.5%) | 706 (17.5%) |
| 2 Vehicles | 1,873 (40.5%) | 1,356 (33.6%) |
| 3 Vehicles | 1,354 (29.3%) | 1,137 (28.1%) |
| 4 Vehicles | 603 (13.0%) | 474 (11.7%) |
| 5 or more Vehicles | 246 (5.3%) | 308 (7.6%) |
| Total | 4,627 (100.0%) | 4,040 (100.0%) |
Commute Time in Fulton County
The most frequently occuring commute durations in Fulton County are 5 to 9 minutes (1,564 commuters, 18.9%), 10 to 14 minutes (1,122 commuters, 13.5%), and 30 to 34 minutes (972 commuters, 11.7%).
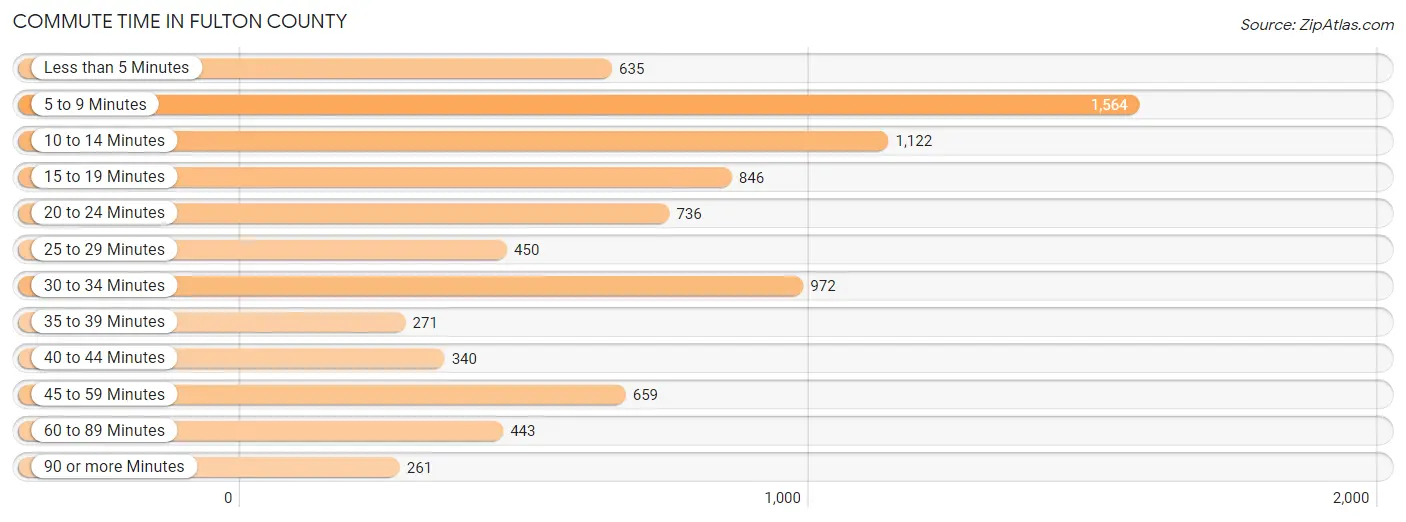
| Commute Time | # Commuters | % Commuters |
| Less than 5 Minutes | 635 | 7.6% |
| 5 to 9 Minutes | 1,564 | 18.9% |
| 10 to 14 Minutes | 1,122 | 13.5% |
| 15 to 19 Minutes | 846 | 10.2% |
| 20 to 24 Minutes | 736 | 8.9% |
| 25 to 29 Minutes | 450 | 5.4% |
| 30 to 34 Minutes | 972 | 11.7% |
| 35 to 39 Minutes | 271 | 3.3% |
| 40 to 44 Minutes | 340 | 4.1% |
| 45 to 59 Minutes | 659 | 7.9% |
| 60 to 89 Minutes | 443 | 5.3% |
| 90 or more Minutes | 261 | 3.1% |
Commute Time by Sex in Fulton County
The most common commute times in Fulton County are 5 to 9 minutes (871 commuters, 19.6%) for males and 5 to 9 minutes (693 commuters, 18.0%) for females.

| Commute Time | Male | Female |
| Less than 5 Minutes | 312 (7.0%) | 323 (8.4%) |
| 5 to 9 Minutes | 871 (19.6%) | 693 (18.0%) |
| 10 to 14 Minutes | 505 (11.4%) | 617 (16.0%) |
| 15 to 19 Minutes | 304 (6.8%) | 542 (14.1%) |
| 20 to 24 Minutes | 410 (9.2%) | 326 (8.5%) |
| 25 to 29 Minutes | 209 (4.7%) | 241 (6.2%) |
| 30 to 34 Minutes | 596 (13.4%) | 376 (9.8%) |
| 35 to 39 Minutes | 107 (2.4%) | 164 (4.3%) |
| 40 to 44 Minutes | 181 (4.1%) | 159 (4.1%) |
| 45 to 59 Minutes | 382 (8.6%) | 277 (7.2%) |
| 60 to 89 Minutes | 329 (7.4%) | 114 (3.0%) |
| 90 or more Minutes | 238 (5.4%) | 23 (0.6%) |
Time of Departure to Work by Sex in Fulton County
The most frequent times of departure to work in Fulton County are 7:30 AM to 7:59 AM (627, 14.1%) for males and 7:00 AM to 7:29 AM (593, 15.4%) for females.
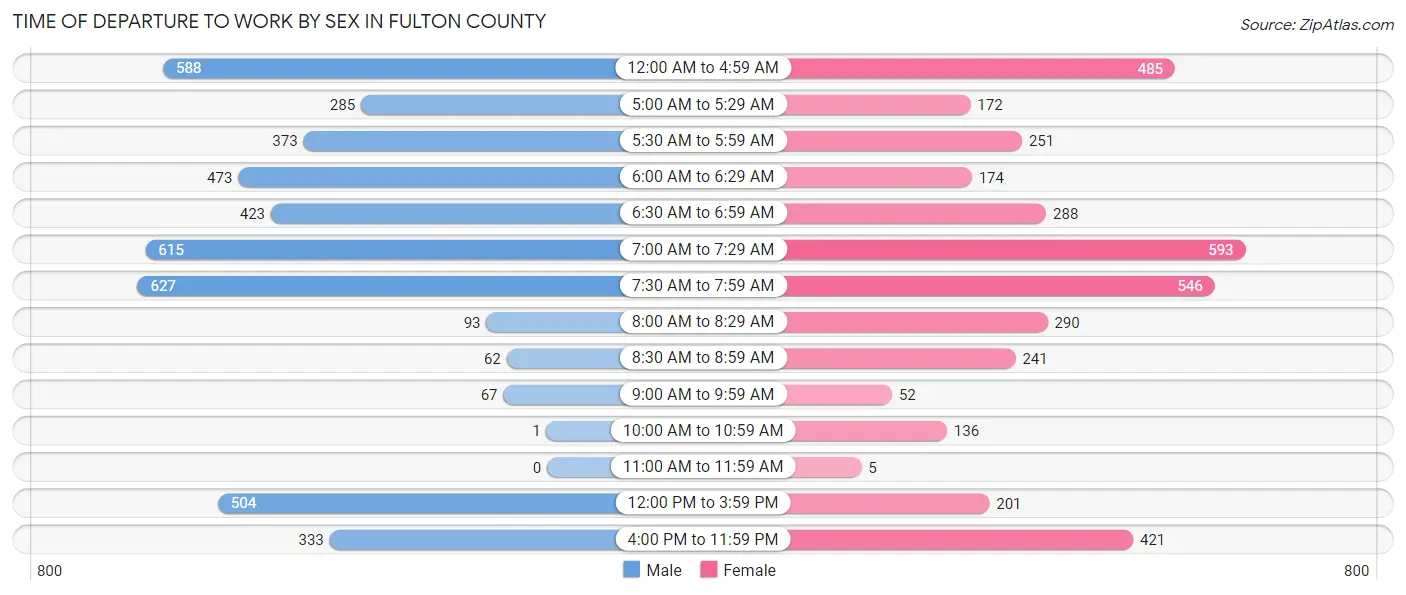
| Time of Departure | Male | Female |
| 12:00 AM to 4:59 AM | 588 (13.2%) | 485 (12.6%) |
| 5:00 AM to 5:29 AM | 285 (6.4%) | 172 (4.5%) |
| 5:30 AM to 5:59 AM | 373 (8.4%) | 251 (6.5%) |
| 6:00 AM to 6:29 AM | 473 (10.6%) | 174 (4.5%) |
| 6:30 AM to 6:59 AM | 423 (9.5%) | 288 (7.5%) |
| 7:00 AM to 7:29 AM | 615 (13.8%) | 593 (15.4%) |
| 7:30 AM to 7:59 AM | 627 (14.1%) | 546 (14.2%) |
| 8:00 AM to 8:29 AM | 93 (2.1%) | 290 (7.5%) |
| 8:30 AM to 8:59 AM | 62 (1.4%) | 241 (6.2%) |
| 9:00 AM to 9:59 AM | 67 (1.5%) | 52 (1.3%) |
| 10:00 AM to 10:59 AM | 1 (0.0%) | 136 (3.5%) |
| 11:00 AM to 11:59 AM | 0 (0.0%) | 5 (0.1%) |
| 12:00 PM to 3:59 PM | 504 (11.3%) | 201 (5.2%) |
| 4:00 PM to 11:59 PM | 333 (7.5%) | 421 (10.9%) |
| Total | 4,444 (100.0%) | 3,855 (100.0%) |
Housing Occupancy in Fulton County
Occupancy by Ownership in Fulton County
Of the total 7,794 dwellings in Fulton County, owner-occupied units account for 6,078 (78.0%), while renter-occupied units make up 1,716 (22.0%).

| Occupancy | # Housing Units | % Housing Units |
| Owner Occupied Housing Units | 6,078 | 78.0% |
| Renter-Occupied Housing Units | 1,716 | 22.0% |
| Total Occupied Housing Units | 7,794 | 100.0% |
Occupancy by Household Size in Fulton County
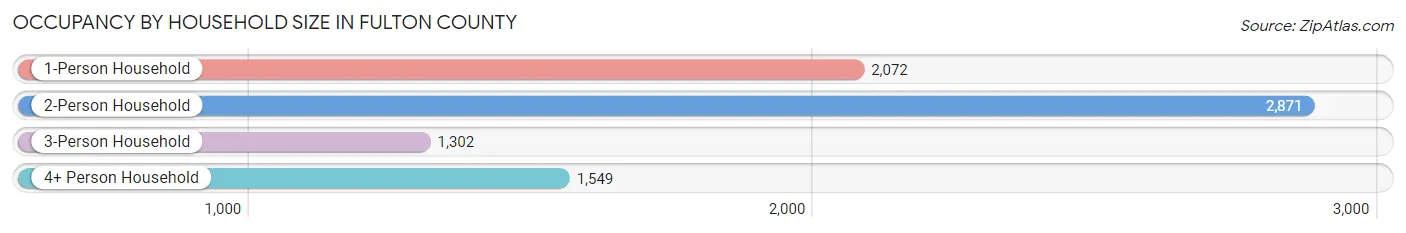
| Household Size | # Housing Units | % Housing Units |
| 1-Person Household | 2,072 | 26.6% |
| 2-Person Household | 2,871 | 36.8% |
| 3-Person Household | 1,302 | 16.7% |
| 4+ Person Household | 1,549 | 19.9% |
| Total Housing Units | 7,794 | 100.0% |
Occupancy by Ownership by Household Size in Fulton County
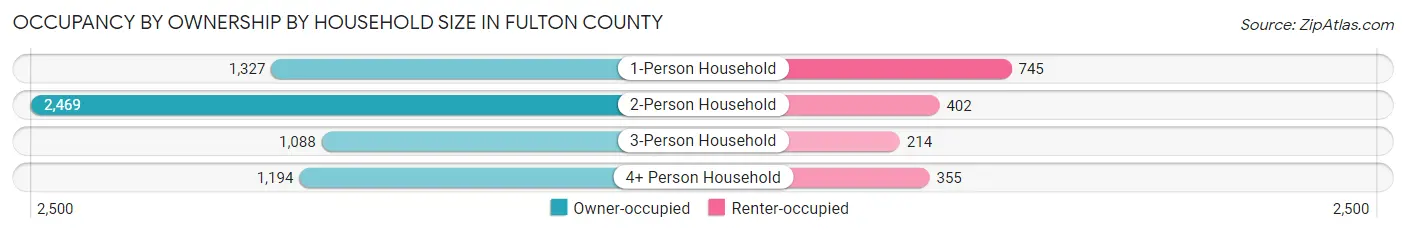
| Household Size | Owner-occupied | Renter-occupied |
| 1-Person Household | 1,327 (64.0%) | 745 (36.0%) |
| 2-Person Household | 2,469 (86.0%) | 402 (14.0%) |
| 3-Person Household | 1,088 (83.6%) | 214 (16.4%) |
| 4+ Person Household | 1,194 (77.1%) | 355 (22.9%) |
| Total Housing Units | 6,078 (78.0%) | 1,716 (22.0%) |
Occupancy by Educational Attainment in Fulton County
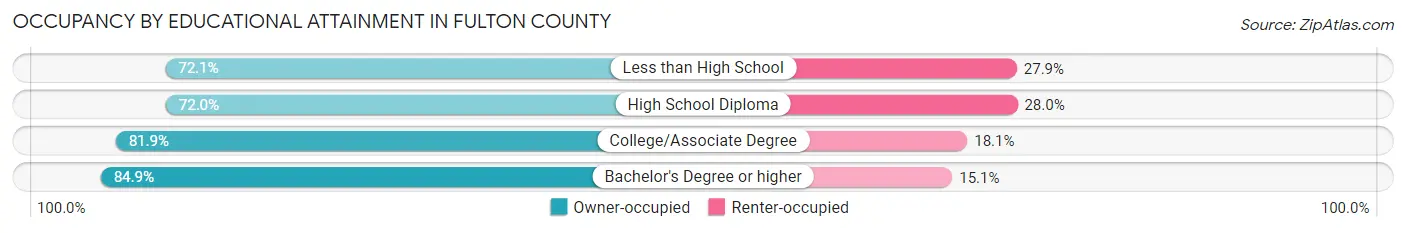
| Household Size | Owner-occupied | Renter-occupied |
| Less than High School | 566 (72.1%) | 219 (27.9%) |
| High School Diploma | 1,996 (72.0%) | 777 (28.0%) |
| College/Associate Degree | 2,212 (81.9%) | 488 (18.1%) |
| Bachelor's Degree or higher | 1,304 (84.9%) | 232 (15.1%) |
Occupancy by Age of Householder in Fulton County
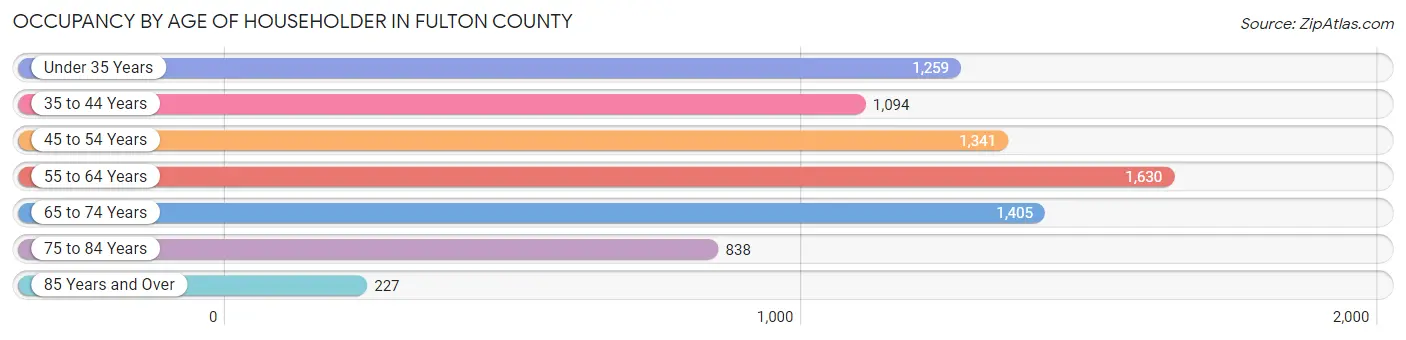
| Age Bracket | # Households | % Households |
| Under 35 Years | 1,259 | 16.2% |
| 35 to 44 Years | 1,094 | 14.0% |
| 45 to 54 Years | 1,341 | 17.2% |
| 55 to 64 Years | 1,630 | 20.9% |
| 65 to 74 Years | 1,405 | 18.0% |
| 75 to 84 Years | 838 | 10.7% |
| 85 Years and Over | 227 | 2.9% |
| Total | 7,794 | 100.0% |
Housing Finances in Fulton County
Median Income by Occupancy in Fulton County
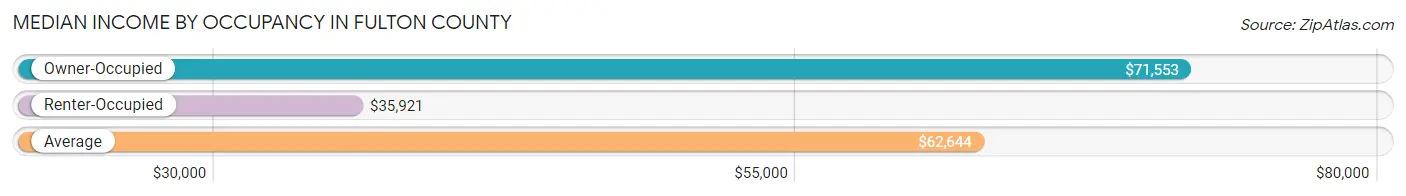
| Occupancy Type | # Households | Median Income |
| Owner-Occupied | 6,078 (78.0%) | $71,553 |
| Renter-Occupied | 1,716 (22.0%) | $35,921 |
| Average | 7,794 (100.0%) | $62,644 |
Occupancy by Householder Income Bracket in Fulton County
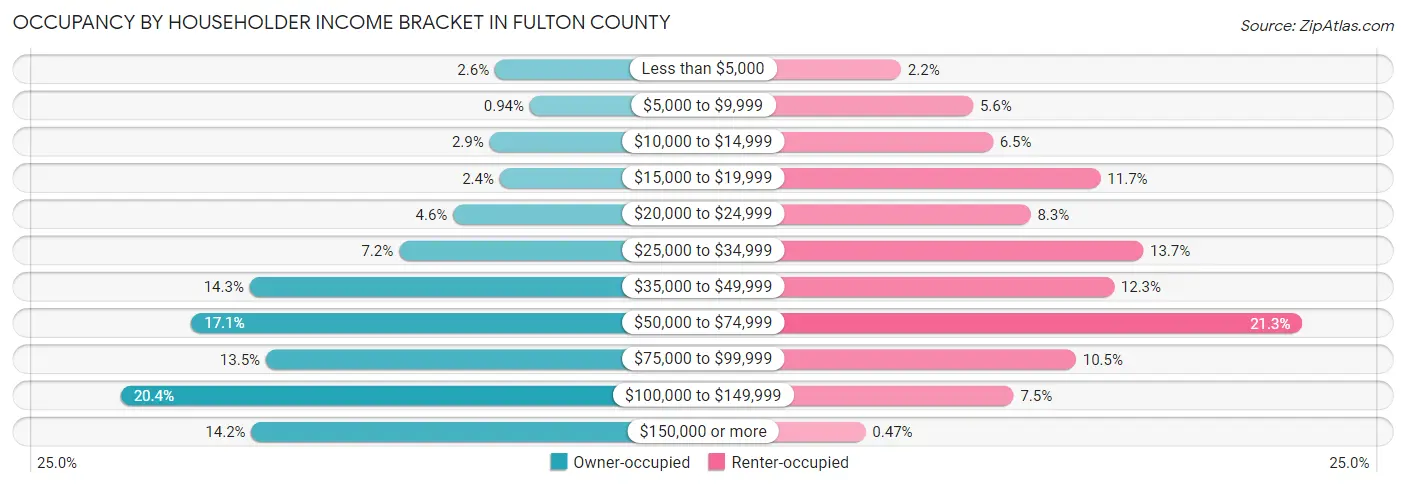
| Income Bracket | Owner-occupied | Renter-occupied |
| Less than $5,000 | 158 (2.6%) | 37 (2.2%) |
| $5,000 to $9,999 | 57 (0.9%) | 96 (5.6%) |
| $10,000 to $14,999 | 174 (2.9%) | 112 (6.5%) |
| $15,000 to $19,999 | 144 (2.4%) | 200 (11.7%) |
| $20,000 to $24,999 | 279 (4.6%) | 143 (8.3%) |
| $25,000 to $34,999 | 436 (7.2%) | 235 (13.7%) |
| $35,000 to $49,999 | 868 (14.3%) | 211 (12.3%) |
| $50,000 to $74,999 | 1,037 (17.1%) | 365 (21.3%) |
| $75,000 to $99,999 | 821 (13.5%) | 180 (10.5%) |
| $100,000 to $149,999 | 1,241 (20.4%) | 129 (7.5%) |
| $150,000 or more | 863 (14.2%) | 8 (0.5%) |
| Total | 6,078 (100.0%) | 1,716 (100.0%) |
Monthly Housing Cost Tiers in Fulton County
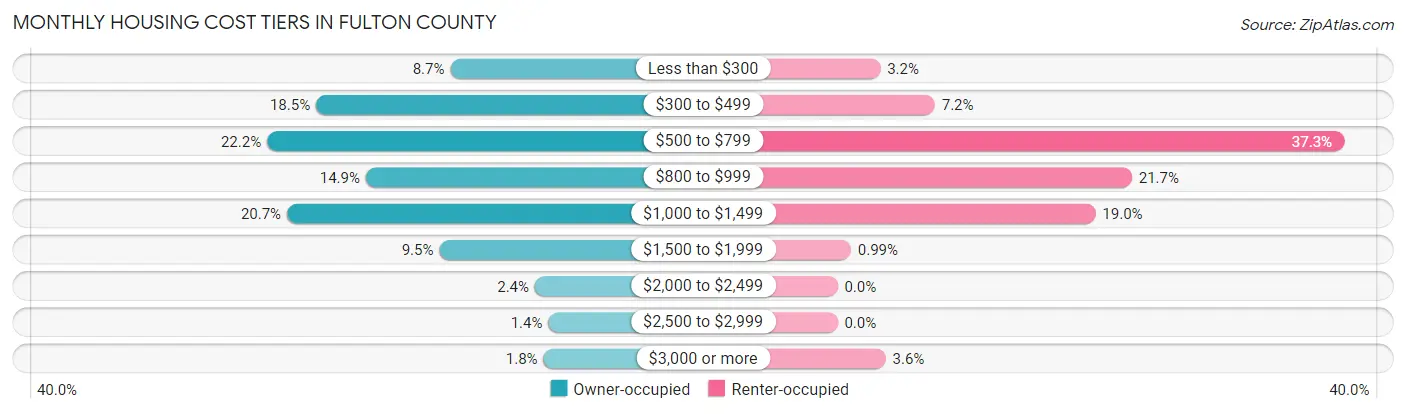
| Monthly Cost | Owner-occupied | Renter-occupied |
| Less than $300 | 526 (8.6%) | 54 (3.2%) |
| $300 to $499 | 1,127 (18.5%) | 123 (7.2%) |
| $500 to $799 | 1,346 (22.2%) | 640 (37.3%) |
| $800 to $999 | 904 (14.9%) | 372 (21.7%) |
| $1,000 to $1,499 | 1,257 (20.7%) | 326 (19.0%) |
| $1,500 to $1,999 | 575 (9.5%) | 17 (1.0%) |
| $2,000 to $2,499 | 147 (2.4%) | 0 (0.0%) |
| $2,500 to $2,999 | 87 (1.4%) | 0 (0.0%) |
| $3,000 or more | 109 (1.8%) | 61 (3.5%) |
| Total | 6,078 (100.0%) | 1,716 (100.0%) |
Physical Housing Characteristics in Fulton County
Housing Structures in Fulton County
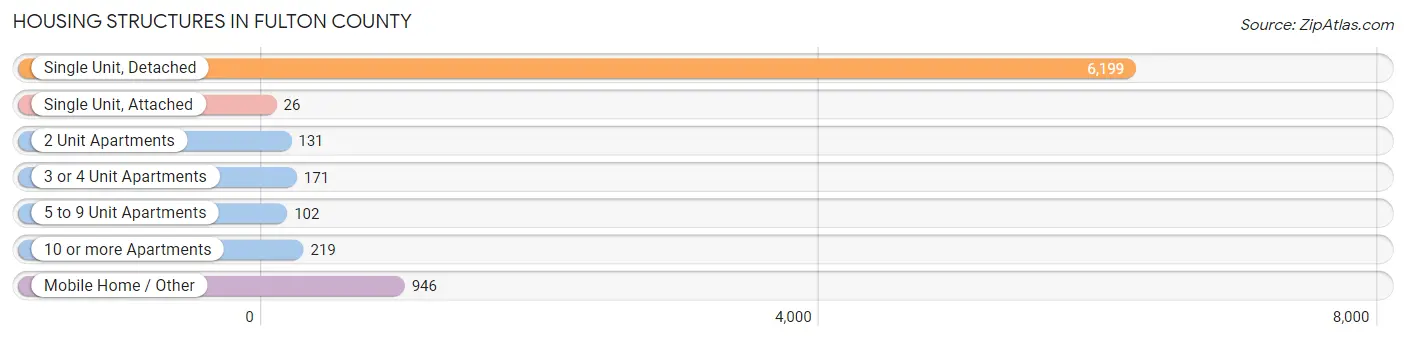
| Structure Type | # Housing Units | % Housing Units |
| Single Unit, Detached | 6,199 | 79.5% |
| Single Unit, Attached | 26 | 0.3% |
| 2 Unit Apartments | 131 | 1.7% |
| 3 or 4 Unit Apartments | 171 | 2.2% |
| 5 to 9 Unit Apartments | 102 | 1.3% |
| 10 or more Apartments | 219 | 2.8% |
| Mobile Home / Other | 946 | 12.1% |
| Total | 7,794 | 100.0% |
Housing Structures by Occupancy in Fulton County
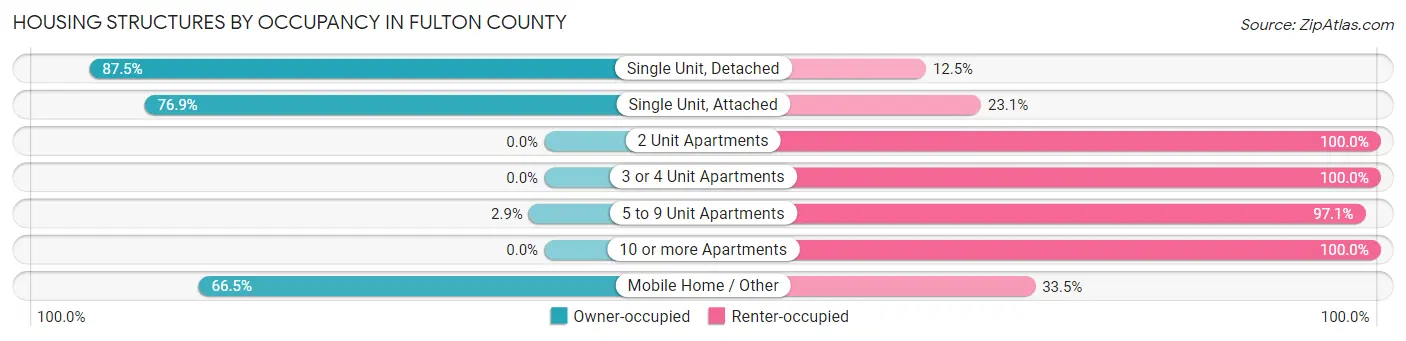
| Structure Type | Owner-occupied | Renter-occupied |
| Single Unit, Detached | 5,426 (87.5%) | 773 (12.5%) |
| Single Unit, Attached | 20 (76.9%) | 6 (23.1%) |
| 2 Unit Apartments | 0 (0.0%) | 131 (100.0%) |
| 3 or 4 Unit Apartments | 0 (0.0%) | 171 (100.0%) |
| 5 to 9 Unit Apartments | 3 (2.9%) | 99 (97.1%) |
| 10 or more Apartments | 0 (0.0%) | 219 (100.0%) |
| Mobile Home / Other | 629 (66.5%) | 317 (33.5%) |
| Total | 6,078 (78.0%) | 1,716 (22.0%) |
Housing Structures by Number of Rooms in Fulton County
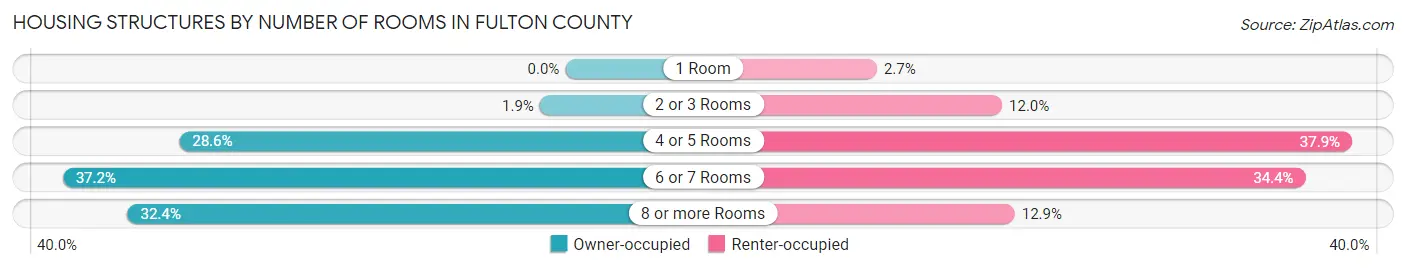
| Number of Rooms | Owner-occupied | Renter-occupied |
| 1 Room | 0 (0.0%) | 47 (2.7%) |
| 2 or 3 Rooms | 115 (1.9%) | 206 (12.0%) |
| 4 or 5 Rooms | 1,735 (28.5%) | 650 (37.9%) |
| 6 or 7 Rooms | 2,260 (37.2%) | 591 (34.4%) |
| 8 or more Rooms | 1,968 (32.4%) | 222 (12.9%) |
| Total | 6,078 (100.0%) | 1,716 (100.0%) |
Housing Structure by Heating Type in Fulton County
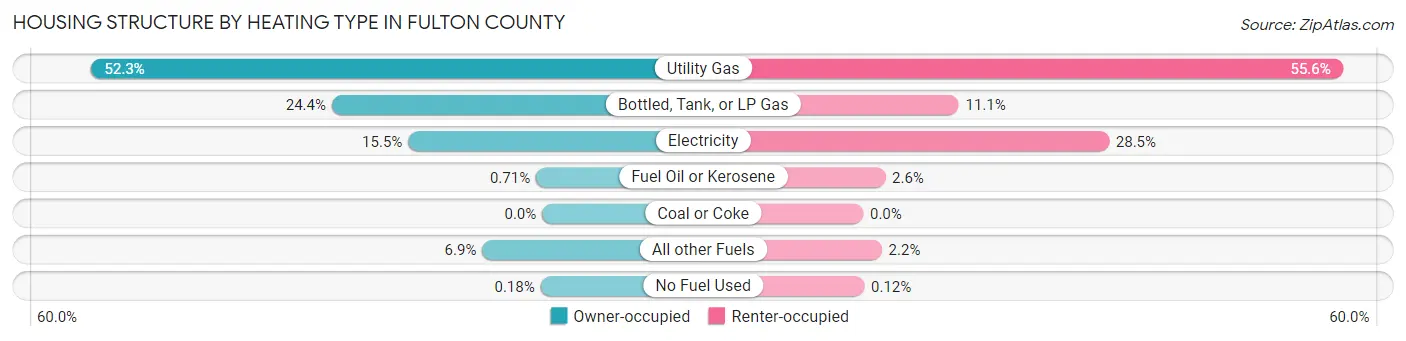
| Heating Type | Owner-occupied | Renter-occupied |
| Utility Gas | 3,176 (52.2%) | 954 (55.6%) |
| Bottled, Tank, or LP Gas | 1,482 (24.4%) | 190 (11.1%) |
| Electricity | 944 (15.5%) | 489 (28.5%) |
| Fuel Oil or Kerosene | 43 (0.7%) | 44 (2.6%) |
| Coal or Coke | 0 (0.0%) | 0 (0.0%) |
| All other Fuels | 422 (6.9%) | 37 (2.2%) |
| No Fuel Used | 11 (0.2%) | 2 (0.1%) |
| Total | 6,078 (100.0%) | 1,716 (100.0%) |
Household Vehicle Usage in Fulton County

| Vehicles per Household | Owner-occupied | Renter-occupied |
| No Vehicle | 207 (3.4%) | 257 (15.0%) |
| 1 Vehicle | 1,216 (20.0%) | 783 (45.6%) |
| 2 Vehicles | 2,349 (38.7%) | 447 (26.1%) |
| 3 or more Vehicles | 2,306 (37.9%) | 229 (13.3%) |
| Total | 6,078 (100.0%) | 1,716 (100.0%) |
Real Estate & Mortgages in Fulton County
Real Estate and Mortgage Overview in Fulton County
| Characteristic | Without Mortgage | With Mortgage |
| Housing Units | 2,533 | 3,545 |
| Median Property Value | $126,300 | $149,600 |
| Median Household Income | $56,680 | $549 |
| Monthly Housing Costs | $438 | $107 |
| Real Estate Taxes | $710 | $101 |
Property Value by Mortgage Status in Fulton County
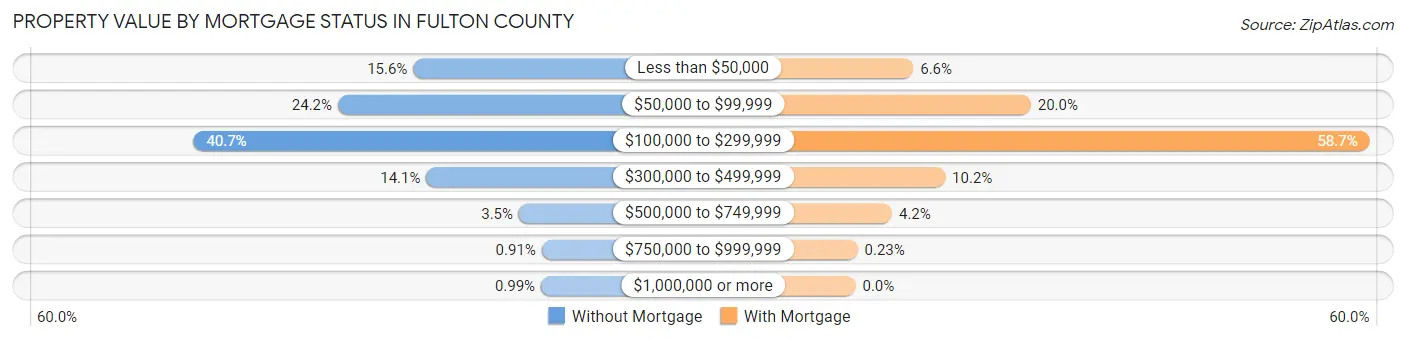
| Property Value | Without Mortgage | With Mortgage |
| Less than $50,000 | 395 (15.6%) | 234 (6.6%) |
| $50,000 to $99,999 | 613 (24.2%) | 710 (20.0%) |
| $100,000 to $299,999 | 1,031 (40.7%) | 2,082 (58.7%) |
| $300,000 to $499,999 | 357 (14.1%) | 363 (10.2%) |
| $500,000 to $749,999 | 89 (3.5%) | 148 (4.2%) |
| $750,000 to $999,999 | 23 (0.9%) | 8 (0.2%) |
| $1,000,000 or more | 25 (1.0%) | 0 (0.0%) |
| Total | 2,533 (100.0%) | 3,545 (100.0%) |
Household Income by Mortgage Status in Fulton County
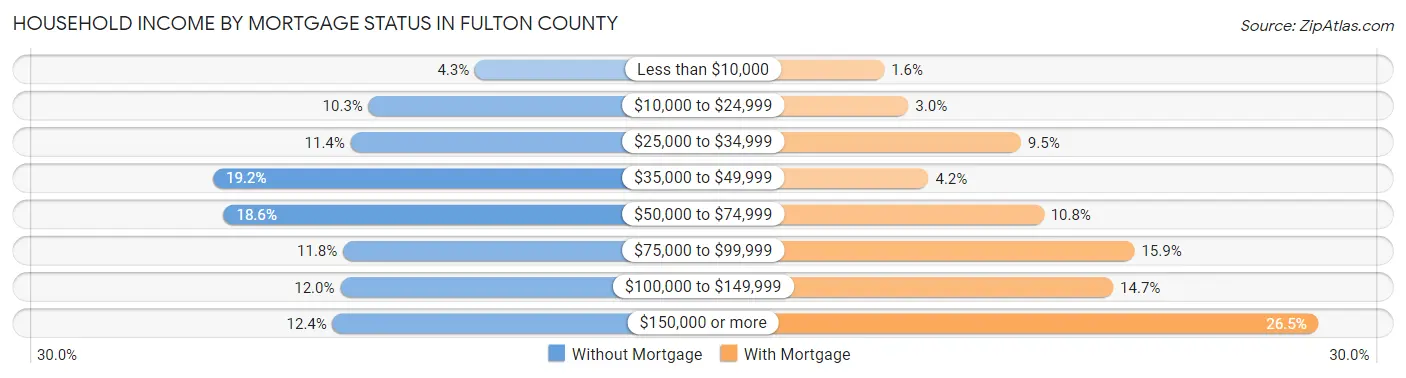
| Household Income | Without Mortgage | With Mortgage |
| Less than $10,000 | 108 (4.3%) | 58 (1.6%) |
| $10,000 to $24,999 | 262 (10.3%) | 107 (3.0%) |
| $25,000 to $34,999 | 288 (11.4%) | 335 (9.5%) |
| $35,000 to $49,999 | 487 (19.2%) | 148 (4.2%) |
| $50,000 to $74,999 | 472 (18.6%) | 381 (10.7%) |
| $75,000 to $99,999 | 299 (11.8%) | 565 (15.9%) |
| $100,000 to $149,999 | 303 (12.0%) | 522 (14.7%) |
| $150,000 or more | 314 (12.4%) | 938 (26.5%) |
| Total | 2,533 (100.0%) | 3,545 (100.0%) |
Property Value to Household Income Ratio in Fulton County
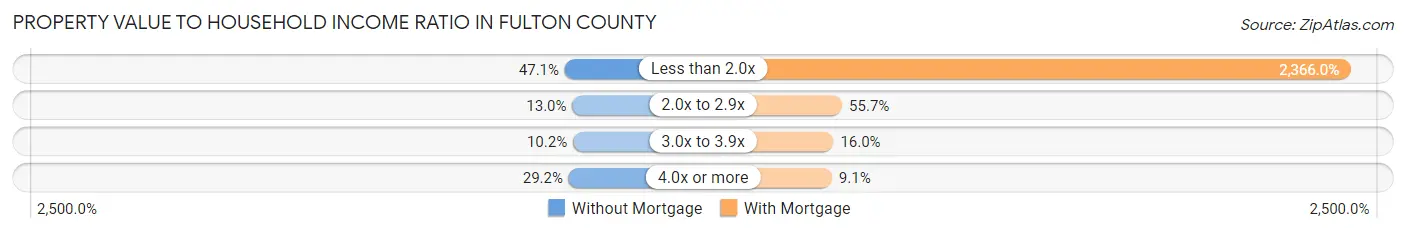
| Value-to-Income Ratio | Without Mortgage | With Mortgage |
| Less than 2.0x | 1,192 (47.1%) | 83,875 (2,366.0%) |
| 2.0x to 2.9x | 329 (13.0%) | 1,974 (55.7%) |
| 3.0x to 3.9x | 259 (10.2%) | 566 (16.0%) |
| 4.0x or more | 739 (29.2%) | 323 (9.1%) |
| Total | 2,533 (100.0%) | 3,545 (100.0%) |
Real Estate Taxes by Mortgage Status in Fulton County
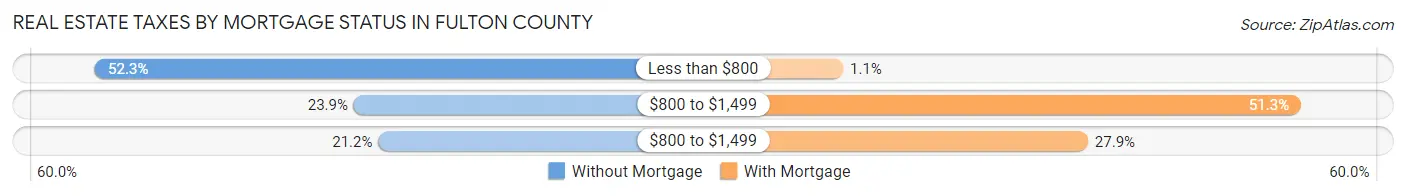
| Property Taxes | Without Mortgage | With Mortgage |
| Less than $800 | 1,324 (52.3%) | 39 (1.1%) |
| $800 to $1,499 | 606 (23.9%) | 1,818 (51.3%) |
| $800 to $1,499 | 538 (21.2%) | 990 (27.9%) |
| Total | 2,533 (100.0%) | 3,545 (100.0%) |
Health & Disability in Fulton County
Health Insurance Coverage by Age in Fulton County
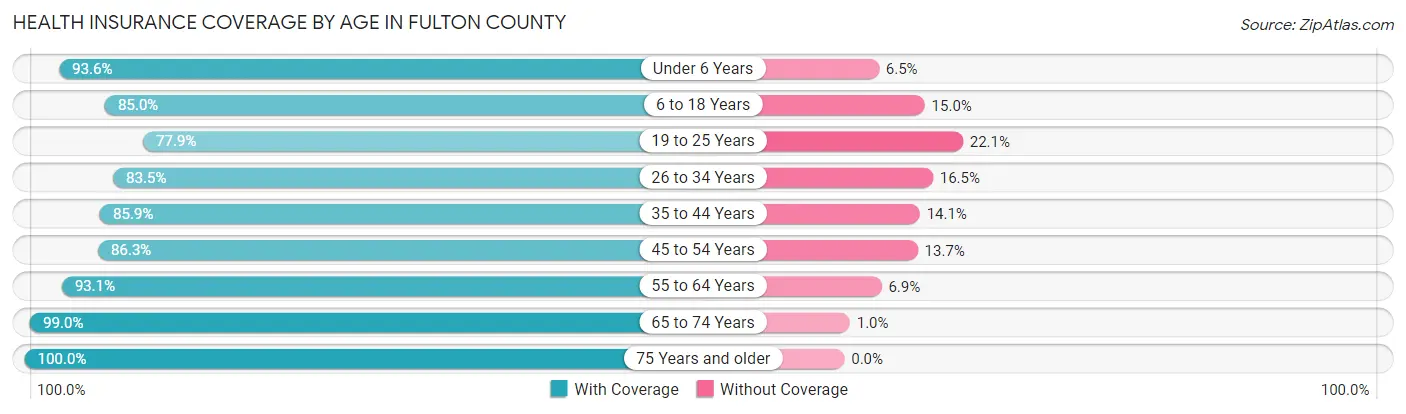
| Age Bracket | With Coverage | Without Coverage |
| Under 6 Years | 1,466 (93.5%) | 101 (6.5%) |
| 6 to 18 Years | 2,870 (85.0%) | 506 (15.0%) |
| 19 to 25 Years | 1,304 (77.9%) | 370 (22.1%) |
| 26 to 34 Years | 1,820 (83.5%) | 360 (16.5%) |
| 35 to 44 Years | 1,968 (85.9%) | 322 (14.1%) |
| 45 to 54 Years | 2,132 (86.3%) | 338 (13.7%) |
| 55 to 64 Years | 2,565 (93.1%) | 191 (6.9%) |
| 65 to 74 Years | 2,319 (99.0%) | 24 (1.0%) |
| 75 Years and older | 1,599 (100.0%) | 0 (0.0%) |
| Total | 18,043 (89.1%) | 2,212 (10.9%) |
Health Insurance Coverage by Citizenship Status in Fulton County
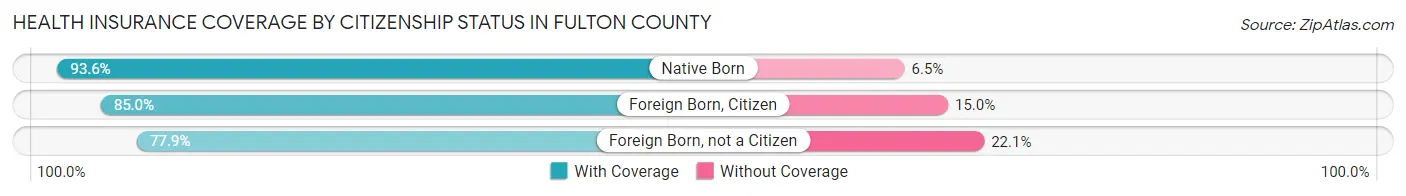
| Citizenship Status | With Coverage | Without Coverage |
| Native Born | 1,466 (93.5%) | 101 (6.5%) |
| Foreign Born, Citizen | 2,870 (85.0%) | 506 (15.0%) |
| Foreign Born, not a Citizen | 1,304 (77.9%) | 370 (22.1%) |
Health Insurance Coverage by Household Income in Fulton County
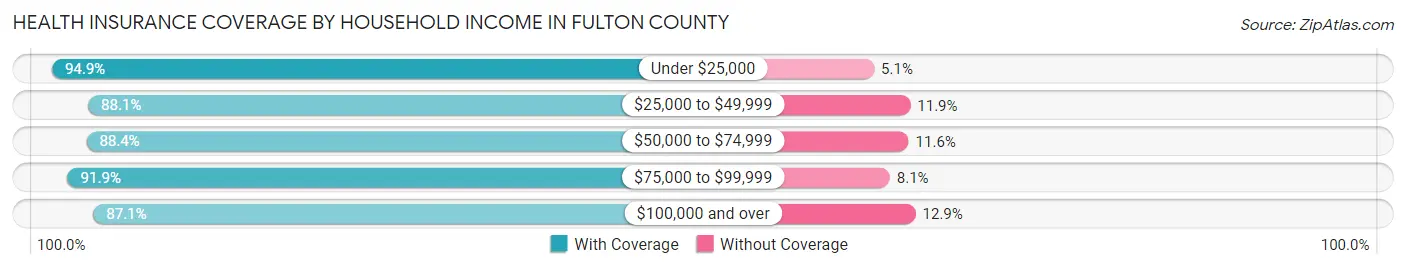
| Household Income | With Coverage | Without Coverage |
| Under $25,000 | 2,220 (94.9%) | 120 (5.1%) |
| $25,000 to $49,999 | 3,374 (88.1%) | 456 (11.9%) |
| $50,000 to $74,999 | 3,294 (88.4%) | 432 (11.6%) |
| $75,000 to $99,999 | 2,506 (91.9%) | 220 (8.1%) |
| $100,000 and over | 6,636 (87.1%) | 982 (12.9%) |
Public vs Private Health Insurance Coverage by Age in Fulton County
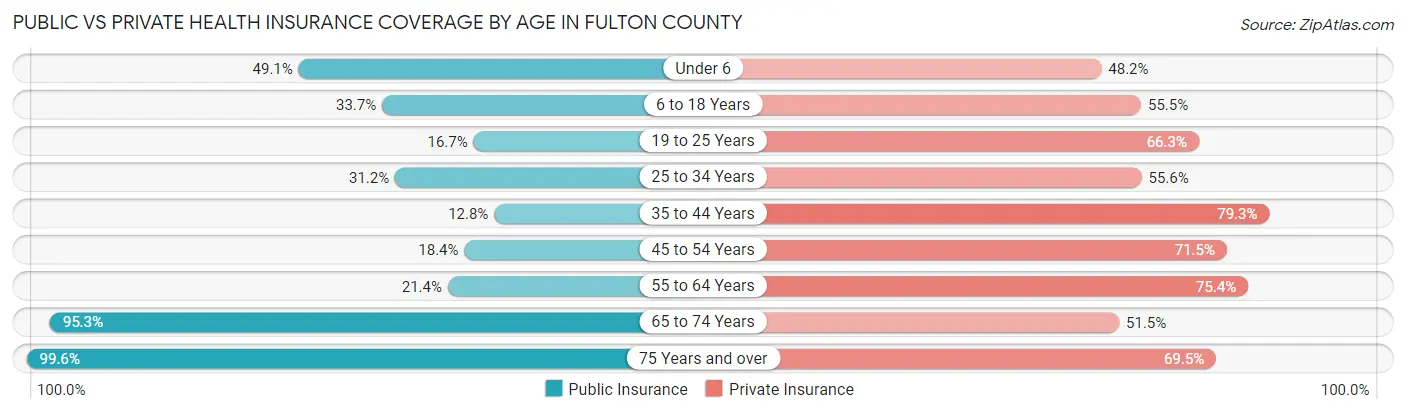
| Age Bracket | Public Insurance | Private Insurance |
| Under 6 | 770 (49.1%) | 755 (48.2%) |
| 6 to 18 Years | 1,136 (33.7%) | 1,875 (55.5%) |
| 19 to 25 Years | 279 (16.7%) | 1,109 (66.2%) |
| 25 to 34 Years | 681 (31.2%) | 1,213 (55.6%) |
| 35 to 44 Years | 294 (12.8%) | 1,817 (79.3%) |
| 45 to 54 Years | 454 (18.4%) | 1,765 (71.5%) |
| 55 to 64 Years | 591 (21.4%) | 2,078 (75.4%) |
| 65 to 74 Years | 2,233 (95.3%) | 1,206 (51.5%) |
| 75 Years and over | 1,593 (99.6%) | 1,111 (69.5%) |
| Total | 8,031 (39.7%) | 12,929 (63.8%) |
Disability Status by Sex by Age in Fulton County
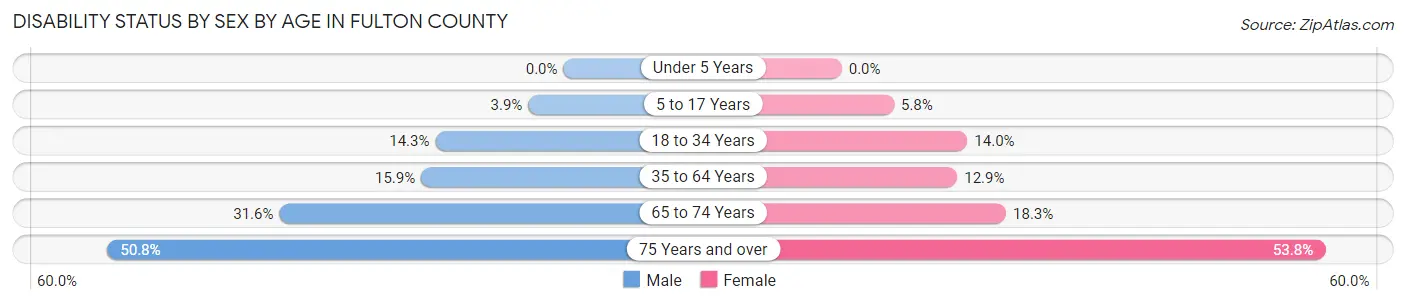
| Age Bracket | Male | Female |
| Under 5 Years | 0 (0.0%) | 0 (0.0%) |
| 5 to 17 Years | 72 (3.9%) | 103 (5.8%) |
| 18 to 34 Years | 283 (14.3%) | 275 (14.0%) |
| 35 to 64 Years | 611 (15.9%) | 471 (12.9%) |
| 65 to 74 Years | 373 (31.6%) | 213 (18.3%) |
| 75 Years and over | 326 (50.8%) | 515 (53.8%) |
Disability Class by Sex by Age in Fulton County
Disability Class: Hearing Difficulty
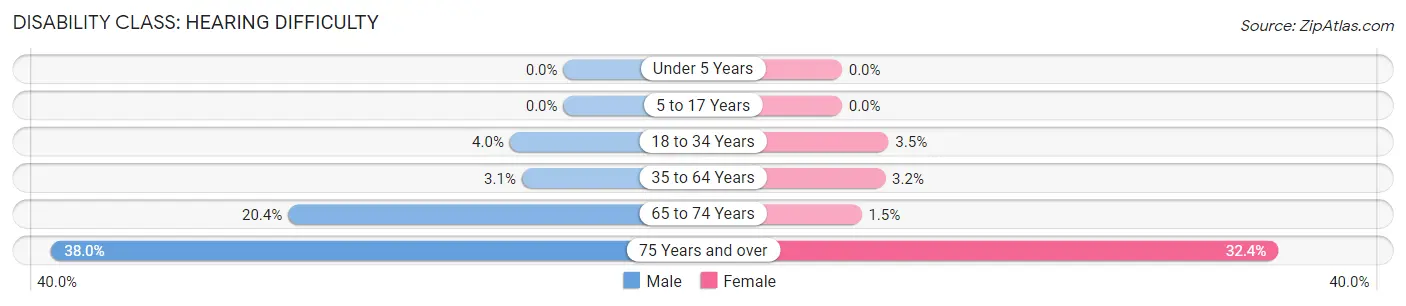
| Age Bracket | Male | Female |
| Under 5 Years | 0 (0.0%) | 0 (0.0%) |
| 5 to 17 Years | 0 (0.0%) | 0 (0.0%) |
| 18 to 34 Years | 79 (4.0%) | 68 (3.5%) |
| 35 to 64 Years | 119 (3.1%) | 118 (3.2%) |
| 65 to 74 Years | 241 (20.4%) | 17 (1.5%) |
| 75 Years and over | 244 (38.0%) | 310 (32.4%) |
Disability Class: Vision Difficulty
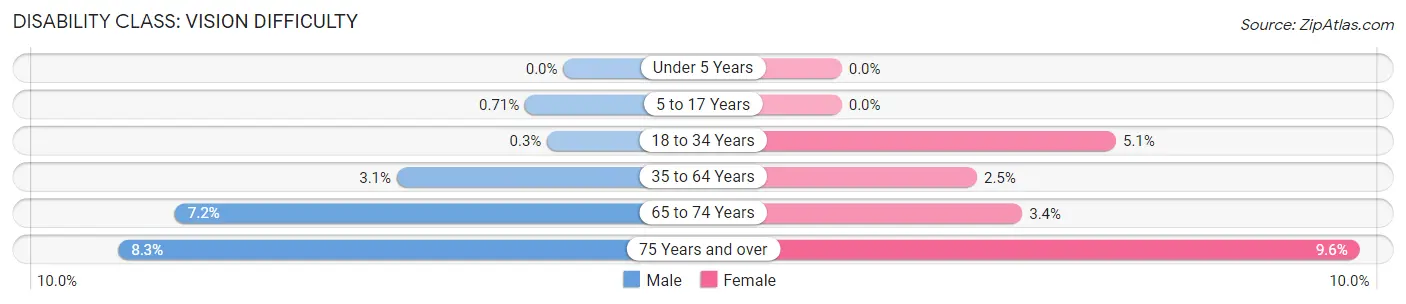
| Age Bracket | Male | Female |
| Under 5 Years | 0 (0.0%) | 0 (0.0%) |
| 5 to 17 Years | 13 (0.7%) | 0 (0.0%) |
| 18 to 34 Years | 6 (0.3%) | 100 (5.1%) |
| 35 to 64 Years | 119 (3.1%) | 92 (2.5%) |
| 65 to 74 Years | 85 (7.2%) | 39 (3.4%) |
| 75 Years and over | 53 (8.3%) | 92 (9.6%) |
Disability Class: Cognitive Difficulty
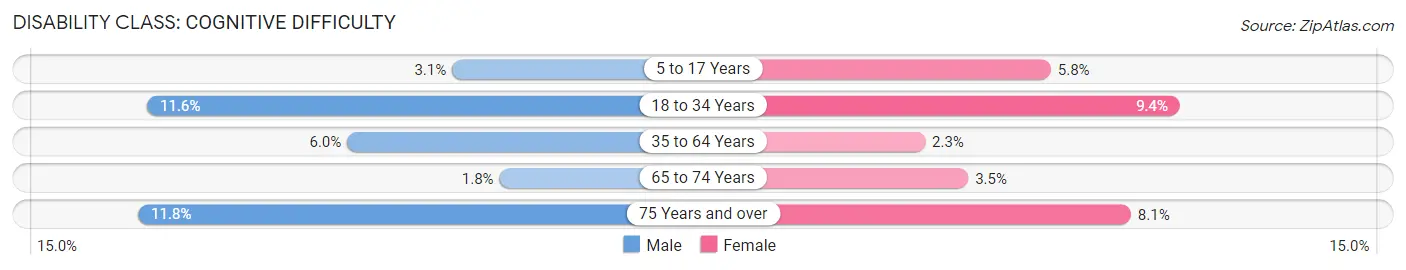
| Age Bracket | Male | Female |
| 5 to 17 Years | 57 (3.1%) | 103 (5.8%) |
| 18 to 34 Years | 230 (11.6%) | 185 (9.4%) |
| 35 to 64 Years | 232 (6.0%) | 85 (2.3%) |
| 65 to 74 Years | 21 (1.8%) | 41 (3.5%) |
| 75 Years and over | 76 (11.8%) | 77 (8.1%) |
Disability Class: Ambulatory Difficulty
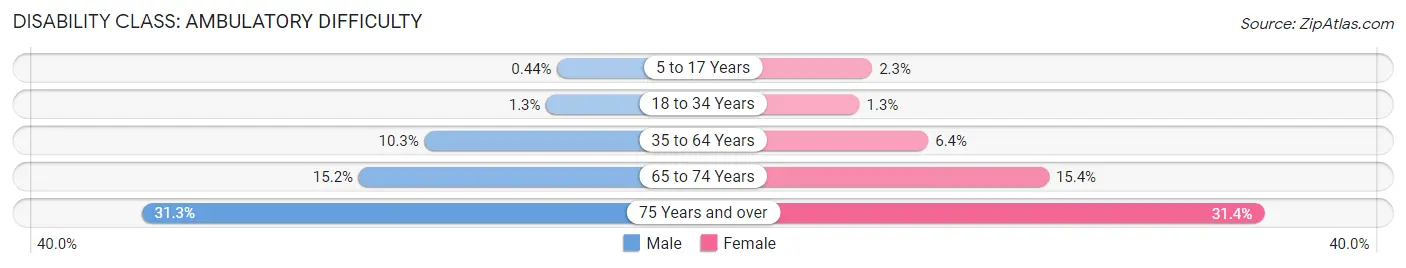
| Age Bracket | Male | Female |
| 5 to 17 Years | 8 (0.4%) | 40 (2.3%) |
| 18 to 34 Years | 25 (1.3%) | 26 (1.3%) |
| 35 to 64 Years | 397 (10.3%) | 235 (6.4%) |
| 65 to 74 Years | 179 (15.2%) | 179 (15.4%) |
| 75 Years and over | 201 (31.3%) | 300 (31.4%) |
Disability Class: Self-Care Difficulty
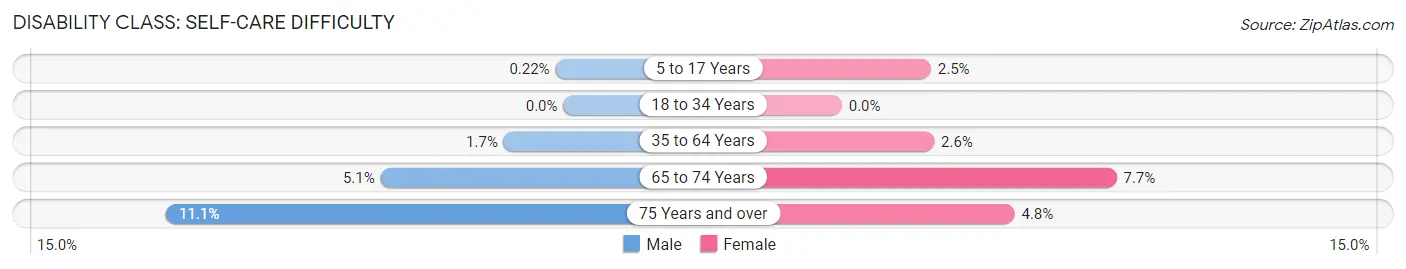
| Age Bracket | Male | Female |
| 5 to 17 Years | 4 (0.2%) | 44 (2.5%) |
| 18 to 34 Years | 0 (0.0%) | 0 (0.0%) |
| 35 to 64 Years | 64 (1.7%) | 94 (2.6%) |
| 65 to 74 Years | 60 (5.1%) | 89 (7.6%) |
| 75 Years and over | 71 (11.1%) | 46 (4.8%) |
Technology Access in Fulton County
Computing Device Access in Fulton County
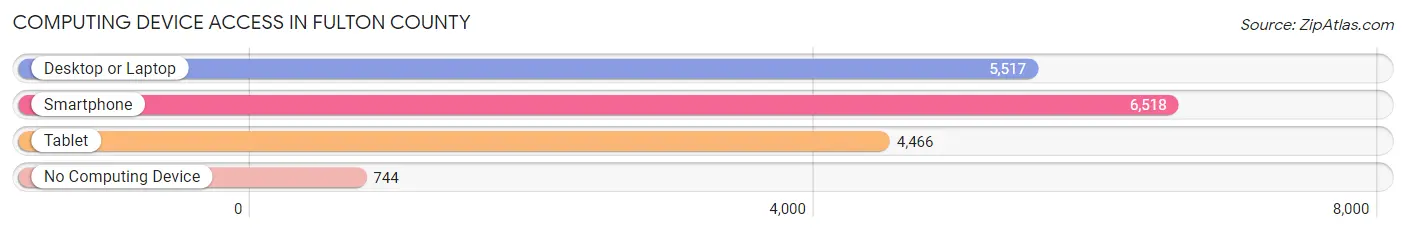
| Device Type | # Households | % Households |
| Desktop or Laptop | 5,517 | 70.8% |
| Smartphone | 6,518 | 83.6% |
| Tablet | 4,466 | 57.3% |
| No Computing Device | 744 | 9.6% |
| Total | 7,794 | 100.0% |
Internet Access in Fulton County
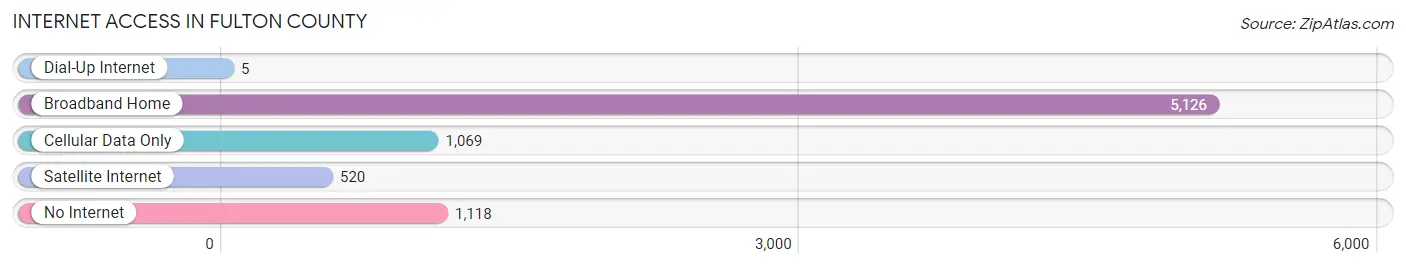
| Internet Type | # Households | % Households |
| Dial-Up Internet | 5 | 0.1% |
| Broadband Home | 5,126 | 65.8% |
| Cellular Data Only | 1,069 | 13.7% |
| Satellite Internet | 520 | 6.7% |
| No Internet | 1,118 | 14.3% |
| Total | 7,794 | 100.0% |
Fulton County Summary
Fulton County, Indiana is located in the northeast corner of the state, bordered by the states of Ohio and Michigan. It is part of the Fort Wayne-Huntington-Auburn Combined Statistical Area, and is the smallest county in Indiana by land area. The county seat is Rochester, and the largest city is Rochester.
History
Fulton County was formed in 1835 from parts of Cass, Miami, and Wabash counties. It was named for Robert Fulton, the inventor of the steamboat. The first settlers arrived in the area in 1834, and the county was officially organized in 1836.
The county was largely agricultural in its early years, with the main crops being wheat, corn, and oats. The Wabash and Erie Canal was built through the county in the 1840s, providing a transportation route for goods and people. The canal was eventually replaced by the railroad, which was completed in 1853.
The county experienced a period of growth in the late 19th and early 20th centuries, with the population increasing from 8,000 in 1880 to over 20,000 by 1910. This growth was largely due to the development of the coal mining industry in the area.
Geography
Fulton County is located in the northeast corner of Indiana, bordered by Ohio to the east and Michigan to the north. It is the smallest county in Indiana by land area, with a total area of only 180 square miles. The county is mostly flat, with some rolling hills in the northern part. The Tippecanoe River runs through the county, and there are several small lakes and ponds.
The climate of Fulton County is humid continental, with hot summers and cold winters. The average annual temperature is around 50°F, and the average annual precipitation is around 40 inches.
Economy
Fulton County has a diverse economy, with a mix of manufacturing, agriculture, and services. The largest employers in the county are the Rochester Community Schools, Fulton County Hospital, and the Fulton County Government.
Agriculture is an important part of the economy, with the main crops being corn, soybeans, and wheat. There are also several livestock farms in the county, raising cattle, hogs, and poultry.
Manufacturing is also an important part of the economy, with the main industries being automotive parts, plastics, and food processing.
Demographics
As of the 2010 census, Fulton County had a population of 20,898. The racial makeup of the county was 95.3% White, 1.2% African American, 0.4% Native American, 0.5% Asian, 0.1% Pacific Islander, 1.2% from other races, and 1.3% from two or more races. Hispanic or Latino of any race were 3.2% of the population.
The median household income in the county was $45,845, and the median family income was $54,845. The per capita income was $21,845. About 11.2% of the population was below the poverty line.
Common Questions
What is the Total Population of Fulton County?
Total Population of Fulton County is 20,420.
What is the Total Male Population of Fulton County?
Total Male Population of Fulton County is 10,257.
What is the Total Female Population of Fulton County?
Total Female Population of Fulton County is 10,163.
What is the Ratio of Males per 100 Females in Fulton County?
There are 100.92 Males per 100 Females in Fulton County.
What is the Ratio of Females per 100 Males in Fulton County?
There are 99.08 Females per 100 Males in Fulton County.
What is the Median Population Age in Fulton County?
Median Population Age in Fulton County is 40.9 Years.
What is the Average Family Size in Fulton County
Average Family Size in Fulton County is 3.0 People.
What is the Average Household Size in Fulton County
Average Household Size in Fulton County is 2.6 People.
What is Per Capita Income in Fulton County?
Per Capita income in Fulton County is $32,479.
What is the Median Family Income in Fulton County?
Median Family Income in Fulton County is $75,020.
What is the Median Household income in Fulton County?
Median Household Income in Fulton County is $62,644.
What is Income or Wage Gap in Fulton County?
Income or Wage Gap in Fulton County is 24.1%.
Women in Fulton County earn 75.9 cents for every dollar earned by a man.
What is Family Income Deficit in Fulton County?
Family Income Deficit in Fulton County is $6,547.
Families that are below poverty line in Fulton County earn $6,547 less on average than the poverty threshold level.
What is Inequality or Gini Index in Fulton County?
Inequality or Gini Index in Fulton County is 0.44.
How Large is the Labor Force in Fulton County?
There are 9,572 People in the Labor Forcein in Fulton County.
What is the Percentage of People in the Labor Force in Fulton County?
59.5% of People are in the Labor Force in Fulton County.
What is the Unemployment Rate in Fulton County?
Unemployment Rate in Fulton County is 7.2%.