Franklin County, IN
Franklin County Map
Franklin County Overview
22,850
TOTAL POPULATION
11,368
MALE POPULATION
11,482
FEMALE POPULATION
99.01
MALES / 100 FEMALES
101.00
FEMALES / 100 MALES
41.8
MEDIAN AGE
3.1
AVG FAMILY SIZE
2.5
AVG HOUSEHOLD SIZE
$36,246
PER CAPITA INCOME
$87,949
AVG FAMILY INCOME
$75,985
AVG HOUSEHOLD INCOME
33.1%
WAGE / INCOME GAP [ % ]
66.9¢/ $1
WAGE / INCOME GAP [ $ ]
$11,429
FAMILY INCOME DEFICIT
0.41
INEQUALITY / GINI INDEX
11,830
LABOR FORCE [ PEOPLE ]
64.4%
PERCENT IN LABOR FORCE
2.1%
UNEMPLOYMENT RATE
Race in Franklin County
The most populous races in Franklin County are White / Caucasian (22,096 | 96.7%), Two or more Races (475 | 2.1%), and Hispanic or Latino (294 | 1.3%).

| Race | # Population | % Population |
| Asian | 132 | 0.6% |
| Black / African American | 21 | 0.1% |
| Hawaiian / Pacific | 0 | 0.0% |
| Hispanic or Latino | 294 | 1.3% |
| Native / Alaskan | 0 | 0.0% |
| White / Caucasian | 22,096 | 96.7% |
| Two or more Races | 475 | 2.1% |
| Some other Race | 126 | 0.5% |
| Total | 22,850 | 100.0% |
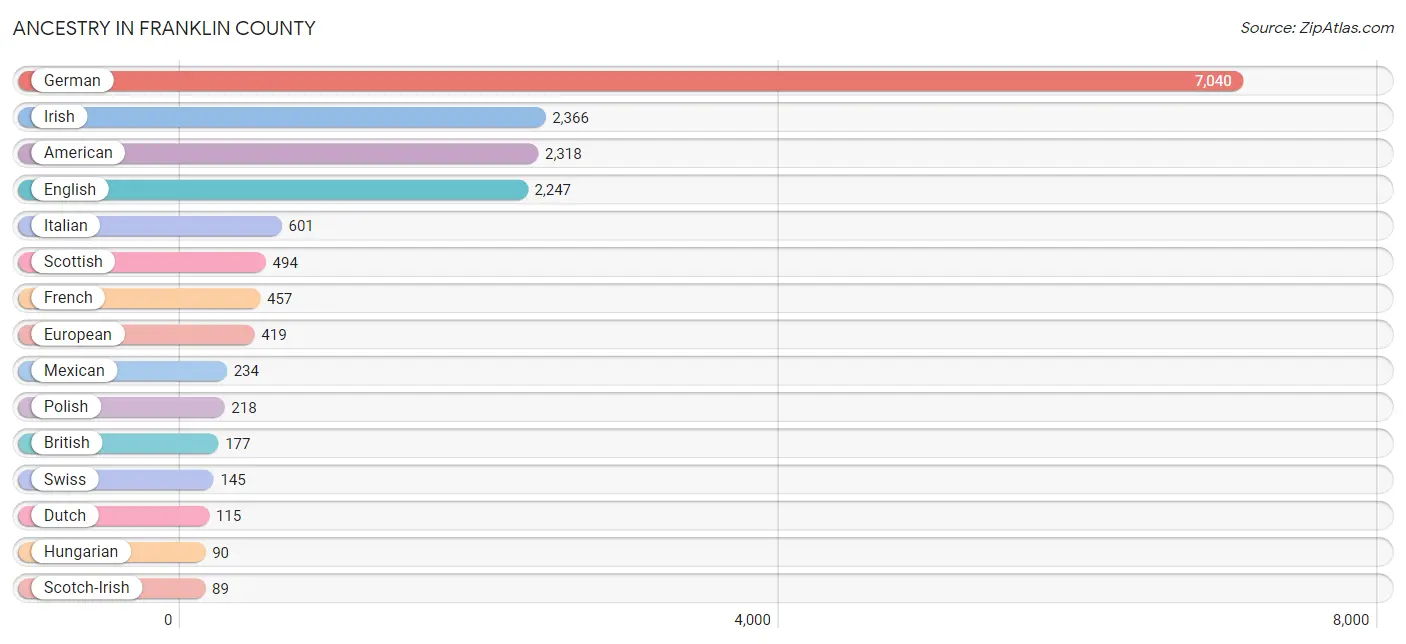
Ancestry in Franklin County
The most populous ancestries reported in Franklin County are German (7,040 | 30.8%), Irish (2,366 | 10.3%), American (2,318 | 10.1%), English (2,247 | 9.8%), and Italian (601 | 2.6%), together accounting for 63.8% of all Franklin County residents.
| Ancestry | # Population | % Population |
| American | 2,318 | 10.1% |
| Arab | 24 | 0.1% |
| Argentinean | 11 | 0.1% |
| Armenian | 27 | 0.1% |
| Austrian | 22 | 0.1% |
| Bhutanese | 19 | 0.1% |
| British | 177 | 0.8% |
| Burmese | 8 | 0.0% |
| Canadian | 31 | 0.1% |
| Cherokee | 77 | 0.3% |
| Danish | 14 | 0.1% |
| Dutch | 115 | 0.5% |
| Eastern European | 64 | 0.3% |
| English | 2,247 | 9.8% |
| European | 419 | 1.8% |
| Finnish | 33 | 0.1% |
| French | 457 | 2.0% |
| French American Indian | 5 | 0.0% |
| French Canadian | 22 | 0.1% |
| German | 7,040 | 30.8% |
| Greek | 31 | 0.1% |
| Hungarian | 90 | 0.4% |
| Irish | 2,366 | 10.3% |
| Iroquois | 14 | 0.1% |
| Italian | 601 | 2.6% |
| Lithuanian | 50 | 0.2% |
| Mexican | 234 | 1.0% |
| Northern European | 15 | 0.1% |
| Norwegian | 50 | 0.2% |
| Polish | 218 | 0.9% |
| Portuguese | 5 | 0.0% |
| Romanian | 68 | 0.3% |
| Russian | 54 | 0.2% |
| Scandinavian | 24 | 0.1% |
| Scotch-Irish | 89 | 0.4% |
| Scottish | 494 | 2.2% |
| Serbian | 26 | 0.1% |
| Slovak | 19 | 0.1% |
| Slovene | 4 | 0.0% |
| South American | 49 | 0.2% |
| Spanish | 7 | 0.0% |
| Sri Lankan | 84 | 0.4% |
| Swedish | 31 | 0.1% |
| Swiss | 145 | 0.6% |
| Thai | 40 | 0.2% |
| Venezuelan | 38 | 0.2% |
| Welsh | 50 | 0.2% |
| Yugoslavian | 22 | 0.1% | View All 48 Rows |
Immigrants in Franklin County
The most numerous immigrant groups reported in Franklin County came from Asia (107 | 0.5%), South Eastern Asia (84 | 0.4%), Vietnam (84 | 0.4%), Latin America (70 | 0.3%), and Central America (52 | 0.2%), together accounting for 1.8% of all Franklin County residents.

| Immigration Origin | # Population | % Population |
| Argentina | 11 | 0.1% |
| Asia | 107 | 0.5% |
| Canada | 31 | 0.1% |
| Central America | 52 | 0.2% |
| Chile | 7 | 0.0% |
| China | 23 | 0.1% |
| Eastern Asia | 23 | 0.1% |
| Eastern Europe | 37 | 0.2% |
| Europe | 37 | 0.2% |
| Latin America | 70 | 0.3% |
| Mexico | 52 | 0.2% |
| Russia | 37 | 0.2% |
| South America | 18 | 0.1% |
| South Eastern Asia | 84 | 0.4% |
| Vietnam | 84 | 0.4% | View All 15 Rows |
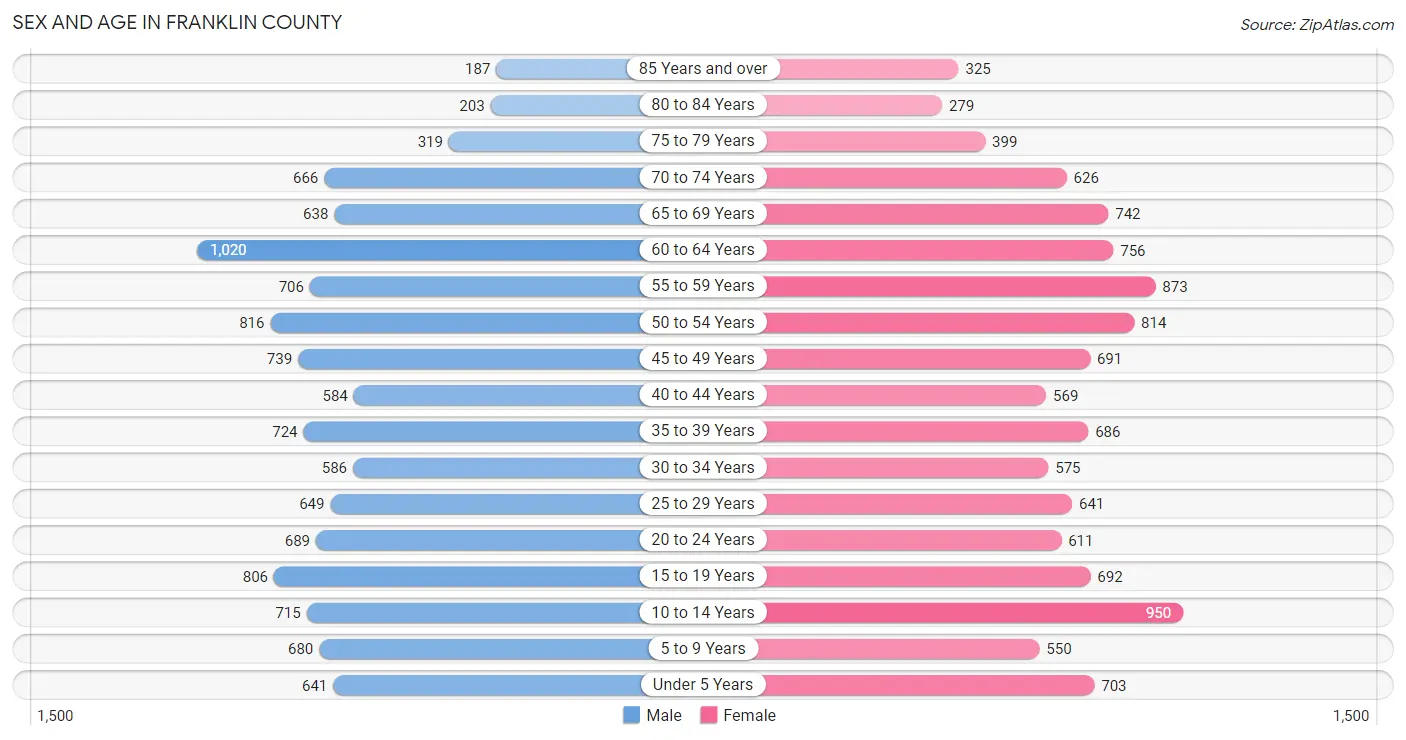
Sex and Age in Franklin County
Sex and Age in Franklin County
The most populous age groups in Franklin County are 60 to 64 Years (1,020 | 9.0%) for men and 10 to 14 Years (950 | 8.3%) for women.
| Age Bracket | Male | Female |
| Under 5 Years | 641 (5.6%) | 703 (6.1%) |
| 5 to 9 Years | 680 (6.0%) | 550 (4.8%) |
| 10 to 14 Years | 715 (6.3%) | 950 (8.3%) |
| 15 to 19 Years | 806 (7.1%) | 692 (6.0%) |
| 20 to 24 Years | 689 (6.1%) | 611 (5.3%) |
| 25 to 29 Years | 649 (5.7%) | 641 (5.6%) |
| 30 to 34 Years | 586 (5.1%) | 575 (5.0%) |
| 35 to 39 Years | 724 (6.4%) | 686 (6.0%) |
| 40 to 44 Years | 584 (5.1%) | 569 (5.0%) |
| 45 to 49 Years | 739 (6.5%) | 691 (6.0%) |
| 50 to 54 Years | 816 (7.2%) | 814 (7.1%) |
| 55 to 59 Years | 706 (6.2%) | 873 (7.6%) |
| 60 to 64 Years | 1,020 (9.0%) | 756 (6.6%) |
| 65 to 69 Years | 638 (5.6%) | 742 (6.5%) |
| 70 to 74 Years | 666 (5.9%) | 626 (5.4%) |
| 75 to 79 Years | 319 (2.8%) | 399 (3.5%) |
| 80 to 84 Years | 203 (1.8%) | 279 (2.4%) |
| 85 Years and over | 187 (1.6%) | 325 (2.8%) |
| Total | 11,368 (100.0%) | 11,482 (100.0%) |
Families and Households in Franklin County
Median Family Size in Franklin County
The median family size in Franklin County is 3.09 persons per family, with single male/father families (359 | 5.8%) accounting for the largest median family size of 3.17 persons per family. On the other hand, single female/mother families (901 | 14.6%) represent the smallest median family size with 2.81 persons per family.

| Family Type | # Families | Family Size |
| Married-Couple | 4,891 (79.5%) | 3.14 |
| Single Male/Father | 359 (5.8%) | 3.17 |
| Single Female/Mother | 901 (14.6%) | 2.81 |
| Total Families | 6,151 (100.0%) | 3.09 |
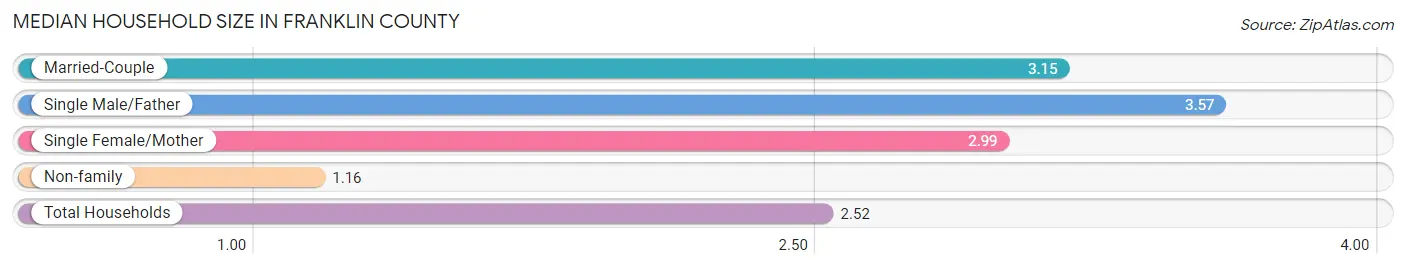
Median Household Size in Franklin County
The median household size in Franklin County is 2.52 persons per household, with single male/father households (359 | 4.0%) accounting for the largest median household size of 3.57 persons per household. non-family households (2,825 | 31.5%) represent the smallest median household size with 1.16 persons per household.
| Household Type | # Households | Household Size |
| Married-Couple | 4,891 (54.5%) | 3.15 |
| Single Male/Father | 359 (4.0%) | 3.57 |
| Single Female/Mother | 901 (10.0%) | 2.99 |
| Non-family | 2,825 (31.5%) | 1.16 |
| Total Households | 8,976 (100.0%) | 2.52 |
Household Size by Marriage Status in Franklin County
Out of a total of 8,976 households in Franklin County, 6,151 (68.5%) are family households, while 2,825 (31.5%) are nonfamily households. The most numerous type of family households are 2-person households, comprising 3,065, and the most common type of nonfamily households are 1-person households, comprising 2,475.

| Household Size | Family Households | Nonfamily Households |
| 1-Person Households | - | 2,475 (27.6%) |
| 2-Person Households | 3,065 (34.2%) | 332 (3.7%) |
| 3-Person Households | 1,340 (14.9%) | 7 (0.1%) |
| 4-Person Households | 844 (9.4%) | 0 (0.0%) |
| 5-Person Households | 567 (6.3%) | 11 (0.1%) |
| 6-Person Households | 128 (1.4%) | 0 (0.0%) |
| 7+ Person Households | 207 (2.3%) | 0 (0.0%) |
| Total | 6,151 (68.5%) | 2,825 (31.5%) |
Female Fertility in Franklin County
Fertility by Age in Franklin County
Average fertility rate in Franklin County is 79.0 births per 1,000 women. Women in the age bracket of 20 to 34 years have the highest fertility rate with 131.0 births per 1,000 women. Women in the age bracket of 20 to 34 years acount for 65.7% of all women with births.

| Age Bracket | Women with Births | Births / 1,000 Women |
| 15 to 19 years | 7 (1.9%) | 10.0 |
| 20 to 34 years | 240 (65.7%) | 131.0 |
| 35 to 50 years | 118 (32.3%) | 56.0 |
| Total | 365 (100.0%) | 79.0 |
Fertility by Age by Marriage Status in Franklin County
65.2% of women with births (365) in Franklin County are married. The highest percentage of unmarried women with births falls into 15 to 19 years age bracket with 100.0% of them unmarried at the time of birth, while the lowest percentage of unmarried women with births belong to 35 to 50 years age bracket with 0.0% of them unmarried.
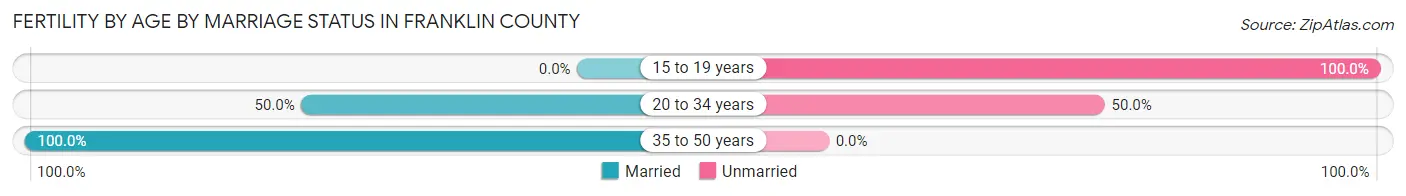
| Age Bracket | Married | Unmarried |
| 15 to 19 years | 0 (0.0%) | 7 (100.0%) |
| 20 to 34 years | 120 (50.0%) | 120 (50.0%) |
| 35 to 50 years | 118 (100.0%) | 0 (0.0%) |
| Total | 238 (65.2%) | 127 (34.8%) |
Fertility by Education in Franklin County
Average fertility rate in Franklin County is 79.0 births per 1,000 women. Women with the education attainment of college or associate's degree have the highest fertility rate of 171.0 births per 1,000 women, while women with the education attainment of less than high school have the lowest fertility at 9.0 births per 1,000 women. Women with the education attainment of college or associate's degree represent 75.1% of all women with births.
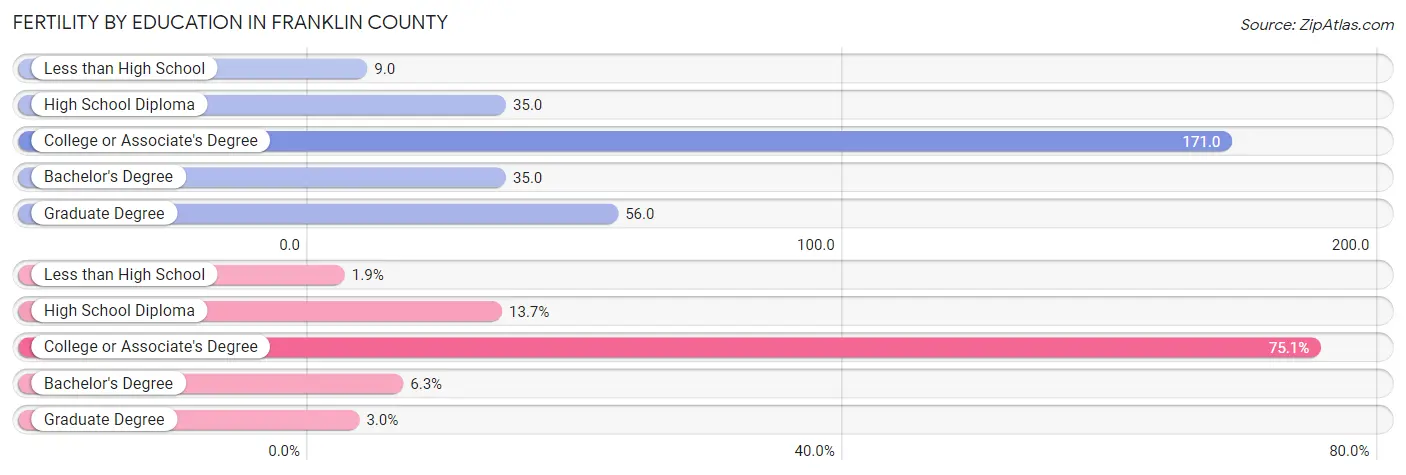
| Educational Attainment | Women with Births | Births / 1,000 Women |
| Less than High School | 7 (1.9%) | 9.0 |
| High School Diploma | 50 (13.7%) | 35.0 |
| College or Associate's Degree | 274 (75.1%) | 171.0 |
| Bachelor's Degree | 23 (6.3%) | 35.0 |
| Graduate Degree | 11 (3.0%) | 56.0 |
| Total | 365 (100.0%) | 79.0 |
Fertility by Education by Marriage Status in Franklin County
34.8% of women with births in Franklin County are unmarried. Women with the educational attainment of less than high school are most likely to be married with 100.0% of them married at childbirth, while women with the educational attainment of high school diploma are least likely to be married with 50.0% of them unmarried at childbirth.

| Educational Attainment | Married | Unmarried |
| Less than High School | 7 (100.0%) | 0 (0.0%) |
| High School Diploma | 25 (50.0%) | 25 (50.0%) |
| College or Associate's Degree | 172 (62.8%) | 102 (37.2%) |
| Bachelor's Degree | 23 (100.0%) | 0 (0.0%) |
| Graduate Degree | 11 (100.0%) | 0 (0.0%) |
| Total | 238 (65.2%) | 127 (34.8%) |
Income in Franklin County
Income Overview in Franklin County
Per Capita Income in Franklin County is $36,246, while median incomes of families and households are $87,949 and $75,985 respectively.
| Characteristic | Number | Measure |
| Per Capita Income | 22,850 | $36,246 |
| Median Family Income | 6,151 | $87,949 |
| Mean Family Income | 6,151 | $106,124 |
| Median Household Income | 8,976 | $75,985 |
| Mean Household Income | 8,976 | $89,486 |
| Income Deficit | 6,151 | $11,429 |
| Wage / Income Gap (%) | 22,850 | 33.06% |
| Wage / Income Gap ($) | 22,850 | 66.94¢ per $1 |
| Gini / Inequality Index | 22,850 | 0.41 |
Earnings by Sex in Franklin County
Average Earnings in Franklin County are $43,096, $52,160 for men and $34,915 for women, a difference of 33.1%.

| Sex | Number | Average Earnings |
| Male | 6,721 (54.6%) | $52,160 |
| Female | 5,588 (45.4%) | $34,915 |
| Total | 12,309 (100.0%) | $43,096 |
Earnings by Sex by Income Bracket in Franklin County
The most common earnings brackets in Franklin County are $75,000 to $99,999 for men (1,002 | 14.9%) and $25,000 to $29,999 for women (528 | 9.5%).
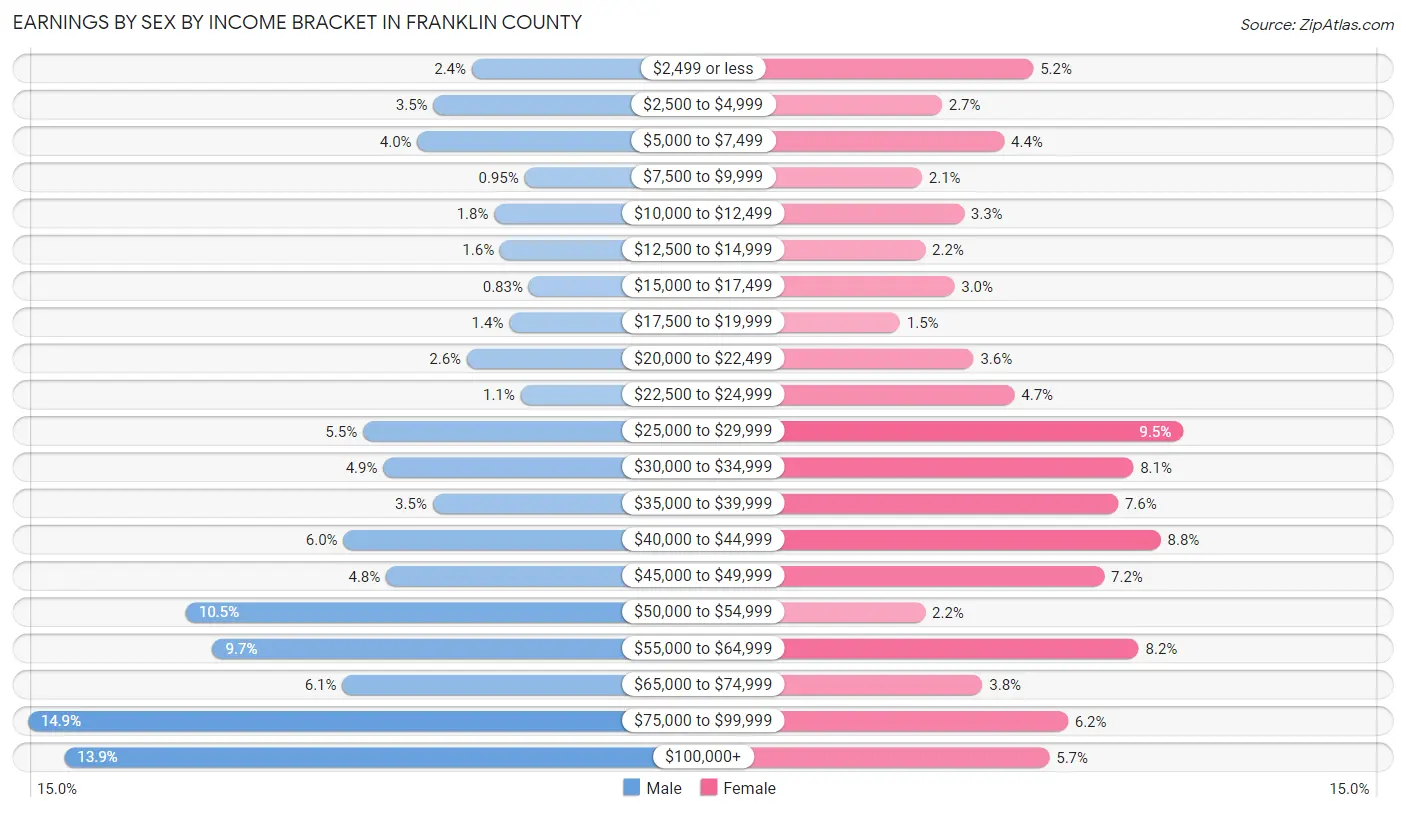
| Income | Male | Female |
| $2,499 or less | 163 (2.4%) | 293 (5.2%) |
| $2,500 to $4,999 | 236 (3.5%) | 149 (2.7%) |
| $5,000 to $7,499 | 266 (4.0%) | 247 (4.4%) |
| $7,500 to $9,999 | 64 (0.9%) | 118 (2.1%) |
| $10,000 to $12,499 | 121 (1.8%) | 184 (3.3%) |
| $12,500 to $14,999 | 110 (1.6%) | 123 (2.2%) |
| $15,000 to $17,499 | 56 (0.8%) | 169 (3.0%) |
| $17,500 to $19,999 | 93 (1.4%) | 83 (1.5%) |
| $20,000 to $22,499 | 173 (2.6%) | 199 (3.6%) |
| $22,500 to $24,999 | 71 (1.1%) | 263 (4.7%) |
| $25,000 to $29,999 | 369 (5.5%) | 528 (9.5%) |
| $30,000 to $34,999 | 331 (4.9%) | 450 (8.1%) |
| $35,000 to $39,999 | 237 (3.5%) | 426 (7.6%) |
| $40,000 to $44,999 | 406 (6.0%) | 493 (8.8%) |
| $45,000 to $49,999 | 325 (4.8%) | 404 (7.2%) |
| $50,000 to $54,999 | 704 (10.5%) | 123 (2.2%) |
| $55,000 to $64,999 | 653 (9.7%) | 458 (8.2%) |
| $65,000 to $74,999 | 408 (6.1%) | 213 (3.8%) |
| $75,000 to $99,999 | 1,002 (14.9%) | 347 (6.2%) |
| $100,000+ | 933 (13.9%) | 318 (5.7%) |
| Total | 6,721 (100.0%) | 5,588 (100.0%) |
Earnings by Sex by Educational Attainment in Franklin County
Average earnings in Franklin County are $56,331 for men and $37,207 for women, a difference of 34.0%. Men with an educational attainment of graduate degree enjoy the highest average annual earnings of $87,222, while those with high school diploma education earn the least with $50,065. Women with an educational attainment of graduate degree earn the most with the average annual earnings of $64,782, while those with less than high school education have the smallest earnings of $14,760.

| Educational Attainment | Male Income | Female Income |
| Less than High School | $50,472 | $14,760 |
| High School Diploma | $50,065 | $37,342 |
| College or Associate's Degree | $64,338 | $29,759 |
| Bachelor's Degree | $86,000 | $47,135 |
| Graduate Degree | $87,222 | $64,782 |
| Total | $56,331 | $37,207 |
Family Income in Franklin County
Family Income Brackets in Franklin County
According to the Franklin County family income data, there are 1,230 families falling into the $100,000 to $149,999 income range, which is the most common income bracket and makes up 20.0% of all families. Conversely, the $10,000 to $14,999 income bracket is the least frequent group with only 68 families (1.1%) belonging to this category.

| Income Bracket | # Families | % Families |
| Less than $10,000 | 148 | 2.4% |
| $10,000 to $14,999 | 68 | 1.1% |
| $15,000 to $24,999 | 135 | 2.2% |
| $25,000 to $34,999 | 332 | 5.4% |
| $35,000 to $49,999 | 695 | 11.3% |
| $50,000 to $74,999 | 1,113 | 18.1% |
| $75,000 to $99,999 | 1,156 | 18.8% |
| $100,000 to $149,999 | 1,230 | 20.0% |
| $150,000 to $199,999 | 701 | 11.4% |
| $200,000+ | 584 | 9.5% |
Family Income by Famaliy Size in Franklin County
4-person families (860 | 14.0%) account for the highest median family income in Franklin County with $127,300 per family, while 2-person families (3,324 | 54.0%) have the highest median income of $40,733 per family member.
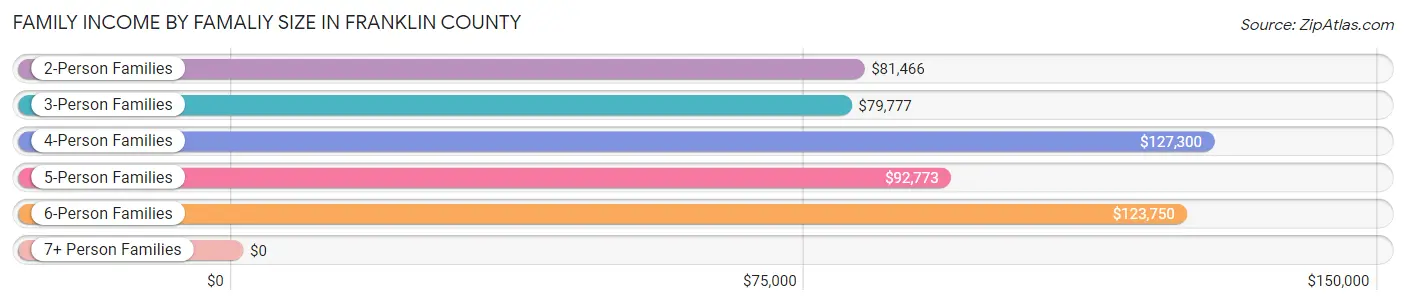
| Income Bracket | # Families | Median Income |
| 2-Person Families | 3,324 (54.0%) | $81,466 |
| 3-Person Families | 1,138 (18.5%) | $79,777 |
| 4-Person Families | 860 (14.0%) | $127,300 |
| 5-Person Families | 558 (9.1%) | $92,773 |
| 6-Person Families | 78 (1.3%) | $123,750 |
| 7+ Person Families | 193 (3.1%) | $0 |
| Total | 6,151 (100.0%) | $87,949 |
Family Income by Number of Earners in Franklin County
The median family income in Franklin County is $87,949, with families comprising 3+ earners (759) having the highest median family income of $141,385, while families with no earners (904) have the lowest median family income of $54,143, accounting for 12.3% and 14.7% of families, respectively.
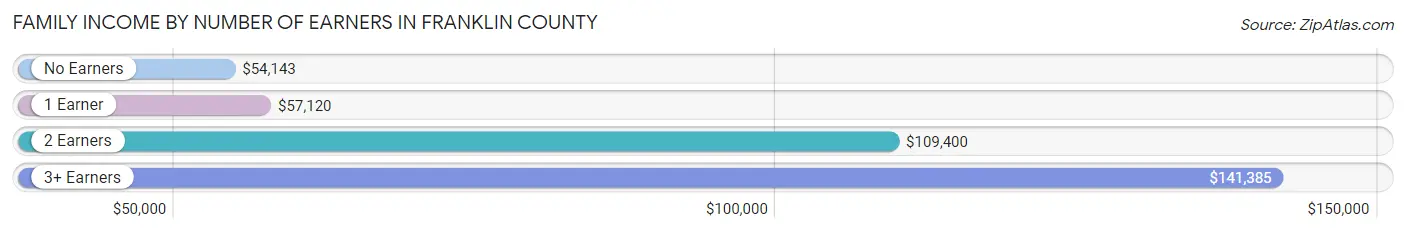
| Number of Earners | # Families | Median Income |
| No Earners | 904 (14.7%) | $54,143 |
| 1 Earner | 1,606 (26.1%) | $57,120 |
| 2 Earners | 2,882 (46.9%) | $109,400 |
| 3+ Earners | 759 (12.3%) | $141,385 |
| Total | 6,151 (100.0%) | $87,949 |
Household Income in Franklin County
Household Income Brackets in Franklin County
With 1,750 households falling in the category, the $75,000 to $99,999 income range is the most frequent in Franklin County, accounting for 19.5% of all households. In contrast, only 278 households (3.1%) fall into the $10,000 to $14,999 income bracket, making it the least populous group.

| Income Bracket | # Households | % Households |
| Less than $10,000 | 296 | 3.3% |
| $10,000 to $14,999 | 278 | 3.1% |
| $15,000 to $24,999 | 673 | 7.5% |
| $25,000 to $34,999 | 754 | 8.4% |
| $35,000 to $49,999 | 898 | 10.0% |
| $50,000 to $74,999 | 1,517 | 16.9% |
| $75,000 to $99,999 | 1,750 | 19.5% |
| $100,000 to $149,999 | 1,490 | 16.6% |
| $150,000 to $199,999 | 718 | 8.0% |
| $200,000+ | 601 | 6.7% |
Household Income by Householder Age in Franklin County
The median household income in Franklin County is $75,985, with the highest median household income of $91,468 found in the 45 to 64 years age bracket for the primary householder. A total of 3,601 households (40.1%) fall into this category. Meanwhile, the 15 to 24 years age bracket for the primary householder has the lowest median household income of $38,816, with 164 households (1.8%) in this group.

| Income Bracket | # Households | Median Income |
| 15 to 24 Years | 164 (1.8%) | $38,816 |
| 25 to 44 Years | 2,349 (26.2%) | $89,506 |
| 45 to 64 Years | 3,601 (40.1%) | $91,468 |
| 65+ Years | 2,862 (31.9%) | $44,419 |
| Total | 8,976 (100.0%) | $75,985 |
Poverty in Franklin County
Income Below Poverty by Sex and Age in Franklin County
With 6.0% poverty level for males and 8.7% for females among the residents of Franklin County, 12 to 14 year old males and 5 year old females are the most vulnerable to poverty, with 61 males (17.5%) and 17 females (28.3%) in their respective age groups living below the poverty level.

| Age Bracket | Male | Female |
| Under 5 Years | 62 (9.7%) | 76 (10.8%) |
| 5 Years | 8 (4.9%) | 17 (28.3%) |
| 6 to 11 Years | 104 (12.7%) | 77 (10.7%) |
| 12 to 14 Years | 61 (17.5%) | 12 (1.7%) |
| 15 Years | 11 (9.5%) | 0 (0.0%) |
| 16 and 17 Years | 18 (4.6%) | 36 (10.4%) |
| 18 to 24 Years | 37 (3.7%) | 72 (8.7%) |
| 25 to 34 Years | 89 (7.2%) | 115 (9.5%) |
| 35 to 44 Years | 71 (5.4%) | 45 (3.6%) |
| 45 to 54 Years | 81 (5.2%) | 159 (10.6%) |
| 55 to 64 Years | 53 (3.1%) | 160 (9.8%) |
| 65 to 74 Years | 62 (4.8%) | 110 (8.2%) |
| 75 Years and over | 15 (2.2%) | 118 (11.8%) |
| Total | 672 (6.0%) | 997 (8.7%) |
Income Above Poverty by Sex and Age in Franklin County
According to the poverty statistics in Franklin County, males aged 75 years and over and females aged 15 years are the age groups that are most secure financially, with 97.8% of males and 100.0% of females in these age groups living above the poverty line.
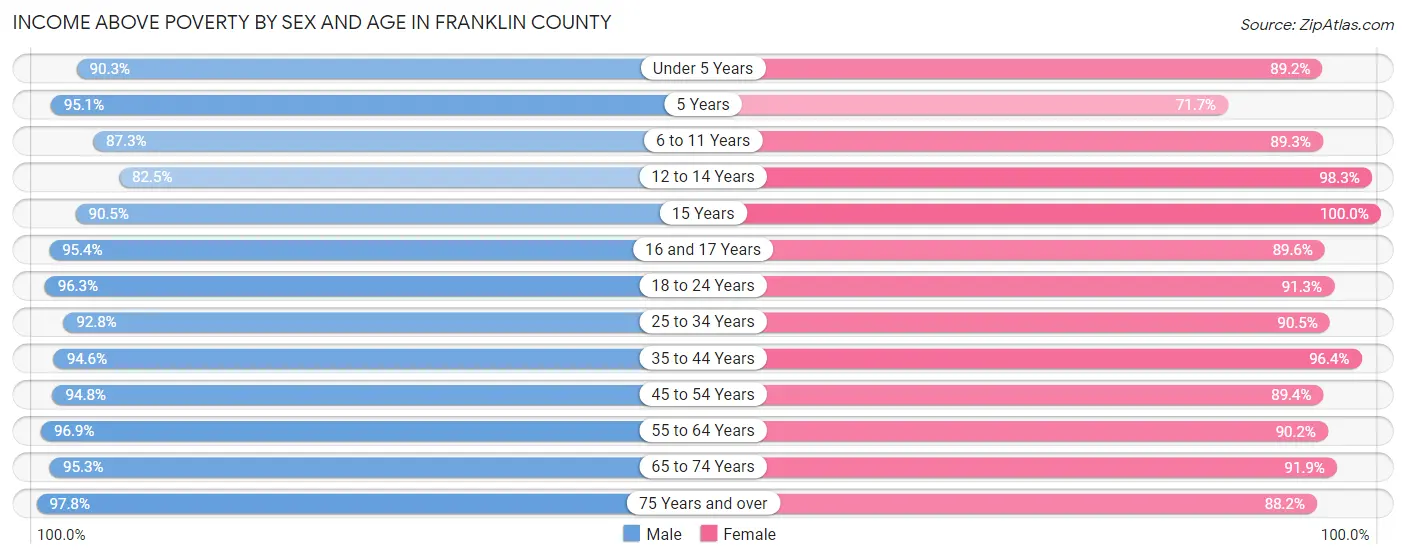
| Age Bracket | Male | Female |
| Under 5 Years | 579 (90.3%) | 627 (89.2%) |
| 5 Years | 156 (95.1%) | 43 (71.7%) |
| 6 to 11 Years | 713 (87.3%) | 639 (89.2%) |
| 12 to 14 Years | 287 (82.5%) | 698 (98.3%) |
| 15 Years | 105 (90.5%) | 126 (100.0%) |
| 16 and 17 Years | 375 (95.4%) | 311 (89.6%) |
| 18 to 24 Years | 949 (96.3%) | 758 (91.3%) |
| 25 to 34 Years | 1,146 (92.8%) | 1,101 (90.5%) |
| 35 to 44 Years | 1,237 (94.6%) | 1,210 (96.4%) |
| 45 to 54 Years | 1,474 (94.8%) | 1,335 (89.4%) |
| 55 to 64 Years | 1,673 (96.9%) | 1,469 (90.2%) |
| 65 to 74 Years | 1,242 (95.3%) | 1,240 (91.8%) |
| 75 Years and over | 657 (97.8%) | 879 (88.2%) |
| Total | 10,593 (94.0%) | 10,436 (91.3%) |
Income Below Poverty Among Married-Couple Families in Franklin County
The poverty statistics for married-couple families in Franklin County show that 2.4% or 115 of the total 4,891 families live below the poverty line. Families with 5 or more children have the highest poverty rate of 6.3%, comprising of 8 families. On the other hand, families with 3 or 4 children have the lowest poverty rate of 1.1%, which includes 4 families.

| Children | Above Poverty | Below Poverty |
| No Children | 3,271 (97.9%) | 70 (2.1%) |
| 1 or 2 Children | 1,036 (96.9%) | 33 (3.1%) |
| 3 or 4 Children | 350 (98.9%) | 4 (1.1%) |
| 5 or more Children | 119 (93.7%) | 8 (6.3%) |
| Total | 4,776 (97.7%) | 115 (2.4%) |
Income Below Poverty Among Single-Parent Households in Franklin County

| Children | Single Father | Single Mother |
| No Children | 0 (0.0%) | 70 (16.9%) |
| 1 or 2 Children | 0 (0.0%) | 64 (15.0%) |
| 3 or 4 Children | 0 (0.0%) | 42 (75.0%) |
| 5 or more Children | 0 (0.0%) | 5 (100.0%) |
| Total | 0 (0.0%) | 181 (20.1%) |
Income Below Poverty Among Married-Couple vs Single-Parent Households in Franklin County
The poverty data for Franklin County shows that 115 of the married-couple family households (2.4%) and 181 of the single-parent households (14.4%) are living below the poverty level. Within the married-couple family households, those with 5 or more children have the highest poverty rate, with 8 households (6.3%) falling below the poverty line. Among the single-parent households, those with 5 or more children have the highest poverty rate, with 5 household (100.0%) living below poverty.
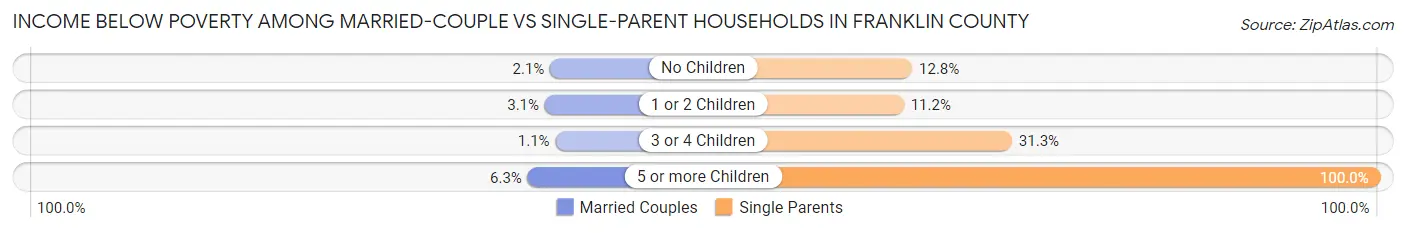
| Children | Married-Couple Families | Single-Parent Households |
| No Children | 70 (2.1%) | 70 (12.8%) |
| 1 or 2 Children | 33 (3.1%) | 64 (11.2%) |
| 3 or 4 Children | 4 (1.1%) | 42 (31.3%) |
| 5 or more Children | 8 (6.3%) | 5 (100.0%) |
| Total | 115 (2.4%) | 181 (14.4%) |
Employment Characteristics in Franklin County
Employment by Class of Employer in Franklin County
Among the 11,370 employed individuals in Franklin County, private company employees (8,232 | 72.4%), not-for-profit organizations (1,037 | 9.1%), and self-employed (not incorporated) (691 | 6.1%) make up the most common classes of employment.

| Employer Class | # Employees | % Employees |
| Private Company Employees | 8,232 | 72.4% |
| Self-Employed (Incorporated) | 477 | 4.2% |
| Self-Employed (Not Incorporated) | 691 | 6.1% |
| Not-for-profit Organizations | 1,037 | 9.1% |
| Local Government Employees | 682 | 6.0% |
| State Government Employees | 154 | 1.3% |
| Federal Government Employees | 85 | 0.7% |
| Unpaid Family Workers | 12 | 0.1% |
| Total | 11,370 | 100.0% |
Employment Status by Age in Franklin County
According to the labor force statistics for Franklin County, out of the total population over 16 years of age (18,369), 64.4% or 11,830 individuals are in the labor force, with 2.1% or 248 of them unemployed. The age group with the highest labor force participation rate is 25 to 29 years, with 88.4% or 1,140 individuals in the labor force. Within the labor force, the 16 to 19 years age range has the highest percentage of unemployed individuals, with 12.1% or 68 of them being unemployed.

| Age Bracket | In Labor Force | Unemployed |
| 16 to 19 Years | 560 (44.6%) | 68 (12.1%) |
| 20 to 24 Years | 1,138 (87.5%) | 34 (3.0%) |
| 25 to 29 Years | 1,140 (88.4%) | 35 (3.1%) |
| 30 to 34 Years | 958 (82.5%) | 27 (2.8%) |
| 35 to 44 Years | 2,163 (84.4%) | 41 (1.9%) |
| 45 to 54 Years | 2,616 (85.5%) | 44 (1.7%) |
| 55 to 59 Years | 1,238 (78.4%) | 0 (0.0%) |
| 60 to 64 Years | 1,243 (70.0%) | 0 (0.0%) |
| 65 to 74 Years | 732 (27.4%) | 3 (0.4%) |
| 75 Years and over | 46 (2.7%) | 0 (0.0%) |
| Total | 11,830 (64.4%) | 248 (2.1%) |
Employment Status by Educational Attainment in Franklin County
According to labor force statistics for Franklin County, 81.9% of individuals (9,360) out of the total population between 25 and 64 years of age (11,429) are in the labor force, with 1.6% or 150 of them being unemployed. The group with the highest labor force participation rate are those with the educational attainment of bachelor's degree or higher, with 87.7% or 2,283 individuals in the labor force. Within the labor force, individuals with less than high school education have the highest percentage of unemployment, with 9.4% or 56 of them being unemployed.
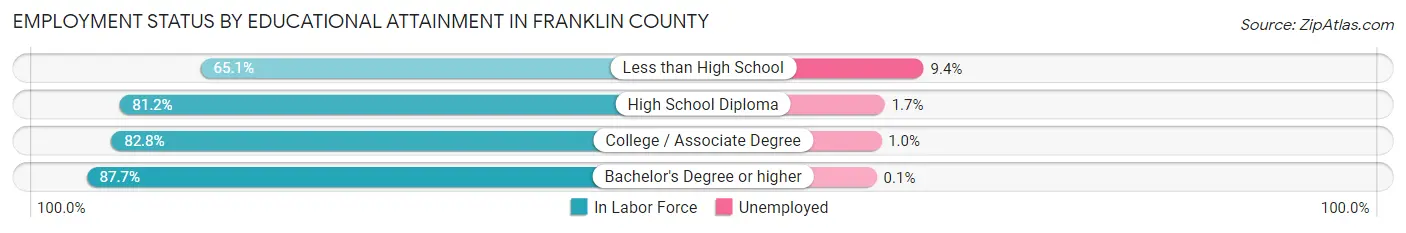
| Educational Attainment | In Labor Force | Unemployed |
| Less than High School | 593 (65.1%) | 86 (9.4%) |
| High School Diploma | 3,573 (81.2%) | 75 (1.7%) |
| College / Associate Degree | 2,910 (82.8%) | 35 (1.0%) |
| Bachelor's Degree or higher | 2,283 (87.7%) | 3 (0.1%) |
| Total | 9,360 (81.9%) | 183 (1.6%) |
Employment Occupations by Sex in Franklin County
Management, Business, Science and Arts Occupations
The most common Management, Business, Science and Arts occupations in Franklin County are Health Diagnosing & Treating (983 | 8.5%), Management (825 | 7.1%), Computers, Engineering & Science (772 | 6.7%), Community & Social Service (646 | 5.6%), and Health Technologists (559 | 4.8%).

Management, Business, Science and Arts Occupations by Sex
Within the Management, Business, Science and Arts occupations in Franklin County, the most male-oriented occupations are Legal Services & Support (100.0%), Architecture & Engineering (77.7%), and Computers & Mathematics (75.7%), while the most female-oriented occupations are Arts, Media & Entertainment (100.0%), Education Instruction & Library (78.3%), and Health Diagnosing & Treating (78.1%).

| Occupation | Male | Female |
| Management | 458 (55.5%) | 367 (44.5%) |
| Business & Financial | 142 (49.8%) | 143 (50.2%) |
| Computers, Engineering & Science | 578 (74.9%) | 194 (25.1%) |
| Computers & Mathematics | 252 (75.7%) | 81 (24.3%) |
| Architecture & Engineering | 283 (77.7%) | 81 (22.3%) |
| Life, Physical & Social Science | 43 (57.3%) | 32 (42.7%) |
| Community & Social Service | 194 (30.0%) | 452 (70.0%) |
| Education, Arts & Media | 68 (36.8%) | 117 (63.2%) |
| Legal Services & Support | 43 (100.0%) | 0 (0.0%) |
| Education Instruction & Library | 83 (21.7%) | 300 (78.3%) |
| Arts, Media & Entertainment | 0 (0.0%) | 35 (100.0%) |
| Health Diagnosing & Treating | 215 (21.9%) | 768 (78.1%) |
| Health Technologists | 164 (29.3%) | 395 (70.7%) |
| Total (Category) | 1,587 (45.2%) | 1,924 (54.8%) |
| Total (Overall) | 6,379 (55.1%) | 5,187 (44.9%) |
Services Occupations
The most common Services occupations in Franklin County are Food Preparation & Serving (451 | 3.9%), Healthcare Support (379 | 3.3%), Cleaning & Maintenance (372 | 3.2%), Personal Care & Service (338 | 2.9%), and Security & Protection (142 | 1.2%).

Services Occupations by Sex
Within the Services occupations in Franklin County, the most male-oriented occupations are Law Enforcement (99.1%), Security & Protection (89.4%), and Cleaning & Maintenance (63.7%), while the most female-oriented occupations are Healthcare Support (90.5%), Personal Care & Service (87.0%), and Food Preparation & Serving (53.7%).

| Occupation | Male | Female |
| Healthcare Support | 36 (9.5%) | 343 (90.5%) |
| Security & Protection | 127 (89.4%) | 15 (10.6%) |
| Firefighting & Prevention | 22 (61.1%) | 14 (38.9%) |
| Law Enforcement | 105 (99.1%) | 1 (0.9%) |
| Food Preparation & Serving | 209 (46.3%) | 242 (53.7%) |
| Cleaning & Maintenance | 237 (63.7%) | 135 (36.3%) |
| Personal Care & Service | 44 (13.0%) | 294 (87.0%) |
| Total (Category) | 653 (38.8%) | 1,029 (61.2%) |
| Total (Overall) | 6,379 (55.1%) | 5,187 (44.9%) |
Sales and Office Occupations
The most common Sales and Office occupations in Franklin County are Office & Administration (1,405 | 12.1%), and Sales & Related (931 | 8.1%).

Sales and Office Occupations by Sex

| Occupation | Male | Female |
| Sales & Related | 529 (56.8%) | 402 (43.2%) |
| Office & Administration | 342 (24.3%) | 1,063 (75.7%) |
| Total (Category) | 871 (37.3%) | 1,465 (62.7%) |
| Total (Overall) | 6,379 (55.1%) | 5,187 (44.9%) |
Natural Resources, Construction and Maintenance Occupations
The most common Natural Resources, Construction and Maintenance occupations in Franklin County are Installation, Maintenance & Repair (878 | 7.6%), Construction & Extraction (760 | 6.6%), and Farming, Fishing & Forestry (44 | 0.4%).

Natural Resources, Construction and Maintenance Occupations by Sex

| Occupation | Male | Female |
| Farming, Fishing & Forestry | 44 (100.0%) | 0 (0.0%) |
| Construction & Extraction | 750 (98.7%) | 10 (1.3%) |
| Installation, Maintenance & Repair | 878 (100.0%) | 0 (0.0%) |
| Total (Category) | 1,672 (99.4%) | 10 (0.6%) |
| Total (Overall) | 6,379 (55.1%) | 5,187 (44.9%) |
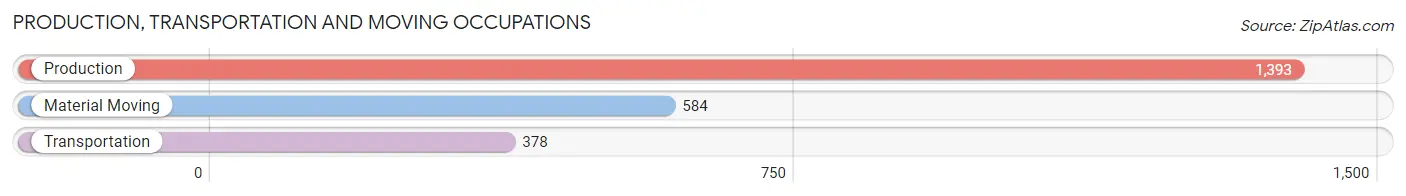
Production, Transportation and Moving Occupations
The most common Production, Transportation and Moving occupations in Franklin County are Production (1,393 | 12.0%), Material Moving (584 | 5.1%), and Transportation (378 | 3.3%).
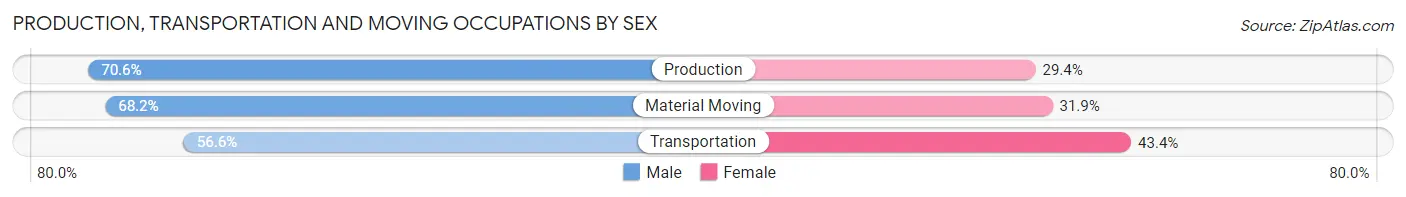
Production, Transportation and Moving Occupations by Sex
| Occupation | Male | Female |
| Production | 984 (70.6%) | 409 (29.4%) |
| Transportation | 214 (56.6%) | 164 (43.4%) |
| Material Moving | 398 (68.1%) | 186 (31.9%) |
| Total (Category) | 1,596 (67.8%) | 759 (32.2%) |
| Total (Overall) | 6,379 (55.1%) | 5,187 (44.9%) |
Employment Industries by Sex in Franklin County
Employment Industries in Franklin County
The major employment industries in Franklin County include Manufacturing (2,721 | 23.5%), Health Care & Social Assistance (1,735 | 15.0%), Retail Trade (1,262 | 10.9%), Construction (1,086 | 9.4%), and Educational Services (748 | 6.5%).

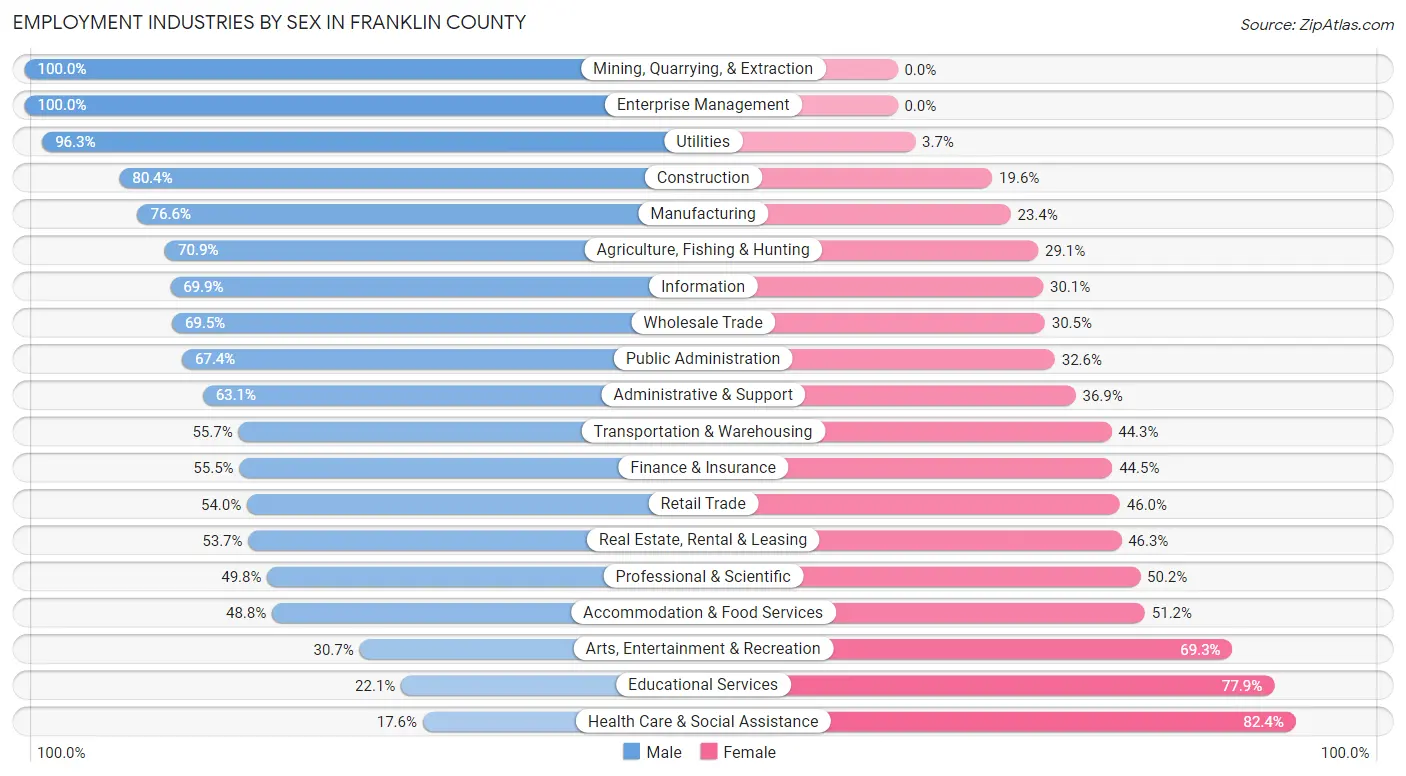
Employment Industries by Sex in Franklin County
The Franklin County industries that see more men than women are Mining, Quarrying, & Extraction (100.0%), Enterprise Management (100.0%), and Utilities (96.3%), whereas the industries that tend to have a higher number of women are Health Care & Social Assistance (82.4%), Educational Services (77.9%), and Arts, Entertainment & Recreation (69.3%).
| Industry | Male | Female |
| Agriculture, Fishing & Hunting | 134 (70.9%) | 55 (29.1%) |
| Mining, Quarrying, & Extraction | 33 (100.0%) | 0 (0.0%) |
| Construction | 873 (80.4%) | 213 (19.6%) |
| Manufacturing | 2,084 (76.6%) | 637 (23.4%) |
| Wholesale Trade | 123 (69.5%) | 54 (30.5%) |
| Retail Trade | 681 (54.0%) | 581 (46.0%) |
| Transportation & Warehousing | 219 (55.7%) | 174 (44.3%) |
| Utilities | 79 (96.3%) | 3 (3.7%) |
| Information | 146 (69.9%) | 63 (30.1%) |
| Finance & Insurance | 326 (55.5%) | 261 (44.5%) |
| Real Estate, Rental & Leasing | 73 (53.7%) | 63 (46.3%) |
| Professional & Scientific | 214 (49.8%) | 216 (50.2%) |
| Enterprise Management | 8 (100.0%) | 0 (0.0%) |
| Administrative & Support | 262 (63.1%) | 153 (36.9%) |
| Educational Services | 165 (22.1%) | 583 (77.9%) |
| Health Care & Social Assistance | 305 (17.6%) | 1,430 (82.4%) |
| Arts, Entertainment & Recreation | 23 (30.7%) | 52 (69.3%) |
| Accommodation & Food Services | 240 (48.8%) | 252 (51.2%) |
| Public Administration | 120 (67.4%) | 58 (32.6%) |
| Total | 6,379 (55.1%) | 5,187 (44.9%) |
Education in Franklin County
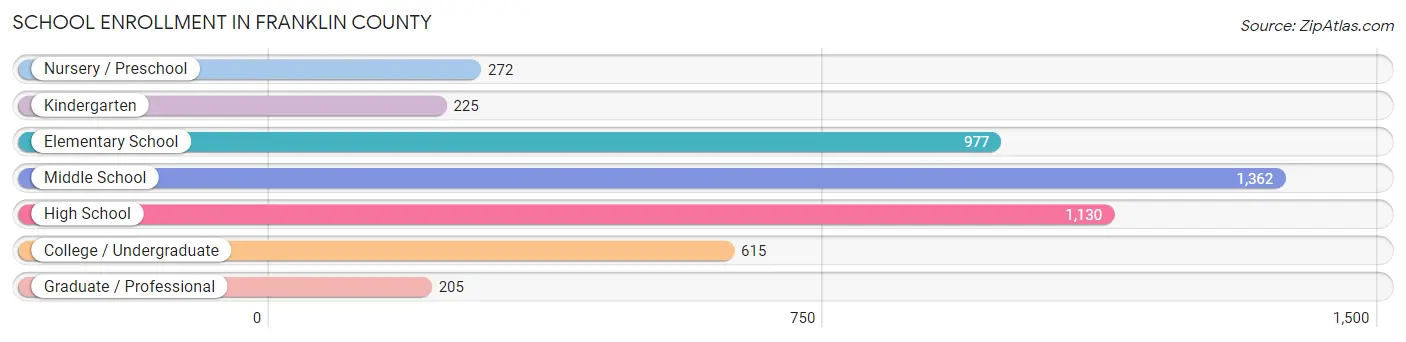
School Enrollment in Franklin County
The most common levels of schooling among the 4,786 students in Franklin County are middle school (1,362 | 28.5%), high school (1,130 | 23.6%), and elementary school (977 | 20.4%).
| School Level | # Students | % Students |
| Nursery / Preschool | 272 | 5.7% |
| Kindergarten | 225 | 4.7% |
| Elementary School | 977 | 20.4% |
| Middle School | 1,362 | 28.5% |
| High School | 1,130 | 23.6% |
| College / Undergraduate | 615 | 12.9% |
| Graduate / Professional | 205 | 4.3% |
| Total | 4,786 | 100.0% |
School Enrollment by Age by Funding Source in Franklin County
Out of a total of 4,786 students who are enrolled in schools in Franklin County, 1,134 (23.7%) attend a private institution, while the remaining 3,652 (76.3%) are enrolled in public schools. The age group of 35 years and over has the highest likelihood of being enrolled in private schools, with 92 (51.7% in the age bracket) enrolled. Conversely, the age group of 20 to 24 year olds has the lowest likelihood of being enrolled in a private school, with 225 (93.0% in the age bracket) attending a public institution.
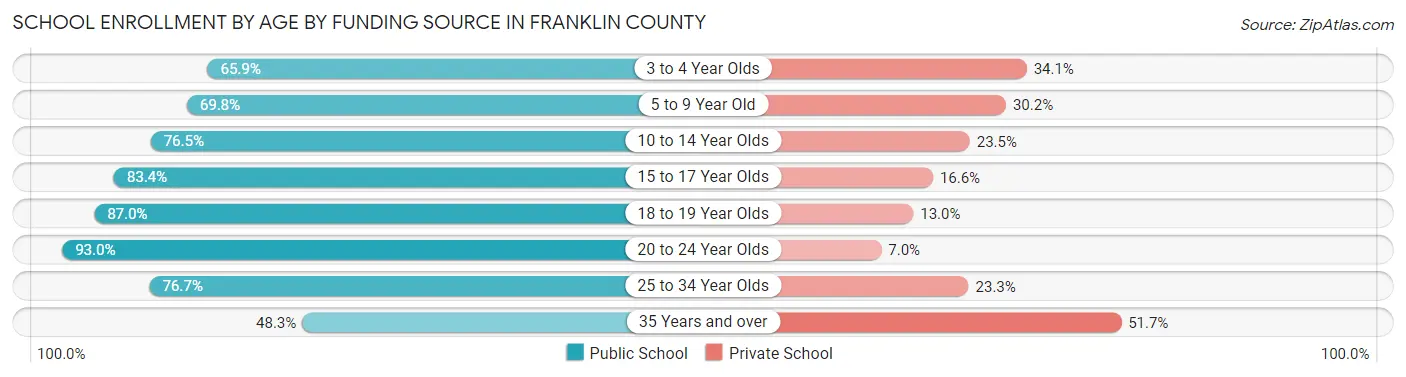
| Age Bracket | Public School | Private School |
| 3 to 4 Year Olds | 87 (65.9%) | 45 (34.1%) |
| 5 to 9 Year Old | 817 (69.8%) | 354 (30.2%) |
| 10 to 14 Year Olds | 1,247 (76.5%) | 383 (23.5%) |
| 15 to 17 Year Olds | 782 (83.4%) | 156 (16.6%) |
| 18 to 19 Year Olds | 255 (87.0%) | 38 (13.0%) |
| 20 to 24 Year Olds | 225 (93.0%) | 17 (7.0%) |
| 25 to 34 Year Olds | 155 (76.7%) | 47 (23.3%) |
| 35 Years and over | 86 (48.3%) | 92 (51.7%) |
| Total | 3,652 (76.3%) | 1,134 (23.7%) |
Educational Attainment by Field of Study in Franklin County
Business (749 | 21.6%), science & technology (521 | 15.0%), education (517 | 14.9%), engineering (400 | 11.6%), and bio, nature & agricultural (270 | 7.8%) are the most common fields of study among 3,462 individuals in Franklin County who have obtained a bachelor's degree or higher.

| Field of Study | # Graduates | % Graduates |
| Computers & Mathematics | 112 | 3.2% |
| Bio, Nature & Agricultural | 270 | 7.8% |
| Physical & Health Sciences | 89 | 2.6% |
| Psychology | 49 | 1.4% |
| Social Sciences | 91 | 2.6% |
| Engineering | 400 | 11.6% |
| Multidisciplinary Studies | 0 | 0.0% |
| Science & Technology | 521 | 15.0% |
| Business | 749 | 21.6% |
| Education | 517 | 14.9% |
| Literature & Languages | 172 | 5.0% |
| Liberal Arts & History | 113 | 3.3% |
| Visual & Performing Arts | 78 | 2.2% |
| Communications | 64 | 1.8% |
| Arts & Humanities | 237 | 6.9% |
| Total | 3,462 | 100.0% |
Transportation & Commute in Franklin County
Vehicle Availability by Sex in Franklin County
The most prevalent vehicle ownership categories in Franklin County are males with 3 vehicles (2,087, accounting for 33.0%) and females with 3 vehicles (1,473, making up 41.7%).
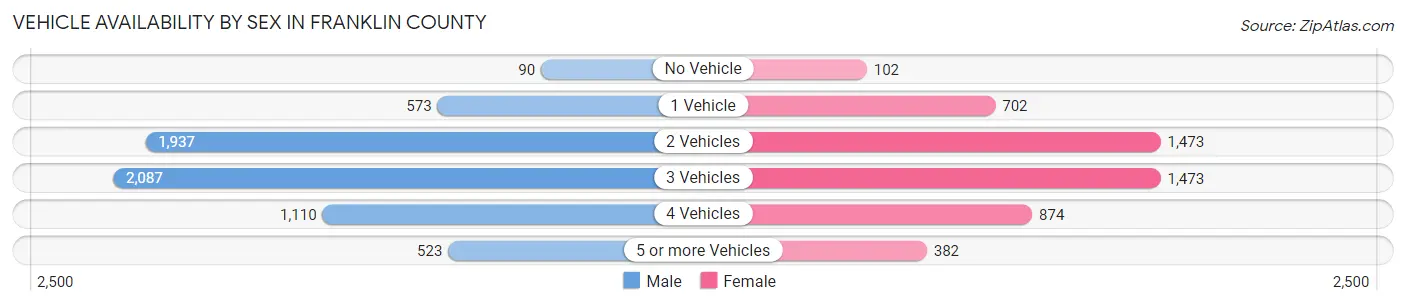
| Vehicles Available | Male | Female |
| No Vehicle | 90 (1.4%) | 102 (2.0%) |
| 1 Vehicle | 573 (9.1%) | 702 (14.0%) |
| 2 Vehicles | 1,937 (30.6%) | 1,473 (29.4%) |
| 3 Vehicles | 2,087 (33.0%) | 1,473 (29.4%) |
| 4 Vehicles | 1,110 (17.6%) | 874 (17.5%) |
| 5 or more Vehicles | 523 (8.3%) | 382 (7.6%) |
| Total | 6,320 (100.0%) | 5,006 (100.0%) |
Commute Time in Franklin County
The most frequently occuring commute durations in Franklin County are 45 to 59 minutes (1,437 commuters, 14.0%), 60 to 89 minutes (1,229 commuters, 12.0%), and 20 to 24 minutes (1,189 commuters, 11.6%).
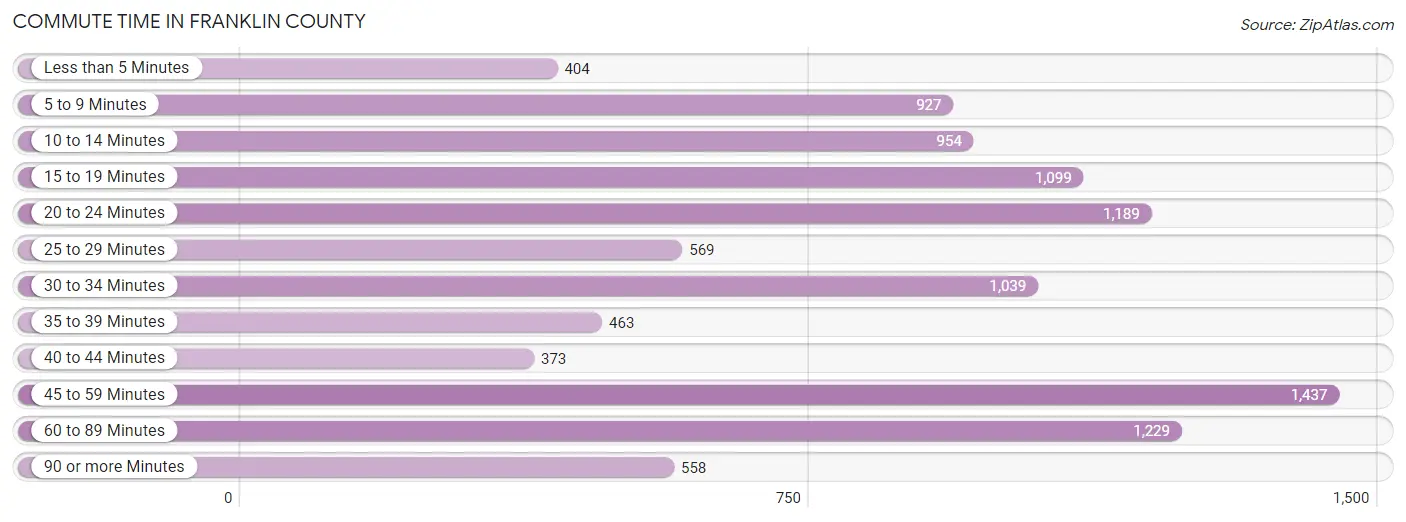
| Commute Time | # Commuters | % Commuters |
| Less than 5 Minutes | 404 | 3.9% |
| 5 to 9 Minutes | 927 | 9.0% |
| 10 to 14 Minutes | 954 | 9.3% |
| 15 to 19 Minutes | 1,099 | 10.7% |
| 20 to 24 Minutes | 1,189 | 11.6% |
| 25 to 29 Minutes | 569 | 5.6% |
| 30 to 34 Minutes | 1,039 | 10.2% |
| 35 to 39 Minutes | 463 | 4.5% |
| 40 to 44 Minutes | 373 | 3.6% |
| 45 to 59 Minutes | 1,437 | 14.0% |
| 60 to 89 Minutes | 1,229 | 12.0% |
| 90 or more Minutes | 558 | 5.4% |
Commute Time by Sex in Franklin County
The most common commute times in Franklin County are 60 to 89 minutes (848 commuters, 14.4%) for males and 45 to 59 minutes (601 commuters, 13.8%) for females.

| Commute Time | Male | Female |
| Less than 5 Minutes | 234 (4.0%) | 170 (3.9%) |
| 5 to 9 Minutes | 491 (8.3%) | 436 (10.0%) |
| 10 to 14 Minutes | 491 (8.3%) | 463 (10.6%) |
| 15 to 19 Minutes | 637 (10.8%) | 462 (10.6%) |
| 20 to 24 Minutes | 603 (10.2%) | 586 (13.5%) |
| 25 to 29 Minutes | 286 (4.9%) | 283 (6.5%) |
| 30 to 34 Minutes | 487 (8.3%) | 552 (12.7%) |
| 35 to 39 Minutes | 387 (6.6%) | 76 (1.8%) |
| 40 to 44 Minutes | 182 (3.1%) | 191 (4.4%) |
| 45 to 59 Minutes | 836 (14.2%) | 601 (13.8%) |
| 60 to 89 Minutes | 848 (14.4%) | 381 (8.8%) |
| 90 or more Minutes | 409 (6.9%) | 149 (3.4%) |
Time of Departure to Work by Sex in Franklin County
The most frequent times of departure to work in Franklin County are 12:00 AM to 4:59 AM (812, 13.8%) for males and 7:00 AM to 7:29 AM (712, 16.4%) for females.

| Time of Departure | Male | Female |
| 12:00 AM to 4:59 AM | 812 (13.8%) | 232 (5.3%) |
| 5:00 AM to 5:29 AM | 529 (9.0%) | 217 (5.0%) |
| 5:30 AM to 5:59 AM | 689 (11.7%) | 355 (8.2%) |
| 6:00 AM to 6:29 AM | 642 (10.9%) | 342 (7.9%) |
| 6:30 AM to 6:59 AM | 423 (7.2%) | 474 (10.9%) |
| 7:00 AM to 7:29 AM | 578 (9.8%) | 712 (16.4%) |
| 7:30 AM to 7:59 AM | 385 (6.5%) | 603 (13.9%) |
| 8:00 AM to 8:29 AM | 568 (9.6%) | 376 (8.6%) |
| 8:30 AM to 8:59 AM | 104 (1.8%) | 90 (2.1%) |
| 9:00 AM to 9:59 AM | 207 (3.5%) | 93 (2.1%) |
| 10:00 AM to 10:59 AM | 107 (1.8%) | 333 (7.7%) |
| 11:00 AM to 11:59 AM | 25 (0.4%) | 40 (0.9%) |
| 12:00 PM to 3:59 PM | 406 (6.9%) | 368 (8.5%) |
| 4:00 PM to 11:59 PM | 416 (7.1%) | 115 (2.6%) |
| Total | 5,891 (100.0%) | 4,350 (100.0%) |
Housing Occupancy in Franklin County
Occupancy by Ownership in Franklin County
Of the total 8,976 dwellings in Franklin County, owner-occupied units account for 7,304 (81.4%), while renter-occupied units make up 1,672 (18.6%).
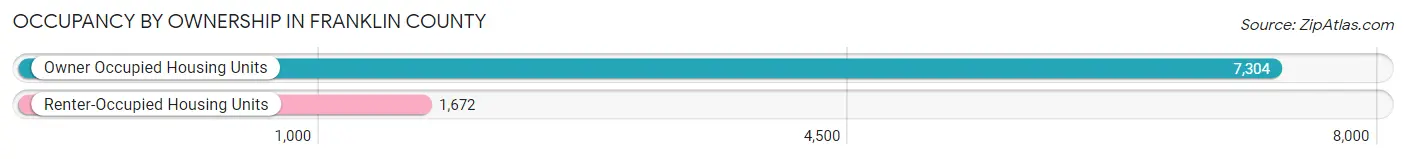
| Occupancy | # Housing Units | % Housing Units |
| Owner Occupied Housing Units | 7,304 | 81.4% |
| Renter-Occupied Housing Units | 1,672 | 18.6% |
| Total Occupied Housing Units | 8,976 | 100.0% |
Occupancy by Household Size in Franklin County

| Household Size | # Housing Units | % Housing Units |
| 1-Person Household | 2,475 | 27.6% |
| 2-Person Household | 3,397 | 37.9% |
| 3-Person Household | 1,347 | 15.0% |
| 4+ Person Household | 1,757 | 19.6% |
| Total Housing Units | 8,976 | 100.0% |
Occupancy by Ownership by Household Size in Franklin County

| Household Size | Owner-occupied | Renter-occupied |
| 1-Person Household | 1,617 (65.3%) | 858 (34.7%) |
| 2-Person Household | 2,954 (87.0%) | 443 (13.0%) |
| 3-Person Household | 1,245 (92.4%) | 102 (7.6%) |
| 4+ Person Household | 1,488 (84.7%) | 269 (15.3%) |
| Total Housing Units | 7,304 (81.4%) | 1,672 (18.6%) |
Occupancy by Educational Attainment in Franklin County

| Household Size | Owner-occupied | Renter-occupied |
| Less than High School | 719 (72.3%) | 276 (27.7%) |
| High School Diploma | 2,626 (81.4%) | 599 (18.6%) |
| College/Associate Degree | 2,417 (86.5%) | 377 (13.5%) |
| Bachelor's Degree or higher | 1,542 (78.6%) | 420 (21.4%) |
Occupancy by Age of Householder in Franklin County

| Age Bracket | # Households | % Households |
| Under 35 Years | 1,180 | 13.2% |
| 35 to 44 Years | 1,333 | 14.8% |
| 45 to 54 Years | 1,588 | 17.7% |
| 55 to 64 Years | 2,013 | 22.4% |
| 65 to 74 Years | 1,751 | 19.5% |
| 75 to 84 Years | 731 | 8.1% |
| 85 Years and Over | 380 | 4.2% |
| Total | 8,976 | 100.0% |
Housing Finances in Franklin County
Median Income by Occupancy in Franklin County

| Occupancy Type | # Households | Median Income |
| Owner-Occupied | 7,304 (81.4%) | $81,156 |
| Renter-Occupied | 1,672 (18.6%) | $40,987 |
| Average | 8,976 (100.0%) | $75,985 |
Occupancy by Householder Income Bracket in Franklin County
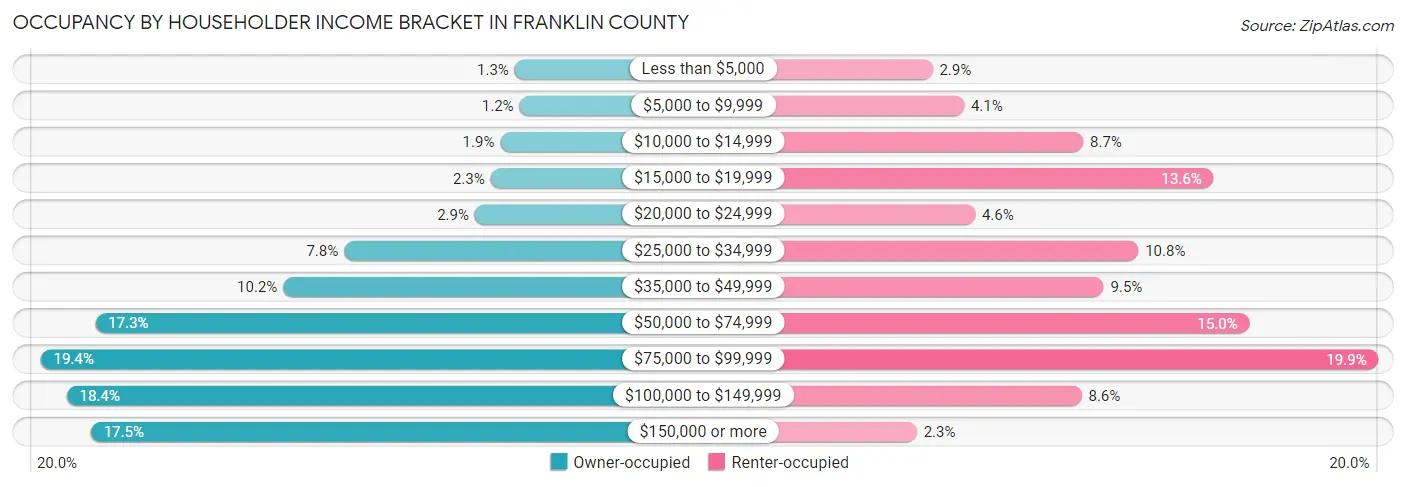
| Income Bracket | Owner-occupied | Renter-occupied |
| Less than $5,000 | 97 (1.3%) | 49 (2.9%) |
| $5,000 to $9,999 | 84 (1.1%) | 69 (4.1%) |
| $10,000 to $14,999 | 137 (1.9%) | 145 (8.7%) |
| $15,000 to $19,999 | 164 (2.2%) | 228 (13.6%) |
| $20,000 to $24,999 | 208 (2.9%) | 76 (4.5%) |
| $25,000 to $34,999 | 572 (7.8%) | 180 (10.8%) |
| $35,000 to $49,999 | 741 (10.2%) | 158 (9.5%) |
| $50,000 to $74,999 | 1,264 (17.3%) | 251 (15.0%) |
| $75,000 to $99,999 | 1,416 (19.4%) | 333 (19.9%) |
| $100,000 to $149,999 | 1,344 (18.4%) | 144 (8.6%) |
| $150,000 or more | 1,277 (17.5%) | 39 (2.3%) |
| Total | 7,304 (100.0%) | 1,672 (100.0%) |
Monthly Housing Cost Tiers in Franklin County

| Monthly Cost | Owner-occupied | Renter-occupied |
| Less than $300 | 511 (7.0%) | 45 (2.7%) |
| $300 to $499 | 1,527 (20.9%) | 217 (13.0%) |
| $500 to $799 | 1,381 (18.9%) | 551 (33.0%) |
| $800 to $999 | 545 (7.5%) | 320 (19.1%) |
| $1,000 to $1,499 | 1,398 (19.1%) | 232 (13.9%) |
| $1,500 to $1,999 | 1,214 (16.6%) | 28 (1.7%) |
| $2,000 to $2,499 | 400 (5.5%) | 0 (0.0%) |
| $2,500 to $2,999 | 146 (2.0%) | 0 (0.0%) |
| $3,000 or more | 182 (2.5%) | 0 (0.0%) |
| Total | 7,304 (100.0%) | 1,672 (100.0%) |
Physical Housing Characteristics in Franklin County
Housing Structures in Franklin County

| Structure Type | # Housing Units | % Housing Units |
| Single Unit, Detached | 7,445 | 82.9% |
| Single Unit, Attached | 18 | 0.2% |
| 2 Unit Apartments | 260 | 2.9% |
| 3 or 4 Unit Apartments | 89 | 1.0% |
| 5 to 9 Unit Apartments | 108 | 1.2% |
| 10 or more Apartments | 130 | 1.5% |
| Mobile Home / Other | 926 | 10.3% |
| Total | 8,976 | 100.0% |
Housing Structures by Occupancy in Franklin County

| Structure Type | Owner-occupied | Renter-occupied |
| Single Unit, Detached | 6,720 (90.3%) | 725 (9.7%) |
| Single Unit, Attached | 11 (61.1%) | 7 (38.9%) |
| 2 Unit Apartments | 8 (3.1%) | 252 (96.9%) |
| 3 or 4 Unit Apartments | 1 (1.1%) | 88 (98.9%) |
| 5 to 9 Unit Apartments | 0 (0.0%) | 108 (100.0%) |
| 10 or more Apartments | 0 (0.0%) | 130 (100.0%) |
| Mobile Home / Other | 564 (60.9%) | 362 (39.1%) |
| Total | 7,304 (81.4%) | 1,672 (18.6%) |
Housing Structures by Number of Rooms in Franklin County
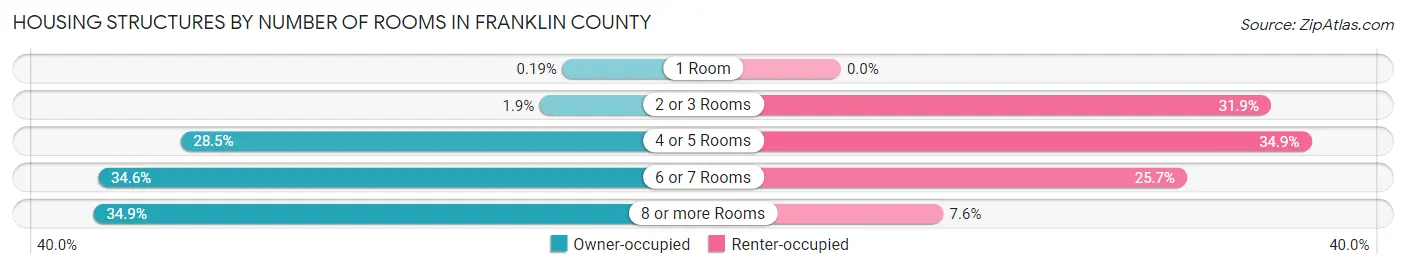
| Number of Rooms | Owner-occupied | Renter-occupied |
| 1 Room | 14 (0.2%) | 0 (0.0%) |
| 2 or 3 Rooms | 136 (1.9%) | 533 (31.9%) |
| 4 or 5 Rooms | 2,080 (28.5%) | 583 (34.9%) |
| 6 or 7 Rooms | 2,525 (34.6%) | 429 (25.7%) |
| 8 or more Rooms | 2,549 (34.9%) | 127 (7.6%) |
| Total | 7,304 (100.0%) | 1,672 (100.0%) |
Housing Structure by Heating Type in Franklin County

| Heating Type | Owner-occupied | Renter-occupied |
| Utility Gas | 1,499 (20.5%) | 313 (18.7%) |
| Bottled, Tank, or LP Gas | 2,334 (32.0%) | 252 (15.1%) |
| Electricity | 2,184 (29.9%) | 945 (56.5%) |
| Fuel Oil or Kerosene | 239 (3.3%) | 36 (2.1%) |
| Coal or Coke | 0 (0.0%) | 0 (0.0%) |
| All other Fuels | 972 (13.3%) | 126 (7.5%) |
| No Fuel Used | 76 (1.0%) | 0 (0.0%) |
| Total | 7,304 (100.0%) | 1,672 (100.0%) |
Household Vehicle Usage in Franklin County
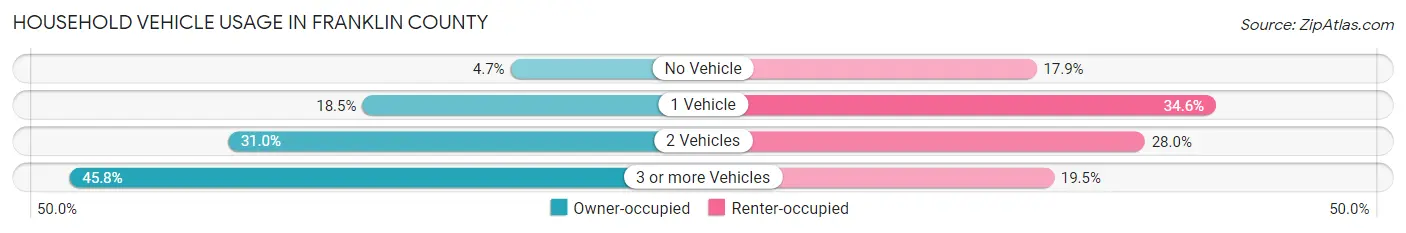
| Vehicles per Household | Owner-occupied | Renter-occupied |
| No Vehicle | 340 (4.6%) | 299 (17.9%) |
| 1 Vehicle | 1,350 (18.5%) | 579 (34.6%) |
| 2 Vehicles | 2,267 (31.0%) | 468 (28.0%) |
| 3 or more Vehicles | 3,347 (45.8%) | 326 (19.5%) |
| Total | 7,304 (100.0%) | 1,672 (100.0%) |
Real Estate & Mortgages in Franklin County
Real Estate and Mortgage Overview in Franklin County
| Characteristic | Without Mortgage | With Mortgage |
| Housing Units | 3,155 | 4,149 |
| Median Property Value | $184,900 | $235,800 |
| Median Household Income | $63,623 | $861 |
| Monthly Housing Costs | $456 | $182 |
| Real Estate Taxes | $1,283 | $20 |
Property Value by Mortgage Status in Franklin County

| Property Value | Without Mortgage | With Mortgage |
| Less than $50,000 | 372 (11.8%) | 70 (1.7%) |
| $50,000 to $99,999 | 474 (15.0%) | 313 (7.5%) |
| $100,000 to $299,999 | 1,620 (51.3%) | 2,195 (52.9%) |
| $300,000 to $499,999 | 380 (12.0%) | 1,304 (31.4%) |
| $500,000 to $749,999 | 237 (7.5%) | 237 (5.7%) |
| $750,000 to $999,999 | 42 (1.3%) | 15 (0.4%) |
| $1,000,000 or more | 30 (0.9%) | 15 (0.4%) |
| Total | 3,155 (100.0%) | 4,149 (100.0%) |
Household Income by Mortgage Status in Franklin County

| Household Income | Without Mortgage | With Mortgage |
| Less than $10,000 | 83 (2.6%) | 63 (1.5%) |
| $10,000 to $24,999 | 354 (11.2%) | 98 (2.4%) |
| $25,000 to $34,999 | 365 (11.6%) | 155 (3.7%) |
| $35,000 to $49,999 | 449 (14.2%) | 207 (5.0%) |
| $50,000 to $74,999 | 632 (20.0%) | 292 (7.0%) |
| $75,000 to $99,999 | 416 (13.2%) | 632 (15.2%) |
| $100,000 to $149,999 | 440 (14.0%) | 1,000 (24.1%) |
| $150,000 or more | 416 (13.2%) | 904 (21.8%) |
| Total | 3,155 (100.0%) | 4,149 (100.0%) |
Property Value to Household Income Ratio in Franklin County

| Value-to-Income Ratio | Without Mortgage | With Mortgage |
| Less than 2.0x | 944 (29.9%) | 92,448 (2,228.2%) |
| 2.0x to 2.9x | 794 (25.2%) | 1,688 (40.7%) |
| 3.0x to 3.9x | 431 (13.7%) | 890 (21.4%) |
| 4.0x or more | 934 (29.6%) | 411 (9.9%) |
| Total | 3,155 (100.0%) | 4,149 (100.0%) |
Real Estate Taxes by Mortgage Status in Franklin County

| Property Taxes | Without Mortgage | With Mortgage |
| Less than $800 | 955 (30.3%) | 11 (0.3%) |
| $800 to $1,499 | 755 (23.9%) | 1,142 (27.5%) |
| $800 to $1,499 | 1,307 (41.4%) | 1,184 (28.5%) |
| Total | 3,155 (100.0%) | 4,149 (100.0%) |
Health & Disability in Franklin County
Health Insurance Coverage by Age in Franklin County

| Age Bracket | With Coverage | Without Coverage |
| Under 6 Years | 1,501 (95.7%) | 67 (4.3%) |
| 6 to 18 Years | 3,494 (91.2%) | 338 (8.8%) |
| 19 to 25 Years | 1,788 (93.7%) | 121 (6.3%) |
| 26 to 34 Years | 1,897 (87.8%) | 264 (12.2%) |
| 35 to 44 Years | 2,233 (87.1%) | 330 (12.9%) |
| 45 to 54 Years | 2,968 (97.3%) | 81 (2.7%) |
| 55 to 64 Years | 3,220 (96.0%) | 135 (4.0%) |
| 65 to 74 Years | 2,654 (100.0%) | 0 (0.0%) |
| 75 Years and older | 1,669 (100.0%) | 0 (0.0%) |
| Total | 21,424 (94.1%) | 1,336 (5.9%) |
Health Insurance Coverage by Citizenship Status in Franklin County
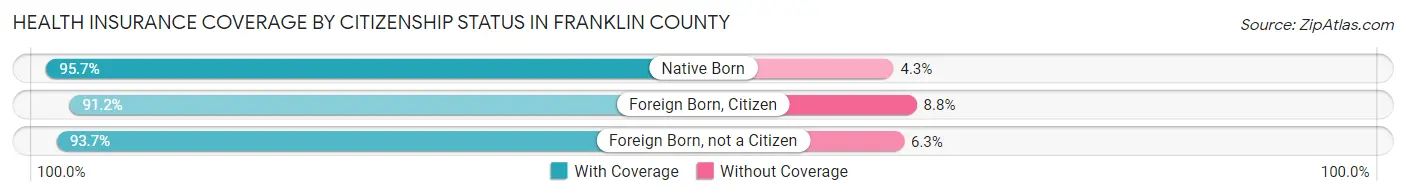
| Citizenship Status | With Coverage | Without Coverage |
| Native Born | 1,501 (95.7%) | 67 (4.3%) |
| Foreign Born, Citizen | 3,494 (91.2%) | 338 (8.8%) |
| Foreign Born, not a Citizen | 1,788 (93.7%) | 121 (6.3%) |
Health Insurance Coverage by Household Income in Franklin County
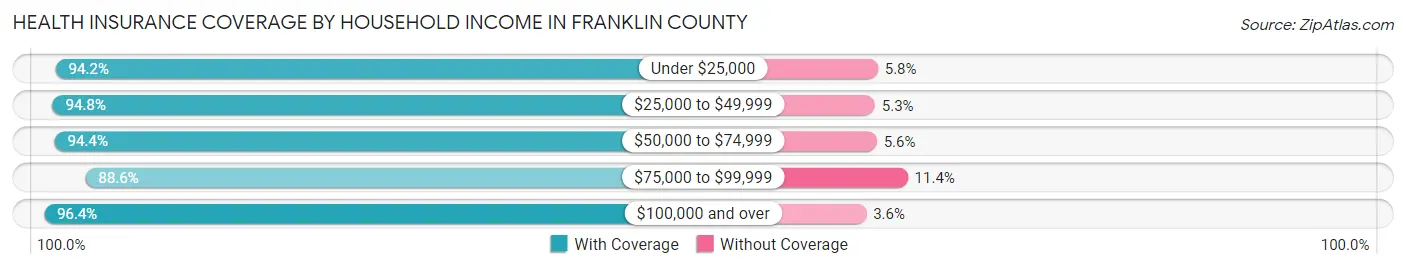
| Household Income | With Coverage | Without Coverage |
| Under $25,000 | 1,863 (94.2%) | 115 (5.8%) |
| $25,000 to $49,999 | 2,853 (94.8%) | 158 (5.2%) |
| $50,000 to $74,999 | 3,636 (94.4%) | 216 (5.6%) |
| $75,000 to $99,999 | 3,940 (88.6%) | 507 (11.4%) |
| $100,000 and over | 9,017 (96.4%) | 340 (3.6%) |
Public vs Private Health Insurance Coverage by Age in Franklin County

| Age Bracket | Public Insurance | Private Insurance |
| Under 6 | 518 (33.0%) | 1,135 (72.4%) |
| 6 to 18 Years | 934 (24.4%) | 2,742 (71.6%) |
| 19 to 25 Years | 284 (14.9%) | 1,574 (82.5%) |
| 25 to 34 Years | 383 (17.7%) | 1,562 (72.3%) |
| 35 to 44 Years | 212 (8.3%) | 2,125 (82.9%) |
| 45 to 54 Years | 424 (13.9%) | 2,644 (86.7%) |
| 55 to 64 Years | 739 (22.0%) | 2,810 (83.8%) |
| 65 to 74 Years | 2,473 (93.2%) | 1,763 (66.4%) |
| 75 Years and over | 1,669 (100.0%) | 912 (54.6%) |
| Total | 7,636 (33.6%) | 17,267 (75.9%) |
Disability Status by Sex by Age in Franklin County
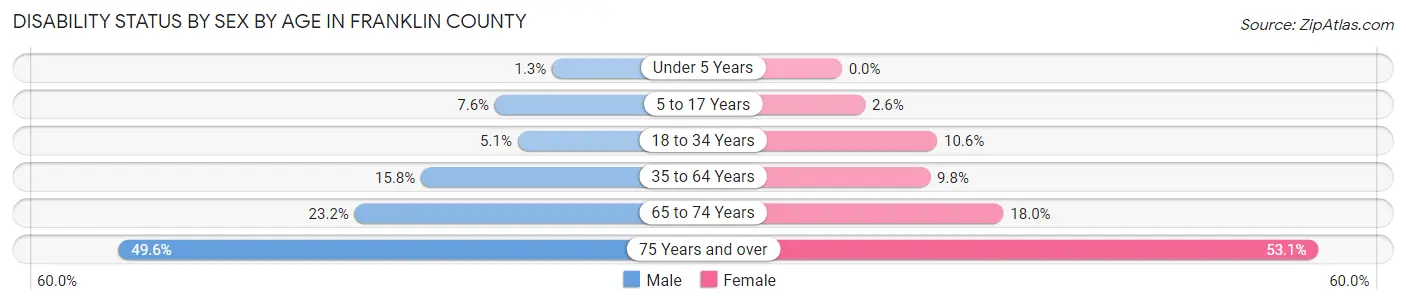
| Age Bracket | Male | Female |
| Under 5 Years | 8 (1.3%) | 0 (0.0%) |
| 5 to 17 Years | 145 (7.6%) | 51 (2.6%) |
| 18 to 34 Years | 112 (5.1%) | 217 (10.6%) |
| 35 to 64 Years | 727 (15.8%) | 431 (9.8%) |
| 65 to 74 Years | 303 (23.2%) | 243 (18.0%) |
| 75 Years and over | 333 (49.5%) | 529 (53.1%) |
Disability Class by Sex by Age in Franklin County
Disability Class: Hearing Difficulty
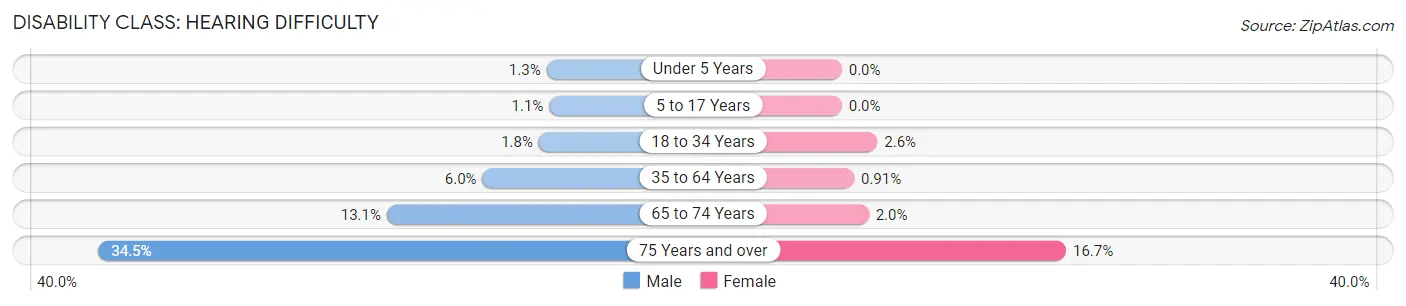
| Age Bracket | Male | Female |
| Under 5 Years | 8 (1.3%) | 0 (0.0%) |
| 5 to 17 Years | 20 (1.1%) | 0 (0.0%) |
| 18 to 34 Years | 40 (1.8%) | 54 (2.6%) |
| 35 to 64 Years | 276 (6.0%) | 40 (0.9%) |
| 65 to 74 Years | 171 (13.1%) | 27 (2.0%) |
| 75 Years and over | 232 (34.5%) | 166 (16.7%) |
Disability Class: Vision Difficulty
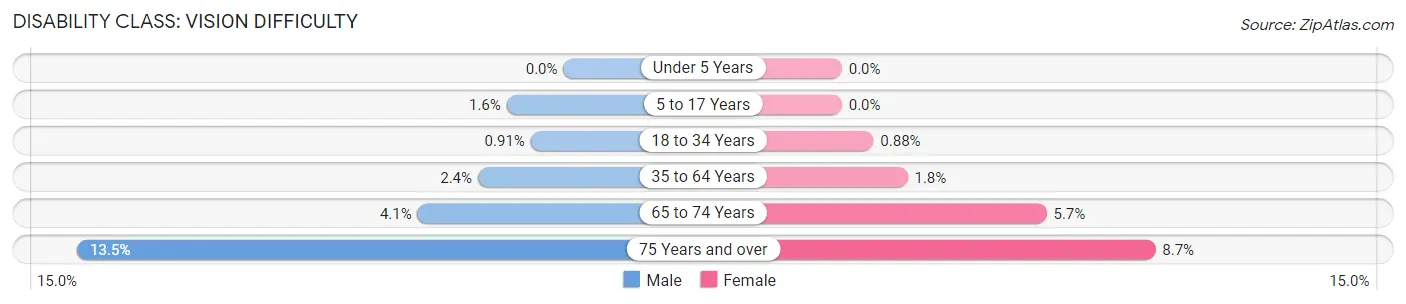
| Age Bracket | Male | Female |
| Under 5 Years | 0 (0.0%) | 0 (0.0%) |
| 5 to 17 Years | 30 (1.6%) | 0 (0.0%) |
| 18 to 34 Years | 20 (0.9%) | 18 (0.9%) |
| 35 to 64 Years | 109 (2.4%) | 80 (1.8%) |
| 65 to 74 Years | 53 (4.1%) | 77 (5.7%) |
| 75 Years and over | 91 (13.5%) | 87 (8.7%) |
Disability Class: Cognitive Difficulty
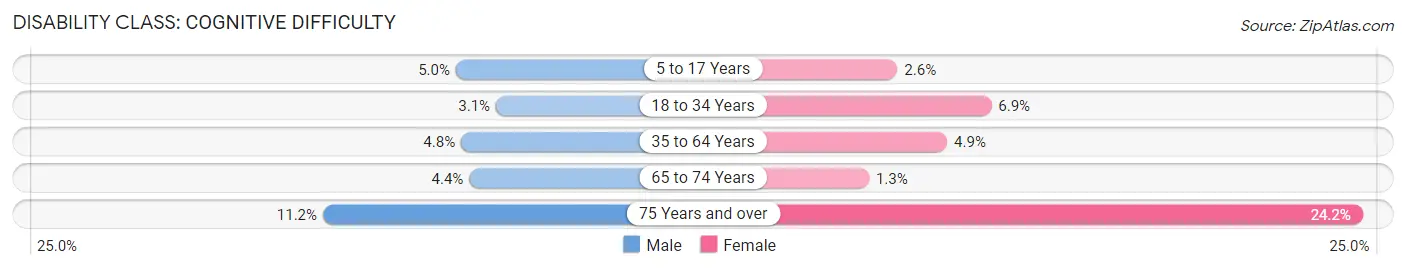
| Age Bracket | Male | Female |
| 5 to 17 Years | 95 (5.0%) | 51 (2.6%) |
| 18 to 34 Years | 69 (3.1%) | 142 (6.9%) |
| 35 to 64 Years | 218 (4.8%) | 214 (4.9%) |
| 65 to 74 Years | 57 (4.4%) | 17 (1.3%) |
| 75 Years and over | 75 (11.2%) | 241 (24.2%) |
Disability Class: Ambulatory Difficulty

| Age Bracket | Male | Female |
| 5 to 17 Years | 30 (1.6%) | 0 (0.0%) |
| 18 to 34 Years | 0 (0.0%) | 15 (0.7%) |
| 35 to 64 Years | 337 (7.3%) | 226 (5.2%) |
| 65 to 74 Years | 136 (10.4%) | 154 (11.4%) |
| 75 Years and over | 185 (27.5%) | 455 (45.6%) |
Disability Class: Self-Care Difficulty

| Age Bracket | Male | Female |
| 5 to 17 Years | 16 (0.8%) | 0 (0.0%) |
| 18 to 34 Years | 0 (0.0%) | 0 (0.0%) |
| 35 to 64 Years | 172 (3.7%) | 73 (1.7%) |
| 65 to 74 Years | 29 (2.2%) | 38 (2.8%) |
| 75 Years and over | 108 (16.1%) | 290 (29.1%) |
Technology Access in Franklin County
Computing Device Access in Franklin County

| Device Type | # Households | % Households |
| Desktop or Laptop | 6,401 | 71.3% |
| Smartphone | 7,512 | 83.7% |
| Tablet | 4,855 | 54.1% |
| No Computing Device | 999 | 11.1% |
| Total | 8,976 | 100.0% |
Internet Access in Franklin County
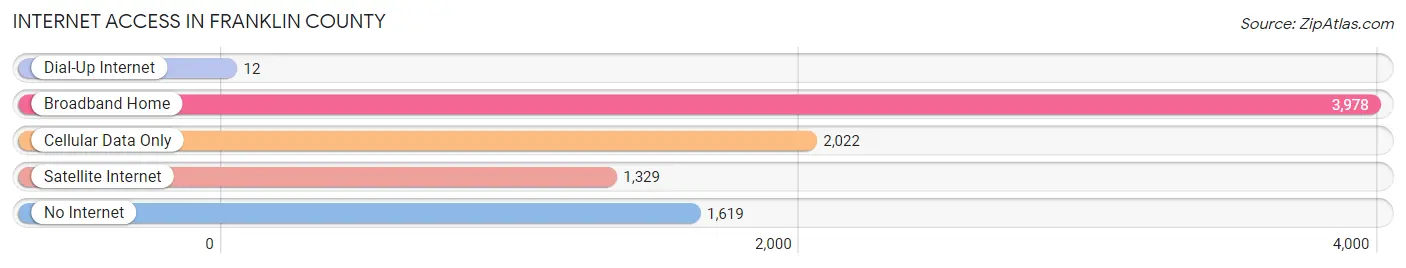
| Internet Type | # Households | % Households |
| Dial-Up Internet | 12 | 0.1% |
| Broadband Home | 3,978 | 44.3% |
| Cellular Data Only | 2,022 | 22.5% |
| Satellite Internet | 1,329 | 14.8% |
| No Internet | 1,619 | 18.0% |
| Total | 8,976 | 100.0% |
Franklin County Summary
Franklin County, Indiana is located in the southeastern part of the state, and is part of the Indianapolis metropolitan area. It is bordered by Decatur, Rush, Fayette, Union, and Wayne counties. The county seat is Brookville, and the largest city is Brookville. The county was established in 1811 and named for Benjamin Franklin.
Geography
Franklin County is located in the southeastern part of Indiana, and is part of the Indianapolis metropolitan area. It is bordered by Decatur, Rush, Fayette, Union, and Wayne counties. The county has a total area of 441 square miles, of which 437 square miles is land and 4.2 square miles is water. The terrain is mostly flat, with some rolling hills in the northern part of the county. The highest point in the county is located in the northern part, at an elevation of 1,000 feet.
The county is drained by the Whitewater River, which flows through the northern part of the county, and the East Fork of the Whitewater River, which flows through the southern part of the county. The county is also home to several small lakes, including Brookville Lake, which is the largest.
Economy
Franklin County has a diverse economy, with a mix of manufacturing, agriculture, and services. The county is home to several large employers, including Cummins, Inc., a diesel engine manufacturer, and Franklin Electric, a manufacturer of electric motors. Other major employers include Brookville Equipment Corporation, a manufacturer of railroad equipment, and Franklin County Hospital.
Agriculture is also an important part of the county's economy. The county is home to several large farms, and the main crops grown are corn, soybeans, and wheat. Livestock production is also important, with beef cattle, dairy cows, and hogs being the main animals raised.
Demographics
As of the 2010 census, Franklin County had a population of 23,085. The population was spread out, with 51.2% male and 48.8% female. The median age was 40.2 years. The racial makeup of the county was 95.2% White, 1.3% African American, 0.3% Native American, 0.7% Asian, 0.1% Pacific Islander, 1.2% from other races, and 1.3% from two or more races. Hispanic or Latino of any race were 2.7% of the population.
The median household income was $45,945, and the median family income was $54,945. The per capita income was $22,845. About 10.2% of the population was below the poverty line.
Conclusion
Franklin County, Indiana is a diverse county located in the southeastern part of the state. It is part of the Indianapolis metropolitan area, and is bordered by Decatur, Rush, Fayette, Union, and Wayne counties. The county has a diverse economy, with a mix of manufacturing, agriculture, and services. The population is mostly white, with a median age of 40.2 years. The median household income is $45,945, and the per capita income is $22,845.
Common Questions
What is the Total Population of Franklin County?
Total Population of Franklin County is 22,850.
What is the Total Male Population of Franklin County?
Total Male Population of Franklin County is 11,368.
What is the Total Female Population of Franklin County?
Total Female Population of Franklin County is 11,482.
What is the Ratio of Males per 100 Females in Franklin County?
There are 99.01 Males per 100 Females in Franklin County.
What is the Ratio of Females per 100 Males in Franklin County?
There are 101.00 Females per 100 Males in Franklin County.
What is the Median Population Age in Franklin County?
Median Population Age in Franklin County is 41.8 Years.
What is the Average Family Size in Franklin County
Average Family Size in Franklin County is 3.1 People.
What is the Average Household Size in Franklin County
Average Household Size in Franklin County is 2.5 People.
What is Per Capita Income in Franklin County?
Per Capita income in Franklin County is $36,246.
What is the Median Family Income in Franklin County?
Median Family Income in Franklin County is $87,949.
What is the Median Household income in Franklin County?
Median Household Income in Franklin County is $75,985.
What is Income or Wage Gap in Franklin County?
Income or Wage Gap in Franklin County is 33.1%.
Women in Franklin County earn 66.9 cents for every dollar earned by a man.
What is Family Income Deficit in Franklin County?
Family Income Deficit in Franklin County is $11,429.
Families that are below poverty line in Franklin County earn $11,429 less on average than the poverty threshold level.
What is Inequality or Gini Index in Franklin County?
Inequality or Gini Index in Franklin County is 0.41.
How Large is the Labor Force in Franklin County?
There are 11,830 People in the Labor Forcein in Franklin County.
What is the Percentage of People in the Labor Force in Franklin County?
64.4% of People are in the Labor Force in Franklin County.
What is the Unemployment Rate in Franklin County?
Unemployment Rate in Franklin County is 2.1%.