Fountain County, IN
Fountain County Map
Fountain County Overview
16,468
TOTAL POPULATION
8,249
MALE POPULATION
8,219
FEMALE POPULATION
100.37
MALES / 100 FEMALES
99.64
FEMALES / 100 MALES
43.1
MEDIAN AGE
2.9
AVG FAMILY SIZE
2.4
AVG HOUSEHOLD SIZE
$30,562
PER CAPITA INCOME
$74,485
AVG FAMILY INCOME
$60,559
AVG HOUSEHOLD INCOME
38.6%
WAGE / INCOME GAP [ % ]
61.4¢/ $1
WAGE / INCOME GAP [ $ ]
$9,652
FAMILY INCOME DEFICIT
0.41
INEQUALITY / GINI INDEX
8,181
LABOR FORCE [ PEOPLE ]
61.7%
PERCENT IN LABOR FORCE
5.2%
UNEMPLOYMENT RATE
Fountain County Area Codes
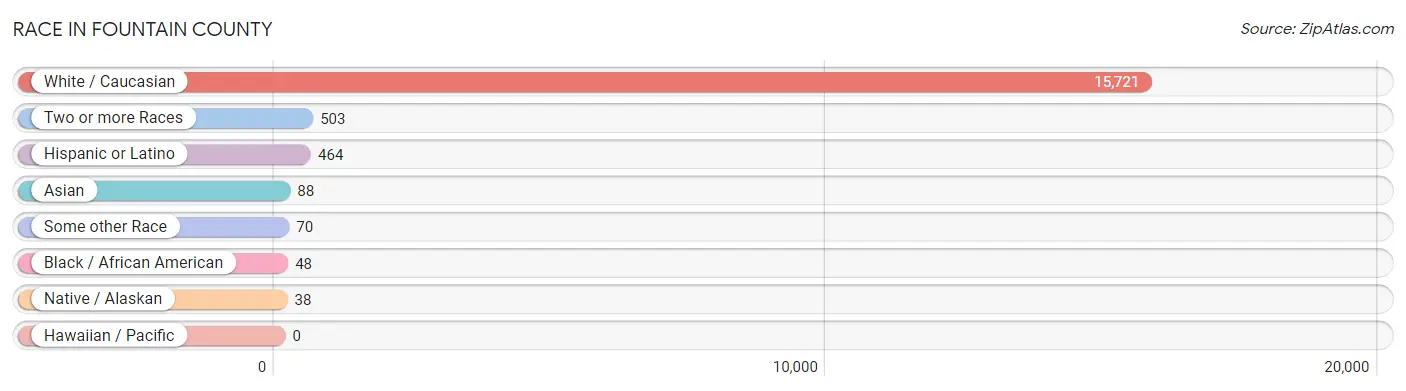
Race in Fountain County
The most populous races in Fountain County are White / Caucasian (15,721 | 95.5%), Two or more Races (503 | 3.0%), and Hispanic or Latino (464 | 2.8%).
| Race | # Population | % Population |
| Asian | 88 | 0.5% |
| Black / African American | 48 | 0.3% |
| Hawaiian / Pacific | 0 | 0.0% |
| Hispanic or Latino | 464 | 2.8% |
| Native / Alaskan | 38 | 0.2% |
| White / Caucasian | 15,721 | 95.5% |
| Two or more Races | 503 | 3.0% |
| Some other Race | 70 | 0.4% |
| Total | 16,468 | 100.0% |
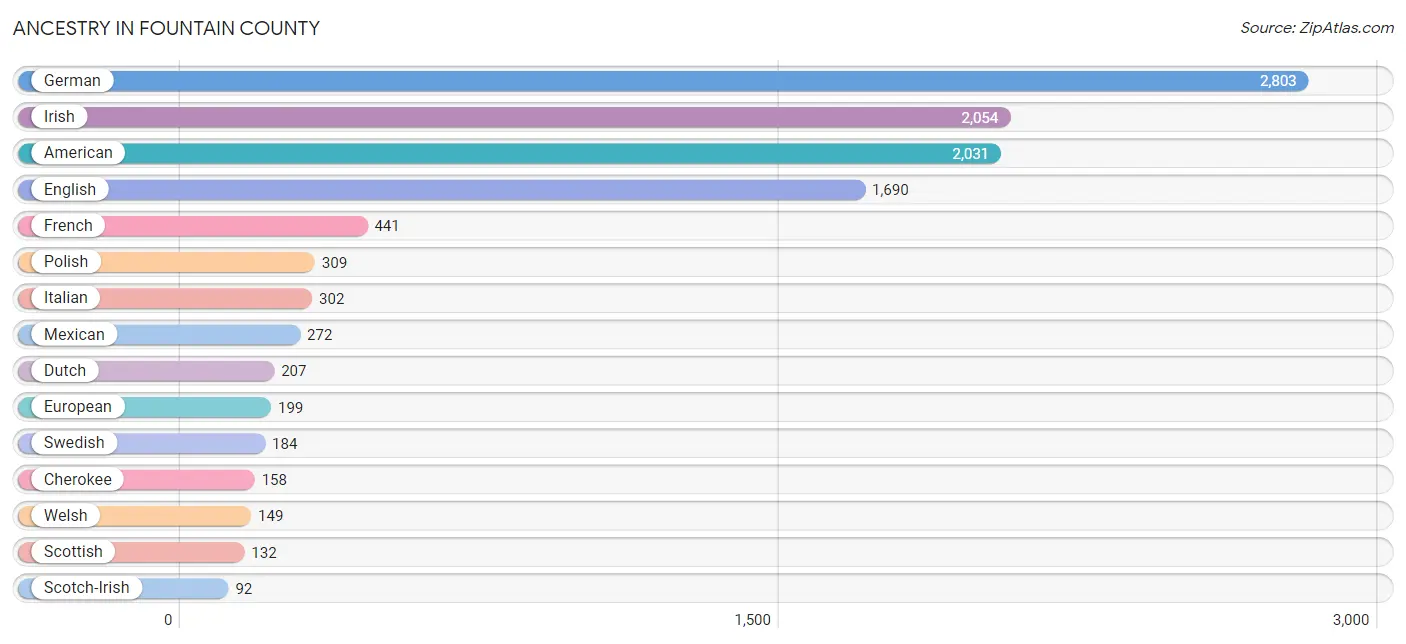
Ancestry in Fountain County
The most populous ancestries reported in Fountain County are German (2,803 | 17.0%), Irish (2,054 | 12.5%), American (2,031 | 12.3%), English (1,690 | 10.3%), and French (441 | 2.7%), together accounting for 54.8% of all Fountain County residents.
| Ancestry | # Population | % Population |
| African | 1 | 0.0% |
| Albanian | 79 | 0.5% |
| Aleut | 4 | 0.0% |
| American | 2,031 | 12.3% |
| Apache | 8 | 0.1% |
| Armenian | 6 | 0.0% |
| Austrian | 28 | 0.2% |
| Bhutanese | 5 | 0.0% |
| Blackfeet | 32 | 0.2% |
| British | 34 | 0.2% |
| Bulgarian | 6 | 0.0% |
| Canadian | 13 | 0.1% |
| Celtic | 5 | 0.0% |
| Central American | 31 | 0.2% |
| Cherokee | 158 | 1.0% |
| Chinese | 7 | 0.0% |
| Colombian | 60 | 0.4% |
| Comanche | 8 | 0.1% |
| Croatian | 29 | 0.2% |
| Czech | 16 | 0.1% |
| Danish | 22 | 0.1% |
| Dutch | 207 | 1.3% |
| Eastern European | 40 | 0.2% |
| English | 1,690 | 10.3% |
| European | 199 | 1.2% |
| French | 441 | 2.7% |
| French Canadian | 12 | 0.1% |
| German | 2,803 | 17.0% |
| Hungarian | 19 | 0.1% |
| Indian (Asian) | 73 | 0.4% |
| Inupiat | 1 | 0.0% |
| Irish | 2,054 | 12.5% |
| Italian | 302 | 1.8% |
| Jamaican | 2 | 0.0% |
| Korean | 14 | 0.1% |
| Latvian | 4 | 0.0% |
| Lithuanian | 8 | 0.1% |
| Mexican | 272 | 1.7% |
| Native Hawaiian | 7 | 0.0% |
| Nicaraguan | 3 | 0.0% |
| Northern European | 1 | 0.0% |
| Norwegian | 53 | 0.3% |
| Peruvian | 5 | 0.0% |
| Polish | 309 | 1.9% |
| Potawatomi | 13 | 0.1% |
| Puerto Rican | 26 | 0.2% |
| Russian | 53 | 0.3% |
| Salvadoran | 28 | 0.2% |
| Scotch-Irish | 92 | 0.6% |
| Scottish | 132 | 0.8% |
| Serbian | 42 | 0.3% |
| Shoshone | 7 | 0.0% |
| Sioux | 3 | 0.0% |
| Slavic | 7 | 0.0% |
| Slovak | 43 | 0.3% |
| South American | 65 | 0.4% |
| South American Indian | 1 | 0.0% |
| Spaniard | 40 | 0.2% |
| Spanish | 26 | 0.2% |
| Subsaharan African | 1 | 0.0% |
| Swedish | 184 | 1.1% |
| Swiss | 60 | 0.4% |
| Thai | 15 | 0.1% |
| Ukrainian | 1 | 0.0% |
| Welsh | 149 | 0.9% | View All 65 Rows |
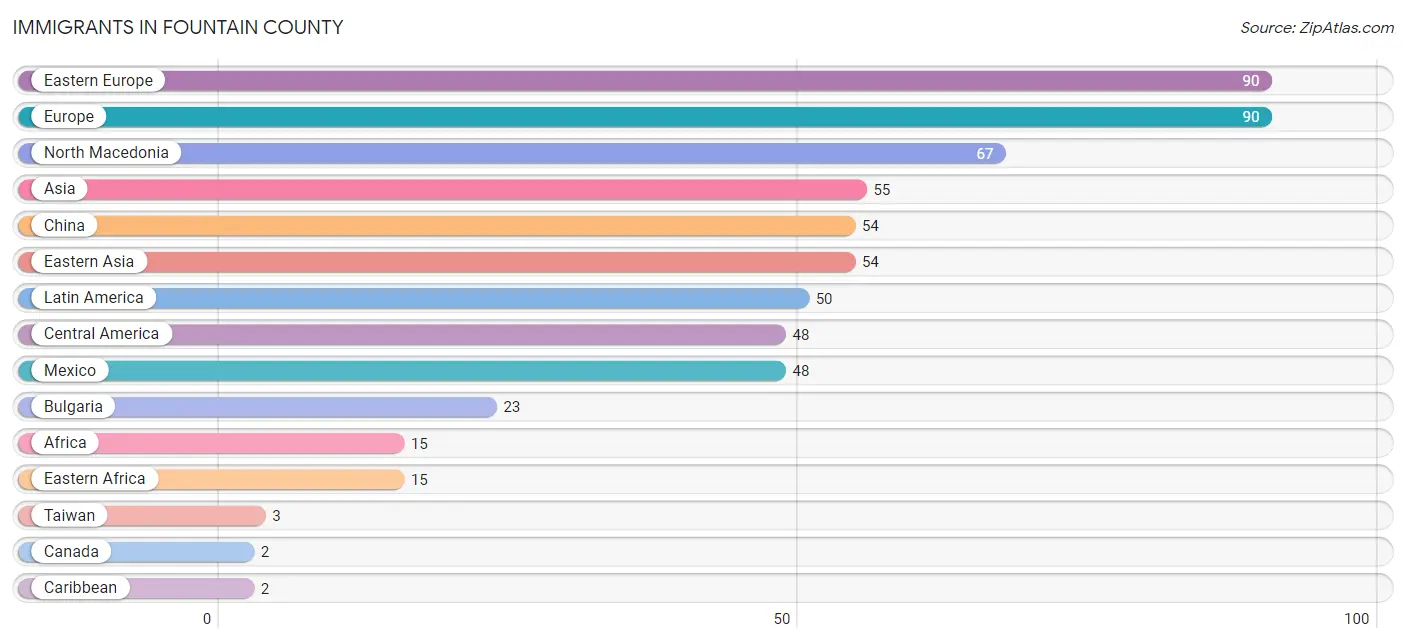
Immigrants in Fountain County
The most numerous immigrant groups reported in Fountain County came from Eastern Europe (90 | 0.5%), Europe (90 | 0.5%), North Macedonia (67 | 0.4%), Asia (55 | 0.3%), and China (54 | 0.3%), together accounting for 2.2% of all Fountain County residents.
| Immigration Origin | # Population | % Population |
| Africa | 15 | 0.1% |
| Asia | 55 | 0.3% |
| Bulgaria | 23 | 0.1% |
| Canada | 2 | 0.0% |
| Caribbean | 2 | 0.0% |
| Central America | 48 | 0.3% |
| China | 54 | 0.3% |
| Eastern Africa | 15 | 0.1% |
| Eastern Asia | 54 | 0.3% |
| Eastern Europe | 90 | 0.5% |
| Europe | 90 | 0.5% |
| Jamaica | 2 | 0.0% |
| Latin America | 50 | 0.3% |
| Mexico | 48 | 0.3% |
| North Macedonia | 67 | 0.4% |
| Taiwan | 3 | 0.0% |
| Turkey | 1 | 0.0% |
| Western Asia | 1 | 0.0% | View All 18 Rows |
Sex and Age in Fountain County
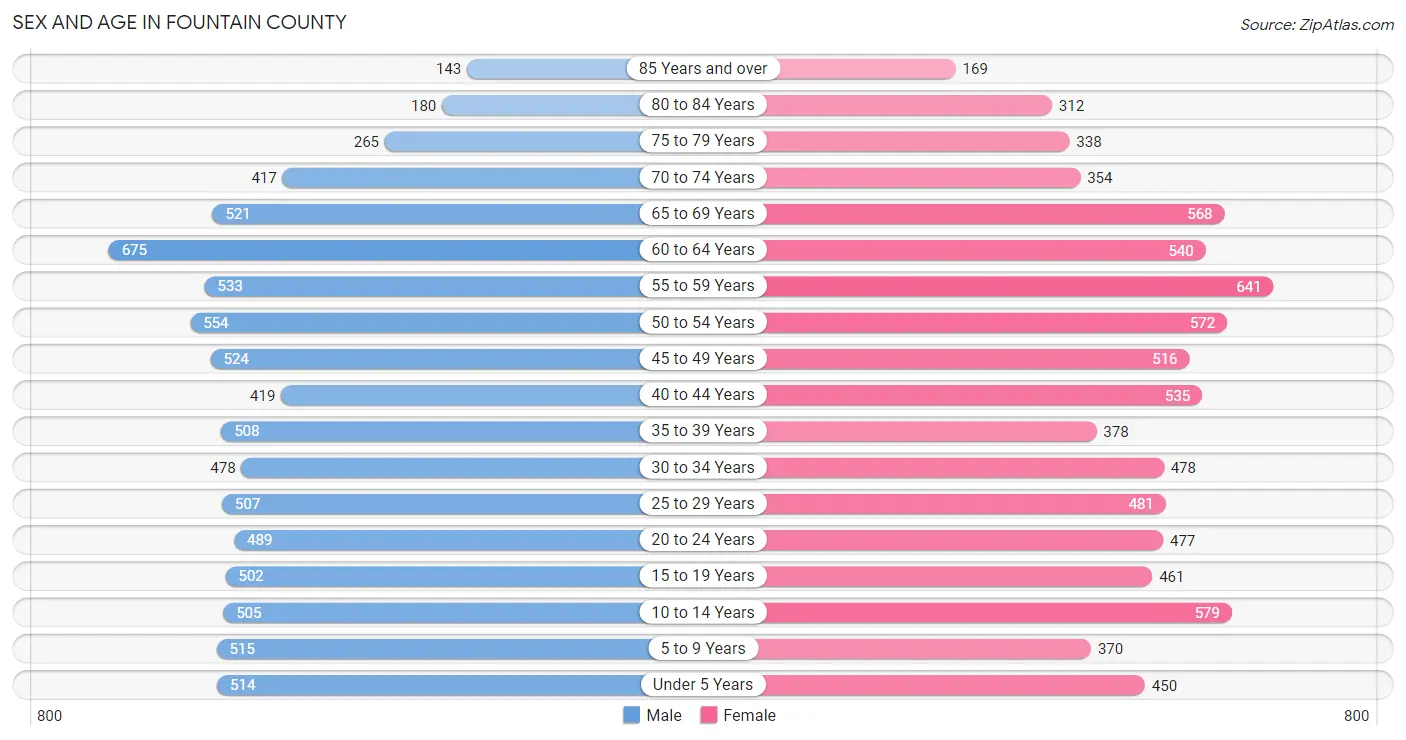
Sex and Age in Fountain County
The most populous age groups in Fountain County are 60 to 64 Years (675 | 8.2%) for men and 55 to 59 Years (641 | 7.8%) for women.
| Age Bracket | Male | Female |
| Under 5 Years | 514 (6.2%) | 450 (5.5%) |
| 5 to 9 Years | 515 (6.2%) | 370 (4.5%) |
| 10 to 14 Years | 505 (6.1%) | 579 (7.0%) |
| 15 to 19 Years | 502 (6.1%) | 461 (5.6%) |
| 20 to 24 Years | 489 (5.9%) | 477 (5.8%) |
| 25 to 29 Years | 507 (6.1%) | 481 (5.9%) |
| 30 to 34 Years | 478 (5.8%) | 478 (5.8%) |
| 35 to 39 Years | 508 (6.2%) | 378 (4.6%) |
| 40 to 44 Years | 419 (5.1%) | 535 (6.5%) |
| 45 to 49 Years | 524 (6.4%) | 516 (6.3%) |
| 50 to 54 Years | 554 (6.7%) | 572 (7.0%) |
| 55 to 59 Years | 533 (6.5%) | 641 (7.8%) |
| 60 to 64 Years | 675 (8.2%) | 540 (6.6%) |
| 65 to 69 Years | 521 (6.3%) | 568 (6.9%) |
| 70 to 74 Years | 417 (5.1%) | 354 (4.3%) |
| 75 to 79 Years | 265 (3.2%) | 338 (4.1%) |
| 80 to 84 Years | 180 (2.2%) | 312 (3.8%) |
| 85 Years and over | 143 (1.7%) | 169 (2.1%) |
| Total | 8,249 (100.0%) | 8,219 (100.0%) |
Families and Households in Fountain County
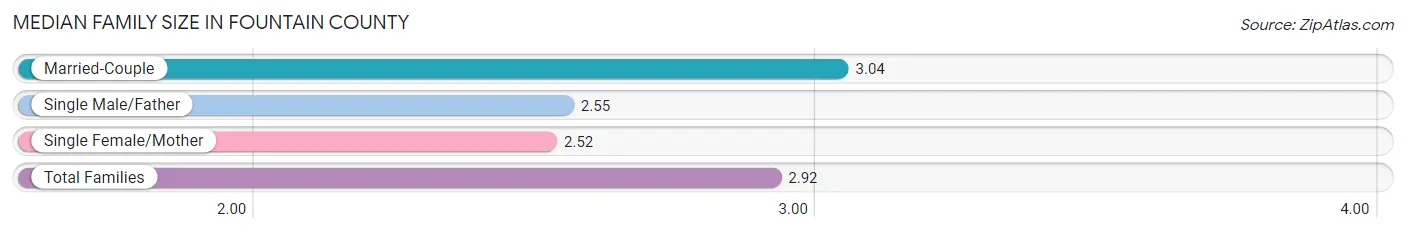
Median Family Size in Fountain County
The median family size in Fountain County is 2.92 persons per family, with married-couple families (3,489 | 76.7%) accounting for the largest median family size of 3.04 persons per family. On the other hand, single female/mother families (671 | 14.7%) represent the smallest median family size with 2.52 persons per family.
| Family Type | # Families | Family Size |
| Married-Couple | 3,489 (76.7%) | 3.04 |
| Single Male/Father | 389 (8.6%) | 2.55 |
| Single Female/Mother | 671 (14.7%) | 2.52 |
| Total Families | 4,549 (100.0%) | 2.92 |
Median Household Size in Fountain County
The median household size in Fountain County is 2.40 persons per household, with married-couple households (3,489 | 51.2%) accounting for the largest median household size of 3.06 persons per household. non-family households (2,271 | 33.3%) represent the smallest median household size with 1.17 persons per household.

| Household Type | # Households | Household Size |
| Married-Couple | 3,489 (51.2%) | 3.06 |
| Single Male/Father | 389 (5.7%) | 2.90 |
| Single Female/Mother | 671 (9.8%) | 2.81 |
| Non-family | 2,271 (33.3%) | 1.17 |
| Total Households | 6,820 (100.0%) | 2.40 |
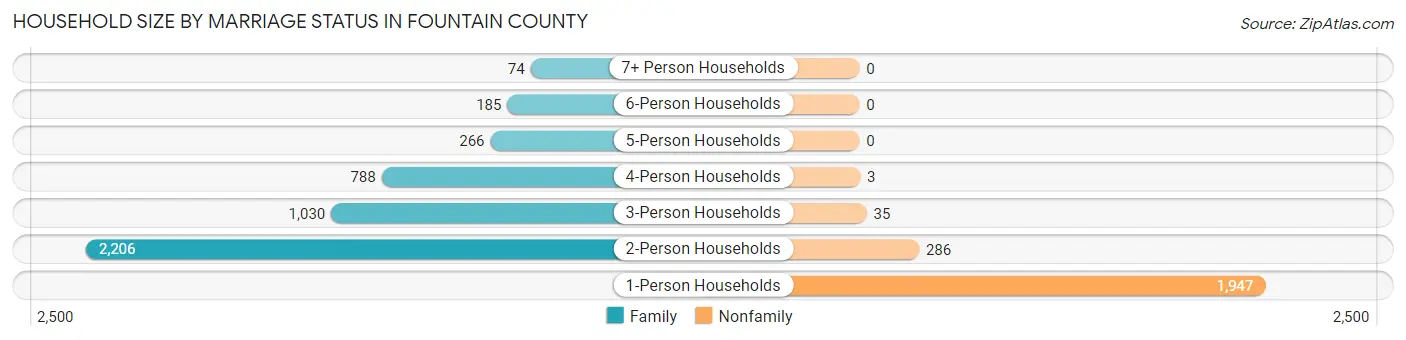
Household Size by Marriage Status in Fountain County
Out of a total of 6,820 households in Fountain County, 4,549 (66.7%) are family households, while 2,271 (33.3%) are nonfamily households. The most numerous type of family households are 2-person households, comprising 2,206, and the most common type of nonfamily households are 1-person households, comprising 1,947.
| Household Size | Family Households | Nonfamily Households |
| 1-Person Households | - | 1,947 (28.5%) |
| 2-Person Households | 2,206 (32.4%) | 286 (4.2%) |
| 3-Person Households | 1,030 (15.1%) | 35 (0.5%) |
| 4-Person Households | 788 (11.6%) | 3 (0.0%) |
| 5-Person Households | 266 (3.9%) | 0 (0.0%) |
| 6-Person Households | 185 (2.7%) | 0 (0.0%) |
| 7+ Person Households | 74 (1.1%) | 0 (0.0%) |
| Total | 4,549 (66.7%) | 2,271 (33.3%) |
Female Fertility in Fountain County
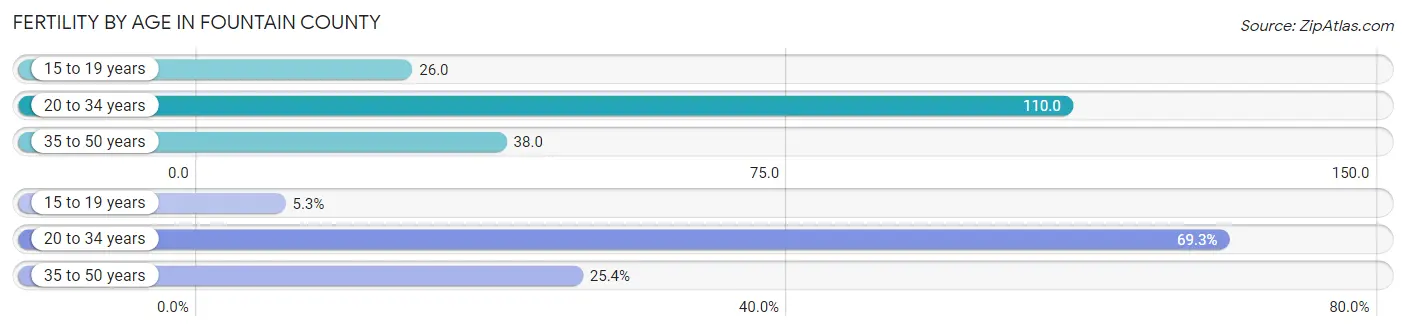
Fertility by Age in Fountain County
Average fertility rate in Fountain County is 66.0 births per 1,000 women. Women in the age bracket of 20 to 34 years have the highest fertility rate with 110.0 births per 1,000 women. Women in the age bracket of 20 to 34 years acount for 69.3% of all women with births.
| Age Bracket | Women with Births | Births / 1,000 Women |
| 15 to 19 years | 12 (5.3%) | 26.0 |
| 20 to 34 years | 158 (69.3%) | 110.0 |
| 35 to 50 years | 58 (25.4%) | 38.0 |
| Total | 228 (100.0%) | 66.0 |
Fertility by Age by Marriage Status in Fountain County
75.4% of women with births (228) in Fountain County are married. The highest percentage of unmarried women with births falls into 15 to 19 years age bracket with 100.0% of them unmarried at the time of birth, while the lowest percentage of unmarried women with births belong to 35 to 50 years age bracket with 8.6% of them unmarried.
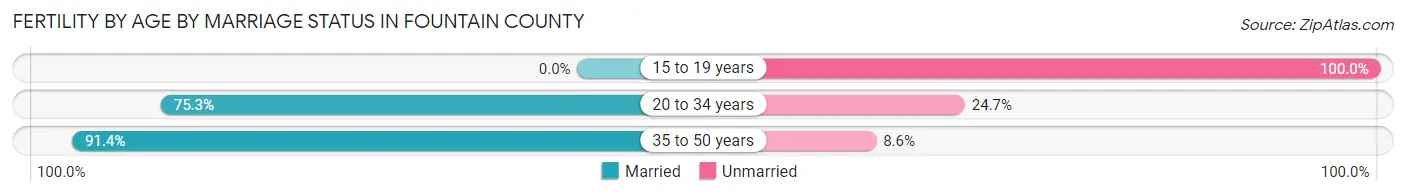
| Age Bracket | Married | Unmarried |
| 15 to 19 years | 0 (0.0%) | 12 (100.0%) |
| 20 to 34 years | 119 (75.3%) | 39 (24.7%) |
| 35 to 50 years | 53 (91.4%) | 5 (8.6%) |
| Total | 172 (75.4%) | 56 (24.6%) |
Fertility by Education in Fountain County
Average fertility rate in Fountain County is 66.0 births per 1,000 women. Women with the education attainment of graduate degree have the highest fertility rate of 276.0 births per 1,000 women, while women with the education attainment of bachelor's degree have the lowest fertility at 21.0 births per 1,000 women. Women with the education attainment of high school diploma represent 33.3% of all women with births.

| Educational Attainment | Women with Births | Births / 1,000 Women |
| Less than High School | 17 (7.5%) | 32.0 |
| High School Diploma | 76 (33.3%) | 77.0 |
| College or Associate's Degree | 73 (32.0%) | 61.0 |
| Bachelor's Degree | 11 (4.8%) | 21.0 |
| Graduate Degree | 51 (22.4%) | 276.0 |
| Total | 228 (100.0%) | 66.0 |
Fertility by Education by Marriage Status in Fountain County
24.6% of women with births in Fountain County are unmarried. Women with the educational attainment of bachelor's degree are most likely to be married with 100.0% of them married at childbirth, while women with the educational attainment of less than high school are least likely to be married with 100.0% of them unmarried at childbirth.
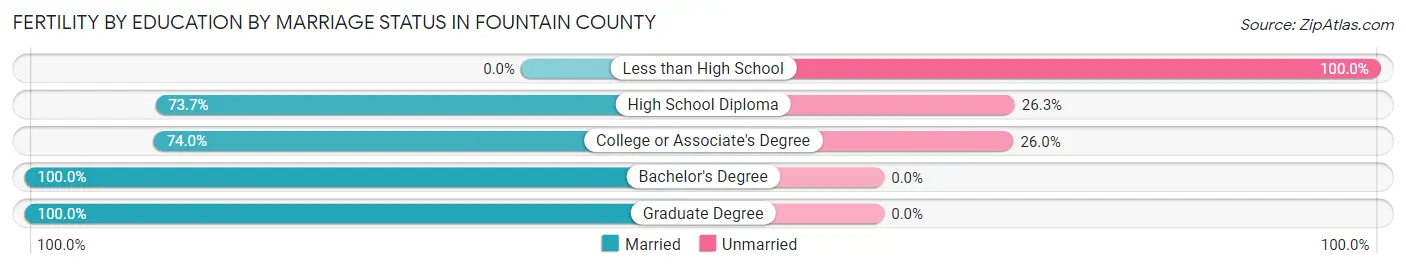
| Educational Attainment | Married | Unmarried |
| Less than High School | 0 (0.0%) | 17 (100.0%) |
| High School Diploma | 56 (73.7%) | 20 (26.3%) |
| College or Associate's Degree | 54 (74.0%) | 19 (26.0%) |
| Bachelor's Degree | 11 (100.0%) | 0 (0.0%) |
| Graduate Degree | 51 (100.0%) | 0 (0.0%) |
| Total | 172 (75.4%) | 56 (24.6%) |
Income in Fountain County
Income Overview in Fountain County
Per Capita Income in Fountain County is $30,562, while median incomes of families and households are $74,485 and $60,559 respectively.
| Characteristic | Number | Measure |
| Per Capita Income | 16,468 | $30,562 |
| Median Family Income | 4,549 | $74,485 |
| Mean Family Income | 4,549 | $84,752 |
| Median Household Income | 6,820 | $60,559 |
| Mean Household Income | 6,820 | $72,960 |
| Income Deficit | 4,549 | $9,652 |
| Wage / Income Gap (%) | 16,468 | 38.60% |
| Wage / Income Gap ($) | 16,468 | 61.40¢ per $1 |
| Gini / Inequality Index | 16,468 | 0.41 |
Earnings by Sex in Fountain County
Average Earnings in Fountain County are $38,589, $46,283 for men and $28,416 for women, a difference of 38.6%.
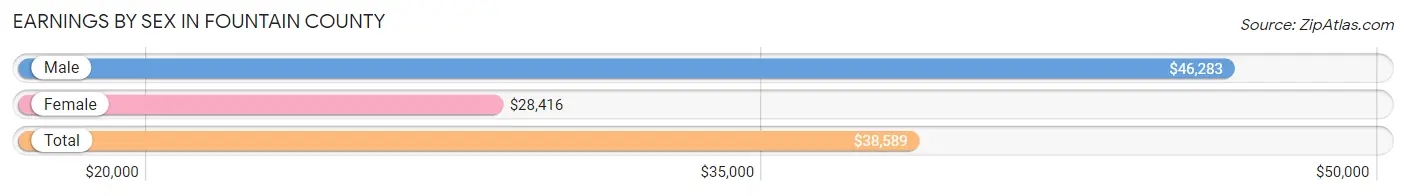
| Sex | Number | Average Earnings |
| Male | 4,574 (54.4%) | $46,283 |
| Female | 3,834 (45.6%) | $28,416 |
| Total | 8,408 (100.0%) | $38,589 |
Earnings by Sex by Income Bracket in Fountain County
The most common earnings brackets in Fountain County are $75,000 to $99,999 for men (708 | 15.5%) and $25,000 to $29,999 for women (362 | 9.4%).

| Income | Male | Female |
| $2,499 or less | 260 (5.7%) | 301 (7.9%) |
| $2,500 to $4,999 | 114 (2.5%) | 190 (5.0%) |
| $5,000 to $7,499 | 118 (2.6%) | 213 (5.6%) |
| $7,500 to $9,999 | 117 (2.6%) | 163 (4.3%) |
| $10,000 to $12,499 | 82 (1.8%) | 146 (3.8%) |
| $12,500 to $14,999 | 47 (1.0%) | 214 (5.6%) |
| $15,000 to $17,499 | 25 (0.5%) | 56 (1.5%) |
| $17,500 to $19,999 | 146 (3.2%) | 91 (2.4%) |
| $20,000 to $22,499 | 49 (1.1%) | 151 (3.9%) |
| $22,500 to $24,999 | 112 (2.5%) | 132 (3.4%) |
| $25,000 to $29,999 | 203 (4.4%) | 362 (9.4%) |
| $30,000 to $34,999 | 206 (4.5%) | 210 (5.5%) |
| $35,000 to $39,999 | 372 (8.1%) | 347 (9.0%) |
| $40,000 to $44,999 | 339 (7.4%) | 297 (7.7%) |
| $45,000 to $49,999 | 274 (6.0%) | 237 (6.2%) |
| $50,000 to $54,999 | 321 (7.0%) | 158 (4.1%) |
| $55,000 to $64,999 | 511 (11.2%) | 153 (4.0%) |
| $65,000 to $74,999 | 236 (5.2%) | 144 (3.8%) |
| $75,000 to $99,999 | 708 (15.5%) | 182 (4.8%) |
| $100,000+ | 334 (7.3%) | 87 (2.3%) |
| Total | 4,574 (100.0%) | 3,834 (100.0%) |
Earnings by Sex by Educational Attainment in Fountain County
Average earnings in Fountain County are $52,022 for men and $33,131 for women, a difference of 36.3%. Men with an educational attainment of graduate degree enjoy the highest average annual earnings of $65,750, while those with high school diploma education earn the least with $42,312. Women with an educational attainment of graduate degree earn the most with the average annual earnings of $56,932, while those with less than high school education have the smallest earnings of $13,185.

| Educational Attainment | Male Income | Female Income |
| Less than High School | $42,679 | $13,185 |
| High School Diploma | $42,312 | $25,636 |
| College or Associate's Degree | $58,972 | $30,859 |
| Bachelor's Degree | $53,654 | $43,542 |
| Graduate Degree | $65,750 | $56,932 |
| Total | $52,022 | $33,131 |
Family Income in Fountain County
Family Income Brackets in Fountain County
According to the Fountain County family income data, there are 1,001 families falling into the $75,000 to $99,999 income range, which is the most common income bracket and makes up 22.0% of all families. Conversely, the less than $10,000 income bracket is the least frequent group with only 109 families (2.4%) belonging to this category.
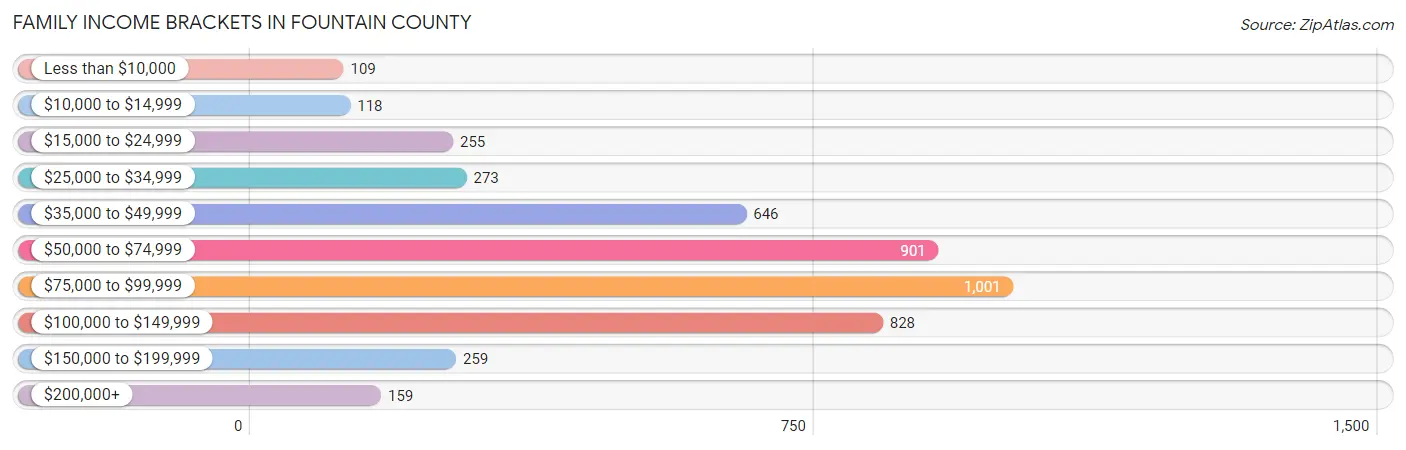
| Income Bracket | # Families | % Families |
| Less than $10,000 | 109 | 2.4% |
| $10,000 to $14,999 | 118 | 2.6% |
| $15,000 to $24,999 | 255 | 5.6% |
| $25,000 to $34,999 | 273 | 6.0% |
| $35,000 to $49,999 | 646 | 14.2% |
| $50,000 to $74,999 | 901 | 19.8% |
| $75,000 to $99,999 | 1,001 | 22.0% |
| $100,000 to $149,999 | 828 | 18.2% |
| $150,000 to $199,999 | 259 | 5.7% |
| $200,000+ | 159 | 3.5% |
Family Income by Famaliy Size in Fountain County
6-person families (147 | 3.2%) account for the highest median family income in Fountain County with $109,313 per family, while 2-person families (2,364 | 52.0%) have the highest median income of $31,994 per family member.

| Income Bracket | # Families | Median Income |
| 2-Person Families | 2,364 (52.0%) | $63,988 |
| 3-Person Families | 958 (21.1%) | $73,302 |
| 4-Person Families | 757 (16.6%) | $89,583 |
| 5-Person Families | 252 (5.5%) | $93,864 |
| 6-Person Families | 147 (3.2%) | $109,313 |
| 7+ Person Families | 71 (1.6%) | $83,281 |
| Total | 4,549 (100.0%) | $74,485 |
Family Income by Number of Earners in Fountain County
The median family income in Fountain County is $74,485, with families comprising 3+ earners (532) having the highest median family income of $111,912, while families with no earners (738) have the lowest median family income of $46,429, accounting for 11.7% and 16.2% of families, respectively.
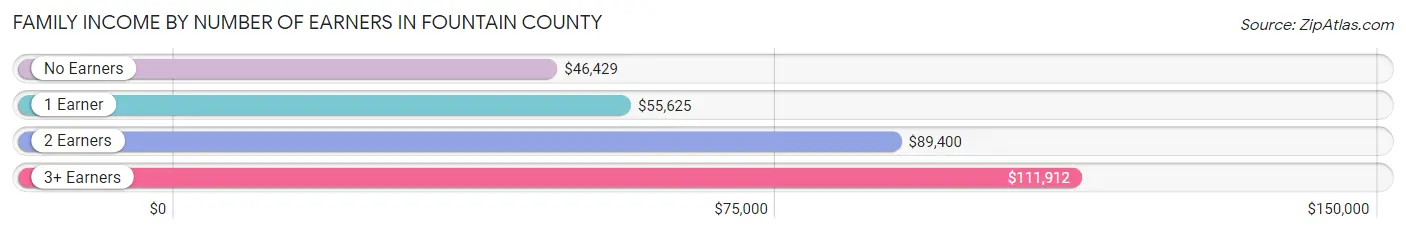
| Number of Earners | # Families | Median Income |
| No Earners | 738 (16.2%) | $46,429 |
| 1 Earner | 1,515 (33.3%) | $55,625 |
| 2 Earners | 1,764 (38.8%) | $89,400 |
| 3+ Earners | 532 (11.7%) | $111,912 |
| Total | 4,549 (100.0%) | $74,485 |
Household Income in Fountain County
Household Income Brackets in Fountain County
With 1,303 households falling in the category, the $75,000 to $99,999 income range is the most frequent in Fountain County, accounting for 19.1% of all households. In contrast, only 211 households (3.1%) fall into the less than $10,000 income bracket, making it the least populous group.
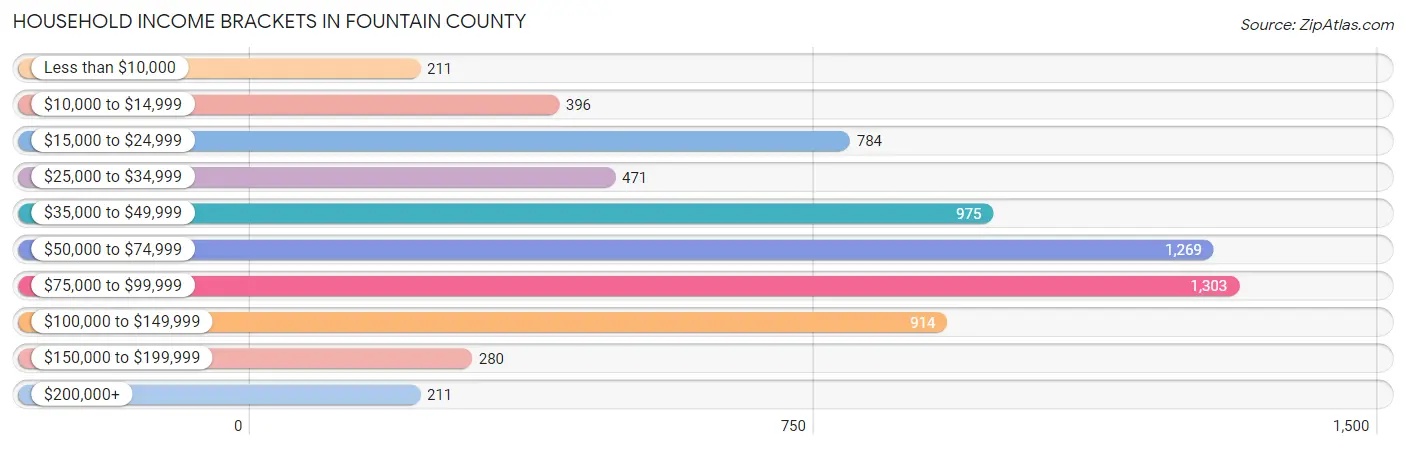
| Income Bracket | # Households | % Households |
| Less than $10,000 | 211 | 3.1% |
| $10,000 to $14,999 | 396 | 5.8% |
| $15,000 to $24,999 | 784 | 11.5% |
| $25,000 to $34,999 | 471 | 6.9% |
| $35,000 to $49,999 | 975 | 14.3% |
| $50,000 to $74,999 | 1,269 | 18.6% |
| $75,000 to $99,999 | 1,303 | 19.1% |
| $100,000 to $149,999 | 914 | 13.4% |
| $150,000 to $199,999 | 280 | 4.1% |
| $200,000+ | 211 | 3.1% |
Household Income by Householder Age in Fountain County
The median household income in Fountain County is $60,559, with the highest median household income of $79,985 found in the 25 to 44 years age bracket for the primary householder. A total of 1,999 households (29.3%) fall into this category. Meanwhile, the 65+ years age bracket for the primary householder has the lowest median household income of $42,446, with 2,088 households (30.6%) in this group.
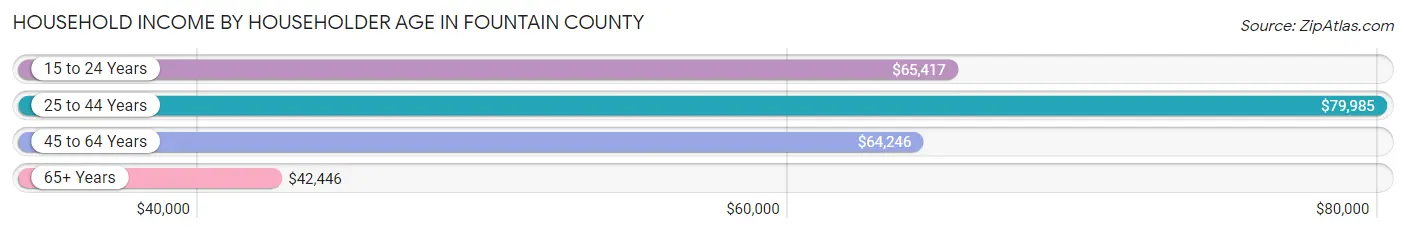
| Income Bracket | # Households | Median Income |
| 15 to 24 Years | 245 (3.6%) | $65,417 |
| 25 to 44 Years | 1,999 (29.3%) | $79,985 |
| 45 to 64 Years | 2,488 (36.5%) | $64,246 |
| 65+ Years | 2,088 (30.6%) | $42,446 |
| Total | 6,820 (100.0%) | $60,559 |
Poverty in Fountain County
Income Below Poverty by Sex and Age in Fountain County
With 10.5% poverty level for males and 13.6% for females among the residents of Fountain County, 15 year old males and under 5 year old females are the most vulnerable to poverty, with 28 males (19.1%) and 110 females (24.4%) in their respective age groups living below the poverty level.
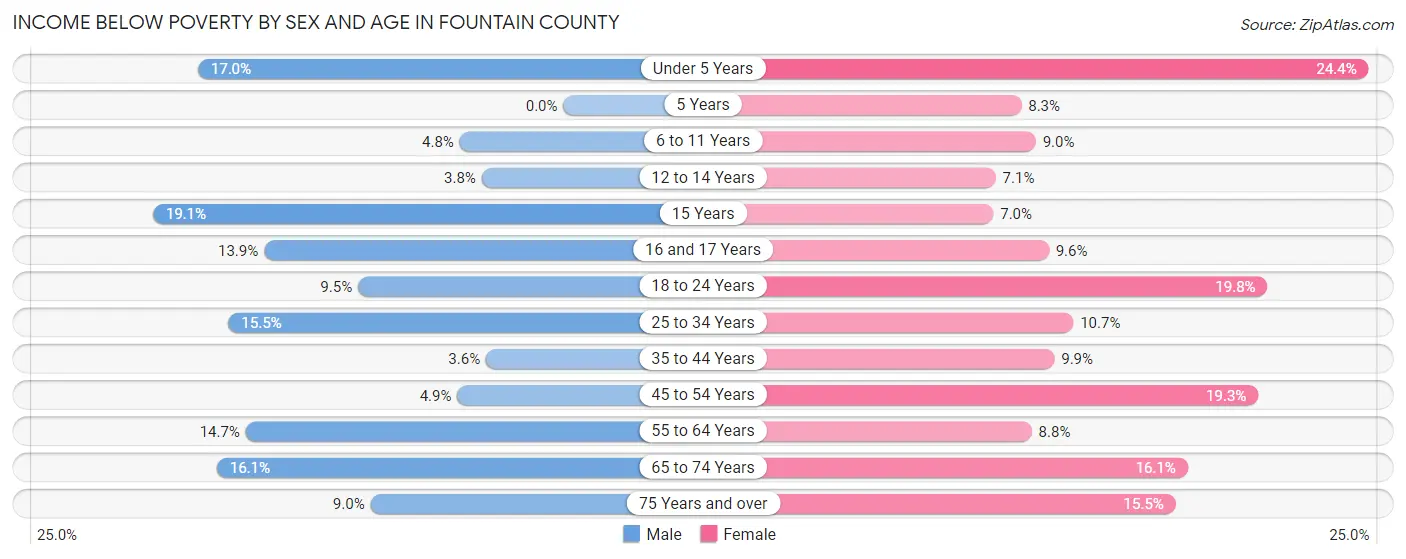
| Age Bracket | Male | Female |
| Under 5 Years | 87 (17.0%) | 110 (24.4%) |
| 5 Years | 0 (0.0%) | 5 (8.3%) |
| 6 to 11 Years | 26 (4.8%) | 47 (9.0%) |
| 12 to 14 Years | 11 (3.8%) | 25 (7.1%) |
| 15 Years | 28 (19.1%) | 9 (7.0%) |
| 16 and 17 Years | 25 (13.9%) | 17 (9.6%) |
| 18 to 24 Years | 63 (9.5%) | 125 (19.8%) |
| 25 to 34 Years | 152 (15.5%) | 103 (10.7%) |
| 35 to 44 Years | 33 (3.6%) | 90 (9.9%) |
| 45 to 54 Years | 53 (4.9%) | 210 (19.3%) |
| 55 to 64 Years | 178 (14.7%) | 104 (8.8%) |
| 65 to 74 Years | 145 (16.1%) | 147 (16.1%) |
| 75 Years and over | 51 (8.9%) | 121 (15.5%) |
| Total | 852 (10.5%) | 1,113 (13.6%) |
Income Above Poverty by Sex and Age in Fountain County
According to the poverty statistics in Fountain County, males aged 5 years and females aged 15 years are the age groups that are most secure financially, with 100.0% of males and 93.0% of females in these age groups living above the poverty line.

| Age Bracket | Male | Female |
| Under 5 Years | 426 (83.0%) | 340 (75.6%) |
| 5 Years | 151 (100.0%) | 55 (91.7%) |
| 6 to 11 Years | 515 (95.2%) | 475 (91.0%) |
| 12 to 14 Years | 279 (96.2%) | 325 (92.9%) |
| 15 Years | 119 (80.9%) | 119 (93.0%) |
| 16 and 17 Years | 155 (86.1%) | 160 (90.4%) |
| 18 to 24 Years | 598 (90.5%) | 508 (80.2%) |
| 25 to 34 Years | 826 (84.5%) | 856 (89.3%) |
| 35 to 44 Years | 885 (96.4%) | 823 (90.1%) |
| 45 to 54 Years | 1,025 (95.1%) | 877 (80.7%) |
| 55 to 64 Years | 1,030 (85.3%) | 1,077 (91.2%) |
| 65 to 74 Years | 757 (83.9%) | 769 (84.0%) |
| 75 Years and over | 519 (91.0%) | 660 (84.5%) |
| Total | 7,285 (89.5%) | 7,044 (86.4%) |
Income Below Poverty Among Married-Couple Families in Fountain County
The poverty statistics for married-couple families in Fountain County show that 5.6% or 194 of the total 3,489 families live below the poverty line. Families with 1 or 2 children have the highest poverty rate of 7.4%, comprising of 71 families. On the other hand, families with 5 or more children have the lowest poverty rate of 0.0%, which includes 0 families.
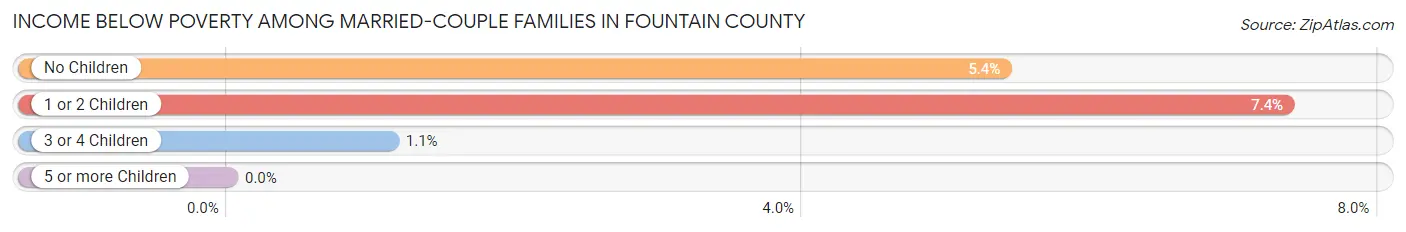
| Children | Above Poverty | Below Poverty |
| No Children | 2,108 (94.6%) | 120 (5.4%) |
| 1 or 2 Children | 894 (92.6%) | 71 (7.4%) |
| 3 or 4 Children | 265 (98.9%) | 3 (1.1%) |
| 5 or more Children | 28 (100.0%) | 0 (0.0%) |
| Total | 3,295 (94.4%) | 194 (5.6%) |
Income Below Poverty Among Single-Parent Households in Fountain County
According to the poverty data in Fountain County, 16.2% or 63 single-father households and 21.8% or 146 single-mother households are living below the poverty line. Among single-father households, those with 1 or 2 children have the highest poverty rate, with 48 households (25.8%) experiencing poverty. Likewise, among single-mother households, those with 3 or 4 children have the highest poverty rate, with 18 households (56.2%) falling below the poverty line.
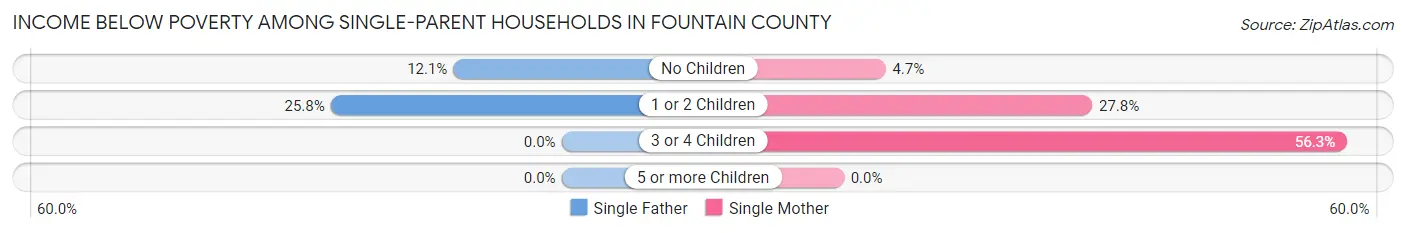
| Children | Single Father | Single Mother |
| No Children | 15 (12.1%) | 10 (4.7%) |
| 1 or 2 Children | 48 (25.8%) | 118 (27.8%) |
| 3 or 4 Children | 0 (0.0%) | 18 (56.2%) |
| 5 or more Children | 0 (0.0%) | 0 (0.0%) |
| Total | 63 (16.2%) | 146 (21.8%) |
Income Below Poverty Among Married-Couple vs Single-Parent Households in Fountain County
The poverty data for Fountain County shows that 194 of the married-couple family households (5.6%) and 209 of the single-parent households (19.7%) are living below the poverty level. Within the married-couple family households, those with 1 or 2 children have the highest poverty rate, with 71 households (7.4%) falling below the poverty line. Among the single-parent households, those with 1 or 2 children have the highest poverty rate, with 166 household (27.2%) living below poverty.
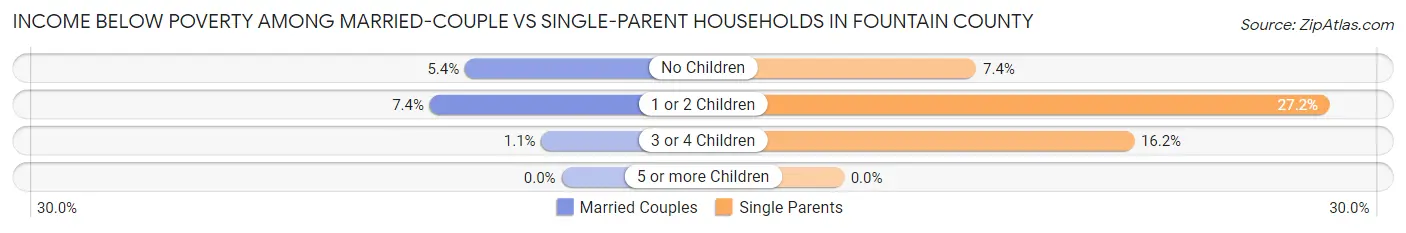
| Children | Married-Couple Families | Single-Parent Households |
| No Children | 120 (5.4%) | 25 (7.4%) |
| 1 or 2 Children | 71 (7.4%) | 166 (27.2%) |
| 3 or 4 Children | 3 (1.1%) | 18 (16.2%) |
| 5 or more Children | 0 (0.0%) | 0 (0.0%) |
| Total | 194 (5.6%) | 209 (19.7%) |
Employment Characteristics in Fountain County
Employment by Class of Employer in Fountain County
Among the 7,531 employed individuals in Fountain County, private company employees (5,247 | 69.7%), local government employees (662 | 8.8%), and not-for-profit organizations (644 | 8.6%) make up the most common classes of employment.
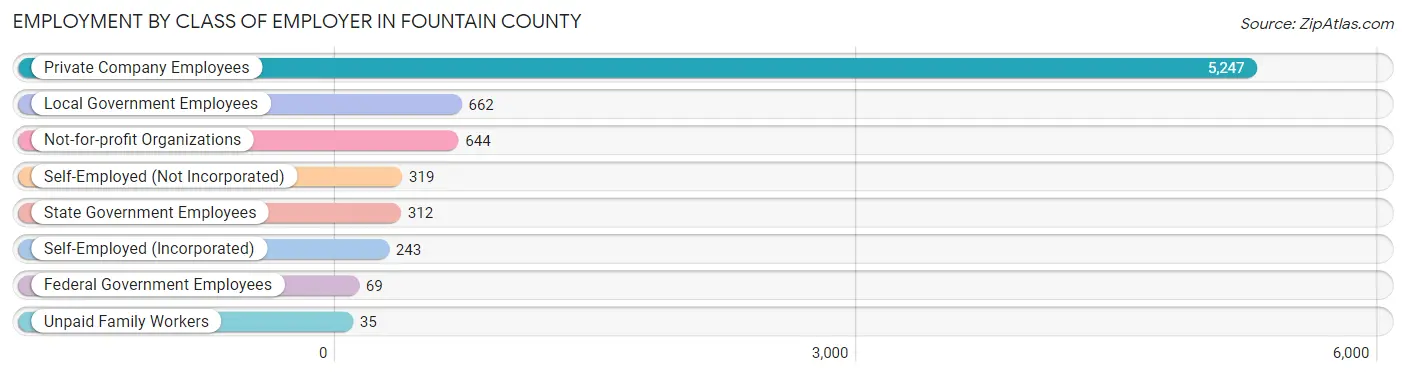
| Employer Class | # Employees | % Employees |
| Private Company Employees | 5,247 | 69.7% |
| Self-Employed (Incorporated) | 243 | 3.2% |
| Self-Employed (Not Incorporated) | 319 | 4.2% |
| Not-for-profit Organizations | 644 | 8.6% |
| Local Government Employees | 662 | 8.8% |
| State Government Employees | 312 | 4.1% |
| Federal Government Employees | 69 | 0.9% |
| Unpaid Family Workers | 35 | 0.5% |
| Total | 7,531 | 100.0% |
Employment Status by Age in Fountain County
According to the labor force statistics for Fountain County, out of the total population over 16 years of age (13,260), 61.7% or 8,181 individuals are in the labor force, with 5.2% or 425 of them unemployed. The age group with the highest labor force participation rate is 30 to 34 years, with 92.1% or 880 individuals in the labor force. Within the labor force, the 65 to 74 years age range has the highest percentage of unemployed individuals, with 12.3% or 51 of them being unemployed.
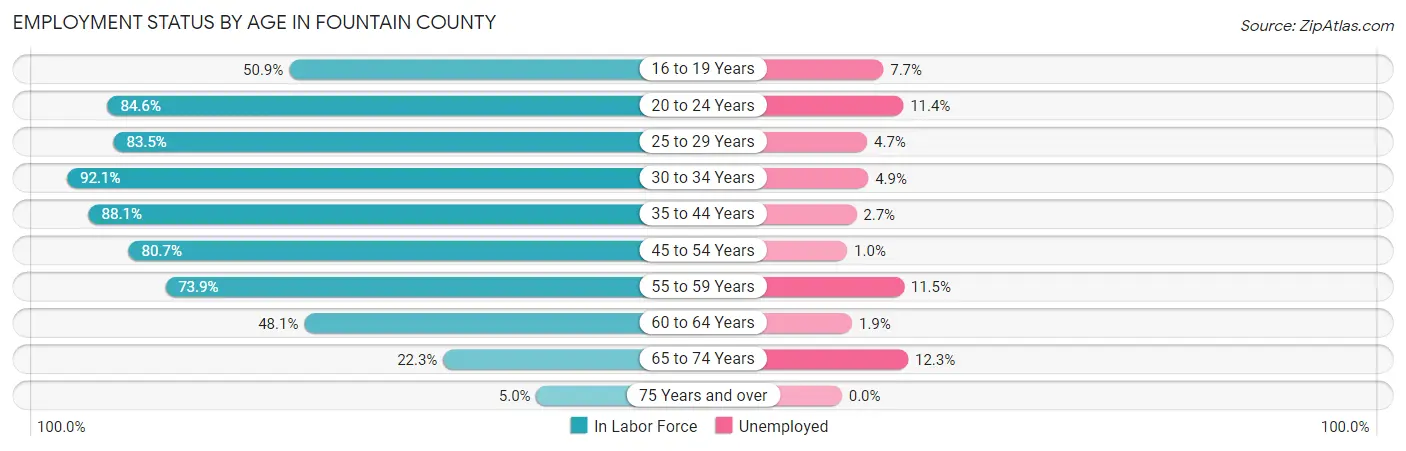
| Age Bracket | In Labor Force | Unemployed |
| 16 to 19 Years | 350 (50.9%) | 27 (7.7%) |
| 20 to 24 Years | 817 (84.6%) | 93 (11.4%) |
| 25 to 29 Years | 825 (83.5%) | 39 (4.7%) |
| 30 to 34 Years | 880 (92.1%) | 43 (4.9%) |
| 35 to 44 Years | 1,621 (88.1%) | 44 (2.7%) |
| 45 to 54 Years | 1,748 (80.7%) | 17 (1.0%) |
| 55 to 59 Years | 868 (73.9%) | 100 (11.5%) |
| 60 to 64 Years | 584 (48.1%) | 11 (1.9%) |
| 65 to 74 Years | 415 (22.3%) | 51 (12.3%) |
| 75 Years and over | 70 (5.0%) | 0 (0.0%) |
| Total | 8,181 (61.7%) | 425 (5.2%) |
Employment Status by Educational Attainment in Fountain County
According to labor force statistics for Fountain County, 78.3% of individuals (6,529) out of the total population between 25 and 64 years of age (8,339) are in the labor force, with 3.9% or 255 of them being unemployed. The group with the highest labor force participation rate are those with the educational attainment of bachelor's degree or higher, with 91.5% or 1,210 individuals in the labor force. Within the labor force, individuals with college / associate degree education have the highest percentage of unemployment, with 4.8% or 113 of them being unemployed.
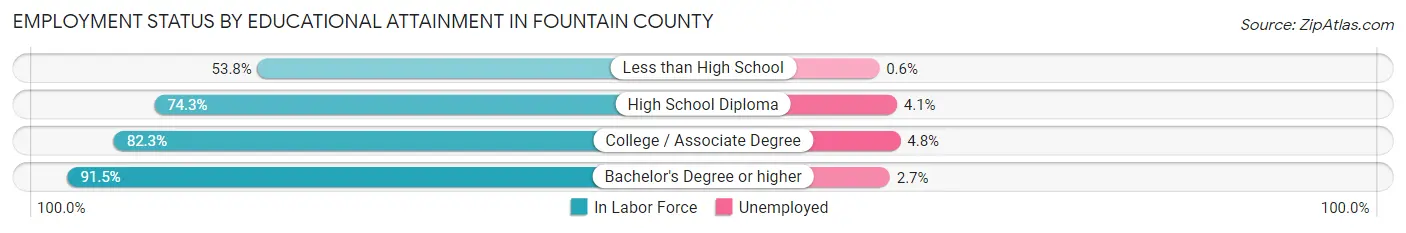
| Educational Attainment | In Labor Force | Unemployed |
| Less than High School | 334 (53.8%) | 4 (0.6%) |
| High School Diploma | 2,632 (74.3%) | 145 (4.1%) |
| College / Associate Degree | 2,348 (82.3%) | 137 (4.8%) |
| Bachelor's Degree or higher | 1,210 (91.5%) | 36 (2.7%) |
| Total | 6,529 (78.3%) | 325 (3.9%) |
Employment Occupations by Sex in Fountain County
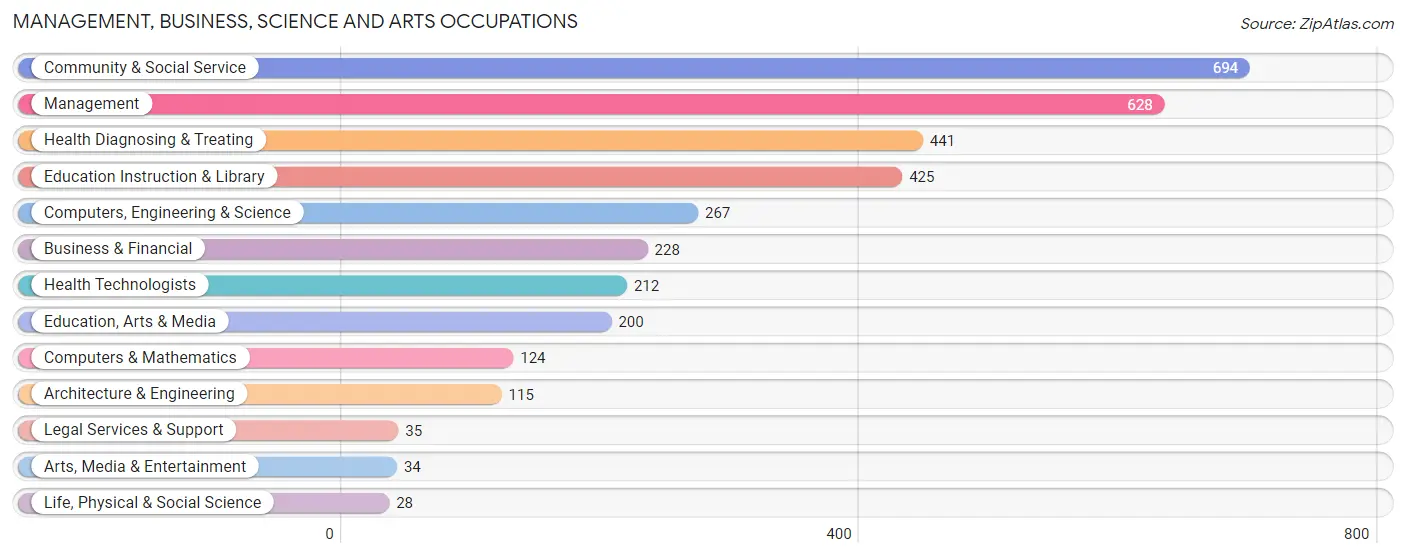
Management, Business, Science and Arts Occupations
The most common Management, Business, Science and Arts occupations in Fountain County are Community & Social Service (694 | 8.9%), Management (628 | 8.1%), Health Diagnosing & Treating (441 | 5.7%), Education Instruction & Library (425 | 5.5%), and Computers, Engineering & Science (267 | 3.4%).
Management, Business, Science and Arts Occupations by Sex
Within the Management, Business, Science and Arts occupations in Fountain County, the most male-oriented occupations are Architecture & Engineering (95.7%), Computers, Engineering & Science (77.9%), and Life, Physical & Social Science (71.4%), while the most female-oriented occupations are Health Diagnosing & Treating (92.1%), Health Technologists (89.1%), and Education Instruction & Library (83.1%).
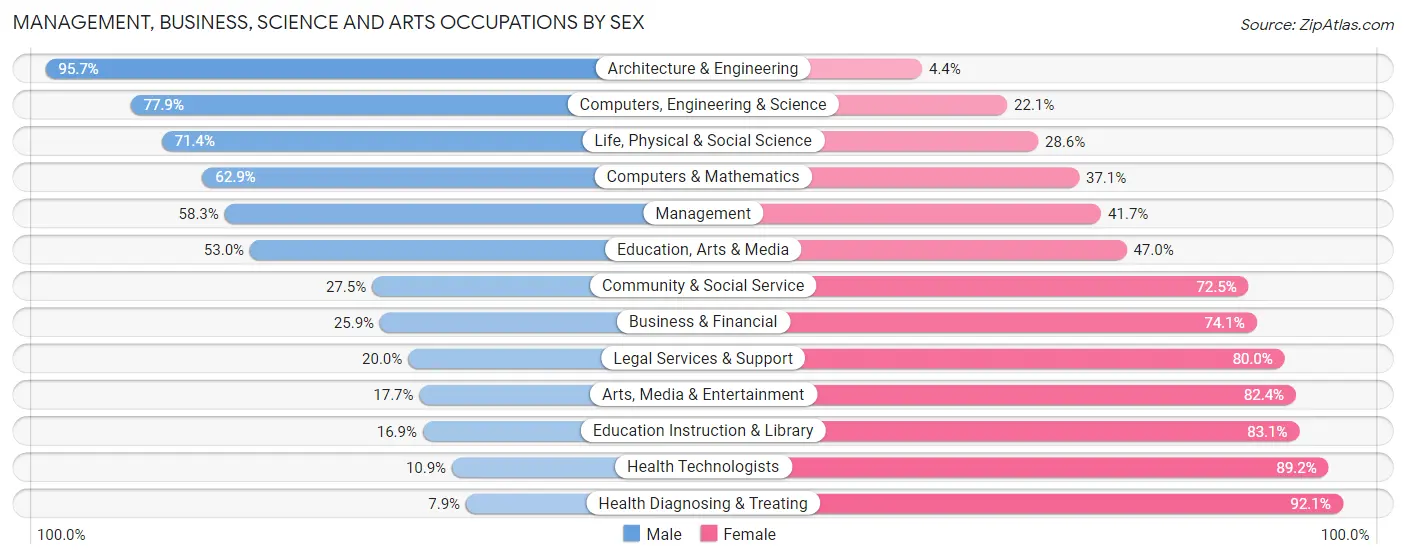
| Occupation | Male | Female |
| Management | 366 (58.3%) | 262 (41.7%) |
| Business & Financial | 59 (25.9%) | 169 (74.1%) |
| Computers, Engineering & Science | 208 (77.9%) | 59 (22.1%) |
| Computers & Mathematics | 78 (62.9%) | 46 (37.1%) |
| Architecture & Engineering | 110 (95.7%) | 5 (4.3%) |
| Life, Physical & Social Science | 20 (71.4%) | 8 (28.6%) |
| Community & Social Service | 191 (27.5%) | 503 (72.5%) |
| Education, Arts & Media | 106 (53.0%) | 94 (47.0%) |
| Legal Services & Support | 7 (20.0%) | 28 (80.0%) |
| Education Instruction & Library | 72 (16.9%) | 353 (83.1%) |
| Arts, Media & Entertainment | 6 (17.6%) | 28 (82.4%) |
| Health Diagnosing & Treating | 35 (7.9%) | 406 (92.1%) |
| Health Technologists | 23 (10.8%) | 189 (89.1%) |
| Total (Category) | 859 (38.0%) | 1,399 (62.0%) |
| Total (Overall) | 4,270 (55.1%) | 3,482 (44.9%) |
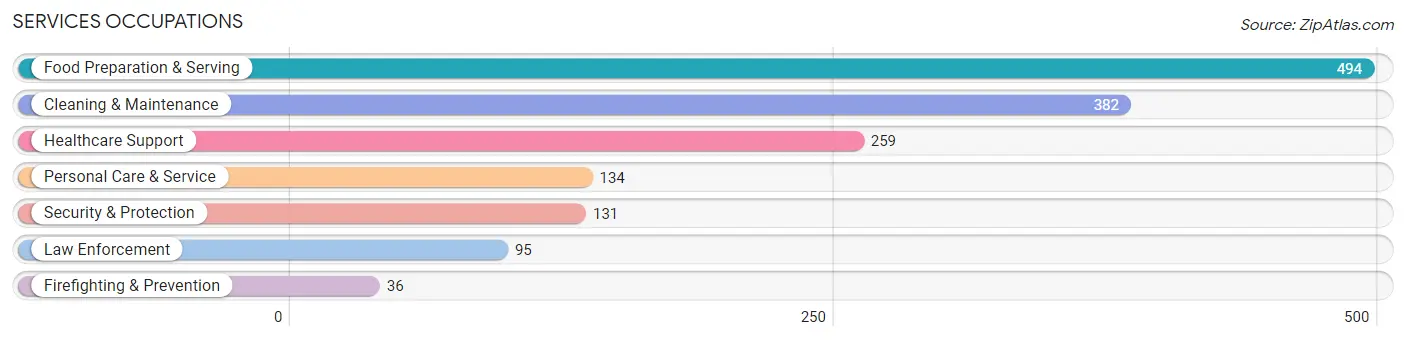
Services Occupations
The most common Services occupations in Fountain County are Food Preparation & Serving (494 | 6.4%), Cleaning & Maintenance (382 | 4.9%), Healthcare Support (259 | 3.3%), Personal Care & Service (134 | 1.7%), and Security & Protection (131 | 1.7%).
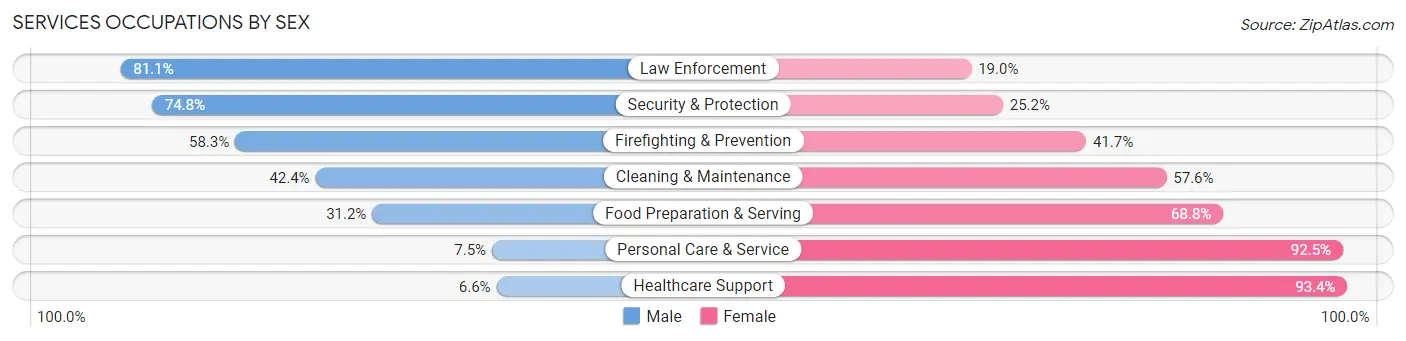
Services Occupations by Sex
Within the Services occupations in Fountain County, the most male-oriented occupations are Law Enforcement (81.0%), Security & Protection (74.8%), and Firefighting & Prevention (58.3%), while the most female-oriented occupations are Healthcare Support (93.4%), Personal Care & Service (92.5%), and Food Preparation & Serving (68.8%).
| Occupation | Male | Female |
| Healthcare Support | 17 (6.6%) | 242 (93.4%) |
| Security & Protection | 98 (74.8%) | 33 (25.2%) |
| Firefighting & Prevention | 21 (58.3%) | 15 (41.7%) |
| Law Enforcement | 77 (81.0%) | 18 (19.0%) |
| Food Preparation & Serving | 154 (31.2%) | 340 (68.8%) |
| Cleaning & Maintenance | 162 (42.4%) | 220 (57.6%) |
| Personal Care & Service | 10 (7.5%) | 124 (92.5%) |
| Total (Category) | 441 (31.5%) | 959 (68.5%) |
| Total (Overall) | 4,270 (55.1%) | 3,482 (44.9%) |
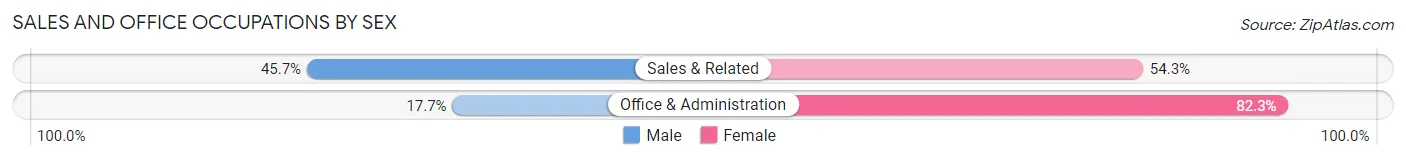
Sales and Office Occupations
The most common Sales and Office occupations in Fountain County are Office & Administration (604 | 7.8%), and Sales & Related (407 | 5.2%).

Sales and Office Occupations by Sex
| Occupation | Male | Female |
| Sales & Related | 186 (45.7%) | 221 (54.3%) |
| Office & Administration | 107 (17.7%) | 497 (82.3%) |
| Total (Category) | 293 (29.0%) | 718 (71.0%) |
| Total (Overall) | 4,270 (55.1%) | 3,482 (44.9%) |
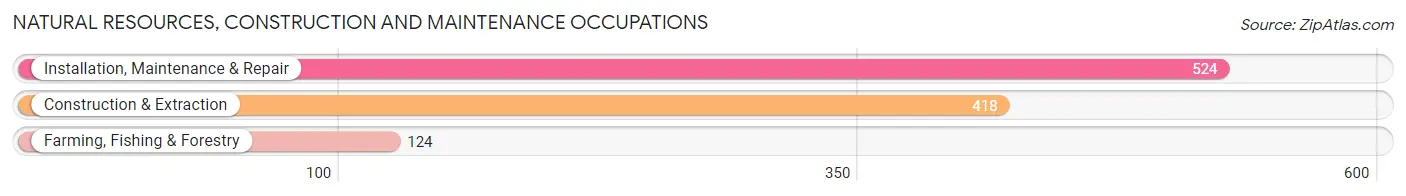
Natural Resources, Construction and Maintenance Occupations
The most common Natural Resources, Construction and Maintenance occupations in Fountain County are Installation, Maintenance & Repair (524 | 6.8%), Construction & Extraction (418 | 5.4%), and Farming, Fishing & Forestry (124 | 1.6%).
Natural Resources, Construction and Maintenance Occupations by Sex
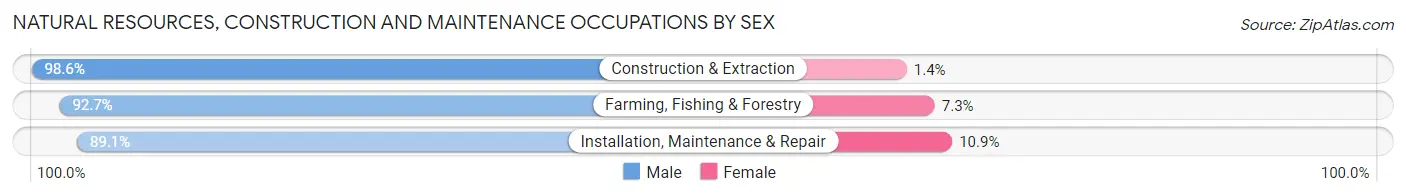
| Occupation | Male | Female |
| Farming, Fishing & Forestry | 115 (92.7%) | 9 (7.3%) |
| Construction & Extraction | 412 (98.6%) | 6 (1.4%) |
| Installation, Maintenance & Repair | 467 (89.1%) | 57 (10.9%) |
| Total (Category) | 994 (93.2%) | 72 (6.8%) |
| Total (Overall) | 4,270 (55.1%) | 3,482 (44.9%) |
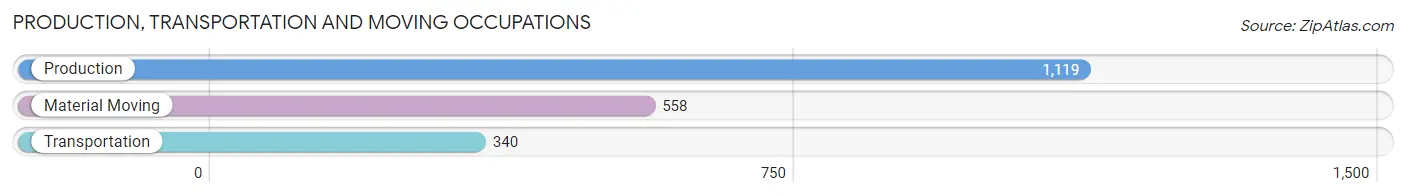
Production, Transportation and Moving Occupations
The most common Production, Transportation and Moving occupations in Fountain County are Production (1,119 | 14.4%), Material Moving (558 | 7.2%), and Transportation (340 | 4.4%).
Production, Transportation and Moving Occupations by Sex
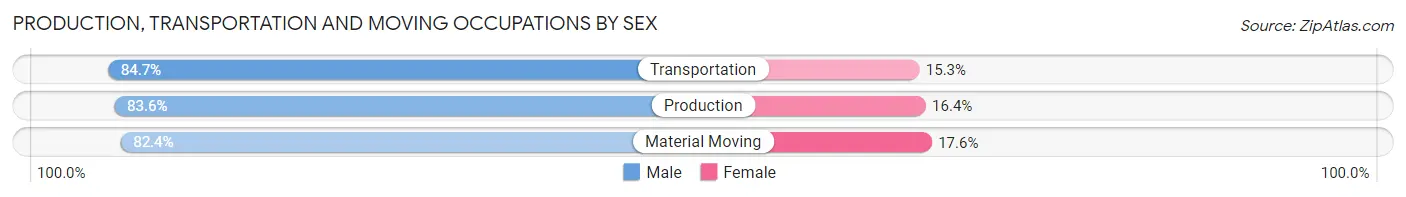
| Occupation | Male | Female |
| Production | 935 (83.6%) | 184 (16.4%) |
| Transportation | 288 (84.7%) | 52 (15.3%) |
| Material Moving | 460 (82.4%) | 98 (17.6%) |
| Total (Category) | 1,683 (83.4%) | 334 (16.6%) |
| Total (Overall) | 4,270 (55.1%) | 3,482 (44.9%) |
Employment Industries by Sex in Fountain County
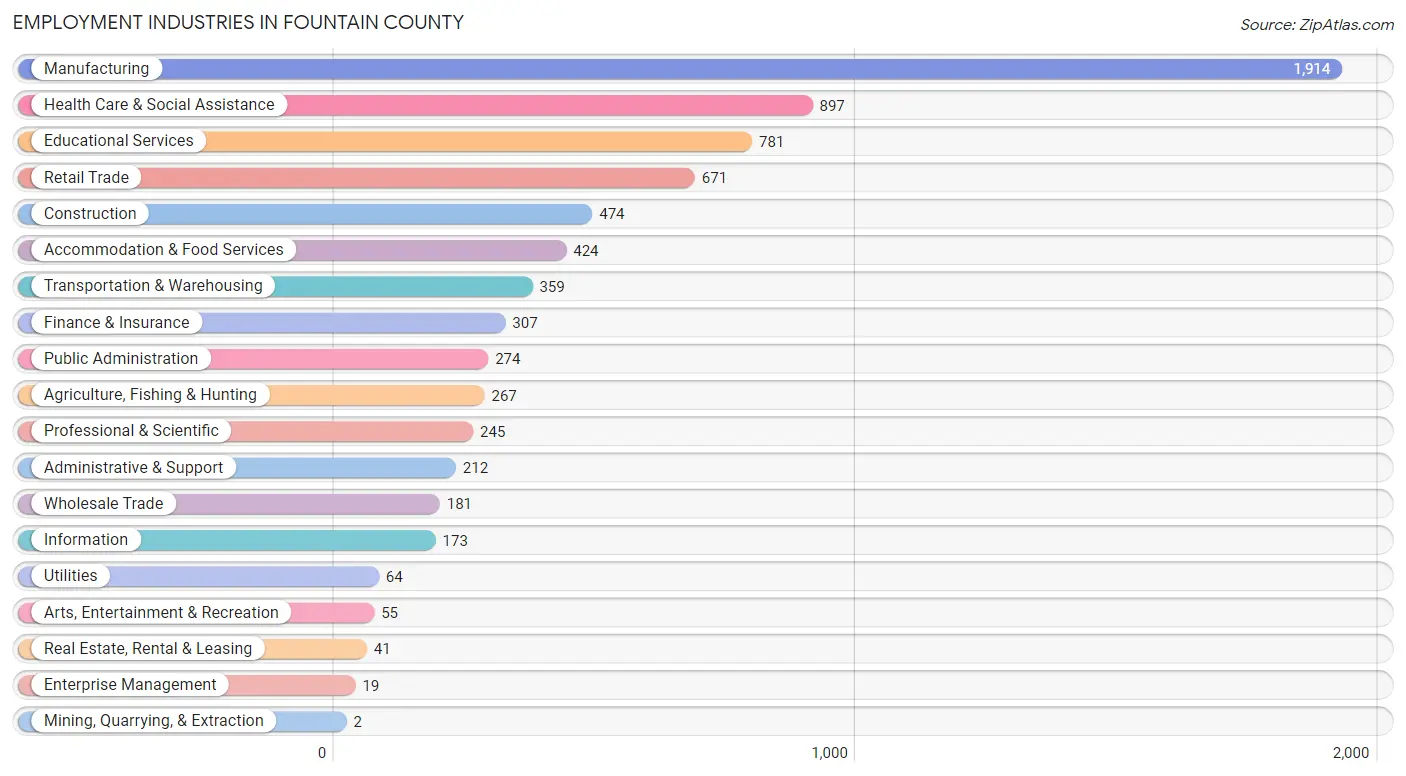
Employment Industries in Fountain County
The major employment industries in Fountain County include Manufacturing (1,914 | 24.7%), Health Care & Social Assistance (897 | 11.6%), Educational Services (781 | 10.1%), Retail Trade (671 | 8.7%), and Construction (474 | 6.1%).
Employment Industries by Sex in Fountain County
The Fountain County industries that see more men than women are Mining, Quarrying, & Extraction (100.0%), Enterprise Management (100.0%), and Wholesale Trade (97.8%), whereas the industries that tend to have a higher number of women are Health Care & Social Assistance (93.2%), Real Estate, Rental & Leasing (85.4%), and Finance & Insurance (75.2%).
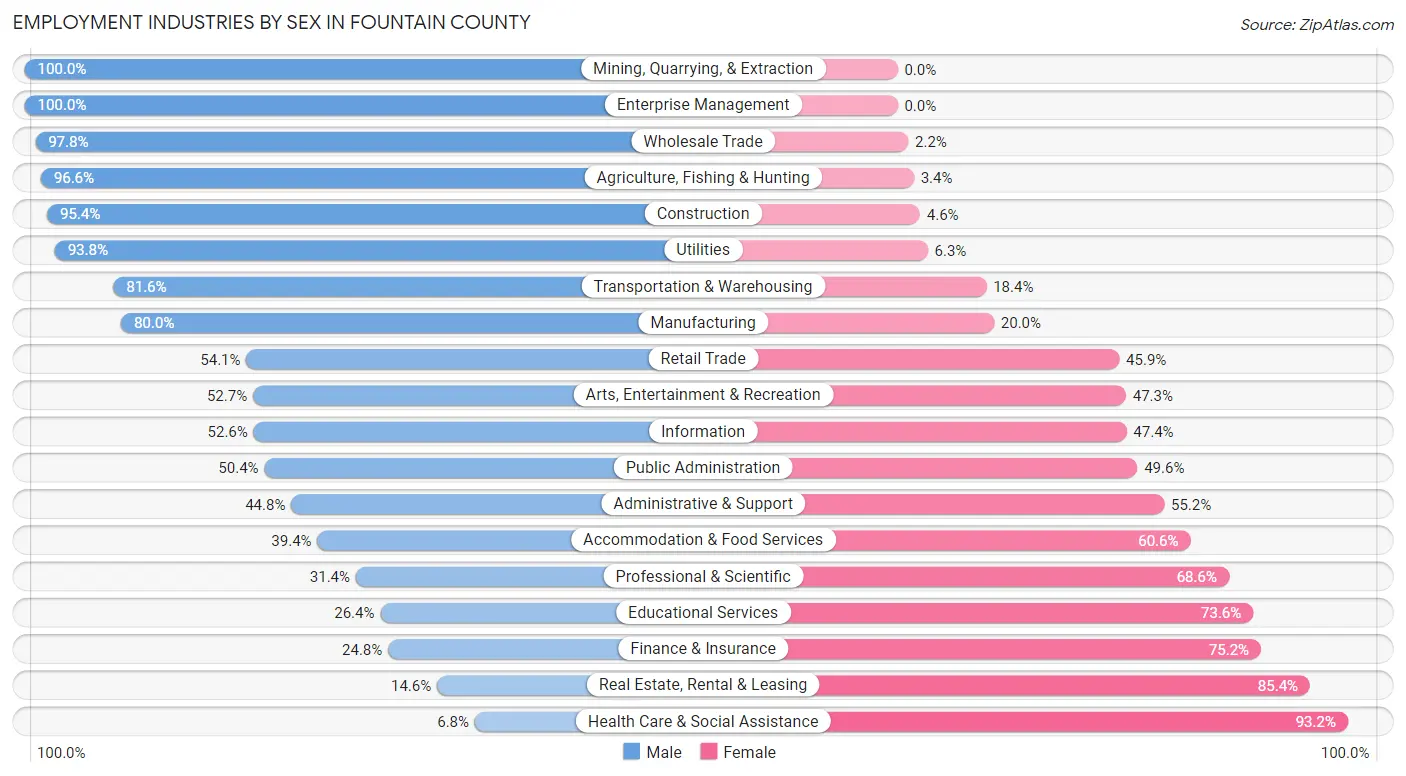
| Industry | Male | Female |
| Agriculture, Fishing & Hunting | 258 (96.6%) | 9 (3.4%) |
| Mining, Quarrying, & Extraction | 2 (100.0%) | 0 (0.0%) |
| Construction | 452 (95.4%) | 22 (4.6%) |
| Manufacturing | 1,532 (80.0%) | 382 (20.0%) |
| Wholesale Trade | 177 (97.8%) | 4 (2.2%) |
| Retail Trade | 363 (54.1%) | 308 (45.9%) |
| Transportation & Warehousing | 293 (81.6%) | 66 (18.4%) |
| Utilities | 60 (93.8%) | 4 (6.2%) |
| Information | 91 (52.6%) | 82 (47.4%) |
| Finance & Insurance | 76 (24.8%) | 231 (75.2%) |
| Real Estate, Rental & Leasing | 6 (14.6%) | 35 (85.4%) |
| Professional & Scientific | 77 (31.4%) | 168 (68.6%) |
| Enterprise Management | 19 (100.0%) | 0 (0.0%) |
| Administrative & Support | 95 (44.8%) | 117 (55.2%) |
| Educational Services | 206 (26.4%) | 575 (73.6%) |
| Health Care & Social Assistance | 61 (6.8%) | 836 (93.2%) |
| Arts, Entertainment & Recreation | 29 (52.7%) | 26 (47.3%) |
| Accommodation & Food Services | 167 (39.4%) | 257 (60.6%) |
| Public Administration | 138 (50.4%) | 136 (49.6%) |
| Total | 4,270 (55.1%) | 3,482 (44.9%) |
Education in Fountain County
School Enrollment in Fountain County
The most common levels of schooling among the 3,273 students in Fountain County are middle school (864 | 26.4%), high school (790 | 24.1%), and elementary school (682 | 20.8%).
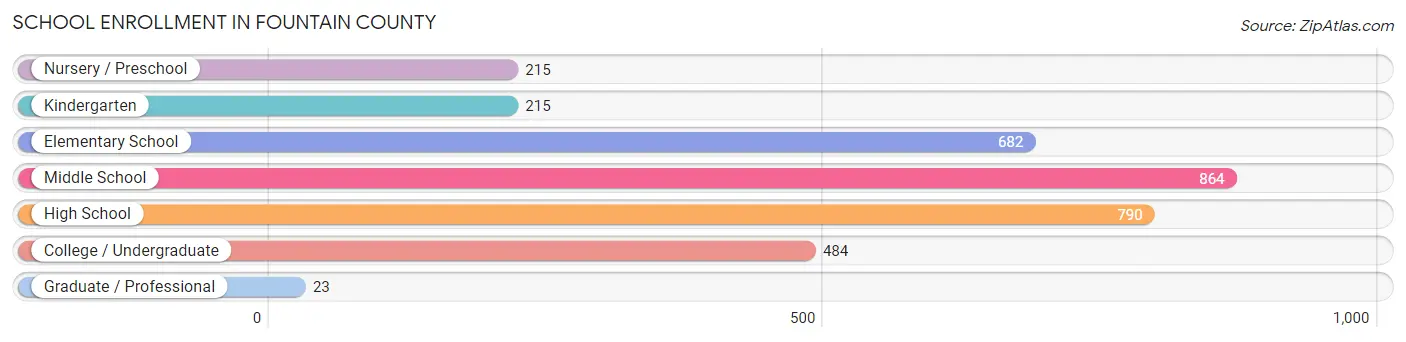
| School Level | # Students | % Students |
| Nursery / Preschool | 215 | 6.6% |
| Kindergarten | 215 | 6.6% |
| Elementary School | 682 | 20.8% |
| Middle School | 864 | 26.4% |
| High School | 790 | 24.1% |
| College / Undergraduate | 484 | 14.8% |
| Graduate / Professional | 23 | 0.7% |
| Total | 3,273 | 100.0% |
School Enrollment by Age by Funding Source in Fountain County
Out of a total of 3,273 students who are enrolled in schools in Fountain County, 301 (9.2%) attend a private institution, while the remaining 2,972 (90.8%) are enrolled in public schools. The age group of 3 to 4 year olds has the highest likelihood of being enrolled in private schools, with 39 (27.5% in the age bracket) enrolled. Conversely, the age group of 18 to 19 year olds has the lowest likelihood of being enrolled in a private school, with 215 (100.0% in the age bracket) attending a public institution.

| Age Bracket | Public School | Private School |
| 3 to 4 Year Olds | 103 (72.5%) | 39 (27.5%) |
| 5 to 9 Year Old | 662 (81.4%) | 151 (18.6%) |
| 10 to 14 Year Olds | 1,007 (94.4%) | 60 (5.6%) |
| 15 to 17 Year Olds | 593 (96.4%) | 22 (3.6%) |
| 18 to 19 Year Olds | 215 (100.0%) | 0 (0.0%) |
| 20 to 24 Year Olds | 144 (90.0%) | 16 (10.0%) |
| 25 to 34 Year Olds | 160 (100.0%) | 0 (0.0%) |
| 35 Years and over | 88 (87.1%) | 13 (12.9%) |
| Total | 2,972 (90.8%) | 301 (9.2%) |
Educational Attainment by Field of Study in Fountain County
Education (470 | 29.1%), business (224 | 13.9%), science & technology (183 | 11.3%), liberal arts & history (156 | 9.7%), and arts & humanities (149 | 9.2%) are the most common fields of study among 1,614 individuals in Fountain County who have obtained a bachelor's degree or higher.
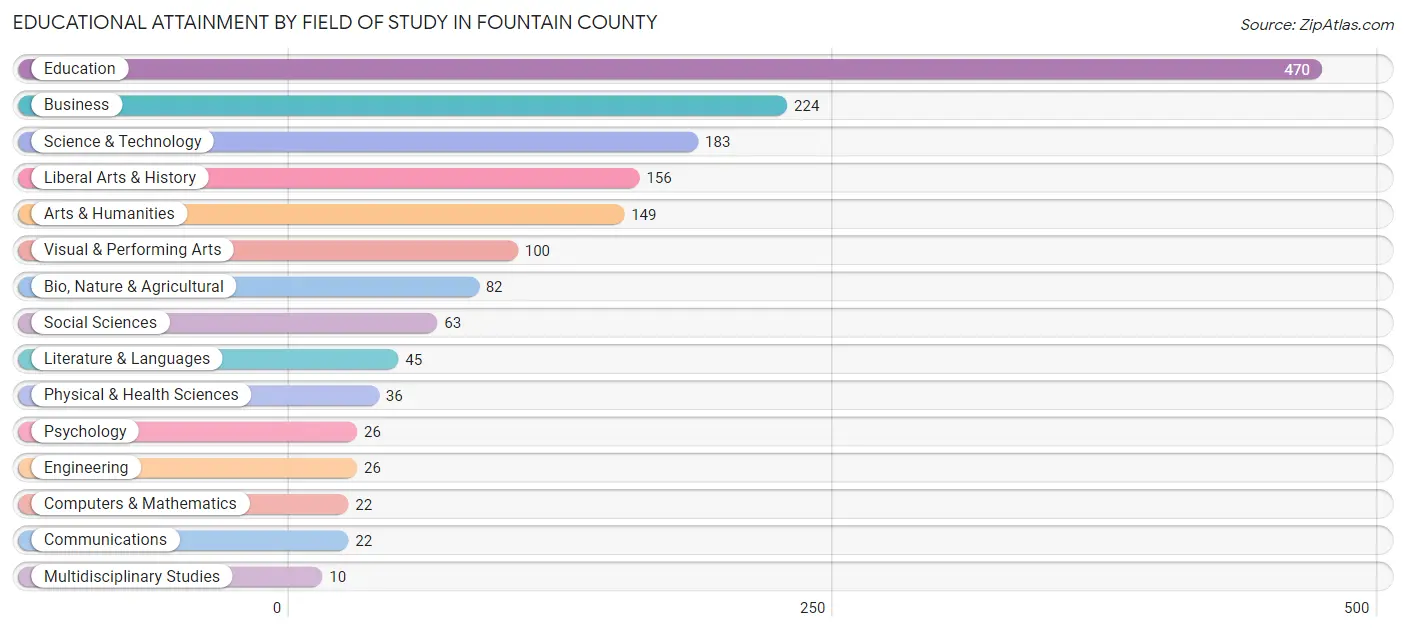
| Field of Study | # Graduates | % Graduates |
| Computers & Mathematics | 22 | 1.4% |
| Bio, Nature & Agricultural | 82 | 5.1% |
| Physical & Health Sciences | 36 | 2.2% |
| Psychology | 26 | 1.6% |
| Social Sciences | 63 | 3.9% |
| Engineering | 26 | 1.6% |
| Multidisciplinary Studies | 10 | 0.6% |
| Science & Technology | 183 | 11.3% |
| Business | 224 | 13.9% |
| Education | 470 | 29.1% |
| Literature & Languages | 45 | 2.8% |
| Liberal Arts & History | 156 | 9.7% |
| Visual & Performing Arts | 100 | 6.2% |
| Communications | 22 | 1.4% |
| Arts & Humanities | 149 | 9.2% |
| Total | 1,614 | 100.0% |
Transportation & Commute in Fountain County
Vehicle Availability by Sex in Fountain County
The most prevalent vehicle ownership categories in Fountain County are males with 2 vehicles (1,587, accounting for 38.7%) and females with 2 vehicles (1,341, making up 46.3%).
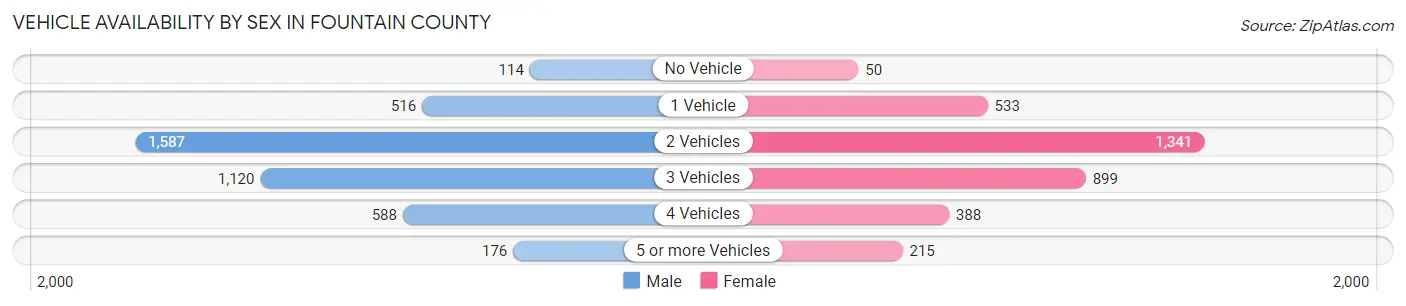
| Vehicles Available | Male | Female |
| No Vehicle | 114 (2.8%) | 50 (1.5%) |
| 1 Vehicle | 516 (12.6%) | 533 (15.6%) |
| 2 Vehicles | 1,587 (38.7%) | 1,341 (39.1%) |
| 3 Vehicles | 1,120 (27.3%) | 899 (26.2%) |
| 4 Vehicles | 588 (14.3%) | 388 (11.3%) |
| 5 or more Vehicles | 176 (4.3%) | 215 (6.3%) |
| Total | 4,101 (100.0%) | 3,426 (100.0%) |
Commute Time in Fountain County
The most frequently occuring commute durations in Fountain County are 5 to 9 minutes (997 commuters, 14.0%), 30 to 34 minutes (985 commuters, 13.8%), and 15 to 19 minutes (891 commuters, 12.5%).
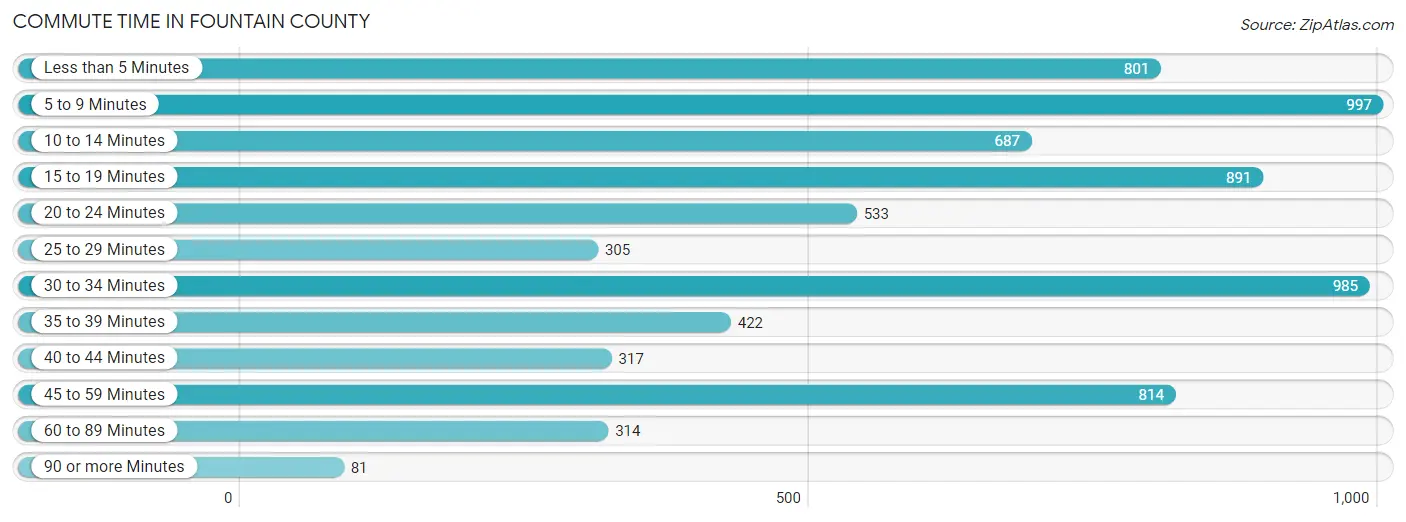
| Commute Time | # Commuters | % Commuters |
| Less than 5 Minutes | 801 | 11.2% |
| 5 to 9 Minutes | 997 | 14.0% |
| 10 to 14 Minutes | 687 | 9.6% |
| 15 to 19 Minutes | 891 | 12.5% |
| 20 to 24 Minutes | 533 | 7.5% |
| 25 to 29 Minutes | 305 | 4.3% |
| 30 to 34 Minutes | 985 | 13.8% |
| 35 to 39 Minutes | 422 | 5.9% |
| 40 to 44 Minutes | 317 | 4.4% |
| 45 to 59 Minutes | 814 | 11.4% |
| 60 to 89 Minutes | 314 | 4.4% |
| 90 or more Minutes | 81 | 1.1% |
Commute Time by Sex in Fountain County
The most common commute times in Fountain County are 30 to 34 minutes (581 commuters, 14.6%) for males and 5 to 9 minutes (548 commuters, 17.3%) for females.
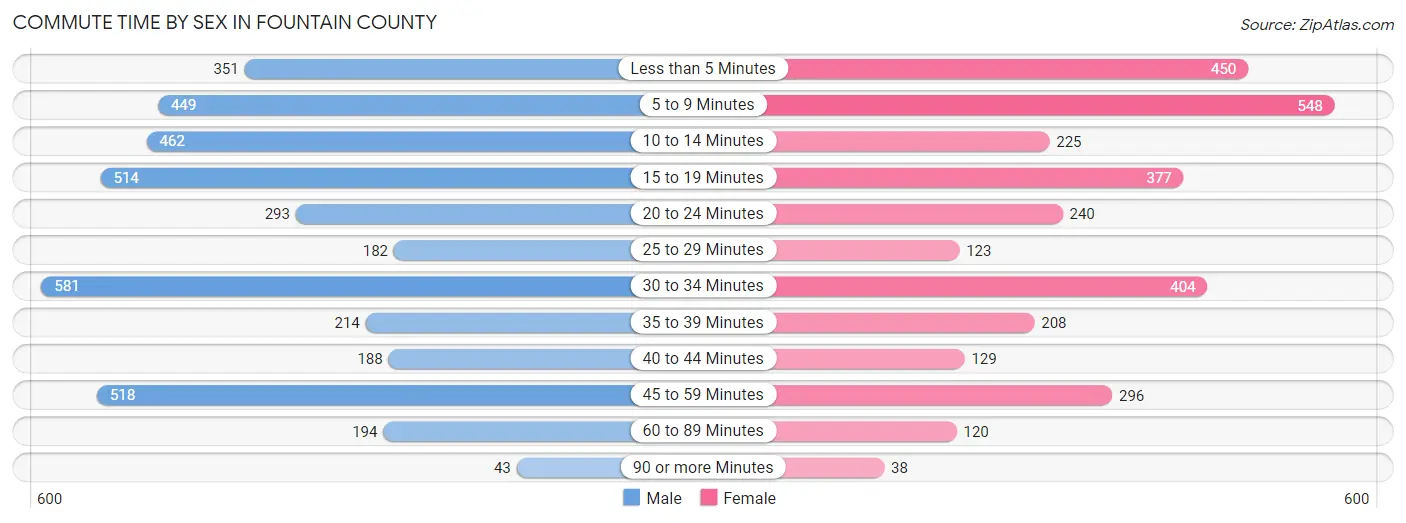
| Commute Time | Male | Female |
| Less than 5 Minutes | 351 (8.8%) | 450 (14.2%) |
| 5 to 9 Minutes | 449 (11.3%) | 548 (17.3%) |
| 10 to 14 Minutes | 462 (11.6%) | 225 (7.1%) |
| 15 to 19 Minutes | 514 (12.9%) | 377 (11.9%) |
| 20 to 24 Minutes | 293 (7.3%) | 240 (7.6%) |
| 25 to 29 Minutes | 182 (4.6%) | 123 (3.9%) |
| 30 to 34 Minutes | 581 (14.6%) | 404 (12.8%) |
| 35 to 39 Minutes | 214 (5.4%) | 208 (6.6%) |
| 40 to 44 Minutes | 188 (4.7%) | 129 (4.1%) |
| 45 to 59 Minutes | 518 (13.0%) | 296 (9.4%) |
| 60 to 89 Minutes | 194 (4.9%) | 120 (3.8%) |
| 90 or more Minutes | 43 (1.1%) | 38 (1.2%) |
Time of Departure to Work by Sex in Fountain County
The most frequent times of departure to work in Fountain County are 6:00 AM to 6:29 AM (539, 13.5%) for males and 7:00 AM to 7:29 AM (532, 16.9%) for females.
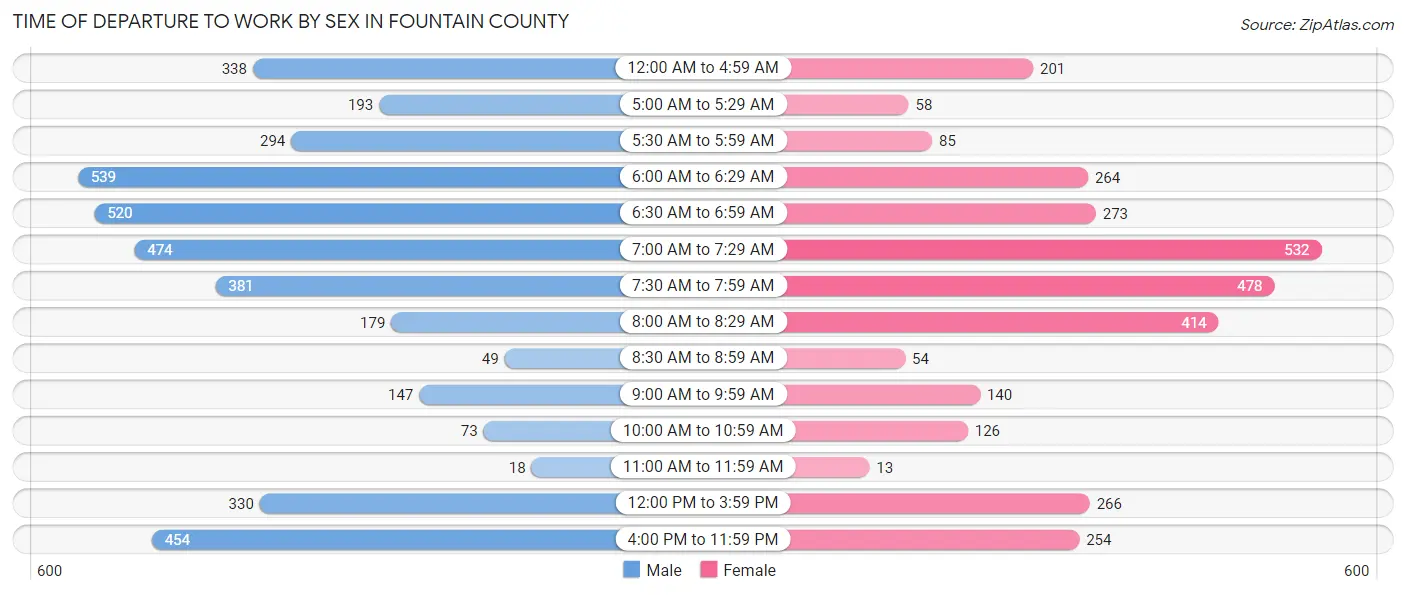
| Time of Departure | Male | Female |
| 12:00 AM to 4:59 AM | 338 (8.5%) | 201 (6.4%) |
| 5:00 AM to 5:29 AM | 193 (4.8%) | 58 (1.8%) |
| 5:30 AM to 5:59 AM | 294 (7.4%) | 85 (2.7%) |
| 6:00 AM to 6:29 AM | 539 (13.5%) | 264 (8.4%) |
| 6:30 AM to 6:59 AM | 520 (13.0%) | 273 (8.6%) |
| 7:00 AM to 7:29 AM | 474 (11.9%) | 532 (16.9%) |
| 7:30 AM to 7:59 AM | 381 (9.6%) | 478 (15.1%) |
| 8:00 AM to 8:29 AM | 179 (4.5%) | 414 (13.1%) |
| 8:30 AM to 8:59 AM | 49 (1.2%) | 54 (1.7%) |
| 9:00 AM to 9:59 AM | 147 (3.7%) | 140 (4.4%) |
| 10:00 AM to 10:59 AM | 73 (1.8%) | 126 (4.0%) |
| 11:00 AM to 11:59 AM | 18 (0.4%) | 13 (0.4%) |
| 12:00 PM to 3:59 PM | 330 (8.3%) | 266 (8.4%) |
| 4:00 PM to 11:59 PM | 454 (11.4%) | 254 (8.0%) |
| Total | 3,989 (100.0%) | 3,158 (100.0%) |
Housing Occupancy in Fountain County
Occupancy by Ownership in Fountain County
Of the total 6,820 dwellings in Fountain County, owner-occupied units account for 5,062 (74.2%), while renter-occupied units make up 1,758 (25.8%).
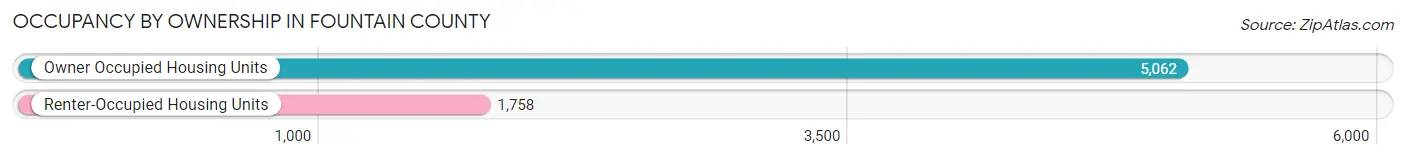
| Occupancy | # Housing Units | % Housing Units |
| Owner Occupied Housing Units | 5,062 | 74.2% |
| Renter-Occupied Housing Units | 1,758 | 25.8% |
| Total Occupied Housing Units | 6,820 | 100.0% |
Occupancy by Household Size in Fountain County
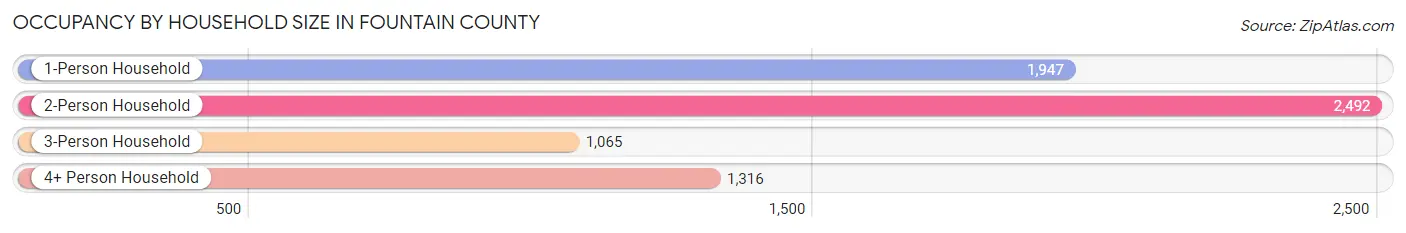
| Household Size | # Housing Units | % Housing Units |
| 1-Person Household | 1,947 | 28.5% |
| 2-Person Household | 2,492 | 36.5% |
| 3-Person Household | 1,065 | 15.6% |
| 4+ Person Household | 1,316 | 19.3% |
| Total Housing Units | 6,820 | 100.0% |
Occupancy by Ownership by Household Size in Fountain County
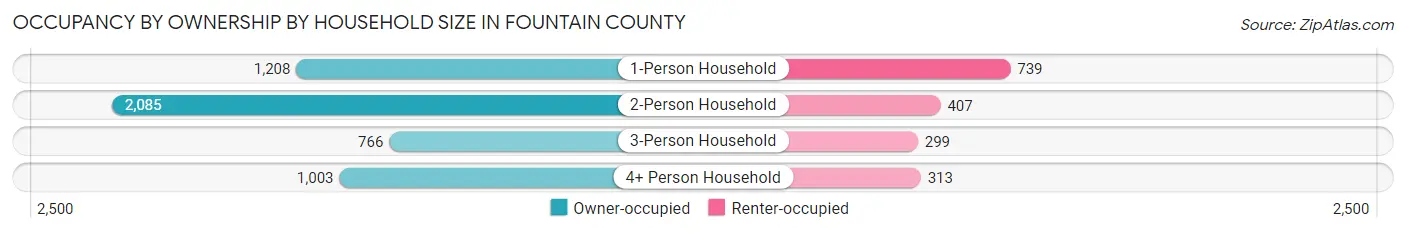
| Household Size | Owner-occupied | Renter-occupied |
| 1-Person Household | 1,208 (62.0%) | 739 (38.0%) |
| 2-Person Household | 2,085 (83.7%) | 407 (16.3%) |
| 3-Person Household | 766 (71.9%) | 299 (28.1%) |
| 4+ Person Household | 1,003 (76.2%) | 313 (23.8%) |
| Total Housing Units | 5,062 (74.2%) | 1,758 (25.8%) |
Occupancy by Educational Attainment in Fountain County
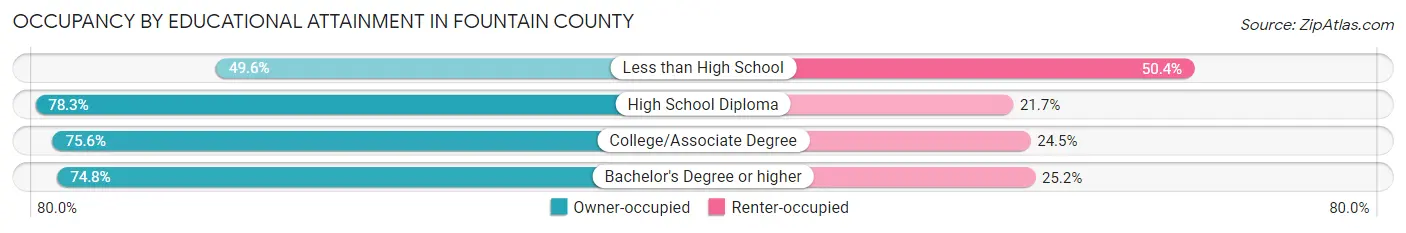
| Household Size | Owner-occupied | Renter-occupied |
| Less than High School | 319 (49.6%) | 324 (50.4%) |
| High School Diploma | 2,378 (78.3%) | 659 (21.7%) |
| College/Associate Degree | 1,635 (75.5%) | 529 (24.4%) |
| Bachelor's Degree or higher | 730 (74.8%) | 246 (25.2%) |
Occupancy by Age of Householder in Fountain County
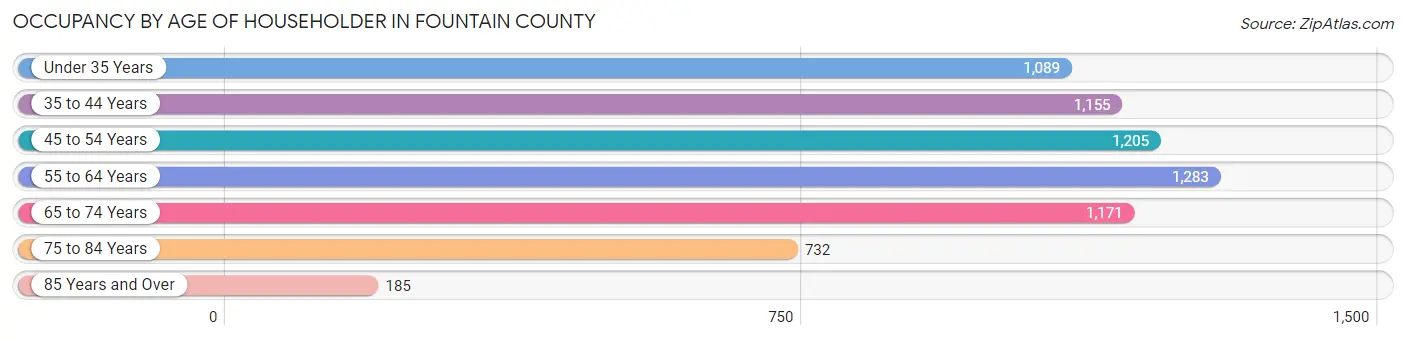
| Age Bracket | # Households | % Households |
| Under 35 Years | 1,089 | 16.0% |
| 35 to 44 Years | 1,155 | 16.9% |
| 45 to 54 Years | 1,205 | 17.7% |
| 55 to 64 Years | 1,283 | 18.8% |
| 65 to 74 Years | 1,171 | 17.2% |
| 75 to 84 Years | 732 | 10.7% |
| 85 Years and Over | 185 | 2.7% |
| Total | 6,820 | 100.0% |
Housing Finances in Fountain County
Median Income by Occupancy in Fountain County
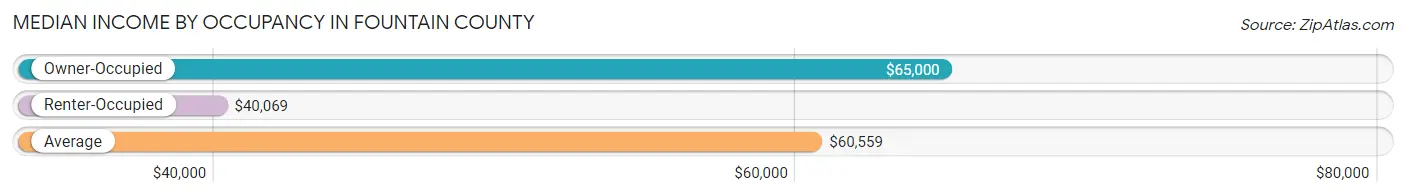
| Occupancy Type | # Households | Median Income |
| Owner-Occupied | 5,062 (74.2%) | $65,000 |
| Renter-Occupied | 1,758 (25.8%) | $40,069 |
| Average | 6,820 (100.0%) | $60,559 |
Occupancy by Householder Income Bracket in Fountain County
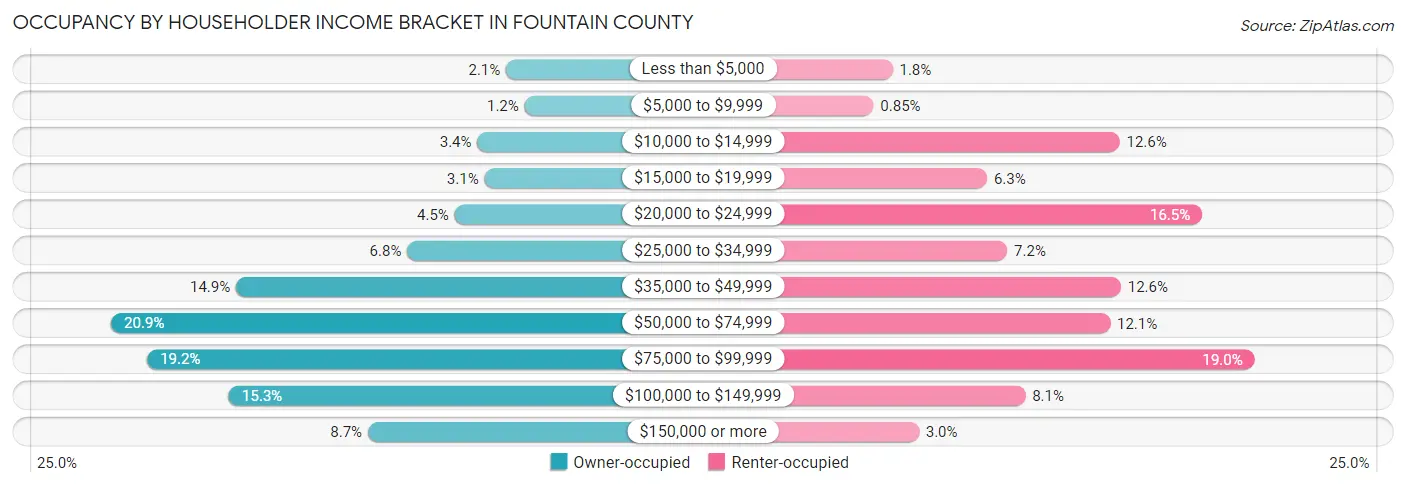
| Income Bracket | Owner-occupied | Renter-occupied |
| Less than $5,000 | 105 (2.1%) | 31 (1.8%) |
| $5,000 to $9,999 | 60 (1.2%) | 15 (0.9%) |
| $10,000 to $14,999 | 174 (3.4%) | 221 (12.6%) |
| $15,000 to $19,999 | 157 (3.1%) | 110 (6.3%) |
| $20,000 to $24,999 | 229 (4.5%) | 290 (16.5%) |
| $25,000 to $34,999 | 343 (6.8%) | 127 (7.2%) |
| $35,000 to $49,999 | 756 (14.9%) | 222 (12.6%) |
| $50,000 to $74,999 | 1,057 (20.9%) | 213 (12.1%) |
| $75,000 to $99,999 | 970 (19.2%) | 334 (19.0%) |
| $100,000 to $149,999 | 773 (15.3%) | 142 (8.1%) |
| $150,000 or more | 438 (8.6%) | 53 (3.0%) |
| Total | 5,062 (100.0%) | 1,758 (100.0%) |
Monthly Housing Cost Tiers in Fountain County
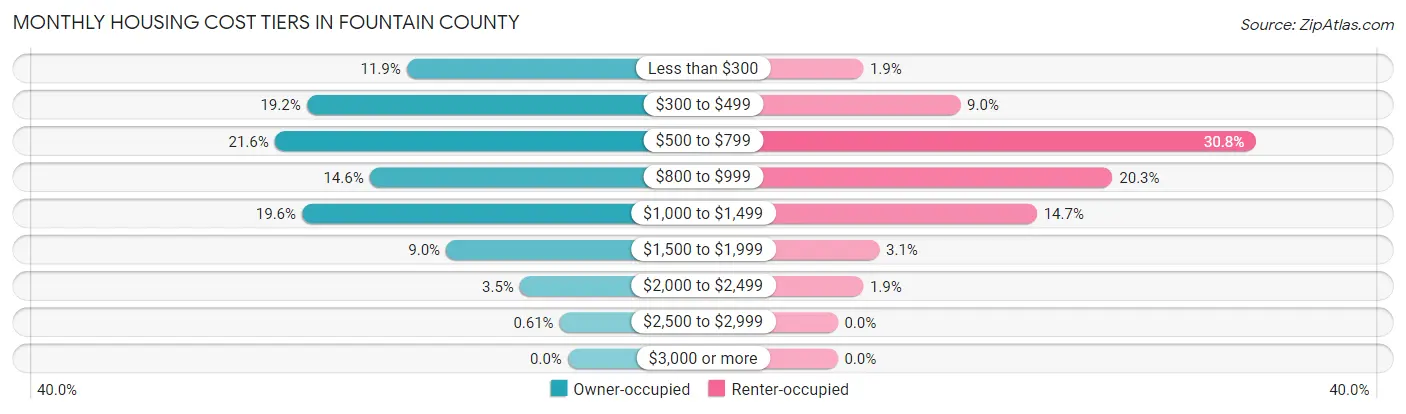
| Monthly Cost | Owner-occupied | Renter-occupied |
| Less than $300 | 601 (11.9%) | 33 (1.9%) |
| $300 to $499 | 974 (19.2%) | 159 (9.0%) |
| $500 to $799 | 1,093 (21.6%) | 542 (30.8%) |
| $800 to $999 | 739 (14.6%) | 356 (20.3%) |
| $1,000 to $1,499 | 991 (19.6%) | 258 (14.7%) |
| $1,500 to $1,999 | 454 (9.0%) | 54 (3.1%) |
| $2,000 to $2,499 | 179 (3.5%) | 33 (1.9%) |
| $2,500 to $2,999 | 31 (0.6%) | 0 (0.0%) |
| $3,000 or more | 0 (0.0%) | 0 (0.0%) |
| Total | 5,062 (100.0%) | 1,758 (100.0%) |
Physical Housing Characteristics in Fountain County
Housing Structures in Fountain County
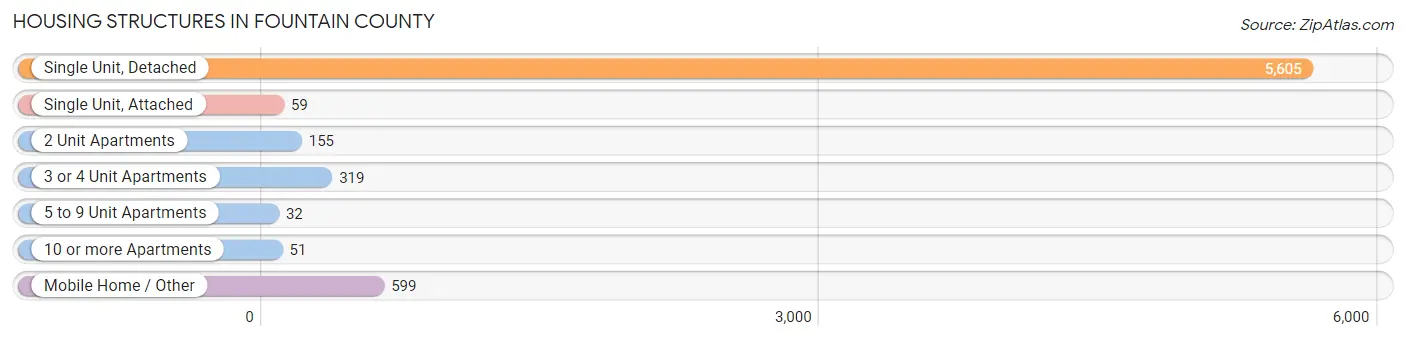
| Structure Type | # Housing Units | % Housing Units |
| Single Unit, Detached | 5,605 | 82.2% |
| Single Unit, Attached | 59 | 0.9% |
| 2 Unit Apartments | 155 | 2.3% |
| 3 or 4 Unit Apartments | 319 | 4.7% |
| 5 to 9 Unit Apartments | 32 | 0.5% |
| 10 or more Apartments | 51 | 0.7% |
| Mobile Home / Other | 599 | 8.8% |
| Total | 6,820 | 100.0% |
Housing Structures by Occupancy in Fountain County
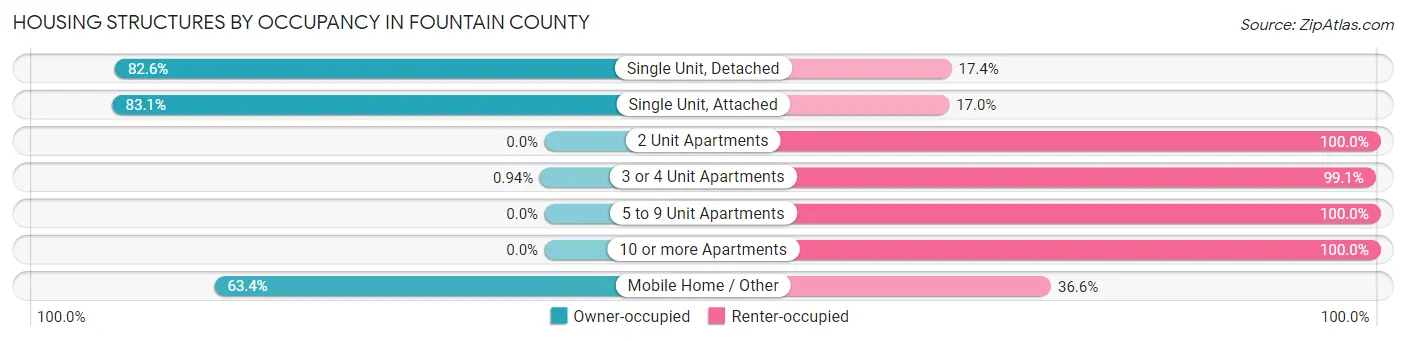
| Structure Type | Owner-occupied | Renter-occupied |
| Single Unit, Detached | 4,630 (82.6%) | 975 (17.4%) |
| Single Unit, Attached | 49 (83.1%) | 10 (17.0%) |
| 2 Unit Apartments | 0 (0.0%) | 155 (100.0%) |
| 3 or 4 Unit Apartments | 3 (0.9%) | 316 (99.1%) |
| 5 to 9 Unit Apartments | 0 (0.0%) | 32 (100.0%) |
| 10 or more Apartments | 0 (0.0%) | 51 (100.0%) |
| Mobile Home / Other | 380 (63.4%) | 219 (36.6%) |
| Total | 5,062 (74.2%) | 1,758 (25.8%) |
Housing Structures by Number of Rooms in Fountain County
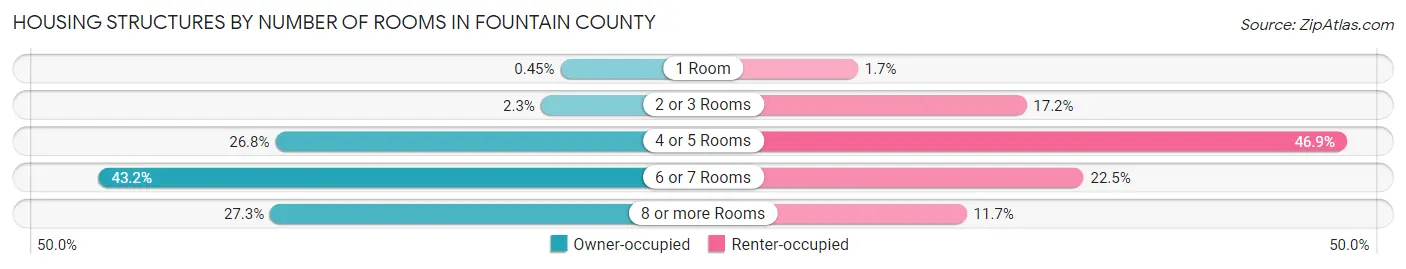
| Number of Rooms | Owner-occupied | Renter-occupied |
| 1 Room | 23 (0.4%) | 29 (1.7%) |
| 2 or 3 Rooms | 115 (2.3%) | 303 (17.2%) |
| 4 or 5 Rooms | 1,357 (26.8%) | 824 (46.9%) |
| 6 or 7 Rooms | 2,185 (43.2%) | 396 (22.5%) |
| 8 or more Rooms | 1,382 (27.3%) | 206 (11.7%) |
| Total | 5,062 (100.0%) | 1,758 (100.0%) |
Housing Structure by Heating Type in Fountain County
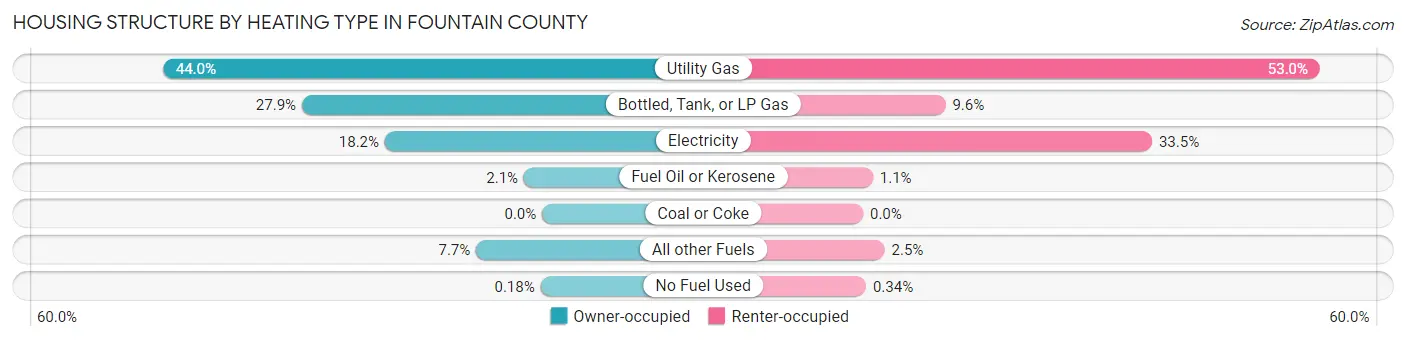
| Heating Type | Owner-occupied | Renter-occupied |
| Utility Gas | 2,226 (44.0%) | 931 (53.0%) |
| Bottled, Tank, or LP Gas | 1,410 (27.9%) | 168 (9.6%) |
| Electricity | 923 (18.2%) | 589 (33.5%) |
| Fuel Oil or Kerosene | 107 (2.1%) | 20 (1.1%) |
| Coal or Coke | 0 (0.0%) | 0 (0.0%) |
| All other Fuels | 387 (7.6%) | 44 (2.5%) |
| No Fuel Used | 9 (0.2%) | 6 (0.3%) |
| Total | 5,062 (100.0%) | 1,758 (100.0%) |
Household Vehicle Usage in Fountain County
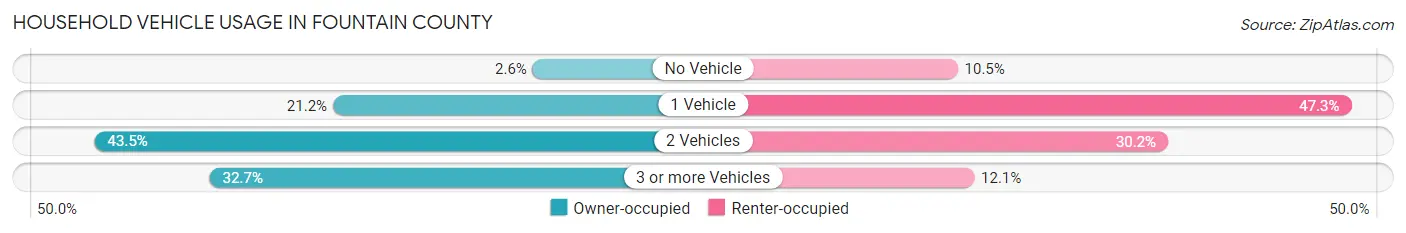
| Vehicles per Household | Owner-occupied | Renter-occupied |
| No Vehicle | 130 (2.6%) | 185 (10.5%) |
| 1 Vehicle | 1,074 (21.2%) | 831 (47.3%) |
| 2 Vehicles | 2,201 (43.5%) | 530 (30.1%) |
| 3 or more Vehicles | 1,657 (32.7%) | 212 (12.1%) |
| Total | 5,062 (100.0%) | 1,758 (100.0%) |
Real Estate & Mortgages in Fountain County
Real Estate and Mortgage Overview in Fountain County
| Characteristic | Without Mortgage | With Mortgage |
| Housing Units | 2,187 | 2,875 |
| Median Property Value | $108,300 | $137,900 |
| Median Household Income | $53,783 | $308 |
| Monthly Housing Costs | $395 | $0 |
| Real Estate Taxes | $588 | $45 |
Property Value by Mortgage Status in Fountain County
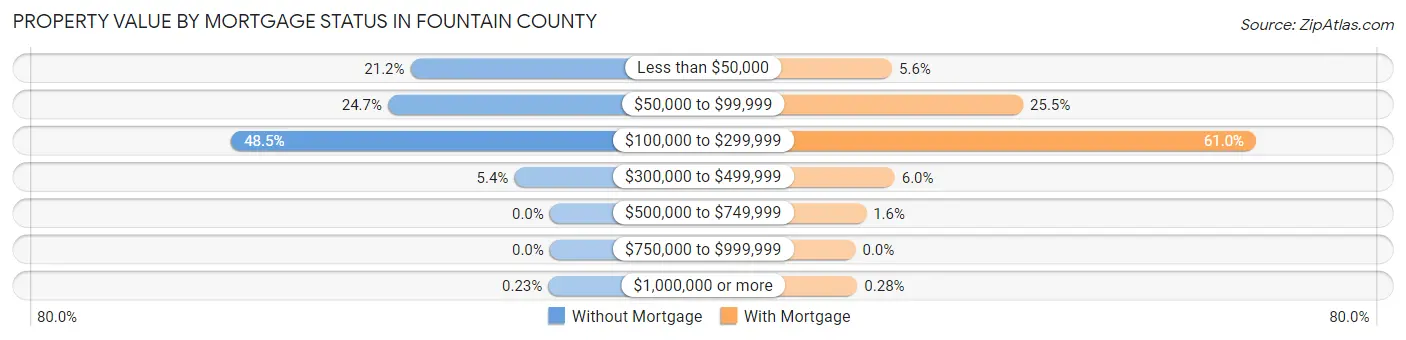
| Property Value | Without Mortgage | With Mortgage |
| Less than $50,000 | 464 (21.2%) | 160 (5.6%) |
| $50,000 to $99,999 | 539 (24.6%) | 734 (25.5%) |
| $100,000 to $299,999 | 1,061 (48.5%) | 1,754 (61.0%) |
| $300,000 to $499,999 | 118 (5.4%) | 172 (6.0%) |
| $500,000 to $749,999 | 0 (0.0%) | 47 (1.6%) |
| $750,000 to $999,999 | 0 (0.0%) | 0 (0.0%) |
| $1,000,000 or more | 5 (0.2%) | 8 (0.3%) |
| Total | 2,187 (100.0%) | 2,875 (100.0%) |
Household Income by Mortgage Status in Fountain County
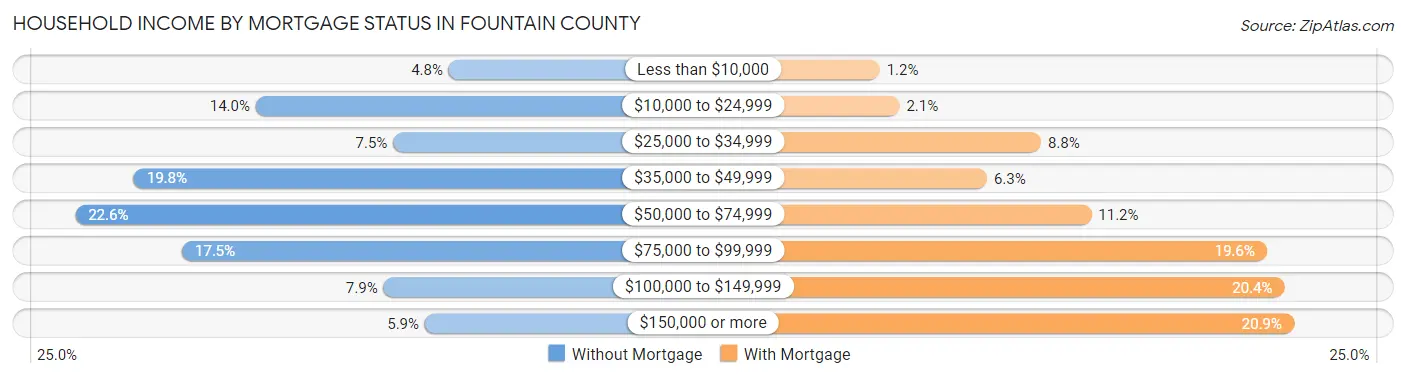
| Household Income | Without Mortgage | With Mortgage |
| Less than $10,000 | 105 (4.8%) | 33 (1.1%) |
| $10,000 to $24,999 | 306 (14.0%) | 60 (2.1%) |
| $25,000 to $34,999 | 163 (7.4%) | 254 (8.8%) |
| $35,000 to $49,999 | 433 (19.8%) | 180 (6.3%) |
| $50,000 to $74,999 | 494 (22.6%) | 323 (11.2%) |
| $75,000 to $99,999 | 383 (17.5%) | 563 (19.6%) |
| $100,000 to $149,999 | 173 (7.9%) | 587 (20.4%) |
| $150,000 or more | 130 (5.9%) | 600 (20.9%) |
| Total | 2,187 (100.0%) | 2,875 (100.0%) |
Property Value to Household Income Ratio in Fountain County

| Value-to-Income Ratio | Without Mortgage | With Mortgage |
| Less than 2.0x | 1,142 (52.2%) | 77,587 (2,698.7%) |
| 2.0x to 2.9x | 387 (17.7%) | 1,503 (52.3%) |
| 3.0x to 3.9x | 266 (12.2%) | 602 (20.9%) |
| 4.0x or more | 367 (16.8%) | 273 (9.5%) |
| Total | 2,187 (100.0%) | 2,875 (100.0%) |
Real Estate Taxes by Mortgage Status in Fountain County
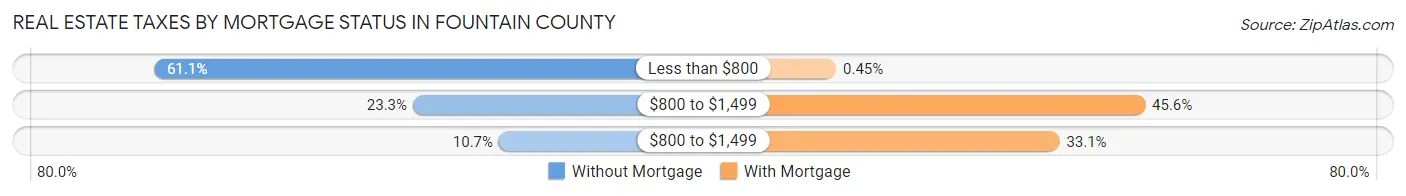
| Property Taxes | Without Mortgage | With Mortgage |
| Less than $800 | 1,336 (61.1%) | 13 (0.4%) |
| $800 to $1,499 | 509 (23.3%) | 1,311 (45.6%) |
| $800 to $1,499 | 234 (10.7%) | 951 (33.1%) |
| Total | 2,187 (100.0%) | 2,875 (100.0%) |
Health & Disability in Fountain County
Health Insurance Coverage by Age in Fountain County
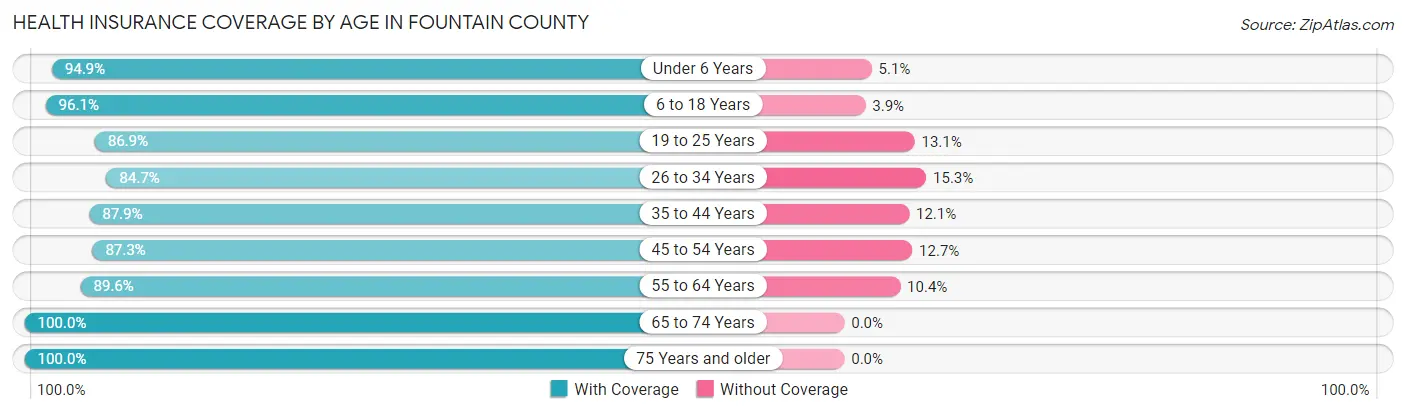
| Age Bracket | With Coverage | Without Coverage |
| Under 6 Years | 1,118 (94.9%) | 60 (5.1%) |
| 6 to 18 Years | 2,445 (96.1%) | 100 (3.9%) |
| 19 to 25 Years | 1,121 (86.9%) | 169 (13.1%) |
| 26 to 34 Years | 1,511 (84.7%) | 272 (15.3%) |
| 35 to 44 Years | 1,610 (87.9%) | 221 (12.1%) |
| 45 to 54 Years | 1,891 (87.3%) | 274 (12.7%) |
| 55 to 64 Years | 2,140 (89.6%) | 249 (10.4%) |
| 65 to 74 Years | 1,818 (100.0%) | 0 (0.0%) |
| 75 Years and older | 1,351 (100.0%) | 0 (0.0%) |
| Total | 15,005 (91.8%) | 1,345 (8.2%) |
Health Insurance Coverage by Citizenship Status in Fountain County
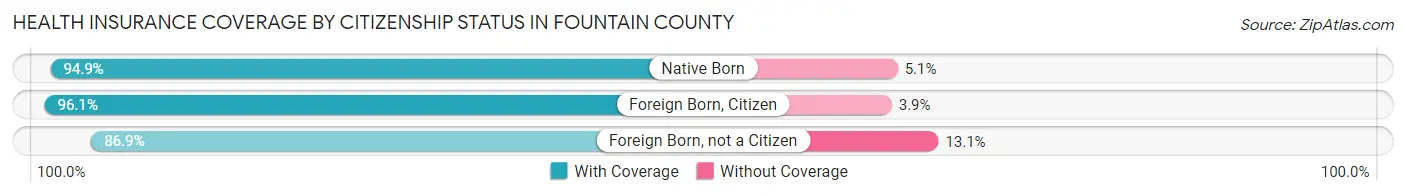
| Citizenship Status | With Coverage | Without Coverage |
| Native Born | 1,118 (94.9%) | 60 (5.1%) |
| Foreign Born, Citizen | 2,445 (96.1%) | 100 (3.9%) |
| Foreign Born, not a Citizen | 1,121 (86.9%) | 169 (13.1%) |
Health Insurance Coverage by Household Income in Fountain County
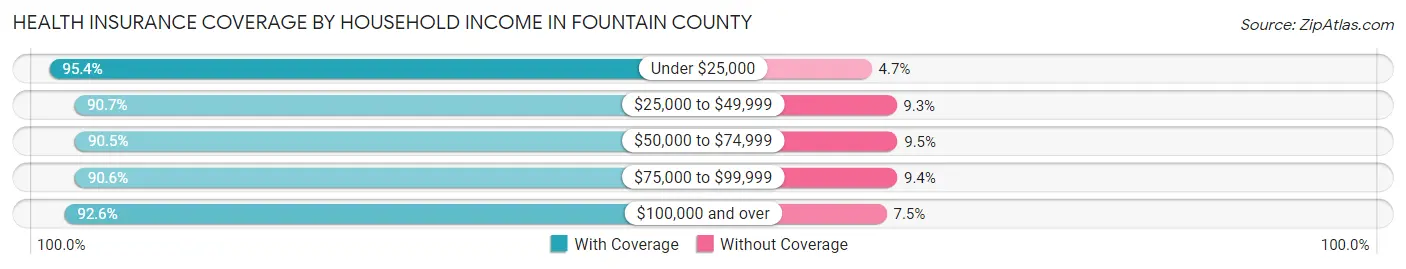
| Household Income | With Coverage | Without Coverage |
| Under $25,000 | 2,051 (95.4%) | 100 (4.6%) |
| $25,000 to $49,999 | 2,618 (90.7%) | 268 (9.3%) |
| $50,000 to $74,999 | 2,727 (90.5%) | 285 (9.5%) |
| $75,000 to $99,999 | 3,352 (90.6%) | 348 (9.4%) |
| $100,000 and over | 4,251 (92.5%) | 342 (7.4%) |
Public vs Private Health Insurance Coverage by Age in Fountain County

| Age Bracket | Public Insurance | Private Insurance |
| Under 6 | 468 (39.7%) | 697 (59.2%) |
| 6 to 18 Years | 848 (33.3%) | 1,720 (67.6%) |
| 19 to 25 Years | 277 (21.5%) | 877 (68.0%) |
| 25 to 34 Years | 356 (20.0%) | 1,197 (67.1%) |
| 35 to 44 Years | 199 (10.9%) | 1,470 (80.3%) |
| 45 to 54 Years | 387 (17.9%) | 1,602 (74.0%) |
| 55 to 64 Years | 629 (26.3%) | 1,629 (68.2%) |
| 65 to 74 Years | 1,800 (99.0%) | 956 (52.6%) |
| 75 Years and over | 1,338 (99.0%) | 1,021 (75.6%) |
| Total | 6,302 (38.5%) | 11,169 (68.3%) |
Disability Status by Sex by Age in Fountain County
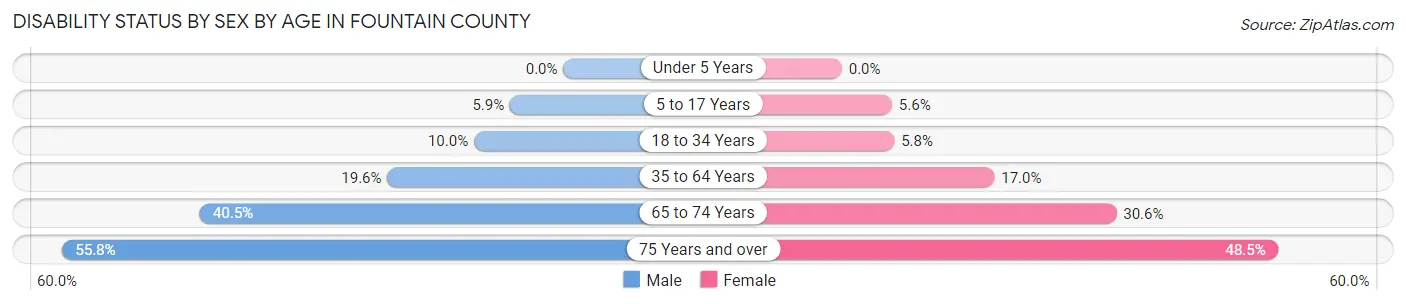
| Age Bracket | Male | Female |
| Under 5 Years | 0 (0.0%) | 0 (0.0%) |
| 5 to 17 Years | 80 (5.9%) | 70 (5.6%) |
| 18 to 34 Years | 163 (10.0%) | 93 (5.8%) |
| 35 to 64 Years | 628 (19.6%) | 540 (17.0%) |
| 65 to 74 Years | 365 (40.5%) | 280 (30.6%) |
| 75 Years and over | 318 (55.8%) | 379 (48.5%) |
Disability Class by Sex by Age in Fountain County
Disability Class: Hearing Difficulty
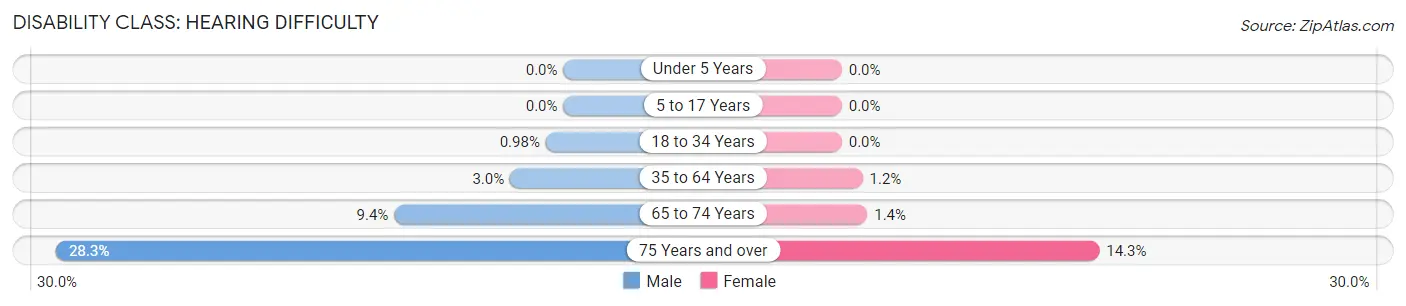
| Age Bracket | Male | Female |
| Under 5 Years | 0 (0.0%) | 0 (0.0%) |
| 5 to 17 Years | 0 (0.0%) | 0 (0.0%) |
| 18 to 34 Years | 16 (1.0%) | 0 (0.0%) |
| 35 to 64 Years | 95 (3.0%) | 37 (1.2%) |
| 65 to 74 Years | 85 (9.4%) | 13 (1.4%) |
| 75 Years and over | 161 (28.2%) | 112 (14.3%) |
Disability Class: Vision Difficulty

| Age Bracket | Male | Female |
| Under 5 Years | 0 (0.0%) | 0 (0.0%) |
| 5 to 17 Years | 2 (0.2%) | 43 (3.4%) |
| 18 to 34 Years | 24 (1.5%) | 3 (0.2%) |
| 35 to 64 Years | 178 (5.6%) | 80 (2.5%) |
| 65 to 74 Years | 114 (12.6%) | 55 (6.0%) |
| 75 Years and over | 59 (10.3%) | 94 (12.0%) |
Disability Class: Cognitive Difficulty
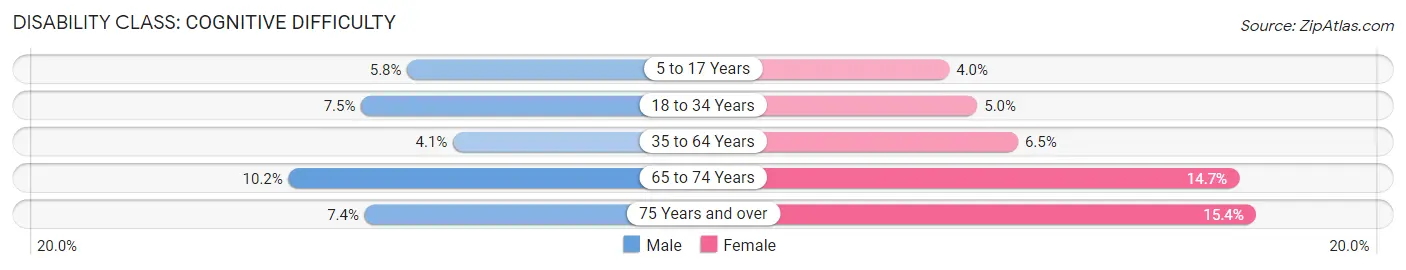
| Age Bracket | Male | Female |
| 5 to 17 Years | 78 (5.8%) | 50 (4.0%) |
| 18 to 34 Years | 123 (7.5%) | 80 (5.0%) |
| 35 to 64 Years | 131 (4.1%) | 208 (6.5%) |
| 65 to 74 Years | 92 (10.2%) | 135 (14.7%) |
| 75 Years and over | 42 (7.4%) | 120 (15.4%) |
Disability Class: Ambulatory Difficulty
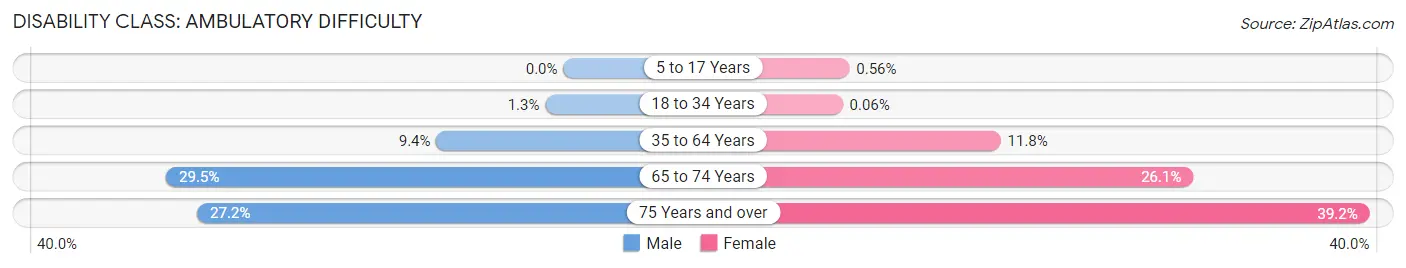
| Age Bracket | Male | Female |
| 5 to 17 Years | 0 (0.0%) | 7 (0.6%) |
| 18 to 34 Years | 22 (1.3%) | 1 (0.1%) |
| 35 to 64 Years | 302 (9.4%) | 375 (11.8%) |
| 65 to 74 Years | 266 (29.5%) | 239 (26.1%) |
| 75 Years and over | 155 (27.2%) | 306 (39.2%) |
Disability Class: Self-Care Difficulty
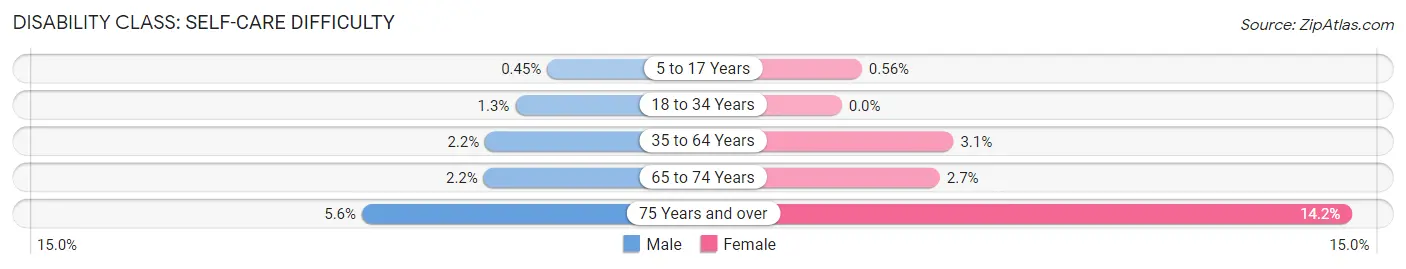
| Age Bracket | Male | Female |
| 5 to 17 Years | 6 (0.4%) | 7 (0.6%) |
| 18 to 34 Years | 22 (1.3%) | 0 (0.0%) |
| 35 to 64 Years | 70 (2.2%) | 99 (3.1%) |
| 65 to 74 Years | 20 (2.2%) | 25 (2.7%) |
| 75 Years and over | 32 (5.6%) | 111 (14.2%) |
Technology Access in Fountain County
Computing Device Access in Fountain County
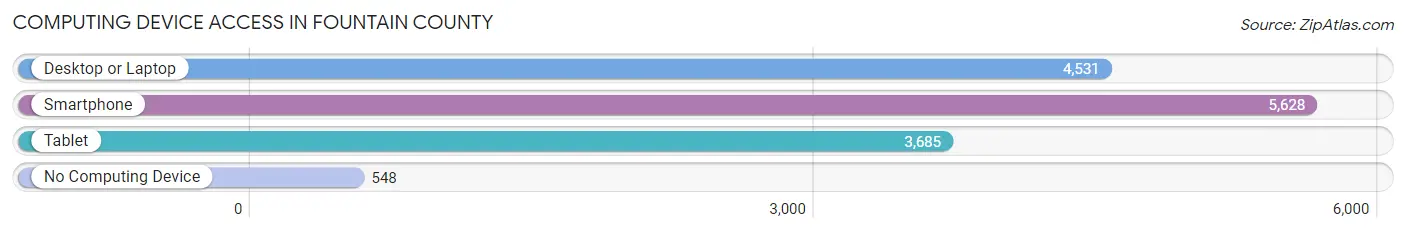
| Device Type | # Households | % Households |
| Desktop or Laptop | 4,531 | 66.4% |
| Smartphone | 5,628 | 82.5% |
| Tablet | 3,685 | 54.0% |
| No Computing Device | 548 | 8.0% |
| Total | 6,820 | 100.0% |
Internet Access in Fountain County
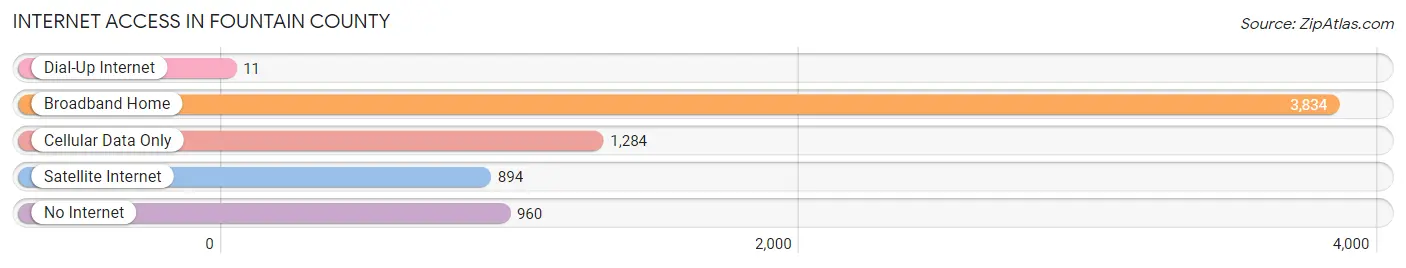
| Internet Type | # Households | % Households |
| Dial-Up Internet | 11 | 0.2% |
| Broadband Home | 3,834 | 56.2% |
| Cellular Data Only | 1,284 | 18.8% |
| Satellite Internet | 894 | 13.1% |
| No Internet | 960 | 14.1% |
| Total | 6,820 | 100.0% |
Fountain County Summary
Fountain County is located in the western part of the state of Indiana, in the United States. It is bordered by Warren County to the north, Vermillion County to the east, Parke County to the south, and Montgomery County to the west. The county seat is Covington, and the largest city is Veedersburg. The county was established in 1826 and named for Major James Fontaine, a Revolutionary War veteran. As of the 2010 census, the population was 17,240.
Geography
Fountain County covers an area of 437 square miles, of which 434 square miles is land and 3 square miles is water. The Wabash River forms the county's northern border, and the Tippecanoe River forms the eastern border. The county is mostly flat, with some rolling hills in the western part. The highest point in the county is located in the northwest corner, at an elevation of 890 feet.
The county is home to several state parks and recreation areas, including Shades State Park, Prophetstown State Park, and the Fountain-Warren State Fish and Wildlife Area. The county also contains several small lakes, including Lake Freeman, Lake Shafer, and Lake Wawasee.
Economy
Agriculture is the main economic activity in Fountain County. The county is home to several large farms, and the main crops grown are corn, soybeans, and wheat. Livestock production is also important, with beef cattle, dairy cows, and hogs being the main animals raised.
Manufacturing is also an important part of the economy. The county is home to several factories, including a steel mill, a paper mill, and a plastics plant. The county also has several small businesses, including restaurants, retail stores, and service providers.
Demographics
As of the 2010 census, the population of Fountain County was 17,240. The population is predominantly white (94.3%), with small percentages of African Americans (2.3%), Native Americans (0.5%), Asians (0.4%), and other races (2.5%). The median household income is $45,845, and the median age is 40.7 years.
The county is served by several school districts, including Covington Community Schools, Attica Consolidated Schools, and Veedersburg Community Schools. The county also has several private schools, including Fountain Central High School and Fountain Central Elementary School.
Conclusion
Fountain County is a rural county located in the western part of Indiana. It is home to several state parks and recreation areas, and the main economic activities are agriculture and manufacturing. The population is predominantly white, with a median household income of $45,845 and a median age of 40.7 years. The county is served by several school districts, as well as several private schools.
Common Questions
What is the Total Population of Fountain County?
Total Population of Fountain County is 16,468.
What is the Total Male Population of Fountain County?
Total Male Population of Fountain County is 8,249.
What is the Total Female Population of Fountain County?
Total Female Population of Fountain County is 8,219.
What is the Ratio of Males per 100 Females in Fountain County?
There are 100.37 Males per 100 Females in Fountain County.
What is the Ratio of Females per 100 Males in Fountain County?
There are 99.64 Females per 100 Males in Fountain County.
What is the Median Population Age in Fountain County?
Median Population Age in Fountain County is 43.1 Years.
What is the Average Family Size in Fountain County
Average Family Size in Fountain County is 2.9 People.
What is the Average Household Size in Fountain County
Average Household Size in Fountain County is 2.4 People.
What is Per Capita Income in Fountain County?
Per Capita income in Fountain County is $30,562.
What is the Median Family Income in Fountain County?
Median Family Income in Fountain County is $74,485.
What is the Median Household income in Fountain County?
Median Household Income in Fountain County is $60,559.
What is Income or Wage Gap in Fountain County?
Income or Wage Gap in Fountain County is 38.6%.
Women in Fountain County earn 61.4 cents for every dollar earned by a man.
What is Family Income Deficit in Fountain County?
Family Income Deficit in Fountain County is $9,652.
Families that are below poverty line in Fountain County earn $9,652 less on average than the poverty threshold level.
What is Inequality or Gini Index in Fountain County?
Inequality or Gini Index in Fountain County is 0.41.
How Large is the Labor Force in Fountain County?
There are 8,181 People in the Labor Forcein in Fountain County.
What is the Percentage of People in the Labor Force in Fountain County?
61.7% of People are in the Labor Force in Fountain County.
What is the Unemployment Rate in Fountain County?
Unemployment Rate in Fountain County is 5.2%.