Floyd County, IN
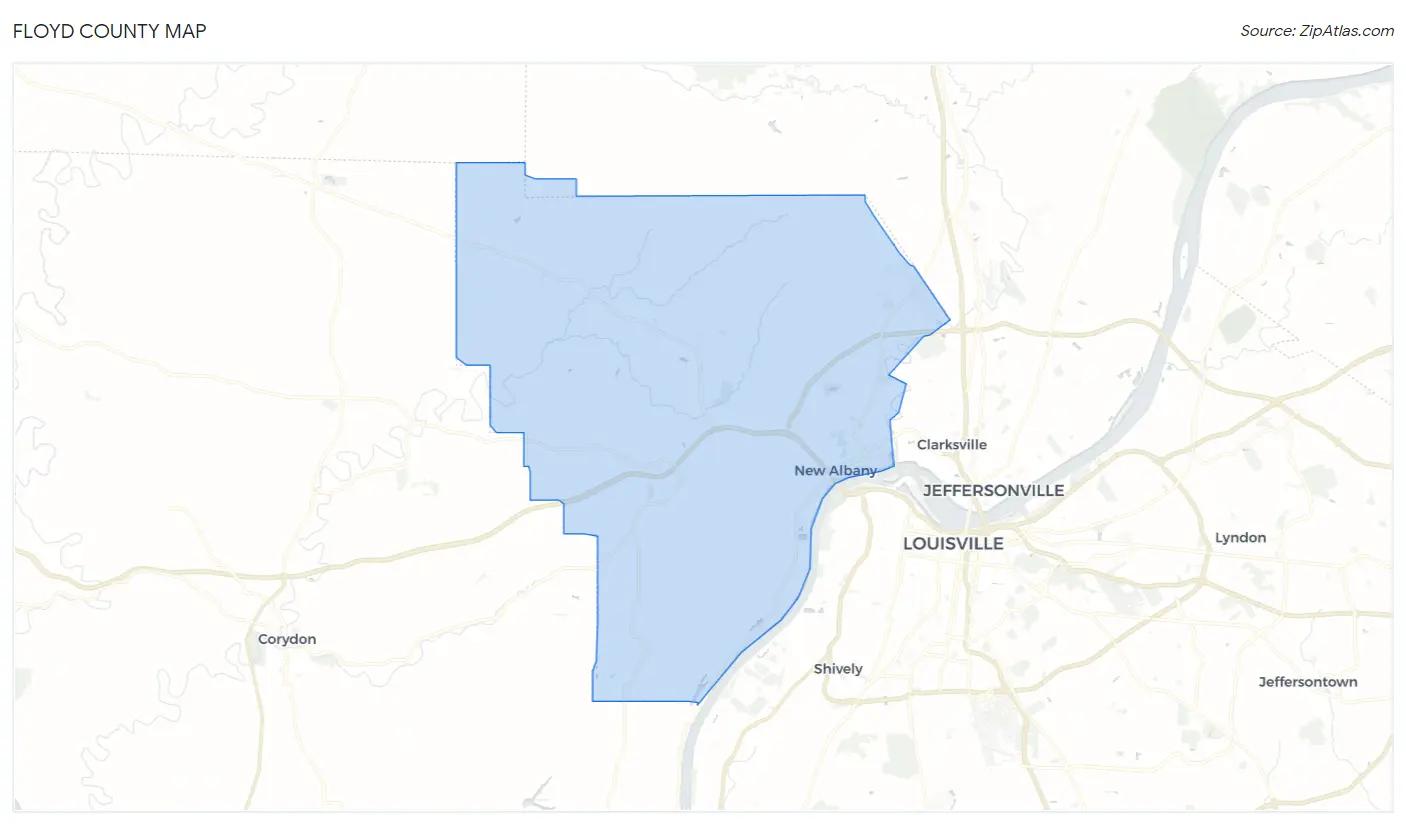
Floyd County Map
Floyd County Overview
80,191
TOTAL POPULATION
39,240
MALE POPULATION
40,951
FEMALE POPULATION
95.82
MALES / 100 FEMALES
104.36
FEMALES / 100 MALES
39.8
MEDIAN AGE
3.2
AVG FAMILY SIZE
2.5
AVG HOUSEHOLD SIZE
$38,949
PER CAPITA INCOME
$97,491
AVG FAMILY INCOME
$75,686
AVG HOUSEHOLD INCOME
26.0%
WAGE / INCOME GAP [ % ]
74.0¢/ $1
WAGE / INCOME GAP [ $ ]
$12,370
FAMILY INCOME DEFICIT
0.43
INEQUALITY / GINI INDEX
41,372
LABOR FORCE [ PEOPLE ]
64.2%
PERCENT IN LABOR FORCE
3.9%
UNEMPLOYMENT RATE
Floyd County Area Codes
Race in Floyd County
The most populous races in Floyd County are White / Caucasian (70,587 | 88.0%), Black / African American (4,046 | 5.1%), and Two or more Races (3,931 | 4.9%).
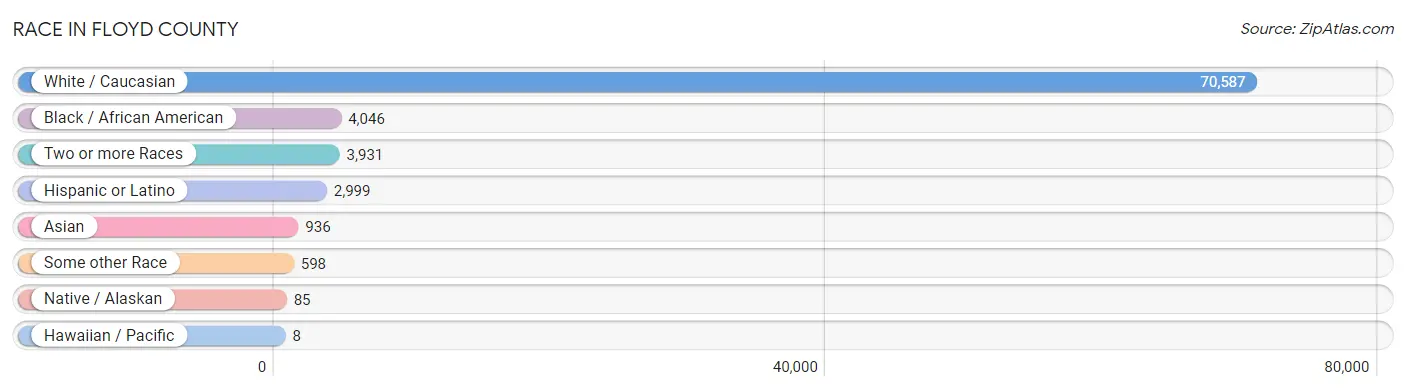
| Race | # Population | % Population |
| Asian | 936 | 1.2% |
| Black / African American | 4,046 | 5.1% |
| Hawaiian / Pacific | 8 | 0.0% |
| Hispanic or Latino | 2,999 | 3.7% |
| Native / Alaskan | 85 | 0.1% |
| White / Caucasian | 70,587 | 88.0% |
| Two or more Races | 3,931 | 4.9% |
| Some other Race | 598 | 0.7% |
| Total | 80,191 | 100.0% |
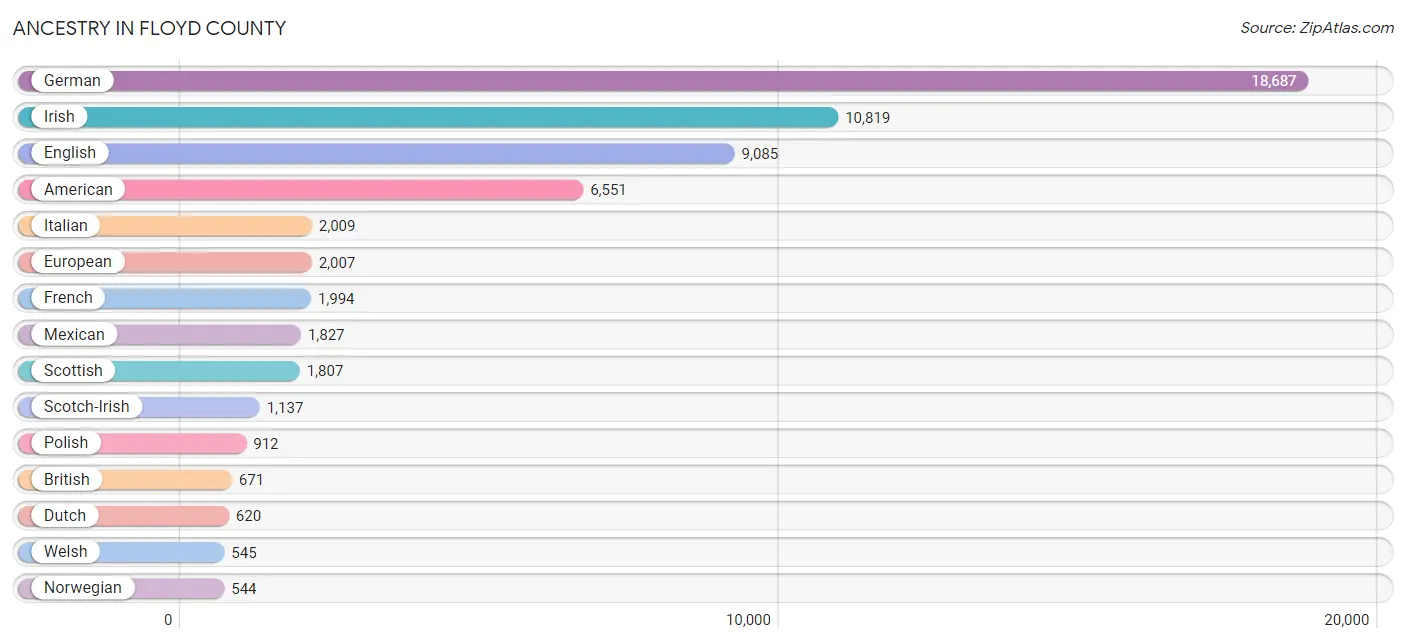
Ancestry in Floyd County
The most populous ancestries reported in Floyd County are German (18,687 | 23.3%), Irish (10,819 | 13.5%), English (9,085 | 11.3%), American (6,551 | 8.2%), and Italian (2,009 | 2.5%), together accounting for 58.8% of all Floyd County residents.
| Ancestry | # Population | % Population |
| Afghan | 39 | 0.1% |
| African | 331 | 0.4% |
| Albanian | 21 | 0.0% |
| Aleut | 14 | 0.0% |
| American | 6,551 | 8.2% |
| Arab | 132 | 0.2% |
| Armenian | 7 | 0.0% |
| Assyrian / Chaldean / Syriac | 8 | 0.0% |
| Australian | 7 | 0.0% |
| Austrian | 24 | 0.0% |
| Belgian | 47 | 0.1% |
| Bhutanese | 92 | 0.1% |
| Blackfeet | 26 | 0.0% |
| British | 671 | 0.8% |
| Bulgarian | 28 | 0.0% |
| Burmese | 134 | 0.2% |
| Cambodian | 10 | 0.0% |
| Canadian | 36 | 0.0% |
| Celtic | 11 | 0.0% |
| Central American | 231 | 0.3% |
| Cherokee | 273 | 0.3% |
| Choctaw | 19 | 0.0% |
| Colombian | 29 | 0.0% |
| Croatian | 4 | 0.0% |
| Cuban | 66 | 0.1% |
| Czech | 51 | 0.1% |
| Danish | 155 | 0.2% |
| Dominican | 143 | 0.2% |
| Dutch | 620 | 0.8% |
| Eastern European | 271 | 0.3% |
| English | 9,085 | 11.3% |
| Ethiopian | 5 | 0.0% |
| European | 2,007 | 2.5% |
| Filipino | 25 | 0.0% |
| Finnish | 41 | 0.1% |
| French | 1,994 | 2.5% |
| French Canadian | 77 | 0.1% |
| German | 18,687 | 23.3% |
| Ghanaian | 16 | 0.0% |
| Greek | 221 | 0.3% |
| Guatemalan | 113 | 0.1% |
| Hmong | 14 | 0.0% |
| Honduran | 6 | 0.0% |
| Hungarian | 133 | 0.2% |
| Indian (Asian) | 199 | 0.3% |
| Iranian | 32 | 0.0% |
| Irish | 10,819 | 13.5% |
| Italian | 2,009 | 2.5% |
| Japanese | 38 | 0.1% |
| Korean | 180 | 0.2% |
| Laotian | 16 | 0.0% |
| Latvian | 63 | 0.1% |
| Lebanese | 65 | 0.1% |
| Liberian | 61 | 0.1% |
| Lithuanian | 102 | 0.1% |
| Malaysian | 60 | 0.1% |
| Mexican | 1,827 | 2.3% |
| Mexican American Indian | 28 | 0.0% |
| Moroccan | 10 | 0.0% |
| Native Hawaiian | 79 | 0.1% |
| Navajo | 10 | 0.0% |
| Nicaraguan | 8 | 0.0% |
| Nigerian | 10 | 0.0% |
| Northern European | 20 | 0.0% |
| Norwegian | 544 | 0.7% |
| Okinawan | 22 | 0.0% |
| Pakistani | 86 | 0.1% |
| Panamanian | 24 | 0.0% |
| Polish | 912 | 1.1% |
| Portuguese | 18 | 0.0% |
| Puerto Rican | 432 | 0.5% |
| Romanian | 82 | 0.1% |
| Russian | 177 | 0.2% |
| Salvadoran | 80 | 0.1% |
| Scandinavian | 115 | 0.1% |
| Scotch-Irish | 1,137 | 1.4% |
| Scottish | 1,807 | 2.2% |
| Sioux | 12 | 0.0% |
| Slavic | 7 | 0.0% |
| Slovak | 247 | 0.3% |
| Slovene | 16 | 0.0% |
| South American | 43 | 0.1% |
| Spaniard | 110 | 0.1% |
| Spanish | 80 | 0.1% |
| Subsaharan African | 440 | 0.5% |
| Swedish | 495 | 0.6% |
| Swiss | 358 | 0.4% |
| Syrian | 57 | 0.1% |
| Thai | 439 | 0.5% |
| Trinidadian and Tobagonian | 28 | 0.0% |
| Ukrainian | 35 | 0.0% |
| Venezuelan | 14 | 0.0% |
| Vietnamese | 1 | 0.0% |
| Welsh | 545 | 0.7% | View All 94 Rows |
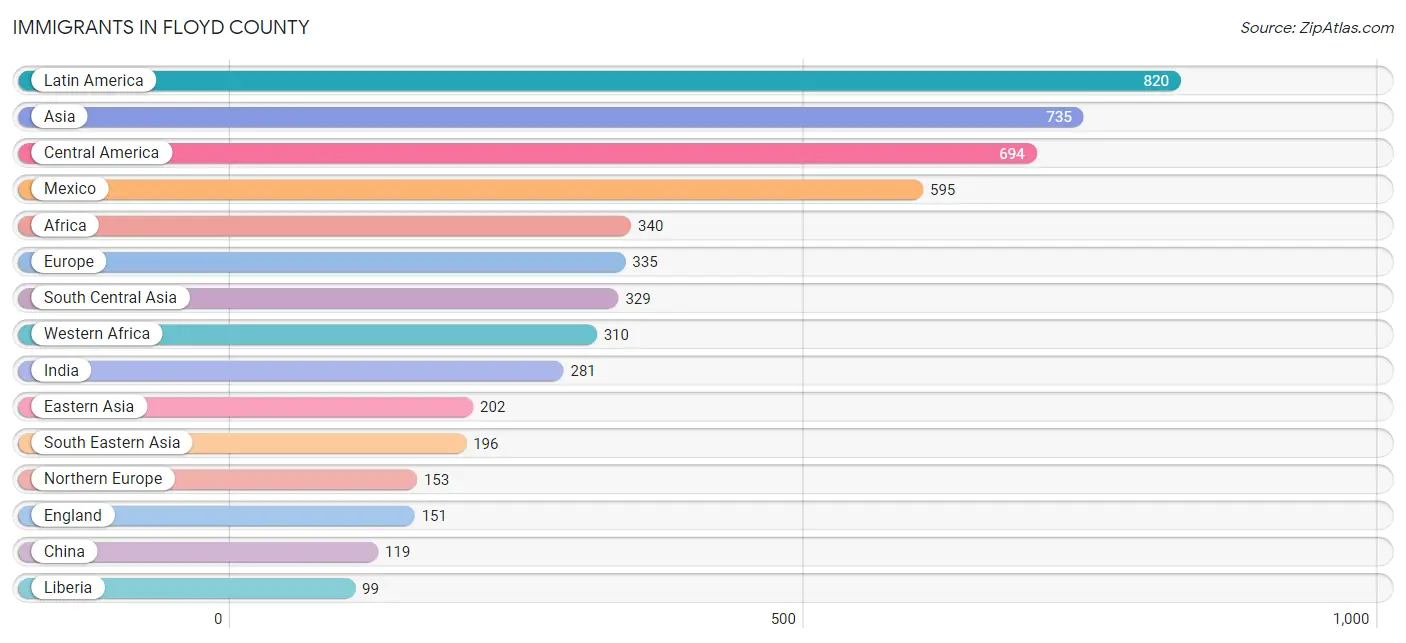
Immigrants in Floyd County
The most numerous immigrant groups reported in Floyd County came from Latin America (820 | 1.0%), Asia (735 | 0.9%), Central America (694 | 0.9%), Mexico (595 | 0.7%), and Africa (340 | 0.4%), together accounting for 4.0% of all Floyd County residents.
| Immigration Origin | # Population | % Population |
| Afghanistan | 39 | 0.1% |
| Africa | 340 | 0.4% |
| Albania | 21 | 0.0% |
| Asia | 735 | 0.9% |
| Bangladesh | 1 | 0.0% |
| Brazil | 18 | 0.0% |
| Bulgaria | 28 | 0.0% |
| Cambodia | 7 | 0.0% |
| Canada | 13 | 0.0% |
| Caribbean | 81 | 0.1% |
| Central America | 694 | 0.9% |
| China | 119 | 0.2% |
| Colombia | 23 | 0.0% |
| Croatia | 14 | 0.0% |
| Cuba | 35 | 0.0% |
| Eastern Asia | 202 | 0.3% |
| Eastern Europe | 95 | 0.1% |
| Ecuador | 4 | 0.0% |
| El Salvador | 18 | 0.0% |
| England | 151 | 0.2% |
| Europe | 335 | 0.4% |
| France | 8 | 0.0% |
| Germany | 50 | 0.1% |
| Ghana | 16 | 0.0% |
| Guatemala | 57 | 0.1% |
| India | 281 | 0.4% |
| Iran | 8 | 0.0% |
| Iraq | 8 | 0.0% |
| Italy | 9 | 0.0% |
| Jamaica | 11 | 0.0% |
| Japan | 30 | 0.0% |
| Korea | 53 | 0.1% |
| Laos | 46 | 0.1% |
| Latin America | 820 | 1.0% |
| Liberia | 99 | 0.1% |
| Malaysia | 22 | 0.0% |
| Mexico | 595 | 0.7% |
| Netherlands | 14 | 0.0% |
| Northern Europe | 153 | 0.2% |
| Panama | 24 | 0.0% |
| Philippines | 82 | 0.1% |
| Romania | 6 | 0.0% |
| Russia | 19 | 0.0% |
| Singapore | 22 | 0.0% |
| South Africa | 30 | 0.0% |
| South America | 45 | 0.1% |
| South Central Asia | 329 | 0.4% |
| South Eastern Asia | 196 | 0.2% |
| Southern Europe | 15 | 0.0% |
| Spain | 6 | 0.0% |
| Taiwan | 14 | 0.0% |
| Thailand | 17 | 0.0% |
| Trinidad and Tobago | 35 | 0.0% |
| Ukraine | 7 | 0.0% |
| Western Africa | 310 | 0.4% |
| Western Asia | 8 | 0.0% |
| Western Europe | 72 | 0.1% | View All 57 Rows |
Sex and Age in Floyd County
Sex and Age in Floyd County
The most populous age groups in Floyd County are 55 to 59 Years (2,918 | 7.4%) for men and 55 to 59 Years (2,964 | 7.2%) for women.
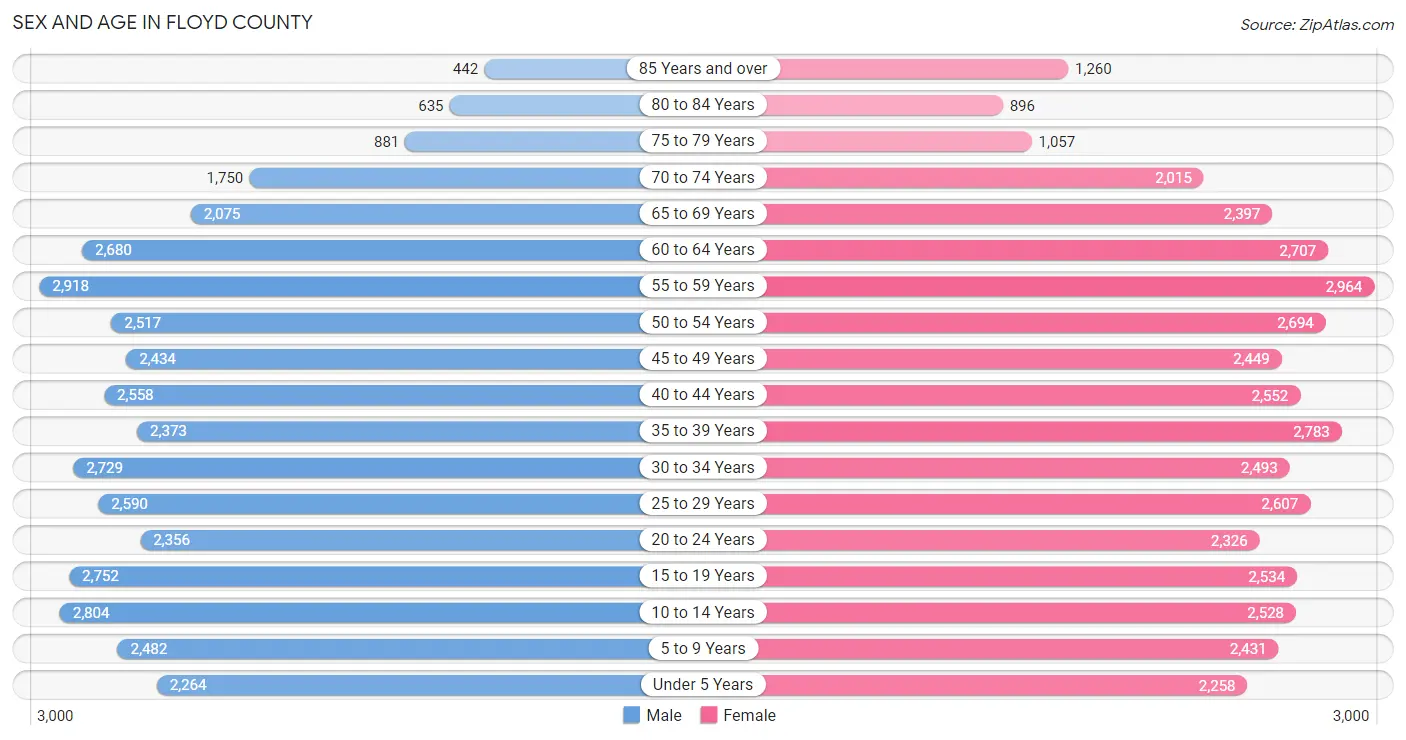
| Age Bracket | Male | Female |
| Under 5 Years | 2,264 (5.8%) | 2,258 (5.5%) |
| 5 to 9 Years | 2,482 (6.3%) | 2,431 (5.9%) |
| 10 to 14 Years | 2,804 (7.1%) | 2,528 (6.2%) |
| 15 to 19 Years | 2,752 (7.0%) | 2,534 (6.2%) |
| 20 to 24 Years | 2,356 (6.0%) | 2,326 (5.7%) |
| 25 to 29 Years | 2,590 (6.6%) | 2,607 (6.4%) |
| 30 to 34 Years | 2,729 (7.0%) | 2,493 (6.1%) |
| 35 to 39 Years | 2,373 (6.0%) | 2,783 (6.8%) |
| 40 to 44 Years | 2,558 (6.5%) | 2,552 (6.2%) |
| 45 to 49 Years | 2,434 (6.2%) | 2,449 (6.0%) |
| 50 to 54 Years | 2,517 (6.4%) | 2,694 (6.6%) |
| 55 to 59 Years | 2,918 (7.4%) | 2,964 (7.2%) |
| 60 to 64 Years | 2,680 (6.8%) | 2,707 (6.6%) |
| 65 to 69 Years | 2,075 (5.3%) | 2,397 (5.9%) |
| 70 to 74 Years | 1,750 (4.5%) | 2,015 (4.9%) |
| 75 to 79 Years | 881 (2.2%) | 1,057 (2.6%) |
| 80 to 84 Years | 635 (1.6%) | 896 (2.2%) |
| 85 Years and over | 442 (1.1%) | 1,260 (3.1%) |
| Total | 39,240 (100.0%) | 40,951 (100.0%) |
Families and Households in Floyd County
Median Family Size in Floyd County
The median family size in Floyd County is 3.18 persons per family, with single male/father families (1,332 | 6.6%) accounting for the largest median family size of 3.23 persons per family. On the other hand, single female/mother families (3,616 | 18.0%) represent the smallest median family size with 3.16 persons per family.
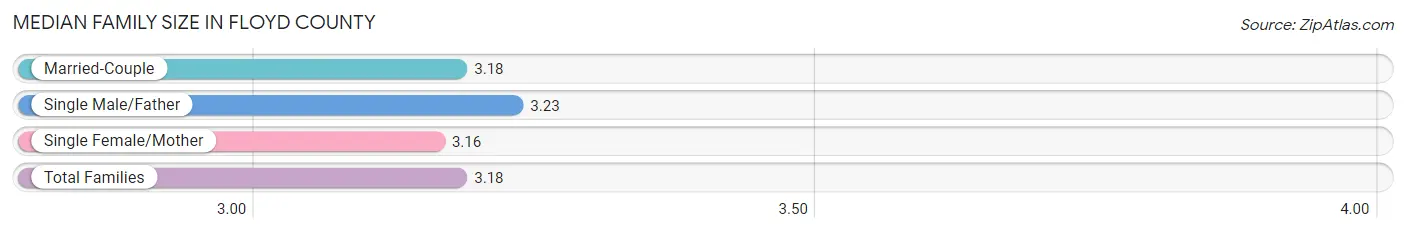
| Family Type | # Families | Family Size |
| Married-Couple | 15,099 (75.3%) | 3.18 |
| Single Male/Father | 1,332 (6.6%) | 3.23 |
| Single Female/Mother | 3,616 (18.0%) | 3.16 |
| Total Families | 20,047 (100.0%) | 3.18 |
Median Household Size in Floyd County
The median household size in Floyd County is 2.55 persons per household, with single male/father households (1,332 | 4.3%) accounting for the largest median household size of 3.54 persons per household. non-family households (10,864 | 35.1%) represent the smallest median household size with 1.23 persons per household.
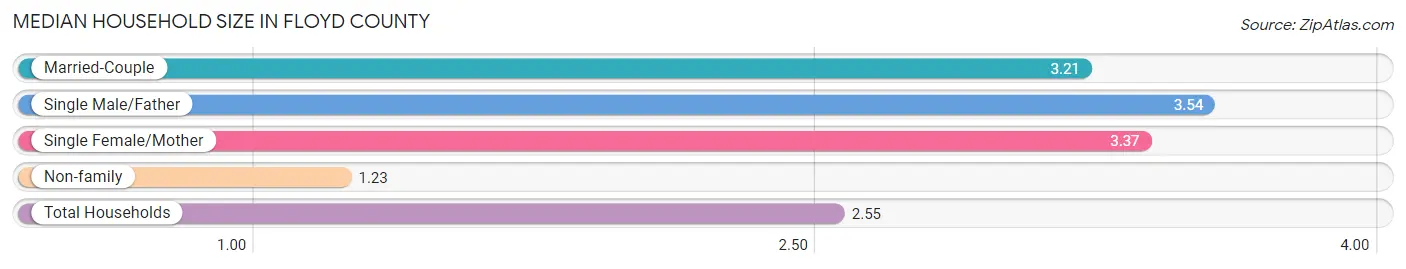
| Household Type | # Households | Household Size |
| Married-Couple | 15,099 (48.8%) | 3.21 |
| Single Male/Father | 1,332 (4.3%) | 3.54 |
| Single Female/Mother | 3,616 (11.7%) | 3.37 |
| Non-family | 10,864 (35.1%) | 1.23 |
| Total Households | 30,911 (100.0%) | 2.55 |
Household Size by Marriage Status in Floyd County
Out of a total of 30,911 households in Floyd County, 20,047 (64.8%) are family households, while 10,864 (35.1%) are nonfamily households. The most numerous type of family households are 2-person households, comprising 9,071, and the most common type of nonfamily households are 1-person households, comprising 8,954.
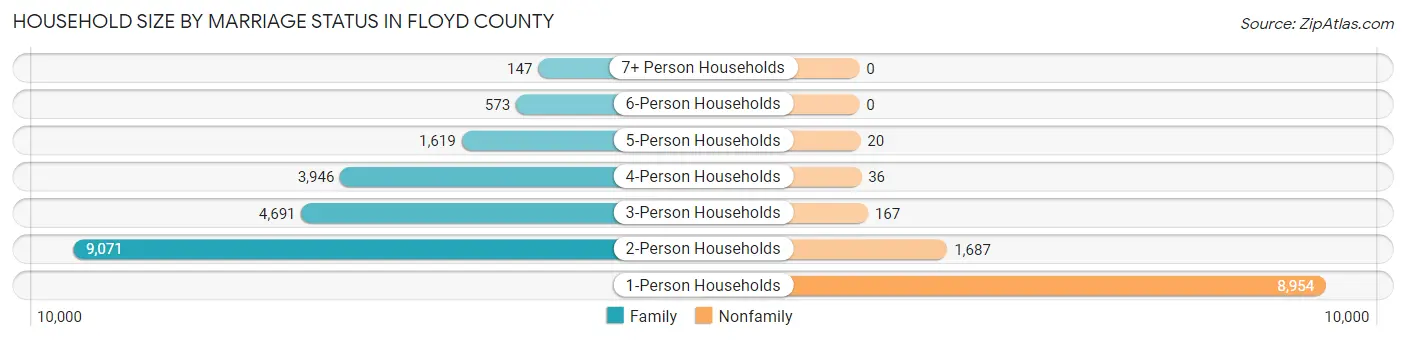
| Household Size | Family Households | Nonfamily Households |
| 1-Person Households | - | 8,954 (29.0%) |
| 2-Person Households | 9,071 (29.3%) | 1,687 (5.5%) |
| 3-Person Households | 4,691 (15.2%) | 167 (0.5%) |
| 4-Person Households | 3,946 (12.8%) | 36 (0.1%) |
| 5-Person Households | 1,619 (5.2%) | 20 (0.1%) |
| 6-Person Households | 573 (1.8%) | 0 (0.0%) |
| 7+ Person Households | 147 (0.5%) | 0 (0.0%) |
| Total | 20,047 (64.8%) | 10,864 (35.1%) |
Female Fertility in Floyd County
Fertility by Age in Floyd County
Average fertility rate in Floyd County is 54.0 births per 1,000 women. Women in the age bracket of 20 to 34 years have the highest fertility rate with 90.0 births per 1,000 women. Women in the age bracket of 20 to 34 years acount for 67.6% of all women with births.
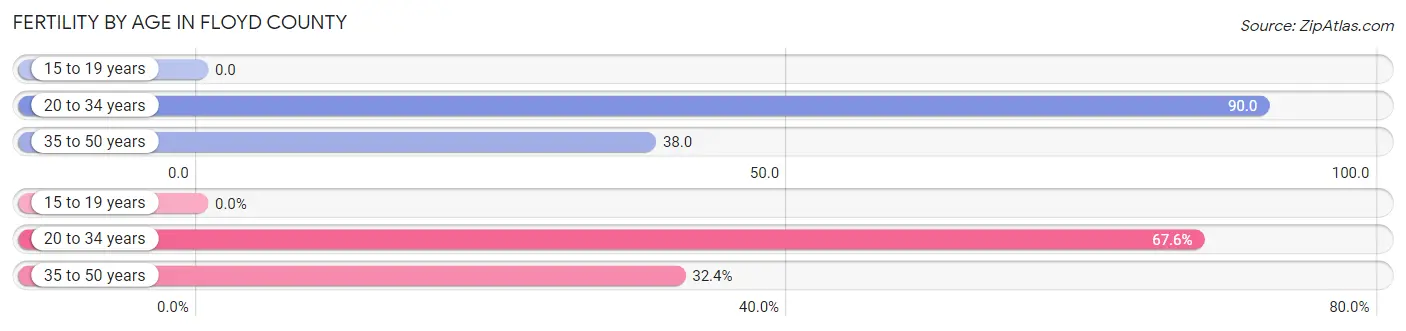
| Age Bracket | Women with Births | Births / 1,000 Women |
| 15 to 19 years | 0 (0.0%) | 0.0 |
| 20 to 34 years | 666 (67.6%) | 90.0 |
| 35 to 50 years | 319 (32.4%) | 38.0 |
| Total | 985 (100.0%) | 54.0 |
Fertility by Age by Marriage Status in Floyd County
66.8% of women with births (985) in Floyd County are married. The highest percentage of unmarried women with births falls into 20 to 34 years age bracket with 45.2% of them unmarried at the time of birth, while the lowest percentage of unmarried women with births belong to 35 to 50 years age bracket with 8.2% of them unmarried.
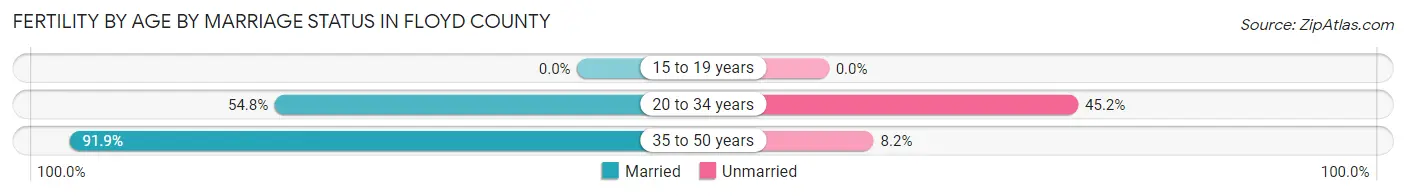
| Age Bracket | Married | Unmarried |
| 15 to 19 years | 0 (0.0%) | 0 (0.0%) |
| 20 to 34 years | 365 (54.8%) | 301 (45.2%) |
| 35 to 50 years | 293 (91.8%) | 26 (8.2%) |
| Total | 658 (66.8%) | 327 (33.2%) |
Fertility by Education in Floyd County
Average fertility rate in Floyd County is 54.0 births per 1,000 women. Women with the education attainment of graduate degree have the highest fertility rate of 104.0 births per 1,000 women, while women with the education attainment of less than high school have the lowest fertility at 32.0 births per 1,000 women. Women with the education attainment of high school diploma represent 31.1% of all women with births.
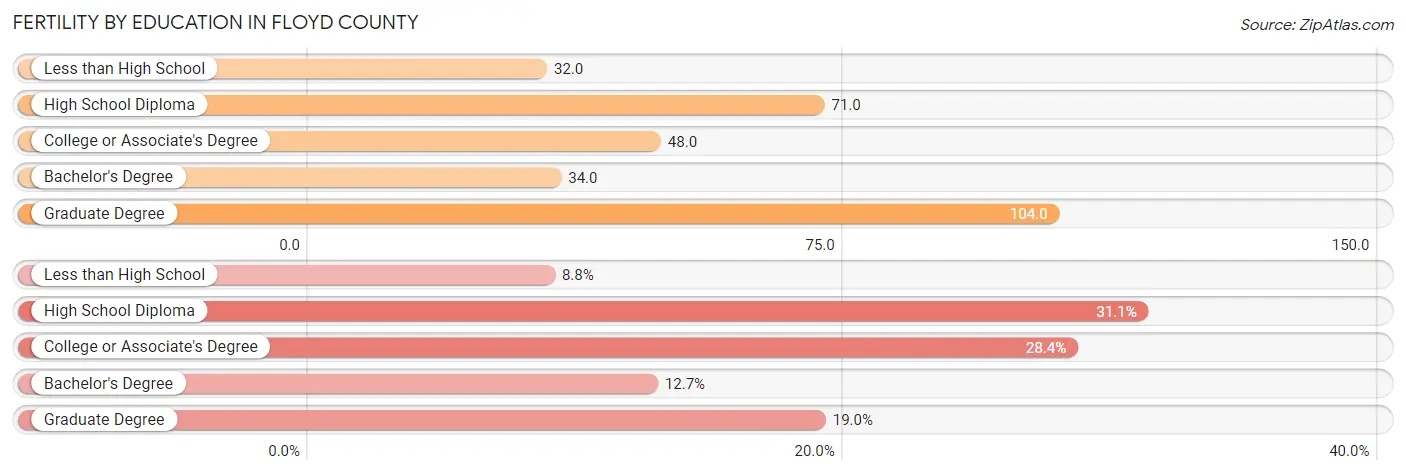
| Educational Attainment | Women with Births | Births / 1,000 Women |
| Less than High School | 87 (8.8%) | 32.0 |
| High School Diploma | 306 (31.1%) | 71.0 |
| College or Associate's Degree | 280 (28.4%) | 48.0 |
| Bachelor's Degree | 125 (12.7%) | 34.0 |
| Graduate Degree | 187 (19.0%) | 104.0 |
| Total | 985 (100.0%) | 54.0 |
Fertility by Education by Marriage Status in Floyd County
33.2% of women with births in Floyd County are unmarried. Women with the educational attainment of graduate degree are most likely to be married with 100.0% of them married at childbirth, while women with the educational attainment of college or associate's degree are least likely to be married with 57.5% of them unmarried at childbirth.
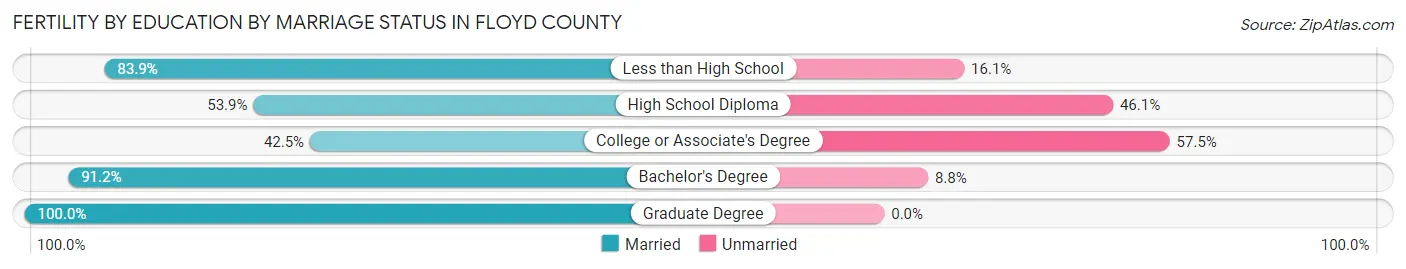
| Educational Attainment | Married | Unmarried |
| Less than High School | 73 (83.9%) | 14 (16.1%) |
| High School Diploma | 165 (53.9%) | 141 (46.1%) |
| College or Associate's Degree | 119 (42.5%) | 161 (57.5%) |
| Bachelor's Degree | 114 (91.2%) | 11 (8.8%) |
| Graduate Degree | 187 (100.0%) | 0 (0.0%) |
| Total | 658 (66.8%) | 327 (33.2%) |
Income in Floyd County
Income Overview in Floyd County
Per Capita Income in Floyd County is $38,949, while median incomes of families and households are $97,491 and $75,686 respectively.
| Characteristic | Number | Measure |
| Per Capita Income | 80,191 | $38,949 |
| Median Family Income | 20,047 | $97,491 |
| Mean Family Income | 20,047 | $118,541 |
| Median Household Income | 30,911 | $75,686 |
| Mean Household Income | 30,911 | $97,601 |
| Income Deficit | 20,047 | $12,370 |
| Wage / Income Gap (%) | 80,191 | 25.96% |
| Wage / Income Gap ($) | 80,191 | 74.04¢ per $1 |
| Gini / Inequality Index | 80,191 | 0.43 |
Earnings by Sex in Floyd County
Average Earnings in Floyd County are $43,764, $51,283 for men and $37,972 for women, a difference of 26.0%.
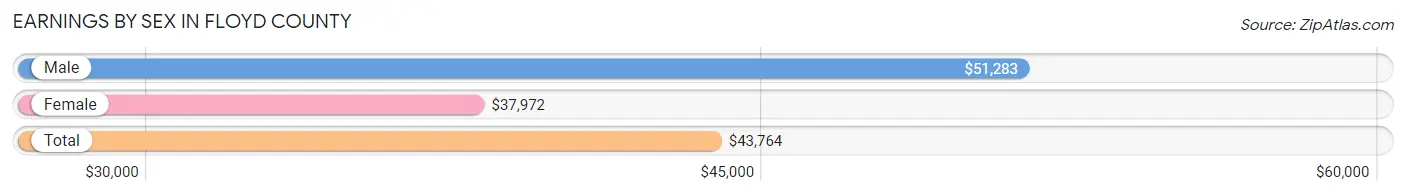
| Sex | Number | Average Earnings |
| Male | 22,485 (52.1%) | $51,283 |
| Female | 20,649 (47.9%) | $37,972 |
| Total | 43,134 (100.0%) | $43,764 |
Earnings by Sex by Income Bracket in Floyd County
The most common earnings brackets in Floyd County are $100,000+ for men (4,252 | 18.9%) and $55,000 to $64,999 for women (1,641 | 8.0%).
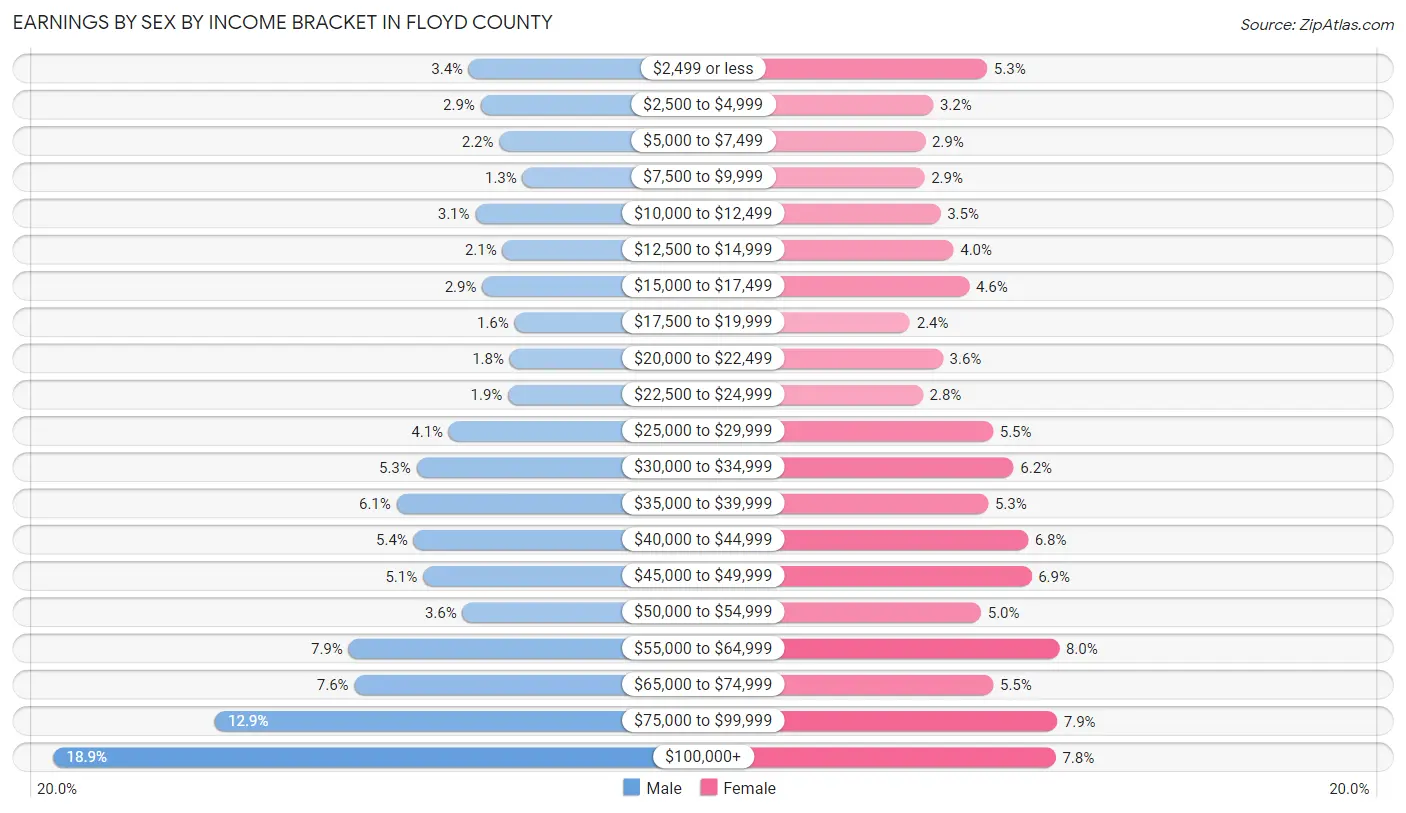
| Income | Male | Female |
| $2,499 or less | 753 (3.4%) | 1,085 (5.2%) |
| $2,500 to $4,999 | 654 (2.9%) | 667 (3.2%) |
| $5,000 to $7,499 | 497 (2.2%) | 606 (2.9%) |
| $7,500 to $9,999 | 301 (1.3%) | 599 (2.9%) |
| $10,000 to $12,499 | 699 (3.1%) | 723 (3.5%) |
| $12,500 to $14,999 | 470 (2.1%) | 823 (4.0%) |
| $15,000 to $17,499 | 641 (2.9%) | 945 (4.6%) |
| $17,500 to $19,999 | 368 (1.6%) | 487 (2.4%) |
| $20,000 to $22,499 | 409 (1.8%) | 742 (3.6%) |
| $22,500 to $24,999 | 423 (1.9%) | 586 (2.8%) |
| $25,000 to $29,999 | 921 (4.1%) | 1,130 (5.5%) |
| $30,000 to $34,999 | 1,194 (5.3%) | 1,288 (6.2%) |
| $35,000 to $39,999 | 1,363 (6.1%) | 1,092 (5.3%) |
| $40,000 to $44,999 | 1,218 (5.4%) | 1,401 (6.8%) |
| $45,000 to $49,999 | 1,139 (5.1%) | 1,426 (6.9%) |
| $50,000 to $54,999 | 807 (3.6%) | 1,036 (5.0%) |
| $55,000 to $64,999 | 1,767 (7.9%) | 1,641 (8.0%) |
| $65,000 to $74,999 | 1,718 (7.6%) | 1,132 (5.5%) |
| $75,000 to $99,999 | 2,891 (12.9%) | 1,626 (7.9%) |
| $100,000+ | 4,252 (18.9%) | 1,614 (7.8%) |
| Total | 22,485 (100.0%) | 20,649 (100.0%) |
Earnings by Sex by Educational Attainment in Floyd County
Average earnings in Floyd County are $58,258 for men and $43,962 for women, a difference of 24.5%. Men with an educational attainment of graduate degree enjoy the highest average annual earnings of $92,411, while those with less than high school education earn the least with $36,902. Women with an educational attainment of graduate degree earn the most with the average annual earnings of $71,259, while those with less than high school education have the smallest earnings of $17,813.
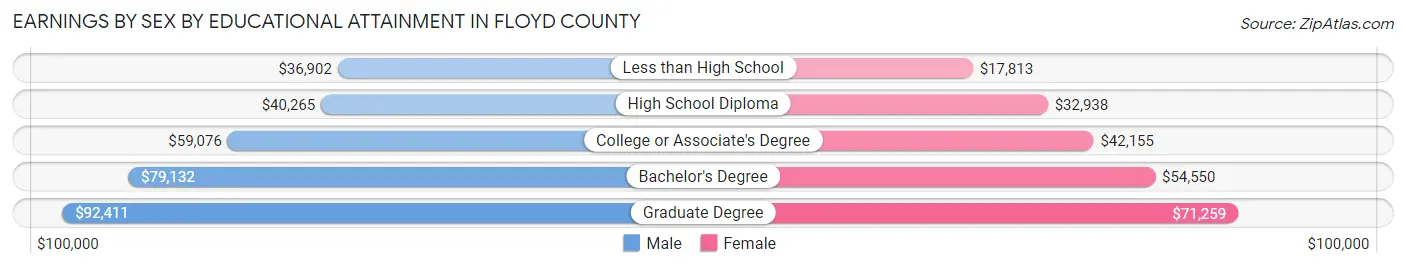
| Educational Attainment | Male Income | Female Income |
| Less than High School | $36,902 | $17,813 |
| High School Diploma | $40,265 | $32,938 |
| College or Associate's Degree | $59,076 | $42,155 |
| Bachelor's Degree | $79,132 | $54,550 |
| Graduate Degree | $92,411 | $71,259 |
| Total | $58,258 | $43,962 |
Family Income in Floyd County
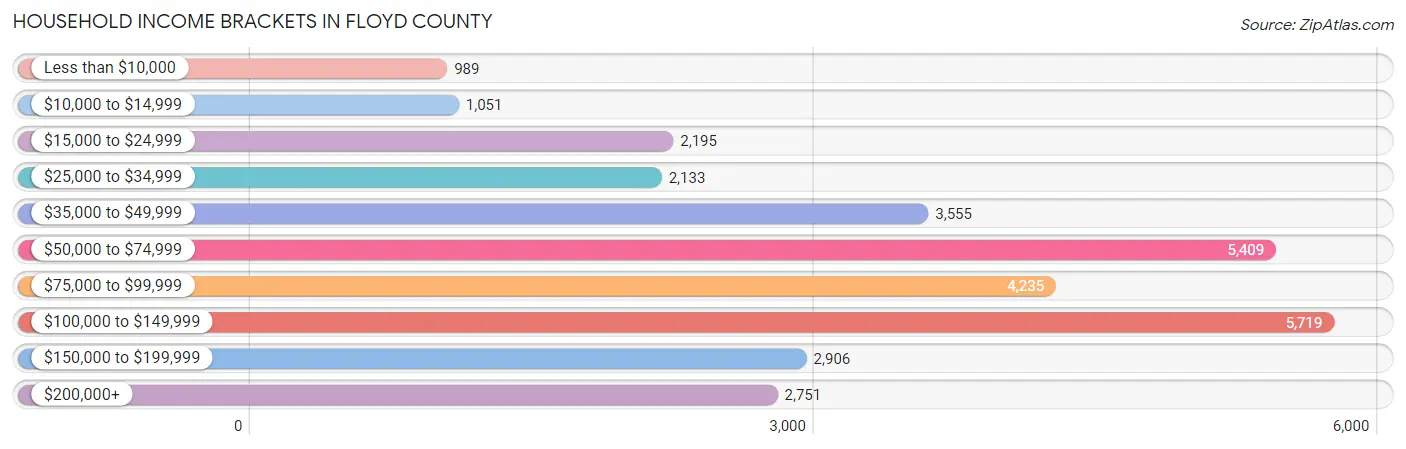
Family Income Brackets in Floyd County
According to the Floyd County family income data, there are 4,651 families falling into the $100,000 to $149,999 income range, which is the most common income bracket and makes up 23.2% of all families. Conversely, the $10,000 to $14,999 income bracket is the least frequent group with only 341 families (1.7%) belonging to this category.
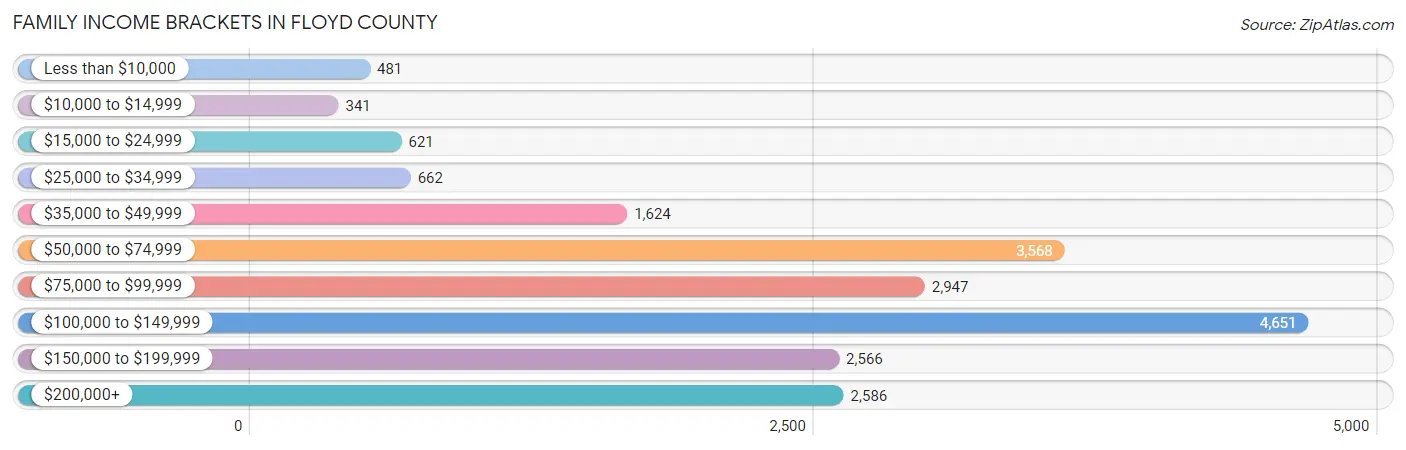
| Income Bracket | # Families | % Families |
| Less than $10,000 | 481 | 2.4% |
| $10,000 to $14,999 | 341 | 1.7% |
| $15,000 to $24,999 | 621 | 3.1% |
| $25,000 to $34,999 | 662 | 3.3% |
| $35,000 to $49,999 | 1,624 | 8.1% |
| $50,000 to $74,999 | 3,568 | 17.8% |
| $75,000 to $99,999 | 2,947 | 14.7% |
| $100,000 to $149,999 | 4,651 | 23.2% |
| $150,000 to $199,999 | 2,566 | 12.8% |
| $200,000+ | 2,586 | 12.9% |
Family Income by Famaliy Size in Floyd County
5-person families (1,439 | 7.2%) account for the highest median family income in Floyd County with $136,326 per family, while 2-person families (9,600 | 47.9%) have the highest median income of $40,000 per family member.
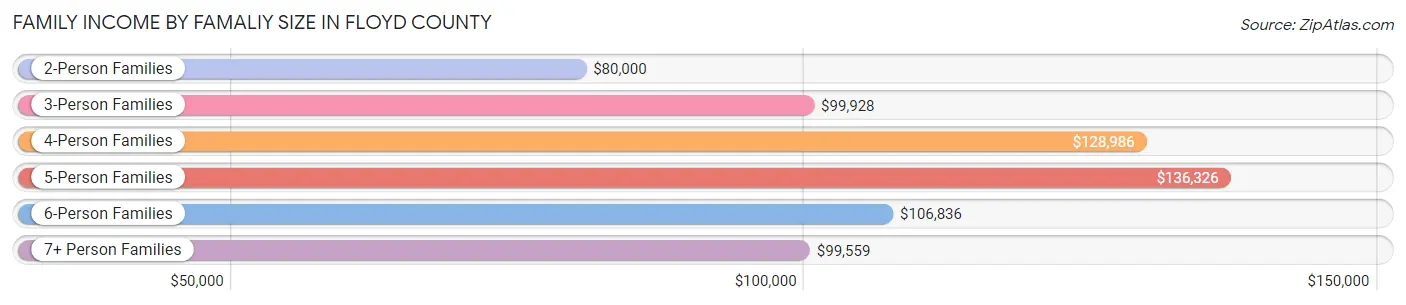
| Income Bracket | # Families | Median Income |
| 2-Person Families | 9,600 (47.9%) | $80,000 |
| 3-Person Families | 4,510 (22.5%) | $99,928 |
| 4-Person Families | 3,903 (19.5%) | $128,986 |
| 5-Person Families | 1,439 (7.2%) | $136,326 |
| 6-Person Families | 481 (2.4%) | $106,836 |
| 7+ Person Families | 114 (0.6%) | $99,559 |
| Total | 20,047 (100.0%) | $97,491 |
Family Income by Number of Earners in Floyd County
The median family income in Floyd County is $97,491, with families comprising 3+ earners (2,357) having the highest median family income of $151,473, while families with no earners (3,024) have the lowest median family income of $54,386, accounting for 11.8% and 15.1% of families, respectively.
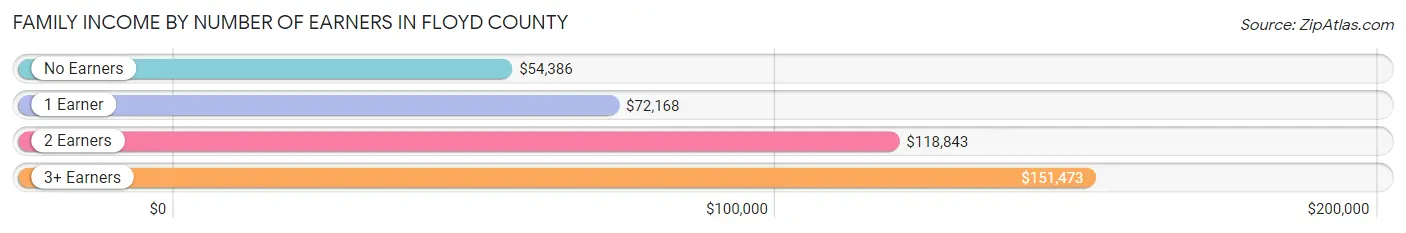
| Number of Earners | # Families | Median Income |
| No Earners | 3,024 (15.1%) | $54,386 |
| 1 Earner | 6,370 (31.8%) | $72,168 |
| 2 Earners | 8,296 (41.4%) | $118,843 |
| 3+ Earners | 2,357 (11.8%) | $151,473 |
| Total | 20,047 (100.0%) | $97,491 |
Household Income in Floyd County
Household Income Brackets in Floyd County
With 5,719 households falling in the category, the $100,000 to $149,999 income range is the most frequent in Floyd County, accounting for 18.5% of all households. In contrast, only 989 households (3.2%) fall into the less than $10,000 income bracket, making it the least populous group.
| Income Bracket | # Households | % Households |
| Less than $10,000 | 989 | 3.2% |
| $10,000 to $14,999 | 1,051 | 3.4% |
| $15,000 to $24,999 | 2,195 | 7.1% |
| $25,000 to $34,999 | 2,133 | 6.9% |
| $35,000 to $49,999 | 3,555 | 11.5% |
| $50,000 to $74,999 | 5,409 | 17.5% |
| $75,000 to $99,999 | 4,235 | 13.7% |
| $100,000 to $149,999 | 5,719 | 18.5% |
| $150,000 to $199,999 | 2,906 | 9.4% |
| $200,000+ | 2,751 | 8.9% |
Household Income by Householder Age in Floyd County
The median household income in Floyd County is $75,686, with the highest median household income of $91,348 found in the 45 to 64 years age bracket for the primary householder. A total of 12,044 households (39.0%) fall into this category. Meanwhile, the 15 to 24 years age bracket for the primary householder has the lowest median household income of $45,318, with 853 households (2.8%) in this group.
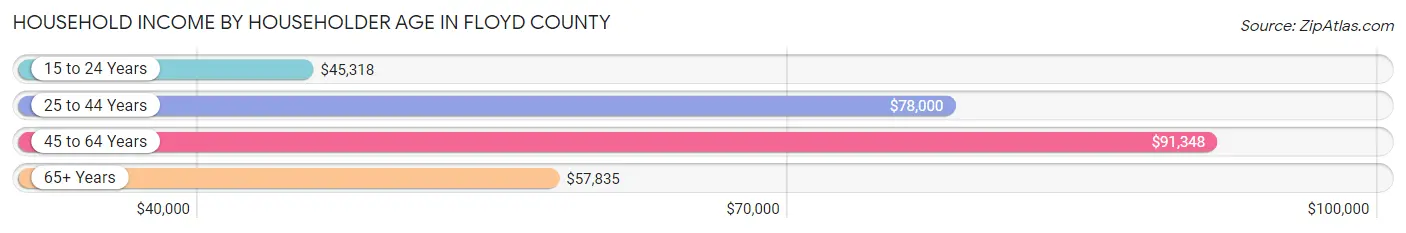
| Income Bracket | # Households | Median Income |
| 15 to 24 Years | 853 (2.8%) | $45,318 |
| 25 to 44 Years | 9,976 (32.3%) | $78,000 |
| 45 to 64 Years | 12,044 (39.0%) | $91,348 |
| 65+ Years | 8,038 (26.0%) | $57,835 |
| Total | 30,911 (100.0%) | $75,686 |
Poverty in Floyd County
Income Below Poverty by Sex and Age in Floyd County
With 7.8% poverty level for males and 10.9% for females among the residents of Floyd County, 5 year old males and under 5 year old females are the most vulnerable to poverty, with 136 males (24.9%) and 541 females (24.4%) in their respective age groups living below the poverty level.
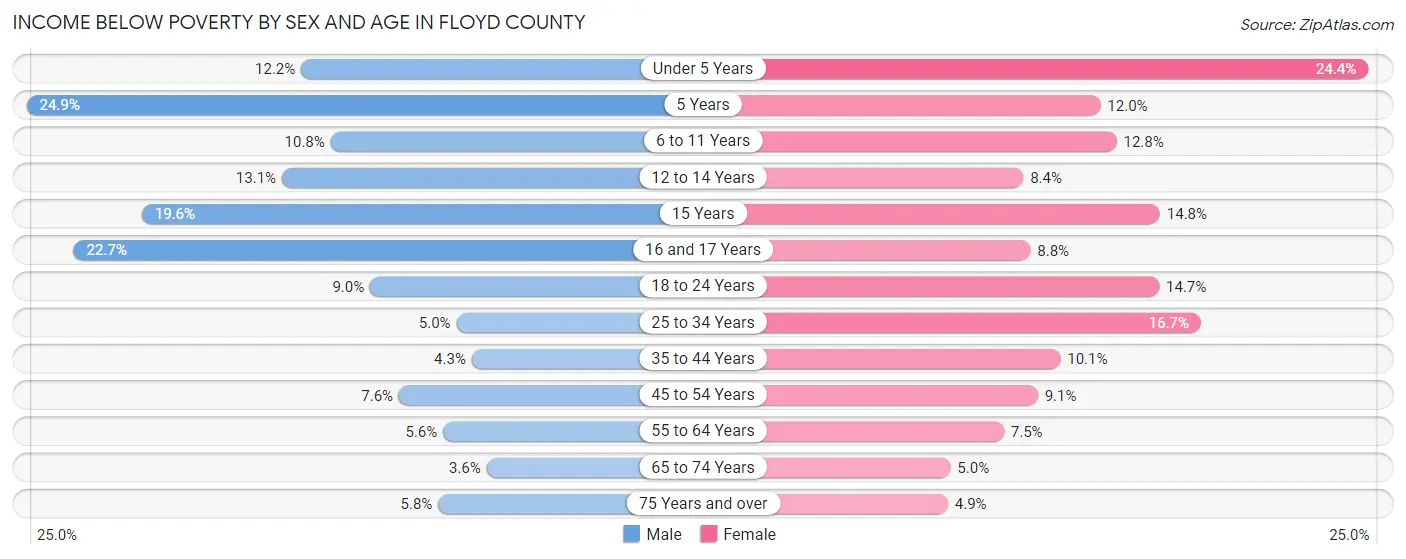
| Age Bracket | Male | Female |
| Under 5 Years | 266 (12.2%) | 541 (24.4%) |
| 5 Years | 136 (24.9%) | 42 (12.0%) |
| 6 to 11 Years | 307 (10.8%) | 397 (12.8%) |
| 12 to 14 Years | 242 (13.1%) | 115 (8.4%) |
| 15 Years | 98 (19.6%) | 71 (14.8%) |
| 16 and 17 Years | 270 (22.7%) | 91 (8.7%) |
| 18 to 24 Years | 293 (9.0%) | 473 (14.7%) |
| 25 to 34 Years | 260 (5.0%) | 846 (16.7%) |
| 35 to 44 Years | 206 (4.3%) | 538 (10.1%) |
| 45 to 54 Years | 373 (7.6%) | 465 (9.1%) |
| 55 to 64 Years | 311 (5.6%) | 424 (7.5%) |
| 65 to 74 Years | 135 (3.6%) | 221 (5.0%) |
| 75 Years and over | 106 (5.8%) | 132 (4.9%) |
| Total | 3,003 (7.8%) | 4,356 (10.9%) |
Income Above Poverty by Sex and Age in Floyd County
According to the poverty statistics in Floyd County, males aged 65 to 74 years and females aged 75 years and over are the age groups that are most secure financially, with 96.4% of males and 95.1% of females in these age groups living above the poverty line.
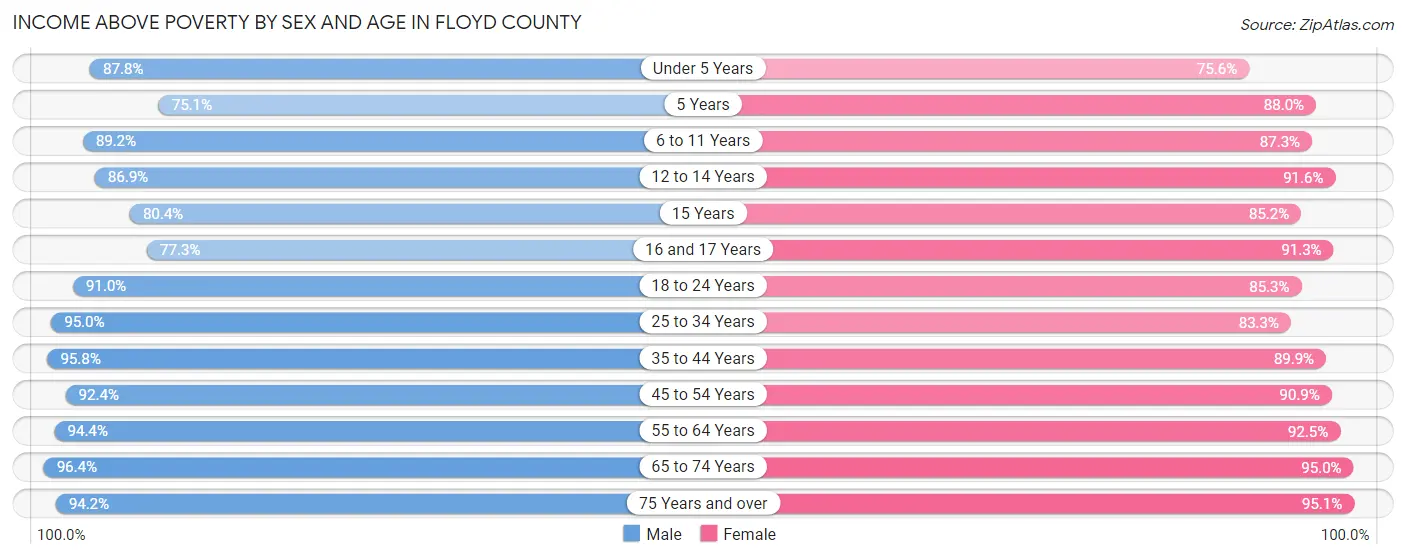
| Age Bracket | Male | Female |
| Under 5 Years | 1,919 (87.8%) | 1,674 (75.6%) |
| 5 Years | 410 (75.1%) | 308 (88.0%) |
| 6 to 11 Years | 2,536 (89.2%) | 2,717 (87.3%) |
| 12 to 14 Years | 1,611 (86.9%) | 1,251 (91.6%) |
| 15 Years | 403 (80.4%) | 410 (85.2%) |
| 16 and 17 Years | 918 (77.3%) | 949 (91.2%) |
| 18 to 24 Years | 2,972 (91.0%) | 2,741 (85.3%) |
| 25 to 34 Years | 4,980 (95.0%) | 4,232 (83.3%) |
| 35 to 44 Years | 4,640 (95.8%) | 4,770 (89.9%) |
| 45 to 54 Years | 4,518 (92.4%) | 4,650 (90.9%) |
| 55 to 64 Years | 5,265 (94.4%) | 5,211 (92.5%) |
| 65 to 74 Years | 3,661 (96.4%) | 4,160 (95.0%) |
| 75 Years and over | 1,719 (94.2%) | 2,553 (95.1%) |
| Total | 35,552 (92.2%) | 35,626 (89.1%) |
Income Below Poverty Among Married-Couple Families in Floyd County
The poverty statistics for married-couple families in Floyd County show that 1.7% or 259 of the total 15,099 families live below the poverty line. Families with 5 or more children have the highest poverty rate of 34.7%, comprising of 17 families. On the other hand, families with 1 or 2 children have the lowest poverty rate of 0.7%, which includes 34 families.
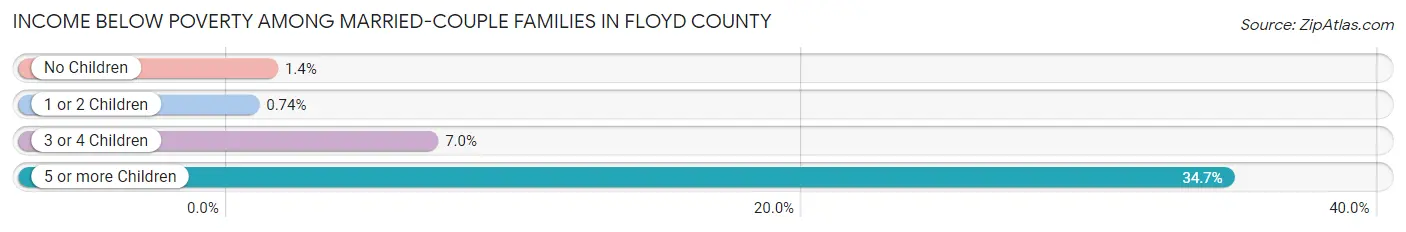
| Children | Above Poverty | Below Poverty |
| No Children | 9,184 (98.6%) | 129 (1.4%) |
| 1 or 2 Children | 4,570 (99.3%) | 34 (0.7%) |
| 3 or 4 Children | 1,054 (93.0%) | 79 (7.0%) |
| 5 or more Children | 32 (65.3%) | 17 (34.7%) |
| Total | 14,840 (98.3%) | 259 (1.7%) |
Income Below Poverty Among Single-Parent Households in Floyd County
According to the poverty data in Floyd County, 7.2% or 96 single-father households and 26.9% or 971 single-mother households are living below the poverty line. Among single-father households, those with 3 or 4 children have the highest poverty rate, with 32 households (13.9%) experiencing poverty. Likewise, among single-mother households, those with 5 or more children have the highest poverty rate, with 22 households (100.0%) falling below the poverty line.
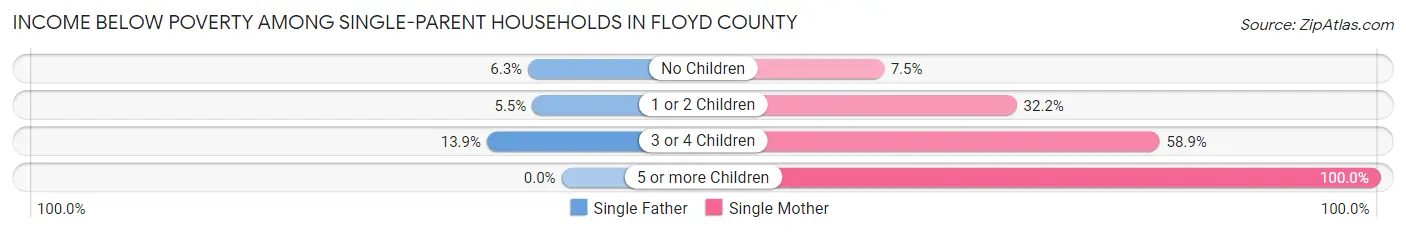
| Children | Single Father | Single Mother |
| No Children | 30 (6.2%) | 87 (7.5%) |
| 1 or 2 Children | 34 (5.5%) | 686 (32.2%) |
| 3 or 4 Children | 32 (13.9%) | 176 (58.9%) |
| 5 or more Children | 0 (0.0%) | 22 (100.0%) |
| Total | 96 (7.2%) | 971 (26.9%) |
Income Below Poverty Among Married-Couple vs Single-Parent Households in Floyd County
The poverty data for Floyd County shows that 259 of the married-couple family households (1.7%) and 1,067 of the single-parent households (21.6%) are living below the poverty level. Within the married-couple family households, those with 5 or more children have the highest poverty rate, with 17 households (34.7%) falling below the poverty line. Among the single-parent households, those with 5 or more children have the highest poverty rate, with 22 household (100.0%) living below poverty.
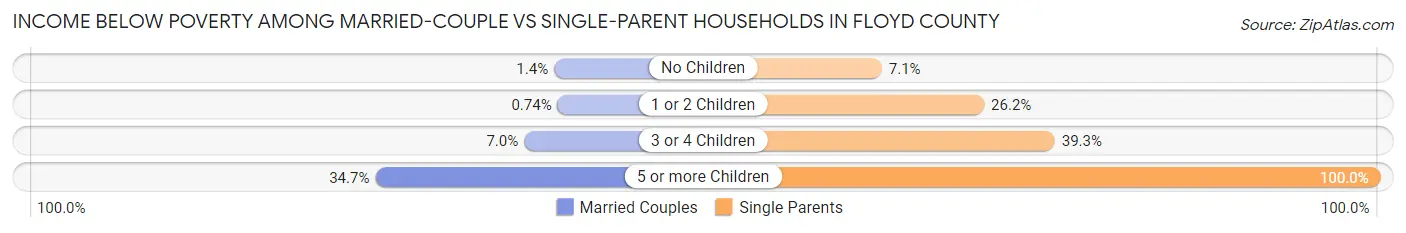
| Children | Married-Couple Families | Single-Parent Households |
| No Children | 129 (1.4%) | 117 (7.1%) |
| 1 or 2 Children | 34 (0.7%) | 720 (26.2%) |
| 3 or 4 Children | 79 (7.0%) | 208 (39.3%) |
| 5 or more Children | 17 (34.7%) | 22 (100.0%) |
| Total | 259 (1.7%) | 1,067 (21.6%) |
Employment Characteristics in Floyd County
Employment by Class of Employer in Floyd County
Among the 38,923 employed individuals in Floyd County, private company employees (28,158 | 72.3%), not-for-profit organizations (3,217 | 8.3%), and local government employees (2,099 | 5.4%) make up the most common classes of employment.
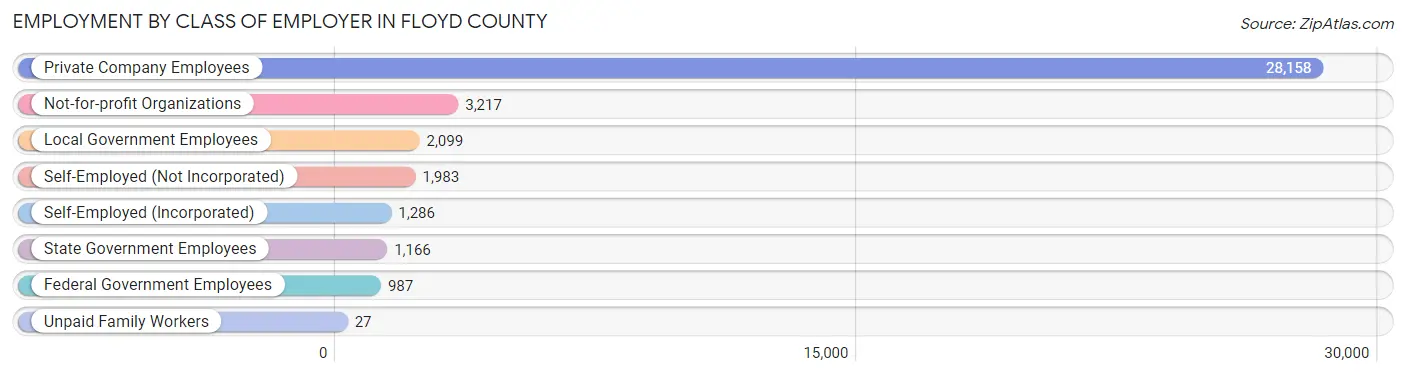
| Employer Class | # Employees | % Employees |
| Private Company Employees | 28,158 | 72.3% |
| Self-Employed (Incorporated) | 1,286 | 3.3% |
| Self-Employed (Not Incorporated) | 1,983 | 5.1% |
| Not-for-profit Organizations | 3,217 | 8.3% |
| Local Government Employees | 2,099 | 5.4% |
| State Government Employees | 1,166 | 3.0% |
| Federal Government Employees | 987 | 2.5% |
| Unpaid Family Workers | 27 | 0.1% |
| Total | 38,923 | 100.0% |
Employment Status by Age in Floyd County
According to the labor force statistics for Floyd County, out of the total population over 16 years of age (64,442), 64.2% or 41,372 individuals are in the labor force, with 3.9% or 1,614 of them unemployed. The age group with the highest labor force participation rate is 30 to 34 years, with 85.9% or 4,486 individuals in the labor force. Within the labor force, the 20 to 24 years age range has the highest percentage of unemployed individuals, with 8.6% or 329 of them being unemployed.
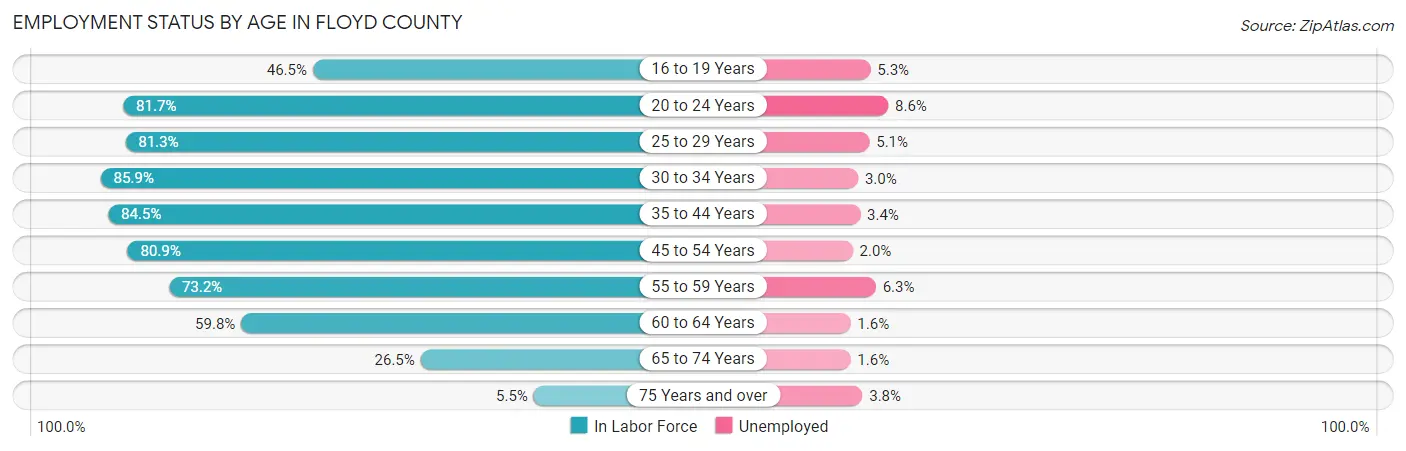
| Age Bracket | In Labor Force | Unemployed |
| 16 to 19 Years | 2,001 (46.5%) | 106 (5.3%) |
| 20 to 24 Years | 3,825 (81.7%) | 329 (8.6%) |
| 25 to 29 Years | 4,225 (81.3%) | 215 (5.1%) |
| 30 to 34 Years | 4,486 (85.9%) | 135 (3.0%) |
| 35 to 44 Years | 8,675 (84.5%) | 295 (3.4%) |
| 45 to 54 Years | 8,166 (80.9%) | 163 (2.0%) |
| 55 to 59 Years | 4,306 (73.2%) | 271 (6.3%) |
| 60 to 64 Years | 3,221 (59.8%) | 52 (1.6%) |
| 65 to 74 Years | 2,183 (26.5%) | 35 (1.6%) |
| 75 Years and over | 284 (5.5%) | 11 (3.8%) |
| Total | 41,372 (64.2%) | 1,614 (3.9%) |
Employment Status by Educational Attainment in Floyd County
According to labor force statistics for Floyd County, 78.7% of individuals (33,092) out of the total population between 25 and 64 years of age (42,048) are in the labor force, with 3.4% or 1,125 of them being unemployed. The group with the highest labor force participation rate are those with the educational attainment of bachelor's degree or higher, with 88.4% or 12,241 individuals in the labor force. Within the labor force, individuals with high school diploma education have the highest percentage of unemployment, with 7.1% or 596 of them being unemployed.
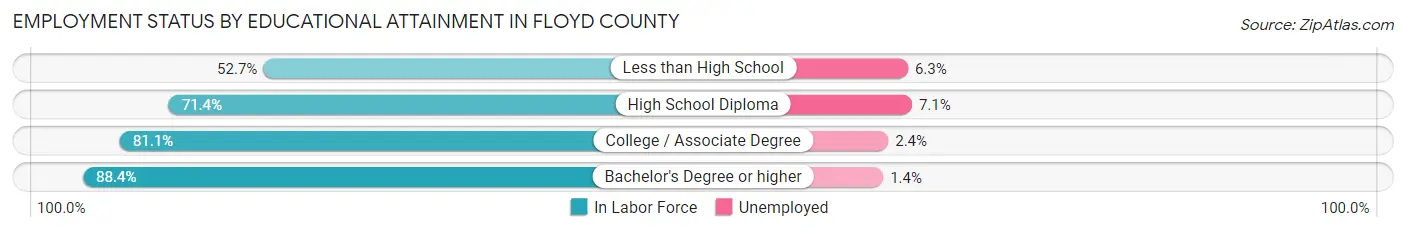
| Educational Attainment | In Labor Force | Unemployed |
| Less than High School | 1,645 (52.7%) | 197 (6.3%) |
| High School Diploma | 8,388 (71.4%) | 834 (7.1%) |
| College / Associate Degree | 10,812 (81.1%) | 320 (2.4%) |
| Bachelor's Degree or higher | 12,241 (88.4%) | 194 (1.4%) |
| Total | 33,092 (78.7%) | 1,430 (3.4%) |
Employment Occupations by Sex in Floyd County
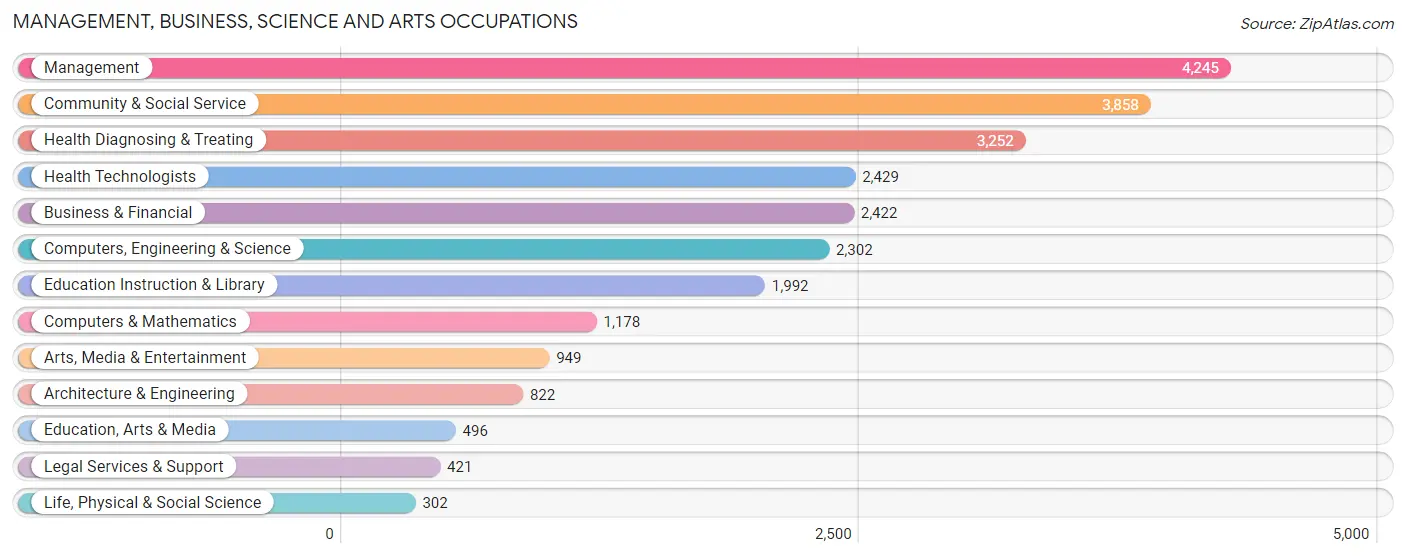
Management, Business, Science and Arts Occupations
The most common Management, Business, Science and Arts occupations in Floyd County are Management (4,245 | 10.7%), Community & Social Service (3,858 | 9.7%), Health Diagnosing & Treating (3,252 | 8.2%), Health Technologists (2,429 | 6.1%), and Business & Financial (2,422 | 6.1%).
Management, Business, Science and Arts Occupations by Sex
Within the Management, Business, Science and Arts occupations in Floyd County, the most male-oriented occupations are Architecture & Engineering (83.7%), Computers, Engineering & Science (72.4%), and Computers & Mathematics (69.1%), while the most female-oriented occupations are Health Diagnosing & Treating (80.6%), Health Technologists (78.6%), and Education Instruction & Library (73.3%).
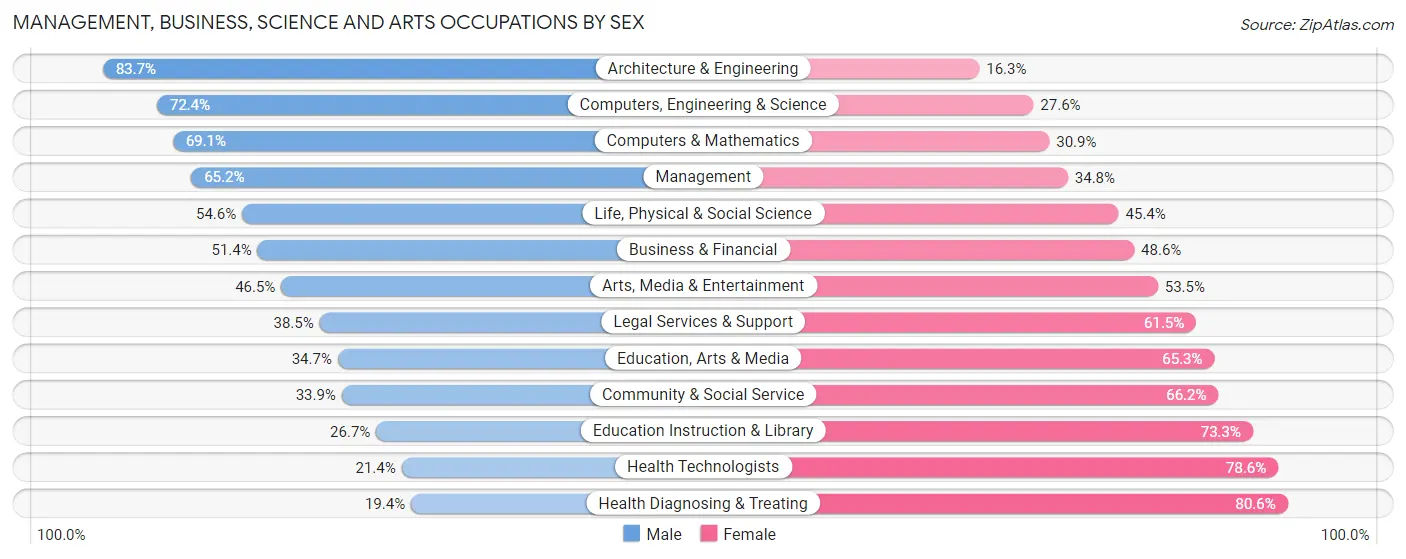
| Occupation | Male | Female |
| Management | 2,769 (65.2%) | 1,476 (34.8%) |
| Business & Financial | 1,245 (51.4%) | 1,177 (48.6%) |
| Computers, Engineering & Science | 1,667 (72.4%) | 635 (27.6%) |
| Computers & Mathematics | 814 (69.1%) | 364 (30.9%) |
| Architecture & Engineering | 688 (83.7%) | 134 (16.3%) |
| Life, Physical & Social Science | 165 (54.6%) | 137 (45.4%) |
| Community & Social Service | 1,306 (33.9%) | 2,552 (66.1%) |
| Education, Arts & Media | 172 (34.7%) | 324 (65.3%) |
| Legal Services & Support | 162 (38.5%) | 259 (61.5%) |
| Education Instruction & Library | 531 (26.7%) | 1,461 (73.3%) |
| Arts, Media & Entertainment | 441 (46.5%) | 508 (53.5%) |
| Health Diagnosing & Treating | 631 (19.4%) | 2,621 (80.6%) |
| Health Technologists | 519 (21.4%) | 1,910 (78.6%) |
| Total (Category) | 7,618 (47.4%) | 8,461 (52.6%) |
| Total (Overall) | 20,730 (52.3%) | 18,924 (47.7%) |
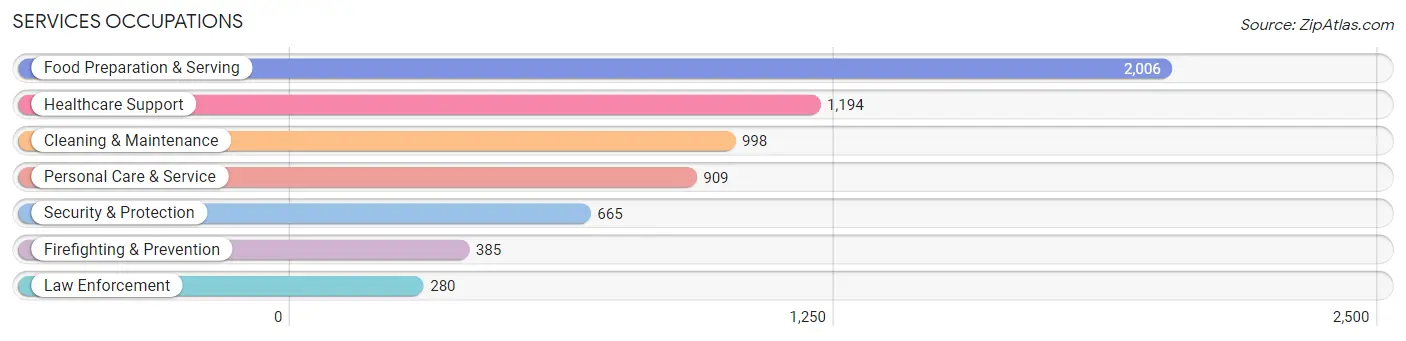
Services Occupations
The most common Services occupations in Floyd County are Food Preparation & Serving (2,006 | 5.1%), Healthcare Support (1,194 | 3.0%), Cleaning & Maintenance (998 | 2.5%), Personal Care & Service (909 | 2.3%), and Security & Protection (665 | 1.7%).
Services Occupations by Sex
Within the Services occupations in Floyd County, the most male-oriented occupations are Firefighting & Prevention (95.8%), Security & Protection (90.1%), and Law Enforcement (82.1%), while the most female-oriented occupations are Healthcare Support (90.7%), Personal Care & Service (78.3%), and Food Preparation & Serving (63.5%).
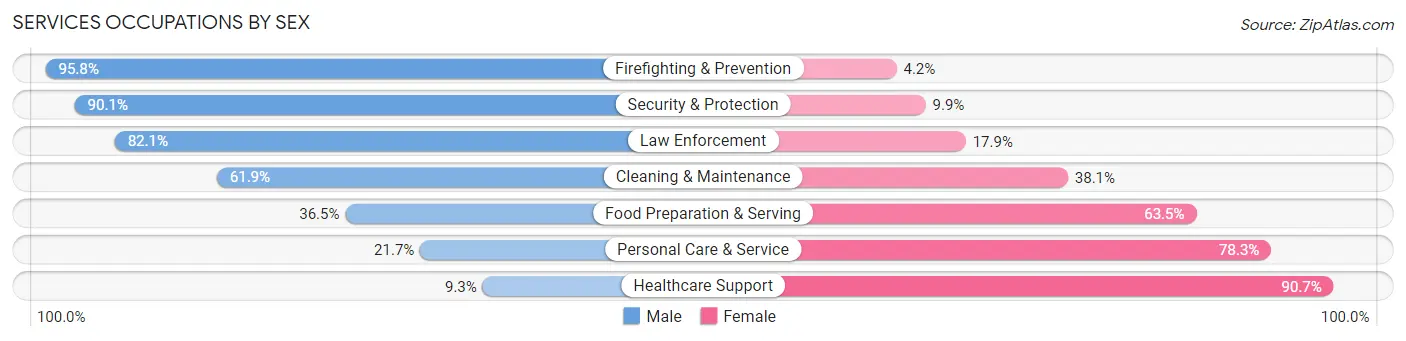
| Occupation | Male | Female |
| Healthcare Support | 111 (9.3%) | 1,083 (90.7%) |
| Security & Protection | 599 (90.1%) | 66 (9.9%) |
| Firefighting & Prevention | 369 (95.8%) | 16 (4.2%) |
| Law Enforcement | 230 (82.1%) | 50 (17.9%) |
| Food Preparation & Serving | 732 (36.5%) | 1,274 (63.5%) |
| Cleaning & Maintenance | 618 (61.9%) | 380 (38.1%) |
| Personal Care & Service | 197 (21.7%) | 712 (78.3%) |
| Total (Category) | 2,257 (39.1%) | 3,515 (60.9%) |
| Total (Overall) | 20,730 (52.3%) | 18,924 (47.7%) |
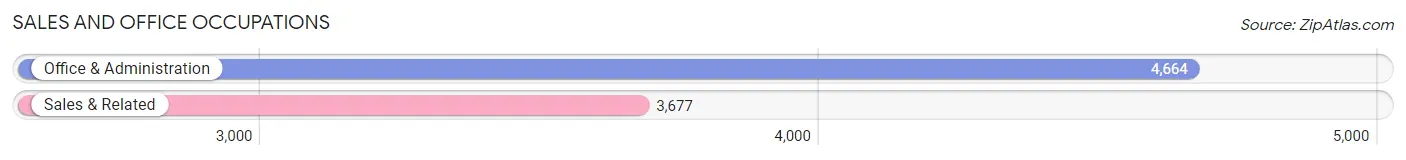
Sales and Office Occupations
The most common Sales and Office occupations in Floyd County are Office & Administration (4,664 | 11.8%), and Sales & Related (3,677 | 9.3%).
Sales and Office Occupations by Sex
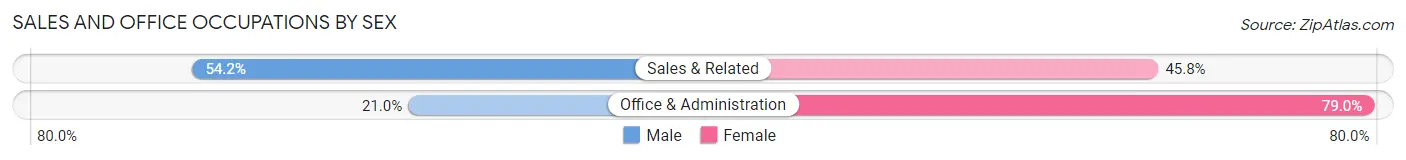
| Occupation | Male | Female |
| Sales & Related | 1,992 (54.2%) | 1,685 (45.8%) |
| Office & Administration | 980 (21.0%) | 3,684 (79.0%) |
| Total (Category) | 2,972 (35.6%) | 5,369 (64.4%) |
| Total (Overall) | 20,730 (52.3%) | 18,924 (47.7%) |
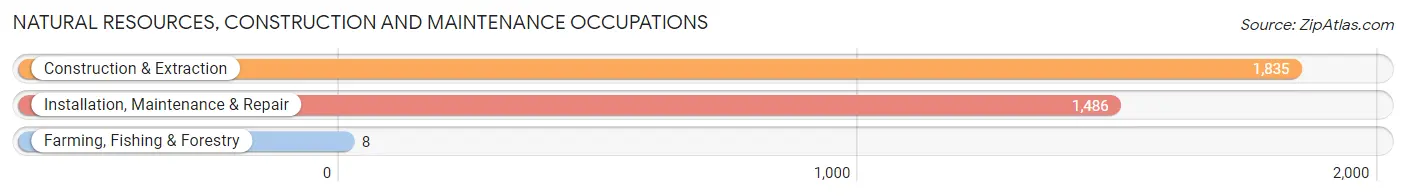
Natural Resources, Construction and Maintenance Occupations
The most common Natural Resources, Construction and Maintenance occupations in Floyd County are Construction & Extraction (1,835 | 4.6%), Installation, Maintenance & Repair (1,486 | 3.7%), and Farming, Fishing & Forestry (8 | 0.0%).
Natural Resources, Construction and Maintenance Occupations by Sex
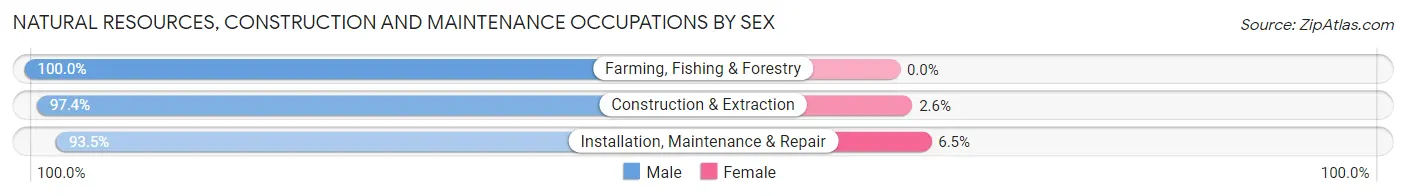
| Occupation | Male | Female |
| Farming, Fishing & Forestry | 8 (100.0%) | 0 (0.0%) |
| Construction & Extraction | 1,788 (97.4%) | 47 (2.6%) |
| Installation, Maintenance & Repair | 1,389 (93.5%) | 97 (6.5%) |
| Total (Category) | 3,185 (95.7%) | 144 (4.3%) |
| Total (Overall) | 20,730 (52.3%) | 18,924 (47.7%) |
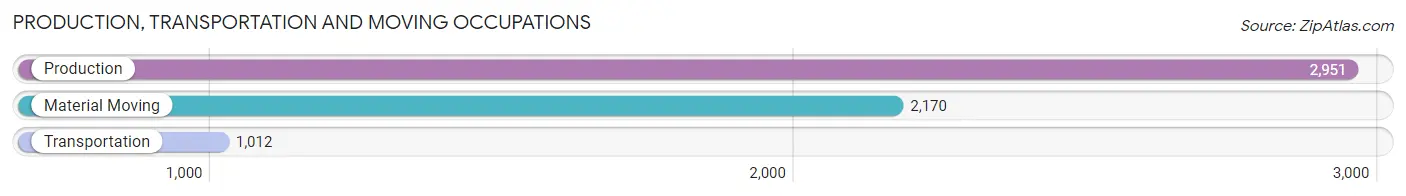
Production, Transportation and Moving Occupations
The most common Production, Transportation and Moving occupations in Floyd County are Production (2,951 | 7.4%), Material Moving (2,170 | 5.5%), and Transportation (1,012 | 2.5%).
Production, Transportation and Moving Occupations by Sex
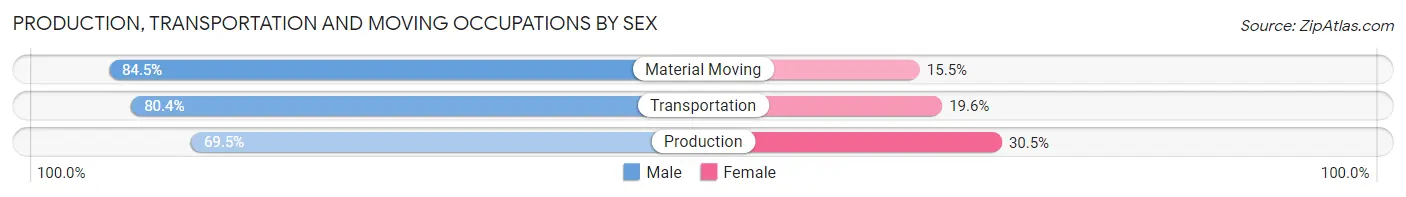
| Occupation | Male | Female |
| Production | 2,050 (69.5%) | 901 (30.5%) |
| Transportation | 814 (80.4%) | 198 (19.6%) |
| Material Moving | 1,834 (84.5%) | 336 (15.5%) |
| Total (Category) | 4,698 (76.6%) | 1,435 (23.4%) |
| Total (Overall) | 20,730 (52.3%) | 18,924 (47.7%) |
Employment Industries by Sex in Floyd County
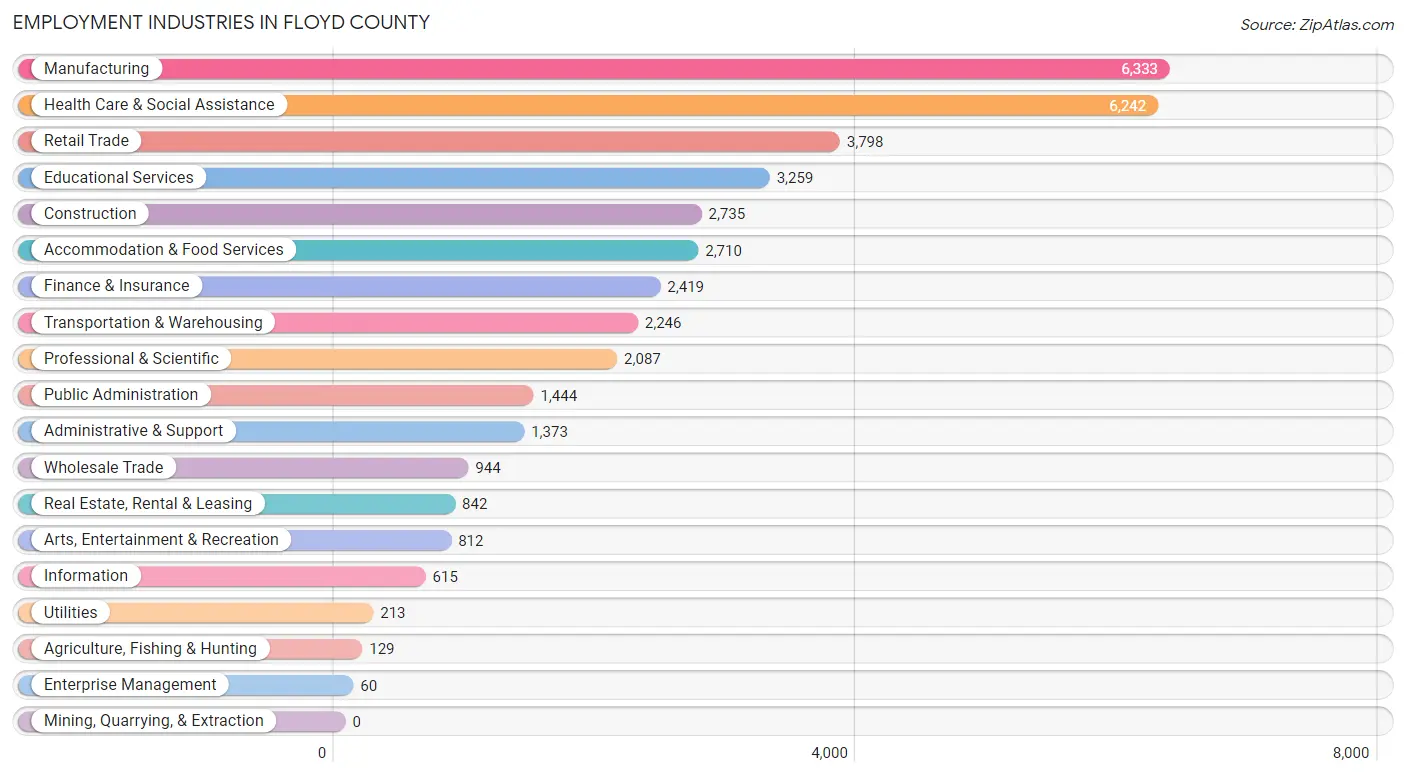
Employment Industries in Floyd County
The major employment industries in Floyd County include Manufacturing (6,333 | 16.0%), Health Care & Social Assistance (6,242 | 15.7%), Retail Trade (3,798 | 9.6%), Educational Services (3,259 | 8.2%), and Construction (2,735 | 6.9%).
Employment Industries by Sex in Floyd County
The Floyd County industries that see more men than women are Construction (91.2%), Transportation & Warehousing (78.4%), and Information (76.4%), whereas the industries that tend to have a higher number of women are Health Care & Social Assistance (83.6%), Educational Services (73.7%), and Finance & Insurance (57.0%).
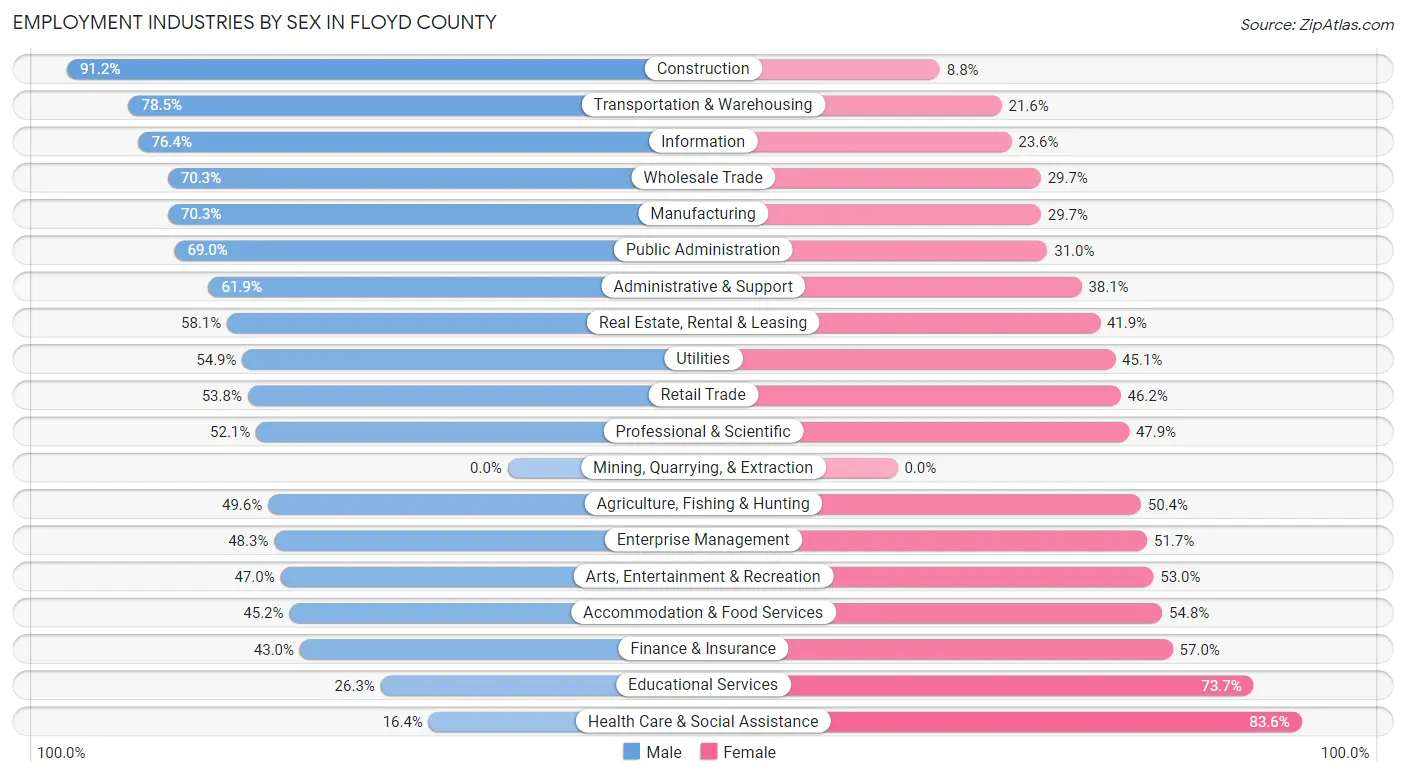
| Industry | Male | Female |
| Agriculture, Fishing & Hunting | 64 (49.6%) | 65 (50.4%) |
| Mining, Quarrying, & Extraction | 0 (0.0%) | 0 (0.0%) |
| Construction | 2,495 (91.2%) | 240 (8.8%) |
| Manufacturing | 4,453 (70.3%) | 1,880 (29.7%) |
| Wholesale Trade | 664 (70.3%) | 280 (29.7%) |
| Retail Trade | 2,044 (53.8%) | 1,754 (46.2%) |
| Transportation & Warehousing | 1,762 (78.4%) | 484 (21.5%) |
| Utilities | 117 (54.9%) | 96 (45.1%) |
| Information | 470 (76.4%) | 145 (23.6%) |
| Finance & Insurance | 1,041 (43.0%) | 1,378 (57.0%) |
| Real Estate, Rental & Leasing | 489 (58.1%) | 353 (41.9%) |
| Professional & Scientific | 1,087 (52.1%) | 1,000 (47.9%) |
| Enterprise Management | 29 (48.3%) | 31 (51.7%) |
| Administrative & Support | 850 (61.9%) | 523 (38.1%) |
| Educational Services | 857 (26.3%) | 2,402 (73.7%) |
| Health Care & Social Assistance | 1,021 (16.4%) | 5,221 (83.6%) |
| Arts, Entertainment & Recreation | 382 (47.0%) | 430 (53.0%) |
| Accommodation & Food Services | 1,225 (45.2%) | 1,485 (54.8%) |
| Public Administration | 996 (69.0%) | 448 (31.0%) |
| Total | 20,730 (52.3%) | 18,924 (47.7%) |
Education in Floyd County
School Enrollment in Floyd County
The most common levels of schooling among the 18,739 students in Floyd County are high school (4,803 | 25.6%), elementary school (4,037 | 21.5%), and middle school (3,935 | 21.0%).
| School Level | # Students | % Students |
| Nursery / Preschool | 1,194 | 6.4% |
| Kindergarten | 929 | 5.0% |
| Elementary School | 4,037 | 21.5% |
| Middle School | 3,935 | 21.0% |
| High School | 4,803 | 25.6% |
| College / Undergraduate | 2,920 | 15.6% |
| Graduate / Professional | 921 | 4.9% |
| Total | 18,739 | 100.0% |
School Enrollment by Age by Funding Source in Floyd County
Out of a total of 18,739 students who are enrolled in schools in Floyd County, 3,204 (17.1%) attend a private institution, while the remaining 15,535 (82.9%) are enrolled in public schools. The age group of 3 to 4 year olds has the highest likelihood of being enrolled in private schools, with 531 (51.8% in the age bracket) enrolled. Conversely, the age group of 20 to 24 year olds has the lowest likelihood of being enrolled in a private school, with 1,185 (92.6% in the age bracket) attending a public institution.
| Age Bracket | Public School | Private School |
| 3 to 4 Year Olds | 494 (48.2%) | 531 (51.8%) |
| 5 to 9 Year Old | 3,785 (82.2%) | 822 (17.8%) |
| 10 to 14 Year Olds | 4,624 (88.4%) | 607 (11.6%) |
| 15 to 17 Year Olds | 2,912 (91.7%) | 264 (8.3%) |
| 18 to 19 Year Olds | 1,211 (79.6%) | 310 (20.4%) |
| 20 to 24 Year Olds | 1,185 (92.6%) | 94 (7.3%) |
| 25 to 34 Year Olds | 646 (62.7%) | 384 (37.3%) |
| 35 Years and over | 680 (78.2%) | 190 (21.8%) |
| Total | 15,535 (82.9%) | 3,204 (17.1%) |
Educational Attainment by Field of Study in Floyd County
Business (3,819 | 20.7%), education (2,829 | 15.3%), science & technology (2,403 | 13.0%), bio, nature & agricultural (1,174 | 6.4%), and social sciences (1,074 | 5.8%) are the most common fields of study among 18,452 individuals in Floyd County who have obtained a bachelor's degree or higher.
| Field of Study | # Graduates | % Graduates |
| Computers & Mathematics | 645 | 3.5% |
| Bio, Nature & Agricultural | 1,174 | 6.4% |
| Physical & Health Sciences | 595 | 3.2% |
| Psychology | 863 | 4.7% |
| Social Sciences | 1,074 | 5.8% |
| Engineering | 996 | 5.4% |
| Multidisciplinary Studies | 283 | 1.5% |
| Science & Technology | 2,403 | 13.0% |
| Business | 3,819 | 20.7% |
| Education | 2,829 | 15.3% |
| Literature & Languages | 824 | 4.5% |
| Liberal Arts & History | 912 | 4.9% |
| Visual & Performing Arts | 575 | 3.1% |
| Communications | 757 | 4.1% |
| Arts & Humanities | 703 | 3.8% |
| Total | 18,452 | 100.0% |
Transportation & Commute in Floyd County
Vehicle Availability by Sex in Floyd County
The most prevalent vehicle ownership categories in Floyd County are males with 2 vehicles (8,238, accounting for 40.5%) and females with 2 vehicles (6,874, making up 44.7%).
| Vehicles Available | Male | Female |
| No Vehicle | 316 (1.6%) | 284 (1.5%) |
| 1 Vehicle | 2,836 (14.0%) | 3,586 (19.5%) |
| 2 Vehicles | 8,238 (40.5%) | 6,874 (37.3%) |
| 3 Vehicles | 4,747 (23.4%) | 4,403 (23.9%) |
| 4 Vehicles | 2,452 (12.1%) | 2,194 (11.9%) |
| 5 or more Vehicles | 1,730 (8.5%) | 1,077 (5.9%) |
| Total | 20,319 (100.0%) | 18,418 (100.0%) |
Commute Time in Floyd County
The most frequently occuring commute durations in Floyd County are 20 to 24 minutes (6,762 commuters, 19.4%), 15 to 19 minutes (6,310 commuters, 18.1%), and 30 to 34 minutes (4,957 commuters, 14.2%).
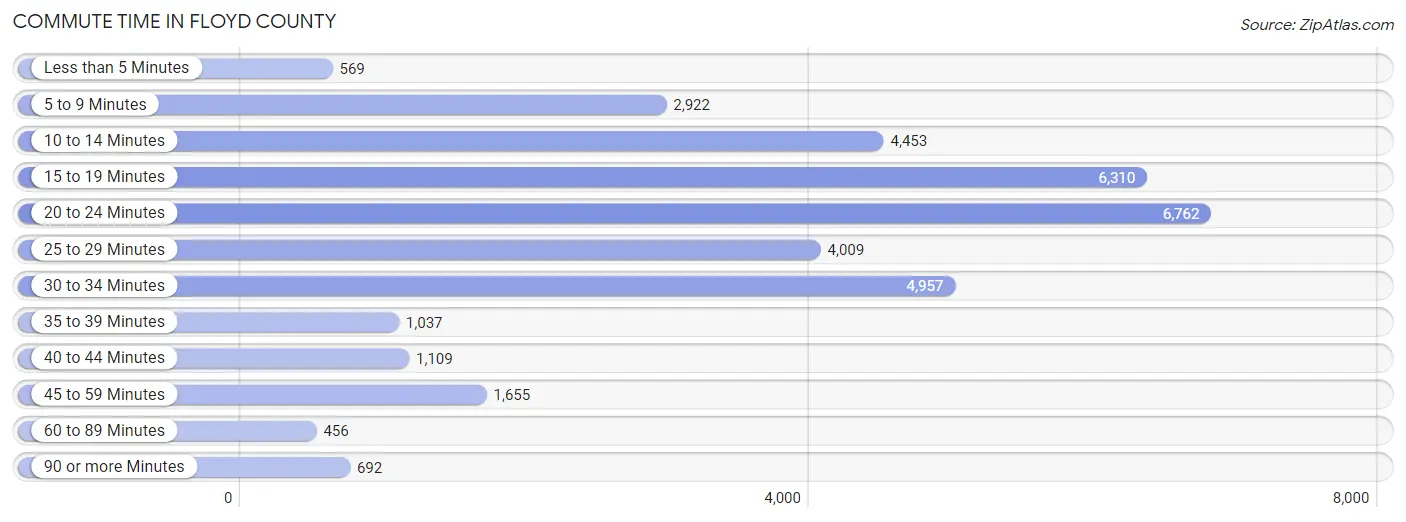
| Commute Time | # Commuters | % Commuters |
| Less than 5 Minutes | 569 | 1.6% |
| 5 to 9 Minutes | 2,922 | 8.4% |
| 10 to 14 Minutes | 4,453 | 12.8% |
| 15 to 19 Minutes | 6,310 | 18.1% |
| 20 to 24 Minutes | 6,762 | 19.4% |
| 25 to 29 Minutes | 4,009 | 11.5% |
| 30 to 34 Minutes | 4,957 | 14.2% |
| 35 to 39 Minutes | 1,037 | 3.0% |
| 40 to 44 Minutes | 1,109 | 3.2% |
| 45 to 59 Minutes | 1,655 | 4.7% |
| 60 to 89 Minutes | 456 | 1.3% |
| 90 or more Minutes | 692 | 2.0% |
Commute Time by Sex in Floyd County
The most common commute times in Floyd County are 20 to 24 minutes (3,425 commuters, 18.2%) for males and 20 to 24 minutes (3,337 commuters, 20.7%) for females.
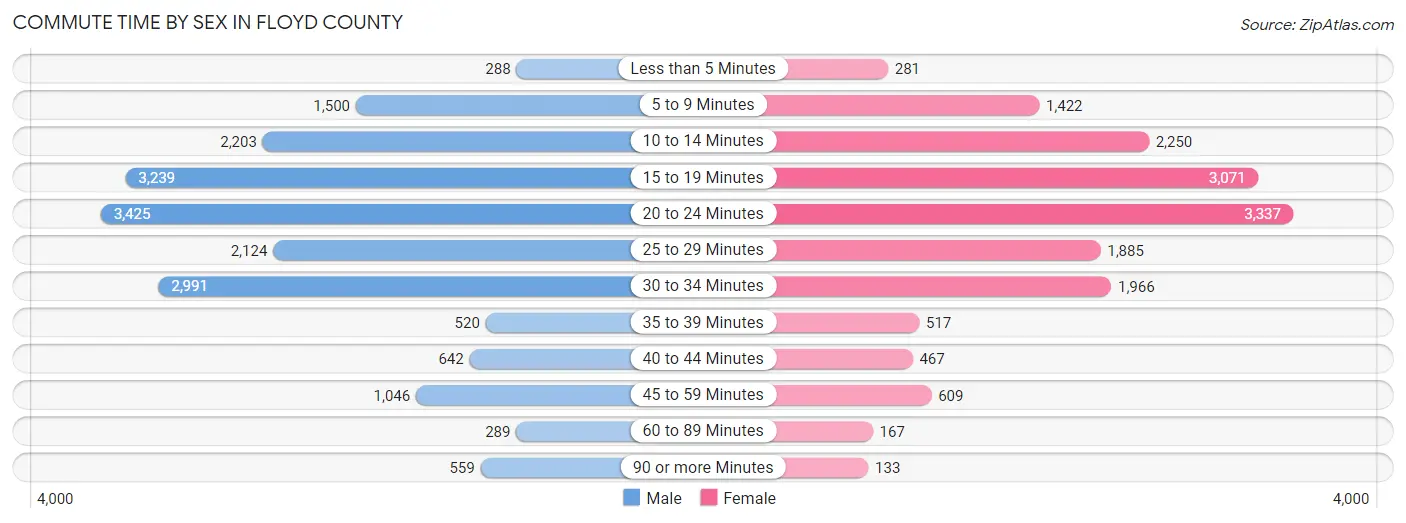
| Commute Time | Male | Female |
| Less than 5 Minutes | 288 (1.5%) | 281 (1.7%) |
| 5 to 9 Minutes | 1,500 (8.0%) | 1,422 (8.8%) |
| 10 to 14 Minutes | 2,203 (11.7%) | 2,250 (14.0%) |
| 15 to 19 Minutes | 3,239 (17.2%) | 3,071 (19.1%) |
| 20 to 24 Minutes | 3,425 (18.2%) | 3,337 (20.7%) |
| 25 to 29 Minutes | 2,124 (11.3%) | 1,885 (11.7%) |
| 30 to 34 Minutes | 2,991 (15.9%) | 1,966 (12.2%) |
| 35 to 39 Minutes | 520 (2.8%) | 517 (3.2%) |
| 40 to 44 Minutes | 642 (3.4%) | 467 (2.9%) |
| 45 to 59 Minutes | 1,046 (5.6%) | 609 (3.8%) |
| 60 to 89 Minutes | 289 (1.5%) | 167 (1.0%) |
| 90 or more Minutes | 559 (3.0%) | 133 (0.8%) |
Time of Departure to Work by Sex in Floyd County
The most frequent times of departure to work in Floyd County are 7:30 AM to 7:59 AM (2,410, 12.8%) for males and 7:30 AM to 7:59 AM (2,538, 15.8%) for females.
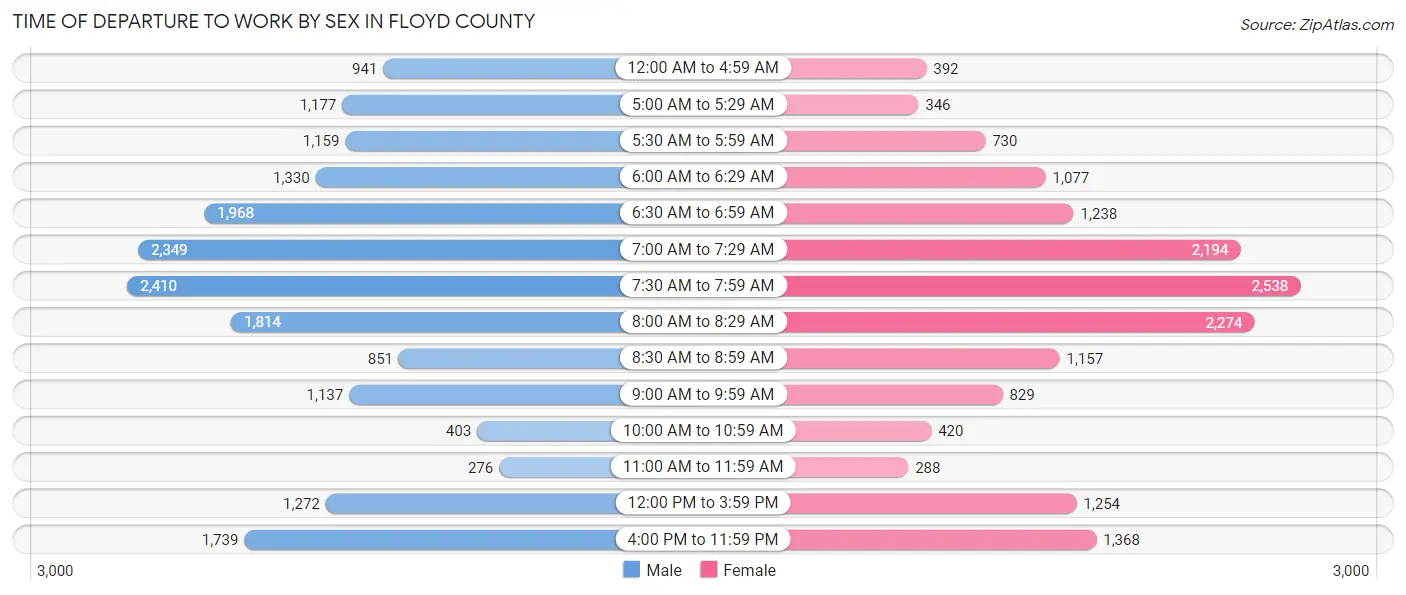
| Time of Departure | Male | Female |
| 12:00 AM to 4:59 AM | 941 (5.0%) | 392 (2.4%) |
| 5:00 AM to 5:29 AM | 1,177 (6.2%) | 346 (2.1%) |
| 5:30 AM to 5:59 AM | 1,159 (6.2%) | 730 (4.5%) |
| 6:00 AM to 6:29 AM | 1,330 (7.1%) | 1,077 (6.7%) |
| 6:30 AM to 6:59 AM | 1,968 (10.4%) | 1,238 (7.7%) |
| 7:00 AM to 7:29 AM | 2,349 (12.5%) | 2,194 (13.6%) |
| 7:30 AM to 7:59 AM | 2,410 (12.8%) | 2,538 (15.8%) |
| 8:00 AM to 8:29 AM | 1,814 (9.6%) | 2,274 (14.1%) |
| 8:30 AM to 8:59 AM | 851 (4.5%) | 1,157 (7.2%) |
| 9:00 AM to 9:59 AM | 1,137 (6.0%) | 829 (5.1%) |
| 10:00 AM to 10:59 AM | 403 (2.1%) | 420 (2.6%) |
| 11:00 AM to 11:59 AM | 276 (1.5%) | 288 (1.8%) |
| 12:00 PM to 3:59 PM | 1,272 (6.8%) | 1,254 (7.8%) |
| 4:00 PM to 11:59 PM | 1,739 (9.2%) | 1,368 (8.5%) |
| Total | 18,826 (100.0%) | 16,105 (100.0%) |
Housing Occupancy in Floyd County
Occupancy by Ownership in Floyd County
Of the total 30,911 dwellings in Floyd County, owner-occupied units account for 22,987 (74.4%), while renter-occupied units make up 7,924 (25.6%).
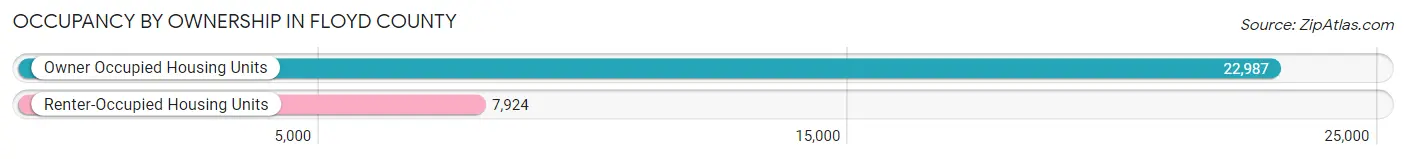
| Occupancy | # Housing Units | % Housing Units |
| Owner Occupied Housing Units | 22,987 | 74.4% |
| Renter-Occupied Housing Units | 7,924 | 25.6% |
| Total Occupied Housing Units | 30,911 | 100.0% |
Occupancy by Household Size in Floyd County
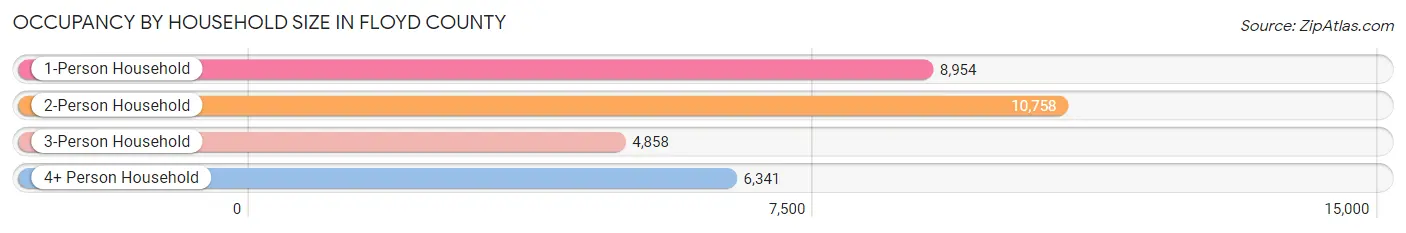
| Household Size | # Housing Units | % Housing Units |
| 1-Person Household | 8,954 | 29.0% |
| 2-Person Household | 10,758 | 34.8% |
| 3-Person Household | 4,858 | 15.7% |
| 4+ Person Household | 6,341 | 20.5% |
| Total Housing Units | 30,911 | 100.0% |
Occupancy by Ownership by Household Size in Floyd County
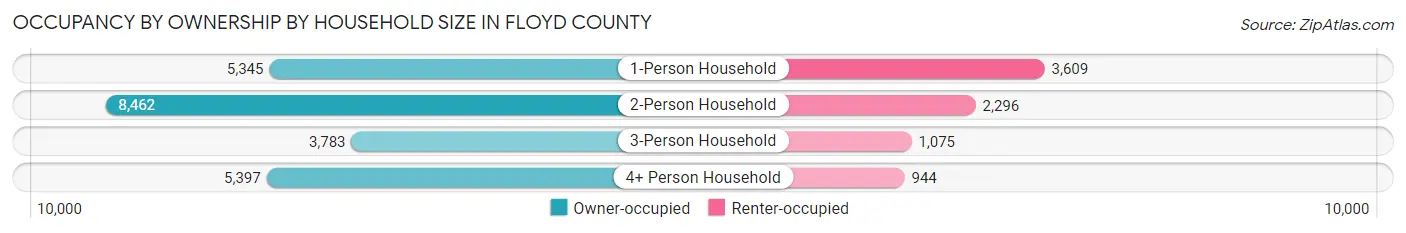
| Household Size | Owner-occupied | Renter-occupied |
| 1-Person Household | 5,345 (59.7%) | 3,609 (40.3%) |
| 2-Person Household | 8,462 (78.7%) | 2,296 (21.3%) |
| 3-Person Household | 3,783 (77.9%) | 1,075 (22.1%) |
| 4+ Person Household | 5,397 (85.1%) | 944 (14.9%) |
| Total Housing Units | 22,987 (74.4%) | 7,924 (25.6%) |
Occupancy by Educational Attainment in Floyd County
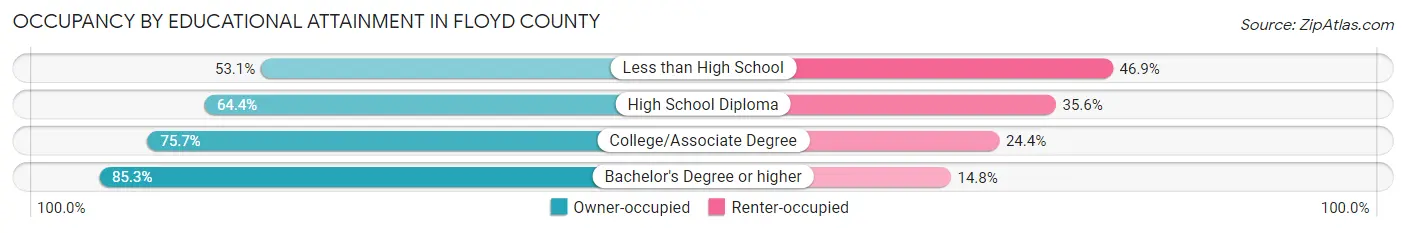
| Household Size | Owner-occupied | Renter-occupied |
| Less than High School | 1,114 (53.1%) | 983 (46.9%) |
| High School Diploma | 5,292 (64.4%) | 2,920 (35.6%) |
| College/Associate Degree | 7,741 (75.6%) | 2,491 (24.3%) |
| Bachelor's Degree or higher | 8,840 (85.3%) | 1,530 (14.7%) |
Occupancy by Age of Householder in Floyd County
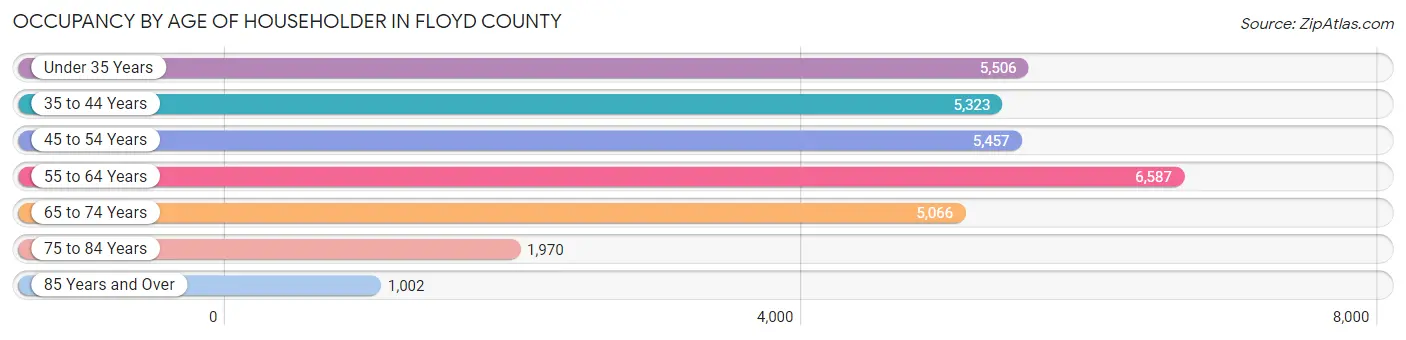
| Age Bracket | # Households | % Households |
| Under 35 Years | 5,506 | 17.8% |
| 35 to 44 Years | 5,323 | 17.2% |
| 45 to 54 Years | 5,457 | 17.6% |
| 55 to 64 Years | 6,587 | 21.3% |
| 65 to 74 Years | 5,066 | 16.4% |
| 75 to 84 Years | 1,970 | 6.4% |
| 85 Years and Over | 1,002 | 3.2% |
| Total | 30,911 | 100.0% |
Housing Finances in Floyd County
Median Income by Occupancy in Floyd County
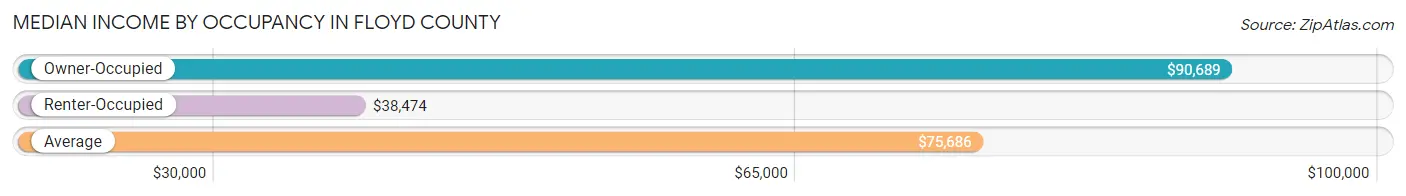
| Occupancy Type | # Households | Median Income |
| Owner-Occupied | 22,987 (74.4%) | $90,689 |
| Renter-Occupied | 7,924 (25.6%) | $38,474 |
| Average | 30,911 (100.0%) | $75,686 |
Occupancy by Householder Income Bracket in Floyd County
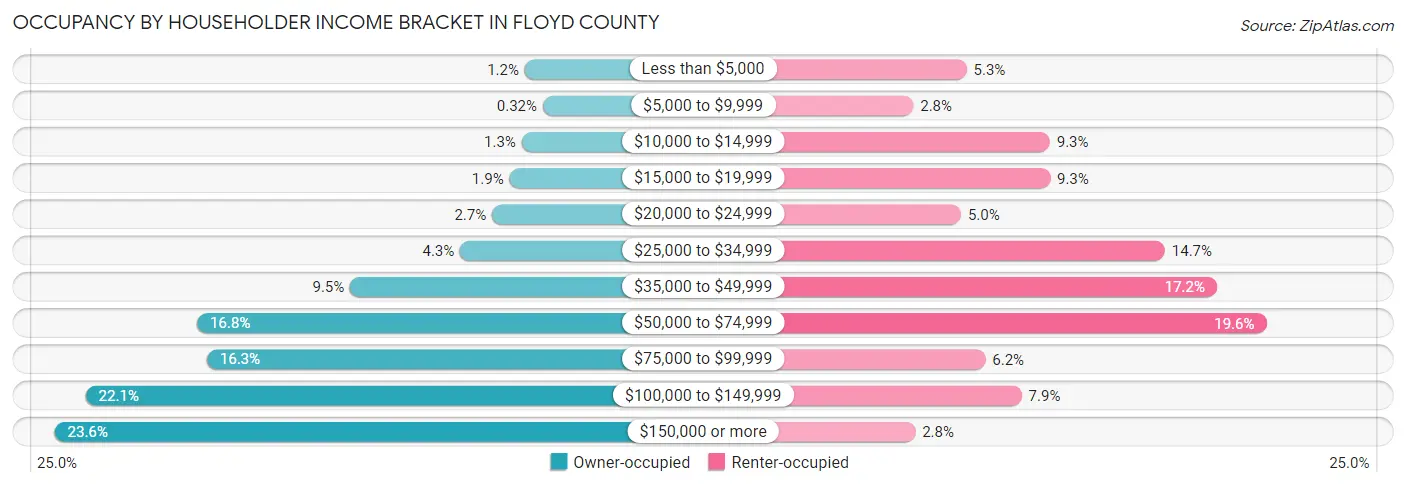
| Income Bracket | Owner-occupied | Renter-occupied |
| Less than $5,000 | 271 (1.2%) | 419 (5.3%) |
| $5,000 to $9,999 | 74 (0.3%) | 218 (2.8%) |
| $10,000 to $14,999 | 306 (1.3%) | 733 (9.2%) |
| $15,000 to $19,999 | 438 (1.9%) | 734 (9.3%) |
| $20,000 to $24,999 | 630 (2.7%) | 398 (5.0%) |
| $25,000 to $34,999 | 979 (4.3%) | 1,167 (14.7%) |
| $35,000 to $49,999 | 2,183 (9.5%) | 1,363 (17.2%) |
| $50,000 to $74,999 | 3,860 (16.8%) | 1,550 (19.6%) |
| $75,000 to $99,999 | 3,751 (16.3%) | 490 (6.2%) |
| $100,000 to $149,999 | 5,077 (22.1%) | 627 (7.9%) |
| $150,000 or more | 5,418 (23.6%) | 225 (2.8%) |
| Total | 22,987 (100.0%) | 7,924 (100.0%) |
Monthly Housing Cost Tiers in Floyd County
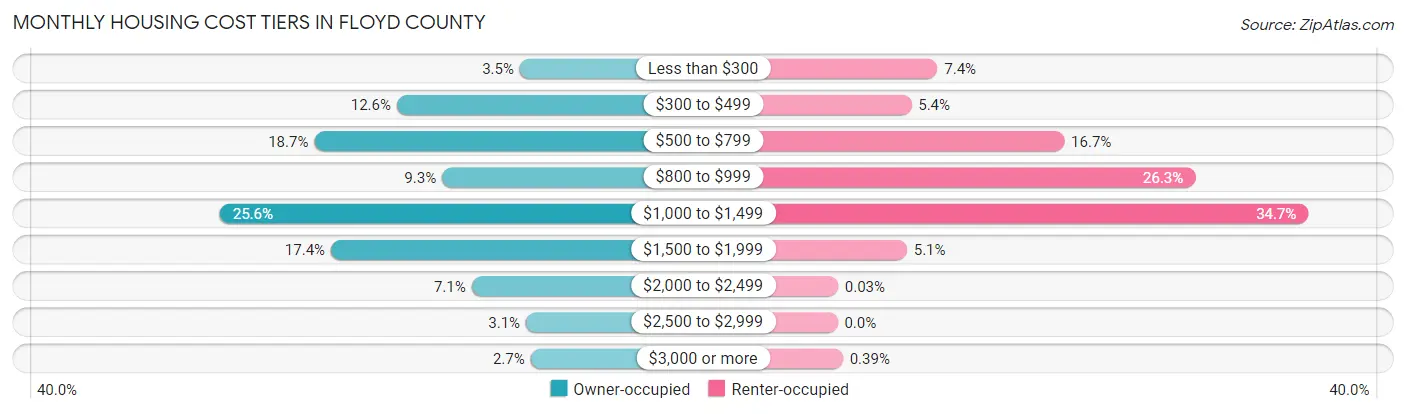
| Monthly Cost | Owner-occupied | Renter-occupied |
| Less than $300 | 811 (3.5%) | 583 (7.4%) |
| $300 to $499 | 2,895 (12.6%) | 431 (5.4%) |
| $500 to $799 | 4,291 (18.7%) | 1,323 (16.7%) |
| $800 to $999 | 2,128 (9.3%) | 2,087 (26.3%) |
| $1,000 to $1,499 | 5,889 (25.6%) | 2,747 (34.7%) |
| $1,500 to $1,999 | 4,009 (17.4%) | 405 (5.1%) |
| $2,000 to $2,499 | 1,627 (7.1%) | 2 (0.0%) |
| $2,500 to $2,999 | 708 (3.1%) | 0 (0.0%) |
| $3,000 or more | 629 (2.7%) | 31 (0.4%) |
| Total | 22,987 (100.0%) | 7,924 (100.0%) |
Physical Housing Characteristics in Floyd County
Housing Structures in Floyd County
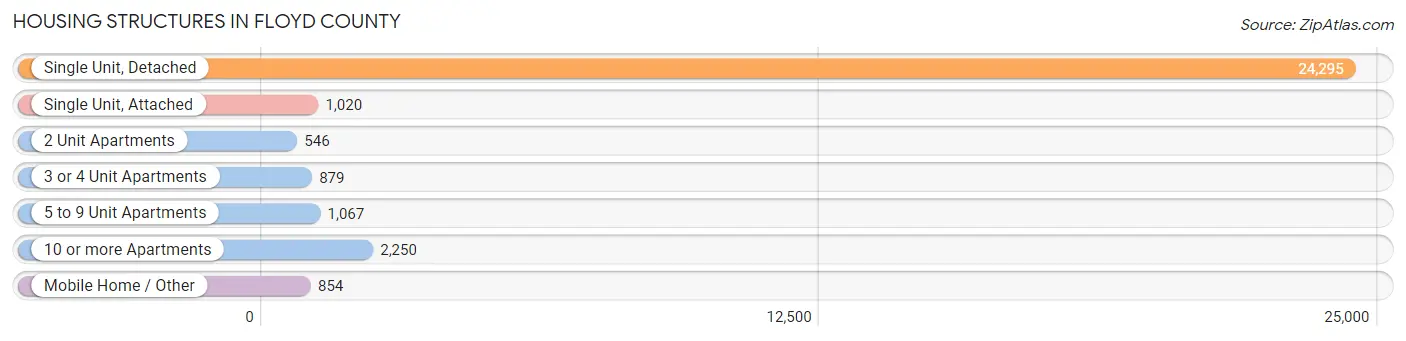
| Structure Type | # Housing Units | % Housing Units |
| Single Unit, Detached | 24,295 | 78.6% |
| Single Unit, Attached | 1,020 | 3.3% |
| 2 Unit Apartments | 546 | 1.8% |
| 3 or 4 Unit Apartments | 879 | 2.8% |
| 5 to 9 Unit Apartments | 1,067 | 3.5% |
| 10 or more Apartments | 2,250 | 7.3% |
| Mobile Home / Other | 854 | 2.8% |
| Total | 30,911 | 100.0% |
Housing Structures by Occupancy in Floyd County
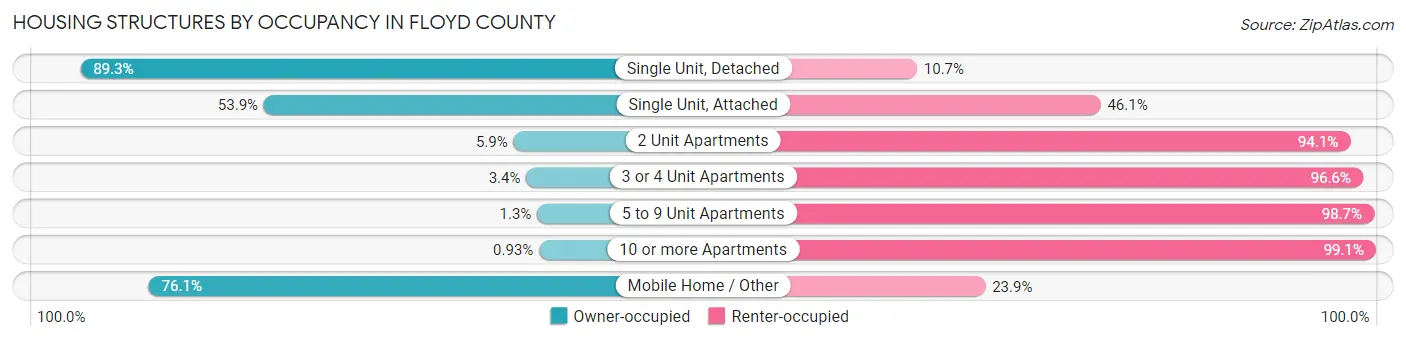
| Structure Type | Owner-occupied | Renter-occupied |
| Single Unit, Detached | 21,690 (89.3%) | 2,605 (10.7%) |
| Single Unit, Attached | 550 (53.9%) | 470 (46.1%) |
| 2 Unit Apartments | 32 (5.9%) | 514 (94.1%) |
| 3 or 4 Unit Apartments | 30 (3.4%) | 849 (96.6%) |
| 5 to 9 Unit Apartments | 14 (1.3%) | 1,053 (98.7%) |
| 10 or more Apartments | 21 (0.9%) | 2,229 (99.1%) |
| Mobile Home / Other | 650 (76.1%) | 204 (23.9%) |
| Total | 22,987 (74.4%) | 7,924 (25.6%) |
Housing Structures by Number of Rooms in Floyd County
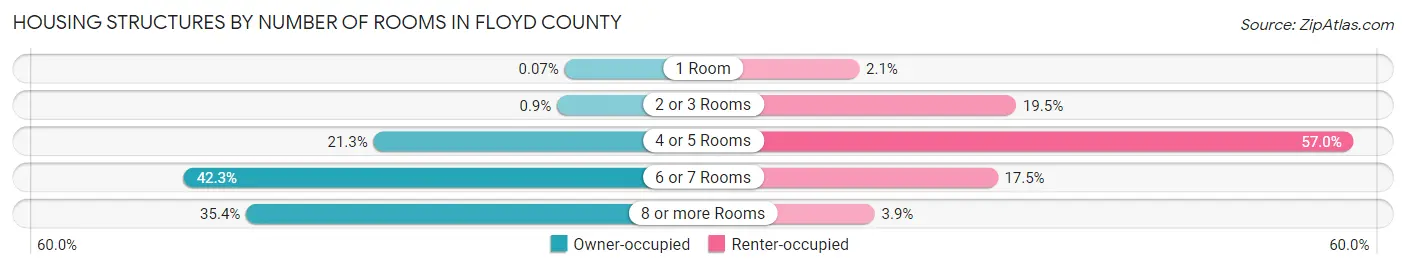
| Number of Rooms | Owner-occupied | Renter-occupied |
| 1 Room | 17 (0.1%) | 169 (2.1%) |
| 2 or 3 Rooms | 207 (0.9%) | 1,548 (19.5%) |
| 4 or 5 Rooms | 4,890 (21.3%) | 4,517 (57.0%) |
| 6 or 7 Rooms | 9,733 (42.3%) | 1,385 (17.5%) |
| 8 or more Rooms | 8,140 (35.4%) | 305 (3.8%) |
| Total | 22,987 (100.0%) | 7,924 (100.0%) |
Housing Structure by Heating Type in Floyd County
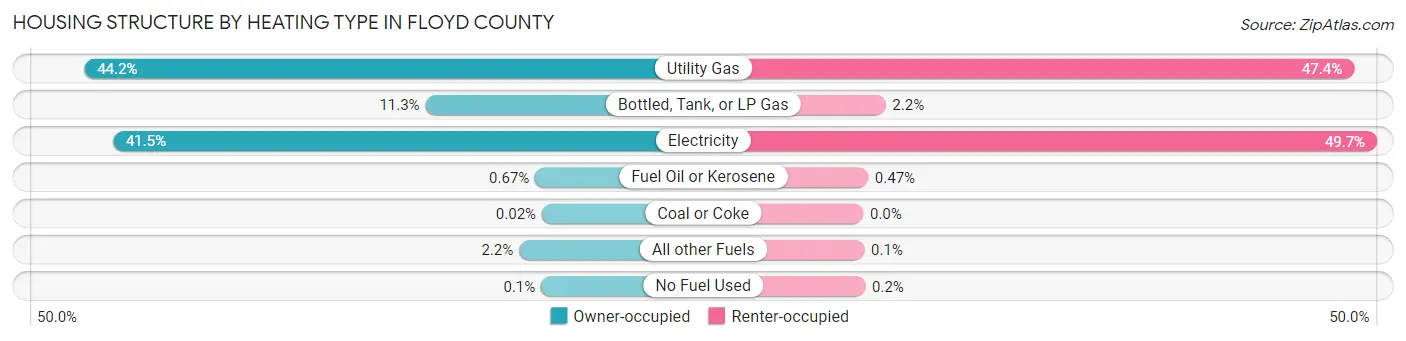
| Heating Type | Owner-occupied | Renter-occupied |
| Utility Gas | 10,170 (44.2%) | 3,758 (47.4%) |
| Bottled, Tank, or LP Gas | 2,590 (11.3%) | 171 (2.2%) |
| Electricity | 9,534 (41.5%) | 3,934 (49.6%) |
| Fuel Oil or Kerosene | 153 (0.7%) | 37 (0.5%) |
| Coal or Coke | 5 (0.0%) | 0 (0.0%) |
| All other Fuels | 513 (2.2%) | 8 (0.1%) |
| No Fuel Used | 22 (0.1%) | 16 (0.2%) |
| Total | 22,987 (100.0%) | 7,924 (100.0%) |
Household Vehicle Usage in Floyd County
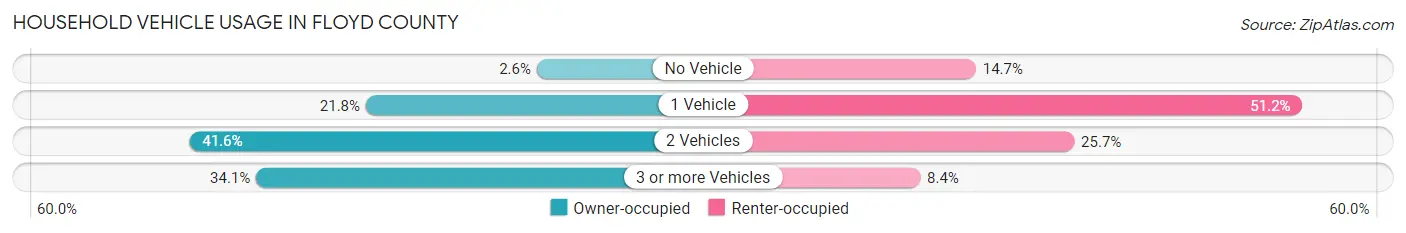
| Vehicles per Household | Owner-occupied | Renter-occupied |
| No Vehicle | 603 (2.6%) | 1,162 (14.7%) |
| 1 Vehicle | 5,004 (21.8%) | 4,060 (51.2%) |
| 2 Vehicles | 9,551 (41.5%) | 2,035 (25.7%) |
| 3 or more Vehicles | 7,829 (34.1%) | 667 (8.4%) |
| Total | 22,987 (100.0%) | 7,924 (100.0%) |
Real Estate & Mortgages in Floyd County
Real Estate and Mortgage Overview in Floyd County
| Characteristic | Without Mortgage | With Mortgage |
| Housing Units | 7,285 | 15,702 |
| Median Property Value | $201,500 | $220,300 |
| Median Household Income | $68,551 | $4,032 |
| Monthly Housing Costs | $518 | $612 |
| Real Estate Taxes | $1,542 | $455 |
Property Value by Mortgage Status in Floyd County
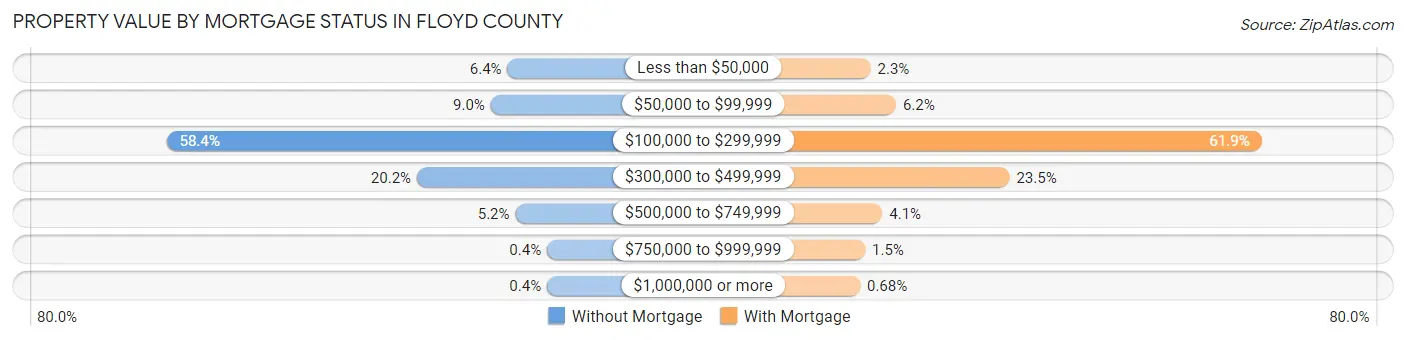
| Property Value | Without Mortgage | With Mortgage |
| Less than $50,000 | 468 (6.4%) | 359 (2.3%) |
| $50,000 to $99,999 | 654 (9.0%) | 968 (6.2%) |
| $100,000 to $299,999 | 4,252 (58.4%) | 9,714 (61.9%) |
| $300,000 to $499,999 | 1,473 (20.2%) | 3,684 (23.5%) |
| $500,000 to $749,999 | 380 (5.2%) | 641 (4.1%) |
| $750,000 to $999,999 | 29 (0.4%) | 229 (1.5%) |
| $1,000,000 or more | 29 (0.4%) | 107 (0.7%) |
| Total | 7,285 (100.0%) | 15,702 (100.0%) |
Household Income by Mortgage Status in Floyd County
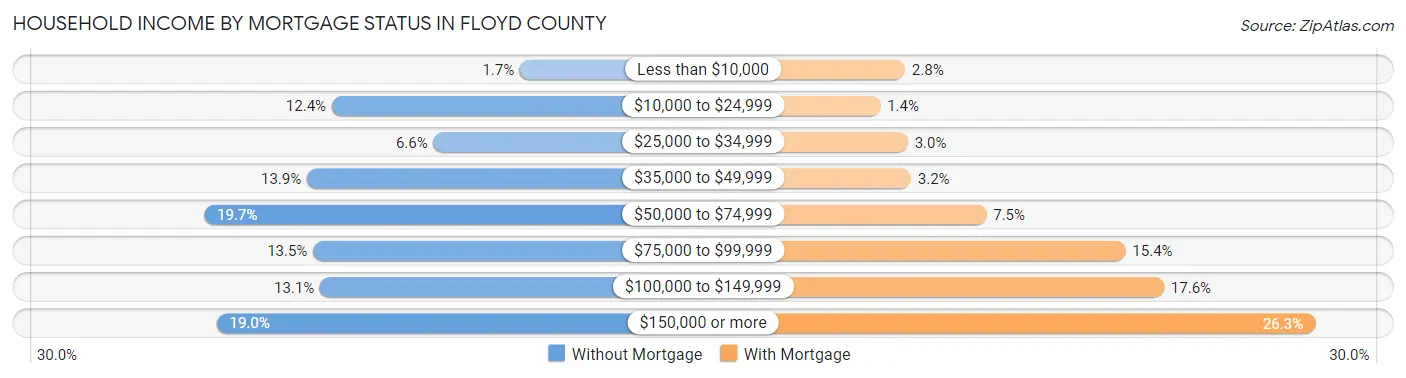
| Household Income | Without Mortgage | With Mortgage |
| Less than $10,000 | 123 (1.7%) | 443 (2.8%) |
| $10,000 to $24,999 | 906 (12.4%) | 222 (1.4%) |
| $25,000 to $34,999 | 483 (6.6%) | 468 (3.0%) |
| $35,000 to $49,999 | 1,010 (13.9%) | 496 (3.2%) |
| $50,000 to $74,999 | 1,438 (19.7%) | 1,173 (7.5%) |
| $75,000 to $99,999 | 984 (13.5%) | 2,422 (15.4%) |
| $100,000 to $149,999 | 955 (13.1%) | 2,767 (17.6%) |
| $150,000 or more | 1,386 (19.0%) | 4,122 (26.3%) |
| Total | 7,285 (100.0%) | 15,702 (100.0%) |
Property Value to Household Income Ratio in Floyd County
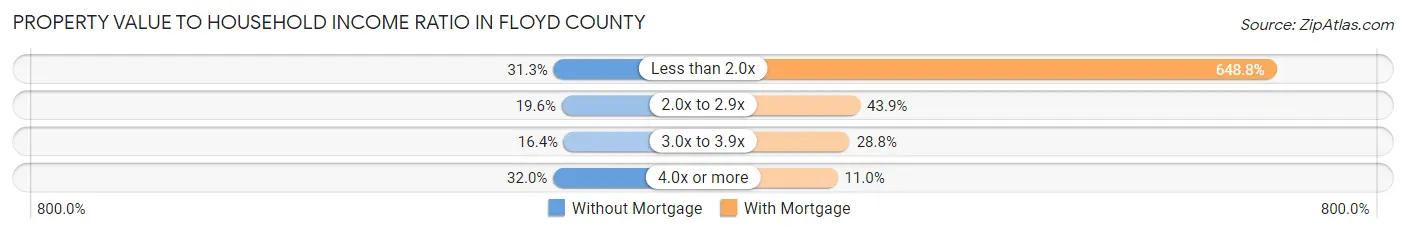
| Value-to-Income Ratio | Without Mortgage | With Mortgage |
| Less than 2.0x | 2,282 (31.3%) | 101,866 (648.7%) |
| 2.0x to 2.9x | 1,430 (19.6%) | 6,897 (43.9%) |
| 3.0x to 3.9x | 1,197 (16.4%) | 4,514 (28.7%) |
| 4.0x or more | 2,334 (32.0%) | 1,734 (11.0%) |
| Total | 7,285 (100.0%) | 15,702 (100.0%) |
Real Estate Taxes by Mortgage Status in Floyd County
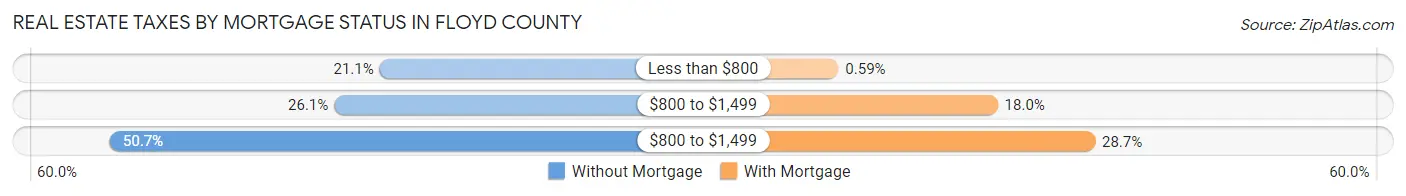
| Property Taxes | Without Mortgage | With Mortgage |
| Less than $800 | 1,537 (21.1%) | 93 (0.6%) |
| $800 to $1,499 | 1,900 (26.1%) | 2,833 (18.0%) |
| $800 to $1,499 | 3,690 (50.6%) | 4,508 (28.7%) |
| Total | 7,285 (100.0%) | 15,702 (100.0%) |
Health & Disability in Floyd County
Health Insurance Coverage by Age in Floyd County
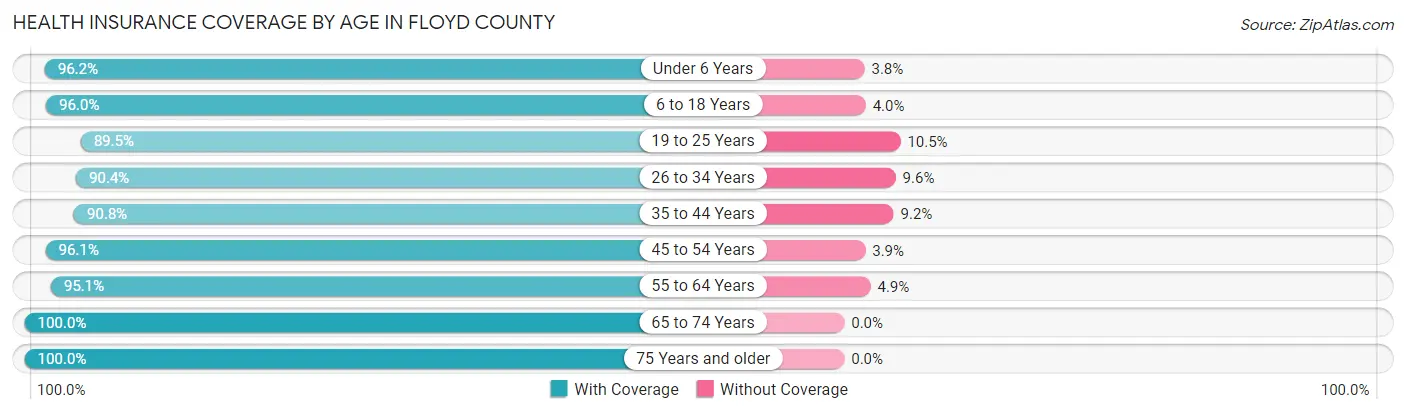
| Age Bracket | With Coverage | Without Coverage |
| Under 6 Years | 5,252 (96.2%) | 206 (3.8%) |
| 6 to 18 Years | 13,054 (96.0%) | 544 (4.0%) |
| 19 to 25 Years | 5,780 (89.5%) | 676 (10.5%) |
| 26 to 34 Years | 8,575 (90.4%) | 909 (9.6%) |
| 35 to 44 Years | 9,163 (90.8%) | 928 (9.2%) |
| 45 to 54 Years | 9,605 (96.1%) | 391 (3.9%) |
| 55 to 64 Years | 10,663 (95.1%) | 548 (4.9%) |
| 65 to 74 Years | 8,177 (100.0%) | 0 (0.0%) |
| 75 Years and older | 4,510 (100.0%) | 0 (0.0%) |
| Total | 74,779 (94.7%) | 4,202 (5.3%) |
Health Insurance Coverage by Citizenship Status in Floyd County
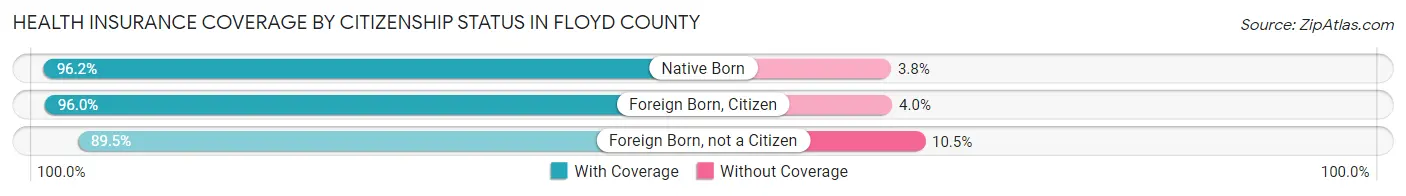
| Citizenship Status | With Coverage | Without Coverage |
| Native Born | 5,252 (96.2%) | 206 (3.8%) |
| Foreign Born, Citizen | 13,054 (96.0%) | 544 (4.0%) |
| Foreign Born, not a Citizen | 5,780 (89.5%) | 676 (10.5%) |
Health Insurance Coverage by Household Income in Floyd County
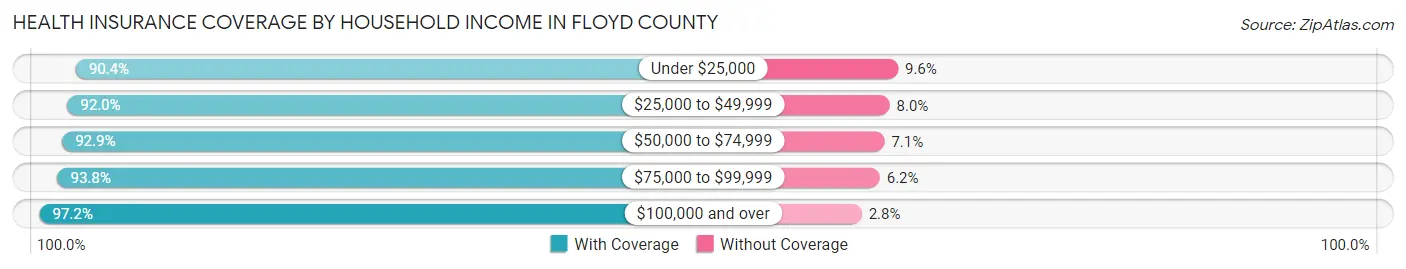
| Household Income | With Coverage | Without Coverage |
| Under $25,000 | 6,769 (90.4%) | 719 (9.6%) |
| $25,000 to $49,999 | 9,242 (92.0%) | 806 (8.0%) |
| $50,000 to $74,999 | 11,916 (92.9%) | 905 (7.1%) |
| $75,000 to $99,999 | 11,043 (93.8%) | 727 (6.2%) |
| $100,000 and over | 35,472 (97.2%) | 1,023 (2.8%) |
Public vs Private Health Insurance Coverage by Age in Floyd County
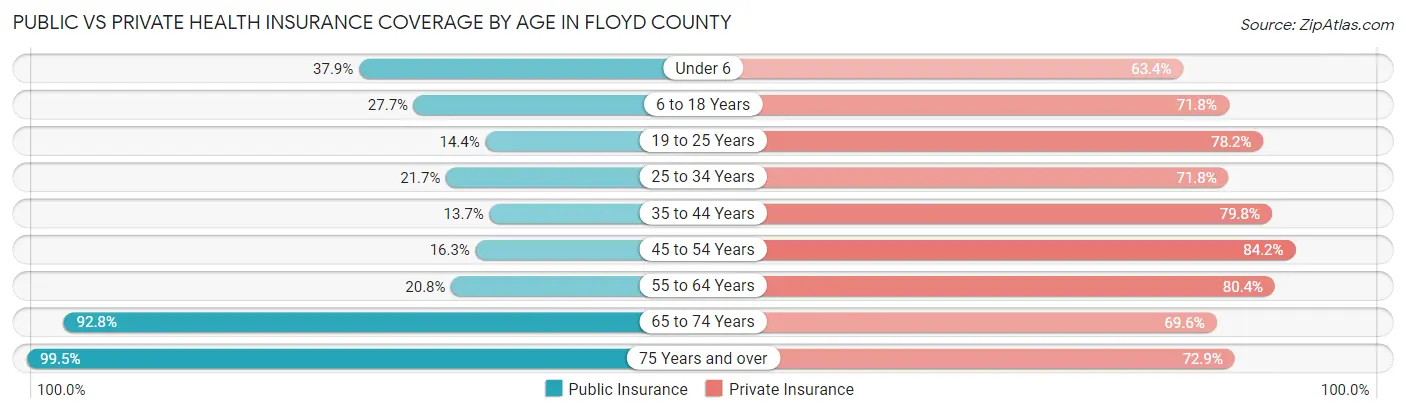
| Age Bracket | Public Insurance | Private Insurance |
| Under 6 | 2,069 (37.9%) | 3,460 (63.4%) |
| 6 to 18 Years | 3,772 (27.7%) | 9,767 (71.8%) |
| 19 to 25 Years | 932 (14.4%) | 5,051 (78.2%) |
| 25 to 34 Years | 2,060 (21.7%) | 6,808 (71.8%) |
| 35 to 44 Years | 1,380 (13.7%) | 8,053 (79.8%) |
| 45 to 54 Years | 1,626 (16.3%) | 8,415 (84.2%) |
| 55 to 64 Years | 2,331 (20.8%) | 9,011 (80.4%) |
| 65 to 74 Years | 7,584 (92.7%) | 5,689 (69.6%) |
| 75 Years and over | 4,489 (99.5%) | 3,289 (72.9%) |
| Total | 26,243 (33.2%) | 59,543 (75.4%) |
Disability Status by Sex by Age in Floyd County
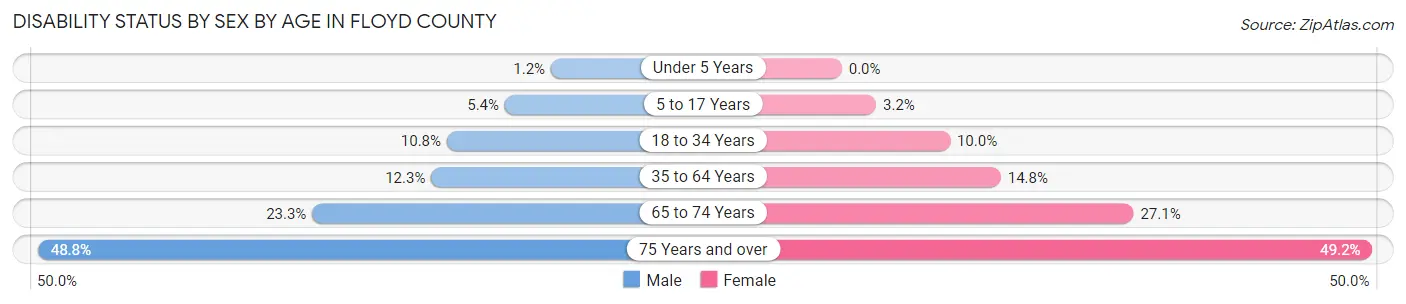
| Age Bracket | Male | Female |
| Under 5 Years | 26 (1.1%) | 0 (0.0%) |
| 5 to 17 Years | 379 (5.4%) | 206 (3.2%) |
| 18 to 34 Years | 930 (10.8%) | 845 (10.0%) |
| 35 to 64 Years | 1,867 (12.3%) | 2,372 (14.8%) |
| 65 to 74 Years | 885 (23.3%) | 1,186 (27.1%) |
| 75 Years and over | 890 (48.8%) | 1,322 (49.2%) |
Disability Class by Sex by Age in Floyd County
Disability Class: Hearing Difficulty
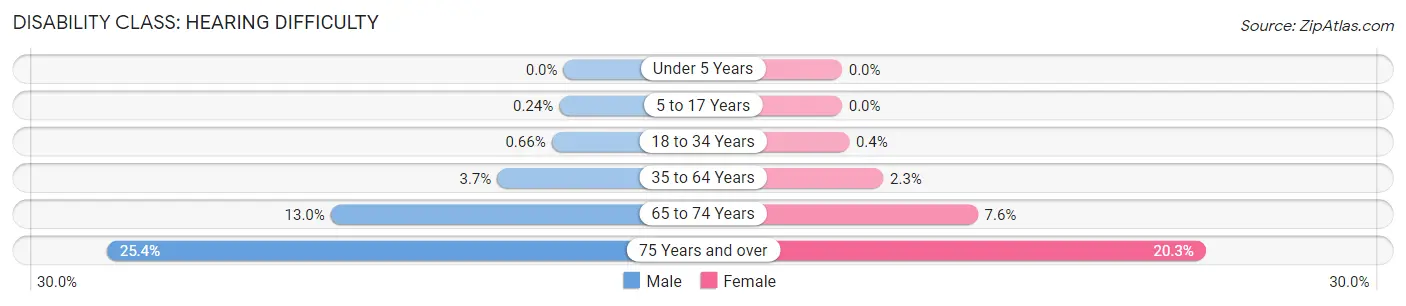
| Age Bracket | Male | Female |
| Under 5 Years | 0 (0.0%) | 0 (0.0%) |
| 5 to 17 Years | 17 (0.2%) | 0 (0.0%) |
| 18 to 34 Years | 57 (0.7%) | 34 (0.4%) |
| 35 to 64 Years | 562 (3.7%) | 370 (2.3%) |
| 65 to 74 Years | 492 (13.0%) | 331 (7.6%) |
| 75 Years and over | 464 (25.4%) | 544 (20.3%) |
Disability Class: Vision Difficulty
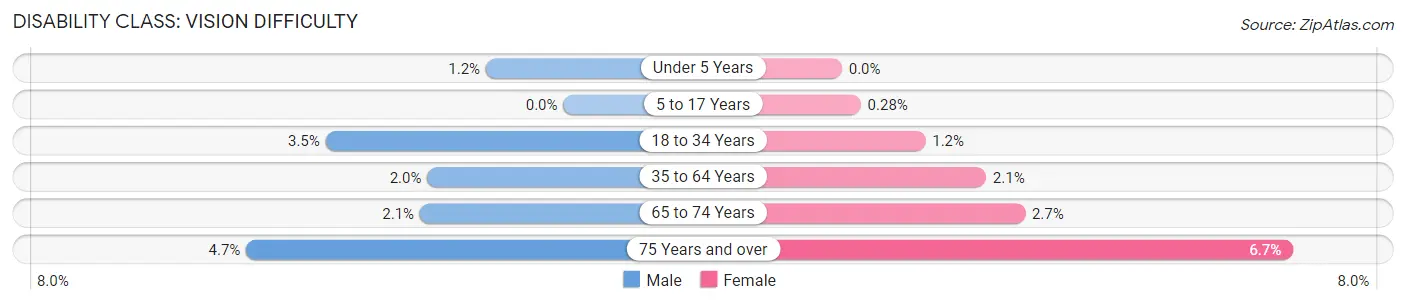
| Age Bracket | Male | Female |
| Under 5 Years | 26 (1.1%) | 0 (0.0%) |
| 5 to 17 Years | 0 (0.0%) | 18 (0.3%) |
| 18 to 34 Years | 304 (3.5%) | 104 (1.2%) |
| 35 to 64 Years | 307 (2.0%) | 344 (2.1%) |
| 65 to 74 Years | 81 (2.1%) | 119 (2.7%) |
| 75 Years and over | 86 (4.7%) | 180 (6.7%) |
Disability Class: Cognitive Difficulty
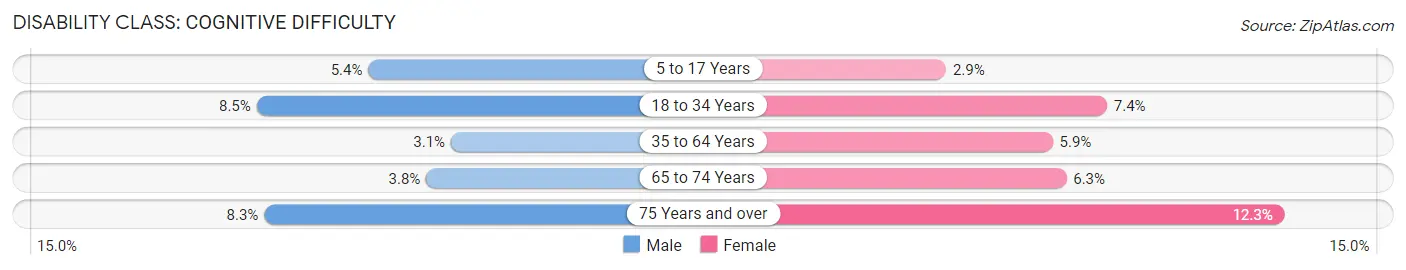
| Age Bracket | Male | Female |
| 5 to 17 Years | 379 (5.4%) | 188 (2.9%) |
| 18 to 34 Years | 735 (8.5%) | 621 (7.4%) |
| 35 to 64 Years | 477 (3.1%) | 943 (5.9%) |
| 65 to 74 Years | 145 (3.8%) | 274 (6.2%) |
| 75 Years and over | 152 (8.3%) | 331 (12.3%) |
Disability Class: Ambulatory Difficulty
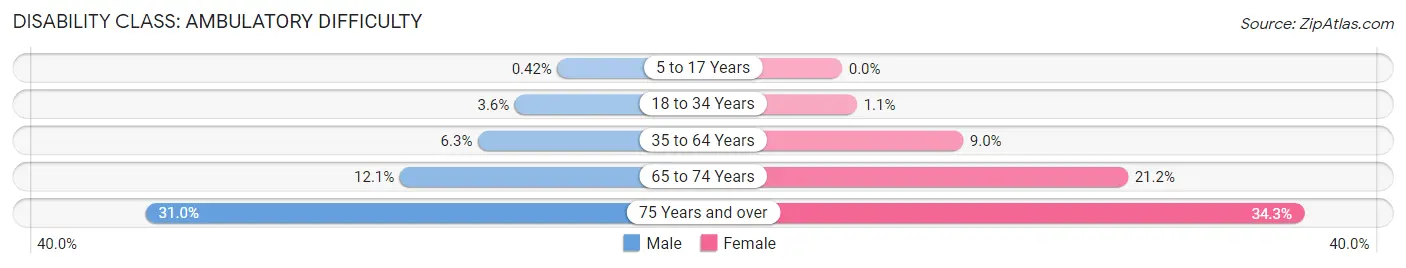
| Age Bracket | Male | Female |
| 5 to 17 Years | 29 (0.4%) | 0 (0.0%) |
| 18 to 34 Years | 308 (3.6%) | 93 (1.1%) |
| 35 to 64 Years | 963 (6.3%) | 1,445 (9.0%) |
| 65 to 74 Years | 460 (12.1%) | 930 (21.2%) |
| 75 Years and over | 566 (31.0%) | 921 (34.3%) |
Disability Class: Self-Care Difficulty
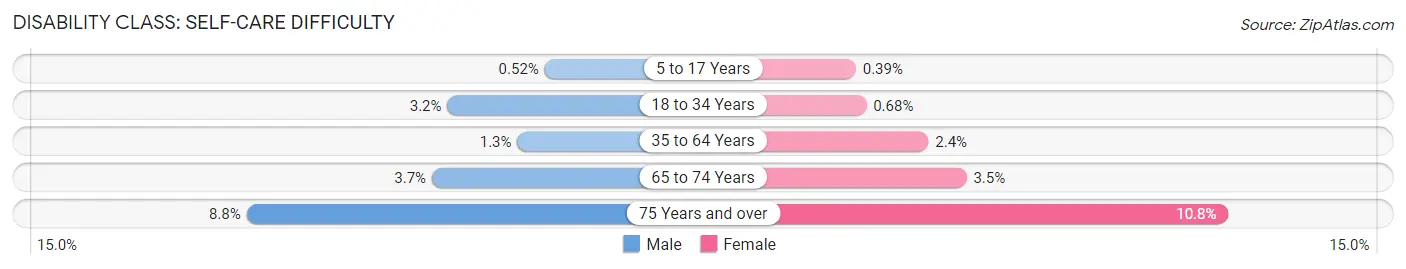
| Age Bracket | Male | Female |
| 5 to 17 Years | 36 (0.5%) | 25 (0.4%) |
| 18 to 34 Years | 278 (3.2%) | 57 (0.7%) |
| 35 to 64 Years | 195 (1.3%) | 387 (2.4%) |
| 65 to 74 Years | 139 (3.7%) | 152 (3.5%) |
| 75 Years and over | 161 (8.8%) | 289 (10.8%) |
Technology Access in Floyd County
Computing Device Access in Floyd County
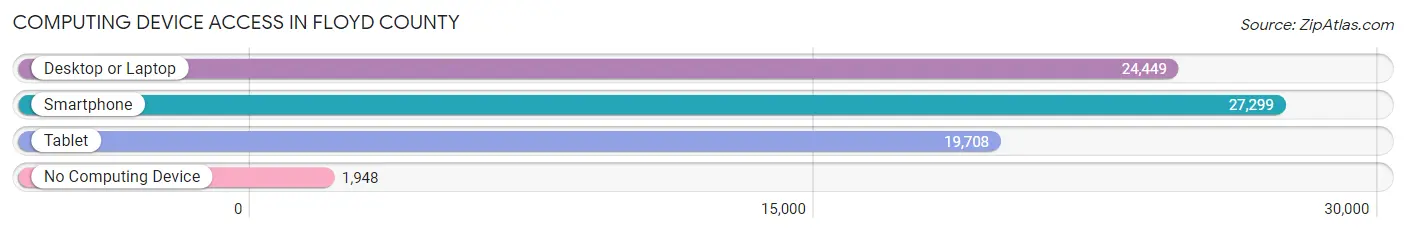
| Device Type | # Households | % Households |
| Desktop or Laptop | 24,449 | 79.1% |
| Smartphone | 27,299 | 88.3% |
| Tablet | 19,708 | 63.8% |
| No Computing Device | 1,948 | 6.3% |
| Total | 30,911 | 100.0% |
Internet Access in Floyd County
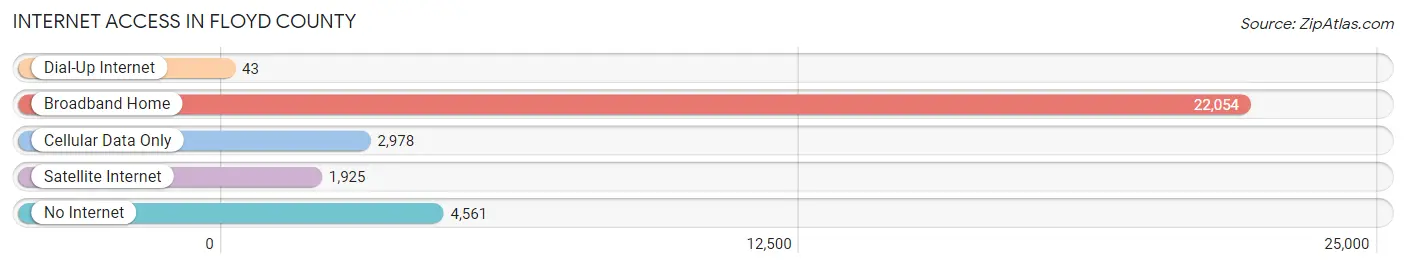
| Internet Type | # Households | % Households |
| Dial-Up Internet | 43 | 0.1% |
| Broadband Home | 22,054 | 71.4% |
| Cellular Data Only | 2,978 | 9.6% |
| Satellite Internet | 1,925 | 6.2% |
| No Internet | 4,561 | 14.8% |
| Total | 30,911 | 100.0% |
Floyd County Summary
Floyd County, Indiana is located in the southern part of the state, just north of Louisville, Kentucky. It is part of the Louisville metropolitan area and is bordered by Clark, Harrison, Washington, and Clark counties. The county seat is New Albany, which is also the largest city in the county. The county was established in 1819 and named after General John Floyd, a Revolutionary War hero.
Geography
Floyd County is located in the southern part of Indiana, just north of Louisville, Kentucky. It is part of the Louisville metropolitan area and is bordered by Clark, Harrison, Washington, and Clark counties. The county has a total area of 437 square miles, of which 434 square miles is land and 3 square miles is water. The terrain is mostly flat, with some rolling hills in the northern part of the county. The highest point in the county is located in the northern part of the county, near the town of Georgetown, and is 845 feet above sea level.
The county is drained by the Ohio River, which forms the county's eastern border. Other major waterways in the county include the Silver Creek, the East Fork of Silver Creek, and the West Fork of Silver Creek.
Economy
Floyd County has a diverse economy, with a mix of manufacturing, retail, and service industries. The county is home to several large employers, including the Cummins Engine Company, which manufactures diesel engines, and the Indiana University Southeast campus. Other major employers in the county include the New Albany-Floyd County School Corporation, the New Albany-Floyd County Public Library, and the New Albany-Floyd County Parks and Recreation Department.
The county also has a strong agricultural sector, with corn, soybeans, and wheat being the primary crops. Livestock production is also important, with beef cattle, dairy cattle, and hogs being the primary livestock raised in the county.
Demographics
As of the 2010 census, Floyd County had a population of 75,283. The racial makeup of the county was 90.2% White, 6.2% African American, 0.4% Native American, 1.2% Asian, 0.1% Pacific Islander, 0.7% from other races, and 1.2% from two or more races. Hispanic or Latino of any race were 2.2% of the population.
The median income for a household in the county was $45,945, and the median income for a family was $54,945. The per capita income for the county was $22,945. About 8.2% of families and 11.2% of the population were below the poverty line, including 15.2% of those under age 18 and 8.2% of those age 65 or over.
Floyd County is served by the New Albany-Floyd County Public Library, which has five branches located throughout the county. The county is also served by the New Albany-Floyd County Parks and Recreation Department, which operates several parks and recreational facilities. The county is also home to several higher education institutions, including Indiana University Southeast, Ivy Tech Community College, and the University of Louisville.
Common Questions
What is the Total Population of Floyd County?
Total Population of Floyd County is 80,191.
What is the Total Male Population of Floyd County?
Total Male Population of Floyd County is 39,240.
What is the Total Female Population of Floyd County?
Total Female Population of Floyd County is 40,951.
What is the Ratio of Males per 100 Females in Floyd County?
There are 95.82 Males per 100 Females in Floyd County.
What is the Ratio of Females per 100 Males in Floyd County?
There are 104.36 Females per 100 Males in Floyd County.
What is the Median Population Age in Floyd County?
Median Population Age in Floyd County is 39.8 Years.
What is the Average Family Size in Floyd County
Average Family Size in Floyd County is 3.2 People.
What is the Average Household Size in Floyd County
Average Household Size in Floyd County is 2.5 People.
What is Per Capita Income in Floyd County?
Per Capita income in Floyd County is $38,949.
What is the Median Family Income in Floyd County?
Median Family Income in Floyd County is $97,491.
What is the Median Household income in Floyd County?
Median Household Income in Floyd County is $75,686.
What is Income or Wage Gap in Floyd County?
Income or Wage Gap in Floyd County is 26.0%.
Women in Floyd County earn 74.0 cents for every dollar earned by a man.
What is Family Income Deficit in Floyd County?
Family Income Deficit in Floyd County is $12,370.
Families that are below poverty line in Floyd County earn $12,370 less on average than the poverty threshold level.
What is Inequality or Gini Index in Floyd County?
Inequality or Gini Index in Floyd County is 0.43.
How Large is the Labor Force in Floyd County?
There are 41,372 People in the Labor Forcein in Floyd County.
What is the Percentage of People in the Labor Force in Floyd County?
64.2% of People are in the Labor Force in Floyd County.
What is the Unemployment Rate in Floyd County?
Unemployment Rate in Floyd County is 3.9%.