Dubois County, IN
Dubois County Map

Dubois County Overview
43,584
TOTAL POPULATION
21,908
MALE POPULATION
21,676
FEMALE POPULATION
101.07
MALES / 100 FEMALES
98.94
FEMALES / 100 MALES
40.0
MEDIAN AGE
3.0
AVG FAMILY SIZE
2.5
AVG HOUSEHOLD SIZE
$35,226
PER CAPITA INCOME
$84,155
AVG FAMILY INCOME
$68,945
AVG HOUSEHOLD INCOME
33.6%
WAGE / INCOME GAP [ % ]
66.4¢/ $1
WAGE / INCOME GAP [ $ ]
$11,135
FAMILY INCOME DEFICIT
0.41
INEQUALITY / GINI INDEX
23,211
LABOR FORCE [ PEOPLE ]
67.9%
PERCENT IN LABOR FORCE
1.9%
UNEMPLOYMENT RATE
Dubois County Area Codes
Race in Dubois County
The most populous races in Dubois County are White / Caucasian (39,601 | 90.9%), Hispanic or Latino (3,783 | 8.7%), and Two or more Races (1,868 | 4.3%).

| Race | # Population | % Population |
| Asian | 220 | 0.5% |
| Black / African American | 699 | 1.6% |
| Hawaiian / Pacific | 0 | 0.0% |
| Hispanic or Latino | 3,783 | 8.7% |
| Native / Alaskan | 92 | 0.2% |
| White / Caucasian | 39,601 | 90.9% |
| Two or more Races | 1,868 | 4.3% |
| Some other Race | 1,104 | 2.5% |
| Total | 43,584 | 100.0% |
Ancestry in Dubois County
The most populous ancestries reported in Dubois County are German (21,226 | 48.7%), English (4,498 | 10.3%), Irish (4,152 | 9.5%), American (2,818 | 6.5%), and Central American (1,954 | 4.5%), together accounting for 79.5% of all Dubois County residents.

| Ancestry | # Population | % Population |
| Alsatian | 131 | 0.3% |
| American | 2,818 | 6.5% |
| Apache | 119 | 0.3% |
| Arab | 10 | 0.0% |
| Austrian | 32 | 0.1% |
| British | 97 | 0.2% |
| Canadian | 5 | 0.0% |
| Celtic | 28 | 0.1% |
| Central American | 1,954 | 4.5% |
| Cherokee | 97 | 0.2% |
| Chinese | 12 | 0.0% |
| Creek | 1 | 0.0% |
| Croatian | 7 | 0.0% |
| Cuban | 128 | 0.3% |
| Czechoslovakian | 30 | 0.1% |
| Dutch | 147 | 0.3% |
| Eastern European | 39 | 0.1% |
| English | 4,498 | 10.3% |
| European | 344 | 0.8% |
| Finnish | 86 | 0.2% |
| French | 861 | 2.0% |
| French Canadian | 42 | 0.1% |
| German | 21,226 | 48.7% |
| Greek | 33 | 0.1% |
| Guatemalan | 71 | 0.2% |
| Haitian | 22 | 0.1% |
| Honduran | 56 | 0.1% |
| Hungarian | 34 | 0.1% |
| Irish | 4,152 | 9.5% |
| Italian | 206 | 0.5% |
| Korean | 17 | 0.0% |
| Lebanese | 10 | 0.0% |
| Lithuanian | 9 | 0.0% |
| Luxembourger | 5 | 0.0% |
| Malaysian | 27 | 0.1% |
| Mexican | 1,354 | 3.1% |
| Northern European | 21 | 0.1% |
| Norwegian | 123 | 0.3% |
| Panamanian | 23 | 0.1% |
| Pennsylvania German | 11 | 0.0% |
| Peruvian | 14 | 0.0% |
| Polish | 283 | 0.6% |
| Portuguese | 11 | 0.0% |
| Puerto Rican | 291 | 0.7% |
| Romanian | 30 | 0.1% |
| Russian | 109 | 0.3% |
| Salvadoran | 1,804 | 4.1% |
| Scandinavian | 39 | 0.1% |
| Scotch-Irish | 110 | 0.3% |
| Scottish | 246 | 0.6% |
| Sioux | 2 | 0.0% |
| South American | 14 | 0.0% |
| Spaniard | 5 | 0.0% |
| Swedish | 46 | 0.1% |
| Swiss | 154 | 0.4% |
| Thai | 179 | 0.4% |
| Ukrainian | 2 | 0.0% |
| Vietnamese | 2 | 0.0% |
| Welsh | 81 | 0.2% |
| Yup'ik | 32 | 0.1% | View All 60 Rows |
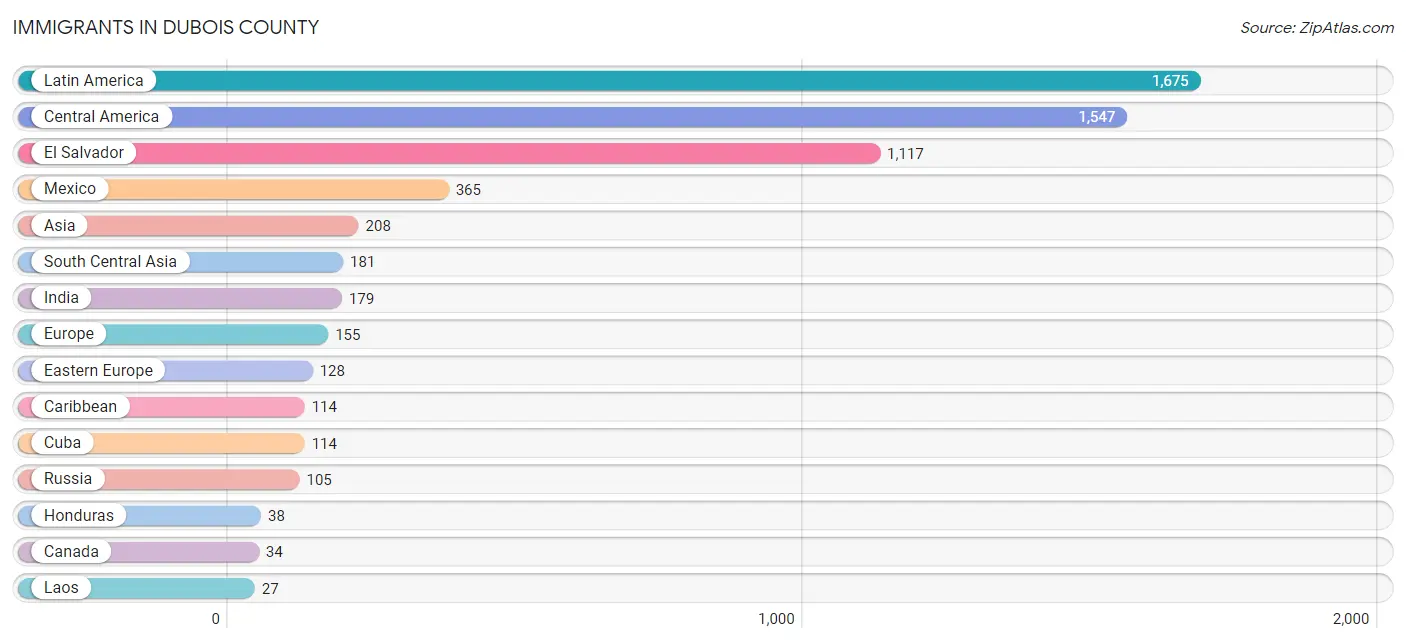
Immigrants in Dubois County
The most numerous immigrant groups reported in Dubois County came from Latin America (1,675 | 3.8%), Central America (1,547 | 3.5%), El Salvador (1,117 | 2.6%), Mexico (365 | 0.8%), and Asia (208 | 0.5%), together accounting for 11.3% of all Dubois County residents.
| Immigration Origin | # Population | % Population |
| Asia | 208 | 0.5% |
| Bangladesh | 2 | 0.0% |
| Canada | 34 | 0.1% |
| Caribbean | 114 | 0.3% |
| Central America | 1,547 | 3.5% |
| Cuba | 114 | 0.3% |
| Eastern Europe | 128 | 0.3% |
| El Salvador | 1,117 | 2.6% |
| Europe | 155 | 0.4% |
| Germany | 2 | 0.0% |
| Guatemala | 4 | 0.0% |
| Honduras | 38 | 0.1% |
| India | 179 | 0.4% |
| Laos | 27 | 0.1% |
| Latin America | 1,675 | 3.8% |
| Mexico | 365 | 0.8% |
| Northern Europe | 11 | 0.0% |
| Oceania | 16 | 0.0% |
| Panama | 23 | 0.1% |
| Peru | 14 | 0.0% |
| Romania | 21 | 0.1% |
| Russia | 105 | 0.2% |
| South America | 14 | 0.0% |
| South Central Asia | 181 | 0.4% |
| South Eastern Asia | 27 | 0.1% |
| Southern Europe | 14 | 0.0% |
| Spain | 5 | 0.0% |
| Ukraine | 2 | 0.0% |
| Western Europe | 2 | 0.0% | View All 29 Rows |
Sex and Age in Dubois County
Sex and Age in Dubois County
The most populous age groups in Dubois County are 55 to 59 Years (1,853 | 8.5%) for men and 55 to 59 Years (1,643 | 7.6%) for women.

| Age Bracket | Male | Female |
| Under 5 Years | 1,435 (6.6%) | 1,357 (6.3%) |
| 5 to 9 Years | 1,649 (7.5%) | 1,466 (6.8%) |
| 10 to 14 Years | 1,452 (6.6%) | 1,391 (6.4%) |
| 15 to 19 Years | 1,387 (6.3%) | 1,416 (6.5%) |
| 20 to 24 Years | 1,274 (5.8%) | 1,288 (5.9%) |
| 25 to 29 Years | 1,237 (5.7%) | 1,155 (5.3%) |
| 30 to 34 Years | 1,226 (5.6%) | 1,245 (5.7%) |
| 35 to 39 Years | 1,449 (6.6%) | 1,360 (6.3%) |
| 40 to 44 Years | 1,361 (6.2%) | 1,043 (4.8%) |
| 45 to 49 Years | 1,227 (5.6%) | 1,074 (5.0%) |
| 50 to 54 Years | 1,399 (6.4%) | 1,386 (6.4%) |
| 55 to 59 Years | 1,853 (8.5%) | 1,643 (7.6%) |
| 60 to 64 Years | 1,499 (6.8%) | 1,548 (7.1%) |
| 65 to 69 Years | 1,238 (5.7%) | 1,142 (5.3%) |
| 70 to 74 Years | 955 (4.4%) | 1,163 (5.4%) |
| 75 to 79 Years | 484 (2.2%) | 676 (3.1%) |
| 80 to 84 Years | 332 (1.5%) | 742 (3.4%) |
| 85 Years and over | 451 (2.1%) | 581 (2.7%) |
| Total | 21,908 (100.0%) | 21,676 (100.0%) |
Families and Households in Dubois County
Median Family Size in Dubois County
The median family size in Dubois County is 3.05 persons per family, with single female/mother families (1,577 | 14.1%) accounting for the largest median family size of 3.2 persons per family. On the other hand, single male/father families (625 | 5.6%) represent the smallest median family size with 2.28 persons per family.

| Family Type | # Families | Family Size |
| Married-Couple | 9,016 (80.4%) | 3.08 |
| Single Male/Father | 625 (5.6%) | 2.28 |
| Single Female/Mother | 1,577 (14.1%) | 3.20 |
| Total Families | 11,218 (100.0%) | 3.05 |
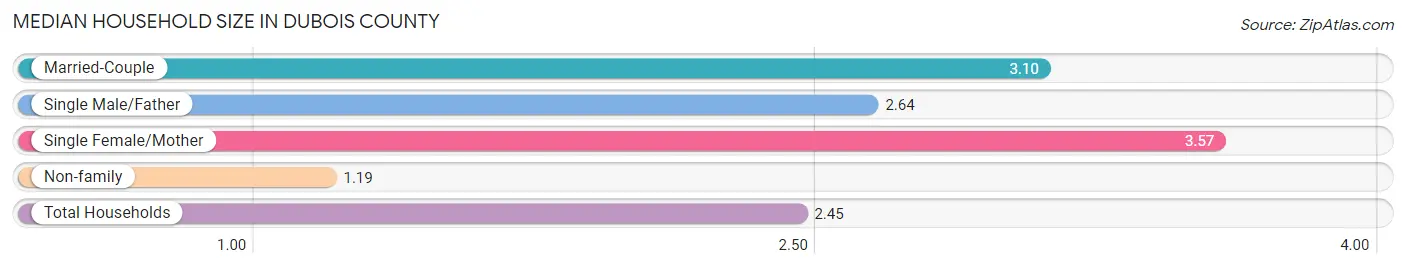
Median Household Size in Dubois County
The median household size in Dubois County is 2.45 persons per household, with single female/mother households (1,577 | 9.0%) accounting for the largest median household size of 3.57 persons per household. non-family households (6,219 | 35.7%) represent the smallest median household size with 1.19 persons per household.
| Household Type | # Households | Household Size |
| Married-Couple | 9,016 (51.7%) | 3.10 |
| Single Male/Father | 625 (3.6%) | 2.64 |
| Single Female/Mother | 1,577 (9.0%) | 3.57 |
| Non-family | 6,219 (35.7%) | 1.19 |
| Total Households | 17,437 (100.0%) | 2.45 |
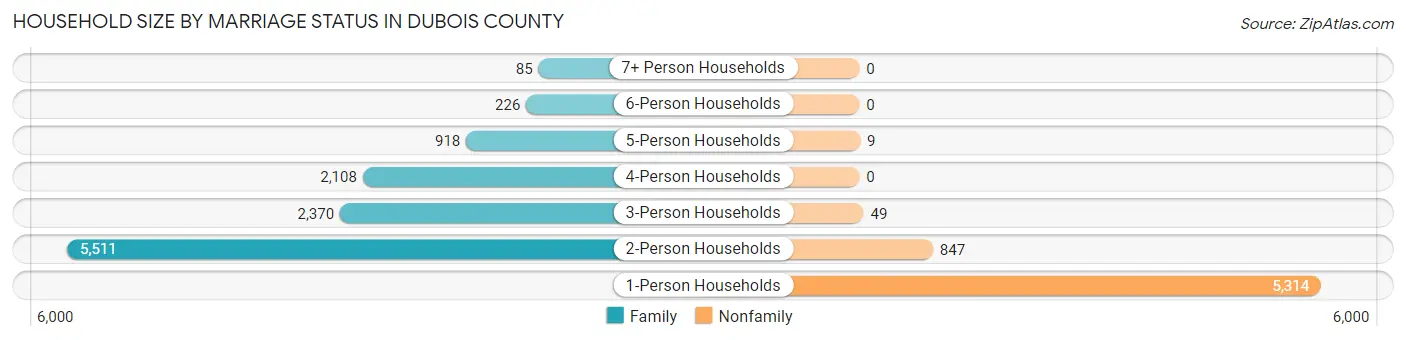
Household Size by Marriage Status in Dubois County
Out of a total of 17,437 households in Dubois County, 11,218 (64.3%) are family households, while 6,219 (35.7%) are nonfamily households. The most numerous type of family households are 2-person households, comprising 5,511, and the most common type of nonfamily households are 1-person households, comprising 5,314.
| Household Size | Family Households | Nonfamily Households |
| 1-Person Households | - | 5,314 (30.5%) |
| 2-Person Households | 5,511 (31.6%) | 847 (4.9%) |
| 3-Person Households | 2,370 (13.6%) | 49 (0.3%) |
| 4-Person Households | 2,108 (12.1%) | 0 (0.0%) |
| 5-Person Households | 918 (5.3%) | 9 (0.1%) |
| 6-Person Households | 226 (1.3%) | 0 (0.0%) |
| 7+ Person Households | 85 (0.5%) | 0 (0.0%) |
| Total | 11,218 (64.3%) | 6,219 (35.7%) |
Female Fertility in Dubois County
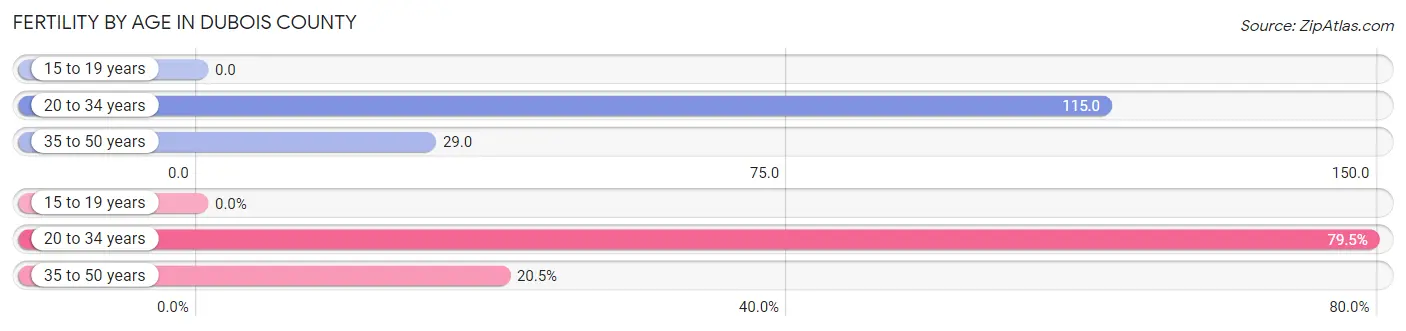
Fertility by Age in Dubois County
Average fertility rate in Dubois County is 60.0 births per 1,000 women. Women in the age bracket of 20 to 34 years have the highest fertility rate with 115.0 births per 1,000 women. Women in the age bracket of 20 to 34 years acount for 79.5% of all women with births.
| Age Bracket | Women with Births | Births / 1,000 Women |
| 15 to 19 years | 0 (0.0%) | 0.0 |
| 20 to 34 years | 423 (79.5%) | 115.0 |
| 35 to 50 years | 109 (20.5%) | 29.0 |
| Total | 532 (100.0%) | 60.0 |
Fertility by Age by Marriage Status in Dubois County
85.0% of women with births (532) in Dubois County are married. The highest percentage of unmarried women with births falls into 35 to 50 years age bracket with 31.2% of them unmarried at the time of birth, while the lowest percentage of unmarried women with births belong to 20 to 34 years age bracket with 10.9% of them unmarried.
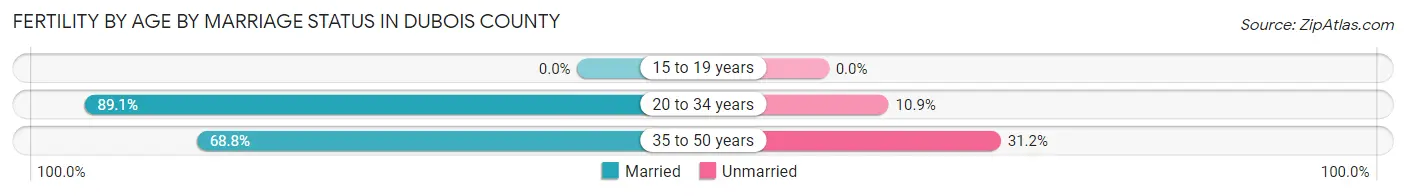
| Age Bracket | Married | Unmarried |
| 15 to 19 years | 0 (0.0%) | 0 (0.0%) |
| 20 to 34 years | 377 (89.1%) | 46 (10.9%) |
| 35 to 50 years | 75 (68.8%) | 34 (31.2%) |
| Total | 452 (85.0%) | 80 (15.0%) |
Fertility by Education in Dubois County
Average fertility rate in Dubois County is 60.0 births per 1,000 women. Women with the education attainment of graduate degree have the highest fertility rate of 112.0 births per 1,000 women, while women with the education attainment of high school diploma have the lowest fertility at 25.0 births per 1,000 women. Women with the education attainment of bachelor's degree represent 32.1% of all women with births.

| Educational Attainment | Women with Births | Births / 1,000 Women |
| Less than High School | 76 (14.3%) | 44.0 |
| High School Diploma | 55 (10.3%) | 25.0 |
| College or Associate's Degree | 167 (31.4%) | 63.0 |
| Bachelor's Degree | 171 (32.1%) | 100.0 |
| Graduate Degree | 63 (11.8%) | 112.0 |
| Total | 532 (100.0%) | 60.0 |
Fertility by Education by Marriage Status in Dubois County
15.0% of women with births in Dubois County are unmarried. Women with the educational attainment of graduate degree are most likely to be married with 100.0% of them married at childbirth, while women with the educational attainment of high school diploma are least likely to be married with 78.2% of them unmarried at childbirth.

| Educational Attainment | Married | Unmarried |
| Less than High School | 66 (86.8%) | 10 (13.2%) |
| High School Diploma | 12 (21.8%) | 43 (78.2%) |
| College or Associate's Degree | 145 (86.8%) | 22 (13.2%) |
| Bachelor's Degree | 166 (97.1%) | 5 (2.9%) |
| Graduate Degree | 63 (100.0%) | 0 (0.0%) |
| Total | 452 (85.0%) | 80 (15.0%) |
Income in Dubois County
Income Overview in Dubois County
Per Capita Income in Dubois County is $35,226, while median incomes of families and households are $84,155 and $68,945 respectively.
| Characteristic | Number | Measure |
| Per Capita Income | 43,584 | $35,226 |
| Median Family Income | 11,218 | $84,155 |
| Mean Family Income | 11,218 | $101,920 |
| Median Household Income | 17,437 | $68,945 |
| Mean Household Income | 17,437 | $84,786 |
| Income Deficit | 11,218 | $11,135 |
| Wage / Income Gap (%) | 43,584 | 33.59% |
| Wage / Income Gap ($) | 43,584 | 66.41¢ per $1 |
| Gini / Inequality Index | 43,584 | 0.41 |
Earnings by Sex in Dubois County
Average Earnings in Dubois County are $41,053, $50,499 for men and $33,536 for women, a difference of 33.6%.

| Sex | Number | Average Earnings |
| Male | 13,548 (55.1%) | $50,499 |
| Female | 11,059 (44.9%) | $33,536 |
| Total | 24,607 (100.0%) | $41,053 |
Earnings by Sex by Income Bracket in Dubois County
The most common earnings brackets in Dubois County are $100,000+ for men (1,950 | 14.4%) and $35,000 to $39,999 for women (1,222 | 11.1%).

| Income | Male | Female |
| $2,499 or less | 378 (2.8%) | 599 (5.4%) |
| $2,500 to $4,999 | 329 (2.4%) | 351 (3.2%) |
| $5,000 to $7,499 | 381 (2.8%) | 381 (3.5%) |
| $7,500 to $9,999 | 151 (1.1%) | 333 (3.0%) |
| $10,000 to $12,499 | 338 (2.5%) | 449 (4.1%) |
| $12,500 to $14,999 | 323 (2.4%) | 407 (3.7%) |
| $15,000 to $17,499 | 102 (0.7%) | 351 (3.2%) |
| $17,500 to $19,999 | 223 (1.7%) | 184 (1.7%) |
| $20,000 to $22,499 | 173 (1.3%) | 490 (4.4%) |
| $22,500 to $24,999 | 219 (1.6%) | 342 (3.1%) |
| $25,000 to $29,999 | 946 (7.0%) | 947 (8.6%) |
| $30,000 to $34,999 | 499 (3.7%) | 1,103 (10.0%) |
| $35,000 to $39,999 | 800 (5.9%) | 1,222 (11.1%) |
| $40,000 to $44,999 | 759 (5.6%) | 664 (6.0%) |
| $45,000 to $49,999 | 1,062 (7.8%) | 973 (8.8%) |
| $50,000 to $54,999 | 768 (5.7%) | 410 (3.7%) |
| $55,000 to $64,999 | 1,631 (12.0%) | 592 (5.3%) |
| $65,000 to $74,999 | 953 (7.0%) | 322 (2.9%) |
| $75,000 to $99,999 | 1,563 (11.5%) | 452 (4.1%) |
| $100,000+ | 1,950 (14.4%) | 487 (4.4%) |
| Total | 13,548 (100.0%) | 11,059 (100.0%) |
Earnings by Sex by Educational Attainment in Dubois County
Average earnings in Dubois County are $55,070 for men and $36,615 for women, a difference of 33.5%. Men with an educational attainment of graduate degree enjoy the highest average annual earnings of $91,216, while those with high school diploma education earn the least with $45,480. Women with an educational attainment of bachelor's degree earn the most with the average annual earnings of $46,829, while those with high school diploma education have the smallest earnings of $30,723.
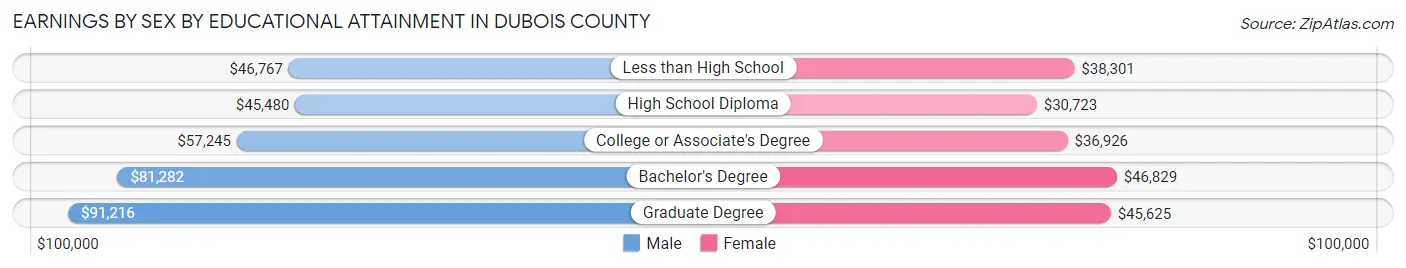
| Educational Attainment | Male Income | Female Income |
| Less than High School | $46,767 | $38,301 |
| High School Diploma | $45,480 | $30,723 |
| College or Associate's Degree | $57,245 | $36,926 |
| Bachelor's Degree | $81,282 | $46,829 |
| Graduate Degree | $91,216 | $45,625 |
| Total | $55,070 | $36,615 |
Family Income in Dubois County
Family Income Brackets in Dubois County
According to the Dubois County family income data, there are 2,479 families falling into the $100,000 to $149,999 income range, which is the most common income bracket and makes up 22.1% of all families. Conversely, the less than $10,000 income bracket is the least frequent group with only 123 families (1.1%) belonging to this category.

| Income Bracket | # Families | % Families |
| Less than $10,000 | 123 | 1.1% |
| $10,000 to $14,999 | 359 | 3.2% |
| $15,000 to $24,999 | 348 | 3.1% |
| $25,000 to $34,999 | 538 | 4.8% |
| $35,000 to $49,999 | 1,111 | 9.9% |
| $50,000 to $74,999 | 2,232 | 19.9% |
| $75,000 to $99,999 | 2,075 | 18.5% |
| $100,000 to $149,999 | 2,479 | 22.1% |
| $150,000 to $199,999 | 897 | 8.0% |
| $200,000+ | 1,077 | 9.6% |
Family Income by Famaliy Size in Dubois County
5-person families (852 | 7.6%) account for the highest median family income in Dubois County with $107,292 per family, while 2-person families (5,886 | 52.5%) have the highest median income of $36,712 per family member.

| Income Bracket | # Families | Median Income |
| 2-Person Families | 5,886 (52.5%) | $73,423 |
| 3-Person Families | 2,231 (19.9%) | $100,064 |
| 4-Person Families | 1,977 (17.6%) | $105,179 |
| 5-Person Families | 852 (7.6%) | $107,292 |
| 6-Person Families | 201 (1.8%) | $79,083 |
| 7+ Person Families | 71 (0.6%) | $61,607 |
| Total | 11,218 (100.0%) | $84,155 |
Family Income by Number of Earners in Dubois County
The median family income in Dubois County is $84,155, with families comprising 3+ earners (1,457) having the highest median family income of $149,458, while families with no earners (1,390) have the lowest median family income of $48,134, accounting for 13.0% and 12.4% of families, respectively.
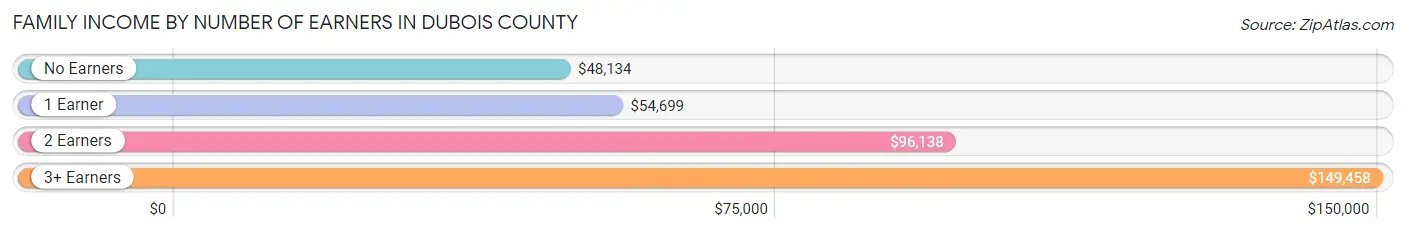
| Number of Earners | # Families | Median Income |
| No Earners | 1,390 (12.4%) | $48,134 |
| 1 Earner | 3,276 (29.2%) | $54,699 |
| 2 Earners | 5,095 (45.4%) | $96,138 |
| 3+ Earners | 1,457 (13.0%) | $149,458 |
| Total | 11,218 (100.0%) | $84,155 |
Household Income in Dubois County
Household Income Brackets in Dubois County
With 3,627 households falling in the category, the $50,000 to $74,999 income range is the most frequent in Dubois County, accounting for 20.8% of all households. In contrast, only 628 households (3.6%) fall into the $10,000 to $14,999 income bracket, making it the least populous group.

| Income Bracket | # Households | % Households |
| Less than $10,000 | 732 | 4.2% |
| $10,000 to $14,999 | 628 | 3.6% |
| $15,000 to $24,999 | 976 | 5.6% |
| $25,000 to $34,999 | 1,709 | 9.8% |
| $35,000 to $49,999 | 1,936 | 11.1% |
| $50,000 to $74,999 | 3,627 | 20.8% |
| $75,000 to $99,999 | 2,598 | 14.9% |
| $100,000 to $149,999 | 2,929 | 16.8% |
| $150,000 to $199,999 | 1,203 | 6.9% |
| $200,000+ | 1,099 | 6.3% |
Household Income by Householder Age in Dubois County
The median household income in Dubois County is $68,945, with the highest median household income of $89,436 found in the 45 to 64 years age bracket for the primary householder. A total of 6,515 households (37.4%) fall into this category. Meanwhile, the 15 to 24 years age bracket for the primary householder has the lowest median household income of $39,729, with 908 households (5.2%) in this group.
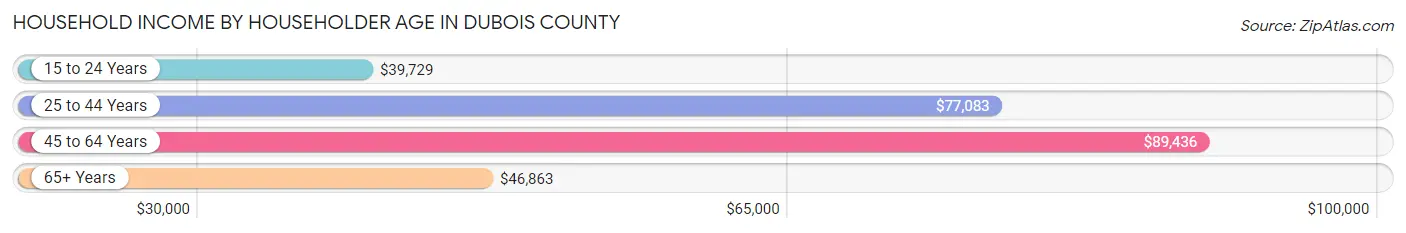
| Income Bracket | # Households | Median Income |
| 15 to 24 Years | 908 (5.2%) | $39,729 |
| 25 to 44 Years | 5,234 (30.0%) | $77,083 |
| 45 to 64 Years | 6,515 (37.4%) | $89,436 |
| 65+ Years | 4,780 (27.4%) | $46,863 |
| Total | 17,437 (100.0%) | $68,945 |
Poverty in Dubois County
Income Below Poverty by Sex and Age in Dubois County
With 9.4% poverty level for males and 10.0% for females among the residents of Dubois County, 5 year old males and 12 to 14 year old females are the most vulnerable to poverty, with 242 males (47.4%) and 144 females (26.0%) in their respective age groups living below the poverty level.

| Age Bracket | Male | Female |
| Under 5 Years | 334 (23.5%) | 58 (4.3%) |
| 5 Years | 242 (47.4%) | 78 (17.8%) |
| 6 to 11 Years | 319 (20.8%) | 185 (10.6%) |
| 12 to 14 Years | 139 (14.6%) | 144 (26.0%) |
| 15 Years | 22 (6.9%) | 41 (12.5%) |
| 16 and 17 Years | 69 (12.1%) | 55 (8.7%) |
| 18 to 24 Years | 112 (6.4%) | 338 (19.5%) |
| 25 to 34 Years | 221 (9.2%) | 130 (5.4%) |
| 35 to 44 Years | 179 (6.5%) | 243 (10.2%) |
| 45 to 54 Years | 47 (1.8%) | 163 (6.7%) |
| 55 to 64 Years | 133 (4.0%) | 161 (5.1%) |
| 65 to 74 Years | 85 (3.9%) | 180 (8.0%) |
| 75 Years and over | 114 (9.8%) | 319 (19.5%) |
| Total | 2,016 (9.4%) | 2,095 (10.0%) |
Income Above Poverty by Sex and Age in Dubois County
According to the poverty statistics in Dubois County, males aged 45 to 54 years and females aged under 5 years are the age groups that are most secure financially, with 98.2% of males and 95.7% of females in these age groups living above the poverty line.
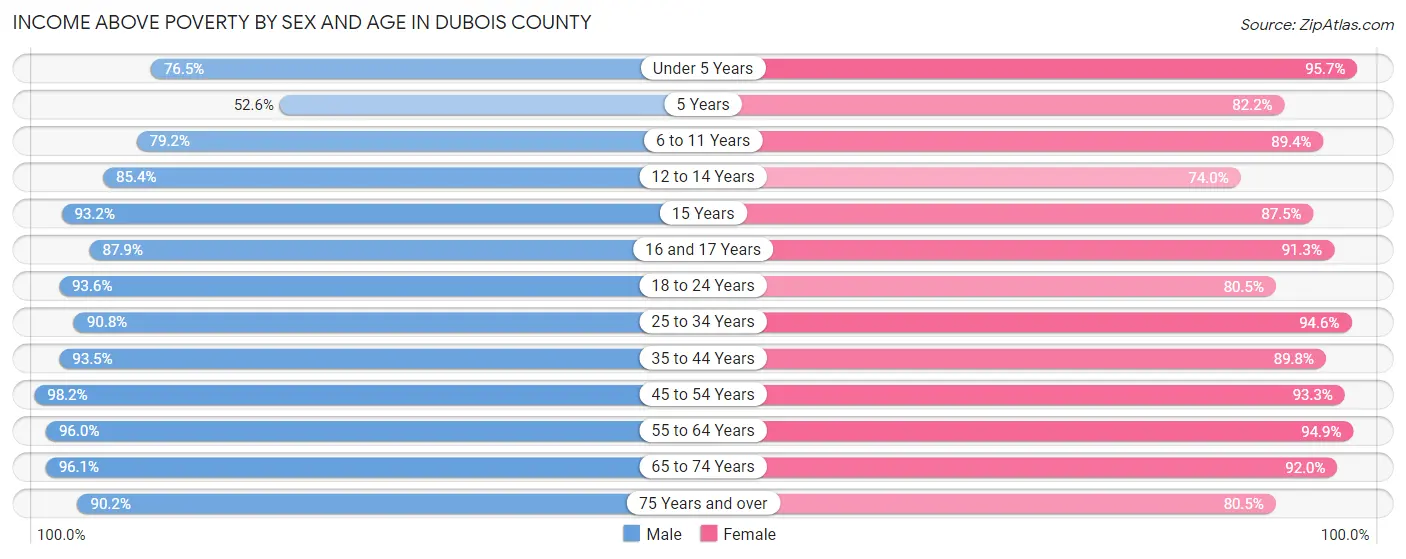
| Age Bracket | Male | Female |
| Under 5 Years | 1,090 (76.5%) | 1,283 (95.7%) |
| 5 Years | 269 (52.6%) | 359 (82.2%) |
| 6 to 11 Years | 1,215 (79.2%) | 1,558 (89.4%) |
| 12 to 14 Years | 814 (85.4%) | 410 (74.0%) |
| 15 Years | 299 (93.1%) | 288 (87.5%) |
| 16 and 17 Years | 503 (87.9%) | 578 (91.3%) |
| 18 to 24 Years | 1,641 (93.6%) | 1,399 (80.5%) |
| 25 to 34 Years | 2,191 (90.8%) | 2,257 (94.6%) |
| 35 to 44 Years | 2,591 (93.5%) | 2,146 (89.8%) |
| 45 to 54 Years | 2,563 (98.2%) | 2,286 (93.3%) |
| 55 to 64 Years | 3,210 (96.0%) | 3,015 (94.9%) |
| 65 to 74 Years | 2,081 (96.1%) | 2,064 (92.0%) |
| 75 Years and over | 1,044 (90.2%) | 1,319 (80.5%) |
| Total | 19,511 (90.6%) | 18,962 (90.0%) |
Income Below Poverty Among Married-Couple Families in Dubois County
The poverty statistics for married-couple families in Dubois County show that 3.3% or 294 of the total 9,016 families live below the poverty line. Families with 5 or more children have the highest poverty rate of 30.0%, comprising of 12 families. On the other hand, families with 1 or 2 children have the lowest poverty rate of 1.7%, which includes 41 families.
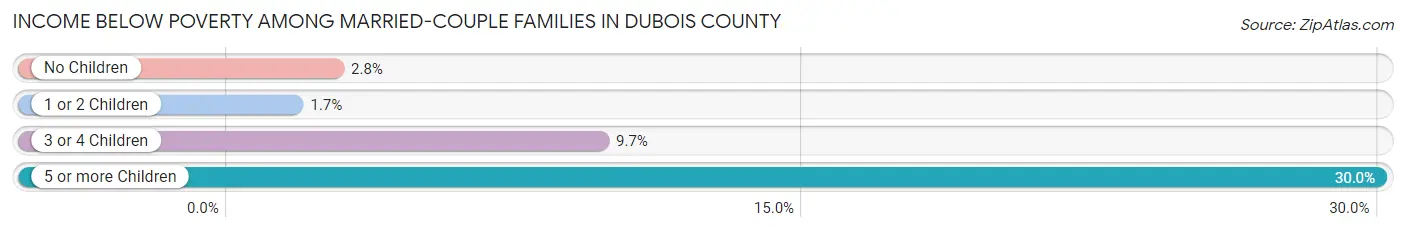
| Children | Above Poverty | Below Poverty |
| No Children | 5,578 (97.2%) | 159 (2.8%) |
| 1 or 2 Children | 2,352 (98.3%) | 41 (1.7%) |
| 3 or 4 Children | 764 (90.3%) | 82 (9.7%) |
| 5 or more Children | 28 (70.0%) | 12 (30.0%) |
| Total | 8,722 (96.7%) | 294 (3.3%) |
Income Below Poverty Among Single-Parent Households in Dubois County
According to the poverty data in Dubois County, 16.0% or 100 single-father households and 19.9% or 313 single-mother households are living below the poverty line. Among single-father households, those with 5 or more children have the highest poverty rate, with 13 households (100.0%) experiencing poverty. Likewise, among single-mother households, those with 3 or 4 children have the highest poverty rate, with 139 households (65.9%) falling below the poverty line.

| Children | Single Father | Single Mother |
| No Children | 0 (0.0%) | 42 (8.9%) |
| 1 or 2 Children | 75 (24.0%) | 132 (14.7%) |
| 3 or 4 Children | 12 (37.5%) | 139 (65.9%) |
| 5 or more Children | 13 (100.0%) | 0 (0.0%) |
| Total | 100 (16.0%) | 313 (19.9%) |
Income Below Poverty Among Married-Couple vs Single-Parent Households in Dubois County
The poverty data for Dubois County shows that 294 of the married-couple family households (3.3%) and 413 of the single-parent households (18.8%) are living below the poverty level. Within the married-couple family households, those with 5 or more children have the highest poverty rate, with 12 households (30.0%) falling below the poverty line. Among the single-parent households, those with 5 or more children have the highest poverty rate, with 13 household (100.0%) living below poverty.

| Children | Married-Couple Families | Single-Parent Households |
| No Children | 159 (2.8%) | 42 (5.7%) |
| 1 or 2 Children | 41 (1.7%) | 207 (17.2%) |
| 3 or 4 Children | 82 (9.7%) | 151 (62.1%) |
| 5 or more Children | 12 (30.0%) | 13 (100.0%) |
| Total | 294 (3.3%) | 413 (18.8%) |
Employment Characteristics in Dubois County
Employment by Class of Employer in Dubois County
Among the 22,578 employed individuals in Dubois County, private company employees (17,077 | 75.6%), not-for-profit organizations (1,581 | 7.0%), and local government employees (1,319 | 5.8%) make up the most common classes of employment.

| Employer Class | # Employees | % Employees |
| Private Company Employees | 17,077 | 75.6% |
| Self-Employed (Incorporated) | 1,171 | 5.2% |
| Self-Employed (Not Incorporated) | 831 | 3.7% |
| Not-for-profit Organizations | 1,581 | 7.0% |
| Local Government Employees | 1,319 | 5.8% |
| State Government Employees | 310 | 1.4% |
| Federal Government Employees | 270 | 1.2% |
| Unpaid Family Workers | 19 | 0.1% |
| Total | 22,578 | 100.0% |
Employment Status by Age in Dubois County
According to the labor force statistics for Dubois County, out of the total population over 16 years of age (34,184), 67.9% or 23,211 individuals are in the labor force, with 1.9% or 441 of them unemployed. The age group with the highest labor force participation rate is 35 to 44 years, with 92.6% or 4,827 individuals in the labor force. Within the labor force, the 20 to 24 years age range has the highest percentage of unemployed individuals, with 4.8% or 105 of them being unemployed.
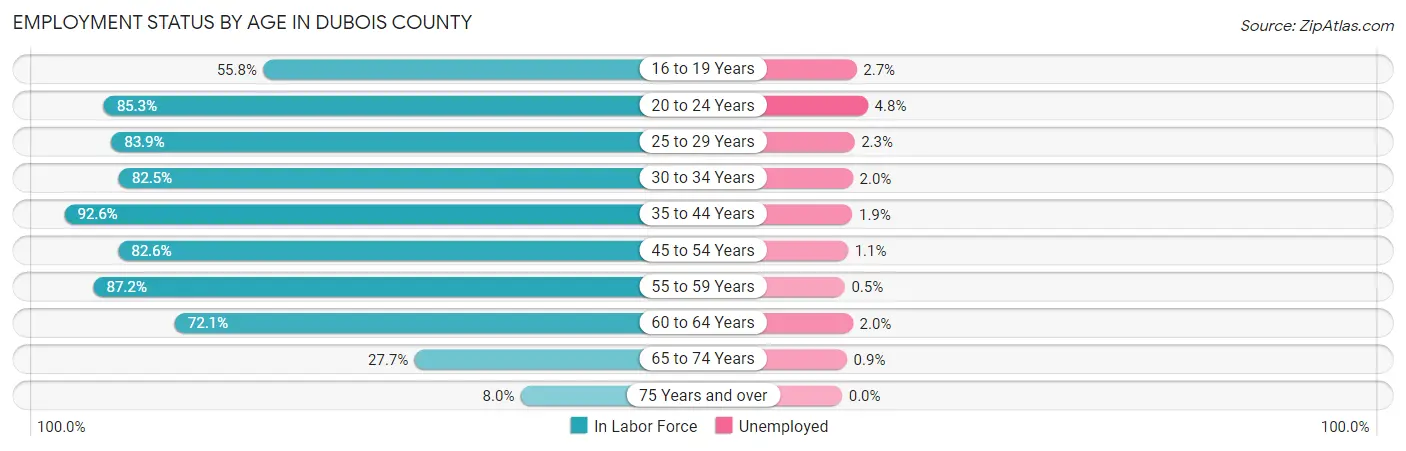
| Age Bracket | In Labor Force | Unemployed |
| 16 to 19 Years | 1,201 (55.8%) | 32 (2.7%) |
| 20 to 24 Years | 2,185 (85.3%) | 105 (4.8%) |
| 25 to 29 Years | 2,007 (83.9%) | 46 (2.3%) |
| 30 to 34 Years | 2,039 (82.5%) | 41 (2.0%) |
| 35 to 44 Years | 4,827 (92.6%) | 92 (1.9%) |
| 45 to 54 Years | 4,201 (82.6%) | 46 (1.1%) |
| 55 to 59 Years | 3,049 (87.2%) | 15 (0.5%) |
| 60 to 64 Years | 2,197 (72.1%) | 44 (2.0%) |
| 65 to 74 Years | 1,246 (27.7%) | 11 (0.9%) |
| 75 Years and over | 261 (8.0%) | 0 (0.0%) |
| Total | 23,211 (67.9%) | 441 (1.9%) |
Employment Status by Educational Attainment in Dubois County
According to labor force statistics for Dubois County, 84.4% of individuals (18,319) out of the total population between 25 and 64 years of age (21,705) are in the labor force, with 1.5% or 275 of them being unemployed. The group with the highest labor force participation rate are those with the educational attainment of bachelor's degree or higher, with 91.6% or 5,142 individuals in the labor force. Within the labor force, individuals with less than high school education have the highest percentage of unemployment, with 3.5% or 47 of them being unemployed.
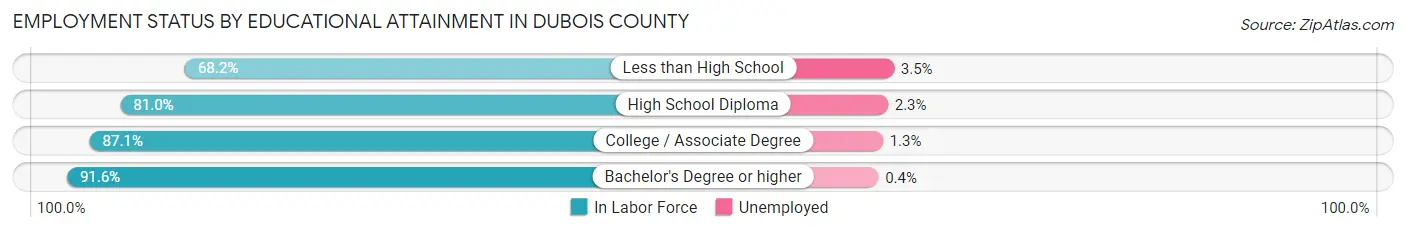
| Educational Attainment | In Labor Force | Unemployed |
| Less than High School | 1,332 (68.2%) | 68 (3.5%) |
| High School Diploma | 6,211 (81.0%) | 176 (2.3%) |
| College / Associate Degree | 5,635 (87.1%) | 84 (1.3%) |
| Bachelor's Degree or higher | 5,142 (91.6%) | 22 (0.4%) |
| Total | 18,319 (84.4%) | 326 (1.5%) |
Employment Occupations by Sex in Dubois County
Management, Business, Science and Arts Occupations
The most common Management, Business, Science and Arts occupations in Dubois County are Management (2,930 | 12.9%), Community & Social Service (1,623 | 7.1%), Health Diagnosing & Treating (1,135 | 5.0%), Education Instruction & Library (1,047 | 4.6%), and Health Technologists (872 | 3.8%).

Management, Business, Science and Arts Occupations by Sex
Within the Management, Business, Science and Arts occupations in Dubois County, the most male-oriented occupations are Architecture & Engineering (92.3%), Computers, Engineering & Science (82.3%), and Management (75.9%), while the most female-oriented occupations are Health Diagnosing & Treating (83.3%), Legal Services & Support (79.0%), and Education, Arts & Media (78.9%).

| Occupation | Male | Female |
| Management | 2,223 (75.9%) | 707 (24.1%) |
| Business & Financial | 326 (41.2%) | 465 (58.8%) |
| Computers, Engineering & Science | 684 (82.3%) | 147 (17.7%) |
| Computers & Mathematics | 189 (72.7%) | 71 (27.3%) |
| Architecture & Engineering | 454 (92.3%) | 38 (7.7%) |
| Life, Physical & Social Science | 41 (51.9%) | 38 (48.1%) |
| Community & Social Service | 443 (27.3%) | 1,180 (72.7%) |
| Education, Arts & Media | 50 (21.1%) | 187 (78.9%) |
| Legal Services & Support | 13 (21.0%) | 49 (79.0%) |
| Education Instruction & Library | 260 (24.8%) | 787 (75.2%) |
| Arts, Media & Entertainment | 120 (43.3%) | 157 (56.7%) |
| Health Diagnosing & Treating | 190 (16.7%) | 945 (83.3%) |
| Health Technologists | 188 (21.6%) | 684 (78.4%) |
| Total (Category) | 3,866 (52.9%) | 3,444 (47.1%) |
| Total (Overall) | 12,598 (55.4%) | 10,145 (44.6%) |
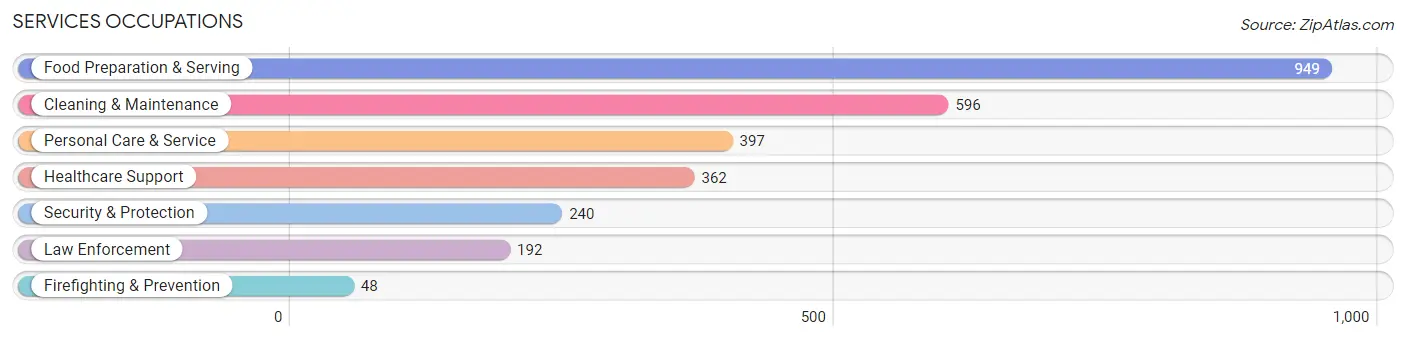
Services Occupations
The most common Services occupations in Dubois County are Food Preparation & Serving (949 | 4.2%), Cleaning & Maintenance (596 | 2.6%), Personal Care & Service (397 | 1.8%), Healthcare Support (362 | 1.6%), and Security & Protection (240 | 1.1%).
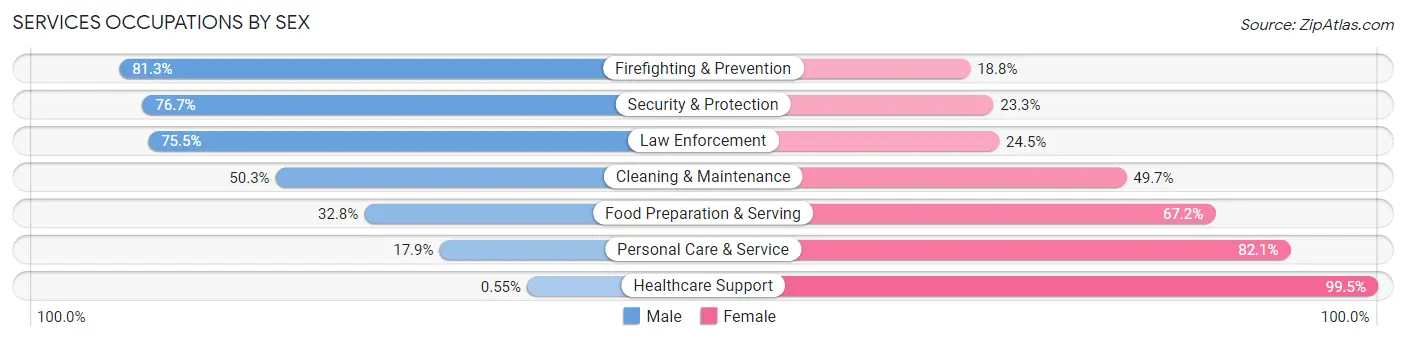
Services Occupations by Sex
Within the Services occupations in Dubois County, the most male-oriented occupations are Firefighting & Prevention (81.2%), Security & Protection (76.7%), and Law Enforcement (75.5%), while the most female-oriented occupations are Healthcare Support (99.5%), Personal Care & Service (82.1%), and Food Preparation & Serving (67.2%).
| Occupation | Male | Female |
| Healthcare Support | 2 (0.5%) | 360 (99.5%) |
| Security & Protection | 184 (76.7%) | 56 (23.3%) |
| Firefighting & Prevention | 39 (81.2%) | 9 (18.8%) |
| Law Enforcement | 145 (75.5%) | 47 (24.5%) |
| Food Preparation & Serving | 311 (32.8%) | 638 (67.2%) |
| Cleaning & Maintenance | 300 (50.3%) | 296 (49.7%) |
| Personal Care & Service | 71 (17.9%) | 326 (82.1%) |
| Total (Category) | 868 (34.1%) | 1,676 (65.9%) |
| Total (Overall) | 12,598 (55.4%) | 10,145 (44.6%) |
Sales and Office Occupations
The most common Sales and Office occupations in Dubois County are Office & Administration (2,623 | 11.5%), and Sales & Related (1,905 | 8.4%).

Sales and Office Occupations by Sex

| Occupation | Male | Female |
| Sales & Related | 1,157 (60.7%) | 748 (39.3%) |
| Office & Administration | 637 (24.3%) | 1,986 (75.7%) |
| Total (Category) | 1,794 (39.6%) | 2,734 (60.4%) |
| Total (Overall) | 12,598 (55.4%) | 10,145 (44.6%) |
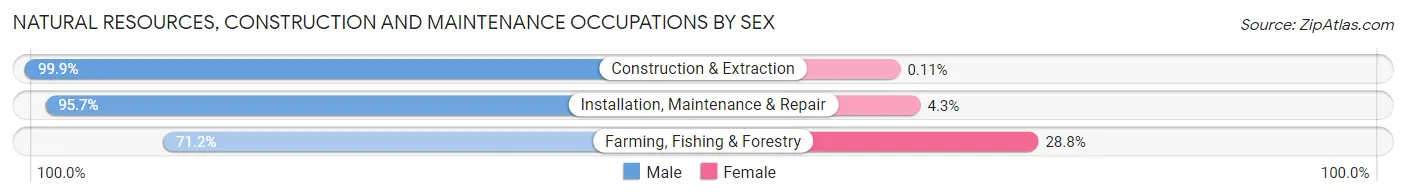
Natural Resources, Construction and Maintenance Occupations
The most common Natural Resources, Construction and Maintenance occupations in Dubois County are Construction & Extraction (927 | 4.1%), Installation, Maintenance & Repair (815 | 3.6%), and Farming, Fishing & Forestry (333 | 1.5%).

Natural Resources, Construction and Maintenance Occupations by Sex
| Occupation | Male | Female |
| Farming, Fishing & Forestry | 237 (71.2%) | 96 (28.8%) |
| Construction & Extraction | 926 (99.9%) | 1 (0.1%) |
| Installation, Maintenance & Repair | 780 (95.7%) | 35 (4.3%) |
| Total (Category) | 1,943 (93.6%) | 132 (6.4%) |
| Total (Overall) | 12,598 (55.4%) | 10,145 (44.6%) |
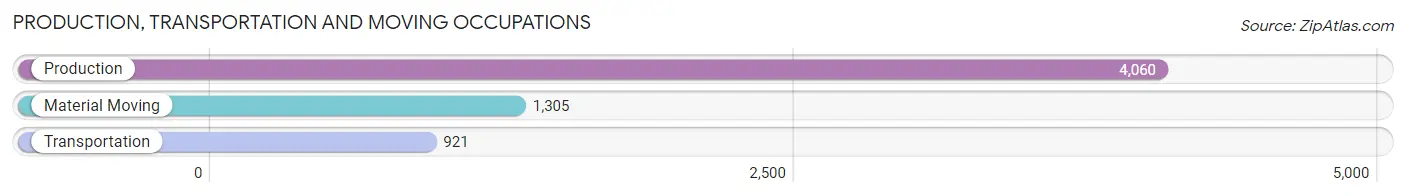
Production, Transportation and Moving Occupations
The most common Production, Transportation and Moving occupations in Dubois County are Production (4,060 | 17.8%), Material Moving (1,305 | 5.7%), and Transportation (921 | 4.1%).
Production, Transportation and Moving Occupations by Sex

| Occupation | Male | Female |
| Production | 2,315 (57.0%) | 1,745 (43.0%) |
| Transportation | 808 (87.7%) | 113 (12.3%) |
| Material Moving | 1,004 (76.9%) | 301 (23.1%) |
| Total (Category) | 4,127 (65.6%) | 2,159 (34.4%) |
| Total (Overall) | 12,598 (55.4%) | 10,145 (44.6%) |
Employment Industries by Sex in Dubois County
Employment Industries in Dubois County
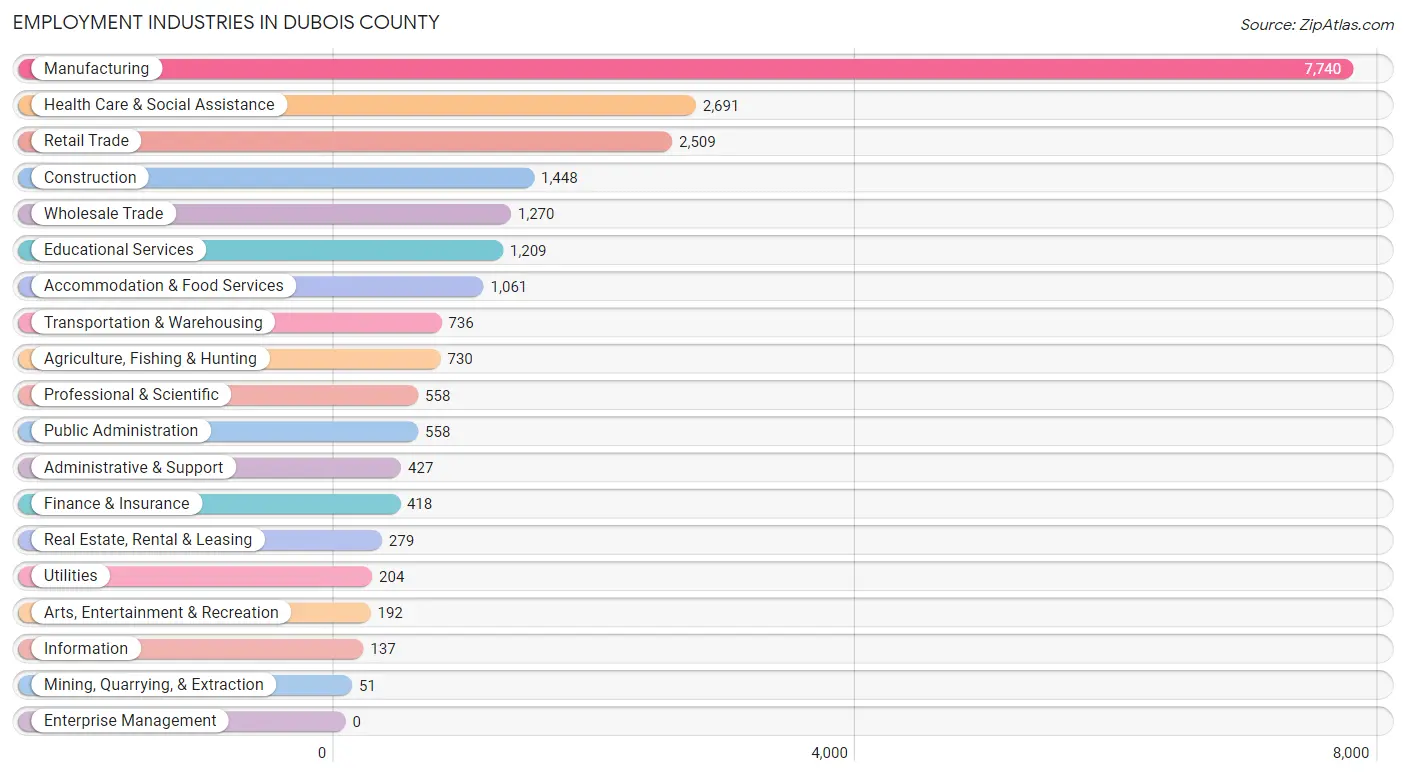
The major employment industries in Dubois County include Manufacturing (7,740 | 34.0%), Health Care & Social Assistance (2,691 | 11.8%), Retail Trade (2,509 | 11.0%), Construction (1,448 | 6.4%), and Wholesale Trade (1,270 | 5.6%).
Employment Industries by Sex in Dubois County
The Dubois County industries that see more men than women are Utilities (100.0%), Construction (94.2%), and Transportation & Warehousing (89.0%), whereas the industries that tend to have a higher number of women are Health Care & Social Assistance (91.7%), Finance & Insurance (70.3%), and Educational Services (70.2%).

| Industry | Male | Female |
| Agriculture, Fishing & Hunting | 597 (81.8%) | 133 (18.2%) |
| Mining, Quarrying, & Extraction | 45 (88.2%) | 6 (11.8%) |
| Construction | 1,364 (94.2%) | 84 (5.8%) |
| Manufacturing | 4,884 (63.1%) | 2,856 (36.9%) |
| Wholesale Trade | 788 (62.1%) | 482 (38.0%) |
| Retail Trade | 1,378 (54.9%) | 1,131 (45.1%) |
| Transportation & Warehousing | 655 (89.0%) | 81 (11.0%) |
| Utilities | 204 (100.0%) | 0 (0.0%) |
| Information | 84 (61.3%) | 53 (38.7%) |
| Finance & Insurance | 124 (29.7%) | 294 (70.3%) |
| Real Estate, Rental & Leasing | 161 (57.7%) | 118 (42.3%) |
| Professional & Scientific | 259 (46.4%) | 299 (53.6%) |
| Enterprise Management | 0 (0.0%) | 0 (0.0%) |
| Administrative & Support | 244 (57.1%) | 183 (42.9%) |
| Educational Services | 360 (29.8%) | 849 (70.2%) |
| Health Care & Social Assistance | 222 (8.3%) | 2,469 (91.7%) |
| Arts, Entertainment & Recreation | 139 (72.4%) | 53 (27.6%) |
| Accommodation & Food Services | 445 (41.9%) | 616 (58.1%) |
| Public Administration | 354 (63.4%) | 204 (36.6%) |
| Total | 12,598 (55.4%) | 10,145 (44.6%) |
Education in Dubois County
School Enrollment in Dubois County
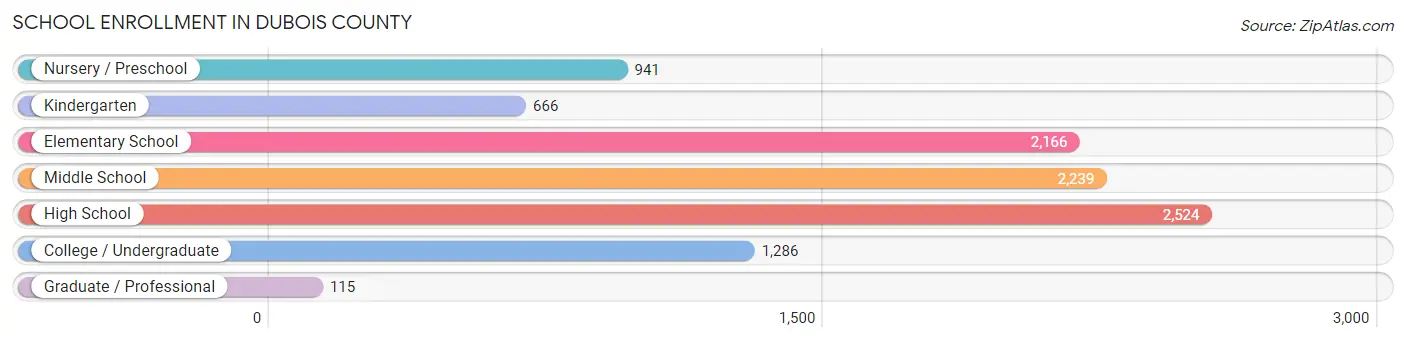
The most common levels of schooling among the 9,937 students in Dubois County are high school (2,524 | 25.4%), middle school (2,239 | 22.5%), and elementary school (2,166 | 21.8%).
| School Level | # Students | % Students |
| Nursery / Preschool | 941 | 9.5% |
| Kindergarten | 666 | 6.7% |
| Elementary School | 2,166 | 21.8% |
| Middle School | 2,239 | 22.5% |
| High School | 2,524 | 25.4% |
| College / Undergraduate | 1,286 | 12.9% |
| Graduate / Professional | 115 | 1.2% |
| Total | 9,937 | 100.0% |
School Enrollment by Age by Funding Source in Dubois County
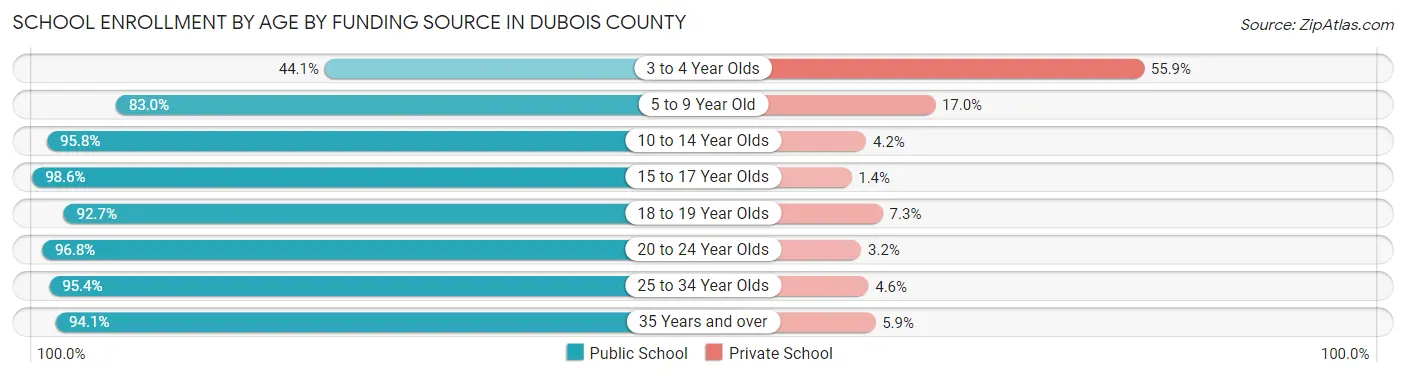
Out of a total of 9,937 students who are enrolled in schools in Dubois County, 1,014 (10.2%) attend a private institution, while the remaining 8,923 (89.8%) are enrolled in public schools. The age group of 3 to 4 year olds has the highest likelihood of being enrolled in private schools, with 260 (55.9% in the age bracket) enrolled. Conversely, the age group of 15 to 17 year olds has the lowest likelihood of being enrolled in a private school, with 1,808 (98.6% in the age bracket) attending a public institution.
| Age Bracket | Public School | Private School |
| 3 to 4 Year Olds | 205 (44.1%) | 260 (55.9%) |
| 5 to 9 Year Old | 2,481 (83.0%) | 508 (17.0%) |
| 10 to 14 Year Olds | 2,684 (95.8%) | 117 (4.2%) |
| 15 to 17 Year Olds | 1,808 (98.6%) | 26 (1.4%) |
| 18 to 19 Year Olds | 651 (92.7%) | 51 (7.3%) |
| 20 to 24 Year Olds | 478 (96.8%) | 16 (3.2%) |
| 25 to 34 Year Olds | 395 (95.4%) | 19 (4.6%) |
| 35 Years and over | 224 (94.1%) | 14 (5.9%) |
| Total | 8,923 (89.8%) | 1,014 (10.2%) |
Educational Attainment by Field of Study in Dubois County
Business (1,543 | 20.0%), education (1,428 | 18.5%), science & technology (1,341 | 17.4%), engineering (469 | 6.1%), and bio, nature & agricultural (437 | 5.7%) are the most common fields of study among 7,707 individuals in Dubois County who have obtained a bachelor's degree or higher.

| Field of Study | # Graduates | % Graduates |
| Computers & Mathematics | 325 | 4.2% |
| Bio, Nature & Agricultural | 437 | 5.7% |
| Physical & Health Sciences | 155 | 2.0% |
| Psychology | 363 | 4.7% |
| Social Sciences | 342 | 4.4% |
| Engineering | 469 | 6.1% |
| Multidisciplinary Studies | 27 | 0.4% |
| Science & Technology | 1,341 | 17.4% |
| Business | 1,543 | 20.0% |
| Education | 1,428 | 18.5% |
| Literature & Languages | 189 | 2.5% |
| Liberal Arts & History | 368 | 4.8% |
| Visual & Performing Arts | 199 | 2.6% |
| Communications | 245 | 3.2% |
| Arts & Humanities | 276 | 3.6% |
| Total | 7,707 | 100.0% |
Transportation & Commute in Dubois County
Vehicle Availability by Sex in Dubois County
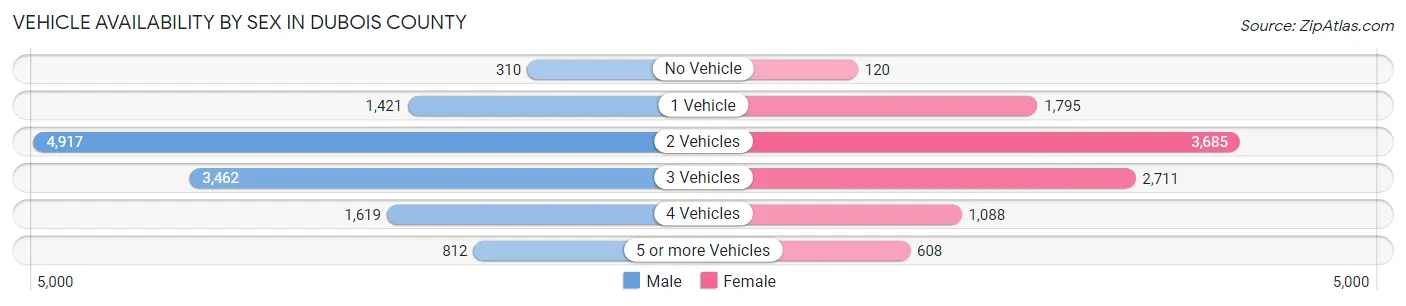
The most prevalent vehicle ownership categories in Dubois County are males with 2 vehicles (4,917, accounting for 39.2%) and females with 2 vehicles (3,685, making up 49.1%).
| Vehicles Available | Male | Female |
| No Vehicle | 310 (2.5%) | 120 (1.2%) |
| 1 Vehicle | 1,421 (11.3%) | 1,795 (17.9%) |
| 2 Vehicles | 4,917 (39.2%) | 3,685 (36.8%) |
| 3 Vehicles | 3,462 (27.6%) | 2,711 (27.1%) |
| 4 Vehicles | 1,619 (12.9%) | 1,088 (10.9%) |
| 5 or more Vehicles | 812 (6.5%) | 608 (6.1%) |
| Total | 12,541 (100.0%) | 10,007 (100.0%) |
Commute Time in Dubois County
The most frequently occuring commute durations in Dubois County are 15 to 19 minutes (4,495 commuters, 20.7%), 5 to 9 minutes (4,489 commuters, 20.6%), and 10 to 14 minutes (3,903 commuters, 17.9%).

| Commute Time | # Commuters | % Commuters |
| Less than 5 Minutes | 1,328 | 6.1% |
| 5 to 9 Minutes | 4,489 | 20.6% |
| 10 to 14 Minutes | 3,903 | 17.9% |
| 15 to 19 Minutes | 4,495 | 20.7% |
| 20 to 24 Minutes | 2,951 | 13.6% |
| 25 to 29 Minutes | 1,090 | 5.0% |
| 30 to 34 Minutes | 909 | 4.2% |
| 35 to 39 Minutes | 228 | 1.1% |
| 40 to 44 Minutes | 149 | 0.7% |
| 45 to 59 Minutes | 948 | 4.4% |
| 60 to 89 Minutes | 949 | 4.4% |
| 90 or more Minutes | 306 | 1.4% |
Commute Time by Sex in Dubois County
The most common commute times in Dubois County are 15 to 19 minutes (2,639 commuters, 21.5%) for males and 5 to 9 minutes (2,273 commuters, 23.9%) for females.
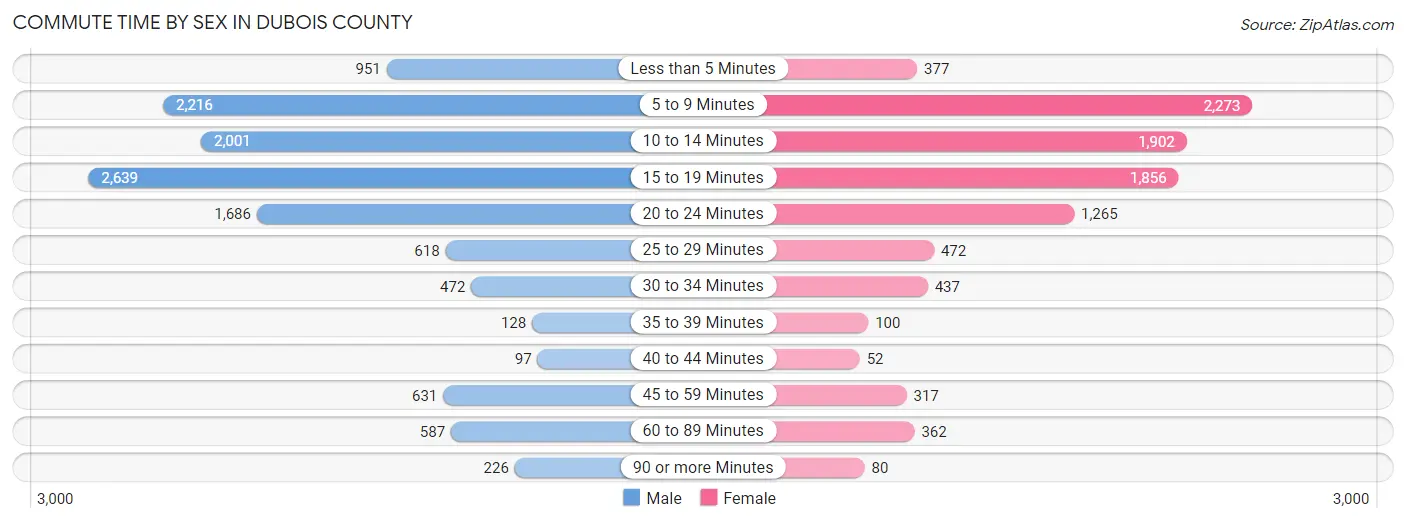
| Commute Time | Male | Female |
| Less than 5 Minutes | 951 (7.8%) | 377 (4.0%) |
| 5 to 9 Minutes | 2,216 (18.1%) | 2,273 (23.9%) |
| 10 to 14 Minutes | 2,001 (16.3%) | 1,902 (20.0%) |
| 15 to 19 Minutes | 2,639 (21.5%) | 1,856 (19.6%) |
| 20 to 24 Minutes | 1,686 (13.8%) | 1,265 (13.3%) |
| 25 to 29 Minutes | 618 (5.0%) | 472 (5.0%) |
| 30 to 34 Minutes | 472 (3.8%) | 437 (4.6%) |
| 35 to 39 Minutes | 128 (1.0%) | 100 (1.1%) |
| 40 to 44 Minutes | 97 (0.8%) | 52 (0.5%) |
| 45 to 59 Minutes | 631 (5.1%) | 317 (3.3%) |
| 60 to 89 Minutes | 587 (4.8%) | 362 (3.8%) |
| 90 or more Minutes | 226 (1.8%) | 80 (0.8%) |
Time of Departure to Work by Sex in Dubois County
The most frequent times of departure to work in Dubois County are 6:30 AM to 6:59 AM (2,002, 16.3%) for males and 7:00 AM to 7:29 AM (1,642, 17.3%) for females.
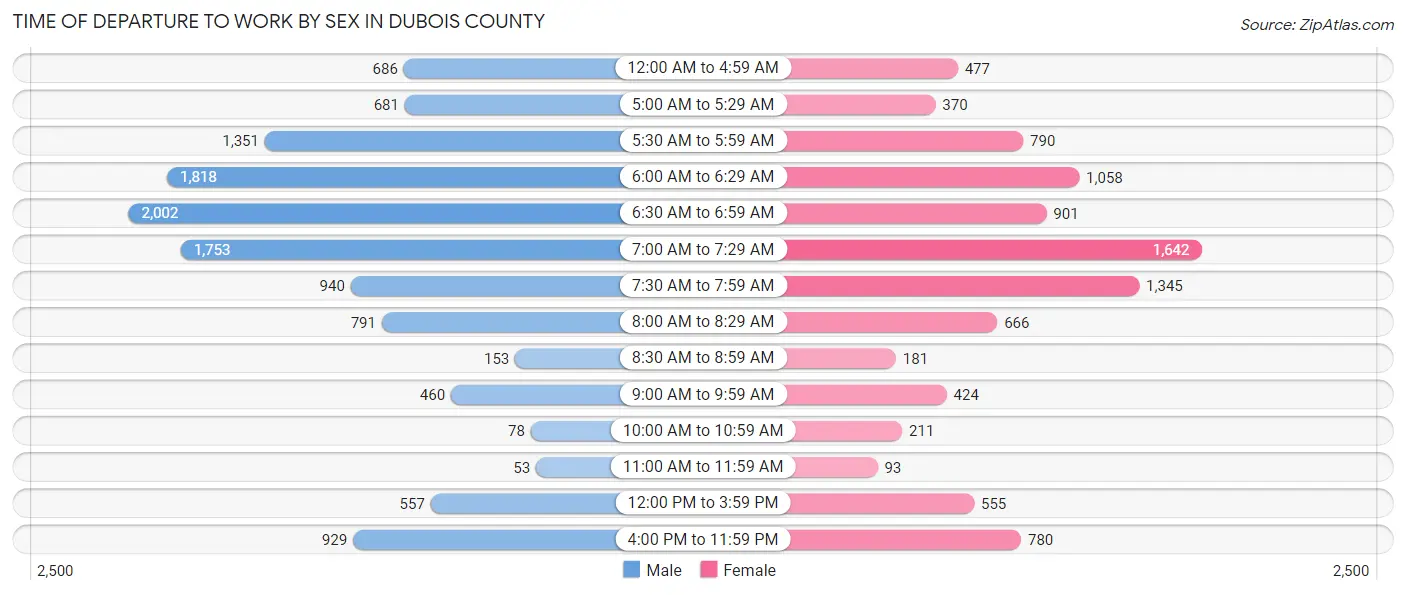
| Time of Departure | Male | Female |
| 12:00 AM to 4:59 AM | 686 (5.6%) | 477 (5.0%) |
| 5:00 AM to 5:29 AM | 681 (5.6%) | 370 (3.9%) |
| 5:30 AM to 5:59 AM | 1,351 (11.0%) | 790 (8.3%) |
| 6:00 AM to 6:29 AM | 1,818 (14.8%) | 1,058 (11.2%) |
| 6:30 AM to 6:59 AM | 2,002 (16.3%) | 901 (9.5%) |
| 7:00 AM to 7:29 AM | 1,753 (14.3%) | 1,642 (17.3%) |
| 7:30 AM to 7:59 AM | 940 (7.7%) | 1,345 (14.2%) |
| 8:00 AM to 8:29 AM | 791 (6.5%) | 666 (7.0%) |
| 8:30 AM to 8:59 AM | 153 (1.3%) | 181 (1.9%) |
| 9:00 AM to 9:59 AM | 460 (3.7%) | 424 (4.5%) |
| 10:00 AM to 10:59 AM | 78 (0.6%) | 211 (2.2%) |
| 11:00 AM to 11:59 AM | 53 (0.4%) | 93 (1.0%) |
| 12:00 PM to 3:59 PM | 557 (4.5%) | 555 (5.9%) |
| 4:00 PM to 11:59 PM | 929 (7.6%) | 780 (8.2%) |
| Total | 12,252 (100.0%) | 9,493 (100.0%) |
Housing Occupancy in Dubois County
Occupancy by Ownership in Dubois County
Of the total 17,437 dwellings in Dubois County, owner-occupied units account for 13,508 (77.5%), while renter-occupied units make up 3,929 (22.5%).

| Occupancy | # Housing Units | % Housing Units |
| Owner Occupied Housing Units | 13,508 | 77.5% |
| Renter-Occupied Housing Units | 3,929 | 22.5% |
| Total Occupied Housing Units | 17,437 | 100.0% |
Occupancy by Household Size in Dubois County

| Household Size | # Housing Units | % Housing Units |
| 1-Person Household | 5,314 | 30.5% |
| 2-Person Household | 6,358 | 36.5% |
| 3-Person Household | 2,419 | 13.9% |
| 4+ Person Household | 3,346 | 19.2% |
| Total Housing Units | 17,437 | 100.0% |
Occupancy by Ownership by Household Size in Dubois County
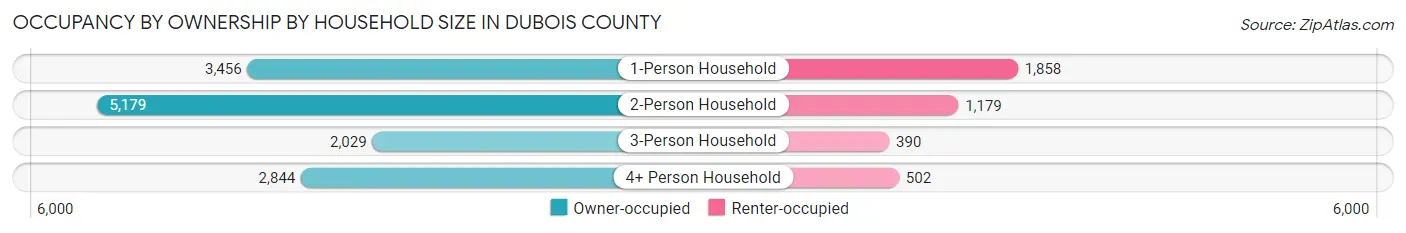
| Household Size | Owner-occupied | Renter-occupied |
| 1-Person Household | 3,456 (65.0%) | 1,858 (35.0%) |
| 2-Person Household | 5,179 (81.5%) | 1,179 (18.5%) |
| 3-Person Household | 2,029 (83.9%) | 390 (16.1%) |
| 4+ Person Household | 2,844 (85.0%) | 502 (15.0%) |
| Total Housing Units | 13,508 (77.5%) | 3,929 (22.5%) |
Occupancy by Educational Attainment in Dubois County
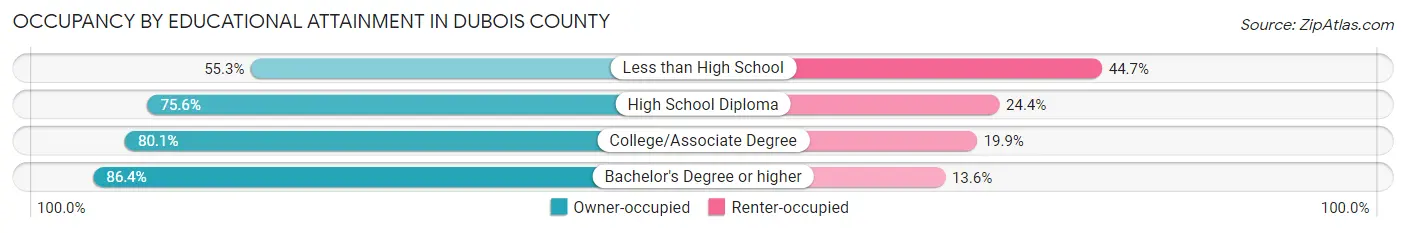
| Household Size | Owner-occupied | Renter-occupied |
| Less than High School | 975 (55.3%) | 789 (44.7%) |
| High School Diploma | 4,682 (75.6%) | 1,509 (24.4%) |
| College/Associate Degree | 4,298 (80.1%) | 1,070 (19.9%) |
| Bachelor's Degree or higher | 3,553 (86.4%) | 561 (13.6%) |
Occupancy by Age of Householder in Dubois County

| Age Bracket | # Households | % Households |
| Under 35 Years | 3,248 | 18.6% |
| 35 to 44 Years | 2,894 | 16.6% |
| 45 to 54 Years | 2,686 | 15.4% |
| 55 to 64 Years | 3,829 | 22.0% |
| 65 to 74 Years | 2,803 | 16.1% |
| 75 to 84 Years | 1,449 | 8.3% |
| 85 Years and Over | 528 | 3.0% |
| Total | 17,437 | 100.0% |
Housing Finances in Dubois County
Median Income by Occupancy in Dubois County

| Occupancy Type | # Households | Median Income |
| Owner-Occupied | 13,508 (77.5%) | $80,265 |
| Renter-Occupied | 3,929 (22.5%) | $36,701 |
| Average | 17,437 (100.0%) | $68,945 |
Occupancy by Householder Income Bracket in Dubois County
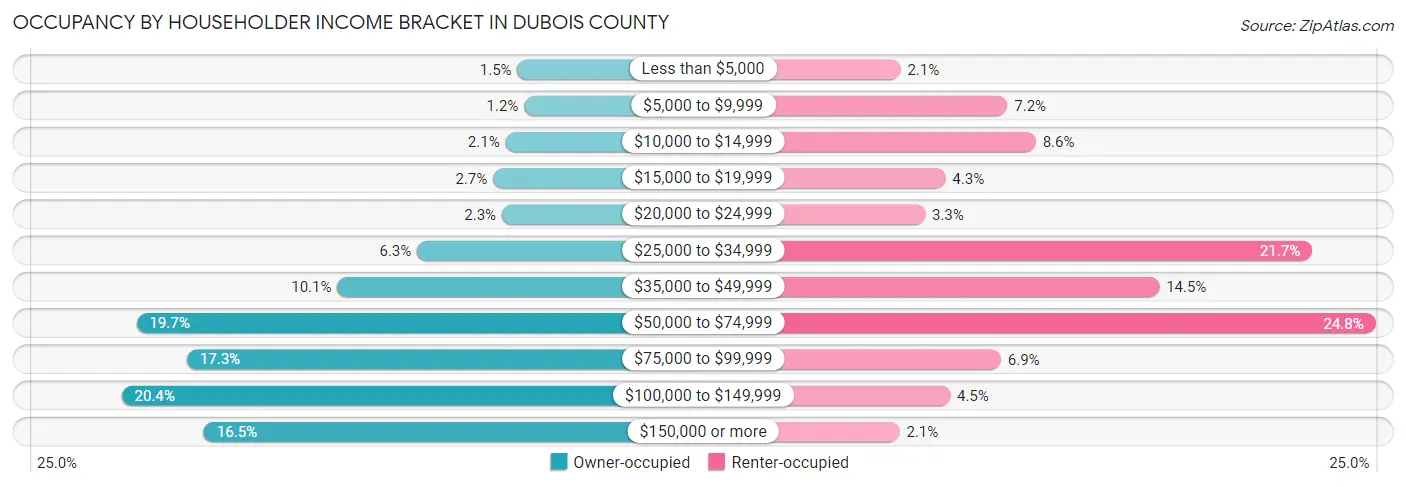
| Income Bracket | Owner-occupied | Renter-occupied |
| Less than $5,000 | 206 (1.5%) | 84 (2.1%) |
| $5,000 to $9,999 | 164 (1.2%) | 284 (7.2%) |
| $10,000 to $14,999 | 284 (2.1%) | 337 (8.6%) |
| $15,000 to $19,999 | 364 (2.7%) | 168 (4.3%) |
| $20,000 to $24,999 | 306 (2.3%) | 130 (3.3%) |
| $25,000 to $34,999 | 853 (6.3%) | 854 (21.7%) |
| $35,000 to $49,999 | 1,365 (10.1%) | 568 (14.5%) |
| $50,000 to $74,999 | 2,657 (19.7%) | 973 (24.8%) |
| $75,000 to $99,999 | 2,333 (17.3%) | 272 (6.9%) |
| $100,000 to $149,999 | 2,753 (20.4%) | 177 (4.5%) |
| $150,000 or more | 2,223 (16.5%) | 82 (2.1%) |
| Total | 13,508 (100.0%) | 3,929 (100.0%) |
Monthly Housing Cost Tiers in Dubois County
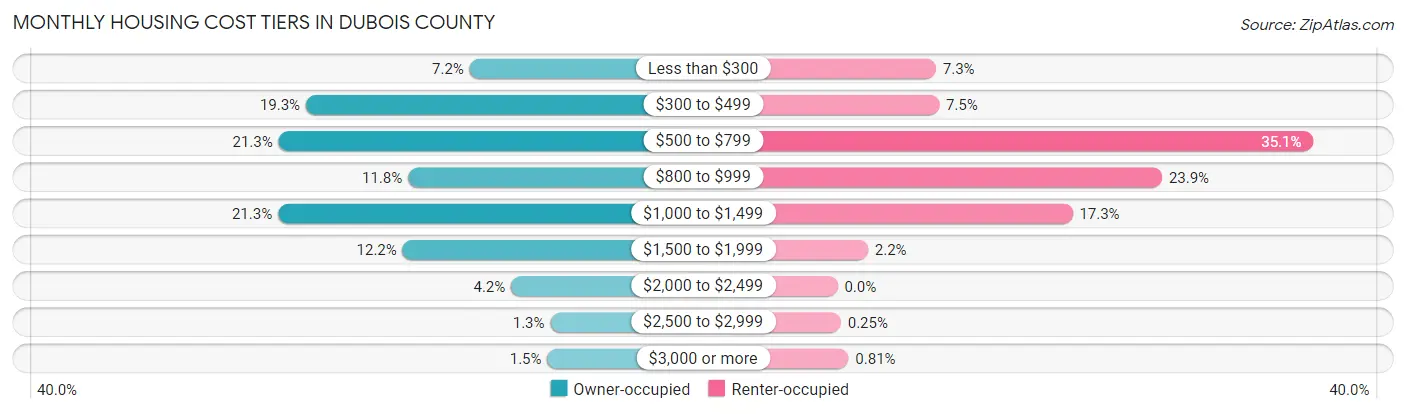
| Monthly Cost | Owner-occupied | Renter-occupied |
| Less than $300 | 975 (7.2%) | 285 (7.2%) |
| $300 to $499 | 2,605 (19.3%) | 294 (7.5%) |
| $500 to $799 | 2,877 (21.3%) | 1,377 (35.0%) |
| $800 to $999 | 1,588 (11.8%) | 939 (23.9%) |
| $1,000 to $1,499 | 2,882 (21.3%) | 680 (17.3%) |
| $1,500 to $1,999 | 1,642 (12.2%) | 88 (2.2%) |
| $2,000 to $2,499 | 563 (4.2%) | 0 (0.0%) |
| $2,500 to $2,999 | 173 (1.3%) | 10 (0.3%) |
| $3,000 or more | 203 (1.5%) | 32 (0.8%) |
| Total | 13,508 (100.0%) | 3,929 (100.0%) |
Physical Housing Characteristics in Dubois County
Housing Structures in Dubois County

| Structure Type | # Housing Units | % Housing Units |
| Single Unit, Detached | 14,067 | 80.7% |
| Single Unit, Attached | 288 | 1.7% |
| 2 Unit Apartments | 805 | 4.6% |
| 3 or 4 Unit Apartments | 423 | 2.4% |
| 5 to 9 Unit Apartments | 269 | 1.5% |
| 10 or more Apartments | 926 | 5.3% |
| Mobile Home / Other | 659 | 3.8% |
| Total | 17,437 | 100.0% |
Housing Structures by Occupancy in Dubois County

| Structure Type | Owner-occupied | Renter-occupied |
| Single Unit, Detached | 12,746 (90.6%) | 1,321 (9.4%) |
| Single Unit, Attached | 95 (33.0%) | 193 (67.0%) |
| 2 Unit Apartments | 80 (9.9%) | 725 (90.1%) |
| 3 or 4 Unit Apartments | 35 (8.3%) | 388 (91.7%) |
| 5 to 9 Unit Apartments | 11 (4.1%) | 258 (95.9%) |
| 10 or more Apartments | 0 (0.0%) | 926 (100.0%) |
| Mobile Home / Other | 541 (82.1%) | 118 (17.9%) |
| Total | 13,508 (77.5%) | 3,929 (22.5%) |
Housing Structures by Number of Rooms in Dubois County

| Number of Rooms | Owner-occupied | Renter-occupied |
| 1 Room | 1 (0.0%) | 76 (1.9%) |
| 2 or 3 Rooms | 274 (2.0%) | 1,181 (30.1%) |
| 4 or 5 Rooms | 3,913 (29.0%) | 1,850 (47.1%) |
| 6 or 7 Rooms | 5,352 (39.6%) | 591 (15.0%) |
| 8 or more Rooms | 3,968 (29.4%) | 231 (5.9%) |
| Total | 13,508 (100.0%) | 3,929 (100.0%) |
Housing Structure by Heating Type in Dubois County

| Heating Type | Owner-occupied | Renter-occupied |
| Utility Gas | 6,564 (48.6%) | 1,168 (29.7%) |
| Bottled, Tank, or LP Gas | 2,804 (20.8%) | 164 (4.2%) |
| Electricity | 3,468 (25.7%) | 2,582 (65.7%) |
| Fuel Oil or Kerosene | 112 (0.8%) | 0 (0.0%) |
| Coal or Coke | 0 (0.0%) | 0 (0.0%) |
| All other Fuels | 423 (3.1%) | 11 (0.3%) |
| No Fuel Used | 137 (1.0%) | 4 (0.1%) |
| Total | 13,508 (100.0%) | 3,929 (100.0%) |
Household Vehicle Usage in Dubois County
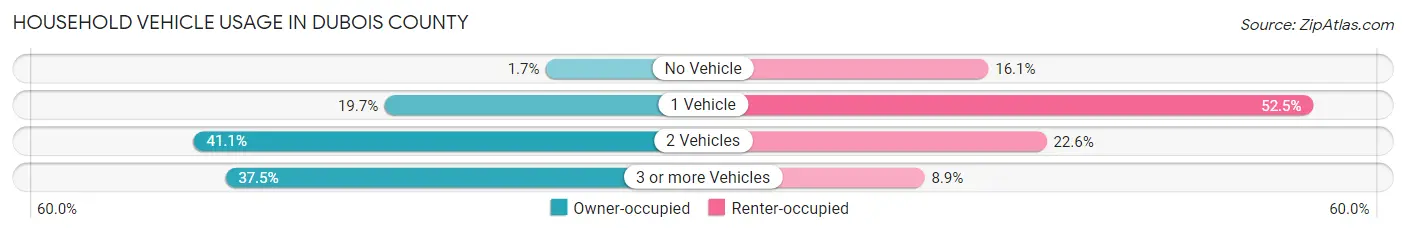
| Vehicles per Household | Owner-occupied | Renter-occupied |
| No Vehicle | 225 (1.7%) | 631 (16.1%) |
| 1 Vehicle | 2,667 (19.7%) | 2,061 (52.5%) |
| 2 Vehicles | 5,548 (41.1%) | 887 (22.6%) |
| 3 or more Vehicles | 5,068 (37.5%) | 350 (8.9%) |
| Total | 13,508 (100.0%) | 3,929 (100.0%) |
Real Estate & Mortgages in Dubois County
Real Estate and Mortgage Overview in Dubois County
| Characteristic | Without Mortgage | With Mortgage |
| Housing Units | 5,550 | 7,958 |
| Median Property Value | $173,800 | $192,600 |
| Median Household Income | $66,489 | $1,548 |
| Monthly Housing Costs | $447 | $179 |
| Real Estate Taxes | $1,279 | $150 |
Property Value by Mortgage Status in Dubois County

| Property Value | Without Mortgage | With Mortgage |
| Less than $50,000 | 456 (8.2%) | 238 (3.0%) |
| $50,000 to $99,999 | 782 (14.1%) | 1,104 (13.9%) |
| $100,000 to $299,999 | 3,128 (56.4%) | 5,084 (63.9%) |
| $300,000 to $499,999 | 950 (17.1%) | 1,272 (16.0%) |
| $500,000 to $749,999 | 127 (2.3%) | 207 (2.6%) |
| $750,000 to $999,999 | 93 (1.7%) | 21 (0.3%) |
| $1,000,000 or more | 14 (0.3%) | 32 (0.4%) |
| Total | 5,550 (100.0%) | 7,958 (100.0%) |
Household Income by Mortgage Status in Dubois County
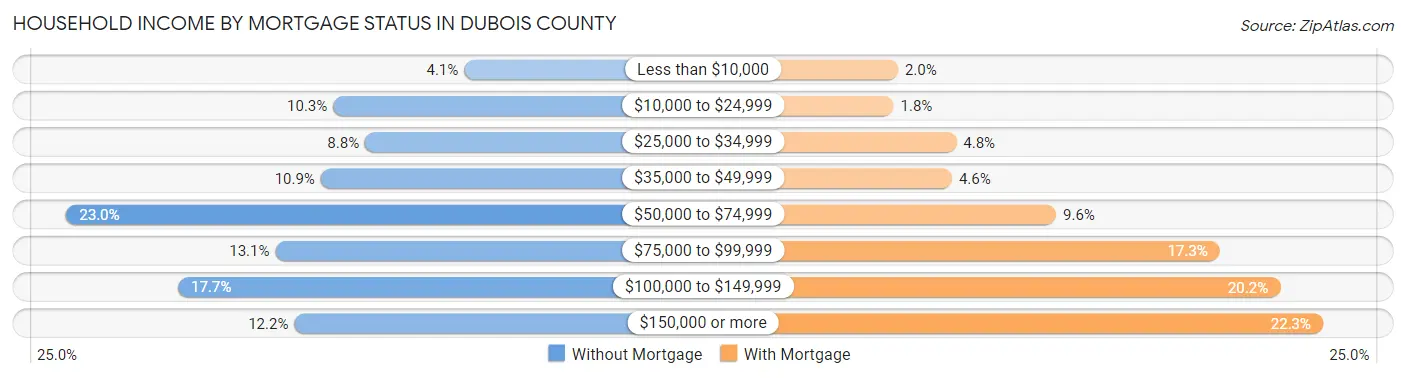
| Household Income | Without Mortgage | With Mortgage |
| Less than $10,000 | 226 (4.1%) | 161 (2.0%) |
| $10,000 to $24,999 | 572 (10.3%) | 144 (1.8%) |
| $25,000 to $34,999 | 488 (8.8%) | 382 (4.8%) |
| $35,000 to $49,999 | 605 (10.9%) | 365 (4.6%) |
| $50,000 to $74,999 | 1,277 (23.0%) | 760 (9.6%) |
| $75,000 to $99,999 | 725 (13.1%) | 1,380 (17.3%) |
| $100,000 to $149,999 | 982 (17.7%) | 1,608 (20.2%) |
| $150,000 or more | 675 (12.2%) | 1,771 (22.3%) |
| Total | 5,550 (100.0%) | 7,958 (100.0%) |
Property Value to Household Income Ratio in Dubois County

| Value-to-Income Ratio | Without Mortgage | With Mortgage |
| Less than 2.0x | 1,924 (34.7%) | 87,253 (1,096.4%) |
| 2.0x to 2.9x | 1,258 (22.7%) | 3,681 (46.3%) |
| 3.0x to 3.9x | 673 (12.1%) | 2,012 (25.3%) |
| 4.0x or more | 1,587 (28.6%) | 852 (10.7%) |
| Total | 5,550 (100.0%) | 7,958 (100.0%) |
Real Estate Taxes by Mortgage Status in Dubois County

| Property Taxes | Without Mortgage | With Mortgage |
| Less than $800 | 1,657 (29.9%) | 13 (0.2%) |
| $800 to $1,499 | 1,578 (28.4%) | 2,310 (29.0%) |
| $800 to $1,499 | 2,149 (38.7%) | 2,713 (34.1%) |
| Total | 5,550 (100.0%) | 7,958 (100.0%) |
Health & Disability in Dubois County
Health Insurance Coverage by Age in Dubois County

| Age Bracket | With Coverage | Without Coverage |
| Under 6 Years | 3,753 (99.4%) | 21 (0.6%) |
| 6 to 18 Years | 7,321 (98.2%) | 133 (1.8%) |
| 19 to 25 Years | 3,031 (91.4%) | 284 (8.6%) |
| 26 to 34 Years | 3,638 (84.4%) | 673 (15.6%) |
| 35 to 44 Years | 4,934 (95.6%) | 225 (4.4%) |
| 45 to 54 Years | 4,745 (93.8%) | 314 (6.2%) |
| 55 to 64 Years | 6,255 (96.0%) | 264 (4.1%) |
| 65 to 74 Years | 4,410 (100.0%) | 0 (0.0%) |
| 75 Years and older | 2,796 (100.0%) | 0 (0.0%) |
| Total | 40,883 (95.5%) | 1,914 (4.5%) |
Health Insurance Coverage by Citizenship Status in Dubois County

| Citizenship Status | With Coverage | Without Coverage |
| Native Born | 3,753 (99.4%) | 21 (0.6%) |
| Foreign Born, Citizen | 7,321 (98.2%) | 133 (1.8%) |
| Foreign Born, not a Citizen | 3,031 (91.4%) | 284 (8.6%) |
Health Insurance Coverage by Household Income in Dubois County

| Household Income | With Coverage | Without Coverage |
| Under $25,000 | 3,753 (90.9%) | 377 (9.1%) |
| $25,000 to $49,999 | 5,670 (91.7%) | 513 (8.3%) |
| $50,000 to $74,999 | 8,180 (95.7%) | 372 (4.3%) |
| $75,000 to $99,999 | 6,828 (95.6%) | 311 (4.4%) |
| $100,000 and over | 16,258 (98.0%) | 338 (2.0%) |
Public vs Private Health Insurance Coverage by Age in Dubois County

| Age Bracket | Public Insurance | Private Insurance |
| Under 6 | 1,238 (32.8%) | 2,630 (69.7%) |
| 6 to 18 Years | 1,473 (19.8%) | 6,117 (82.1%) |
| 19 to 25 Years | 510 (15.4%) | 2,694 (81.3%) |
| 25 to 34 Years | 301 (7.0%) | 3,382 (78.4%) |
| 35 to 44 Years | 373 (7.2%) | 4,591 (89.0%) |
| 45 to 54 Years | 533 (10.5%) | 4,354 (86.1%) |
| 55 to 64 Years | 717 (11.0%) | 5,719 (87.7%) |
| 65 to 74 Years | 4,284 (97.1%) | 2,464 (55.9%) |
| 75 Years and over | 2,780 (99.4%) | 1,333 (47.7%) |
| Total | 12,209 (28.5%) | 33,284 (77.8%) |
Disability Status by Sex by Age in Dubois County

| Age Bracket | Male | Female |
| Under 5 Years | 0 (0.0%) | 0 (0.0%) |
| 5 to 17 Years | 159 (4.0%) | 114 (3.0%) |
| 18 to 34 Years | 263 (6.4%) | 333 (8.1%) |
| 35 to 64 Years | 702 (8.1%) | 801 (10.0%) |
| 65 to 74 Years | 653 (30.1%) | 446 (19.9%) |
| 75 Years and over | 449 (38.8%) | 736 (44.9%) |
Disability Class by Sex by Age in Dubois County
Disability Class: Hearing Difficulty

| Age Bracket | Male | Female |
| Under 5 Years | 0 (0.0%) | 0 (0.0%) |
| 5 to 17 Years | 24 (0.6%) | 0 (0.0%) |
| 18 to 34 Years | 30 (0.7%) | 27 (0.6%) |
| 35 to 64 Years | 394 (4.5%) | 134 (1.7%) |
| 65 to 74 Years | 370 (17.1%) | 88 (3.9%) |
| 75 Years and over | 211 (18.2%) | 149 (9.1%) |
Disability Class: Vision Difficulty
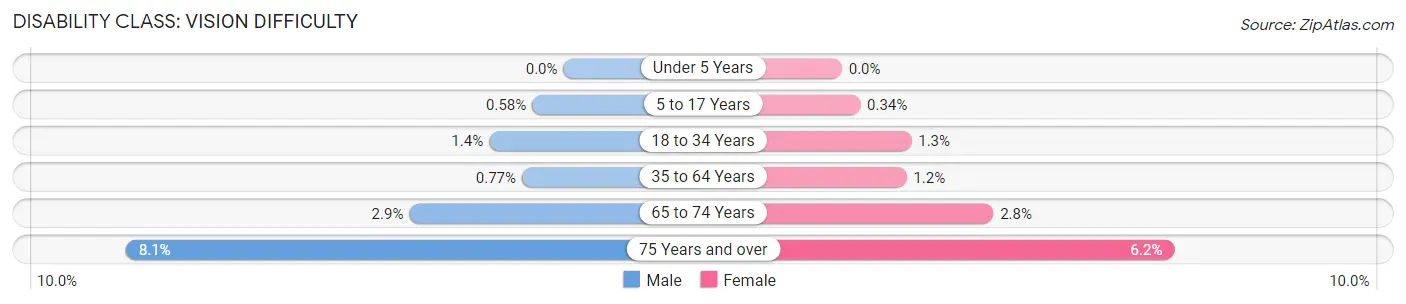
| Age Bracket | Male | Female |
| Under 5 Years | 0 (0.0%) | 0 (0.0%) |
| 5 to 17 Years | 23 (0.6%) | 13 (0.3%) |
| 18 to 34 Years | 57 (1.4%) | 53 (1.3%) |
| 35 to 64 Years | 67 (0.8%) | 96 (1.2%) |
| 65 to 74 Years | 62 (2.9%) | 63 (2.8%) |
| 75 Years and over | 94 (8.1%) | 101 (6.2%) |
Disability Class: Cognitive Difficulty

| Age Bracket | Male | Female |
| 5 to 17 Years | 81 (2.0%) | 101 (2.6%) |
| 18 to 34 Years | 144 (3.5%) | 181 (4.4%) |
| 35 to 64 Years | 166 (1.9%) | 391 (4.9%) |
| 65 to 74 Years | 74 (3.4%) | 71 (3.2%) |
| 75 Years and over | 91 (7.9%) | 147 (9.0%) |
Disability Class: Ambulatory Difficulty
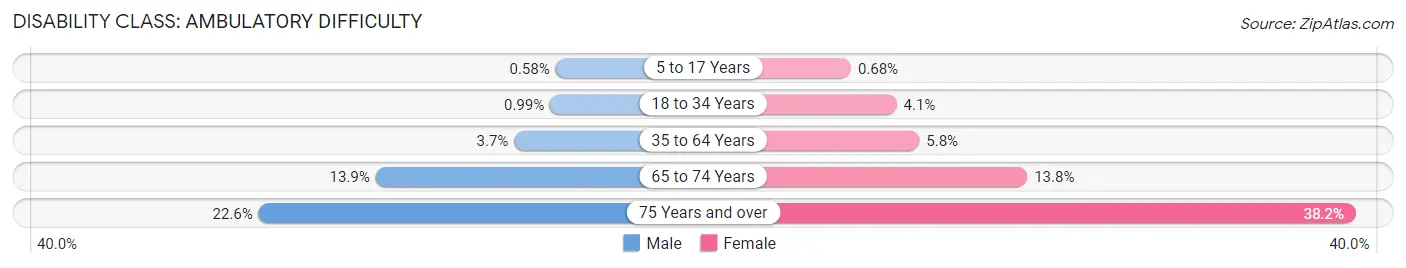
| Age Bracket | Male | Female |
| 5 to 17 Years | 23 (0.6%) | 26 (0.7%) |
| 18 to 34 Years | 41 (1.0%) | 168 (4.1%) |
| 35 to 64 Years | 318 (3.6%) | 462 (5.8%) |
| 65 to 74 Years | 302 (13.9%) | 309 (13.8%) |
| 75 Years and over | 262 (22.6%) | 625 (38.2%) |
Disability Class: Self-Care Difficulty

| Age Bracket | Male | Female |
| 5 to 17 Years | 41 (1.0%) | 26 (0.7%) |
| 18 to 34 Years | 41 (1.0%) | 168 (4.1%) |
| 35 to 64 Years | 137 (1.6%) | 126 (1.6%) |
| 65 to 74 Years | 76 (3.5%) | 46 (2.1%) |
| 75 Years and over | 69 (6.0%) | 161 (9.8%) |
Technology Access in Dubois County
Computing Device Access in Dubois County
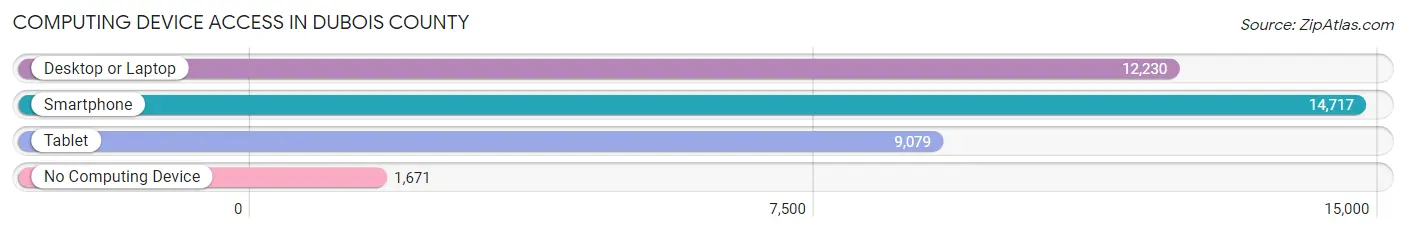
| Device Type | # Households | % Households |
| Desktop or Laptop | 12,230 | 70.1% |
| Smartphone | 14,717 | 84.4% |
| Tablet | 9,079 | 52.1% |
| No Computing Device | 1,671 | 9.6% |
| Total | 17,437 | 100.0% |
Internet Access in Dubois County
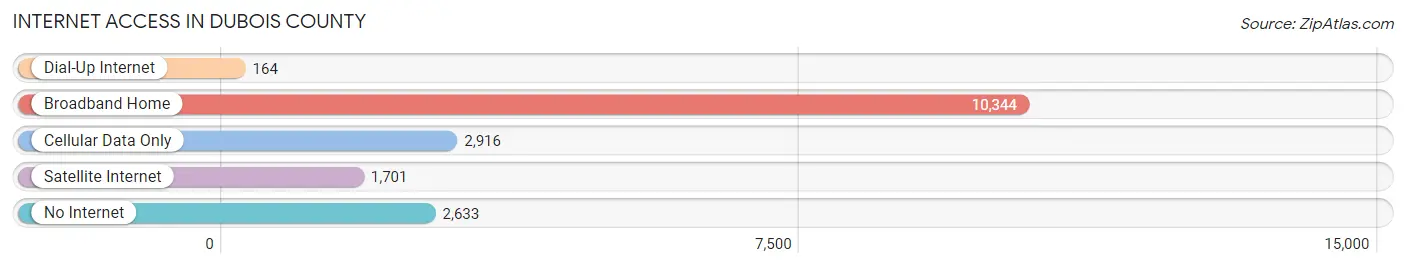
| Internet Type | # Households | % Households |
| Dial-Up Internet | 164 | 0.9% |
| Broadband Home | 10,344 | 59.3% |
| Cellular Data Only | 2,916 | 16.7% |
| Satellite Internet | 1,701 | 9.8% |
| No Internet | 2,633 | 15.1% |
| Total | 17,437 | 100.0% |
Dubois County Summary
DuBois County, Indiana is located in the southwestern corner of the state, and is part of the Jasper-Newton-Dubois Combined Statistical Area. The county was established in 1818 and named after Toussaint Dubois, a French-Canadian fur trader who had settled in the area in the late 1700s. The county seat is Jasper, and the county is home to a population of over 40,000 people.
Geography
DuBois County is located in the southwestern corner of Indiana, and is bordered by Gibson, Pike, Daviess, Martin, and Spencer counties. The county is situated in the rolling hills of the Midwest, and is part of the Wabash Valley region. The county is home to several rivers, including the Patoka, White, and Blue rivers, as well as numerous creeks and streams. The county is also home to several state parks, including Patoka Lake State Park, which is located in the northern part of the county.
The county has a total area of 441 square miles, of which 437 square miles is land and 4 square miles is water. The county is home to several small towns, including Jasper, Huntingburg, Ferdinand, and Holland. The county is also home to several unincorporated communities, including Birdseye, Celestine, Dubois, and Schnellville.
Economy
DuBois County has a diverse economy, with a variety of industries providing employment opportunities. The county is home to several manufacturing companies, including Jasper Engines and Transmissions, which is the largest employer in the county. Other major employers include Kimball International, MasterBrand Cabinets, and German American Bancorp. The county is also home to several agricultural operations, including dairy farms, hog farms, and grain farms.
The county is also home to several tourist attractions, including the Dubois County Museum, the Ferdinand State Forest, and the Patoka Lake State Park. The county is also home to several wineries, including the Patoka Lake Winery and the Ferdinand Winery.
Demographics
As of the 2010 census, DuBois County had a population of 40,858 people. The population was spread out, with 24.3% under the age of 18, 8.2% from 18 to 24, 28.2% from 25 to 44, 24.3% from 45 to 64, and 14.0% who were 65 years of age or older. The median age was 37.4 years.
The racial makeup of the county was 97.2% White, 0.7% African American, 0.2% Native American, 0.4% Asian, 0.1% Pacific Islander, 0.5% from other races, and 0.9% from two or more races. Hispanic or Latino of any race were 1.3% of the population.
The median income for a household in the county was $45,837, and the median income for a family was $54,837. The per capita income for the county was $22,837. About 8.2% of families and 11.2% of the population were below the poverty line, including 15.2% of those under age 18 and 8.2% of those age 65 or over.
Conclusion
DuBois County, Indiana is a rural county located in the southwestern corner of the state. The county is home to a population of over 40,000 people, and has a diverse economy with a variety of industries providing employment opportunities. The county is also home to several tourist attractions, including the Dubois County Museum, the Ferdinand State Forest, and the Patoka Lake State Park. The county has a median income of $45,837, and the population is 97.2% White, with 0.7% African American, 0.2% Native American, 0.4% Asian, and 0.1% Pacific Islander.
Common Questions
What is the Total Population of Dubois County?
Total Population of Dubois County is 43,584.
What is the Total Male Population of Dubois County?
Total Male Population of Dubois County is 21,908.
What is the Total Female Population of Dubois County?
Total Female Population of Dubois County is 21,676.
What is the Ratio of Males per 100 Females in Dubois County?
There are 101.07 Males per 100 Females in Dubois County.
What is the Ratio of Females per 100 Males in Dubois County?
There are 98.94 Females per 100 Males in Dubois County.
What is the Median Population Age in Dubois County?
Median Population Age in Dubois County is 40.0 Years.
What is the Average Family Size in Dubois County
Average Family Size in Dubois County is 3.0 People.
What is the Average Household Size in Dubois County
Average Household Size in Dubois County is 2.5 People.
What is Per Capita Income in Dubois County?
Per Capita income in Dubois County is $35,226.
What is the Median Family Income in Dubois County?
Median Family Income in Dubois County is $84,155.
What is the Median Household income in Dubois County?
Median Household Income in Dubois County is $68,945.
What is Income or Wage Gap in Dubois County?
Income or Wage Gap in Dubois County is 33.6%.
Women in Dubois County earn 66.4 cents for every dollar earned by a man.
What is Family Income Deficit in Dubois County?
Family Income Deficit in Dubois County is $11,135.
Families that are below poverty line in Dubois County earn $11,135 less on average than the poverty threshold level.
What is Inequality or Gini Index in Dubois County?
Inequality or Gini Index in Dubois County is 0.41.
How Large is the Labor Force in Dubois County?
There are 23,211 People in the Labor Forcein in Dubois County.
What is the Percentage of People in the Labor Force in Dubois County?
67.9% of People are in the Labor Force in Dubois County.
What is the Unemployment Rate in Dubois County?
Unemployment Rate in Dubois County is 1.9%.