Delaware County, IN
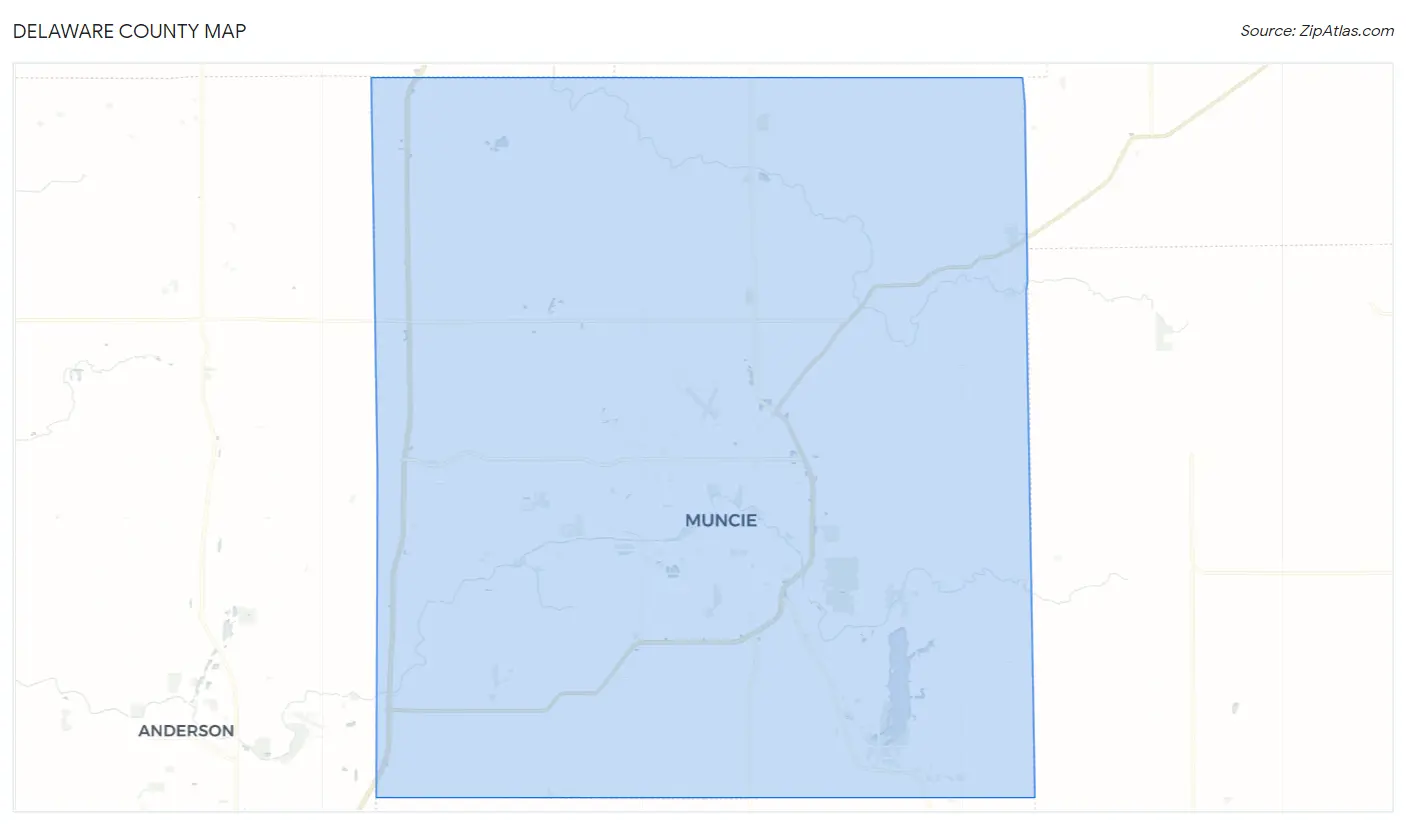
Delaware County Map
Delaware County Overview
112,156
TOTAL POPULATION
54,338
MALE POPULATION
57,818
FEMALE POPULATION
93.98
MALES / 100 FEMALES
106.40
FEMALES / 100 MALES
35.6
MEDIAN AGE
2.8
AVG FAMILY SIZE
2.3
AVG HOUSEHOLD SIZE
$28,874
PER CAPITA INCOME
$68,452
AVG FAMILY INCOME
$53,377
AVG HOUSEHOLD INCOME
33.6%
WAGE / INCOME GAP [ % ]
66.4¢/ $1
WAGE / INCOME GAP [ $ ]
$10,953
FAMILY INCOME DEFICIT
0.45
INEQUALITY / GINI INDEX
56,400
LABOR FORCE [ PEOPLE ]
59.8%
PERCENT IN LABOR FORCE
6.1%
UNEMPLOYMENT RATE
Delaware County Area Codes
Race in Delaware County
The most populous races in Delaware County are White / Caucasian (97,726 | 87.1%), Black / African American (6,999 | 6.2%), and Two or more Races (4,762 | 4.3%).
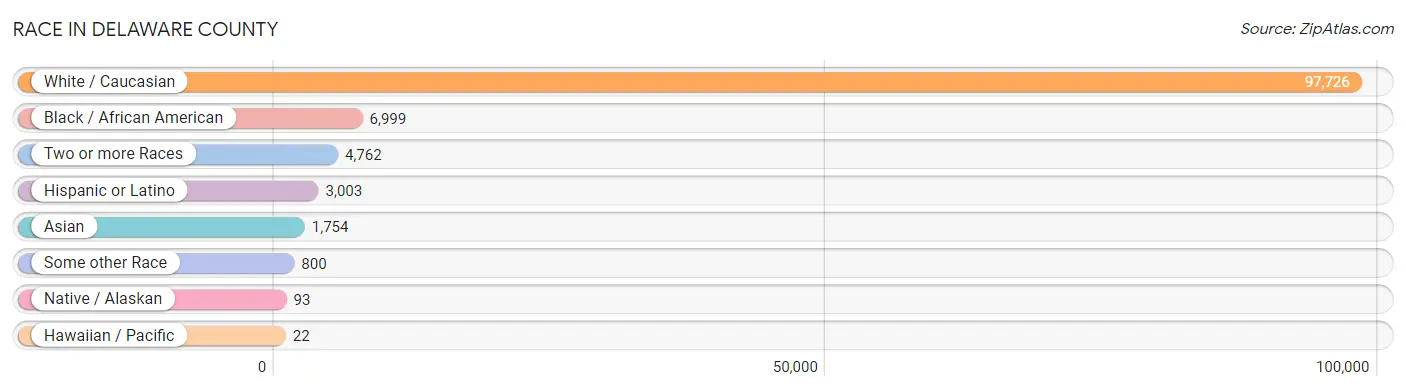
| Race | # Population | % Population |
| Asian | 1,754 | 1.6% |
| Black / African American | 6,999 | 6.2% |
| Hawaiian / Pacific | 22 | 0.0% |
| Hispanic or Latino | 3,003 | 2.7% |
| Native / Alaskan | 93 | 0.1% |
| White / Caucasian | 97,726 | 87.1% |
| Two or more Races | 4,762 | 4.3% |
| Some other Race | 800 | 0.7% |
| Total | 112,156 | 100.0% |
Ancestry in Delaware County
The most populous ancestries reported in Delaware County are German (20,350 | 18.1%), English (13,308 | 11.9%), Irish (12,487 | 11.1%), American (9,485 | 8.5%), and European (2,821 | 2.5%), together accounting for 52.1% of all Delaware County residents.
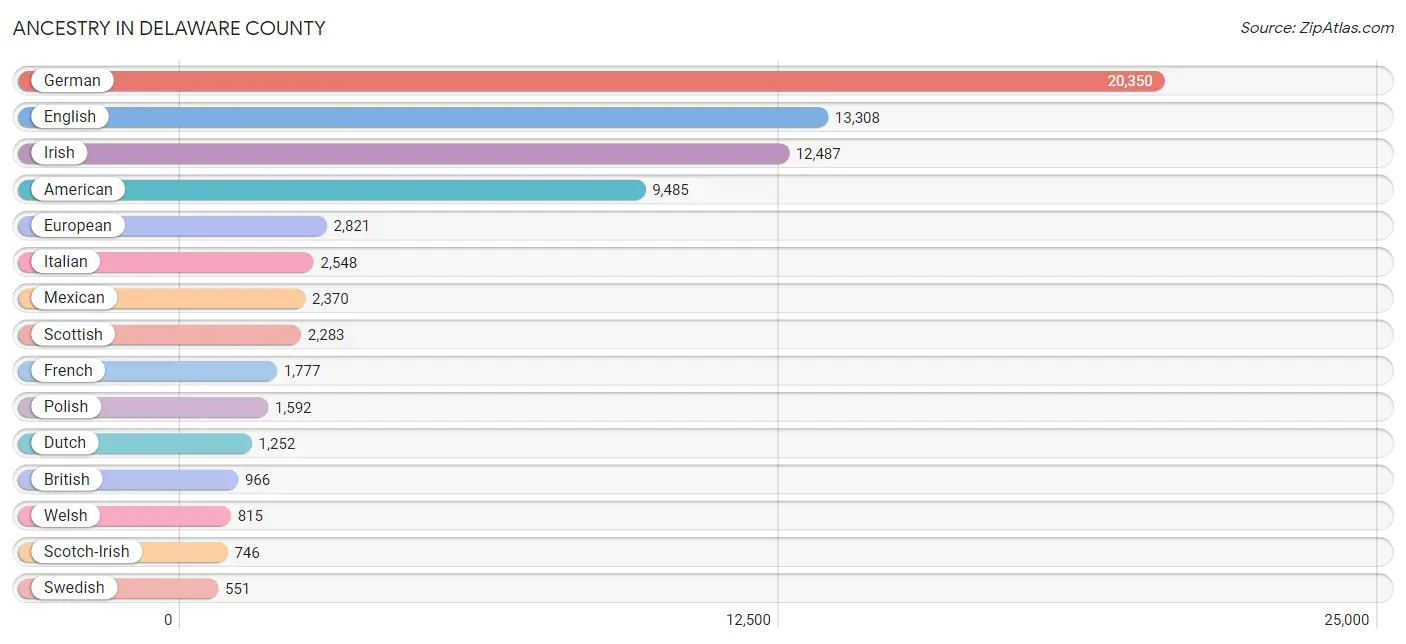
| Ancestry | # Population | % Population |
| African | 299 | 0.3% |
| Alsatian | 13 | 0.0% |
| American | 9,485 | 8.5% |
| Apache | 10 | 0.0% |
| Arab | 198 | 0.2% |
| Australian | 38 | 0.0% |
| Austrian | 223 | 0.2% |
| Bahamian | 31 | 0.0% |
| Bangladeshi | 26 | 0.0% |
| Barbadian | 16 | 0.0% |
| Belgian | 85 | 0.1% |
| Bhutanese | 129 | 0.1% |
| Blackfeet | 27 | 0.0% |
| Brazilian | 17 | 0.0% |
| British | 966 | 0.9% |
| Burmese | 126 | 0.1% |
| Cajun | 16 | 0.0% |
| Canadian | 49 | 0.0% |
| Celtic | 52 | 0.1% |
| Central American | 162 | 0.1% |
| Cherokee | 379 | 0.3% |
| Choctaw | 48 | 0.0% |
| Creek | 19 | 0.0% |
| Croatian | 7 | 0.0% |
| Cuban | 26 | 0.0% |
| Czech | 131 | 0.1% |
| Czechoslovakian | 63 | 0.1% |
| Danish | 118 | 0.1% |
| Delaware | 7 | 0.0% |
| Dutch | 1,252 | 1.1% |
| Eastern European | 202 | 0.2% |
| English | 13,308 | 11.9% |
| European | 2,821 | 2.5% |
| Filipino | 4 | 0.0% |
| Finnish | 23 | 0.0% |
| French | 1,777 | 1.6% |
| French American Indian | 4 | 0.0% |
| French Canadian | 73 | 0.1% |
| German | 20,350 | 18.1% |
| German Russian | 3 | 0.0% |
| Ghanaian | 88 | 0.1% |
| Greek | 364 | 0.3% |
| Guamanian / Chamorro | 21 | 0.0% |
| Guatemalan | 56 | 0.1% |
| Haitian | 11 | 0.0% |
| Honduran | 21 | 0.0% |
| Hungarian | 110 | 0.1% |
| Indian (Asian) | 530 | 0.5% |
| Iranian | 30 | 0.0% |
| Iraqi | 1 | 0.0% |
| Irish | 12,487 | 11.1% |
| Iroquois | 75 | 0.1% |
| Italian | 2,548 | 2.3% |
| Jamaican | 23 | 0.0% |
| Jordanian | 14 | 0.0% |
| Kenyan | 9 | 0.0% |
| Korean | 309 | 0.3% |
| Latvian | 9 | 0.0% |
| Lebanese | 10 | 0.0% |
| Lithuanian | 85 | 0.1% |
| Mexican | 2,370 | 2.1% |
| Mexican American Indian | 25 | 0.0% |
| Mongolian | 20 | 0.0% |
| Moroccan | 16 | 0.0% |
| Native Hawaiian | 74 | 0.1% |
| New Zealander | 17 | 0.0% |
| Nigerian | 41 | 0.0% |
| Northern European | 197 | 0.2% |
| Norwegian | 431 | 0.4% |
| Pakistani | 9 | 0.0% |
| Panamanian | 7 | 0.0% |
| Pennsylvania German | 34 | 0.0% |
| Peruvian | 38 | 0.0% |
| Polish | 1,592 | 1.4% |
| Portuguese | 142 | 0.1% |
| Potawatomi | 6 | 0.0% |
| Puerto Rican | 246 | 0.2% |
| Romanian | 135 | 0.1% |
| Russian | 266 | 0.2% |
| Salvadoran | 78 | 0.1% |
| Samoan | 53 | 0.1% |
| Scandinavian | 288 | 0.3% |
| Scotch-Irish | 746 | 0.7% |
| Scottish | 2,283 | 2.0% |
| Seminole | 35 | 0.0% |
| Senegalese | 22 | 0.0% |
| Serbian | 17 | 0.0% |
| Sioux | 6 | 0.0% |
| Slavic | 122 | 0.1% |
| Slovak | 62 | 0.1% |
| Slovene | 30 | 0.0% |
| South African | 17 | 0.0% |
| South American | 38 | 0.0% |
| Spanish | 61 | 0.1% |
| Spanish American | 39 | 0.0% |
| Sri Lankan | 418 | 0.4% |
| Subsaharan African | 504 | 0.4% |
| Swedish | 551 | 0.5% |
| Swiss | 262 | 0.2% |
| Syrian | 9 | 0.0% |
| Thai | 471 | 0.4% |
| Trinidadian and Tobagonian | 20 | 0.0% |
| Ukrainian | 62 | 0.1% |
| Vietnamese | 84 | 0.1% |
| Welsh | 815 | 0.7% |
| West Indian | 6 | 0.0% |
| Yugoslavian | 39 | 0.0% | View All 107 Rows |
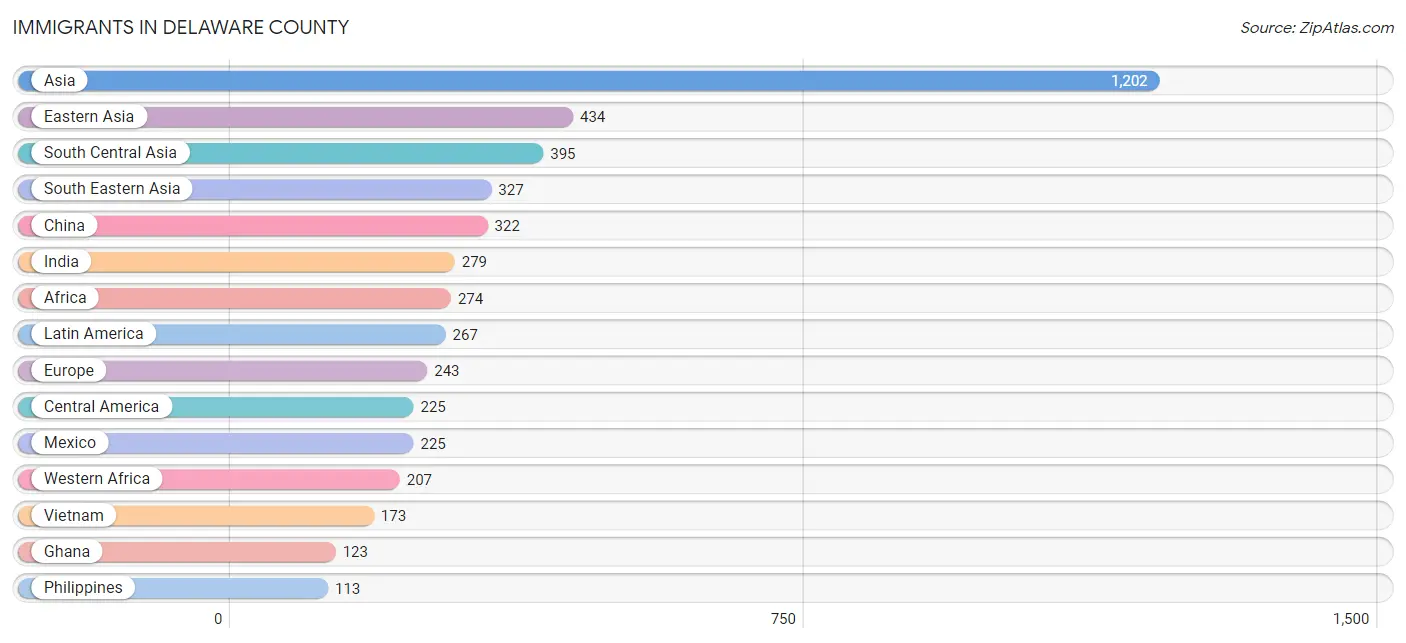
Immigrants in Delaware County
The most numerous immigrant groups reported in Delaware County came from Asia (1,202 | 1.1%), Eastern Asia (434 | 0.4%), South Central Asia (395 | 0.4%), South Eastern Asia (327 | 0.3%), and China (322 | 0.3%), together accounting for 2.4% of all Delaware County residents.
| Immigration Origin | # Population | % Population |
| Africa | 274 | 0.2% |
| Asia | 1,202 | 1.1% |
| Bangladesh | 71 | 0.1% |
| Bosnia and Herzegovina | 50 | 0.0% |
| Brazil | 17 | 0.0% |
| Canada | 22 | 0.0% |
| Caribbean | 25 | 0.0% |
| Central America | 225 | 0.2% |
| China | 322 | 0.3% |
| Eastern Asia | 434 | 0.4% |
| Eastern Europe | 109 | 0.1% |
| England | 7 | 0.0% |
| Europe | 243 | 0.2% |
| Germany | 74 | 0.1% |
| Ghana | 123 | 0.1% |
| Haiti | 10 | 0.0% |
| Hong Kong | 4 | 0.0% |
| Hungary | 12 | 0.0% |
| India | 279 | 0.3% |
| Iran | 30 | 0.0% |
| Japan | 6 | 0.0% |
| Kazakhstan | 8 | 0.0% |
| Korea | 106 | 0.1% |
| Latin America | 267 | 0.2% |
| Liberia | 14 | 0.0% |
| Lithuania | 9 | 0.0% |
| Malaysia | 14 | 0.0% |
| Mexico | 225 | 0.2% |
| Middle Africa | 47 | 0.0% |
| Morocco | 16 | 0.0% |
| Nepal | 3 | 0.0% |
| Netherlands | 20 | 0.0% |
| Nigeria | 56 | 0.1% |
| Northern Africa | 16 | 0.0% |
| Northern Europe | 40 | 0.0% |
| Oceania | 2 | 0.0% |
| Pakistan | 4 | 0.0% |
| Philippines | 113 | 0.1% |
| Poland | 1 | 0.0% |
| Russia | 17 | 0.0% |
| Saudi Arabia | 32 | 0.0% |
| Senegal | 14 | 0.0% |
| Serbia | 19 | 0.0% |
| Singapore | 12 | 0.0% |
| South Africa | 4 | 0.0% |
| South America | 17 | 0.0% |
| South Central Asia | 395 | 0.4% |
| South Eastern Asia | 327 | 0.3% |
| Taiwan | 4 | 0.0% |
| Thailand | 7 | 0.0% |
| Trinidad and Tobago | 15 | 0.0% |
| Ukraine | 1 | 0.0% |
| Vietnam | 173 | 0.2% |
| Western Africa | 207 | 0.2% |
| Western Asia | 46 | 0.0% |
| Western Europe | 94 | 0.1% |
| Yemen | 14 | 0.0% | View All 57 Rows |
Sex and Age in Delaware County
Sex and Age in Delaware County
The most populous age groups in Delaware County are 20 to 24 Years (7,269 | 13.4%) for men and 20 to 24 Years (8,065 | 14.0%) for women.
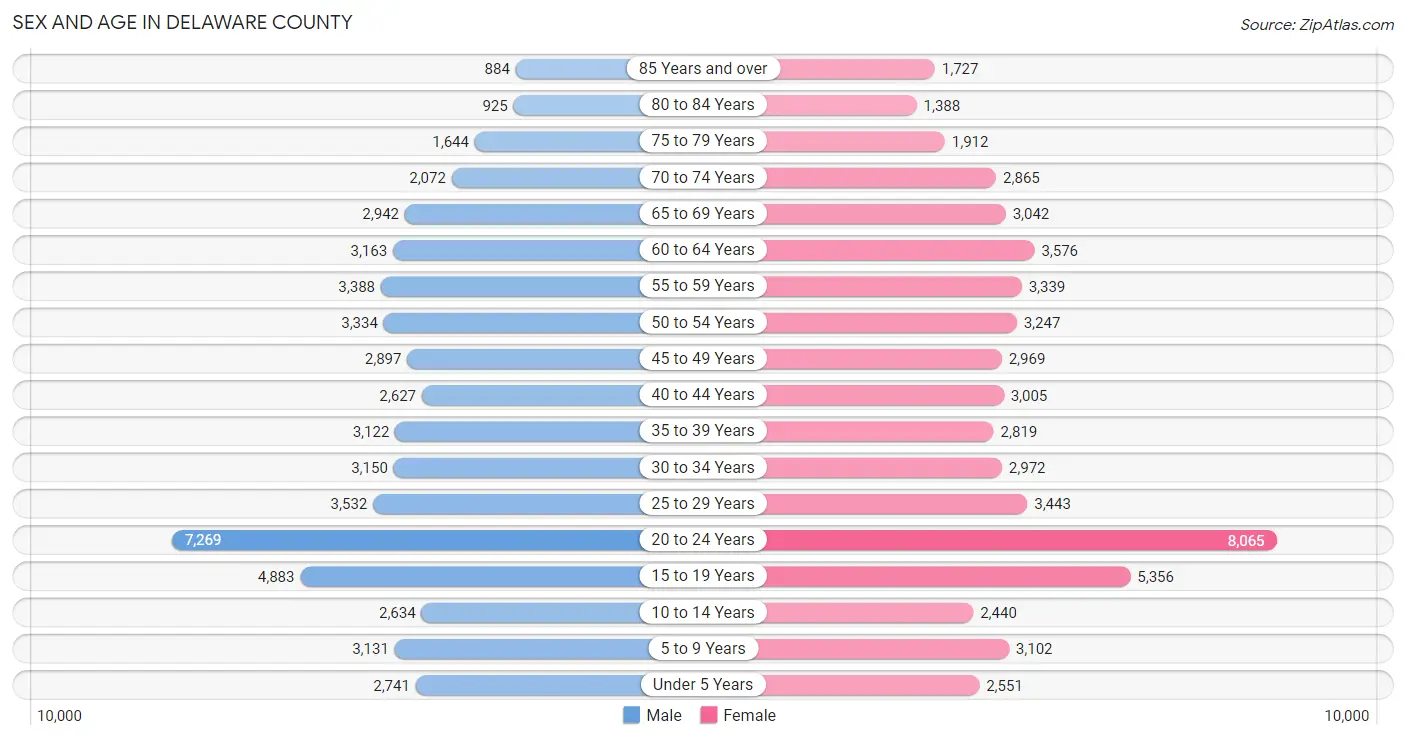
| Age Bracket | Male | Female |
| Under 5 Years | 2,741 (5.0%) | 2,551 (4.4%) |
| 5 to 9 Years | 3,131 (5.8%) | 3,102 (5.4%) |
| 10 to 14 Years | 2,634 (4.9%) | 2,440 (4.2%) |
| 15 to 19 Years | 4,883 (9.0%) | 5,356 (9.3%) |
| 20 to 24 Years | 7,269 (13.4%) | 8,065 (14.0%) |
| 25 to 29 Years | 3,532 (6.5%) | 3,443 (5.9%) |
| 30 to 34 Years | 3,150 (5.8%) | 2,972 (5.1%) |
| 35 to 39 Years | 3,122 (5.8%) | 2,819 (4.9%) |
| 40 to 44 Years | 2,627 (4.8%) | 3,005 (5.2%) |
| 45 to 49 Years | 2,897 (5.3%) | 2,969 (5.1%) |
| 50 to 54 Years | 3,334 (6.1%) | 3,247 (5.6%) |
| 55 to 59 Years | 3,388 (6.2%) | 3,339 (5.8%) |
| 60 to 64 Years | 3,163 (5.8%) | 3,576 (6.2%) |
| 65 to 69 Years | 2,942 (5.4%) | 3,042 (5.3%) |
| 70 to 74 Years | 2,072 (3.8%) | 2,865 (5.0%) |
| 75 to 79 Years | 1,644 (3.0%) | 1,912 (3.3%) |
| 80 to 84 Years | 925 (1.7%) | 1,388 (2.4%) |
| 85 Years and over | 884 (1.6%) | 1,727 (3.0%) |
| Total | 54,338 (100.0%) | 57,818 (100.0%) |
Families and Households in Delaware County
Median Family Size in Delaware County
The median family size in Delaware County is 2.76 persons per family, with married-couple families (18,603 | 68.1%) accounting for the largest median family size of 2.85 persons per family. On the other hand, single male/father families (2,760 | 10.1%) represent the smallest median family size with 2.45 persons per family.
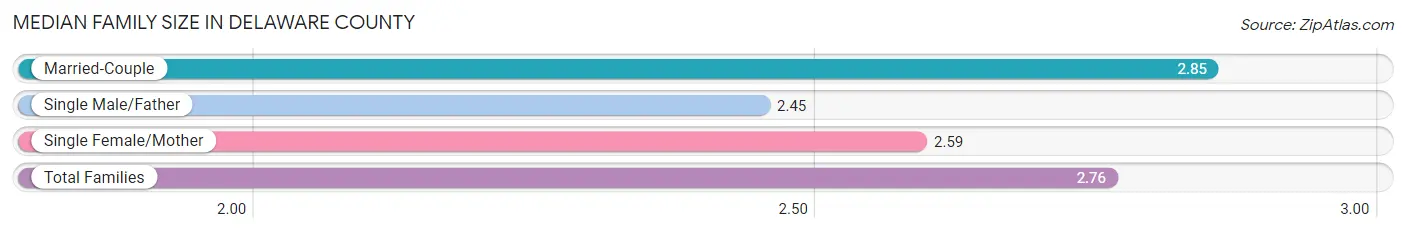
| Family Type | # Families | Family Size |
| Married-Couple | 18,603 (68.1%) | 2.85 |
| Single Male/Father | 2,760 (10.1%) | 2.45 |
| Single Female/Mother | 5,937 (21.7%) | 2.59 |
| Total Families | 27,300 (100.0%) | 2.76 |
Median Household Size in Delaware County
The median household size in Delaware County is 2.27 persons per household, with single male/father households (2,760 | 6.0%) accounting for the largest median household size of 3 persons per household. non-family households (18,859 | 40.9%) represent the smallest median household size with 1.37 persons per household.
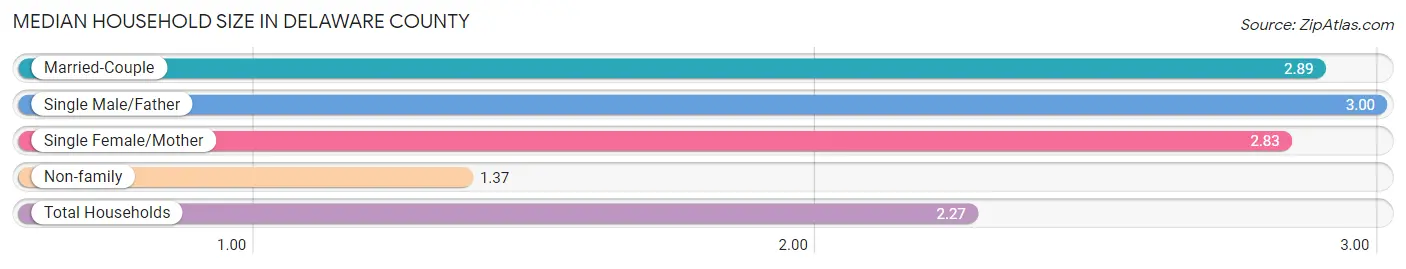
| Household Type | # Households | Household Size |
| Married-Couple | 18,603 (40.3%) | 2.89 |
| Single Male/Father | 2,760 (6.0%) | 3.00 |
| Single Female/Mother | 5,937 (12.9%) | 2.83 |
| Non-family | 18,859 (40.9%) | 1.37 |
| Total Households | 46,159 (100.0%) | 2.27 |
Household Size by Marriage Status in Delaware County
Out of a total of 46,159 households in Delaware County, 27,300 (59.1%) are family households, while 18,859 (40.9%) are nonfamily households. The most numerous type of family households are 2-person households, comprising 13,402, and the most common type of nonfamily households are 1-person households, comprising 14,116.
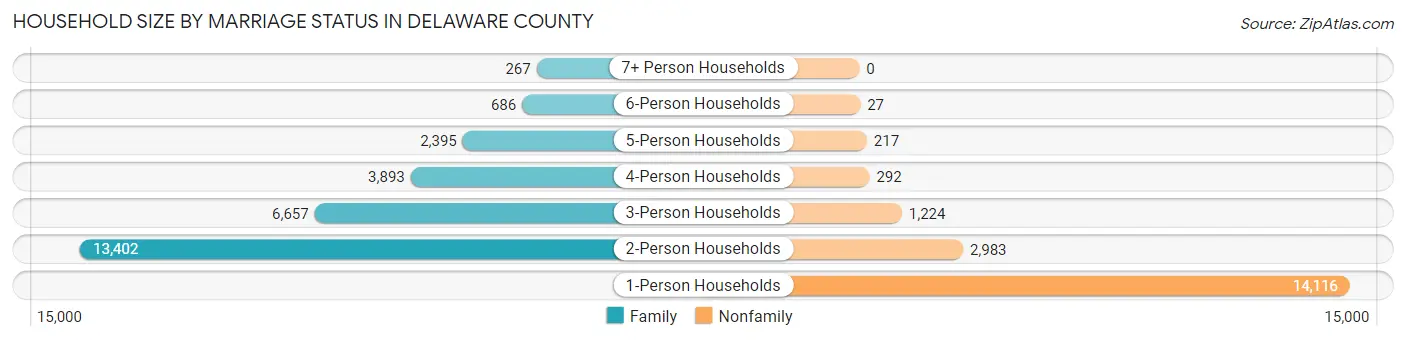
| Household Size | Family Households | Nonfamily Households |
| 1-Person Households | - | 14,116 (30.6%) |
| 2-Person Households | 13,402 (29.0%) | 2,983 (6.5%) |
| 3-Person Households | 6,657 (14.4%) | 1,224 (2.6%) |
| 4-Person Households | 3,893 (8.4%) | 292 (0.6%) |
| 5-Person Households | 2,395 (5.2%) | 217 (0.5%) |
| 6-Person Households | 686 (1.5%) | 27 (0.1%) |
| 7+ Person Households | 267 (0.6%) | 0 (0.0%) |
| Total | 27,300 (59.1%) | 18,859 (40.9%) |
Female Fertility in Delaware County
Fertility by Age in Delaware County
Average fertility rate in Delaware County is 50.0 births per 1,000 women. Women in the age bracket of 20 to 34 years have the highest fertility rate with 88.0 births per 1,000 women. Women in the age bracket of 20 to 34 years acount for 87.3% of all women with births.
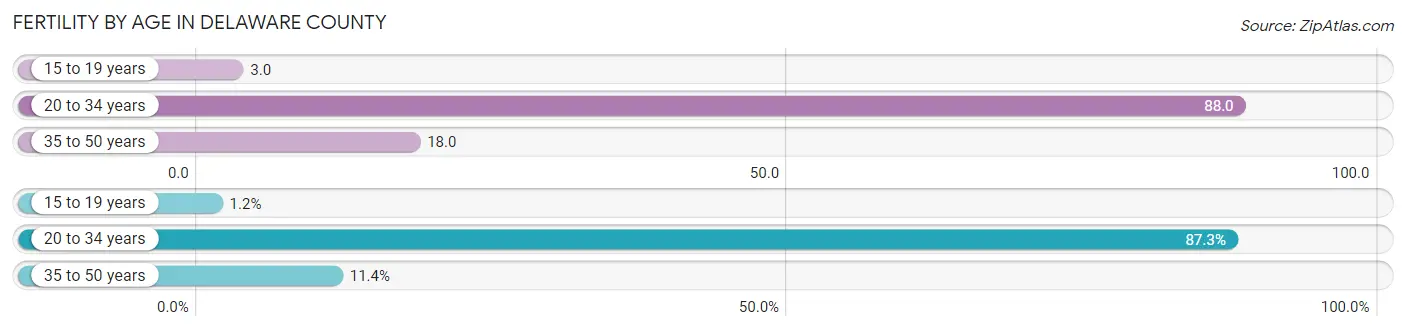
| Age Bracket | Women with Births | Births / 1,000 Women |
| 15 to 19 years | 18 (1.2%) | 3.0 |
| 20 to 34 years | 1,268 (87.3%) | 88.0 |
| 35 to 50 years | 166 (11.4%) | 18.0 |
| Total | 1,452 (100.0%) | 50.0 |
Fertility by Age by Marriage Status in Delaware County
47.2% of women with births (1,452) in Delaware County are married. The highest percentage of unmarried women with births falls into 15 to 19 years age bracket with 100.0% of them unmarried at the time of birth, while the lowest percentage of unmarried women with births belong to 20 to 34 years age bracket with 50.3% of them unmarried.
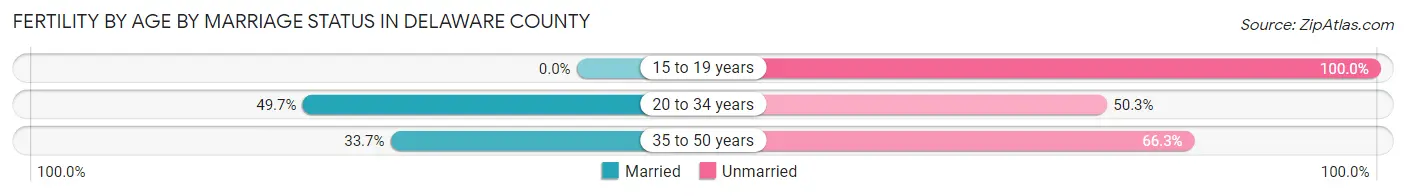
| Age Bracket | Married | Unmarried |
| 15 to 19 years | 0 (0.0%) | 18 (100.0%) |
| 20 to 34 years | 630 (49.7%) | 638 (50.3%) |
| 35 to 50 years | 56 (33.7%) | 110 (66.3%) |
| Total | 685 (47.2%) | 767 (52.8%) |
Fertility by Education in Delaware County
Average fertility rate in Delaware County is 50.0 births per 1,000 women. Women with the education attainment of bachelor's degree have the highest fertility rate of 66.0 births per 1,000 women, while women with the education attainment of less than high school have the lowest fertility at 17.0 births per 1,000 women. Women with the education attainment of college or associate's degree represent 48.9% of all women with births.
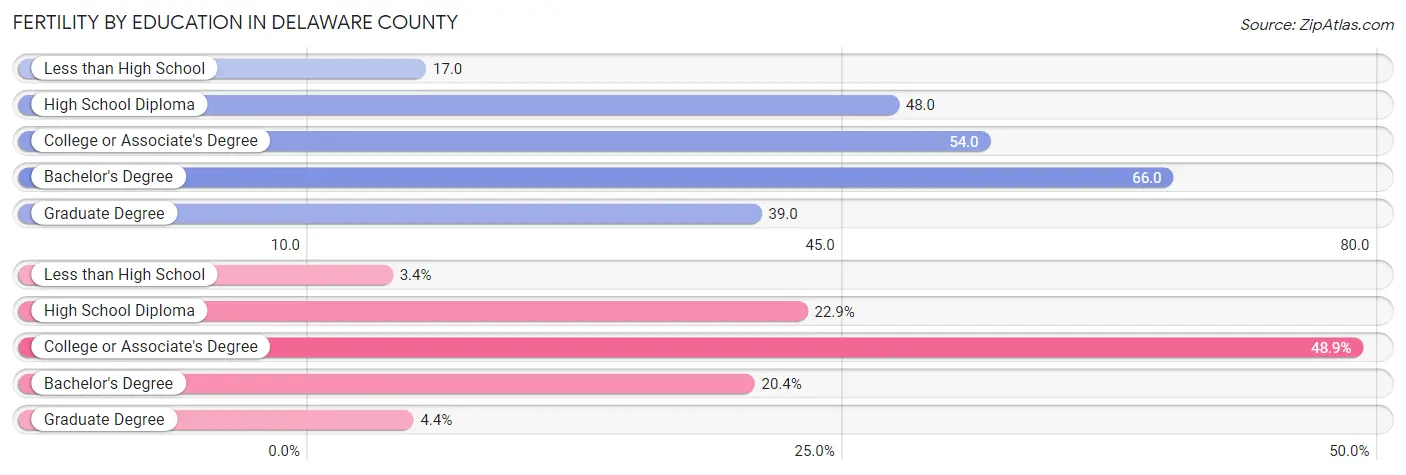
| Educational Attainment | Women with Births | Births / 1,000 Women |
| Less than High School | 50 (3.4%) | 17.0 |
| High School Diploma | 332 (22.9%) | 48.0 |
| College or Associate's Degree | 710 (48.9%) | 54.0 |
| Bachelor's Degree | 296 (20.4%) | 66.0 |
| Graduate Degree | 64 (4.4%) | 39.0 |
| Total | 1,452 (100.0%) | 50.0 |
Fertility by Education by Marriage Status in Delaware County
52.8% of women with births in Delaware County are unmarried. Women with the educational attainment of bachelor's degree are most likely to be married with 76.3% of them married at childbirth, while women with the educational attainment of less than high school are least likely to be married with 92.0% of them unmarried at childbirth.
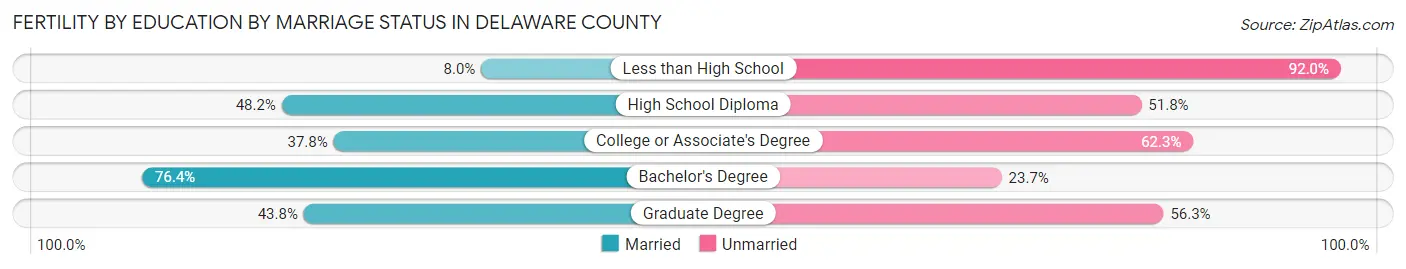
| Educational Attainment | Married | Unmarried |
| Less than High School | 4 (8.0%) | 46 (92.0%) |
| High School Diploma | 160 (48.2%) | 172 (51.8%) |
| College or Associate's Degree | 268 (37.8%) | 442 (62.3%) |
| Bachelor's Degree | 226 (76.3%) | 70 (23.6%) |
| Graduate Degree | 28 (43.8%) | 36 (56.2%) |
| Total | 685 (47.2%) | 767 (52.8%) |
Income in Delaware County
Income Overview in Delaware County
Per Capita Income in Delaware County is $28,874, while median incomes of families and households are $68,452 and $53,377 respectively.
| Characteristic | Number | Measure |
| Per Capita Income | 112,156 | $28,874 |
| Median Family Income | 27,300 | $68,452 |
| Mean Family Income | 27,300 | $83,668 |
| Median Household Income | 46,159 | $53,377 |
| Mean Household Income | 46,159 | $68,286 |
| Income Deficit | 27,300 | $10,953 |
| Wage / Income Gap (%) | 112,156 | 33.65% |
| Wage / Income Gap ($) | 112,156 | 66.35¢ per $1 |
| Gini / Inequality Index | 112,156 | 0.45 |
Earnings by Sex in Delaware County
Average Earnings in Delaware County are $28,511, $34,683 for men and $23,013 for women, a difference of 33.7%.
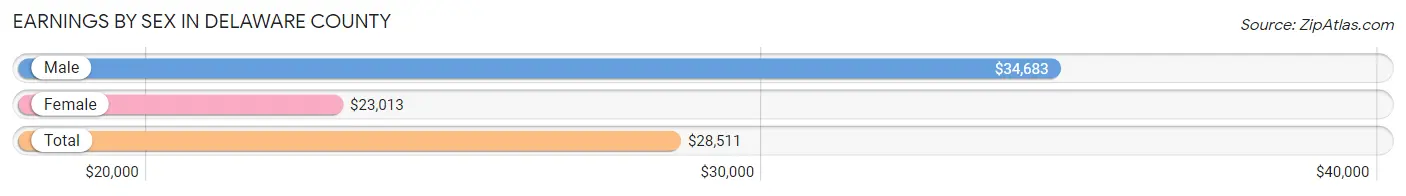
| Sex | Number | Average Earnings |
| Male | 31,811 (50.7%) | $34,683 |
| Female | 30,904 (49.3%) | $23,013 |
| Total | 62,715 (100.0%) | $28,511 |
Earnings by Sex by Income Bracket in Delaware County
The most common earnings brackets in Delaware County are $75,000 to $99,999 for men (2,625 | 8.3%) and $2,499 or less for women (2,800 | 9.1%).
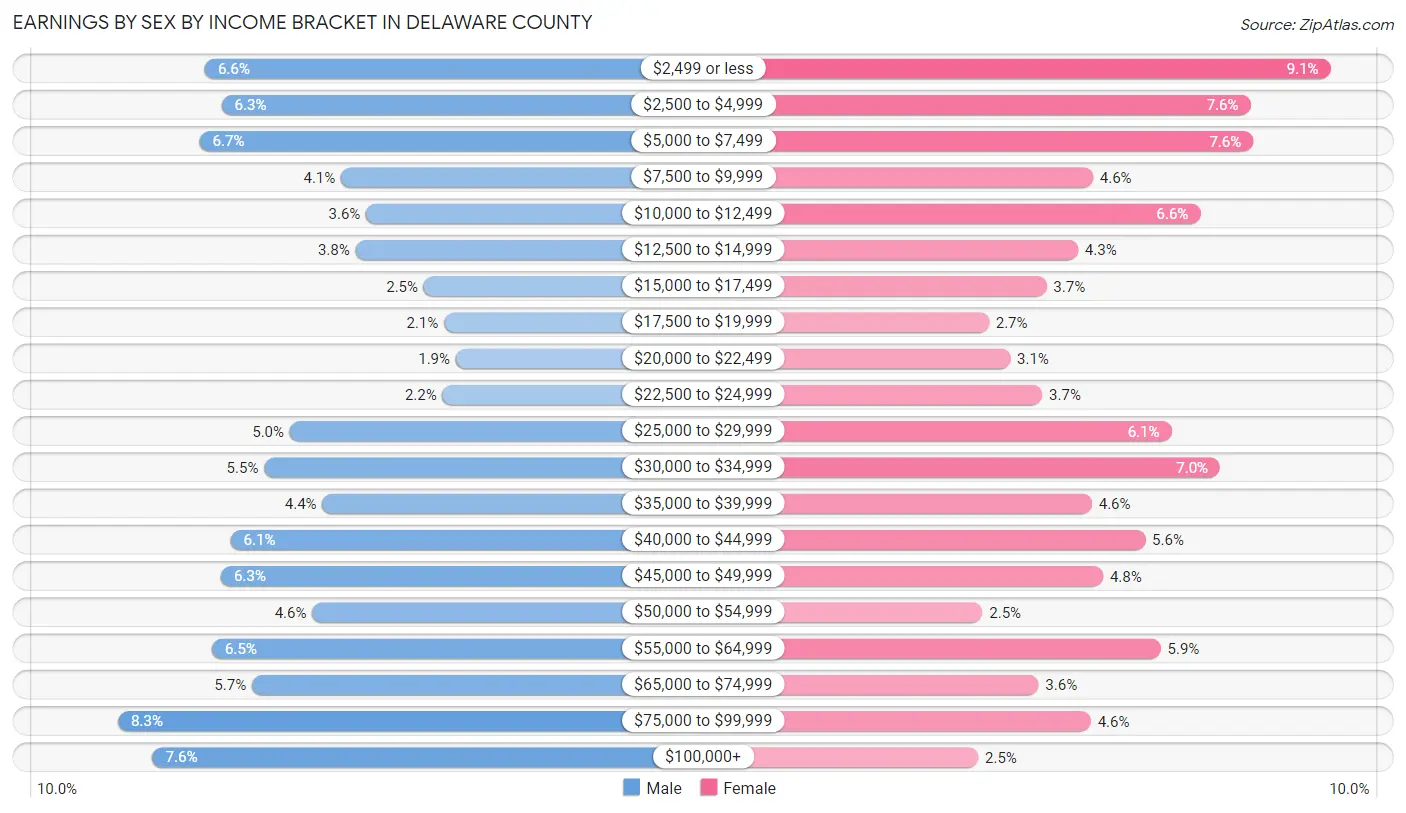
| Income | Male | Female |
| $2,499 or less | 2,105 (6.6%) | 2,800 (9.1%) |
| $2,500 to $4,999 | 2,006 (6.3%) | 2,336 (7.6%) |
| $5,000 to $7,499 | 2,139 (6.7%) | 2,352 (7.6%) |
| $7,500 to $9,999 | 1,296 (4.1%) | 1,425 (4.6%) |
| $10,000 to $12,499 | 1,145 (3.6%) | 2,047 (6.6%) |
| $12,500 to $14,999 | 1,210 (3.8%) | 1,337 (4.3%) |
| $15,000 to $17,499 | 802 (2.5%) | 1,156 (3.7%) |
| $17,500 to $19,999 | 681 (2.1%) | 821 (2.7%) |
| $20,000 to $22,499 | 612 (1.9%) | 946 (3.1%) |
| $22,500 to $24,999 | 691 (2.2%) | 1,131 (3.7%) |
| $25,000 to $29,999 | 1,601 (5.0%) | 1,879 (6.1%) |
| $30,000 to $34,999 | 1,754 (5.5%) | 2,160 (7.0%) |
| $35,000 to $39,999 | 1,407 (4.4%) | 1,420 (4.6%) |
| $40,000 to $44,999 | 1,952 (6.1%) | 1,728 (5.6%) |
| $45,000 to $49,999 | 2,012 (6.3%) | 1,482 (4.8%) |
| $50,000 to $54,999 | 1,466 (4.6%) | 785 (2.5%) |
| $55,000 to $64,999 | 2,064 (6.5%) | 1,818 (5.9%) |
| $65,000 to $74,999 | 1,825 (5.7%) | 1,109 (3.6%) |
| $75,000 to $99,999 | 2,625 (8.3%) | 1,413 (4.6%) |
| $100,000+ | 2,418 (7.6%) | 759 (2.5%) |
| Total | 31,811 (100.0%) | 30,904 (100.0%) |
Earnings by Sex by Educational Attainment in Delaware County
Average earnings in Delaware County are $46,218 for men and $34,585 for women, a difference of 25.2%. Men with an educational attainment of graduate degree enjoy the highest average annual earnings of $80,291, while those with less than high school education earn the least with $31,685. Women with an educational attainment of graduate degree earn the most with the average annual earnings of $60,296, while those with less than high school education have the smallest earnings of $16,585.
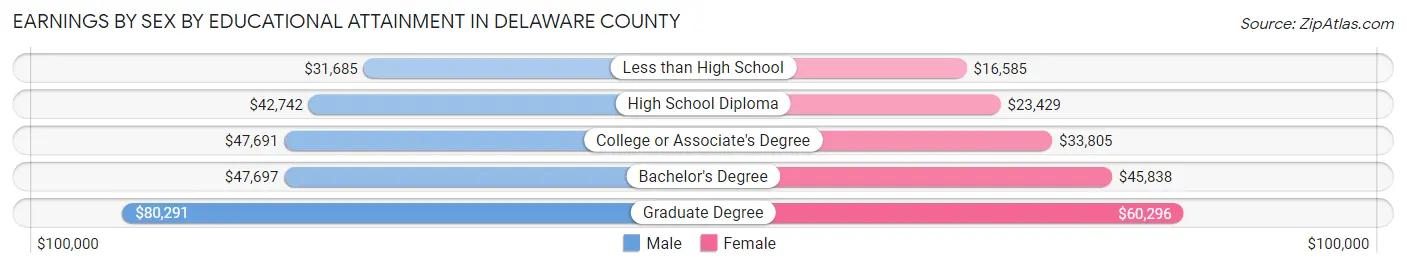
| Educational Attainment | Male Income | Female Income |
| Less than High School | $31,685 | $16,585 |
| High School Diploma | $42,742 | $23,429 |
| College or Associate's Degree | $47,691 | $33,805 |
| Bachelor's Degree | $47,697 | $45,838 |
| Graduate Degree | $80,291 | $60,296 |
| Total | $46,218 | $34,585 |
Family Income in Delaware County
Family Income Brackets in Delaware County
According to the Delaware County family income data, there are 5,842 families falling into the $50,000 to $74,999 income range, which is the most common income bracket and makes up 21.4% of all families. Conversely, the $10,000 to $14,999 income bracket is the least frequent group with only 655 families (2.4%) belonging to this category.
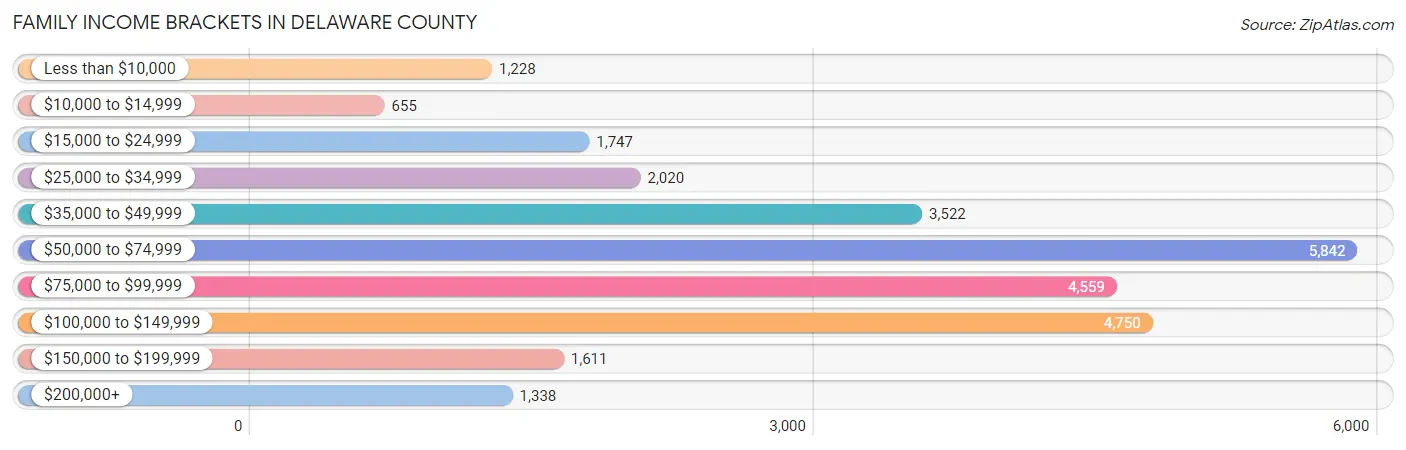
| Income Bracket | # Families | % Families |
| Less than $10,000 | 1,228 | 4.5% |
| $10,000 to $14,999 | 655 | 2.4% |
| $15,000 to $24,999 | 1,747 | 6.4% |
| $25,000 to $34,999 | 2,020 | 7.4% |
| $35,000 to $49,999 | 3,522 | 12.9% |
| $50,000 to $74,999 | 5,842 | 21.4% |
| $75,000 to $99,999 | 4,559 | 16.7% |
| $100,000 to $149,999 | 4,750 | 17.4% |
| $150,000 to $199,999 | 1,611 | 5.9% |
| $200,000+ | 1,338 | 4.9% |
Family Income by Famaliy Size in Delaware County
6-person families (599 | 2.2%) account for the highest median family income in Delaware County with $89,712 per family, while 2-person families (14,679 | 53.8%) have the highest median income of $32,256 per family member.
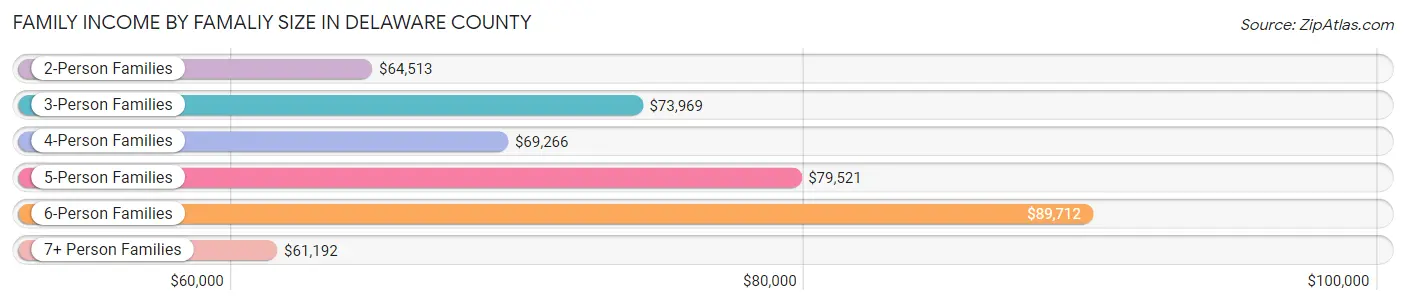
| Income Bracket | # Families | Median Income |
| 2-Person Families | 14,679 (53.8%) | $64,513 |
| 3-Person Families | 6,656 (24.4%) | $73,969 |
| 4-Person Families | 3,338 (12.2%) | $69,266 |
| 5-Person Families | 1,823 (6.7%) | $79,521 |
| 6-Person Families | 599 (2.2%) | $89,712 |
| 7+ Person Families | 205 (0.7%) | $61,192 |
| Total | 27,300 (100.0%) | $68,452 |
Family Income by Number of Earners in Delaware County
The median family income in Delaware County is $68,452, with families comprising 3+ earners (2,042) having the highest median family income of $119,444, while families with no earners (4,842) have the lowest median family income of $44,975, accounting for 7.5% and 17.7% of families, respectively.
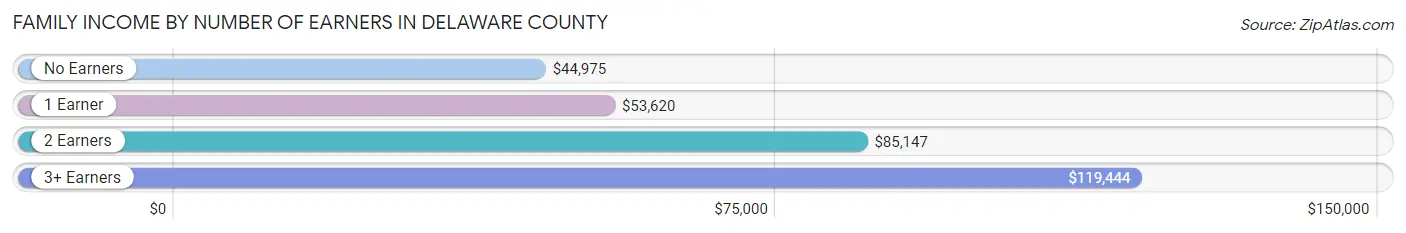
| Number of Earners | # Families | Median Income |
| No Earners | 4,842 (17.7%) | $44,975 |
| 1 Earner | 9,596 (35.1%) | $53,620 |
| 2 Earners | 10,820 (39.6%) | $85,147 |
| 3+ Earners | 2,042 (7.5%) | $119,444 |
| Total | 27,300 (100.0%) | $68,452 |
Household Income in Delaware County
Household Income Brackets in Delaware County
With 8,724 households falling in the category, the $50,000 to $74,999 income range is the most frequent in Delaware County, accounting for 18.9% of all households. In contrast, only 1,569 households (3.4%) fall into the $200,000+ income bracket, making it the least populous group.
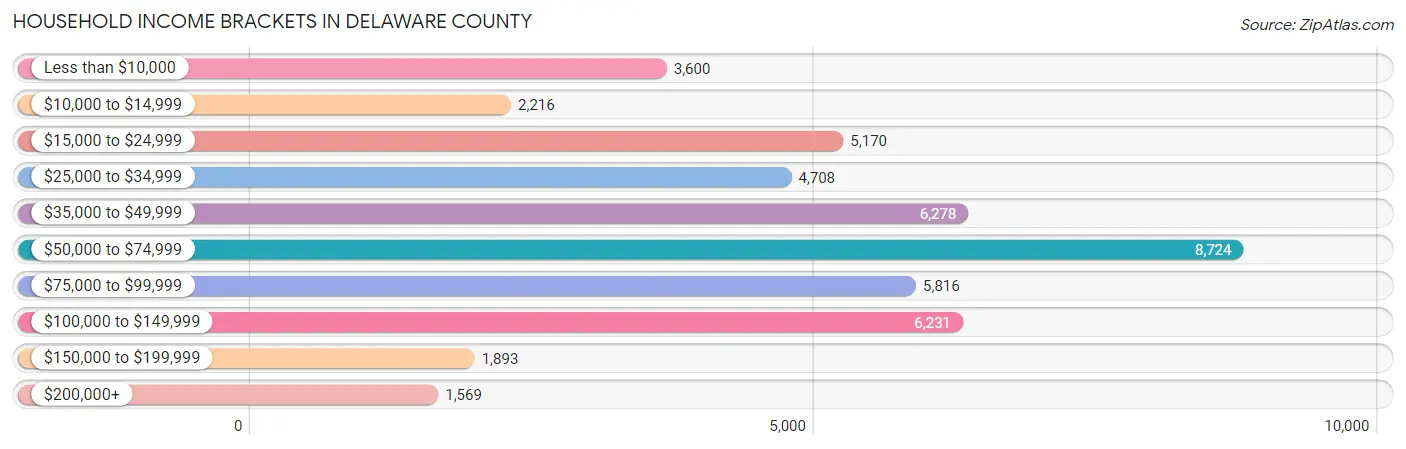
| Income Bracket | # Households | % Households |
| Less than $10,000 | 3,600 | 7.8% |
| $10,000 to $14,999 | 2,216 | 4.8% |
| $15,000 to $24,999 | 5,170 | 11.2% |
| $25,000 to $34,999 | 4,708 | 10.2% |
| $35,000 to $49,999 | 6,278 | 13.6% |
| $50,000 to $74,999 | 8,724 | 18.9% |
| $75,000 to $99,999 | 5,816 | 12.6% |
| $100,000 to $149,999 | 6,231 | 13.5% |
| $150,000 to $199,999 | 1,893 | 4.1% |
| $200,000+ | 1,569 | 3.4% |
Household Income by Householder Age in Delaware County
The median household income in Delaware County is $53,377, with the highest median household income of $67,049 found in the 45 to 64 years age bracket for the primary householder. A total of 15,473 households (33.5%) fall into this category. Meanwhile, the 15 to 24 years age bracket for the primary householder has the lowest median household income of $24,302, with 5,180 households (11.2%) in this group.
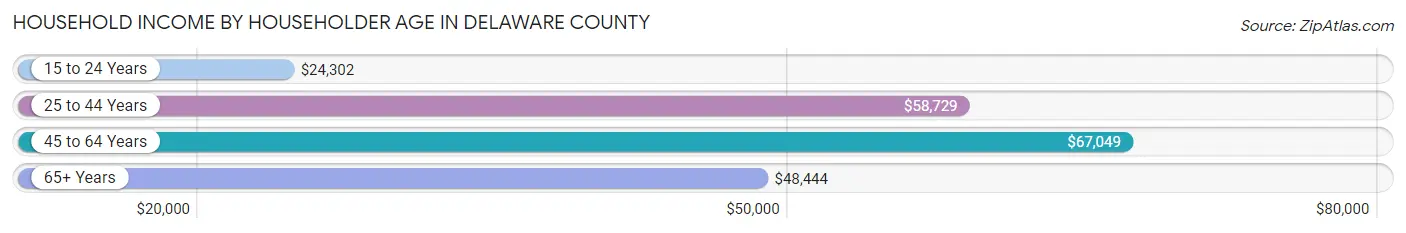
| Income Bracket | # Households | Median Income |
| 15 to 24 Years | 5,180 (11.2%) | $24,302 |
| 25 to 44 Years | 13,083 (28.3%) | $58,729 |
| 45 to 64 Years | 15,473 (33.5%) | $67,049 |
| 65+ Years | 12,423 (26.9%) | $48,444 |
| Total | 46,159 (100.0%) | $53,377 |
Poverty in Delaware County
Income Below Poverty by Sex and Age in Delaware County
With 19.1% poverty level for males and 22.1% for females among the residents of Delaware County, 18 to 24 year old males and 18 to 24 year old females are the most vulnerable to poverty, with 3,818 males (47.8%) and 4,410 females (51.7%) in their respective age groups living below the poverty level.
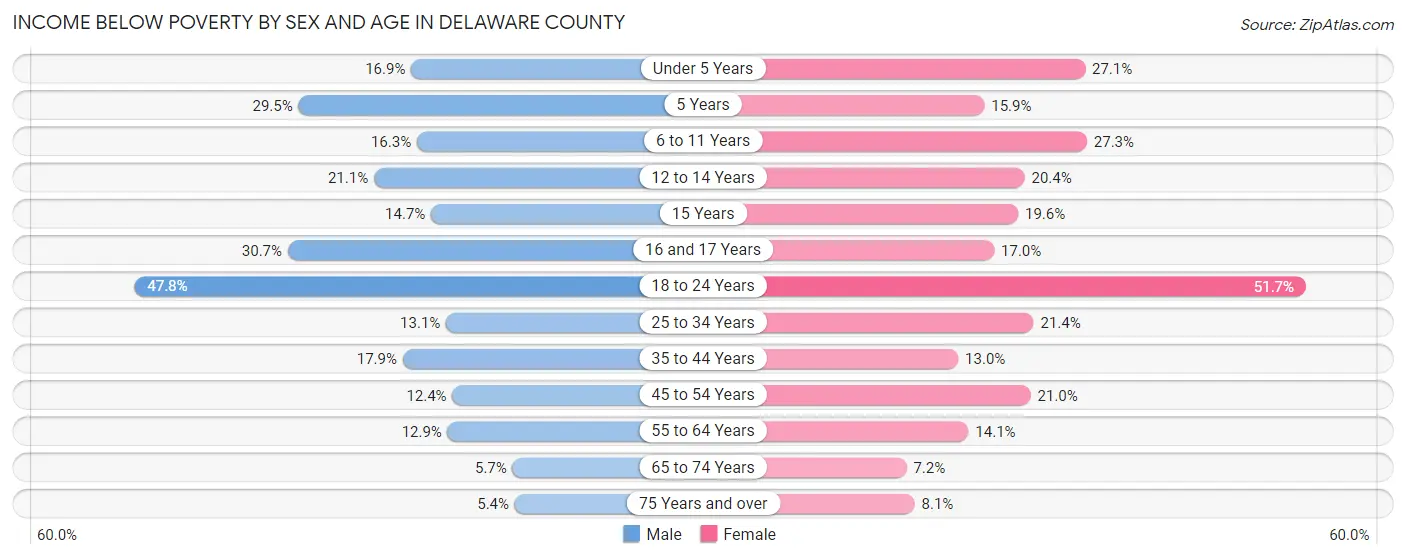
| Age Bracket | Male | Female |
| Under 5 Years | 446 (16.9%) | 680 (27.1%) |
| 5 Years | 238 (29.5%) | 99 (15.9%) |
| 6 to 11 Years | 536 (16.3%) | 928 (27.3%) |
| 12 to 14 Years | 325 (21.1%) | 283 (20.3%) |
| 15 Years | 101 (14.7%) | 106 (19.6%) |
| 16 and 17 Years | 358 (30.7%) | 200 (17.0%) |
| 18 to 24 Years | 3,818 (47.8%) | 4,410 (51.7%) |
| 25 to 34 Years | 865 (13.1%) | 1,357 (21.4%) |
| 35 to 44 Years | 1,016 (17.9%) | 755 (13.0%) |
| 45 to 54 Years | 761 (12.3%) | 1,299 (21.0%) |
| 55 to 64 Years | 830 (12.9%) | 961 (14.1%) |
| 65 to 74 Years | 273 (5.7%) | 411 (7.2%) |
| 75 Years and over | 175 (5.4%) | 369 (8.1%) |
| Total | 9,742 (19.1%) | 11,858 (22.1%) |
Income Above Poverty by Sex and Age in Delaware County
According to the poverty statistics in Delaware County, males aged 75 years and over and females aged 65 to 74 years are the age groups that are most secure financially, with 94.6% of males and 92.8% of females in these age groups living above the poverty line.
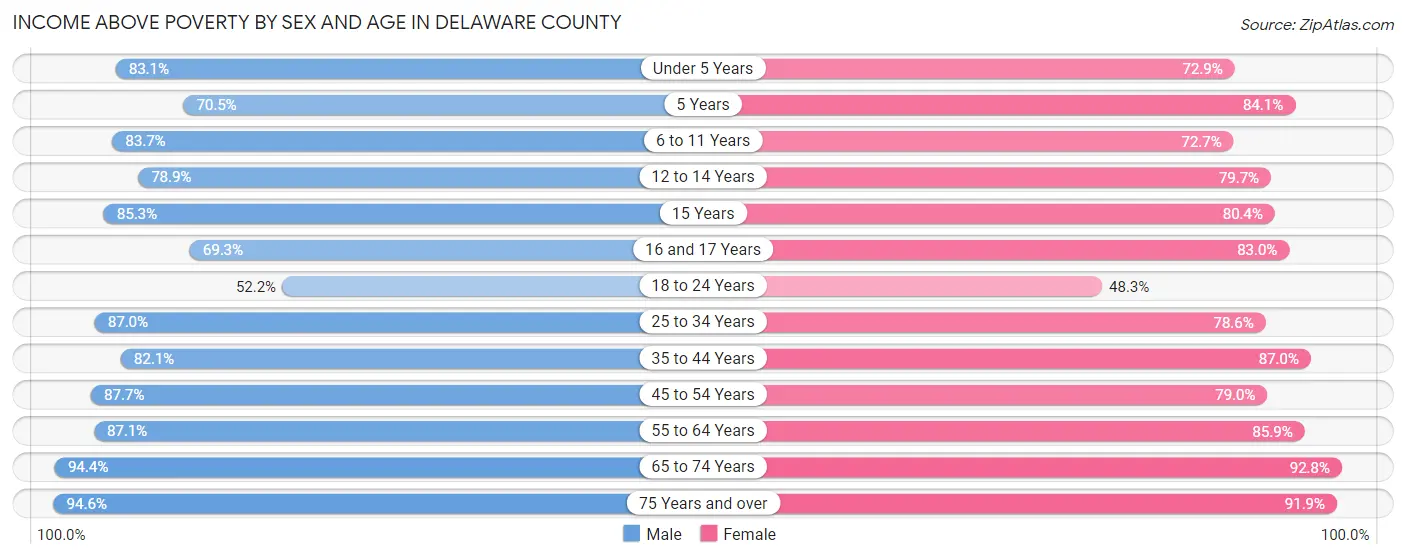
| Age Bracket | Male | Female |
| Under 5 Years | 2,187 (83.1%) | 1,830 (72.9%) |
| 5 Years | 569 (70.5%) | 525 (84.1%) |
| 6 to 11 Years | 2,753 (83.7%) | 2,472 (72.7%) |
| 12 to 14 Years | 1,216 (78.9%) | 1,108 (79.6%) |
| 15 Years | 585 (85.3%) | 434 (80.4%) |
| 16 and 17 Years | 809 (69.3%) | 979 (83.0%) |
| 18 to 24 Years | 4,175 (52.2%) | 4,123 (48.3%) |
| 25 to 34 Years | 5,765 (87.0%) | 4,996 (78.6%) |
| 35 to 44 Years | 4,666 (82.1%) | 5,069 (87.0%) |
| 45 to 54 Years | 5,402 (87.6%) | 4,881 (79.0%) |
| 55 to 64 Years | 5,613 (87.1%) | 5,856 (85.9%) |
| 65 to 74 Years | 4,561 (94.4%) | 5,301 (92.8%) |
| 75 Years and over | 3,064 (94.6%) | 4,182 (91.9%) |
| Total | 41,365 (80.9%) | 41,756 (77.9%) |
Income Below Poverty Among Married-Couple Families in Delaware County
The poverty statistics for married-couple families in Delaware County show that 5.0% or 938 of the total 18,603 families live below the poverty line. Families with 3 or 4 children have the highest poverty rate of 13.2%, comprising of 219 families. On the other hand, families with no children have the lowest poverty rate of 3.6%, which includes 426 families.
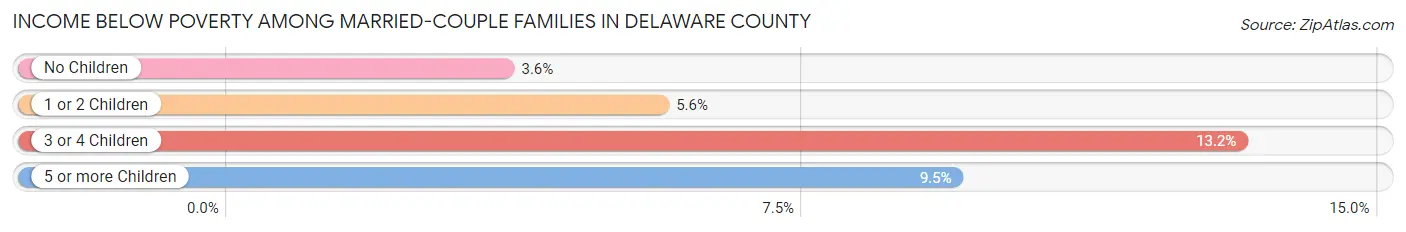
| Children | Above Poverty | Below Poverty |
| No Children | 11,374 (96.4%) | 426 (3.6%) |
| 1 or 2 Children | 4,764 (94.4%) | 284 (5.6%) |
| 3 or 4 Children | 1,441 (86.8%) | 219 (13.2%) |
| 5 or more Children | 86 (90.5%) | 9 (9.5%) |
| Total | 17,665 (95.0%) | 938 (5.0%) |
Income Below Poverty Among Single-Parent Households in Delaware County
According to the poverty data in Delaware County, 17.6% or 486 single-father households and 29.9% or 1,777 single-mother households are living below the poverty line. Among single-father households, those with 3 or 4 children have the highest poverty rate, with 149 households (41.6%) experiencing poverty. Likewise, among single-mother households, those with 5 or more children have the highest poverty rate, with 18 households (100.0%) falling below the poverty line.
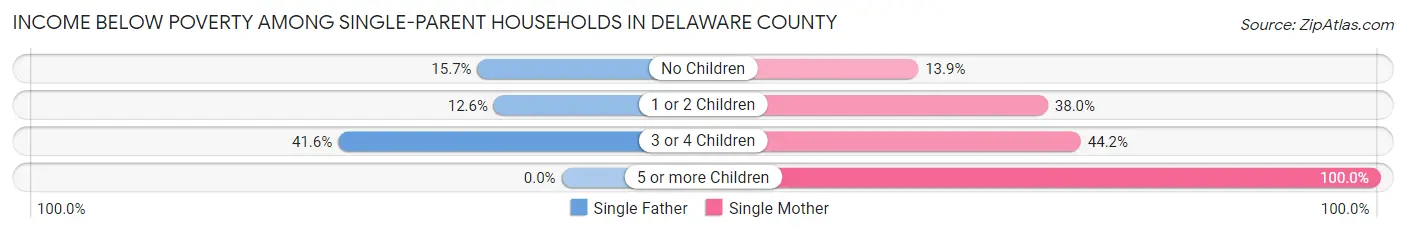
| Children | Single Father | Single Mother |
| No Children | 190 (15.7%) | 308 (13.9%) |
| 1 or 2 Children | 147 (12.6%) | 1,140 (38.0%) |
| 3 or 4 Children | 149 (41.6%) | 311 (44.2%) |
| 5 or more Children | 0 (0.0%) | 18 (100.0%) |
| Total | 486 (17.6%) | 1,777 (29.9%) |
Income Below Poverty Among Married-Couple vs Single-Parent Households in Delaware County
The poverty data for Delaware County shows that 938 of the married-couple family households (5.0%) and 2,263 of the single-parent households (26.0%) are living below the poverty level. Within the married-couple family households, those with 3 or 4 children have the highest poverty rate, with 219 households (13.2%) falling below the poverty line. Among the single-parent households, those with 5 or more children have the highest poverty rate, with 18 household (45.0%) living below poverty.
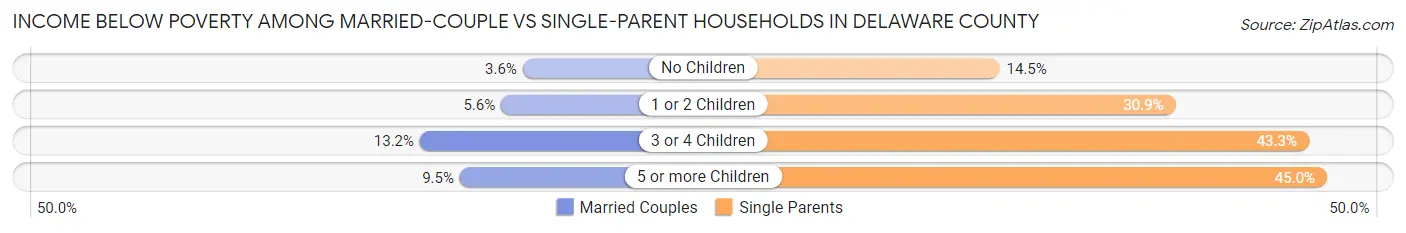
| Children | Married-Couple Families | Single-Parent Households |
| No Children | 426 (3.6%) | 498 (14.5%) |
| 1 or 2 Children | 284 (5.6%) | 1,287 (30.9%) |
| 3 or 4 Children | 219 (13.2%) | 460 (43.3%) |
| 5 or more Children | 9 (9.5%) | 18 (45.0%) |
| Total | 938 (5.0%) | 2,263 (26.0%) |
Employment Characteristics in Delaware County
Employment by Class of Employer in Delaware County
Among the 51,601 employed individuals in Delaware County, private company employees (35,071 | 68.0%), not-for-profit organizations (6,218 | 12.0%), and state government employees (3,419 | 6.6%) make up the most common classes of employment.
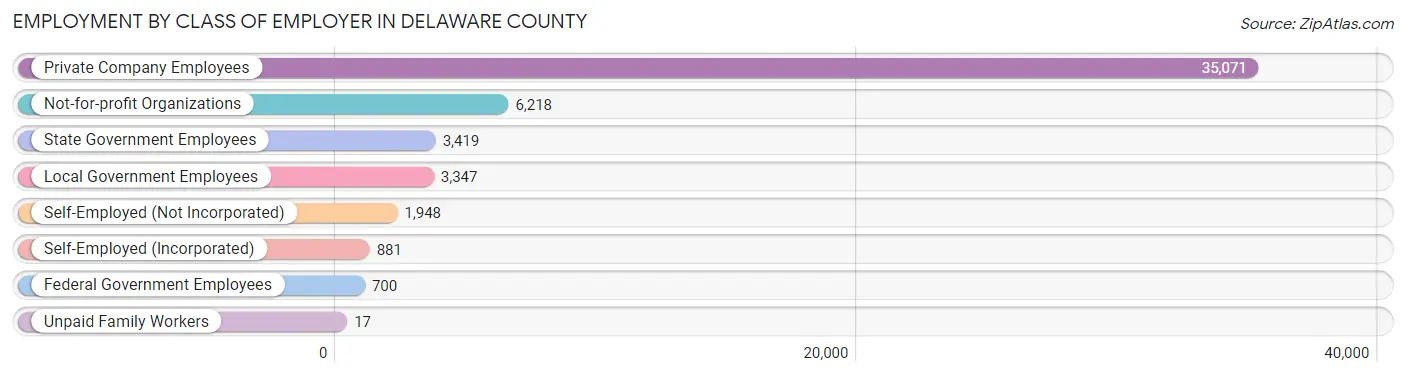
| Employer Class | # Employees | % Employees |
| Private Company Employees | 35,071 | 68.0% |
| Self-Employed (Incorporated) | 881 | 1.7% |
| Self-Employed (Not Incorporated) | 1,948 | 3.8% |
| Not-for-profit Organizations | 6,218 | 12.0% |
| Local Government Employees | 3,347 | 6.5% |
| State Government Employees | 3,419 | 6.6% |
| Federal Government Employees | 700 | 1.4% |
| Unpaid Family Workers | 17 | 0.0% |
| Total | 51,601 | 100.0% |
Employment Status by Age in Delaware County
According to the labor force statistics for Delaware County, out of the total population over 16 years of age (94,314), 59.8% or 56,400 individuals are in the labor force, with 6.1% or 3,440 of them unemployed. The age group with the highest labor force participation rate is 25 to 29 years, with 85.8% or 5,985 individuals in the labor force. Within the labor force, the 16 to 19 years age range has the highest percentage of unemployed individuals, with 15.9% or 632 of them being unemployed.
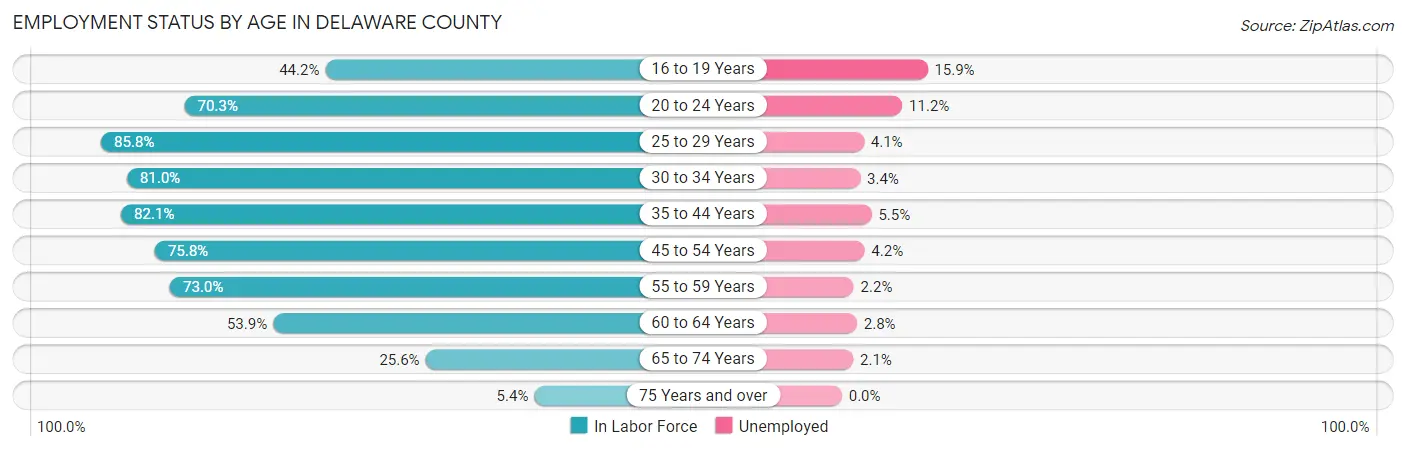
| Age Bracket | In Labor Force | Unemployed |
| 16 to 19 Years | 3,976 (44.2%) | 632 (15.9%) |
| 20 to 24 Years | 10,780 (70.3%) | 1,207 (11.2%) |
| 25 to 29 Years | 5,985 (85.8%) | 245 (4.1%) |
| 30 to 34 Years | 4,959 (81.0%) | 169 (3.4%) |
| 35 to 44 Years | 9,501 (82.1%) | 523 (5.5%) |
| 45 to 54 Years | 9,435 (75.8%) | 396 (4.2%) |
| 55 to 59 Years | 4,911 (73.0%) | 108 (2.2%) |
| 60 to 64 Years | 3,632 (53.9%) | 102 (2.8%) |
| 65 to 74 Years | 2,796 (25.6%) | 59 (2.1%) |
| 75 Years and over | 458 (5.4%) | 0 (0.0%) |
| Total | 56,400 (59.8%) | 3,440 (6.1%) |
Employment Status by Educational Attainment in Delaware County
According to labor force statistics for Delaware County, 76.0% of individuals (38,443) out of the total population between 25 and 64 years of age (50,583) are in the labor force, with 4.0% or 1,538 of them being unemployed. The group with the highest labor force participation rate are those with the educational attainment of bachelor's degree or higher, with 87.0% or 11,523 individuals in the labor force. Within the labor force, individuals with less than high school education have the highest percentage of unemployment, with 8.4% or 188 of them being unemployed.
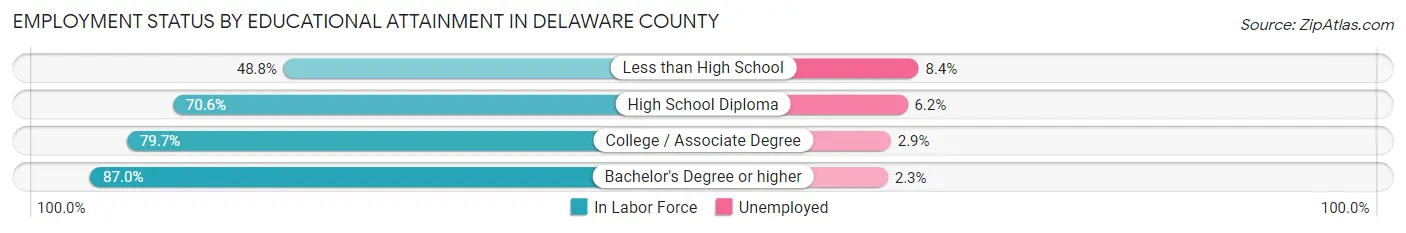
| Educational Attainment | In Labor Force | Unemployed |
| Less than High School | 2,233 (48.8%) | 384 (8.4%) |
| High School Diploma | 11,156 (70.6%) | 980 (6.2%) |
| College / Associate Degree | 13,517 (79.7%) | 492 (2.9%) |
| Bachelor's Degree or higher | 11,523 (87.0%) | 305 (2.3%) |
| Total | 38,443 (76.0%) | 2,023 (4.0%) |
Employment Occupations by Sex in Delaware County
Management, Business, Science and Arts Occupations
The most common Management, Business, Science and Arts occupations in Delaware County are Community & Social Service (5,902 | 11.2%), Management (4,458 | 8.4%), Education Instruction & Library (3,690 | 7.0%), Health Diagnosing & Treating (3,507 | 6.6%), and Business & Financial (2,381 | 4.5%).
Management, Business, Science and Arts Occupations by Sex
Within the Management, Business, Science and Arts occupations in Delaware County, the most male-oriented occupations are Computers & Mathematics (82.8%), Architecture & Engineering (82.1%), and Computers, Engineering & Science (80.4%), while the most female-oriented occupations are Health Technologists (80.0%), Health Diagnosing & Treating (73.3%), and Education Instruction & Library (67.8%).
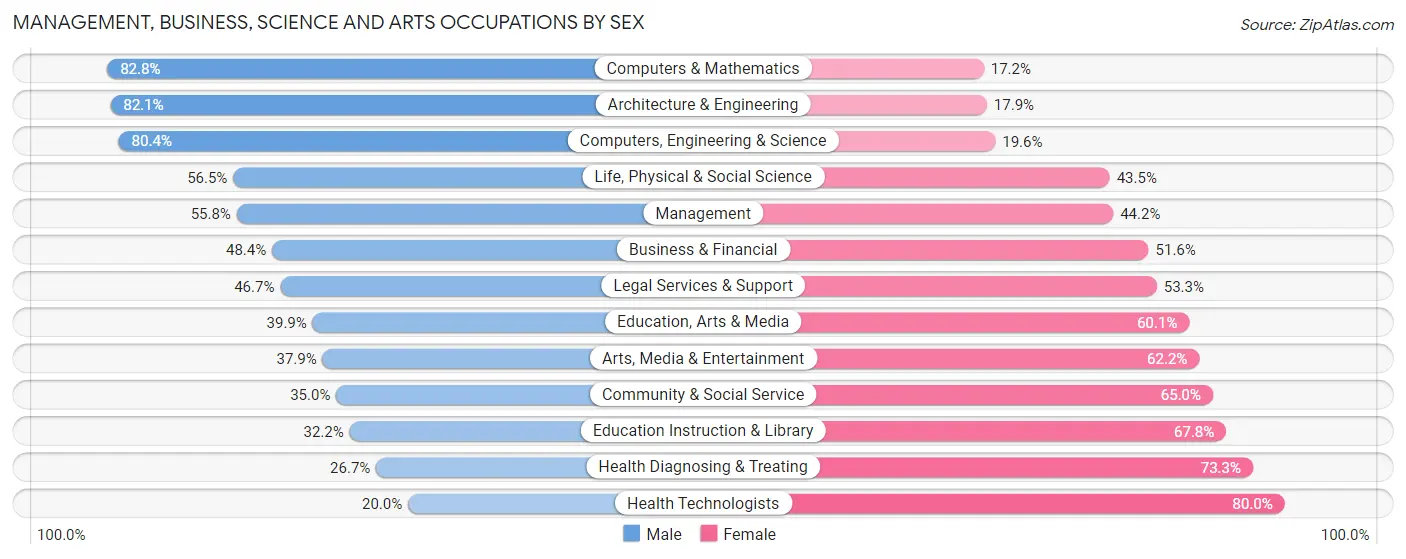
| Occupation | Male | Female |
| Management | 2,486 (55.8%) | 1,972 (44.2%) |
| Business & Financial | 1,152 (48.4%) | 1,229 (51.6%) |
| Computers, Engineering & Science | 1,453 (80.4%) | 355 (19.6%) |
| Computers & Mathematics | 1,008 (82.8%) | 210 (17.2%) |
| Architecture & Engineering | 358 (82.1%) | 78 (17.9%) |
| Life, Physical & Social Science | 87 (56.5%) | 67 (43.5%) |
| Community & Social Service | 2,065 (35.0%) | 3,837 (65.0%) |
| Education, Arts & Media | 493 (39.9%) | 742 (60.1%) |
| Legal Services & Support | 70 (46.7%) | 80 (53.3%) |
| Education Instruction & Library | 1,189 (32.2%) | 2,501 (67.8%) |
| Arts, Media & Entertainment | 313 (37.9%) | 514 (62.2%) |
| Health Diagnosing & Treating | 935 (26.7%) | 2,572 (73.3%) |
| Health Technologists | 454 (20.0%) | 1,815 (80.0%) |
| Total (Category) | 8,091 (44.8%) | 9,965 (55.2%) |
| Total (Overall) | 26,826 (50.7%) | 26,103 (49.3%) |
Services Occupations
The most common Services occupations in Delaware County are Food Preparation & Serving (3,733 | 7.0%), Cleaning & Maintenance (2,130 | 4.0%), Healthcare Support (1,990 | 3.8%), Personal Care & Service (1,740 | 3.3%), and Security & Protection (1,252 | 2.4%).
Services Occupations by Sex
Within the Services occupations in Delaware County, the most male-oriented occupations are Law Enforcement (84.3%), Security & Protection (73.7%), and Cleaning & Maintenance (70.7%), while the most female-oriented occupations are Healthcare Support (84.0%), Personal Care & Service (82.9%), and Food Preparation & Serving (67.5%).
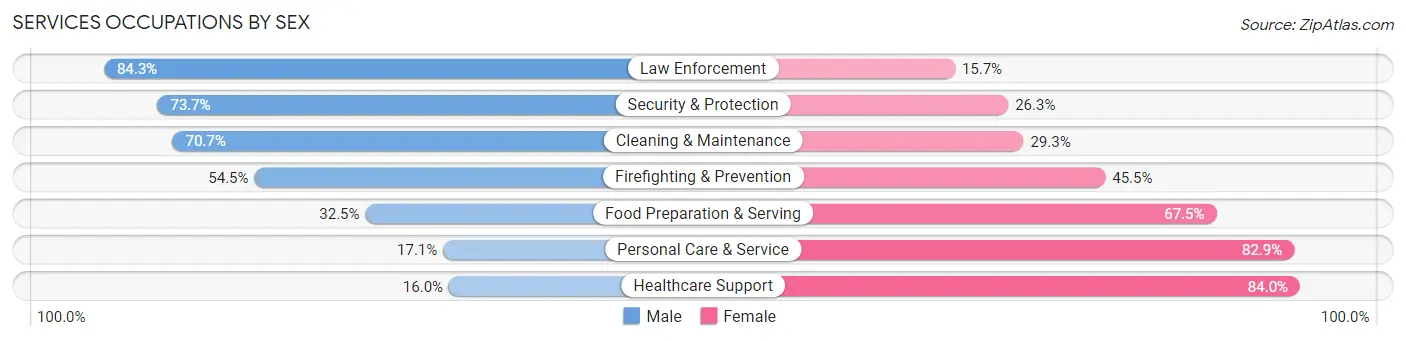
| Occupation | Male | Female |
| Healthcare Support | 318 (16.0%) | 1,672 (84.0%) |
| Security & Protection | 923 (73.7%) | 329 (26.3%) |
| Firefighting & Prevention | 242 (54.5%) | 202 (45.5%) |
| Law Enforcement | 681 (84.3%) | 127 (15.7%) |
| Food Preparation & Serving | 1,214 (32.5%) | 2,519 (67.5%) |
| Cleaning & Maintenance | 1,506 (70.7%) | 624 (29.3%) |
| Personal Care & Service | 298 (17.1%) | 1,442 (82.9%) |
| Total (Category) | 4,259 (39.3%) | 6,586 (60.7%) |
| Total (Overall) | 26,826 (50.7%) | 26,103 (49.3%) |
Sales and Office Occupations
The most common Sales and Office occupations in Delaware County are Office & Administration (6,196 | 11.7%), and Sales & Related (4,977 | 9.4%).

Sales and Office Occupations by Sex
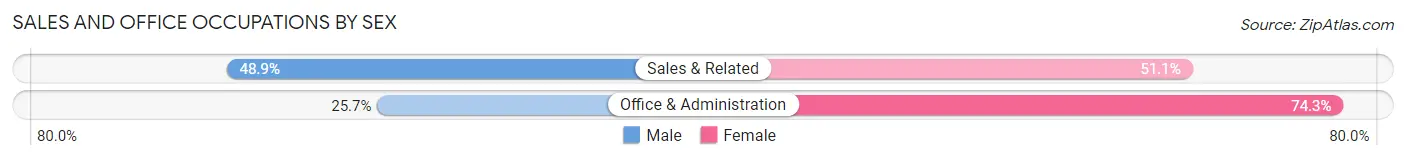
| Occupation | Male | Female |
| Sales & Related | 2,435 (48.9%) | 2,542 (51.1%) |
| Office & Administration | 1,595 (25.7%) | 4,601 (74.3%) |
| Total (Category) | 4,030 (36.1%) | 7,143 (63.9%) |
| Total (Overall) | 26,826 (50.7%) | 26,103 (49.3%) |
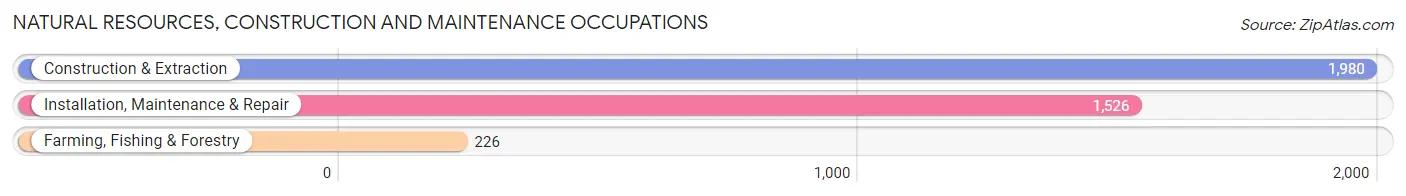
Natural Resources, Construction and Maintenance Occupations
The most common Natural Resources, Construction and Maintenance occupations in Delaware County are Construction & Extraction (1,980 | 3.7%), Installation, Maintenance & Repair (1,526 | 2.9%), and Farming, Fishing & Forestry (226 | 0.4%).
Natural Resources, Construction and Maintenance Occupations by Sex
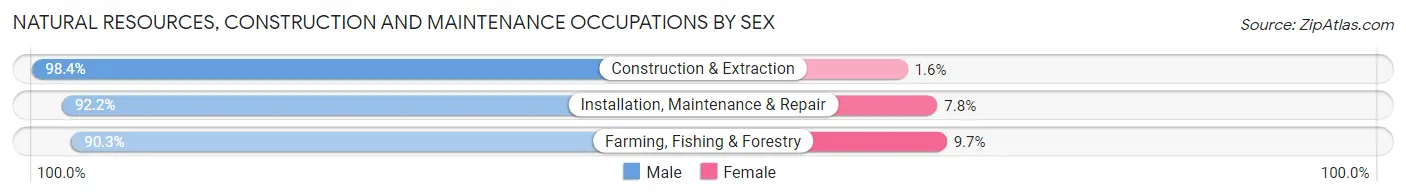
| Occupation | Male | Female |
| Farming, Fishing & Forestry | 204 (90.3%) | 22 (9.7%) |
| Construction & Extraction | 1,948 (98.4%) | 32 (1.6%) |
| Installation, Maintenance & Repair | 1,407 (92.2%) | 119 (7.8%) |
| Total (Category) | 3,559 (95.4%) | 173 (4.6%) |
| Total (Overall) | 26,826 (50.7%) | 26,103 (49.3%) |
Production, Transportation and Moving Occupations
The most common Production, Transportation and Moving occupations in Delaware County are Production (4,097 | 7.7%), Material Moving (2,799 | 5.3%), and Transportation (2,227 | 4.2%).
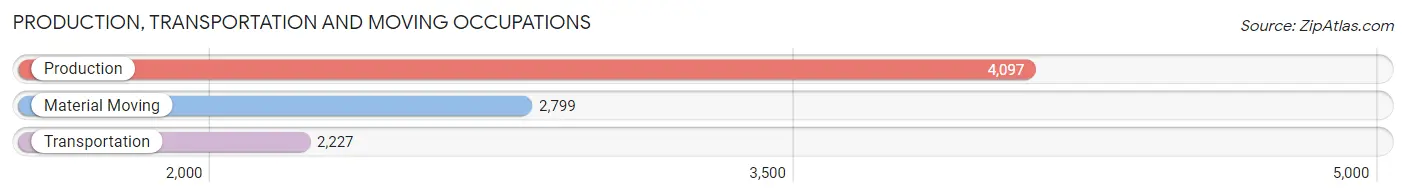
Production, Transportation and Moving Occupations by Sex
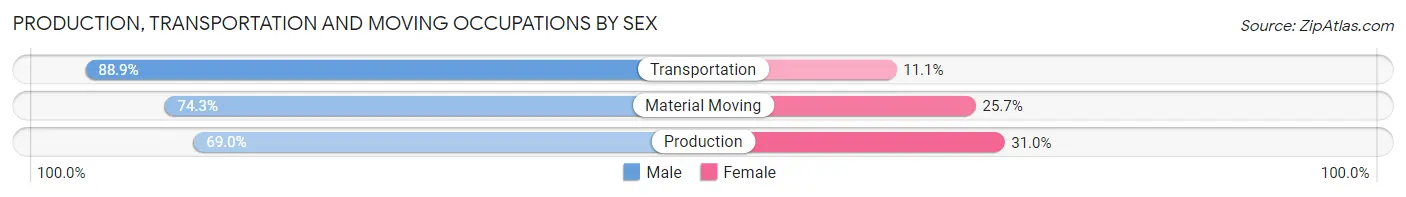
| Occupation | Male | Female |
| Production | 2,828 (69.0%) | 1,269 (31.0%) |
| Transportation | 1,979 (88.9%) | 248 (11.1%) |
| Material Moving | 2,080 (74.3%) | 719 (25.7%) |
| Total (Category) | 6,887 (75.5%) | 2,236 (24.5%) |
| Total (Overall) | 26,826 (50.7%) | 26,103 (49.3%) |
Employment Industries by Sex in Delaware County
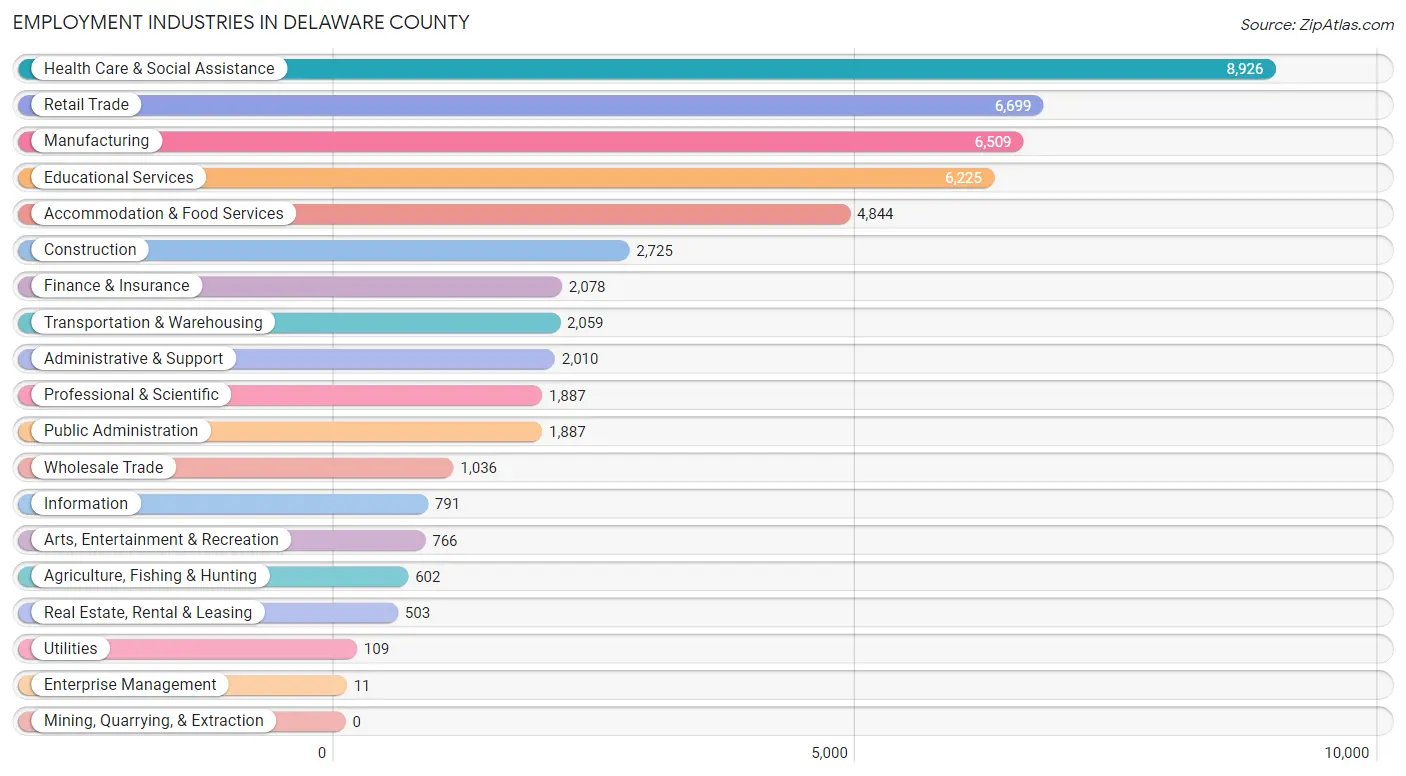
Employment Industries in Delaware County
The major employment industries in Delaware County include Health Care & Social Assistance (8,926 | 16.9%), Retail Trade (6,699 | 12.7%), Manufacturing (6,509 | 12.3%), Educational Services (6,225 | 11.8%), and Accommodation & Food Services (4,844 | 9.1%).
Employment Industries by Sex in Delaware County
The Delaware County industries that see more men than women are Construction (94.1%), Agriculture, Fishing & Hunting (83.7%), and Wholesale Trade (80.6%), whereas the industries that tend to have a higher number of women are Enterprise Management (100.0%), Health Care & Social Assistance (77.1%), and Finance & Insurance (71.3%).
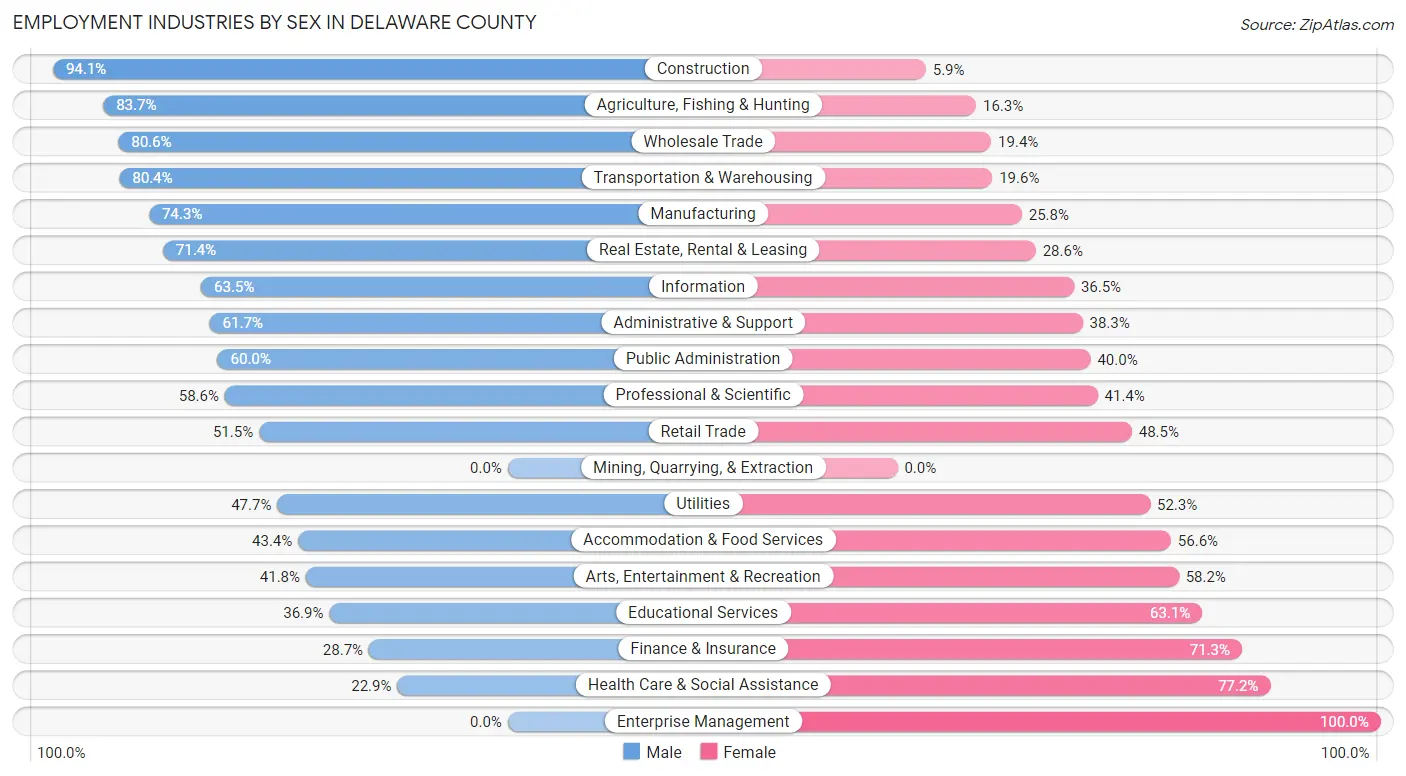
| Industry | Male | Female |
| Agriculture, Fishing & Hunting | 504 (83.7%) | 98 (16.3%) |
| Mining, Quarrying, & Extraction | 0 (0.0%) | 0 (0.0%) |
| Construction | 2,565 (94.1%) | 160 (5.9%) |
| Manufacturing | 4,833 (74.3%) | 1,676 (25.8%) |
| Wholesale Trade | 835 (80.6%) | 201 (19.4%) |
| Retail Trade | 3,449 (51.5%) | 3,250 (48.5%) |
| Transportation & Warehousing | 1,655 (80.4%) | 404 (19.6%) |
| Utilities | 52 (47.7%) | 57 (52.3%) |
| Information | 502 (63.5%) | 289 (36.5%) |
| Finance & Insurance | 597 (28.7%) | 1,481 (71.3%) |
| Real Estate, Rental & Leasing | 359 (71.4%) | 144 (28.6%) |
| Professional & Scientific | 1,105 (58.6%) | 782 (41.4%) |
| Enterprise Management | 0 (0.0%) | 11 (100.0%) |
| Administrative & Support | 1,240 (61.7%) | 770 (38.3%) |
| Educational Services | 2,299 (36.9%) | 3,926 (63.1%) |
| Health Care & Social Assistance | 2,040 (22.9%) | 6,886 (77.1%) |
| Arts, Entertainment & Recreation | 320 (41.8%) | 446 (58.2%) |
| Accommodation & Food Services | 2,102 (43.4%) | 2,742 (56.6%) |
| Public Administration | 1,133 (60.0%) | 754 (40.0%) |
| Total | 26,826 (50.7%) | 26,103 (49.3%) |
Education in Delaware County
School Enrollment in Delaware County
The most common levels of schooling among the 32,617 students in Delaware County are college / undergraduate (15,140 | 46.4%), elementary school (4,618 | 14.2%), and high school (4,526 | 13.9%).
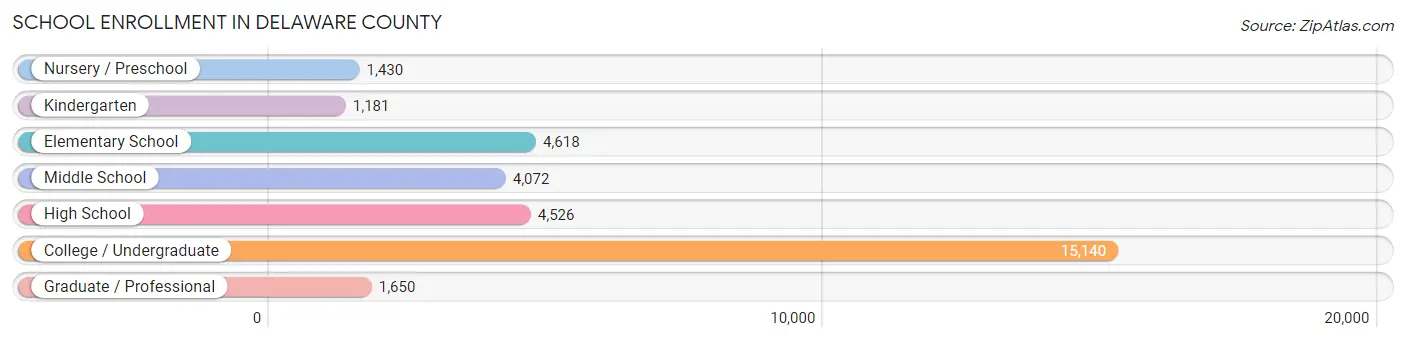
| School Level | # Students | % Students |
| Nursery / Preschool | 1,430 | 4.4% |
| Kindergarten | 1,181 | 3.6% |
| Elementary School | 4,618 | 14.2% |
| Middle School | 4,072 | 12.5% |
| High School | 4,526 | 13.9% |
| College / Undergraduate | 15,140 | 46.4% |
| Graduate / Professional | 1,650 | 5.1% |
| Total | 32,617 | 100.0% |
School Enrollment by Age by Funding Source in Delaware County
Out of a total of 32,617 students who are enrolled in schools in Delaware County, 2,446 (7.5%) attend a private institution, while the remaining 30,171 (92.5%) are enrolled in public schools. The age group of 3 to 4 year olds has the highest likelihood of being enrolled in private schools, with 306 (31.7% in the age bracket) enrolled. Conversely, the age group of 18 to 19 year olds has the lowest likelihood of being enrolled in a private school, with 5,297 (98.7% in the age bracket) attending a public institution.
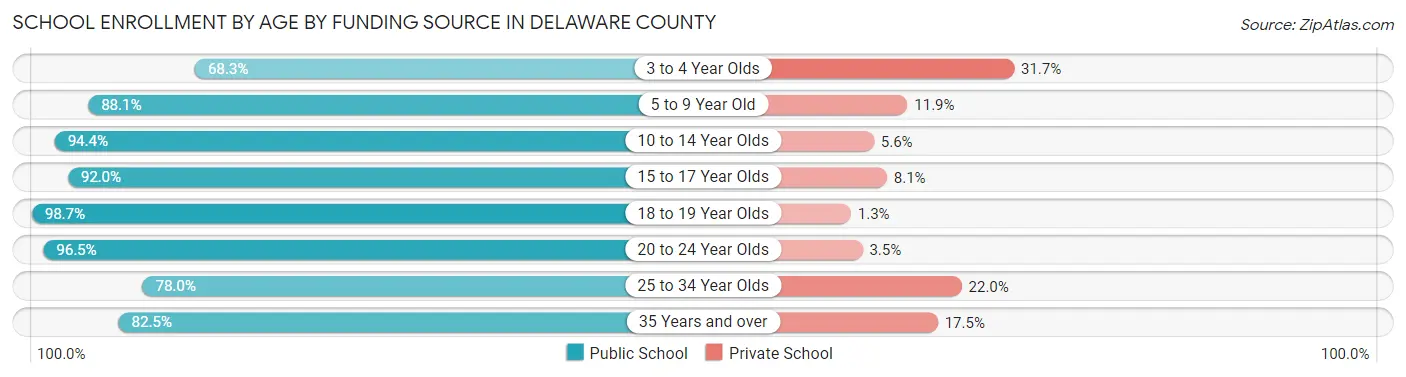
| Age Bracket | Public School | Private School |
| 3 to 4 Year Olds | 658 (68.3%) | 306 (31.7%) |
| 5 to 9 Year Old | 4,963 (88.1%) | 668 (11.9%) |
| 10 to 14 Year Olds | 4,736 (94.4%) | 282 (5.6%) |
| 15 to 17 Year Olds | 3,223 (91.9%) | 282 (8.1%) |
| 18 to 19 Year Olds | 5,297 (98.7%) | 72 (1.3%) |
| 20 to 24 Year Olds | 9,260 (96.5%) | 336 (3.5%) |
| 25 to 34 Year Olds | 1,122 (78.0%) | 316 (22.0%) |
| 35 Years and over | 904 (82.5%) | 192 (17.5%) |
| Total | 30,171 (92.5%) | 2,446 (7.5%) |
Educational Attainment by Field of Study in Delaware County
Education (3,462 | 17.7%), science & technology (2,954 | 15.1%), business (2,770 | 14.2%), arts & humanities (1,731 | 8.9%), and social sciences (1,218 | 6.2%) are the most common fields of study among 19,548 individuals in Delaware County who have obtained a bachelor's degree or higher.
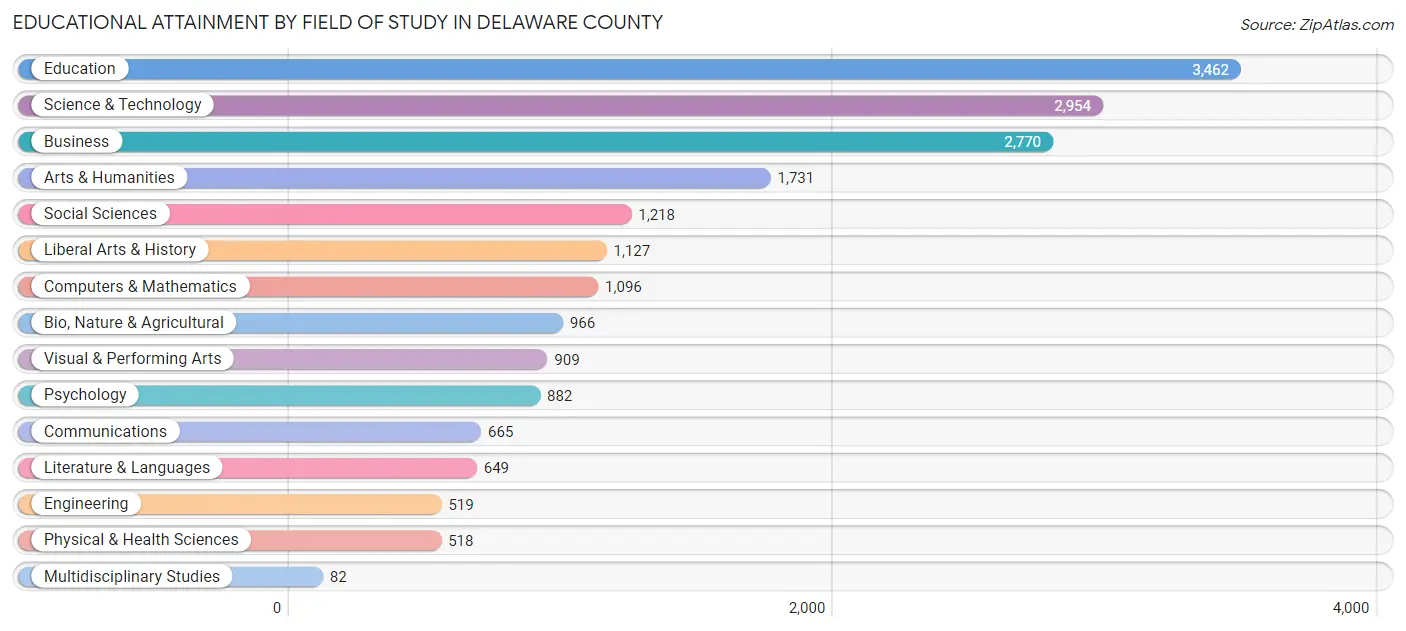
| Field of Study | # Graduates | % Graduates |
| Computers & Mathematics | 1,096 | 5.6% |
| Bio, Nature & Agricultural | 966 | 4.9% |
| Physical & Health Sciences | 518 | 2.6% |
| Psychology | 882 | 4.5% |
| Social Sciences | 1,218 | 6.2% |
| Engineering | 519 | 2.7% |
| Multidisciplinary Studies | 82 | 0.4% |
| Science & Technology | 2,954 | 15.1% |
| Business | 2,770 | 14.2% |
| Education | 3,462 | 17.7% |
| Literature & Languages | 649 | 3.3% |
| Liberal Arts & History | 1,127 | 5.8% |
| Visual & Performing Arts | 909 | 4.6% |
| Communications | 665 | 3.4% |
| Arts & Humanities | 1,731 | 8.9% |
| Total | 19,548 | 100.0% |
Transportation & Commute in Delaware County
Vehicle Availability by Sex in Delaware County
The most prevalent vehicle ownership categories in Delaware County are males with 2 vehicles (11,871, accounting for 46.9%) and females with 2 vehicles (10,614, making up 48.5%).
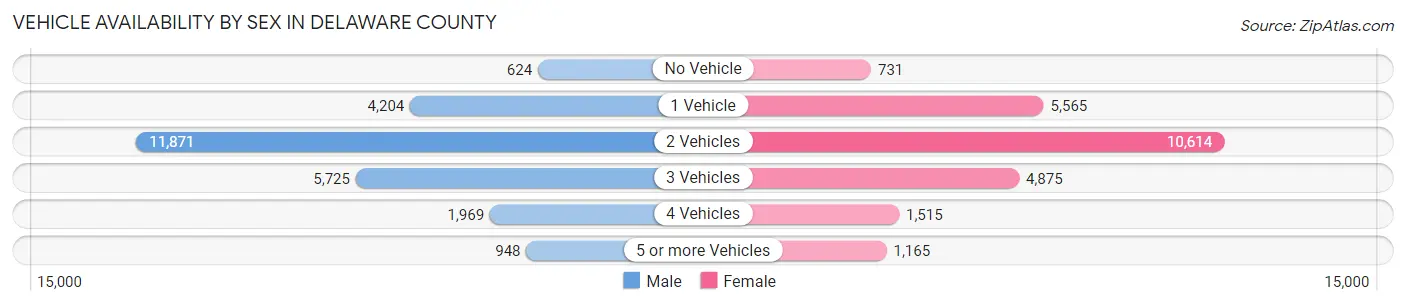
| Vehicles Available | Male | Female |
| No Vehicle | 624 (2.5%) | 731 (3.0%) |
| 1 Vehicle | 4,204 (16.6%) | 5,565 (22.8%) |
| 2 Vehicles | 11,871 (46.9%) | 10,614 (43.4%) |
| 3 Vehicles | 5,725 (22.6%) | 4,875 (19.9%) |
| 4 Vehicles | 1,969 (7.8%) | 1,515 (6.2%) |
| 5 or more Vehicles | 948 (3.7%) | 1,165 (4.8%) |
| Total | 25,341 (100.0%) | 24,465 (100.0%) |
Commute Time in Delaware County
The most frequently occuring commute durations in Delaware County are 10 to 14 minutes (9,433 commuters, 19.4%), 5 to 9 minutes (8,967 commuters, 18.4%), and 15 to 19 minutes (8,878 commuters, 18.2%).
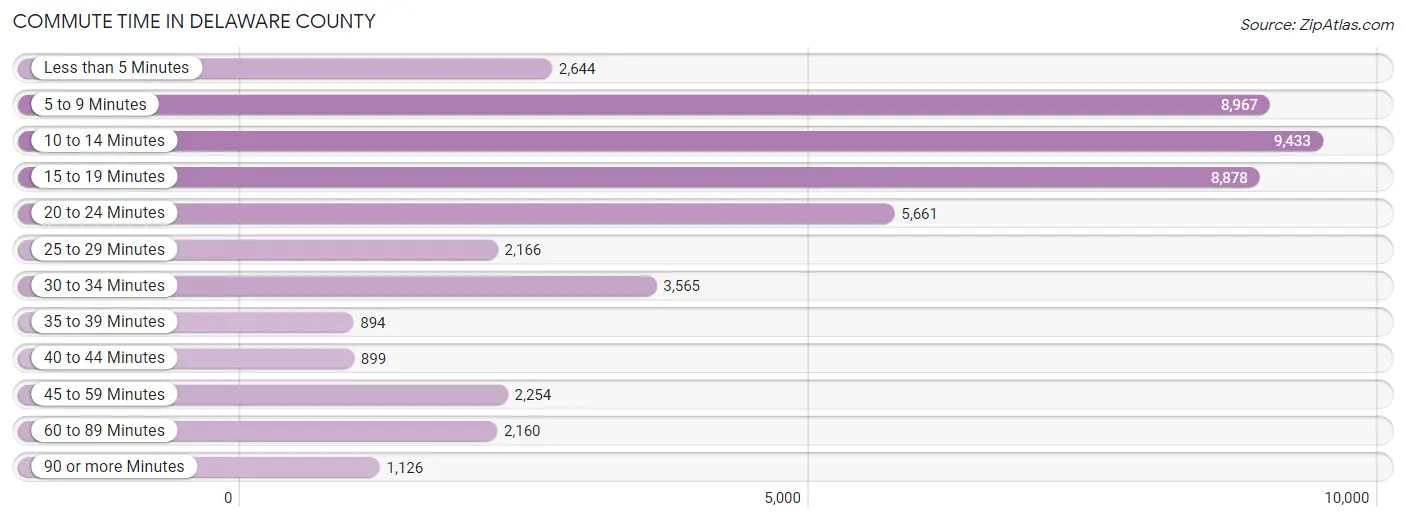
| Commute Time | # Commuters | % Commuters |
| Less than 5 Minutes | 2,644 | 5.4% |
| 5 to 9 Minutes | 8,967 | 18.4% |
| 10 to 14 Minutes | 9,433 | 19.4% |
| 15 to 19 Minutes | 8,878 | 18.2% |
| 20 to 24 Minutes | 5,661 | 11.6% |
| 25 to 29 Minutes | 2,166 | 4.4% |
| 30 to 34 Minutes | 3,565 | 7.3% |
| 35 to 39 Minutes | 894 | 1.8% |
| 40 to 44 Minutes | 899 | 1.8% |
| 45 to 59 Minutes | 2,254 | 4.6% |
| 60 to 89 Minutes | 2,160 | 4.4% |
| 90 or more Minutes | 1,126 | 2.3% |
Commute Time by Sex in Delaware County
The most common commute times in Delaware County are 15 to 19 minutes (4,462 commuters, 18.0%) for males and 10 to 14 minutes (5,290 commuters, 22.2%) for females.
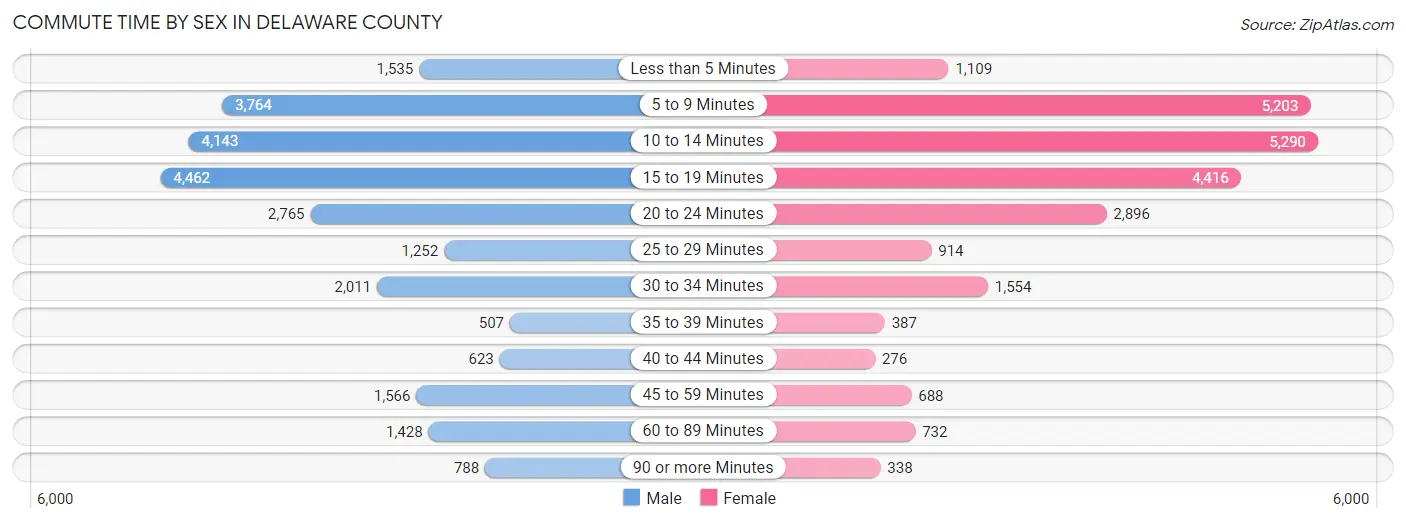
| Commute Time | Male | Female |
| Less than 5 Minutes | 1,535 (6.2%) | 1,109 (4.7%) |
| 5 to 9 Minutes | 3,764 (15.1%) | 5,203 (21.9%) |
| 10 to 14 Minutes | 4,143 (16.7%) | 5,290 (22.2%) |
| 15 to 19 Minutes | 4,462 (18.0%) | 4,416 (18.5%) |
| 20 to 24 Minutes | 2,765 (11.1%) | 2,896 (12.2%) |
| 25 to 29 Minutes | 1,252 (5.0%) | 914 (3.8%) |
| 30 to 34 Minutes | 2,011 (8.1%) | 1,554 (6.5%) |
| 35 to 39 Minutes | 507 (2.0%) | 387 (1.6%) |
| 40 to 44 Minutes | 623 (2.5%) | 276 (1.2%) |
| 45 to 59 Minutes | 1,566 (6.3%) | 688 (2.9%) |
| 60 to 89 Minutes | 1,428 (5.8%) | 732 (3.1%) |
| 90 or more Minutes | 788 (3.2%) | 338 (1.4%) |
Time of Departure to Work by Sex in Delaware County
The most frequent times of departure to work in Delaware County are 7:30 AM to 7:59 AM (3,352, 13.5%) for males and 7:30 AM to 7:59 AM (4,566, 19.2%) for females.
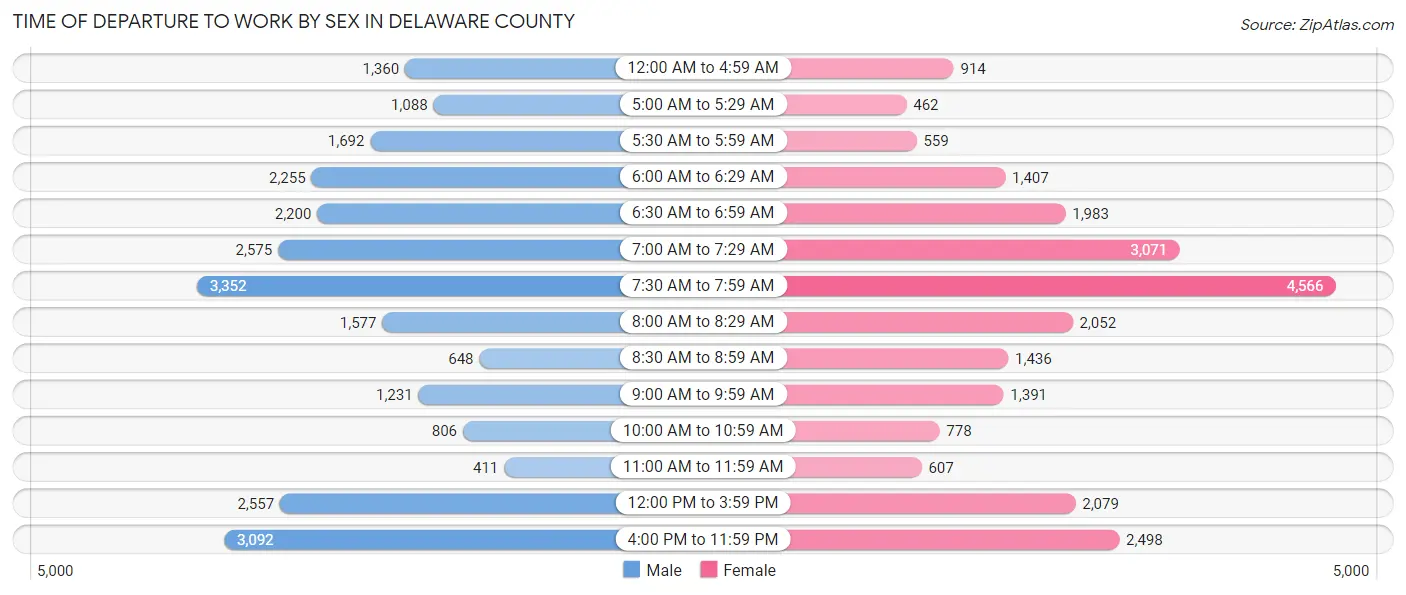
| Time of Departure | Male | Female |
| 12:00 AM to 4:59 AM | 1,360 (5.5%) | 914 (3.8%) |
| 5:00 AM to 5:29 AM | 1,088 (4.4%) | 462 (1.9%) |
| 5:30 AM to 5:59 AM | 1,692 (6.8%) | 559 (2.4%) |
| 6:00 AM to 6:29 AM | 2,255 (9.1%) | 1,407 (5.9%) |
| 6:30 AM to 6:59 AM | 2,200 (8.9%) | 1,983 (8.3%) |
| 7:00 AM to 7:29 AM | 2,575 (10.4%) | 3,071 (12.9%) |
| 7:30 AM to 7:59 AM | 3,352 (13.5%) | 4,566 (19.2%) |
| 8:00 AM to 8:29 AM | 1,577 (6.4%) | 2,052 (8.6%) |
| 8:30 AM to 8:59 AM | 648 (2.6%) | 1,436 (6.0%) |
| 9:00 AM to 9:59 AM | 1,231 (5.0%) | 1,391 (5.8%) |
| 10:00 AM to 10:59 AM | 806 (3.2%) | 778 (3.3%) |
| 11:00 AM to 11:59 AM | 411 (1.7%) | 607 (2.5%) |
| 12:00 PM to 3:59 PM | 2,557 (10.3%) | 2,079 (8.7%) |
| 4:00 PM to 11:59 PM | 3,092 (12.4%) | 2,498 (10.5%) |
| Total | 24,844 (100.0%) | 23,803 (100.0%) |
Housing Occupancy in Delaware County
Occupancy by Ownership in Delaware County
Of the total 46,159 dwellings in Delaware County, owner-occupied units account for 30,270 (65.6%), while renter-occupied units make up 15,889 (34.4%).
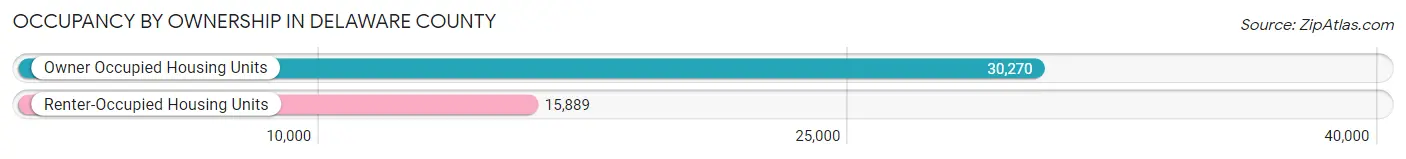
| Occupancy | # Housing Units | % Housing Units |
| Owner Occupied Housing Units | 30,270 | 65.6% |
| Renter-Occupied Housing Units | 15,889 | 34.4% |
| Total Occupied Housing Units | 46,159 | 100.0% |
Occupancy by Household Size in Delaware County
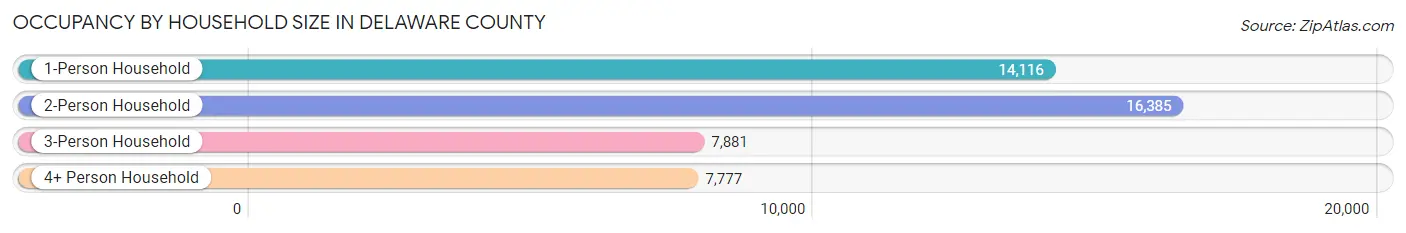
| Household Size | # Housing Units | % Housing Units |
| 1-Person Household | 14,116 | 30.6% |
| 2-Person Household | 16,385 | 35.5% |
| 3-Person Household | 7,881 | 17.1% |
| 4+ Person Household | 7,777 | 16.9% |
| Total Housing Units | 46,159 | 100.0% |
Occupancy by Ownership by Household Size in Delaware County
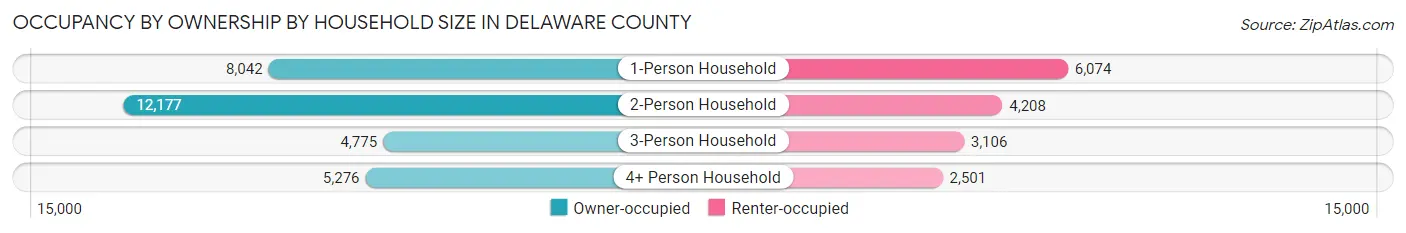
| Household Size | Owner-occupied | Renter-occupied |
| 1-Person Household | 8,042 (57.0%) | 6,074 (43.0%) |
| 2-Person Household | 12,177 (74.3%) | 4,208 (25.7%) |
| 3-Person Household | 4,775 (60.6%) | 3,106 (39.4%) |
| 4+ Person Household | 5,276 (67.8%) | 2,501 (32.2%) |
| Total Housing Units | 30,270 (65.6%) | 15,889 (34.4%) |
Occupancy by Educational Attainment in Delaware County
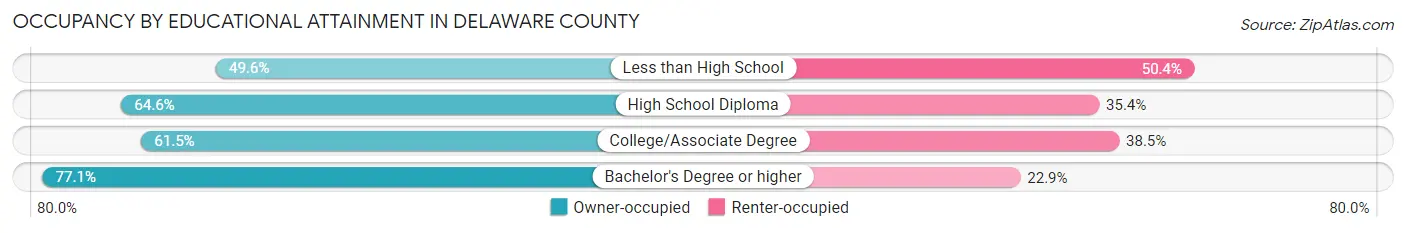
| Household Size | Owner-occupied | Renter-occupied |
| Less than High School | 1,762 (49.6%) | 1,788 (50.4%) |
| High School Diploma | 8,970 (64.6%) | 4,907 (35.4%) |
| College/Associate Degree | 10,294 (61.5%) | 6,453 (38.5%) |
| Bachelor's Degree or higher | 9,244 (77.1%) | 2,741 (22.9%) |
Occupancy by Age of Householder in Delaware County
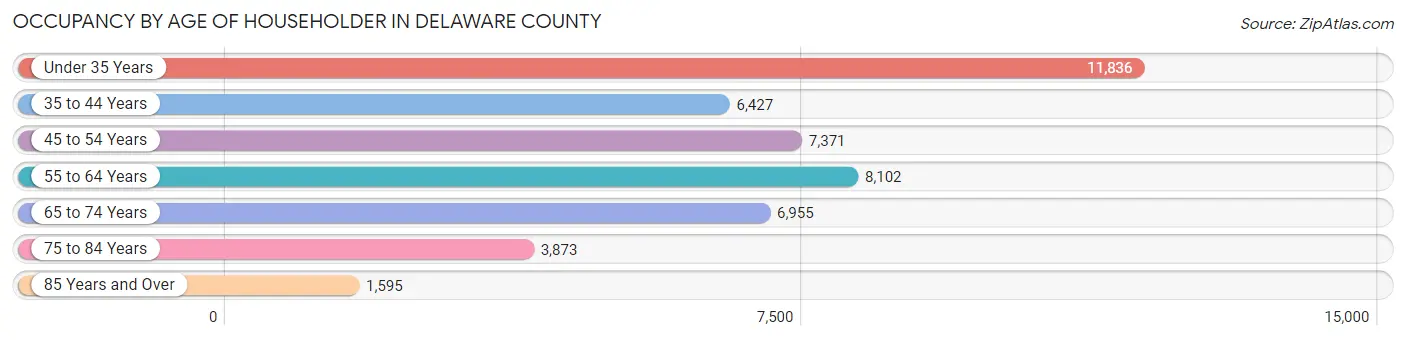
| Age Bracket | # Households | % Households |
| Under 35 Years | 11,836 | 25.6% |
| 35 to 44 Years | 6,427 | 13.9% |
| 45 to 54 Years | 7,371 | 16.0% |
| 55 to 64 Years | 8,102 | 17.5% |
| 65 to 74 Years | 6,955 | 15.1% |
| 75 to 84 Years | 3,873 | 8.4% |
| 85 Years and Over | 1,595 | 3.5% |
| Total | 46,159 | 100.0% |
Housing Finances in Delaware County
Median Income by Occupancy in Delaware County
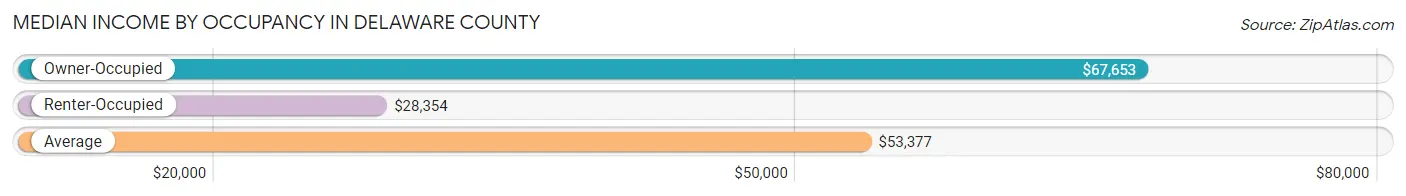
| Occupancy Type | # Households | Median Income |
| Owner-Occupied | 30,270 (65.6%) | $67,653 |
| Renter-Occupied | 15,889 (34.4%) | $28,354 |
| Average | 46,159 (100.0%) | $53,377 |
Occupancy by Householder Income Bracket in Delaware County
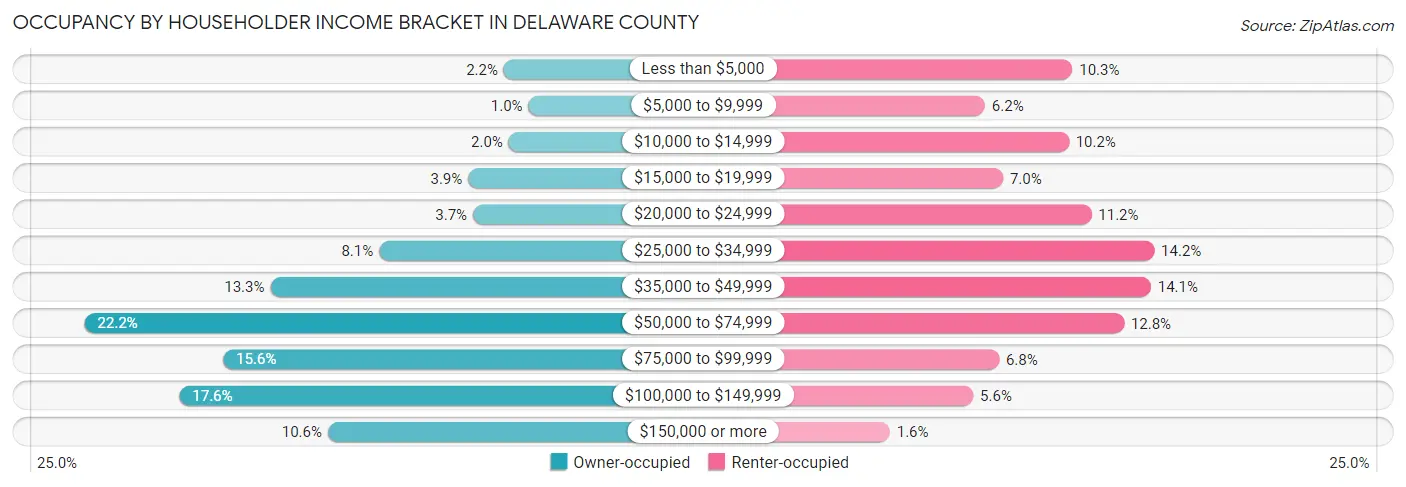
| Income Bracket | Owner-occupied | Renter-occupied |
| Less than $5,000 | 661 (2.2%) | 1,640 (10.3%) |
| $5,000 to $9,999 | 307 (1.0%) | 978 (6.2%) |
| $10,000 to $14,999 | 591 (1.9%) | 1,613 (10.2%) |
| $15,000 to $19,999 | 1,174 (3.9%) | 1,115 (7.0%) |
| $20,000 to $24,999 | 1,105 (3.6%) | 1,785 (11.2%) |
| $25,000 to $34,999 | 2,457 (8.1%) | 2,259 (14.2%) |
| $35,000 to $49,999 | 4,026 (13.3%) | 2,234 (14.1%) |
| $50,000 to $74,999 | 6,706 (22.2%) | 2,031 (12.8%) |
| $75,000 to $99,999 | 4,707 (15.5%) | 1,086 (6.8%) |
| $100,000 to $149,999 | 5,338 (17.6%) | 889 (5.6%) |
| $150,000 or more | 3,198 (10.6%) | 259 (1.6%) |
| Total | 30,270 (100.0%) | 15,889 (100.0%) |
Monthly Housing Cost Tiers in Delaware County
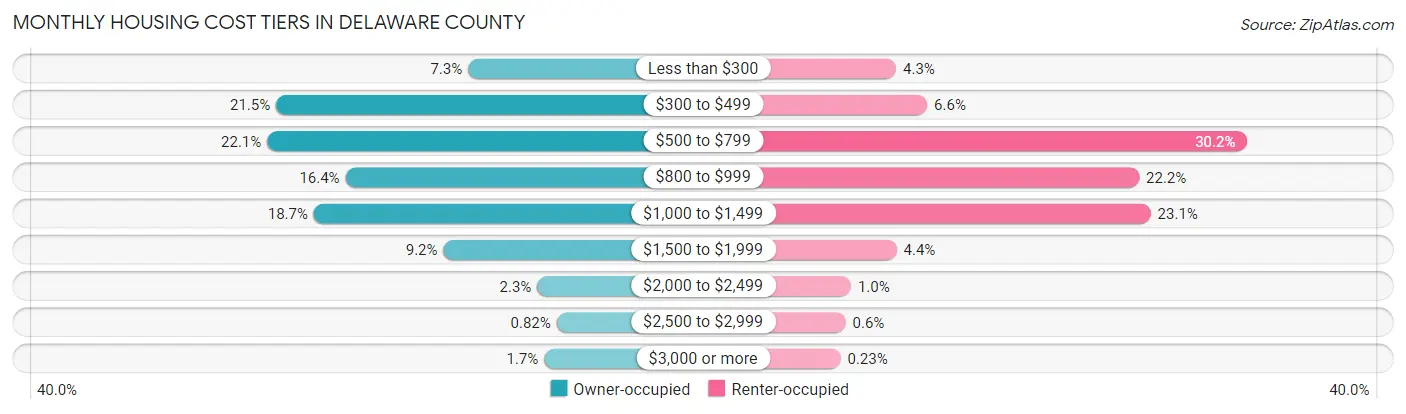
| Monthly Cost | Owner-occupied | Renter-occupied |
| Less than $300 | 2,221 (7.3%) | 686 (4.3%) |
| $300 to $499 | 6,502 (21.5%) | 1,050 (6.6%) |
| $500 to $799 | 6,703 (22.1%) | 4,796 (30.2%) |
| $800 to $999 | 4,954 (16.4%) | 3,531 (22.2%) |
| $1,000 to $1,499 | 5,660 (18.7%) | 3,665 (23.1%) |
| $1,500 to $1,999 | 2,773 (9.2%) | 693 (4.4%) |
| $2,000 to $2,499 | 680 (2.2%) | 159 (1.0%) |
| $2,500 to $2,999 | 249 (0.8%) | 96 (0.6%) |
| $3,000 or more | 528 (1.7%) | 36 (0.2%) |
| Total | 30,270 (100.0%) | 15,889 (100.0%) |
Physical Housing Characteristics in Delaware County
Housing Structures in Delaware County
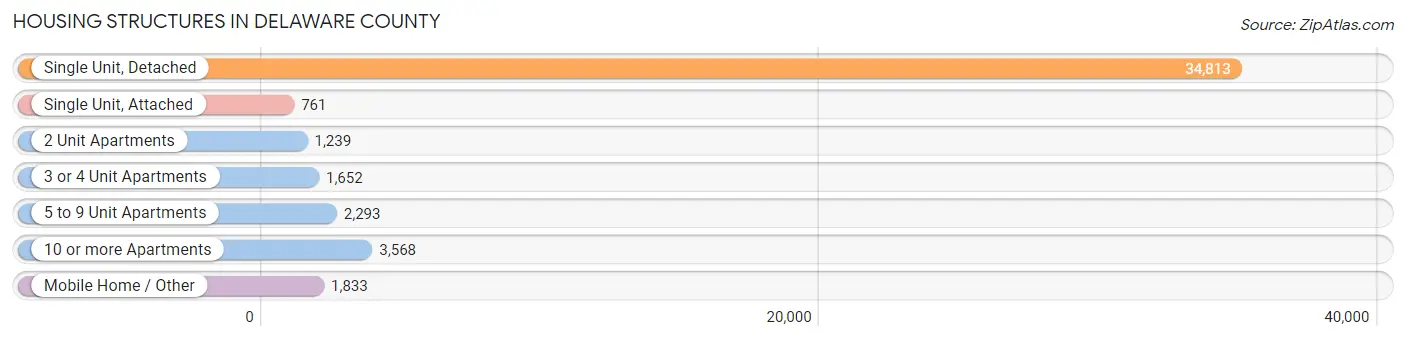
| Structure Type | # Housing Units | % Housing Units |
| Single Unit, Detached | 34,813 | 75.4% |
| Single Unit, Attached | 761 | 1.7% |
| 2 Unit Apartments | 1,239 | 2.7% |
| 3 or 4 Unit Apartments | 1,652 | 3.6% |
| 5 to 9 Unit Apartments | 2,293 | 5.0% |
| 10 or more Apartments | 3,568 | 7.7% |
| Mobile Home / Other | 1,833 | 4.0% |
| Total | 46,159 | 100.0% |
Housing Structures by Occupancy in Delaware County
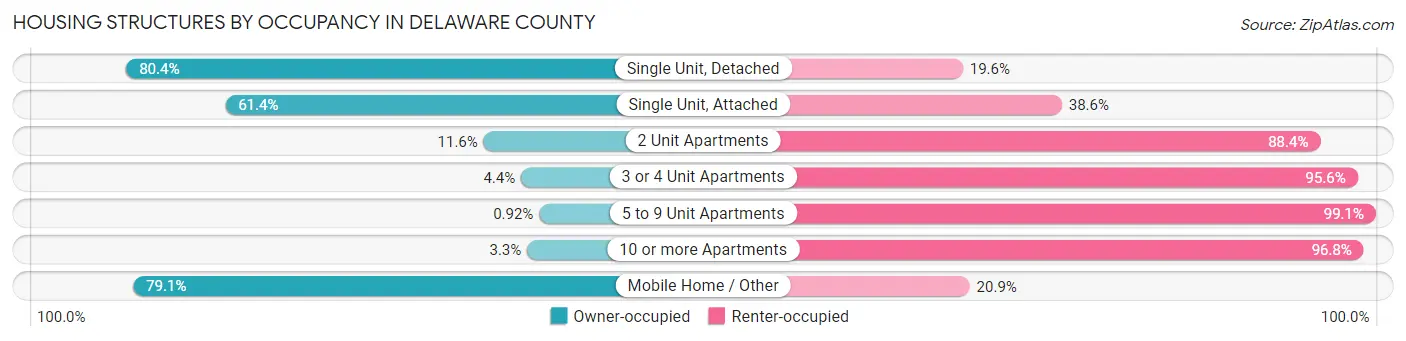
| Structure Type | Owner-occupied | Renter-occupied |
| Single Unit, Detached | 27,999 (80.4%) | 6,814 (19.6%) |
| Single Unit, Attached | 467 (61.4%) | 294 (38.6%) |
| 2 Unit Apartments | 144 (11.6%) | 1,095 (88.4%) |
| 3 or 4 Unit Apartments | 73 (4.4%) | 1,579 (95.6%) |
| 5 to 9 Unit Apartments | 21 (0.9%) | 2,272 (99.1%) |
| 10 or more Apartments | 116 (3.3%) | 3,452 (96.8%) |
| Mobile Home / Other | 1,450 (79.1%) | 383 (20.9%) |
| Total | 30,270 (65.6%) | 15,889 (34.4%) |
Housing Structures by Number of Rooms in Delaware County
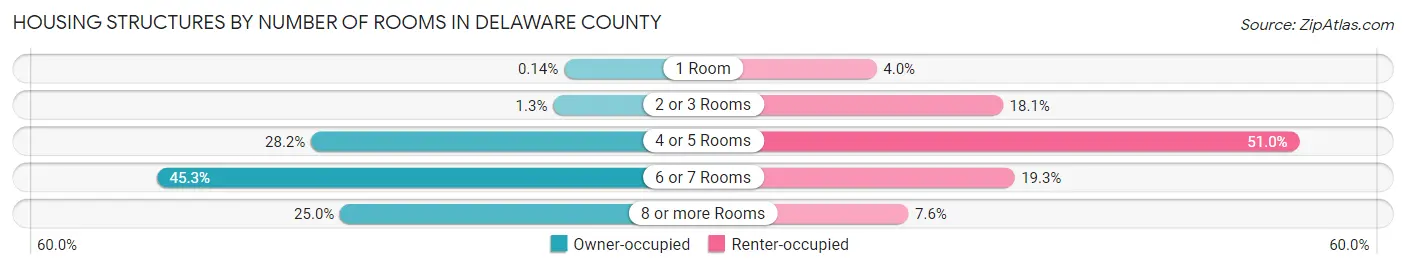
| Number of Rooms | Owner-occupied | Renter-occupied |
| 1 Room | 43 (0.1%) | 642 (4.0%) |
| 2 or 3 Rooms | 404 (1.3%) | 2,869 (18.1%) |
| 4 or 5 Rooms | 8,537 (28.2%) | 8,102 (51.0%) |
| 6 or 7 Rooms | 13,724 (45.3%) | 3,073 (19.3%) |
| 8 or more Rooms | 7,562 (25.0%) | 1,203 (7.6%) |
| Total | 30,270 (100.0%) | 15,889 (100.0%) |
Housing Structure by Heating Type in Delaware County
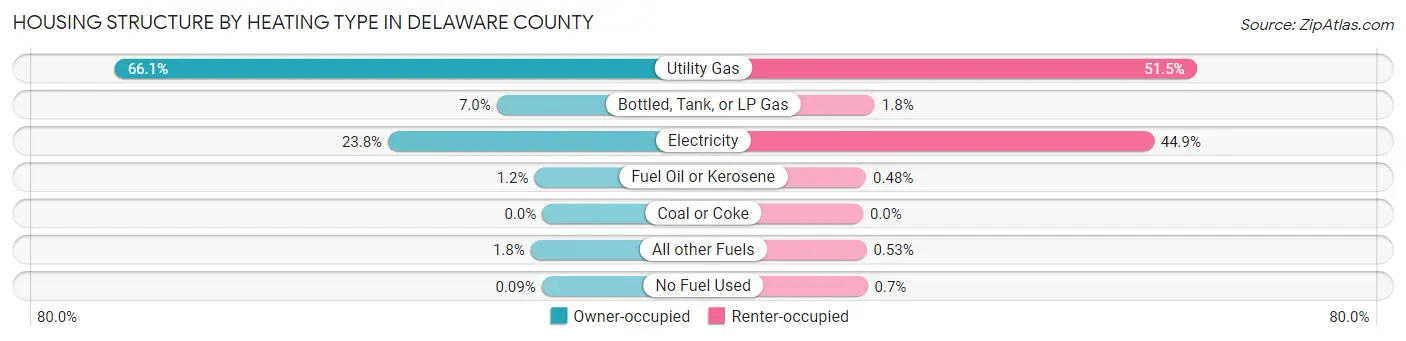
| Heating Type | Owner-occupied | Renter-occupied |
| Utility Gas | 19,997 (66.1%) | 8,187 (51.5%) |
| Bottled, Tank, or LP Gas | 2,129 (7.0%) | 290 (1.8%) |
| Electricity | 7,212 (23.8%) | 7,141 (44.9%) |
| Fuel Oil or Kerosene | 367 (1.2%) | 76 (0.5%) |
| Coal or Coke | 0 (0.0%) | 0 (0.0%) |
| All other Fuels | 538 (1.8%) | 84 (0.5%) |
| No Fuel Used | 27 (0.1%) | 111 (0.7%) |
| Total | 30,270 (100.0%) | 15,889 (100.0%) |
Household Vehicle Usage in Delaware County
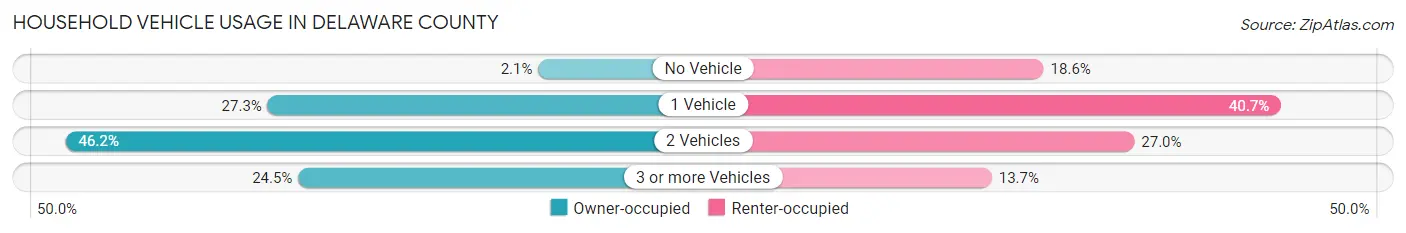
| Vehicles per Household | Owner-occupied | Renter-occupied |
| No Vehicle | 620 (2.1%) | 2,947 (18.5%) |
| 1 Vehicle | 8,267 (27.3%) | 6,470 (40.7%) |
| 2 Vehicles | 13,978 (46.2%) | 4,294 (27.0%) |
| 3 or more Vehicles | 7,405 (24.5%) | 2,178 (13.7%) |
| Total | 30,270 (100.0%) | 15,889 (100.0%) |
Real Estate & Mortgages in Delaware County
Real Estate and Mortgage Overview in Delaware County
| Characteristic | Without Mortgage | With Mortgage |
| Housing Units | 12,633 | 17,637 |
| Median Property Value | $99,100 | $134,000 |
| Median Household Income | $52,920 | $2,440 |
| Monthly Housing Costs | $435 | $528 |
| Real Estate Taxes | $858 | $627 |
Property Value by Mortgage Status in Delaware County
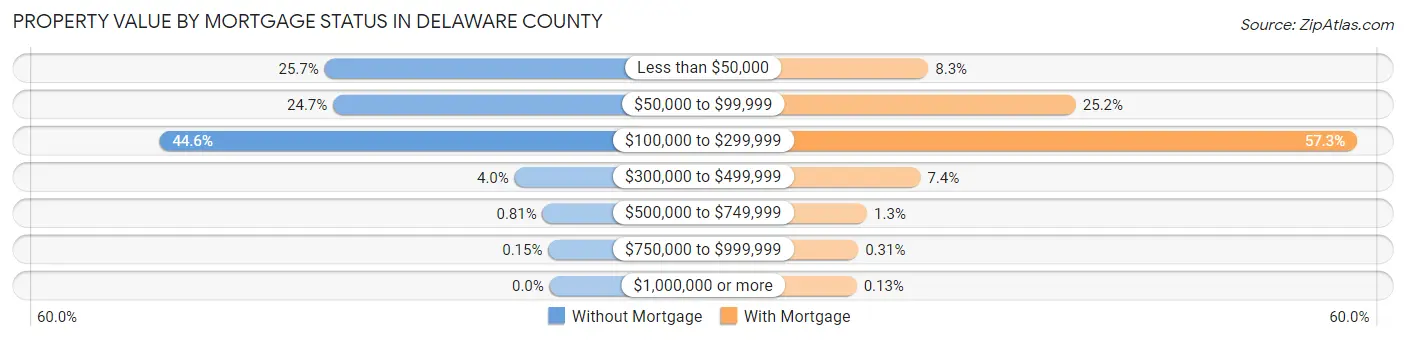
| Property Value | Without Mortgage | With Mortgage |
| Less than $50,000 | 3,249 (25.7%) | 1,467 (8.3%) |
| $50,000 to $99,999 | 3,126 (24.7%) | 4,441 (25.2%) |
| $100,000 to $299,999 | 5,632 (44.6%) | 10,108 (57.3%) |
| $300,000 to $499,999 | 505 (4.0%) | 1,308 (7.4%) |
| $500,000 to $749,999 | 102 (0.8%) | 235 (1.3%) |
| $750,000 to $999,999 | 19 (0.2%) | 55 (0.3%) |
| $1,000,000 or more | 0 (0.0%) | 23 (0.1%) |
| Total | 12,633 (100.0%) | 17,637 (100.0%) |
Household Income by Mortgage Status in Delaware County
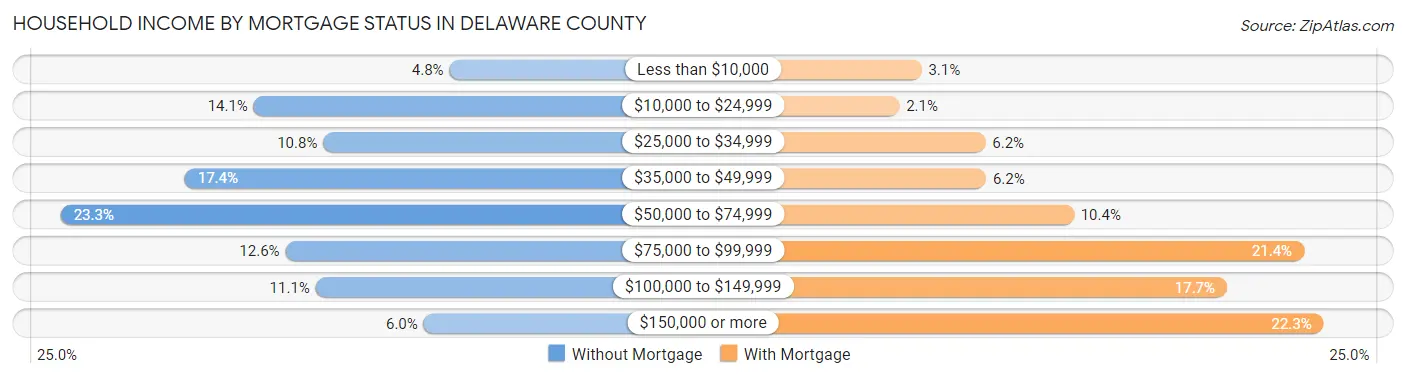
| Household Income | Without Mortgage | With Mortgage |
| Less than $10,000 | 602 (4.8%) | 553 (3.1%) |
| $10,000 to $24,999 | 1,780 (14.1%) | 366 (2.1%) |
| $25,000 to $34,999 | 1,362 (10.8%) | 1,090 (6.2%) |
| $35,000 to $49,999 | 2,194 (17.4%) | 1,095 (6.2%) |
| $50,000 to $74,999 | 2,941 (23.3%) | 1,832 (10.4%) |
| $75,000 to $99,999 | 1,589 (12.6%) | 3,765 (21.3%) |
| $100,000 to $149,999 | 1,407 (11.1%) | 3,118 (17.7%) |
| $150,000 or more | 758 (6.0%) | 3,931 (22.3%) |
| Total | 12,633 (100.0%) | 17,637 (100.0%) |
Property Value to Household Income Ratio in Delaware County
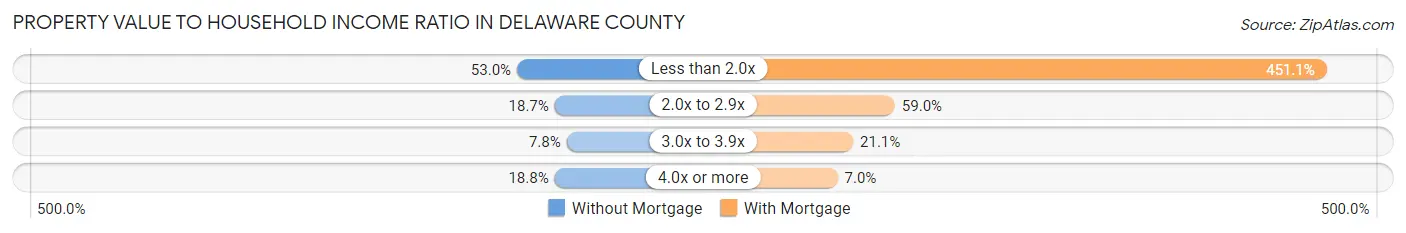
| Value-to-Income Ratio | Without Mortgage | With Mortgage |
| Less than 2.0x | 6,690 (53.0%) | 79,556 (451.1%) |
| 2.0x to 2.9x | 2,362 (18.7%) | 10,406 (59.0%) |
| 3.0x to 3.9x | 990 (7.8%) | 3,712 (21.0%) |
| 4.0x or more | 2,380 (18.8%) | 1,235 (7.0%) |
| Total | 12,633 (100.0%) | 17,637 (100.0%) |
Real Estate Taxes by Mortgage Status in Delaware County
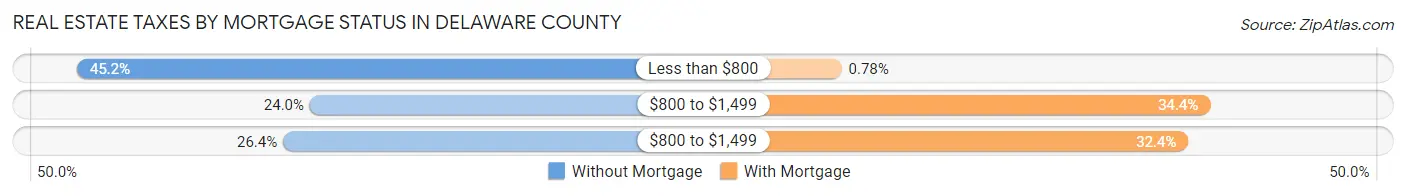
| Property Taxes | Without Mortgage | With Mortgage |
| Less than $800 | 5,714 (45.2%) | 138 (0.8%) |
| $800 to $1,499 | 3,025 (23.9%) | 6,075 (34.4%) |
| $800 to $1,499 | 3,335 (26.4%) | 5,722 (32.4%) |
| Total | 12,633 (100.0%) | 17,637 (100.0%) |
Health & Disability in Delaware County
Health Insurance Coverage by Age in Delaware County
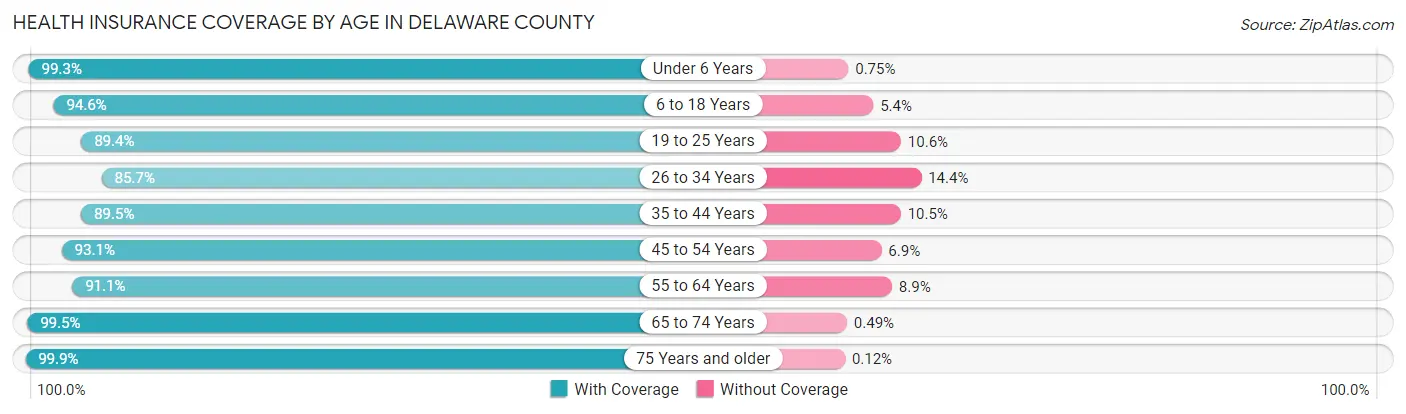
| Age Bracket | With Coverage | Without Coverage |
| Under 6 Years | 6,706 (99.3%) | 51 (0.7%) |
| 6 to 18 Years | 15,200 (94.6%) | 866 (5.4%) |
| 19 to 25 Years | 18,420 (89.4%) | 2,174 (10.6%) |
| 26 to 34 Years | 10,006 (85.7%) | 1,677 (14.3%) |
| 35 to 44 Years | 10,297 (89.5%) | 1,210 (10.5%) |
| 45 to 54 Years | 11,473 (93.1%) | 853 (6.9%) |
| 55 to 64 Years | 12,082 (91.1%) | 1,178 (8.9%) |
| 65 to 74 Years | 10,494 (99.5%) | 52 (0.5%) |
| 75 Years and older | 7,781 (99.9%) | 9 (0.1%) |
| Total | 102,459 (92.7%) | 8,070 (7.3%) |
Health Insurance Coverage by Citizenship Status in Delaware County
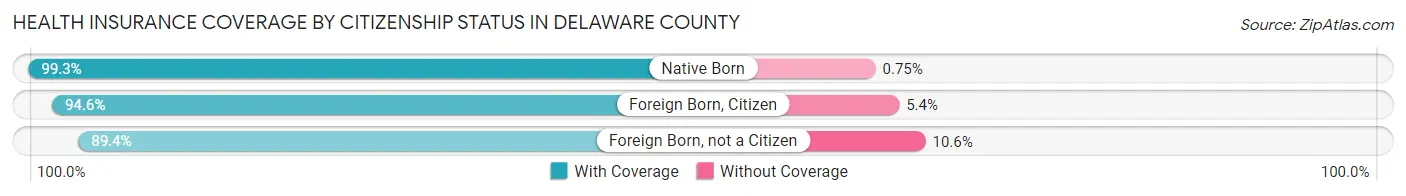
| Citizenship Status | With Coverage | Without Coverage |
| Native Born | 6,706 (99.3%) | 51 (0.7%) |
| Foreign Born, Citizen | 15,200 (94.6%) | 866 (5.4%) |
| Foreign Born, not a Citizen | 18,420 (89.4%) | 2,174 (10.6%) |
Health Insurance Coverage by Household Income in Delaware County
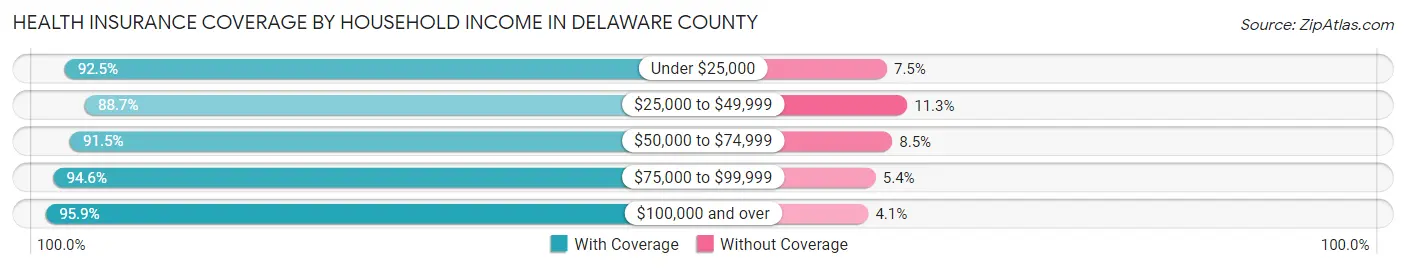
| Household Income | With Coverage | Without Coverage |
| Under $25,000 | 17,229 (92.5%) | 1,405 (7.5%) |
| $25,000 to $49,999 | 20,038 (88.7%) | 2,564 (11.3%) |
| $50,000 to $74,999 | 18,557 (91.5%) | 1,733 (8.5%) |
| $75,000 to $99,999 | 14,449 (94.6%) | 832 (5.4%) |
| $100,000 and over | 26,722 (95.9%) | 1,132 (4.1%) |
Public vs Private Health Insurance Coverage by Age in Delaware County
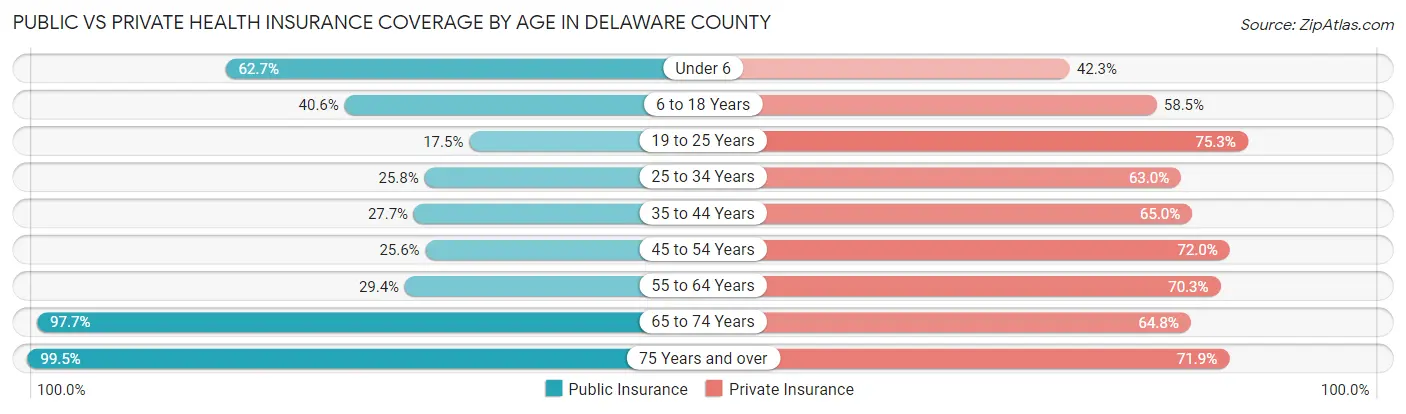
| Age Bracket | Public Insurance | Private Insurance |
| Under 6 | 4,237 (62.7%) | 2,860 (42.3%) |
| 6 to 18 Years | 6,523 (40.6%) | 9,396 (58.5%) |
| 19 to 25 Years | 3,597 (17.5%) | 15,511 (75.3%) |
| 25 to 34 Years | 3,009 (25.8%) | 7,354 (62.9%) |
| 35 to 44 Years | 3,191 (27.7%) | 7,482 (65.0%) |
| 45 to 54 Years | 3,155 (25.6%) | 8,874 (72.0%) |
| 55 to 64 Years | 3,899 (29.4%) | 9,316 (70.3%) |
| 65 to 74 Years | 10,299 (97.7%) | 6,829 (64.7%) |
| 75 Years and over | 7,749 (99.5%) | 5,599 (71.9%) |
| Total | 45,659 (41.3%) | 73,221 (66.2%) |
Disability Status by Sex by Age in Delaware County
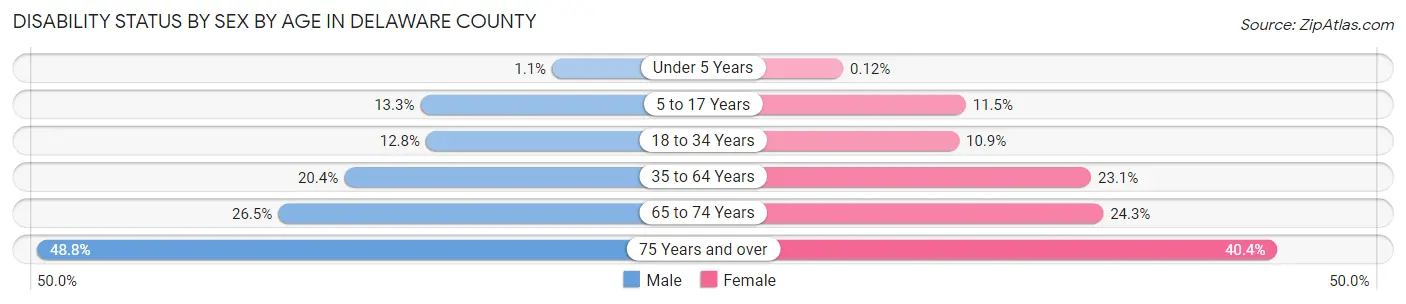
| Age Bracket | Male | Female |
| Under 5 Years | 29 (1.1%) | 3 (0.1%) |
| 5 to 17 Years | 1,010 (13.3%) | 834 (11.5%) |
| 18 to 34 Years | 2,156 (12.8%) | 1,967 (10.9%) |
| 35 to 64 Years | 3,720 (20.4%) | 4,356 (23.1%) |
| 65 to 74 Years | 1,280 (26.5%) | 1,386 (24.3%) |
| 75 Years and over | 1,582 (48.8%) | 1,839 (40.4%) |
Disability Class by Sex by Age in Delaware County
Disability Class: Hearing Difficulty
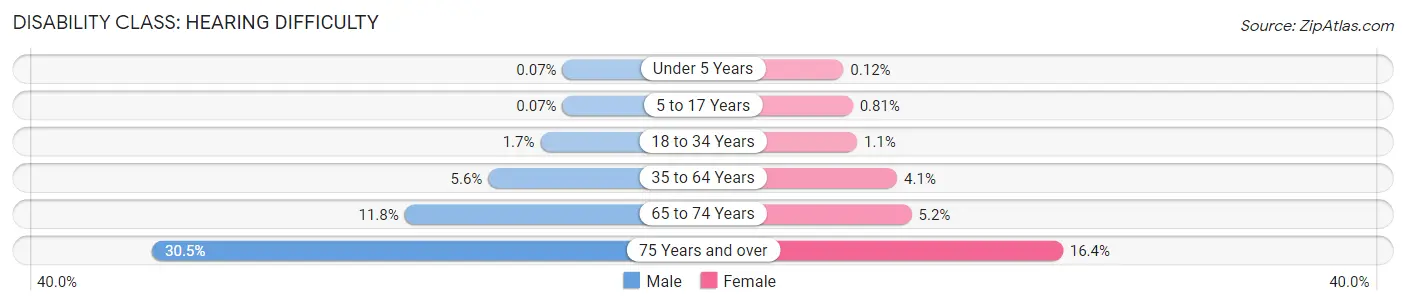
| Age Bracket | Male | Female |
| Under 5 Years | 2 (0.1%) | 3 (0.1%) |
| 5 to 17 Years | 5 (0.1%) | 59 (0.8%) |
| 18 to 34 Years | 289 (1.7%) | 204 (1.1%) |
| 35 to 64 Years | 1,020 (5.6%) | 773 (4.1%) |
| 65 to 74 Years | 570 (11.8%) | 296 (5.2%) |
| 75 Years and over | 989 (30.5%) | 747 (16.4%) |
Disability Class: Vision Difficulty
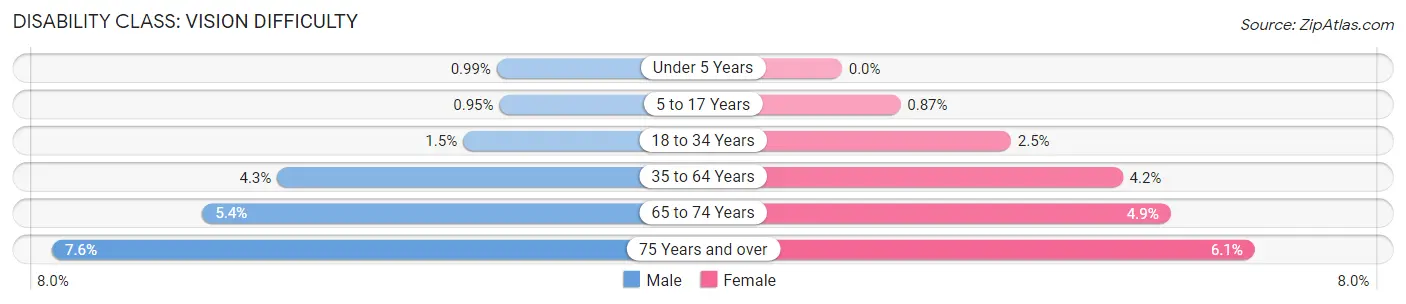
| Age Bracket | Male | Female |
| Under 5 Years | 27 (1.0%) | 0 (0.0%) |
| 5 to 17 Years | 72 (0.9%) | 63 (0.9%) |
| 18 to 34 Years | 252 (1.5%) | 453 (2.5%) |
| 35 to 64 Years | 776 (4.3%) | 784 (4.2%) |
| 65 to 74 Years | 259 (5.4%) | 279 (4.9%) |
| 75 Years and over | 246 (7.6%) | 279 (6.1%) |
Disability Class: Cognitive Difficulty
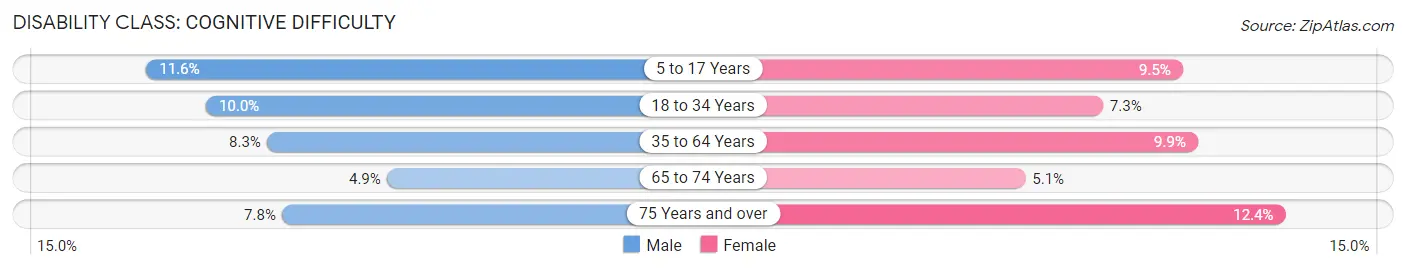
| Age Bracket | Male | Female |
| 5 to 17 Years | 883 (11.6%) | 688 (9.5%) |
| 18 to 34 Years | 1,679 (10.0%) | 1,314 (7.3%) |
| 35 to 64 Years | 1,509 (8.3%) | 1,866 (9.9%) |
| 65 to 74 Years | 238 (4.9%) | 292 (5.1%) |
| 75 Years and over | 254 (7.8%) | 562 (12.3%) |
Disability Class: Ambulatory Difficulty
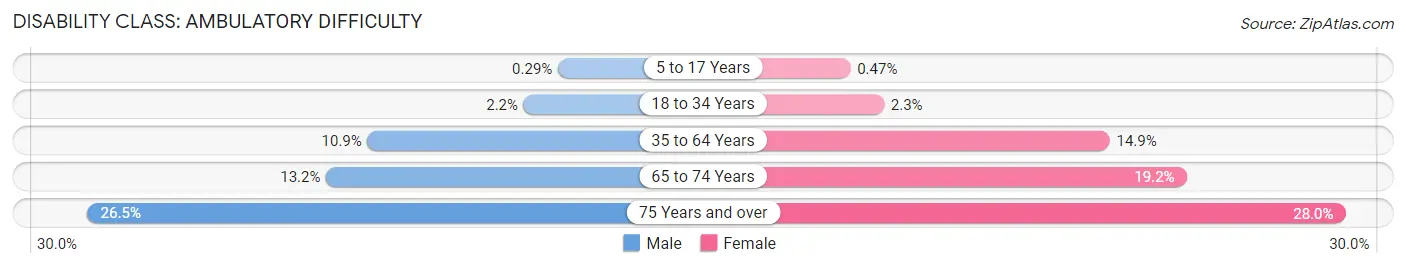
| Age Bracket | Male | Female |
| 5 to 17 Years | 22 (0.3%) | 34 (0.5%) |
| 18 to 34 Years | 371 (2.2%) | 423 (2.3%) |
| 35 to 64 Years | 1,991 (10.9%) | 2,807 (14.9%) |
| 65 to 74 Years | 638 (13.2%) | 1,096 (19.2%) |
| 75 Years and over | 858 (26.5%) | 1,276 (28.0%) |
Disability Class: Self-Care Difficulty
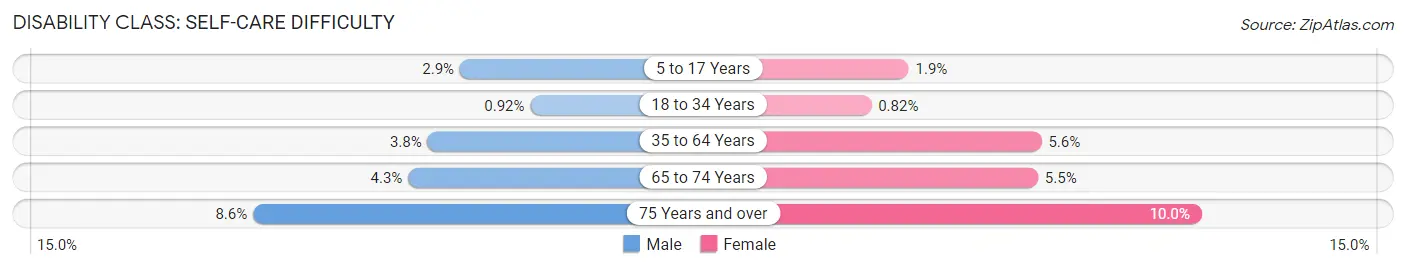
| Age Bracket | Male | Female |
| 5 to 17 Years | 219 (2.9%) | 135 (1.9%) |
| 18 to 34 Years | 155 (0.9%) | 148 (0.8%) |
| 35 to 64 Years | 690 (3.8%) | 1,046 (5.6%) |
| 65 to 74 Years | 209 (4.3%) | 312 (5.5%) |
| 75 Years and over | 280 (8.6%) | 456 (10.0%) |
Technology Access in Delaware County
Computing Device Access in Delaware County
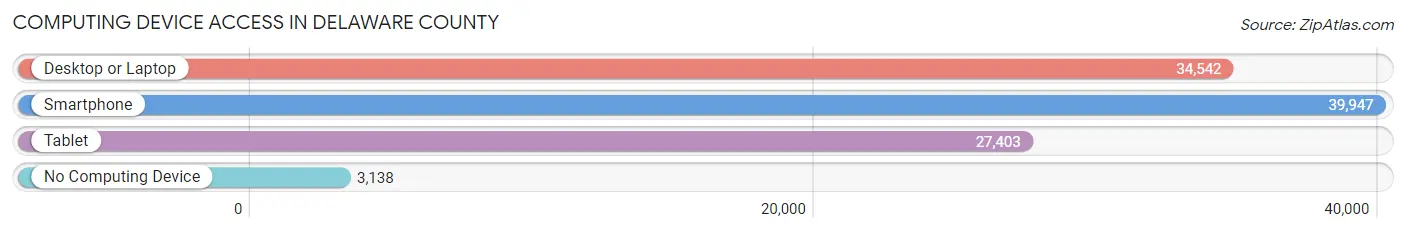
| Device Type | # Households | % Households |
| Desktop or Laptop | 34,542 | 74.8% |
| Smartphone | 39,947 | 86.5% |
| Tablet | 27,403 | 59.4% |
| No Computing Device | 3,138 | 6.8% |
| Total | 46,159 | 100.0% |
Internet Access in Delaware County
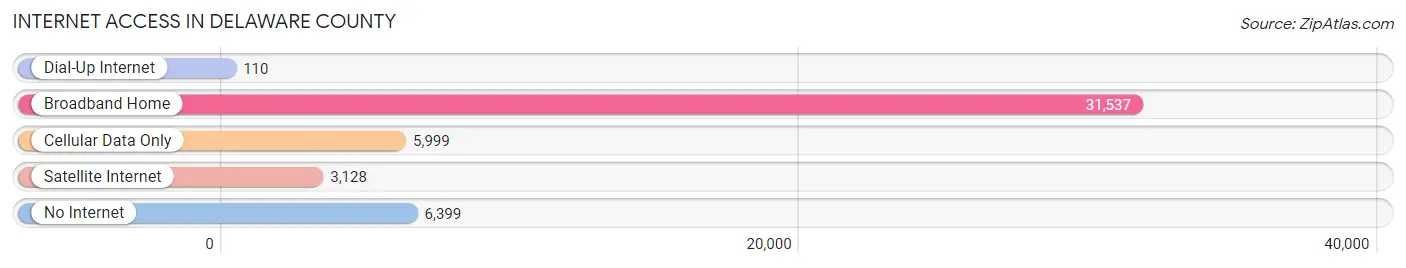
| Internet Type | # Households | % Households |
| Dial-Up Internet | 110 | 0.2% |
| Broadband Home | 31,537 | 68.3% |
| Cellular Data Only | 5,999 | 13.0% |
| Satellite Internet | 3,128 | 6.8% |
| No Internet | 6,399 | 13.9% |
| Total | 46,159 | 100.0% |
Delaware County Summary
Delaware County, Indiana is located in the east-central part of the state, and is part of the Muncie Metropolitan Statistical Area. The county was established in 1827 and named after Delaware Indians who had previously inhabited the area. The county seat is Muncie, which is also the largest city in the county.
Geography
Delaware County is located in east-central Indiana, and is bordered by Randolph, Henry, Madison, Blackford, and Jay counties. The county has a total area of 437 square miles, of which 433 square miles is land and 4.2 square miles is water. The county is mostly flat, with some rolling hills in the northern and western parts. The White River flows through the county, and there are several small lakes and ponds scattered throughout.
The county is divided into twelve townships: Center, Dale, Hamilton, Liberty, Monroe, Mount Pleasant, Niles, Perry, Salem, Union, Washington, and Yorktown. The county is also home to several small towns and unincorporated communities, including Albany, Eaton, Gaston, Selma, and Yorktown.
Economy
Delaware County has a diverse economy, with a mix of manufacturing, retail, and service industries. The county is home to several large employers, including Ball State University, Indiana Steel and Wire, and the Muncie Community Schools. The county also has a strong agricultural sector, with corn, soybeans, and wheat being the main crops.
The county has a strong tourism industry, with several attractions, including the Muncie Children's Museum, the Minnetrista Cultural Center, and the Muncie Civic Theatre. The county is also home to several wineries and breweries, as well as several golf courses.
Demographics
As of the 2010 census, Delaware County had a population of 117,671. The population was spread out, with 24.3% under the age of 18, 11.7% from 18 to 24, 25.2% from 25 to 44, 22.7% from 45 to 64, and 16.1% who were 65 years of age or older. The median age was 36.4 years.
The racial makeup of the county was 88.2% White, 8.2% African American, 0.4% Native American, 1.2% Asian, 0.1% Pacific Islander, 0.7% from other races, and 1.2% from two or more races. Hispanic or Latino of any race were 2.3% of the population.
The median income for a household in the county was $41,945, and the median income for a family was $51,919. The per capita income for the county was $20,945. About 11.2% of families and 15.3% of the population were below the poverty line, including 22.2% of those under age 18 and 6.7% of those age 65 or over.
Conclusion
Delaware County, Indiana is a diverse county with a mix of manufacturing, retail, and service industries. The county is home to several large employers, as well as a strong agricultural sector. The county also has a strong tourism industry, with several attractions and wineries. The population of the county is mostly white, with a median age of 36.4 years. The median income for a household in the county is $41,945, and the per capita income is $20,945.
Common Questions
What is the Total Population of Delaware County?
Total Population of Delaware County is 112,156.
What is the Total Male Population of Delaware County?
Total Male Population of Delaware County is 54,338.
What is the Total Female Population of Delaware County?
Total Female Population of Delaware County is 57,818.
What is the Ratio of Males per 100 Females in Delaware County?
There are 93.98 Males per 100 Females in Delaware County.
What is the Ratio of Females per 100 Males in Delaware County?
There are 106.40 Females per 100 Males in Delaware County.
What is the Median Population Age in Delaware County?
Median Population Age in Delaware County is 35.6 Years.
What is the Average Family Size in Delaware County
Average Family Size in Delaware County is 2.8 People.
What is the Average Household Size in Delaware County
Average Household Size in Delaware County is 2.3 People.
What is Per Capita Income in Delaware County?
Per Capita income in Delaware County is $28,874.
What is the Median Family Income in Delaware County?
Median Family Income in Delaware County is $68,452.
What is the Median Household income in Delaware County?
Median Household Income in Delaware County is $53,377.
What is Income or Wage Gap in Delaware County?
Income or Wage Gap in Delaware County is 33.6%.
Women in Delaware County earn 66.4 cents for every dollar earned by a man.
What is Family Income Deficit in Delaware County?
Family Income Deficit in Delaware County is $10,953.
Families that are below poverty line in Delaware County earn $10,953 less on average than the poverty threshold level.
What is Inequality or Gini Index in Delaware County?
Inequality or Gini Index in Delaware County is 0.45.
How Large is the Labor Force in Delaware County?
There are 56,400 People in the Labor Forcein in Delaware County.
What is the Percentage of People in the Labor Force in Delaware County?
59.8% of People are in the Labor Force in Delaware County.
What is the Unemployment Rate in Delaware County?
Unemployment Rate in Delaware County is 6.1%.