Dearborn County, IN
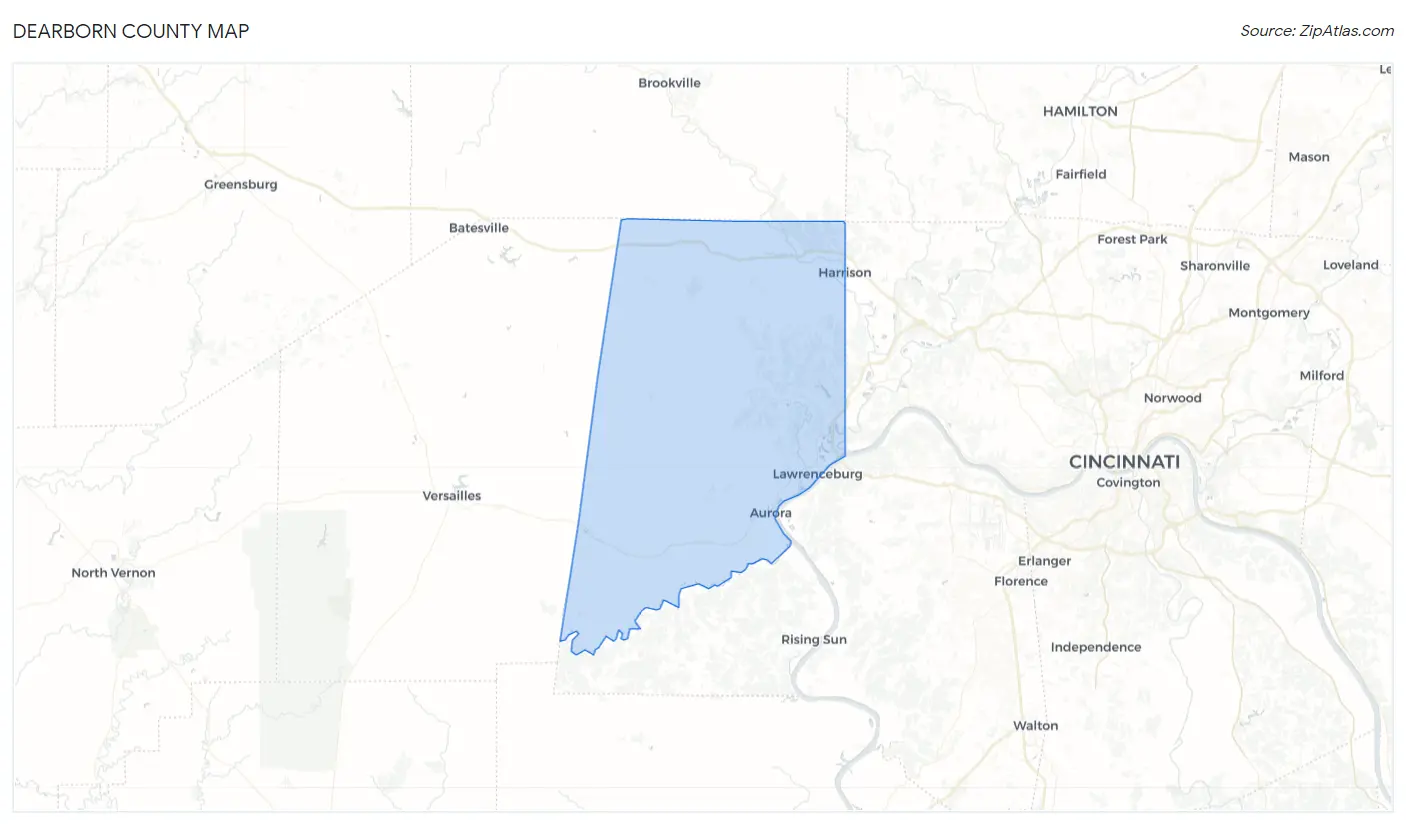
Dearborn County Map
Dearborn County Overview
50,709
TOTAL POPULATION
25,306
MALE POPULATION
25,403
FEMALE POPULATION
99.62
MALES / 100 FEMALES
100.38
FEMALES / 100 MALES
42.3
MEDIAN AGE
3.0
AVG FAMILY SIZE
2.5
AVG HOUSEHOLD SIZE
$36,005
PER CAPITA INCOME
$94,954
AVG FAMILY INCOME
$80,352
AVG HOUSEHOLD INCOME
37.8%
WAGE / INCOME GAP [ % ]
62.2¢/ $1
WAGE / INCOME GAP [ $ ]
$13,594
FAMILY INCOME DEFICIT
0.40
INEQUALITY / GINI INDEX
26,353
LABOR FORCE [ PEOPLE ]
64.3%
PERCENT IN LABOR FORCE
2.1%
UNEMPLOYMENT RATE
Dearborn County Area Codes
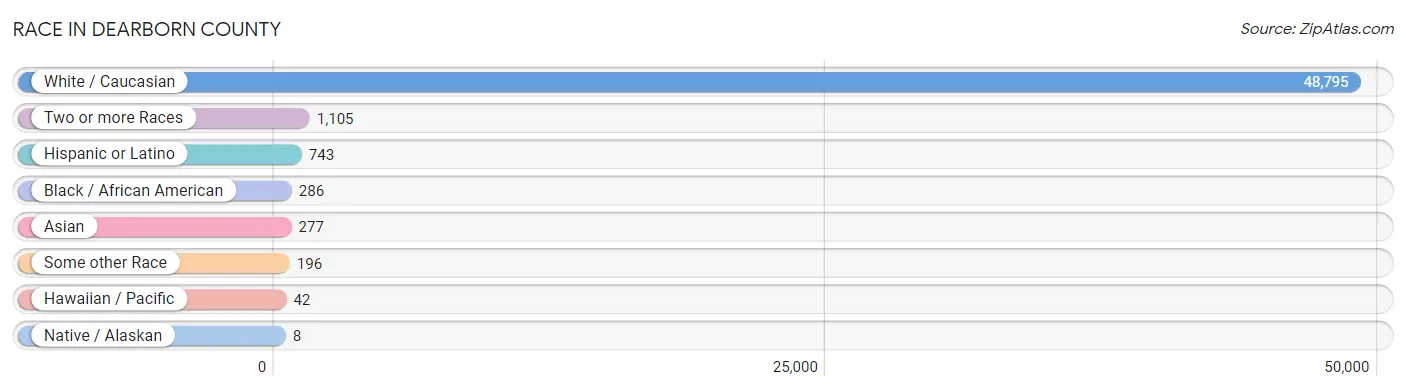
Race in Dearborn County
The most populous races in Dearborn County are White / Caucasian (48,795 | 96.2%), Two or more Races (1,105 | 2.2%), and Hispanic or Latino (743 | 1.5%).
| Race | # Population | % Population |
| Asian | 277 | 0.5% |
| Black / African American | 286 | 0.6% |
| Hawaiian / Pacific | 42 | 0.1% |
| Hispanic or Latino | 743 | 1.5% |
| Native / Alaskan | 8 | 0.0% |
| White / Caucasian | 48,795 | 96.2% |
| Two or more Races | 1,105 | 2.2% |
| Some other Race | 196 | 0.4% |
| Total | 50,709 | 100.0% |
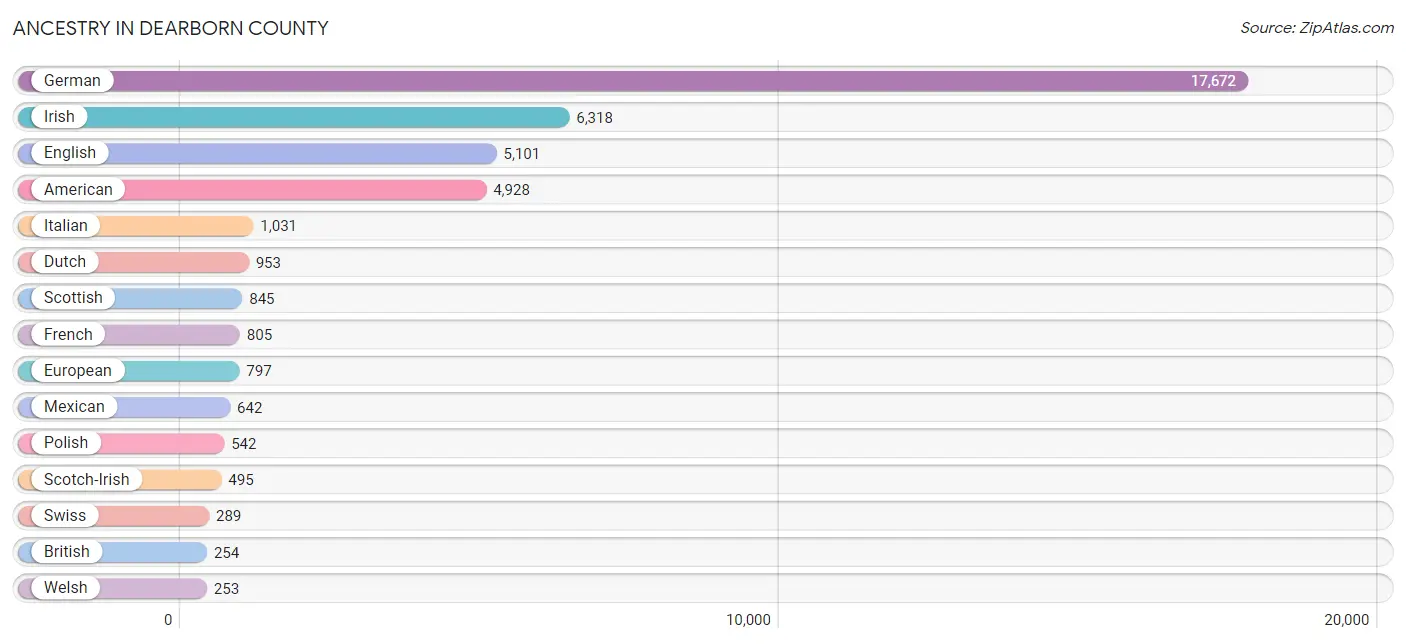
Ancestry in Dearborn County
The most populous ancestries reported in Dearborn County are German (17,672 | 34.8%), Irish (6,318 | 12.5%), English (5,101 | 10.1%), American (4,928 | 9.7%), and Italian (1,031 | 2.0%), together accounting for 69.1% of all Dearborn County residents.
| Ancestry | # Population | % Population |
| African | 3 | 0.0% |
| American | 4,928 | 9.7% |
| Apache | 6 | 0.0% |
| Arab | 232 | 0.5% |
| Arapaho | 21 | 0.0% |
| Armenian | 30 | 0.1% |
| Australian | 7 | 0.0% |
| Austrian | 161 | 0.3% |
| Belgian | 7 | 0.0% |
| Bhutanese | 13 | 0.0% |
| Blackfeet | 6 | 0.0% |
| Brazilian | 14 | 0.0% |
| British | 254 | 0.5% |
| Burmese | 3 | 0.0% |
| Canadian | 9 | 0.0% |
| Central American | 4 | 0.0% |
| Cherokee | 129 | 0.3% |
| Comanche | 3 | 0.0% |
| Czech | 9 | 0.0% |
| Czechoslovakian | 9 | 0.0% |
| Danish | 30 | 0.1% |
| Dutch | 953 | 1.9% |
| Eastern European | 65 | 0.1% |
| English | 5,101 | 10.1% |
| European | 797 | 1.6% |
| Finnish | 7 | 0.0% |
| French | 805 | 1.6% |
| French Canadian | 46 | 0.1% |
| German | 17,672 | 34.8% |
| Greek | 80 | 0.2% |
| Guatemalan | 1 | 0.0% |
| Hungarian | 34 | 0.1% |
| Indonesian | 32 | 0.1% |
| Irish | 6,318 | 12.5% |
| Italian | 1,031 | 2.0% |
| Jordanian | 17 | 0.0% |
| Korean | 21 | 0.0% |
| Lebanese | 125 | 0.3% |
| Lithuanian | 13 | 0.0% |
| Mexican | 642 | 1.3% |
| Native Hawaiian | 144 | 0.3% |
| Northern European | 18 | 0.0% |
| Norwegian | 248 | 0.5% |
| Pakistani | 6 | 0.0% |
| Peruvian | 24 | 0.1% |
| Polish | 542 | 1.1% |
| Portuguese | 6 | 0.0% |
| Puerto Rican | 31 | 0.1% |
| Russian | 164 | 0.3% |
| Salvadoran | 3 | 0.0% |
| Scandinavian | 121 | 0.2% |
| Scotch-Irish | 495 | 1.0% |
| Scottish | 845 | 1.7% |
| Serbian | 51 | 0.1% |
| Sioux | 3 | 0.0% |
| South American | 24 | 0.1% |
| Spaniard | 6 | 0.0% |
| Spanish | 7 | 0.0% |
| Sri Lankan | 163 | 0.3% |
| Subsaharan African | 3 | 0.0% |
| Swedish | 163 | 0.3% |
| Swiss | 289 | 0.6% |
| Thai | 66 | 0.1% |
| Ukrainian | 3 | 0.0% |
| Welsh | 253 | 0.5% | View All 65 Rows |
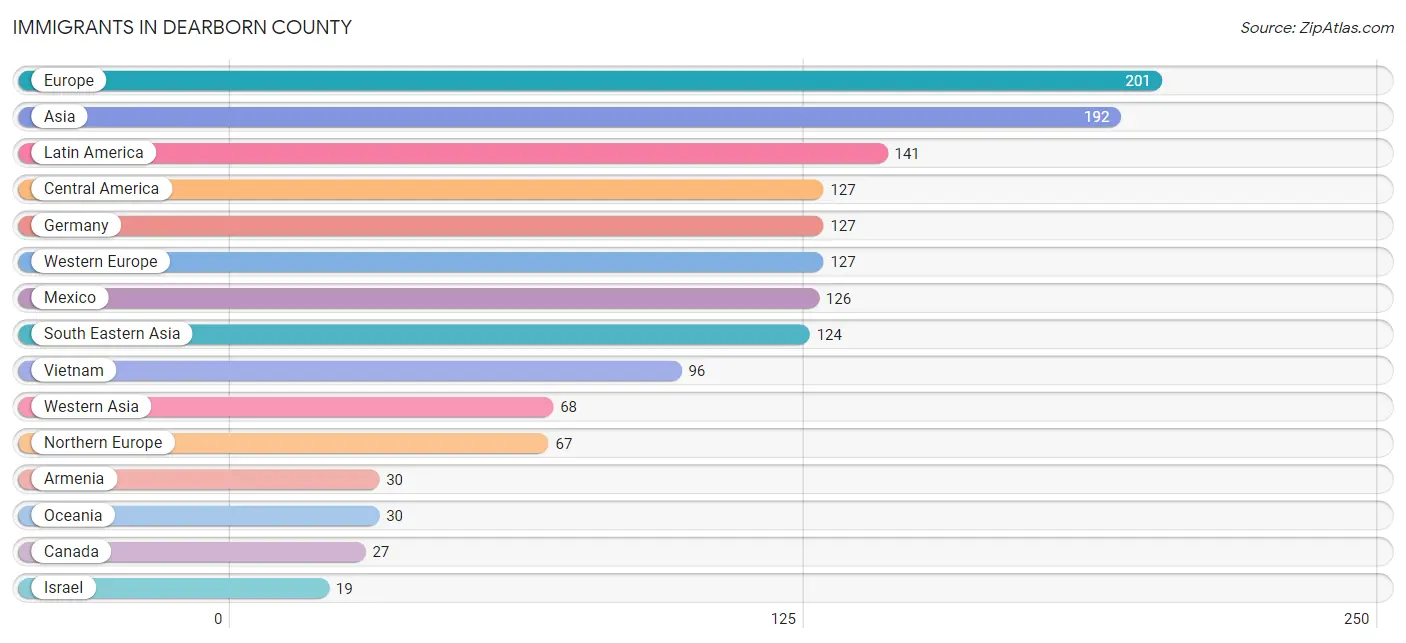
Immigrants in Dearborn County
The most numerous immigrant groups reported in Dearborn County came from Europe (201 | 0.4%), Asia (192 | 0.4%), Latin America (141 | 0.3%), Central America (127 | 0.3%), and Germany (127 | 0.3%), together accounting for 1.6% of all Dearborn County residents.
| Immigration Origin | # Population | % Population |
| Africa | 12 | 0.0% |
| Armenia | 30 | 0.1% |
| Asia | 192 | 0.4% |
| Brazil | 14 | 0.0% |
| Canada | 27 | 0.1% |
| Central America | 127 | 0.3% |
| Denmark | 2 | 0.0% |
| Eastern Europe | 7 | 0.0% |
| Europe | 201 | 0.4% |
| Germany | 127 | 0.3% |
| Guatemala | 1 | 0.0% |
| Israel | 19 | 0.0% |
| Jordan | 17 | 0.0% |
| Latin America | 141 | 0.3% |
| Mexico | 126 | 0.3% |
| Northern Europe | 67 | 0.1% |
| Oceania | 30 | 0.1% |
| Philippines | 11 | 0.0% |
| Russia | 7 | 0.0% |
| South Africa | 12 | 0.0% |
| South America | 14 | 0.0% |
| South Eastern Asia | 124 | 0.2% |
| Thailand | 5 | 0.0% |
| Vietnam | 96 | 0.2% |
| Western Asia | 68 | 0.1% |
| Western Europe | 127 | 0.3% | View All 26 Rows |
Sex and Age in Dearborn County
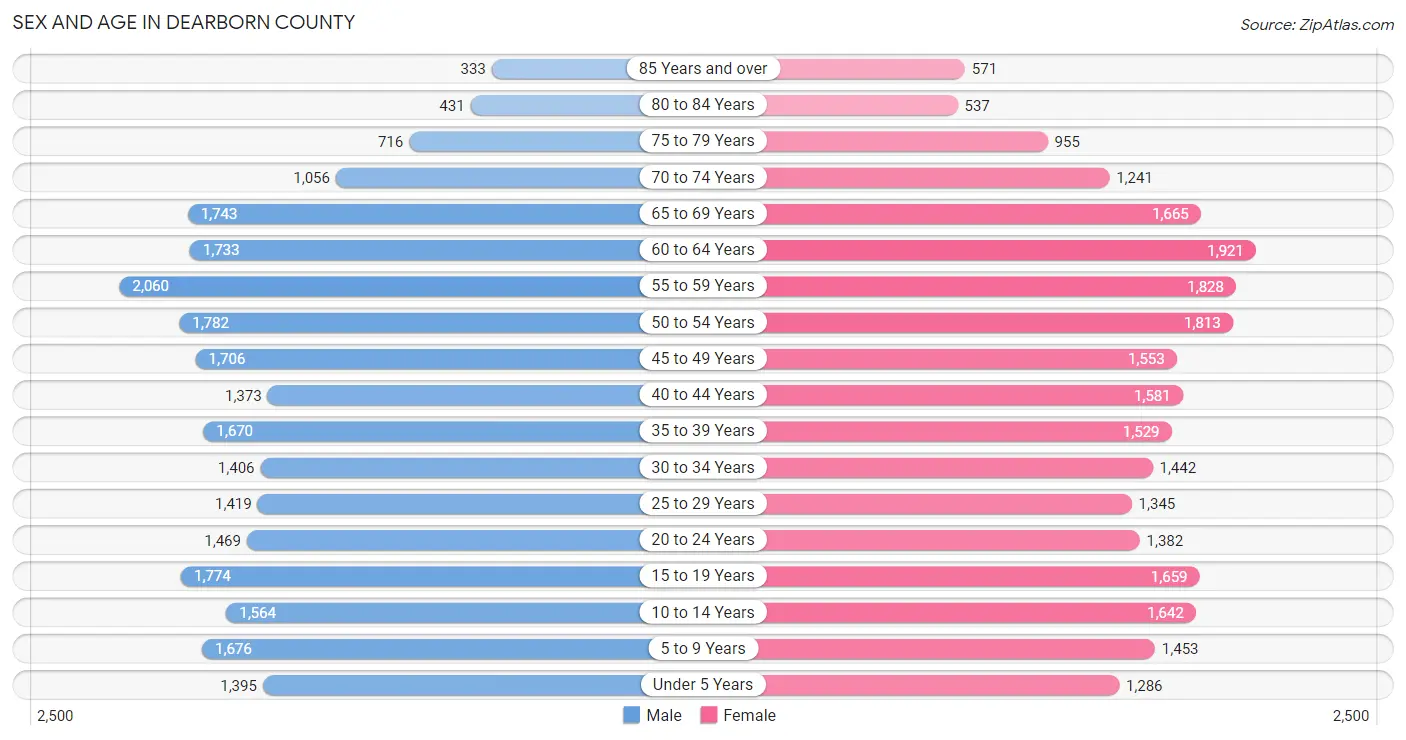
Sex and Age in Dearborn County
The most populous age groups in Dearborn County are 55 to 59 Years (2,060 | 8.1%) for men and 60 to 64 Years (1,921 | 7.6%) for women.
| Age Bracket | Male | Female |
| Under 5 Years | 1,395 (5.5%) | 1,286 (5.1%) |
| 5 to 9 Years | 1,676 (6.6%) | 1,453 (5.7%) |
| 10 to 14 Years | 1,564 (6.2%) | 1,642 (6.5%) |
| 15 to 19 Years | 1,774 (7.0%) | 1,659 (6.5%) |
| 20 to 24 Years | 1,469 (5.8%) | 1,382 (5.4%) |
| 25 to 29 Years | 1,419 (5.6%) | 1,345 (5.3%) |
| 30 to 34 Years | 1,406 (5.6%) | 1,442 (5.7%) |
| 35 to 39 Years | 1,670 (6.6%) | 1,529 (6.0%) |
| 40 to 44 Years | 1,373 (5.4%) | 1,581 (6.2%) |
| 45 to 49 Years | 1,706 (6.7%) | 1,553 (6.1%) |
| 50 to 54 Years | 1,782 (7.0%) | 1,813 (7.1%) |
| 55 to 59 Years | 2,060 (8.1%) | 1,828 (7.2%) |
| 60 to 64 Years | 1,733 (6.9%) | 1,921 (7.6%) |
| 65 to 69 Years | 1,743 (6.9%) | 1,665 (6.6%) |
| 70 to 74 Years | 1,056 (4.2%) | 1,241 (4.9%) |
| 75 to 79 Years | 716 (2.8%) | 955 (3.8%) |
| 80 to 84 Years | 431 (1.7%) | 537 (2.1%) |
| 85 Years and over | 333 (1.3%) | 571 (2.2%) |
| Total | 25,306 (100.0%) | 25,403 (100.0%) |
Families and Households in Dearborn County
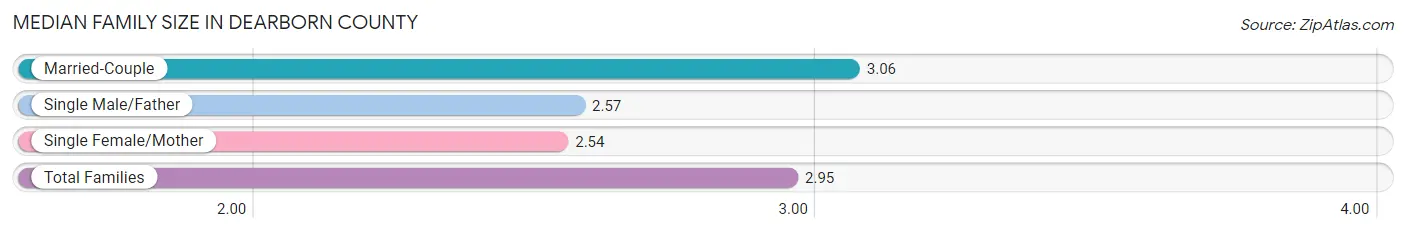
Median Family Size in Dearborn County
The median family size in Dearborn County is 2.95 persons per family, with married-couple families (11,277 | 78.8%) accounting for the largest median family size of 3.06 persons per family. On the other hand, single female/mother families (1,953 | 13.7%) represent the smallest median family size with 2.54 persons per family.
| Family Type | # Families | Family Size |
| Married-Couple | 11,277 (78.8%) | 3.06 |
| Single Male/Father | 1,079 (7.5%) | 2.57 |
| Single Female/Mother | 1,953 (13.7%) | 2.54 |
| Total Families | 14,309 (100.0%) | 2.95 |
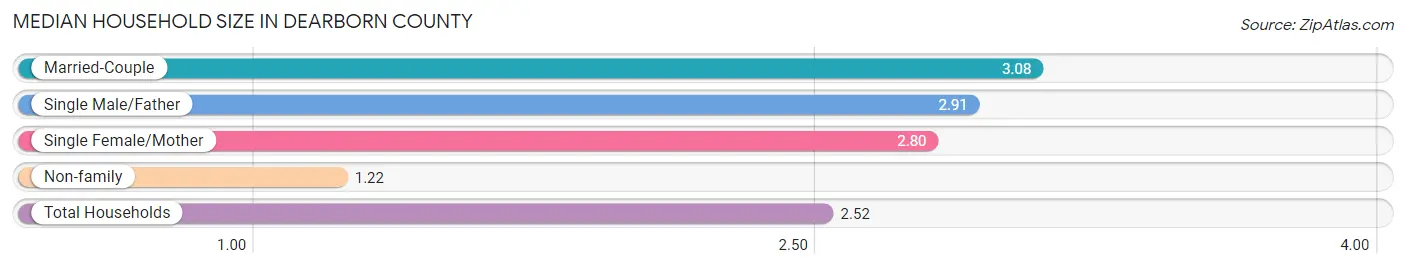
Median Household Size in Dearborn County
The median household size in Dearborn County is 2.52 persons per household, with married-couple households (11,277 | 56.6%) accounting for the largest median household size of 3.08 persons per household. non-family households (5,606 | 28.1%) represent the smallest median household size with 1.22 persons per household.
| Household Type | # Households | Household Size |
| Married-Couple | 11,277 (56.6%) | 3.08 |
| Single Male/Father | 1,079 (5.4%) | 2.91 |
| Single Female/Mother | 1,953 (9.8%) | 2.80 |
| Non-family | 5,606 (28.1%) | 1.22 |
| Total Households | 19,915 (100.0%) | 2.52 |
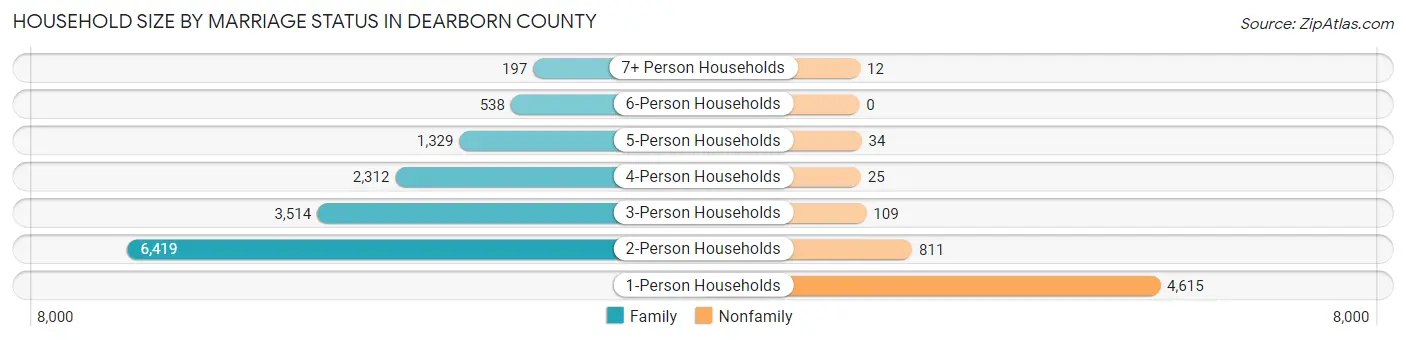
Household Size by Marriage Status in Dearborn County
Out of a total of 19,915 households in Dearborn County, 14,309 (71.9%) are family households, while 5,606 (28.1%) are nonfamily households. The most numerous type of family households are 2-person households, comprising 6,419, and the most common type of nonfamily households are 1-person households, comprising 4,615.
| Household Size | Family Households | Nonfamily Households |
| 1-Person Households | - | 4,615 (23.2%) |
| 2-Person Households | 6,419 (32.2%) | 811 (4.1%) |
| 3-Person Households | 3,514 (17.6%) | 109 (0.5%) |
| 4-Person Households | 2,312 (11.6%) | 25 (0.1%) |
| 5-Person Households | 1,329 (6.7%) | 34 (0.2%) |
| 6-Person Households | 538 (2.7%) | 0 (0.0%) |
| 7+ Person Households | 197 (1.0%) | 12 (0.1%) |
| Total | 14,309 (71.9%) | 5,606 (28.1%) |
Female Fertility in Dearborn County
Fertility by Age in Dearborn County
Average fertility rate in Dearborn County is 46.0 births per 1,000 women. Women in the age bracket of 20 to 34 years have the highest fertility rate with 76.0 births per 1,000 women. Women in the age bracket of 20 to 34 years acount for 63.3% of all women with births.
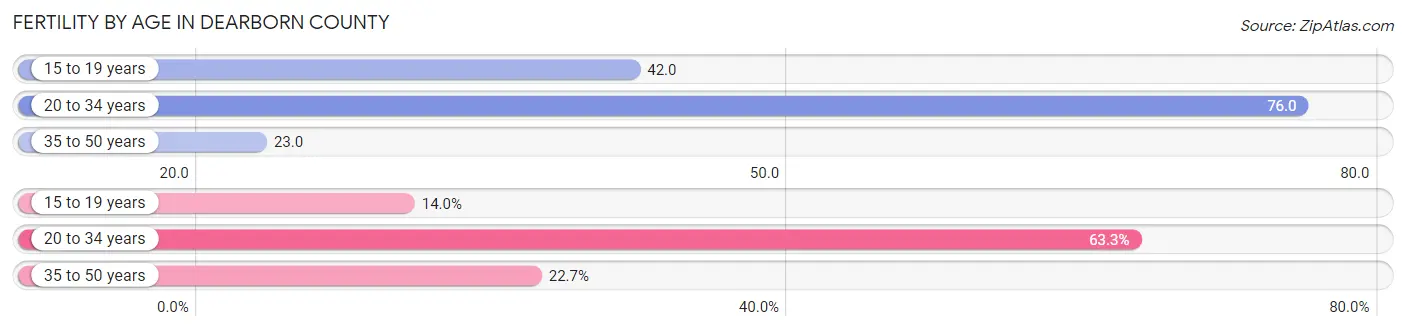
| Age Bracket | Women with Births | Births / 1,000 Women |
| 15 to 19 years | 70 (14.0%) | 42.0 |
| 20 to 34 years | 316 (63.3%) | 76.0 |
| 35 to 50 years | 113 (22.7%) | 23.0 |
| Total | 499 (100.0%) | 46.0 |
Fertility by Age by Marriage Status in Dearborn County
59.5% of women with births (499) in Dearborn County are married. The highest percentage of unmarried women with births falls into 15 to 19 years age bracket with 100.0% of them unmarried at the time of birth, while the lowest percentage of unmarried women with births belong to 35 to 50 years age bracket with 24.8% of them unmarried.
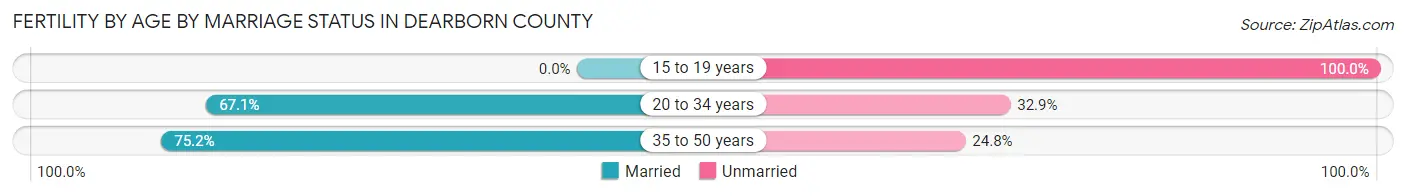
| Age Bracket | Married | Unmarried |
| 15 to 19 years | 0 (0.0%) | 70 (100.0%) |
| 20 to 34 years | 212 (67.1%) | 104 (32.9%) |
| 35 to 50 years | 85 (75.2%) | 28 (24.8%) |
| Total | 297 (59.5%) | 202 (40.5%) |
Fertility by Education in Dearborn County
Average fertility rate in Dearborn County is 46.0 births per 1,000 women. Women with the education attainment of bachelor's degree have the highest fertility rate of 78.0 births per 1,000 women, while women with the education attainment of less than high school have the lowest fertility at 17.0 births per 1,000 women. Women with the education attainment of bachelor's degree represent 33.1% of all women with births.
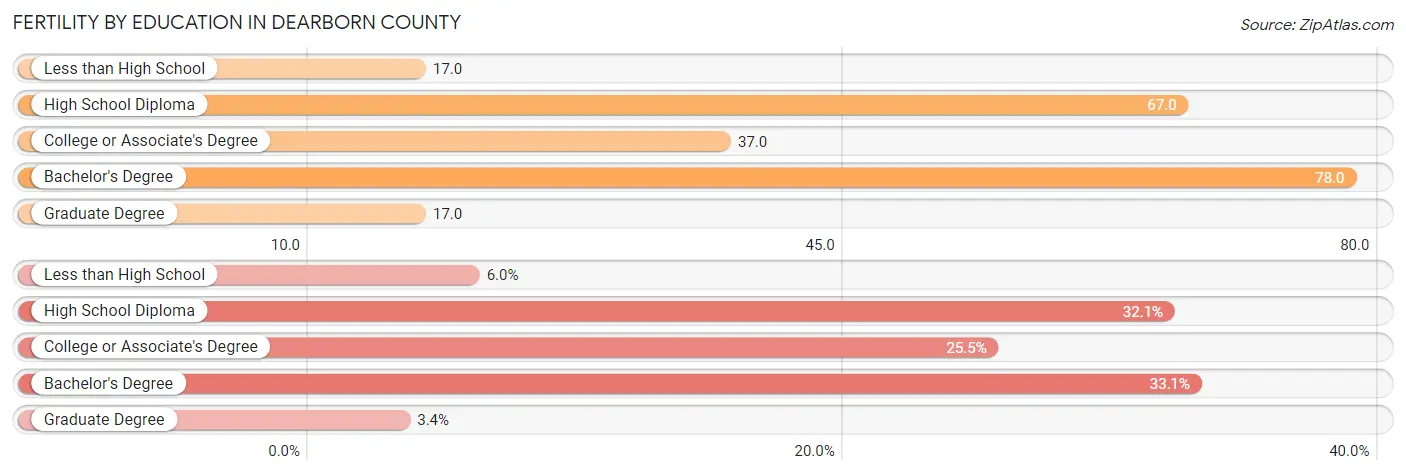
| Educational Attainment | Women with Births | Births / 1,000 Women |
| Less than High School | 30 (6.0%) | 17.0 |
| High School Diploma | 160 (32.1%) | 67.0 |
| College or Associate's Degree | 127 (25.5%) | 37.0 |
| Bachelor's Degree | 165 (33.1%) | 78.0 |
| Graduate Degree | 17 (3.4%) | 17.0 |
| Total | 499 (100.0%) | 46.0 |
Fertility by Education by Marriage Status in Dearborn County
40.5% of women with births in Dearborn County are unmarried. Women with the educational attainment of bachelor's degree are most likely to be married with 100.0% of them married at childbirth, while women with the educational attainment of high school diploma are least likely to be married with 84.4% of them unmarried at childbirth.
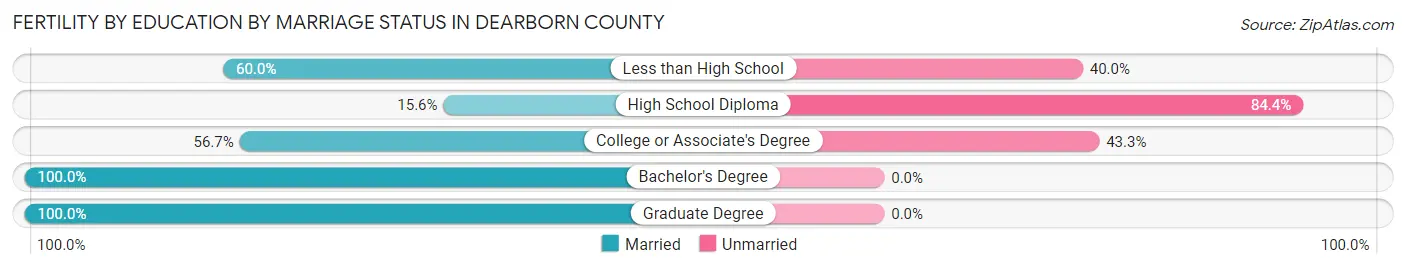
| Educational Attainment | Married | Unmarried |
| Less than High School | 18 (60.0%) | 12 (40.0%) |
| High School Diploma | 25 (15.6%) | 135 (84.4%) |
| College or Associate's Degree | 72 (56.7%) | 55 (43.3%) |
| Bachelor's Degree | 165 (100.0%) | 0 (0.0%) |
| Graduate Degree | 17 (100.0%) | 0 (0.0%) |
| Total | 297 (59.5%) | 202 (40.5%) |
Income in Dearborn County
Income Overview in Dearborn County
Per Capita Income in Dearborn County is $36,005, while median incomes of families and households are $94,954 and $80,352 respectively.
| Characteristic | Number | Measure |
| Per Capita Income | 50,709 | $36,005 |
| Median Family Income | 14,309 | $94,954 |
| Mean Family Income | 14,309 | $104,450 |
| Median Household Income | 19,915 | $80,352 |
| Mean Household Income | 19,915 | $91,881 |
| Income Deficit | 14,309 | $13,594 |
| Wage / Income Gap (%) | 50,709 | 37.83% |
| Wage / Income Gap ($) | 50,709 | 62.17¢ per $1 |
| Gini / Inequality Index | 50,709 | 0.40 |
Earnings by Sex in Dearborn County
Average Earnings in Dearborn County are $43,530, $53,521 for men and $33,275 for women, a difference of 37.8%.
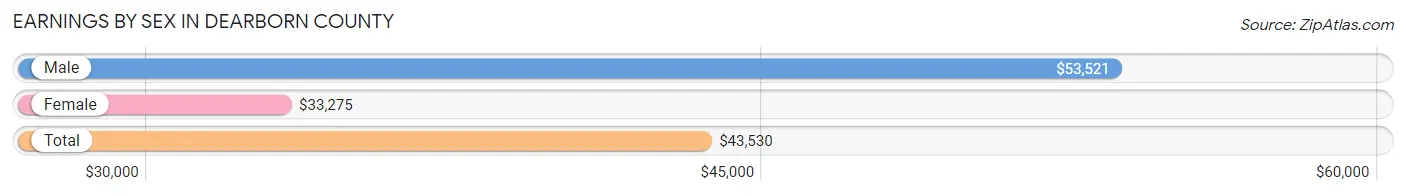
| Sex | Number | Average Earnings |
| Male | 14,759 (52.7%) | $53,521 |
| Female | 13,238 (47.3%) | $33,275 |
| Total | 27,997 (100.0%) | $43,530 |
Earnings by Sex by Income Bracket in Dearborn County
The most common earnings brackets in Dearborn County are $100,000+ for men (2,270 | 15.4%) and $75,000 to $99,999 for women (1,128 | 8.5%).
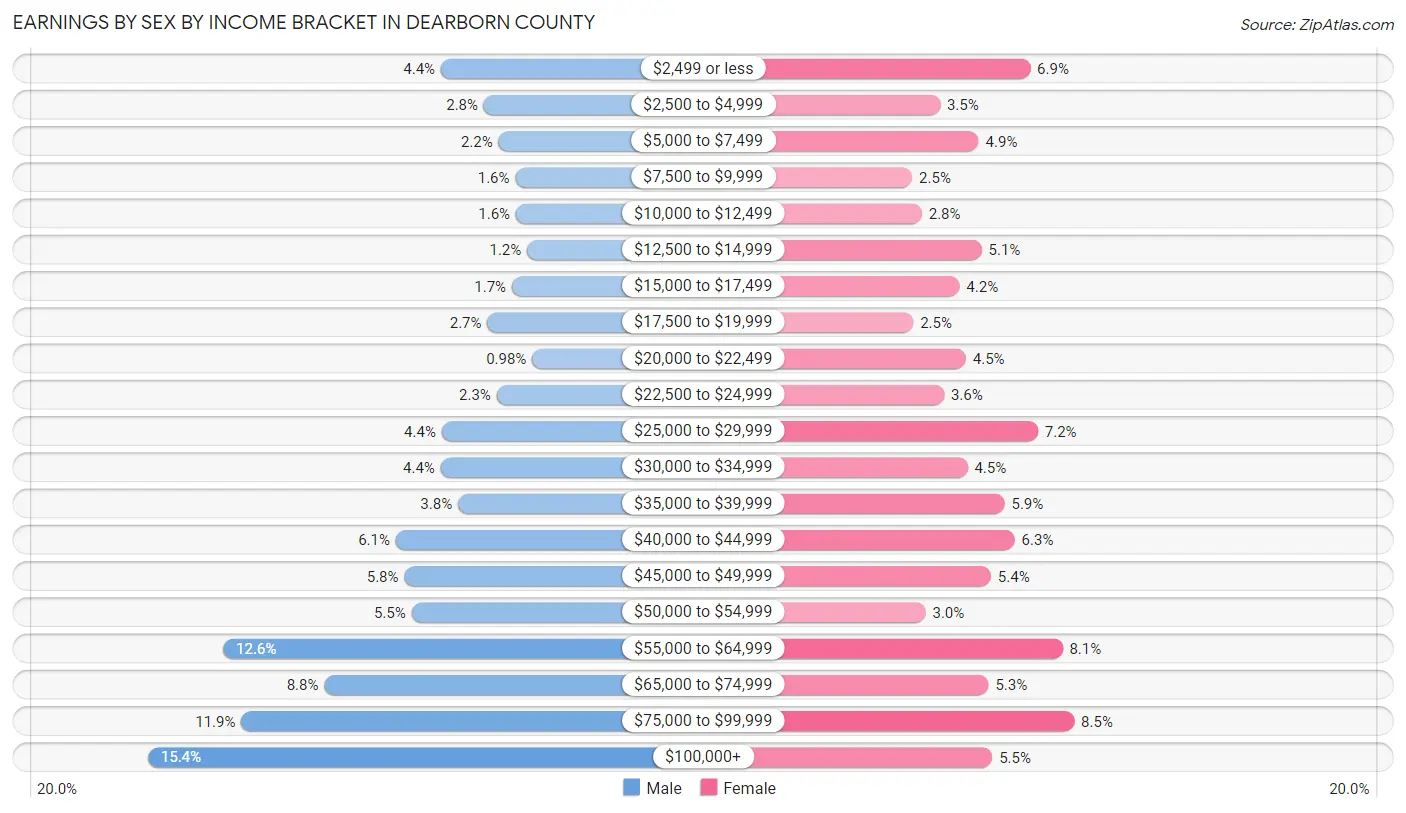
| Income | Male | Female |
| $2,499 or less | 650 (4.4%) | 909 (6.9%) |
| $2,500 to $4,999 | 412 (2.8%) | 462 (3.5%) |
| $5,000 to $7,499 | 330 (2.2%) | 654 (4.9%) |
| $7,500 to $9,999 | 237 (1.6%) | 324 (2.5%) |
| $10,000 to $12,499 | 235 (1.6%) | 372 (2.8%) |
| $12,500 to $14,999 | 173 (1.2%) | 668 (5.1%) |
| $15,000 to $17,499 | 257 (1.7%) | 559 (4.2%) |
| $17,500 to $19,999 | 392 (2.7%) | 329 (2.5%) |
| $20,000 to $22,499 | 145 (1.0%) | 590 (4.5%) |
| $22,500 to $24,999 | 341 (2.3%) | 482 (3.6%) |
| $25,000 to $29,999 | 645 (4.4%) | 948 (7.2%) |
| $30,000 to $34,999 | 651 (4.4%) | 598 (4.5%) |
| $35,000 to $39,999 | 555 (3.8%) | 783 (5.9%) |
| $40,000 to $44,999 | 899 (6.1%) | 833 (6.3%) |
| $45,000 to $49,999 | 852 (5.8%) | 715 (5.4%) |
| $50,000 to $54,999 | 812 (5.5%) | 390 (2.9%) |
| $55,000 to $64,999 | 1,854 (12.6%) | 1,069 (8.1%) |
| $65,000 to $74,999 | 1,295 (8.8%) | 703 (5.3%) |
| $75,000 to $99,999 | 1,754 (11.9%) | 1,128 (8.5%) |
| $100,000+ | 2,270 (15.4%) | 722 (5.4%) |
| Total | 14,759 (100.0%) | 13,238 (100.0%) |
Earnings by Sex by Educational Attainment in Dearborn County
Average earnings in Dearborn County are $58,611 for men and $38,926 for women, a difference of 33.6%. Men with an educational attainment of bachelor's degree enjoy the highest average annual earnings of $78,988, while those with less than high school education earn the least with $40,632. Women with an educational attainment of graduate degree earn the most with the average annual earnings of $74,363, while those with less than high school education have the smallest earnings of $21,157.
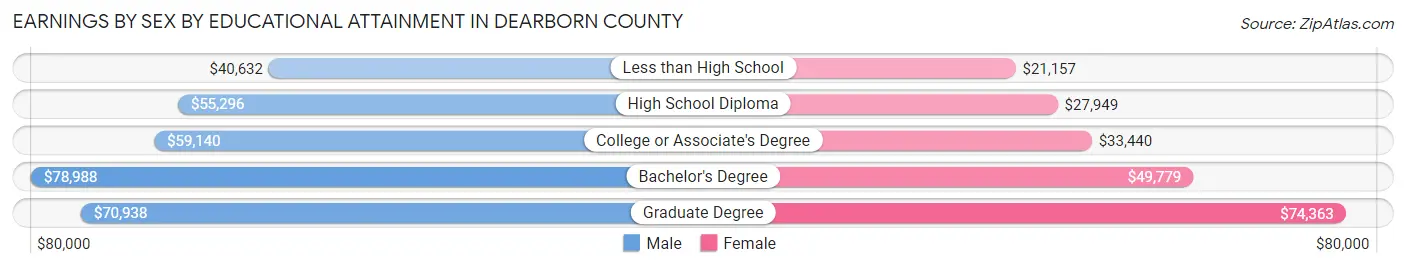
| Educational Attainment | Male Income | Female Income |
| Less than High School | $40,632 | $21,157 |
| High School Diploma | $55,296 | $27,949 |
| College or Associate's Degree | $59,140 | $33,440 |
| Bachelor's Degree | $78,988 | $49,779 |
| Graduate Degree | $70,938 | $74,363 |
| Total | $58,611 | $38,926 |
Family Income in Dearborn County
Family Income Brackets in Dearborn County
According to the Dearborn County family income data, there are 3,821 families falling into the $100,000 to $149,999 income range, which is the most common income bracket and makes up 26.7% of all families. Conversely, the $10,000 to $14,999 income bracket is the least frequent group with only 143 families (1.0%) belonging to this category.
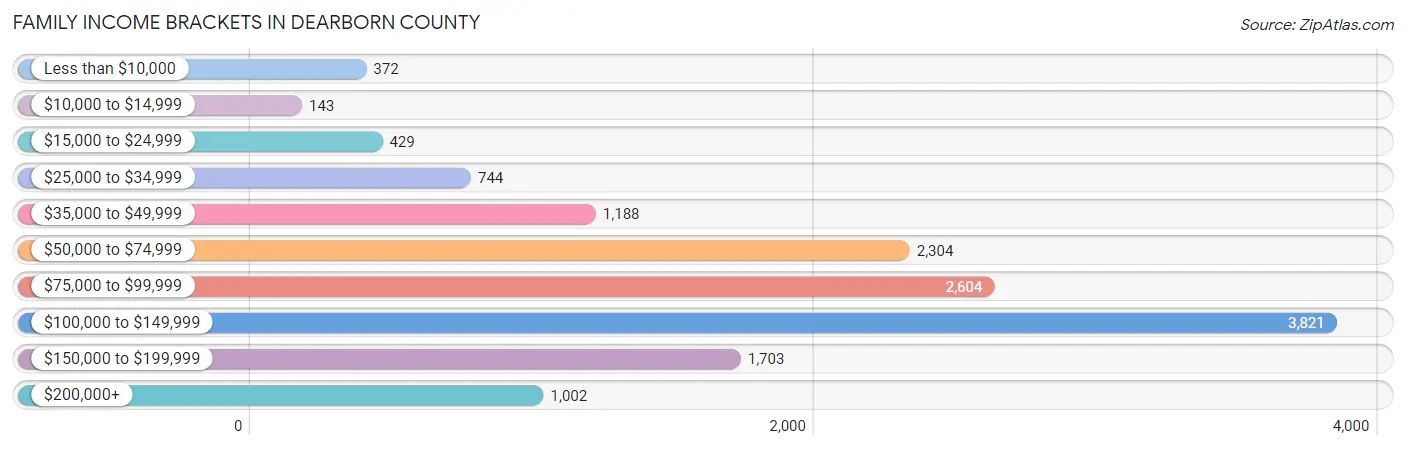
| Income Bracket | # Families | % Families |
| Less than $10,000 | 372 | 2.6% |
| $10,000 to $14,999 | 143 | 1.0% |
| $15,000 to $24,999 | 429 | 3.0% |
| $25,000 to $34,999 | 744 | 5.2% |
| $35,000 to $49,999 | 1,188 | 8.3% |
| $50,000 to $74,999 | 2,304 | 16.1% |
| $75,000 to $99,999 | 2,604 | 18.2% |
| $100,000 to $149,999 | 3,821 | 26.7% |
| $150,000 to $199,999 | 1,703 | 11.9% |
| $200,000+ | 1,002 | 7.0% |
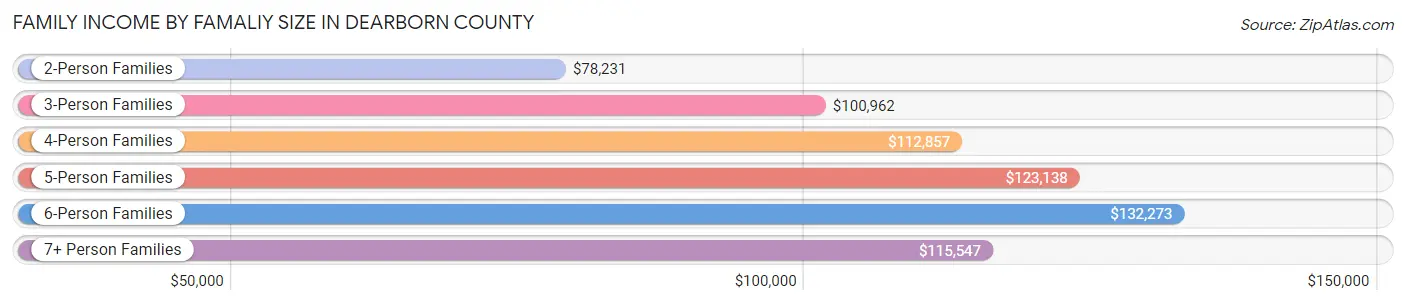
Family Income by Famaliy Size in Dearborn County
6-person families (512 | 3.6%) account for the highest median family income in Dearborn County with $132,273 per family, while 2-person families (6,951 | 48.6%) have the highest median income of $39,116 per family member.
| Income Bracket | # Families | Median Income |
| 2-Person Families | 6,951 (48.6%) | $78,231 |
| 3-Person Families | 3,246 (22.7%) | $100,962 |
| 4-Person Families | 2,226 (15.6%) | $112,857 |
| 5-Person Families | 1,199 (8.4%) | $123,138 |
| 6-Person Families | 512 (3.6%) | $132,273 |
| 7+ Person Families | 175 (1.2%) | $115,547 |
| Total | 14,309 (100.0%) | $94,954 |
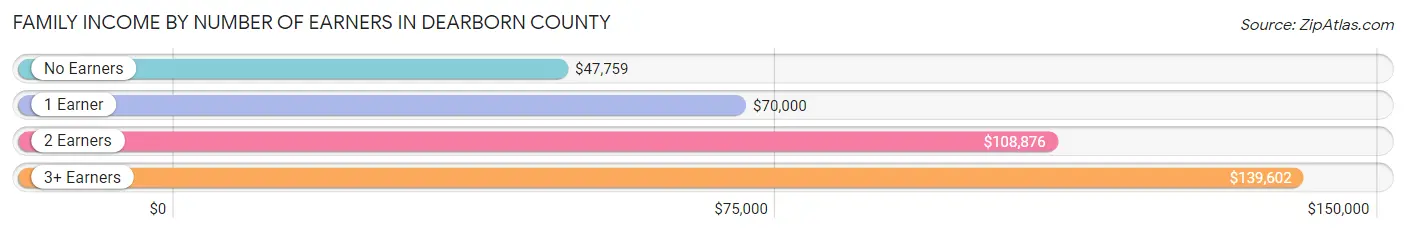
Family Income by Number of Earners in Dearborn County
The median family income in Dearborn County is $94,954, with families comprising 3+ earners (2,105) having the highest median family income of $139,602, while families with no earners (2,350) have the lowest median family income of $47,759, accounting for 14.7% and 16.4% of families, respectively.
| Number of Earners | # Families | Median Income |
| No Earners | 2,350 (16.4%) | $47,759 |
| 1 Earner | 3,708 (25.9%) | $70,000 |
| 2 Earners | 6,146 (42.9%) | $108,876 |
| 3+ Earners | 2,105 (14.7%) | $139,602 |
| Total | 14,309 (100.0%) | $94,954 |
Household Income in Dearborn County
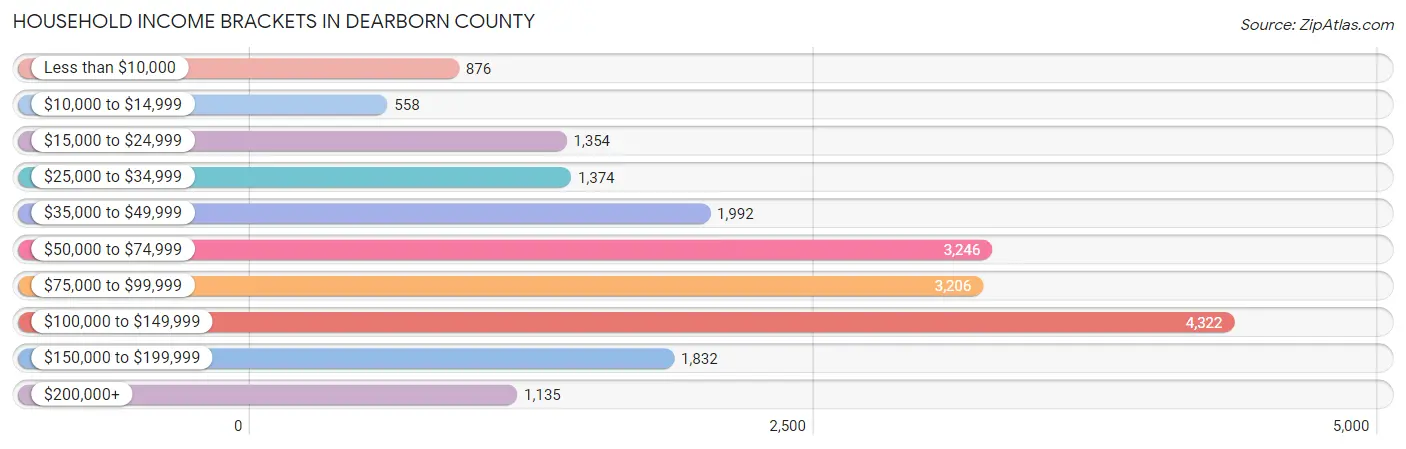
Household Income Brackets in Dearborn County
With 4,322 households falling in the category, the $100,000 to $149,999 income range is the most frequent in Dearborn County, accounting for 21.7% of all households. In contrast, only 558 households (2.8%) fall into the $10,000 to $14,999 income bracket, making it the least populous group.
| Income Bracket | # Households | % Households |
| Less than $10,000 | 876 | 4.4% |
| $10,000 to $14,999 | 558 | 2.8% |
| $15,000 to $24,999 | 1,354 | 6.8% |
| $25,000 to $34,999 | 1,374 | 6.9% |
| $35,000 to $49,999 | 1,992 | 10.0% |
| $50,000 to $74,999 | 3,246 | 16.3% |
| $75,000 to $99,999 | 3,206 | 16.1% |
| $100,000 to $149,999 | 4,322 | 21.7% |
| $150,000 to $199,999 | 1,832 | 9.2% |
| $200,000+ | 1,135 | 5.7% |
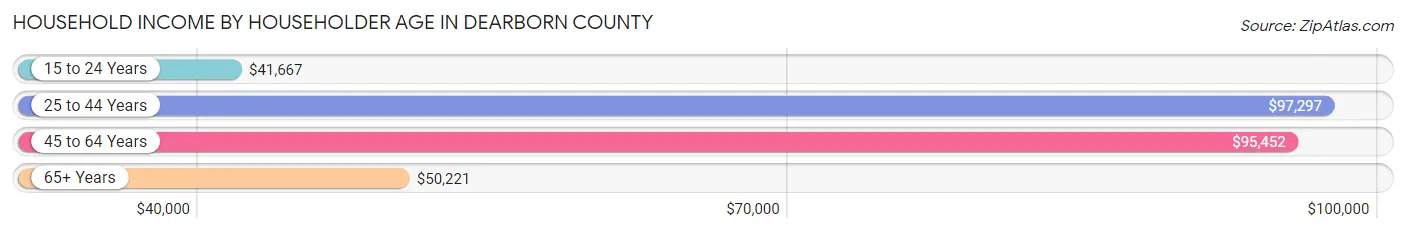
Household Income by Householder Age in Dearborn County
The median household income in Dearborn County is $80,352, with the highest median household income of $97,297 found in the 25 to 44 years age bracket for the primary householder. A total of 5,670 households (28.5%) fall into this category. Meanwhile, the 15 to 24 years age bracket for the primary householder has the lowest median household income of $41,667, with 522 households (2.6%) in this group.
| Income Bracket | # Households | Median Income |
| 15 to 24 Years | 522 (2.6%) | $41,667 |
| 25 to 44 Years | 5,670 (28.5%) | $97,297 |
| 45 to 64 Years | 7,813 (39.2%) | $95,452 |
| 65+ Years | 5,910 (29.7%) | $50,221 |
| Total | 19,915 (100.0%) | $80,352 |
Poverty in Dearborn County
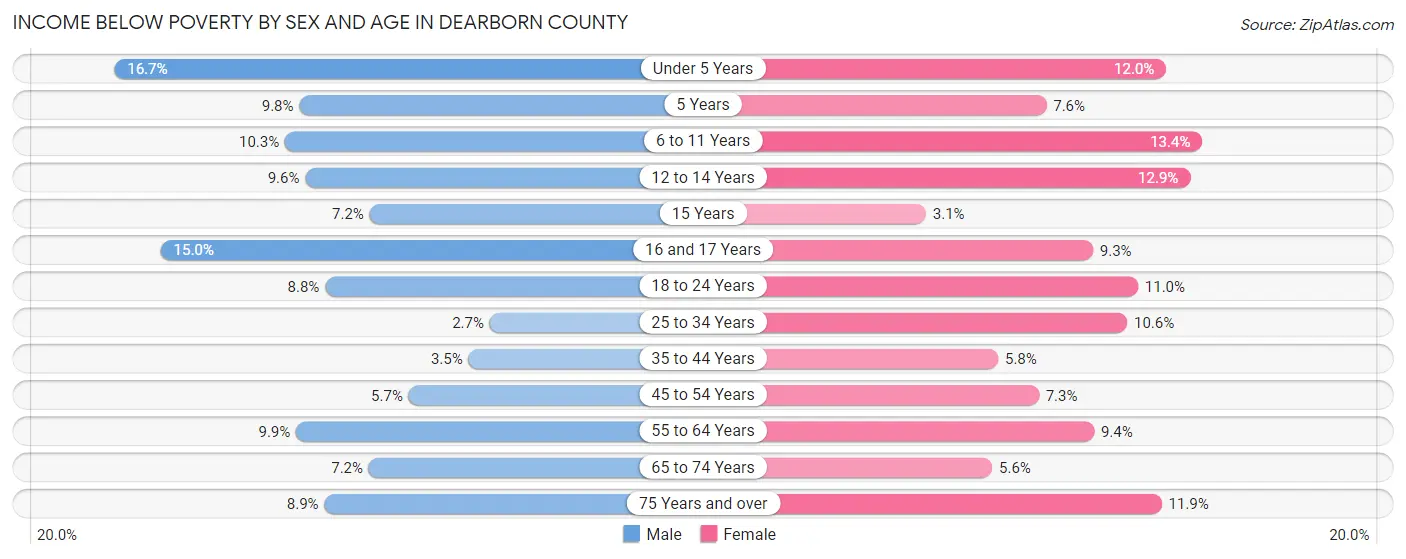
Income Below Poverty by Sex and Age in Dearborn County
With 7.8% poverty level for males and 9.1% for females among the residents of Dearborn County, under 5 year old males and 6 to 11 year old females are the most vulnerable to poverty, with 214 males (16.7%) and 227 females (13.4%) in their respective age groups living below the poverty level.
| Age Bracket | Male | Female |
| Under 5 Years | 214 (16.7%) | 154 (12.0%) |
| 5 Years | 29 (9.8%) | 28 (7.6%) |
| 6 to 11 Years | 193 (10.3%) | 227 (13.4%) |
| 12 to 14 Years | 98 (9.6%) | 123 (12.9%) |
| 15 Years | 21 (7.2%) | 13 (3.1%) |
| 16 and 17 Years | 123 (14.9%) | 63 (9.3%) |
| 18 to 24 Years | 186 (8.8%) | 214 (11.0%) |
| 25 to 34 Years | 75 (2.7%) | 294 (10.6%) |
| 35 to 44 Years | 105 (3.5%) | 179 (5.8%) |
| 45 to 54 Years | 198 (5.7%) | 246 (7.3%) |
| 55 to 64 Years | 376 (9.9%) | 349 (9.4%) |
| 65 to 74 Years | 201 (7.2%) | 158 (5.6%) |
| 75 Years and over | 130 (8.9%) | 233 (11.9%) |
| Total | 1,949 (7.8%) | 2,281 (9.1%) |
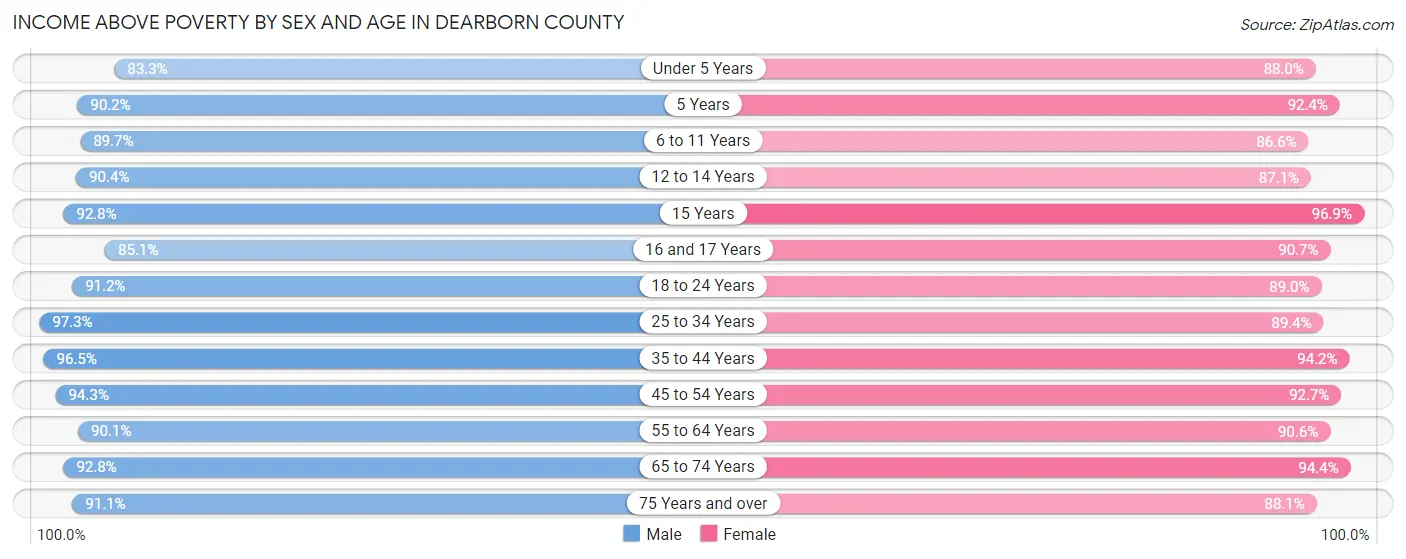
Income Above Poverty by Sex and Age in Dearborn County
According to the poverty statistics in Dearborn County, males aged 25 to 34 years and females aged 15 years are the age groups that are most secure financially, with 97.3% of males and 96.9% of females in these age groups living above the poverty line.
| Age Bracket | Male | Female |
| Under 5 Years | 1,070 (83.3%) | 1,125 (88.0%) |
| 5 Years | 267 (90.2%) | 341 (92.4%) |
| 6 to 11 Years | 1,676 (89.7%) | 1,469 (86.6%) |
| 12 to 14 Years | 925 (90.4%) | 828 (87.1%) |
| 15 Years | 271 (92.8%) | 403 (96.9%) |
| 16 and 17 Years | 700 (85.1%) | 613 (90.7%) |
| 18 to 24 Years | 1,918 (91.2%) | 1,733 (89.0%) |
| 25 to 34 Years | 2,675 (97.3%) | 2,482 (89.4%) |
| 35 to 44 Years | 2,878 (96.5%) | 2,905 (94.2%) |
| 45 to 54 Years | 3,250 (94.3%) | 3,118 (92.7%) |
| 55 to 64 Years | 3,416 (90.1%) | 3,379 (90.6%) |
| 65 to 74 Years | 2,584 (92.8%) | 2,676 (94.4%) |
| 75 Years and over | 1,336 (91.1%) | 1,730 (88.1%) |
| Total | 22,966 (92.2%) | 22,802 (90.9%) |
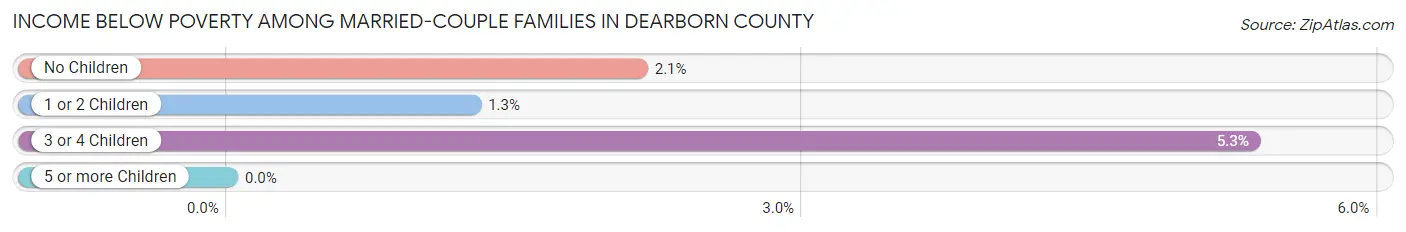
Income Below Poverty Among Married-Couple Families in Dearborn County
The poverty statistics for married-couple families in Dearborn County show that 2.1% or 232 of the total 11,277 families live below the poverty line. Families with 3 or 4 children have the highest poverty rate of 5.3%, comprising of 39 families. On the other hand, families with 5 or more children have the lowest poverty rate of 0.0%, which includes 0 families.
| Children | Above Poverty | Below Poverty |
| No Children | 6,661 (97.9%) | 146 (2.1%) |
| 1 or 2 Children | 3,653 (98.7%) | 47 (1.3%) |
| 3 or 4 Children | 691 (94.7%) | 39 (5.3%) |
| 5 or more Children | 40 (100.0%) | 0 (0.0%) |
| Total | 11,045 (97.9%) | 232 (2.1%) |
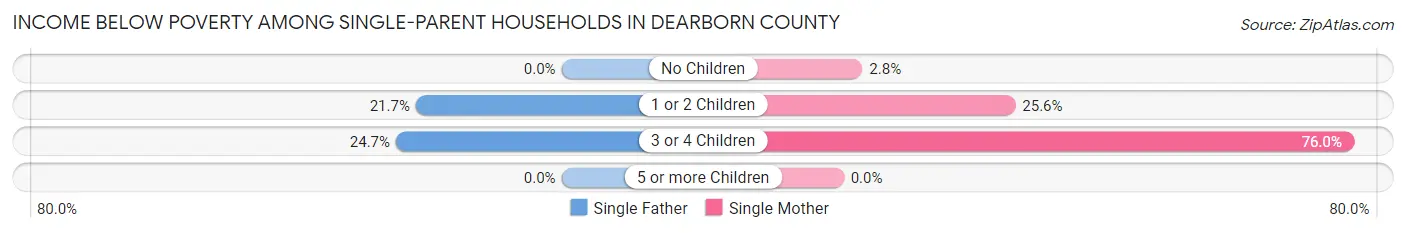
Income Below Poverty Among Single-Parent Households in Dearborn County
According to the poverty data in Dearborn County, 14.2% or 153 single-father households and 20.5% or 400 single-mother households are living below the poverty line. Among single-father households, those with 3 or 4 children have the highest poverty rate, with 19 households (24.7%) experiencing poverty. Likewise, among single-mother households, those with 3 or 4 children have the highest poverty rate, with 133 households (76.0%) falling below the poverty line.
| Children | Single Father | Single Mother |
| No Children | 0 (0.0%) | 23 (2.8%) |
| 1 or 2 Children | 134 (21.7%) | 244 (25.6%) |
| 3 or 4 Children | 19 (24.7%) | 133 (76.0%) |
| 5 or more Children | 0 (0.0%) | 0 (0.0%) |
| Total | 153 (14.2%) | 400 (20.5%) |
Income Below Poverty Among Married-Couple vs Single-Parent Households in Dearborn County
The poverty data for Dearborn County shows that 232 of the married-couple family households (2.1%) and 553 of the single-parent households (18.2%) are living below the poverty level. Within the married-couple family households, those with 3 or 4 children have the highest poverty rate, with 39 households (5.3%) falling below the poverty line. Among the single-parent households, those with 3 or 4 children have the highest poverty rate, with 152 household (60.3%) living below poverty.
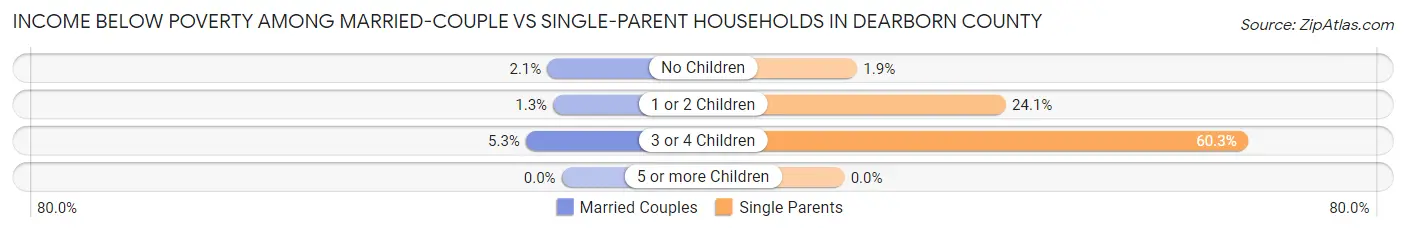
| Children | Married-Couple Families | Single-Parent Households |
| No Children | 146 (2.1%) | 23 (1.9%) |
| 1 or 2 Children | 47 (1.3%) | 378 (24.1%) |
| 3 or 4 Children | 39 (5.3%) | 152 (60.3%) |
| 5 or more Children | 0 (0.0%) | 0 (0.0%) |
| Total | 232 (2.1%) | 553 (18.2%) |
Employment Characteristics in Dearborn County
Employment by Class of Employer in Dearborn County
Among the 25,312 employed individuals in Dearborn County, private company employees (18,248 | 72.1%), not-for-profit organizations (2,115 | 8.4%), and local government employees (2,016 | 8.0%) make up the most common classes of employment.
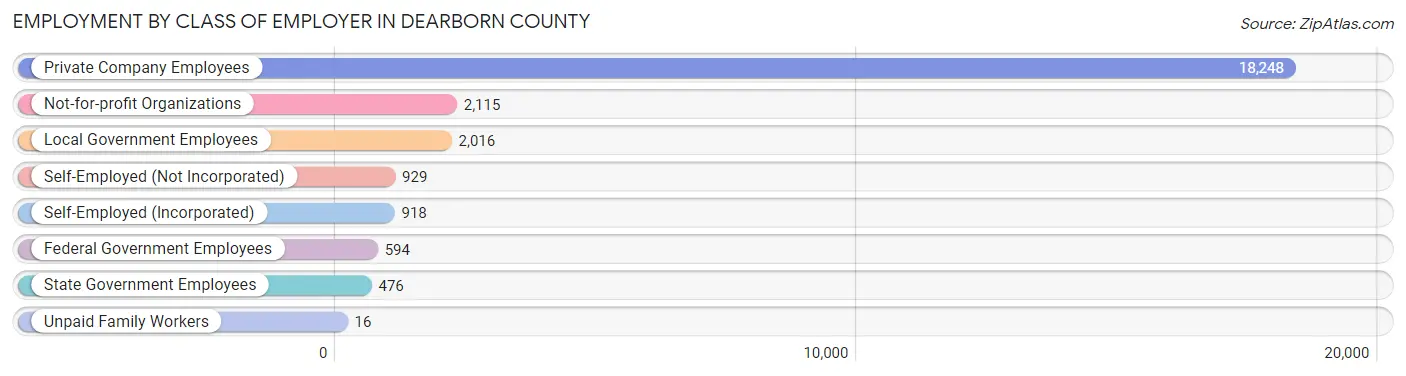
| Employer Class | # Employees | % Employees |
| Private Company Employees | 18,248 | 72.1% |
| Self-Employed (Incorporated) | 918 | 3.6% |
| Self-Employed (Not Incorporated) | 929 | 3.7% |
| Not-for-profit Organizations | 2,115 | 8.4% |
| Local Government Employees | 2,016 | 8.0% |
| State Government Employees | 476 | 1.9% |
| Federal Government Employees | 594 | 2.4% |
| Unpaid Family Workers | 16 | 0.1% |
| Total | 25,312 | 100.0% |
Employment Status by Age in Dearborn County
According to the labor force statistics for Dearborn County, out of the total population over 16 years of age (40,985), 64.3% or 26,353 individuals are in the labor force, with 2.1% or 553 of them unemployed. The age group with the highest labor force participation rate is 25 to 29 years, with 92.9% or 2,568 individuals in the labor force. Within the labor force, the 20 to 24 years age range has the highest percentage of unemployed individuals, with 4.3% or 110 of them being unemployed.
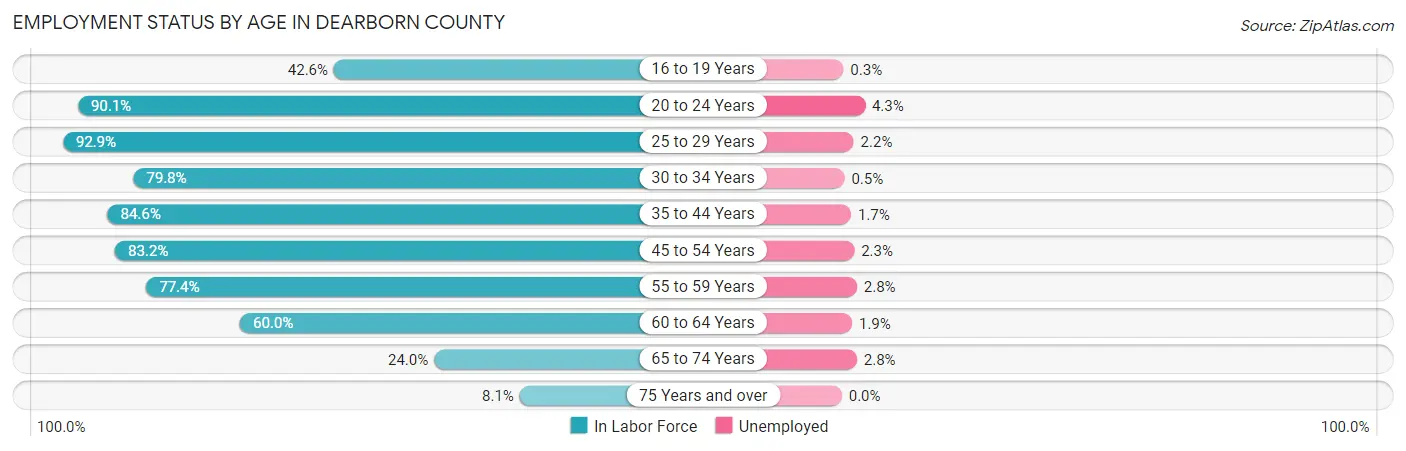
| Age Bracket | In Labor Force | Unemployed |
| 16 to 19 Years | 1,161 (42.6%) | 3 (0.3%) |
| 20 to 24 Years | 2,569 (90.1%) | 110 (4.3%) |
| 25 to 29 Years | 2,568 (92.9%) | 56 (2.2%) |
| 30 to 34 Years | 2,273 (79.8%) | 11 (0.5%) |
| 35 to 44 Years | 5,205 (84.6%) | 88 (1.7%) |
| 45 to 54 Years | 5,703 (83.2%) | 131 (2.3%) |
| 55 to 59 Years | 3,009 (77.4%) | 84 (2.8%) |
| 60 to 64 Years | 2,192 (60.0%) | 42 (1.9%) |
| 65 to 74 Years | 1,369 (24.0%) | 38 (2.8%) |
| 75 Years and over | 287 (8.1%) | 0 (0.0%) |
| Total | 26,353 (64.3%) | 553 (2.1%) |
Employment Status by Educational Attainment in Dearborn County
According to labor force statistics for Dearborn County, 80.1% of individuals (20,955) out of the total population between 25 and 64 years of age (26,161) are in the labor force, with 2.0% or 419 of them being unemployed. The group with the highest labor force participation rate are those with the educational attainment of bachelor's degree or higher, with 92.7% or 6,810 individuals in the labor force. Within the labor force, individuals with less than high school education have the highest percentage of unemployment, with 6.0% or 70 of them being unemployed.
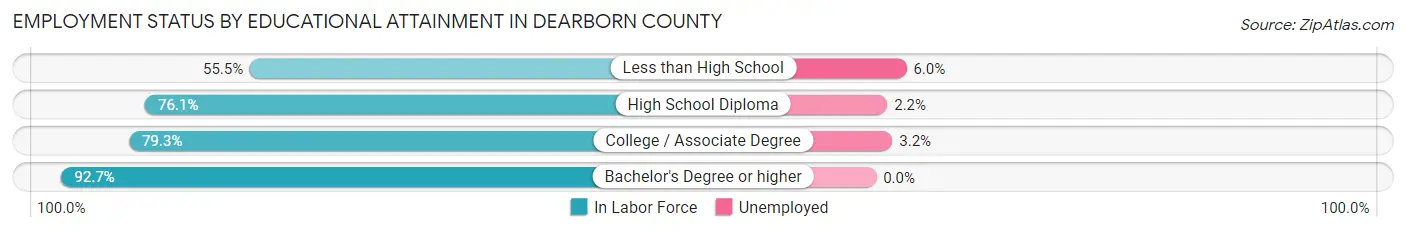
| Educational Attainment | In Labor Force | Unemployed |
| Less than High School | 1,164 (55.5%) | 126 (6.0%) |
| High School Diploma | 6,911 (76.1%) | 200 (2.2%) |
| College / Associate Degree | 6,056 (79.3%) | 244 (3.2%) |
| Bachelor's Degree or higher | 6,810 (92.7%) | 0 (0.0%) |
| Total | 20,955 (80.1%) | 523 (2.0%) |
Employment Occupations by Sex in Dearborn County
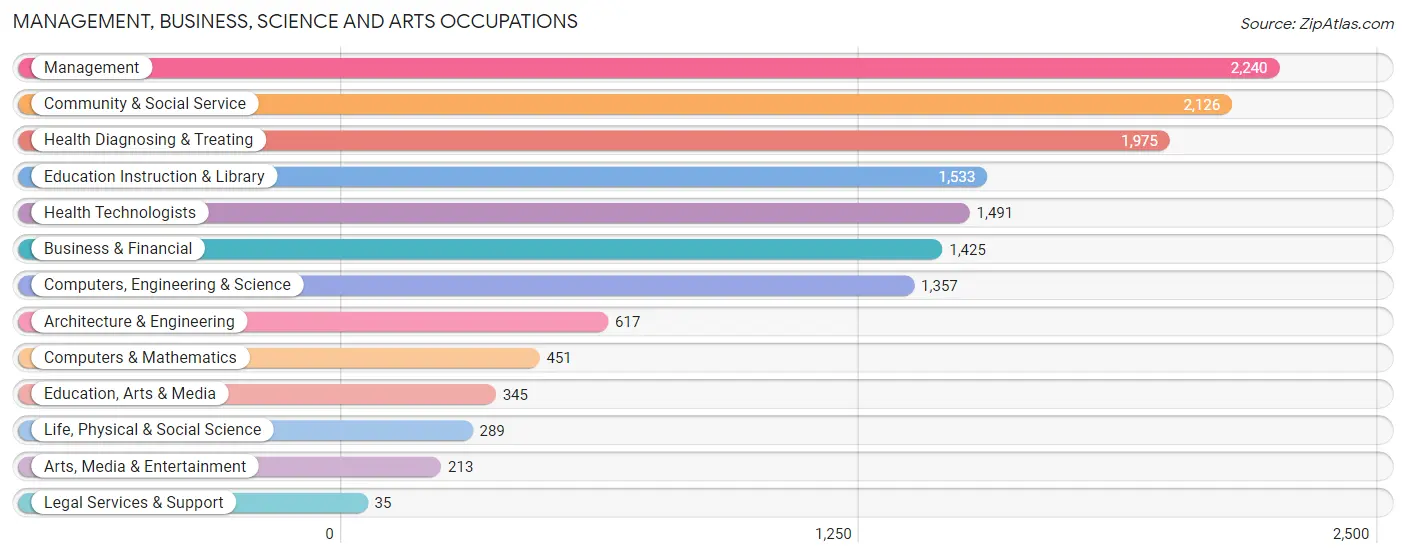
Management, Business, Science and Arts Occupations
The most common Management, Business, Science and Arts occupations in Dearborn County are Management (2,240 | 8.7%), Community & Social Service (2,126 | 8.3%), Health Diagnosing & Treating (1,975 | 7.7%), Education Instruction & Library (1,533 | 6.0%), and Health Technologists (1,491 | 5.8%).
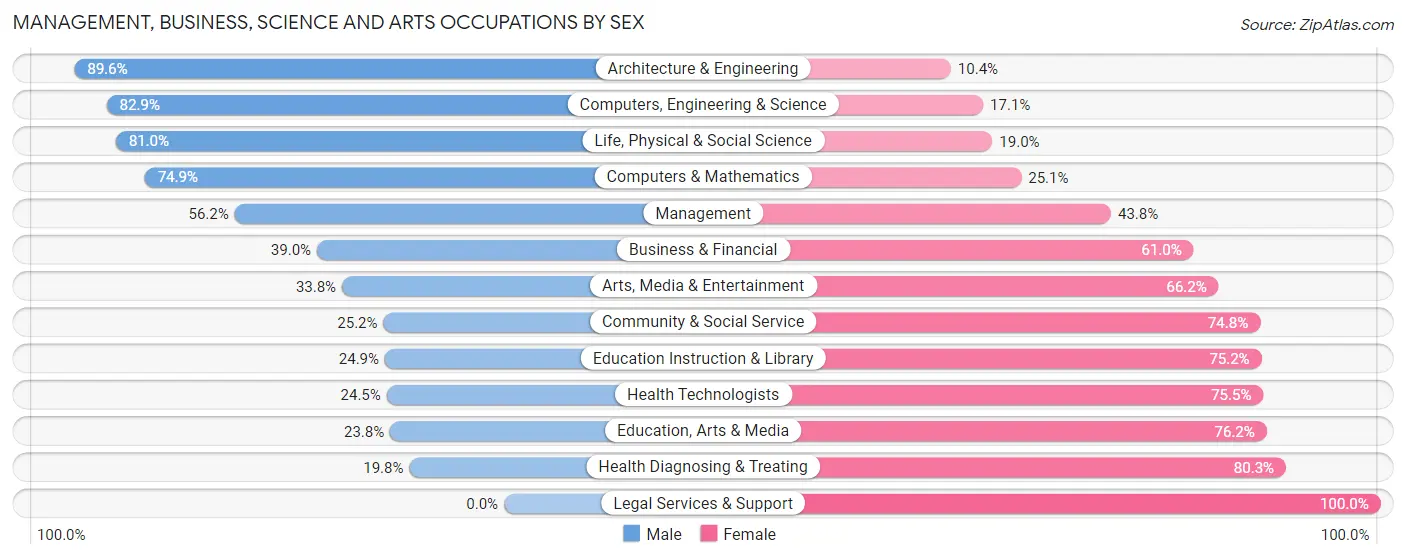
Management, Business, Science and Arts Occupations by Sex
Within the Management, Business, Science and Arts occupations in Dearborn County, the most male-oriented occupations are Architecture & Engineering (89.6%), Computers, Engineering & Science (82.9%), and Life, Physical & Social Science (81.0%), while the most female-oriented occupations are Legal Services & Support (100.0%), Health Diagnosing & Treating (80.2%), and Education, Arts & Media (76.2%).
| Occupation | Male | Female |
| Management | 1,259 (56.2%) | 981 (43.8%) |
| Business & Financial | 556 (39.0%) | 869 (61.0%) |
| Computers, Engineering & Science | 1,125 (82.9%) | 232 (17.1%) |
| Computers & Mathematics | 338 (74.9%) | 113 (25.1%) |
| Architecture & Engineering | 553 (89.6%) | 64 (10.4%) |
| Life, Physical & Social Science | 234 (81.0%) | 55 (19.0%) |
| Community & Social Service | 535 (25.2%) | 1,591 (74.8%) |
| Education, Arts & Media | 82 (23.8%) | 263 (76.2%) |
| Legal Services & Support | 0 (0.0%) | 35 (100.0%) |
| Education Instruction & Library | 381 (24.8%) | 1,152 (75.1%) |
| Arts, Media & Entertainment | 72 (33.8%) | 141 (66.2%) |
| Health Diagnosing & Treating | 390 (19.8%) | 1,585 (80.2%) |
| Health Technologists | 365 (24.5%) | 1,126 (75.5%) |
| Total (Category) | 3,865 (42.4%) | 5,258 (57.6%) |
| Total (Overall) | 13,820 (53.7%) | 11,919 (46.3%) |
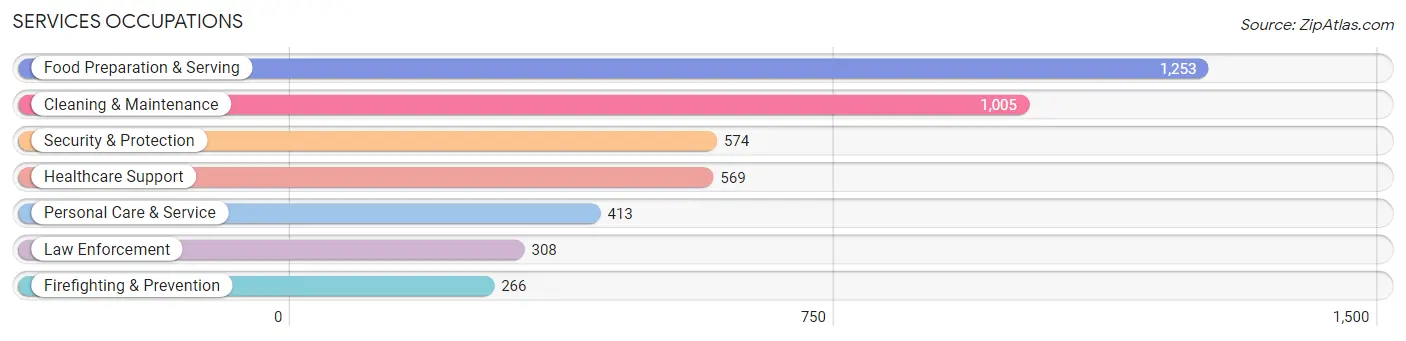
Services Occupations
The most common Services occupations in Dearborn County are Food Preparation & Serving (1,253 | 4.9%), Cleaning & Maintenance (1,005 | 3.9%), Security & Protection (574 | 2.2%), Healthcare Support (569 | 2.2%), and Personal Care & Service (413 | 1.6%).
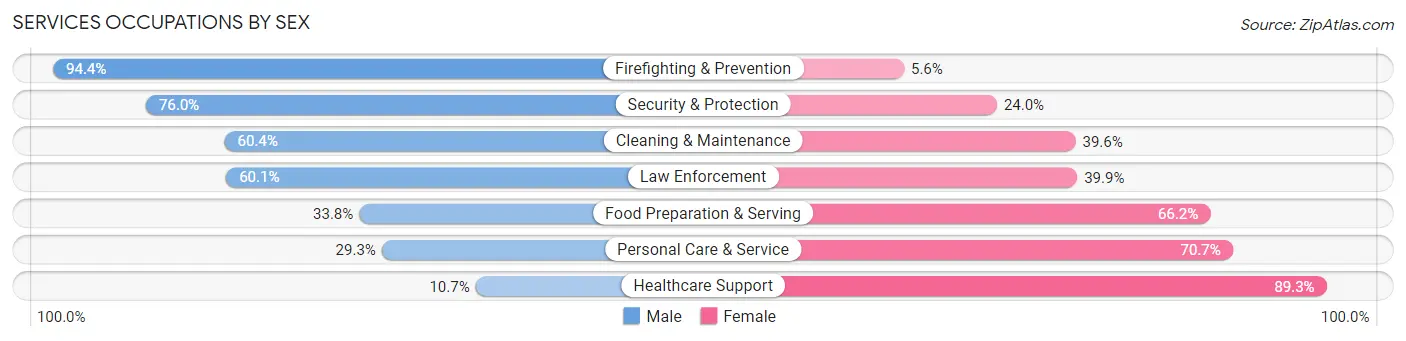
Services Occupations by Sex
Within the Services occupations in Dearborn County, the most male-oriented occupations are Firefighting & Prevention (94.4%), Security & Protection (76.0%), and Cleaning & Maintenance (60.4%), while the most female-oriented occupations are Healthcare Support (89.3%), Personal Care & Service (70.7%), and Food Preparation & Serving (66.2%).
| Occupation | Male | Female |
| Healthcare Support | 61 (10.7%) | 508 (89.3%) |
| Security & Protection | 436 (76.0%) | 138 (24.0%) |
| Firefighting & Prevention | 251 (94.4%) | 15 (5.6%) |
| Law Enforcement | 185 (60.1%) | 123 (39.9%) |
| Food Preparation & Serving | 423 (33.8%) | 830 (66.2%) |
| Cleaning & Maintenance | 607 (60.4%) | 398 (39.6%) |
| Personal Care & Service | 121 (29.3%) | 292 (70.7%) |
| Total (Category) | 1,648 (43.2%) | 2,166 (56.8%) |
| Total (Overall) | 13,820 (53.7%) | 11,919 (46.3%) |
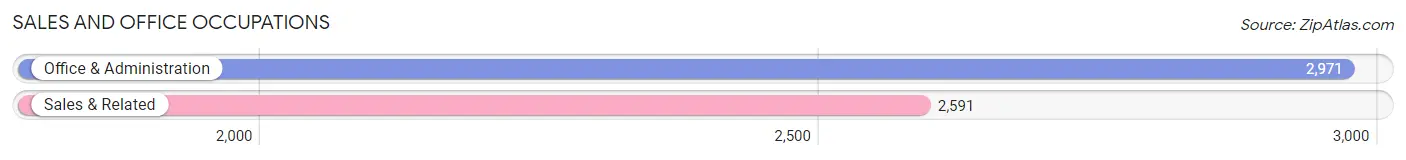
Sales and Office Occupations
The most common Sales and Office occupations in Dearborn County are Office & Administration (2,971 | 11.5%), and Sales & Related (2,591 | 10.1%).
Sales and Office Occupations by Sex

| Occupation | Male | Female |
| Sales & Related | 1,415 (54.6%) | 1,176 (45.4%) |
| Office & Administration | 568 (19.1%) | 2,403 (80.9%) |
| Total (Category) | 1,983 (35.6%) | 3,579 (64.3%) |
| Total (Overall) | 13,820 (53.7%) | 11,919 (46.3%) |
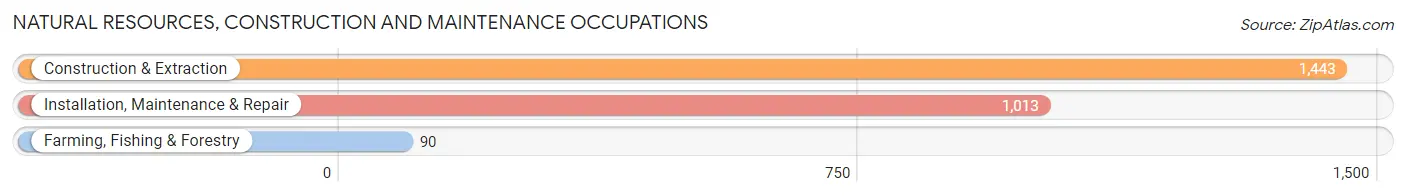
Natural Resources, Construction and Maintenance Occupations
The most common Natural Resources, Construction and Maintenance occupations in Dearborn County are Construction & Extraction (1,443 | 5.6%), Installation, Maintenance & Repair (1,013 | 3.9%), and Farming, Fishing & Forestry (90 | 0.4%).
Natural Resources, Construction and Maintenance Occupations by Sex
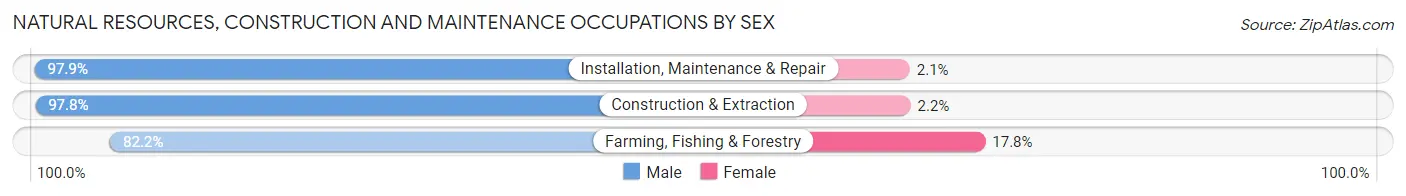
| Occupation | Male | Female |
| Farming, Fishing & Forestry | 74 (82.2%) | 16 (17.8%) |
| Construction & Extraction | 1,411 (97.8%) | 32 (2.2%) |
| Installation, Maintenance & Repair | 992 (97.9%) | 21 (2.1%) |
| Total (Category) | 2,477 (97.3%) | 69 (2.7%) |
| Total (Overall) | 13,820 (53.7%) | 11,919 (46.3%) |
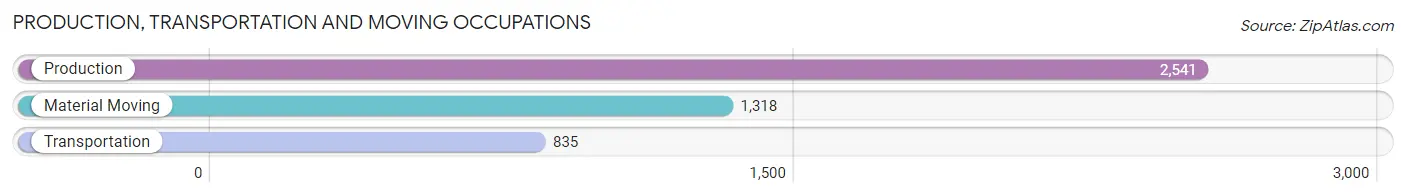
Production, Transportation and Moving Occupations
The most common Production, Transportation and Moving occupations in Dearborn County are Production (2,541 | 9.9%), Material Moving (1,318 | 5.1%), and Transportation (835 | 3.2%).
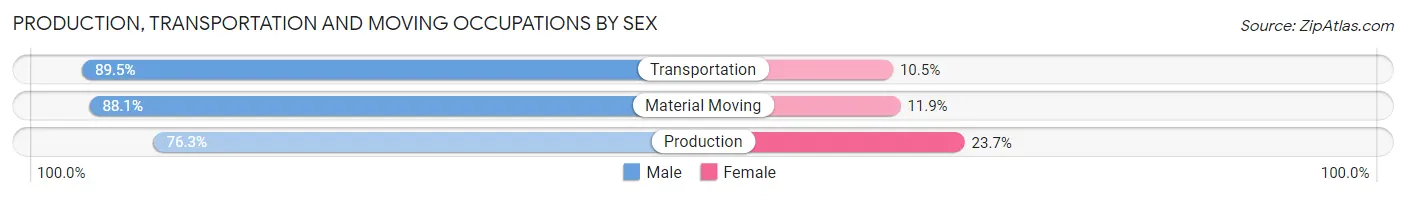
Production, Transportation and Moving Occupations by Sex
| Occupation | Male | Female |
| Production | 1,939 (76.3%) | 602 (23.7%) |
| Transportation | 747 (89.5%) | 88 (10.5%) |
| Material Moving | 1,161 (88.1%) | 157 (11.9%) |
| Total (Category) | 3,847 (82.0%) | 847 (18.0%) |
| Total (Overall) | 13,820 (53.7%) | 11,919 (46.3%) |
Employment Industries by Sex in Dearborn County
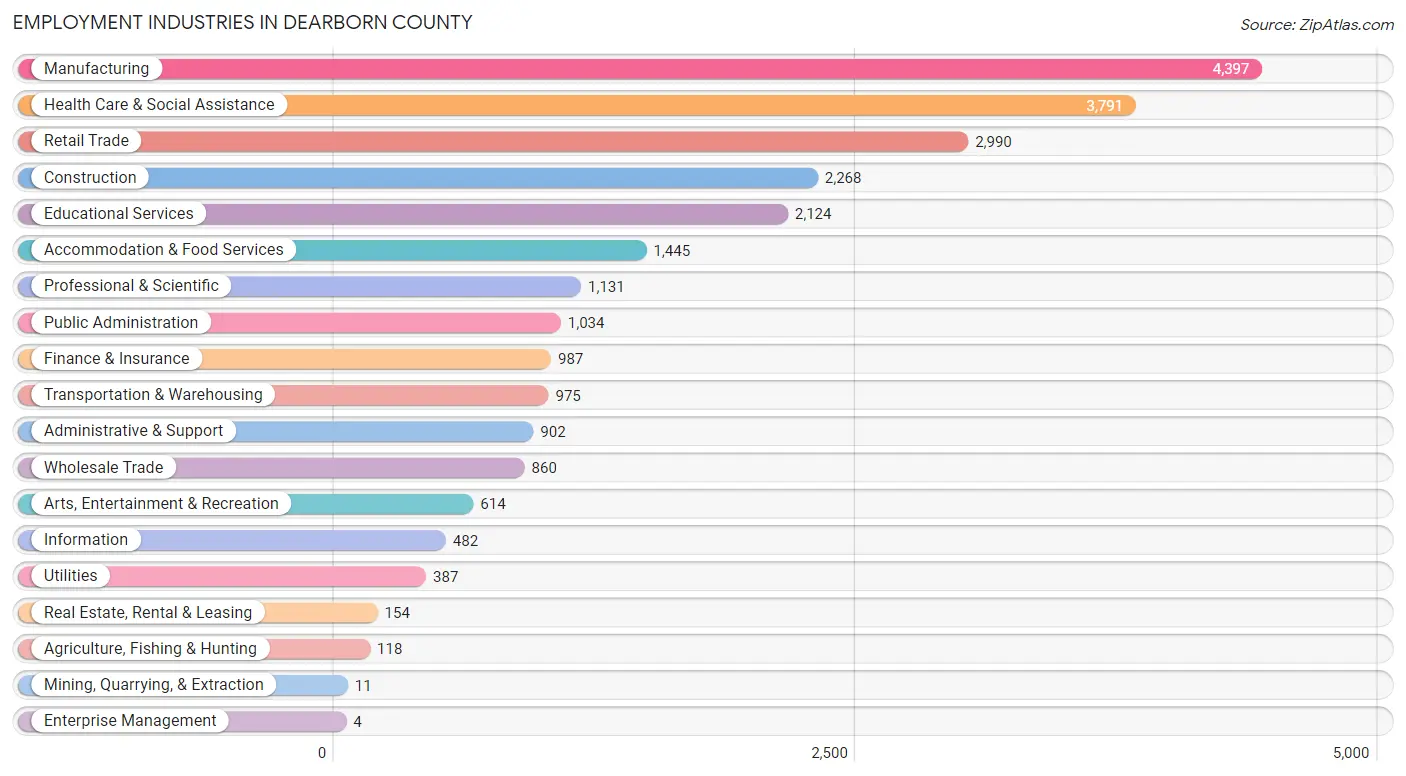
Employment Industries in Dearborn County
The major employment industries in Dearborn County include Manufacturing (4,397 | 17.1%), Health Care & Social Assistance (3,791 | 14.7%), Retail Trade (2,990 | 11.6%), Construction (2,268 | 8.8%), and Educational Services (2,124 | 8.3%).
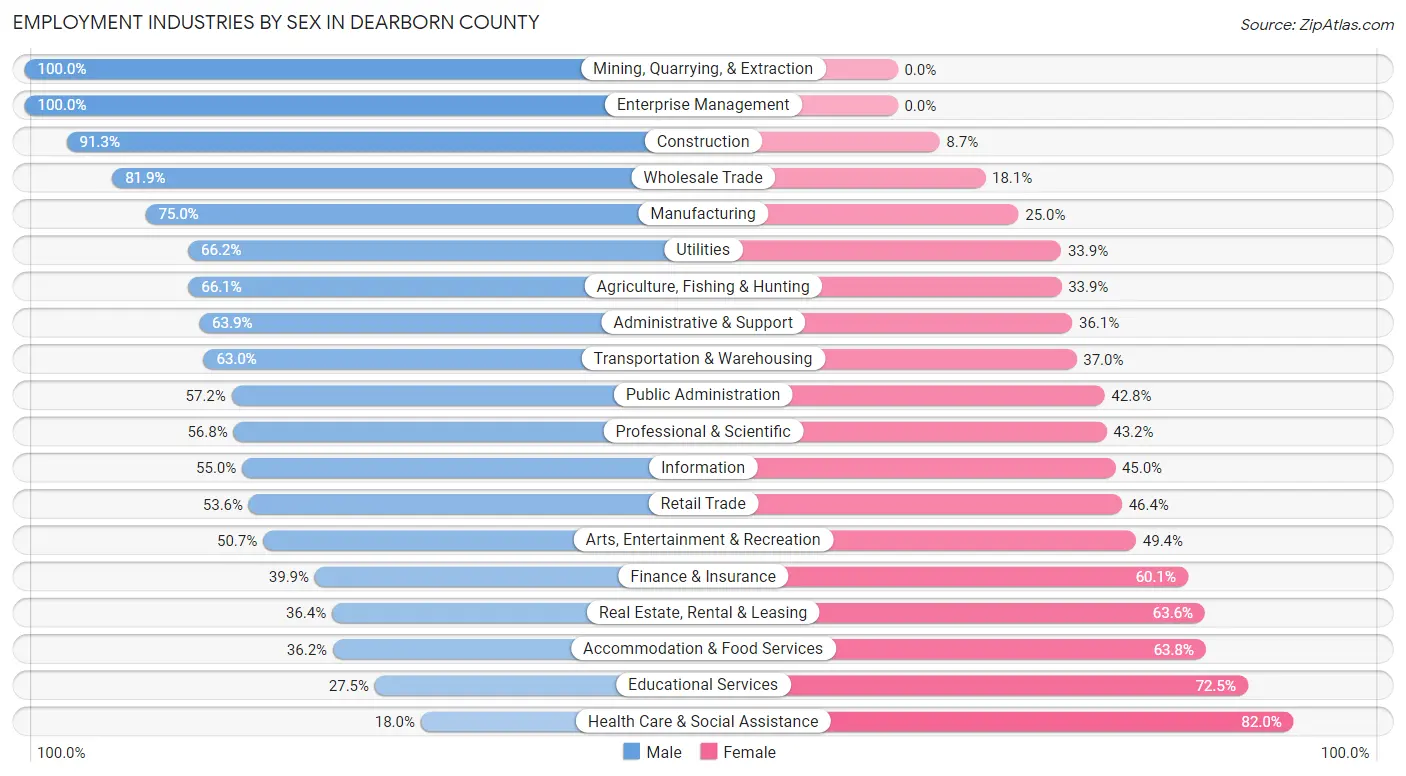
Employment Industries by Sex in Dearborn County
The Dearborn County industries that see more men than women are Mining, Quarrying, & Extraction (100.0%), Enterprise Management (100.0%), and Construction (91.3%), whereas the industries that tend to have a higher number of women are Health Care & Social Assistance (82.0%), Educational Services (72.5%), and Accommodation & Food Services (63.8%).
| Industry | Male | Female |
| Agriculture, Fishing & Hunting | 78 (66.1%) | 40 (33.9%) |
| Mining, Quarrying, & Extraction | 11 (100.0%) | 0 (0.0%) |
| Construction | 2,071 (91.3%) | 197 (8.7%) |
| Manufacturing | 3,297 (75.0%) | 1,100 (25.0%) |
| Wholesale Trade | 704 (81.9%) | 156 (18.1%) |
| Retail Trade | 1,602 (53.6%) | 1,388 (46.4%) |
| Transportation & Warehousing | 614 (63.0%) | 361 (37.0%) |
| Utilities | 256 (66.1%) | 131 (33.9%) |
| Information | 265 (55.0%) | 217 (45.0%) |
| Finance & Insurance | 394 (39.9%) | 593 (60.1%) |
| Real Estate, Rental & Leasing | 56 (36.4%) | 98 (63.6%) |
| Professional & Scientific | 642 (56.8%) | 489 (43.2%) |
| Enterprise Management | 4 (100.0%) | 0 (0.0%) |
| Administrative & Support | 576 (63.9%) | 326 (36.1%) |
| Educational Services | 584 (27.5%) | 1,540 (72.5%) |
| Health Care & Social Assistance | 682 (18.0%) | 3,109 (82.0%) |
| Arts, Entertainment & Recreation | 311 (50.6%) | 303 (49.3%) |
| Accommodation & Food Services | 523 (36.2%) | 922 (63.8%) |
| Public Administration | 591 (57.2%) | 443 (42.8%) |
| Total | 13,820 (53.7%) | 11,919 (46.3%) |
Education in Dearborn County
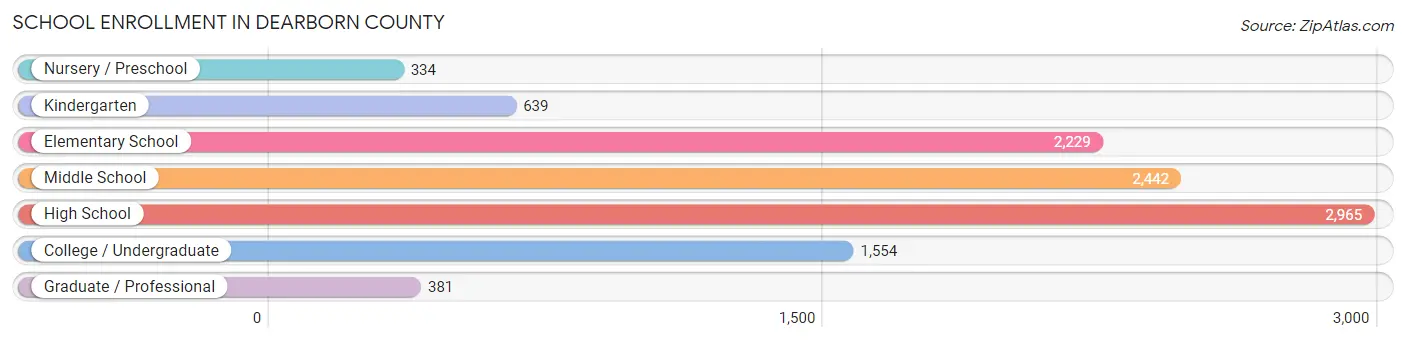
School Enrollment in Dearborn County
The most common levels of schooling among the 10,544 students in Dearborn County are high school (2,965 | 28.1%), middle school (2,442 | 23.2%), and elementary school (2,229 | 21.1%).
| School Level | # Students | % Students |
| Nursery / Preschool | 334 | 3.2% |
| Kindergarten | 639 | 6.1% |
| Elementary School | 2,229 | 21.1% |
| Middle School | 2,442 | 23.2% |
| High School | 2,965 | 28.1% |
| College / Undergraduate | 1,554 | 14.7% |
| Graduate / Professional | 381 | 3.6% |
| Total | 10,544 | 100.0% |
School Enrollment by Age by Funding Source in Dearborn County
Out of a total of 10,544 students who are enrolled in schools in Dearborn County, 981 (9.3%) attend a private institution, while the remaining 9,563 (90.7%) are enrolled in public schools. The age group of 3 to 4 year olds has the highest likelihood of being enrolled in private schools, with 106 (64.6% in the age bracket) enrolled. Conversely, the age group of 18 to 19 year olds has the lowest likelihood of being enrolled in a private school, with 835 (94.9% in the age bracket) attending a public institution.
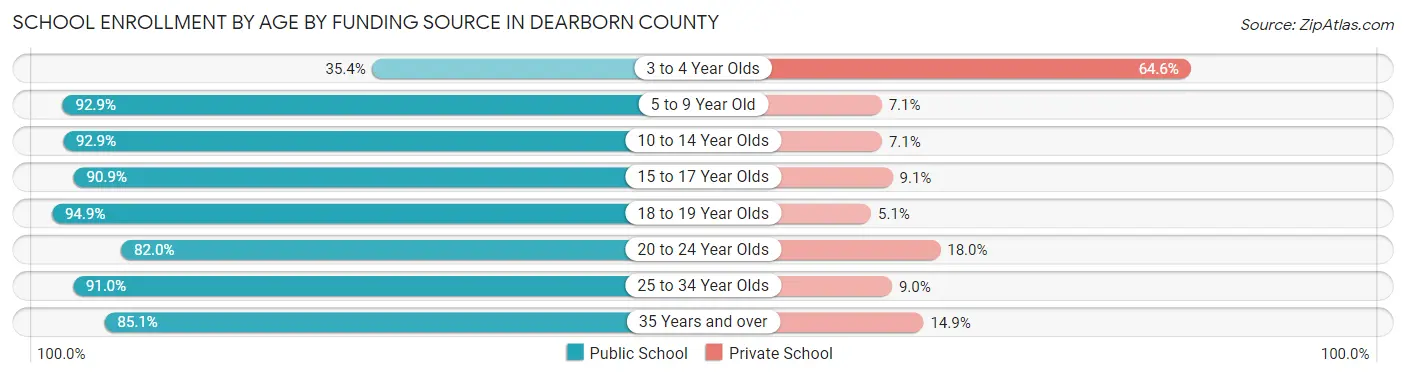
| Age Bracket | Public School | Private School |
| 3 to 4 Year Olds | 58 (35.4%) | 106 (64.6%) |
| 5 to 9 Year Old | 2,597 (92.9%) | 198 (7.1%) |
| 10 to 14 Year Olds | 2,945 (92.9%) | 226 (7.1%) |
| 15 to 17 Year Olds | 1,885 (90.9%) | 189 (9.1%) |
| 18 to 19 Year Olds | 835 (94.9%) | 45 (5.1%) |
| 20 to 24 Year Olds | 538 (82.0%) | 118 (18.0%) |
| 25 to 34 Year Olds | 334 (91.0%) | 33 (9.0%) |
| 35 Years and over | 372 (85.1%) | 65 (14.9%) |
| Total | 9,563 (90.7%) | 981 (9.3%) |
Educational Attainment by Field of Study in Dearborn County
Business (2,070 | 21.8%), science & technology (1,708 | 18.0%), education (1,673 | 17.6%), bio, nature & agricultural (580 | 6.1%), and computers & mathematics (536 | 5.6%) are the most common fields of study among 9,510 individuals in Dearborn County who have obtained a bachelor's degree or higher.
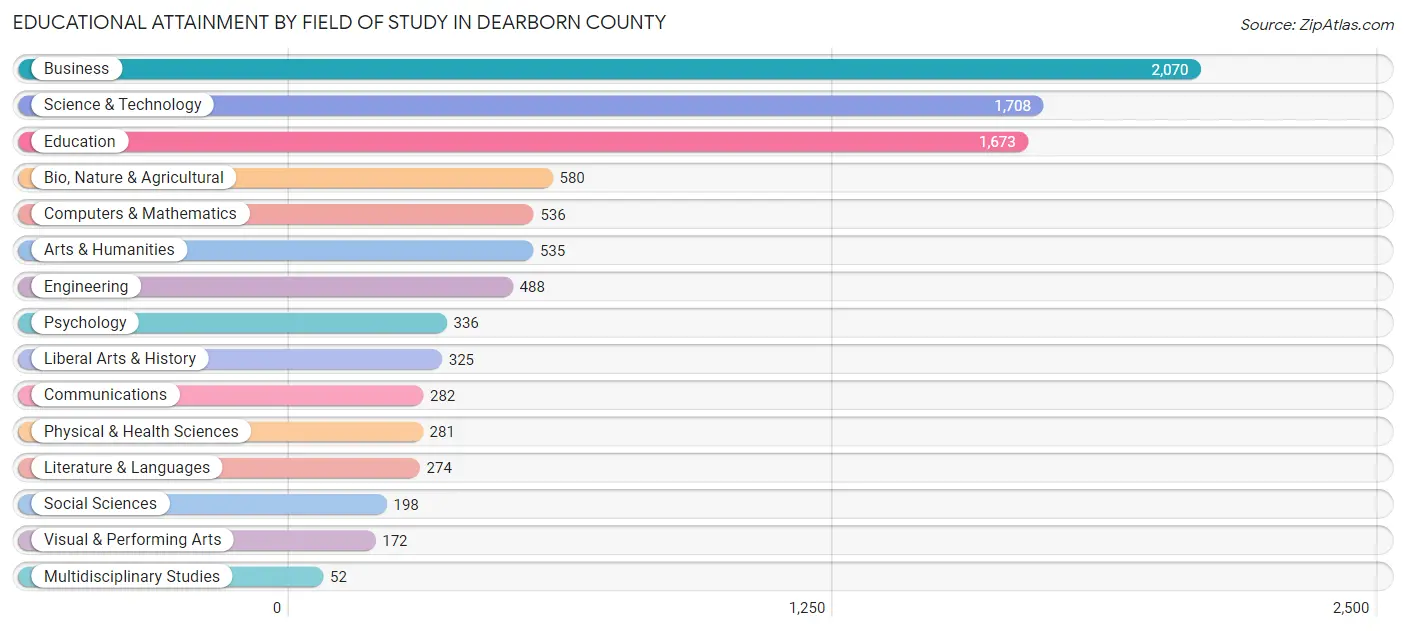
| Field of Study | # Graduates | % Graduates |
| Computers & Mathematics | 536 | 5.6% |
| Bio, Nature & Agricultural | 580 | 6.1% |
| Physical & Health Sciences | 281 | 2.9% |
| Psychology | 336 | 3.5% |
| Social Sciences | 198 | 2.1% |
| Engineering | 488 | 5.1% |
| Multidisciplinary Studies | 52 | 0.5% |
| Science & Technology | 1,708 | 18.0% |
| Business | 2,070 | 21.8% |
| Education | 1,673 | 17.6% |
| Literature & Languages | 274 | 2.9% |
| Liberal Arts & History | 325 | 3.4% |
| Visual & Performing Arts | 172 | 1.8% |
| Communications | 282 | 3.0% |
| Arts & Humanities | 535 | 5.6% |
| Total | 9,510 | 100.0% |
Transportation & Commute in Dearborn County
Vehicle Availability by Sex in Dearborn County
The most prevalent vehicle ownership categories in Dearborn County are males with 2 vehicles (4,767, accounting for 35.1%) and females with 2 vehicles (4,450, making up 40.6%).
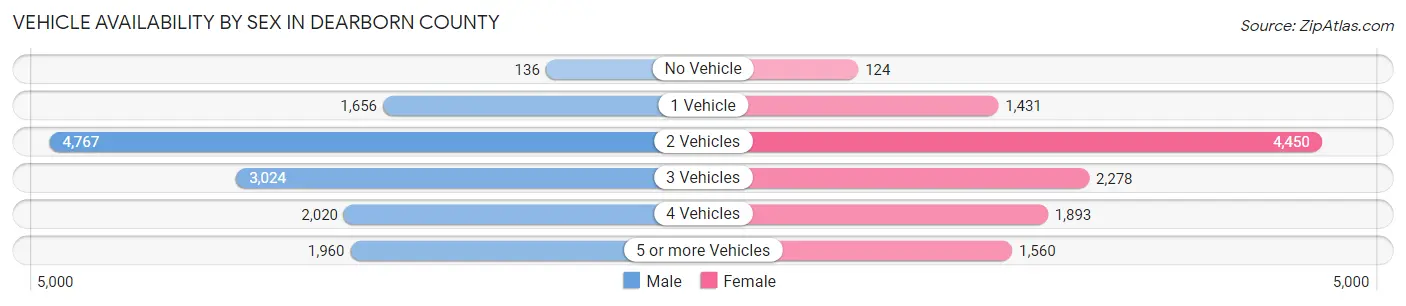
| Vehicles Available | Male | Female |
| No Vehicle | 136 (1.0%) | 124 (1.1%) |
| 1 Vehicle | 1,656 (12.2%) | 1,431 (12.2%) |
| 2 Vehicles | 4,767 (35.1%) | 4,450 (37.9%) |
| 3 Vehicles | 3,024 (22.3%) | 2,278 (19.4%) |
| 4 Vehicles | 2,020 (14.9%) | 1,893 (16.1%) |
| 5 or more Vehicles | 1,960 (14.4%) | 1,560 (13.3%) |
| Total | 13,563 (100.0%) | 11,736 (100.0%) |
Commute Time in Dearborn County
The most frequently occuring commute durations in Dearborn County are 30 to 34 minutes (3,499 commuters, 14.9%), 45 to 59 minutes (3,075 commuters, 13.1%), and 20 to 24 minutes (2,863 commuters, 12.2%).
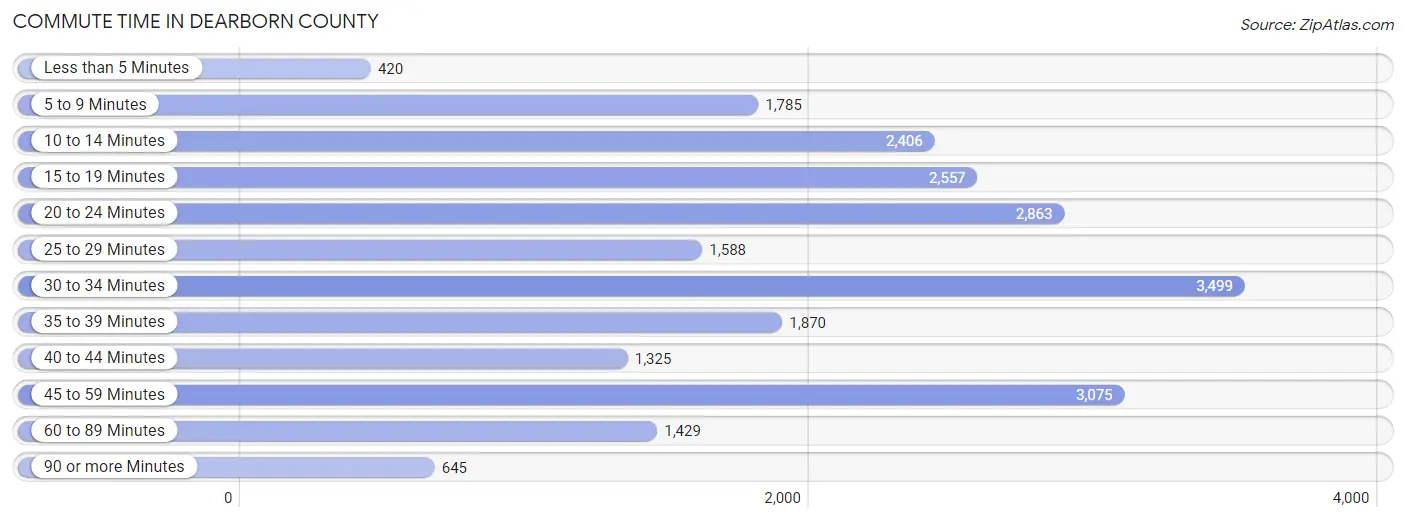
| Commute Time | # Commuters | % Commuters |
| Less than 5 Minutes | 420 | 1.8% |
| 5 to 9 Minutes | 1,785 | 7.6% |
| 10 to 14 Minutes | 2,406 | 10.2% |
| 15 to 19 Minutes | 2,557 | 10.9% |
| 20 to 24 Minutes | 2,863 | 12.2% |
| 25 to 29 Minutes | 1,588 | 6.8% |
| 30 to 34 Minutes | 3,499 | 14.9% |
| 35 to 39 Minutes | 1,870 | 8.0% |
| 40 to 44 Minutes | 1,325 | 5.7% |
| 45 to 59 Minutes | 3,075 | 13.1% |
| 60 to 89 Minutes | 1,429 | 6.1% |
| 90 or more Minutes | 645 | 2.8% |
Commute Time by Sex in Dearborn County
The most common commute times in Dearborn County are 30 to 34 minutes (1,789 commuters, 14.3%) for males and 30 to 34 minutes (1,710 commuters, 15.7%) for females.
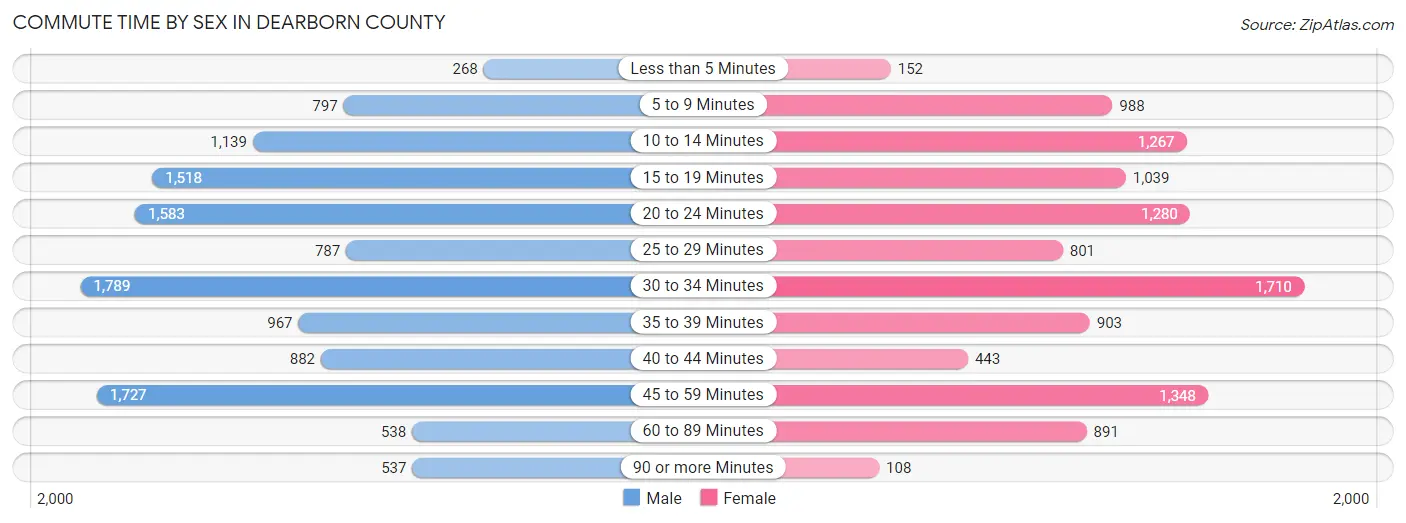
| Commute Time | Male | Female |
| Less than 5 Minutes | 268 (2.1%) | 152 (1.4%) |
| 5 to 9 Minutes | 797 (6.4%) | 988 (9.0%) |
| 10 to 14 Minutes | 1,139 (9.1%) | 1,267 (11.6%) |
| 15 to 19 Minutes | 1,518 (12.1%) | 1,039 (9.5%) |
| 20 to 24 Minutes | 1,583 (12.6%) | 1,280 (11.7%) |
| 25 to 29 Minutes | 787 (6.3%) | 801 (7.3%) |
| 30 to 34 Minutes | 1,789 (14.3%) | 1,710 (15.7%) |
| 35 to 39 Minutes | 967 (7.7%) | 903 (8.3%) |
| 40 to 44 Minutes | 882 (7.0%) | 443 (4.1%) |
| 45 to 59 Minutes | 1,727 (13.8%) | 1,348 (12.3%) |
| 60 to 89 Minutes | 538 (4.3%) | 891 (8.2%) |
| 90 or more Minutes | 537 (4.3%) | 108 (1.0%) |
Time of Departure to Work by Sex in Dearborn County
The most frequent times of departure to work in Dearborn County are 6:00 AM to 6:29 AM (2,110, 16.8%) for males and 7:00 AM to 7:29 AM (2,054, 18.8%) for females.
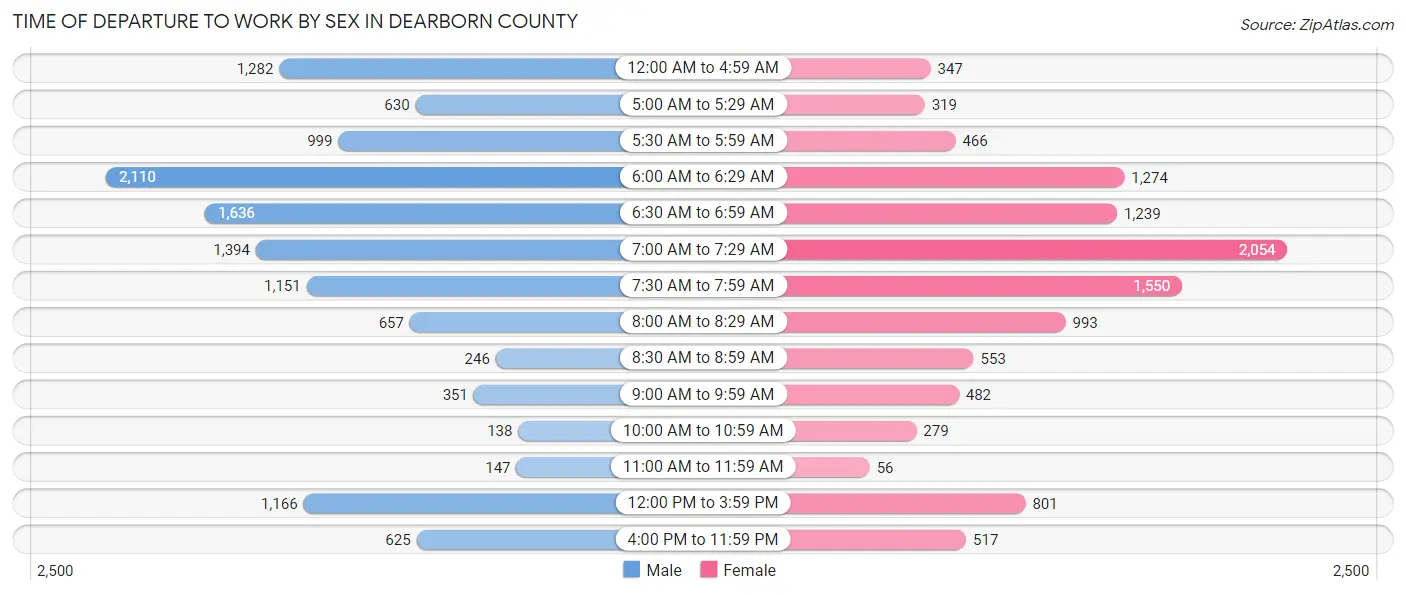
| Time of Departure | Male | Female |
| 12:00 AM to 4:59 AM | 1,282 (10.2%) | 347 (3.2%) |
| 5:00 AM to 5:29 AM | 630 (5.0%) | 319 (2.9%) |
| 5:30 AM to 5:59 AM | 999 (8.0%) | 466 (4.3%) |
| 6:00 AM to 6:29 AM | 2,110 (16.8%) | 1,274 (11.7%) |
| 6:30 AM to 6:59 AM | 1,636 (13.1%) | 1,239 (11.3%) |
| 7:00 AM to 7:29 AM | 1,394 (11.1%) | 2,054 (18.8%) |
| 7:30 AM to 7:59 AM | 1,151 (9.2%) | 1,550 (14.2%) |
| 8:00 AM to 8:29 AM | 657 (5.2%) | 993 (9.1%) |
| 8:30 AM to 8:59 AM | 246 (2.0%) | 553 (5.1%) |
| 9:00 AM to 9:59 AM | 351 (2.8%) | 482 (4.4%) |
| 10:00 AM to 10:59 AM | 138 (1.1%) | 279 (2.5%) |
| 11:00 AM to 11:59 AM | 147 (1.2%) | 56 (0.5%) |
| 12:00 PM to 3:59 PM | 1,166 (9.3%) | 801 (7.3%) |
| 4:00 PM to 11:59 PM | 625 (5.0%) | 517 (4.7%) |
| Total | 12,532 (100.0%) | 10,930 (100.0%) |
Housing Occupancy in Dearborn County
Occupancy by Ownership in Dearborn County
Of the total 19,915 dwellings in Dearborn County, owner-occupied units account for 16,561 (83.2%), while renter-occupied units make up 3,354 (16.8%).
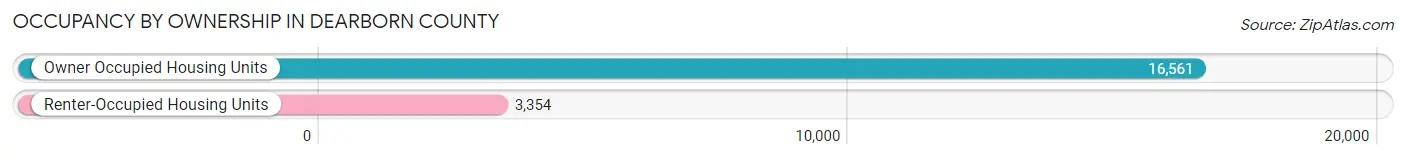
| Occupancy | # Housing Units | % Housing Units |
| Owner Occupied Housing Units | 16,561 | 83.2% |
| Renter-Occupied Housing Units | 3,354 | 16.8% |
| Total Occupied Housing Units | 19,915 | 100.0% |
Occupancy by Household Size in Dearborn County
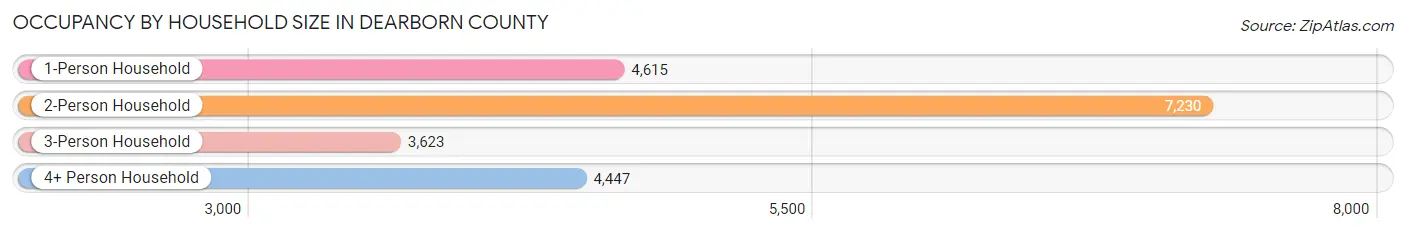
| Household Size | # Housing Units | % Housing Units |
| 1-Person Household | 4,615 | 23.2% |
| 2-Person Household | 7,230 | 36.3% |
| 3-Person Household | 3,623 | 18.2% |
| 4+ Person Household | 4,447 | 22.3% |
| Total Housing Units | 19,915 | 100.0% |
Occupancy by Ownership by Household Size in Dearborn County
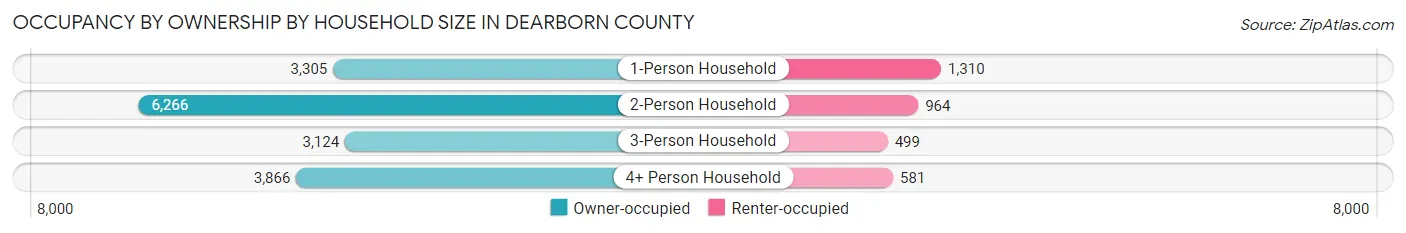
| Household Size | Owner-occupied | Renter-occupied |
| 1-Person Household | 3,305 (71.6%) | 1,310 (28.4%) |
| 2-Person Household | 6,266 (86.7%) | 964 (13.3%) |
| 3-Person Household | 3,124 (86.2%) | 499 (13.8%) |
| 4+ Person Household | 3,866 (86.9%) | 581 (13.1%) |
| Total Housing Units | 16,561 (83.2%) | 3,354 (16.8%) |
Occupancy by Educational Attainment in Dearborn County
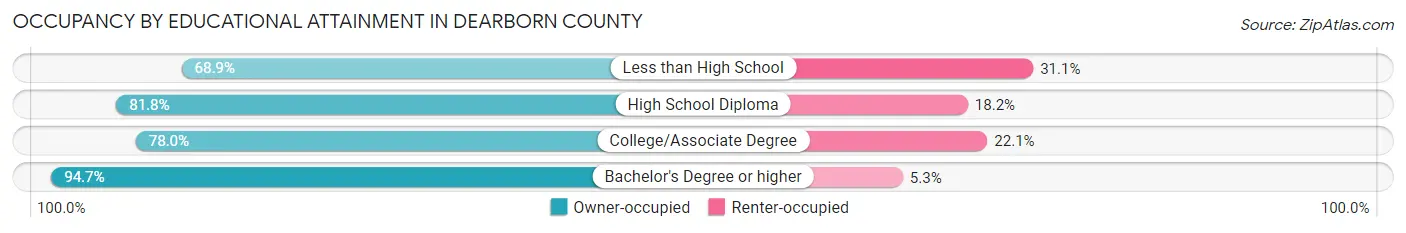
| Household Size | Owner-occupied | Renter-occupied |
| Less than High School | 933 (68.9%) | 422 (31.1%) |
| High School Diploma | 6,123 (81.8%) | 1,361 (18.2%) |
| College/Associate Degree | 4,578 (77.9%) | 1,295 (22.1%) |
| Bachelor's Degree or higher | 4,927 (94.7%) | 276 (5.3%) |
Occupancy by Age of Householder in Dearborn County
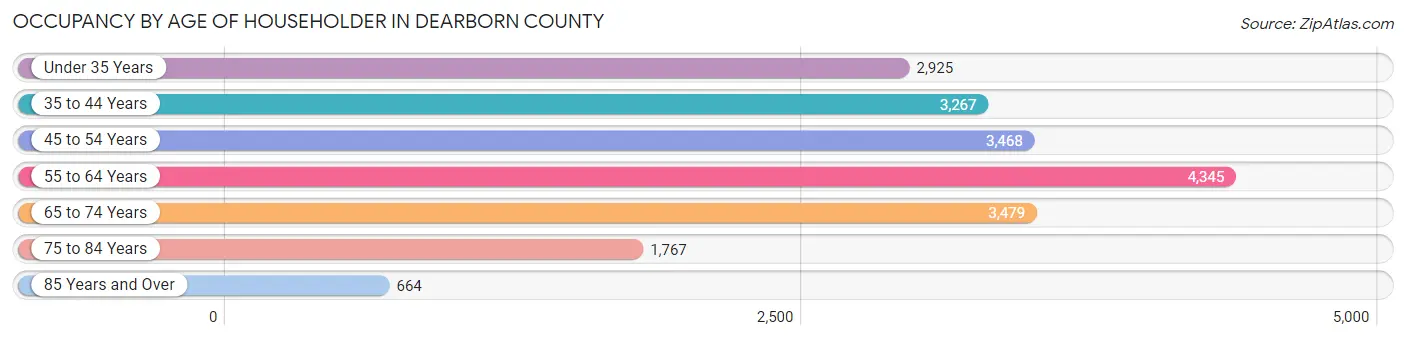
| Age Bracket | # Households | % Households |
| Under 35 Years | 2,925 | 14.7% |
| 35 to 44 Years | 3,267 | 16.4% |
| 45 to 54 Years | 3,468 | 17.4% |
| 55 to 64 Years | 4,345 | 21.8% |
| 65 to 74 Years | 3,479 | 17.5% |
| 75 to 84 Years | 1,767 | 8.9% |
| 85 Years and Over | 664 | 3.3% |
| Total | 19,915 | 100.0% |
Housing Finances in Dearborn County
Median Income by Occupancy in Dearborn County
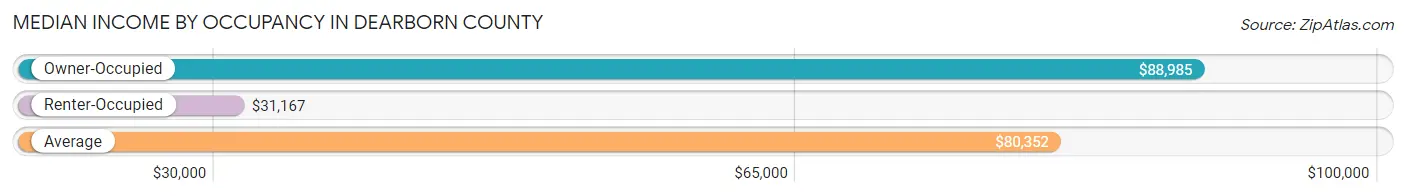
| Occupancy Type | # Households | Median Income |
| Owner-Occupied | 16,561 (83.2%) | $88,985 |
| Renter-Occupied | 3,354 (16.8%) | $31,167 |
| Average | 19,915 (100.0%) | $80,352 |
Occupancy by Householder Income Bracket in Dearborn County
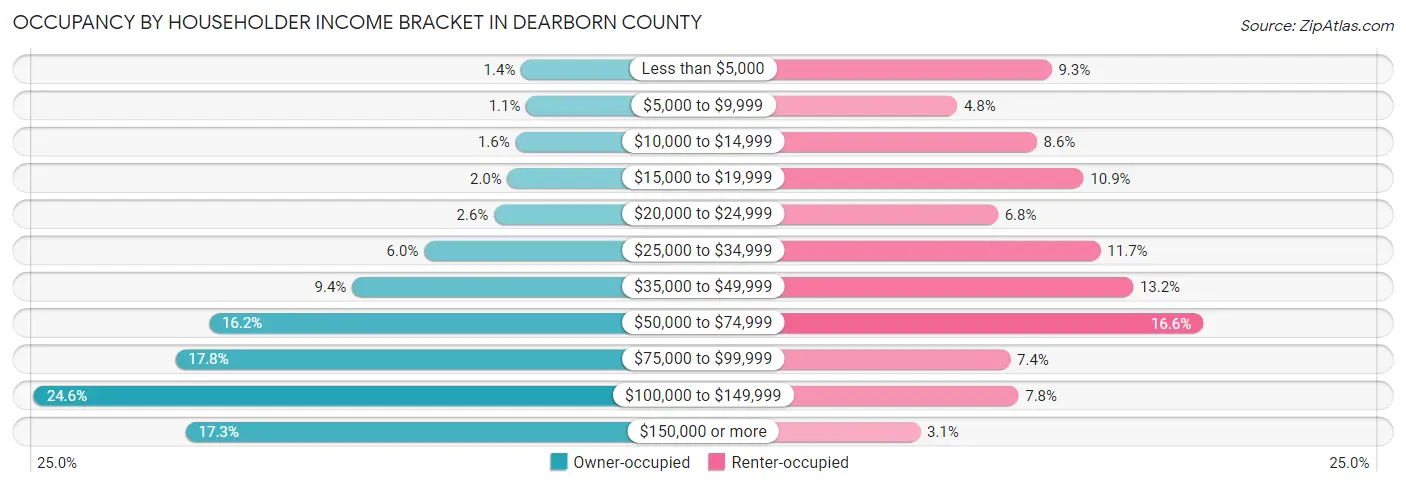
| Income Bracket | Owner-occupied | Renter-occupied |
| Less than $5,000 | 223 (1.3%) | 313 (9.3%) |
| $5,000 to $9,999 | 183 (1.1%) | 162 (4.8%) |
| $10,000 to $14,999 | 268 (1.6%) | 289 (8.6%) |
| $15,000 to $19,999 | 331 (2.0%) | 364 (10.8%) |
| $20,000 to $24,999 | 437 (2.6%) | 227 (6.8%) |
| $25,000 to $34,999 | 989 (6.0%) | 391 (11.7%) |
| $35,000 to $49,999 | 1,556 (9.4%) | 443 (13.2%) |
| $50,000 to $74,999 | 2,686 (16.2%) | 555 (16.6%) |
| $75,000 to $99,999 | 2,951 (17.8%) | 247 (7.4%) |
| $100,000 to $149,999 | 4,067 (24.6%) | 260 (7.7%) |
| $150,000 or more | 2,870 (17.3%) | 103 (3.1%) |
| Total | 16,561 (100.0%) | 3,354 (100.0%) |
Monthly Housing Cost Tiers in Dearborn County
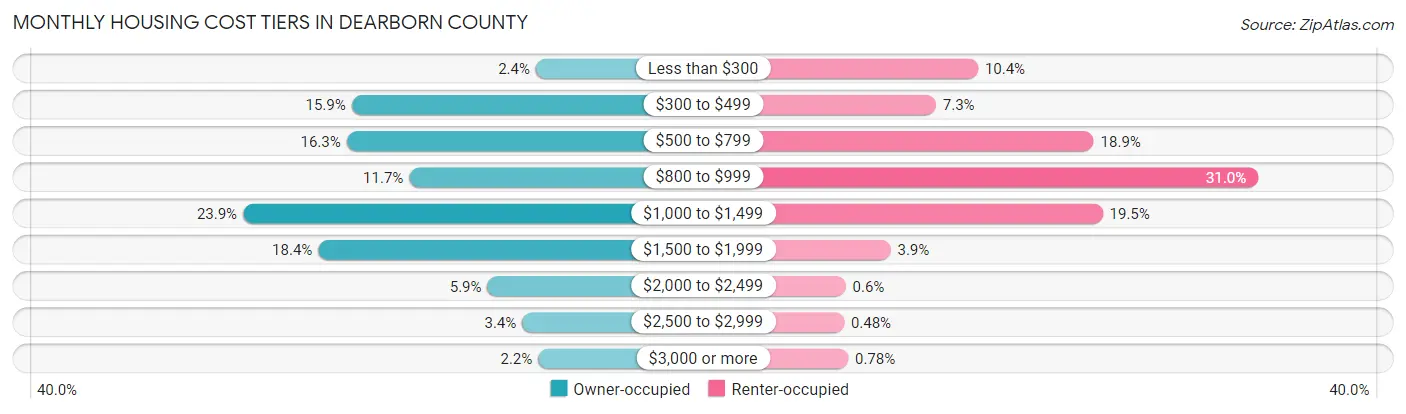
| Monthly Cost | Owner-occupied | Renter-occupied |
| Less than $300 | 390 (2.4%) | 347 (10.3%) |
| $300 to $499 | 2,637 (15.9%) | 243 (7.2%) |
| $500 to $799 | 2,697 (16.3%) | 633 (18.9%) |
| $800 to $999 | 1,934 (11.7%) | 1,039 (31.0%) |
| $1,000 to $1,499 | 3,961 (23.9%) | 655 (19.5%) |
| $1,500 to $1,999 | 3,044 (18.4%) | 131 (3.9%) |
| $2,000 to $2,499 | 980 (5.9%) | 20 (0.6%) |
| $2,500 to $2,999 | 557 (3.4%) | 16 (0.5%) |
| $3,000 or more | 361 (2.2%) | 26 (0.8%) |
| Total | 16,561 (100.0%) | 3,354 (100.0%) |
Physical Housing Characteristics in Dearborn County
Housing Structures in Dearborn County
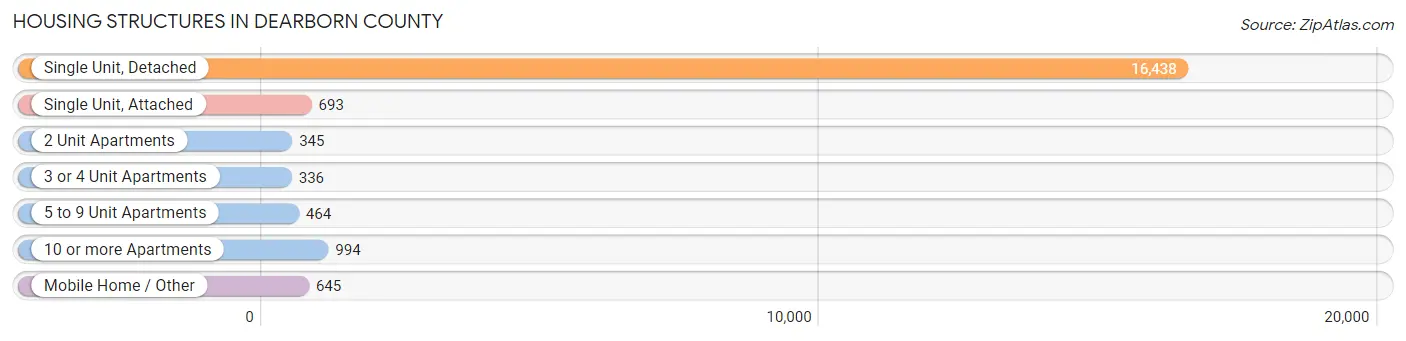
| Structure Type | # Housing Units | % Housing Units |
| Single Unit, Detached | 16,438 | 82.5% |
| Single Unit, Attached | 693 | 3.5% |
| 2 Unit Apartments | 345 | 1.7% |
| 3 or 4 Unit Apartments | 336 | 1.7% |
| 5 to 9 Unit Apartments | 464 | 2.3% |
| 10 or more Apartments | 994 | 5.0% |
| Mobile Home / Other | 645 | 3.2% |
| Total | 19,915 | 100.0% |
Housing Structures by Occupancy in Dearborn County
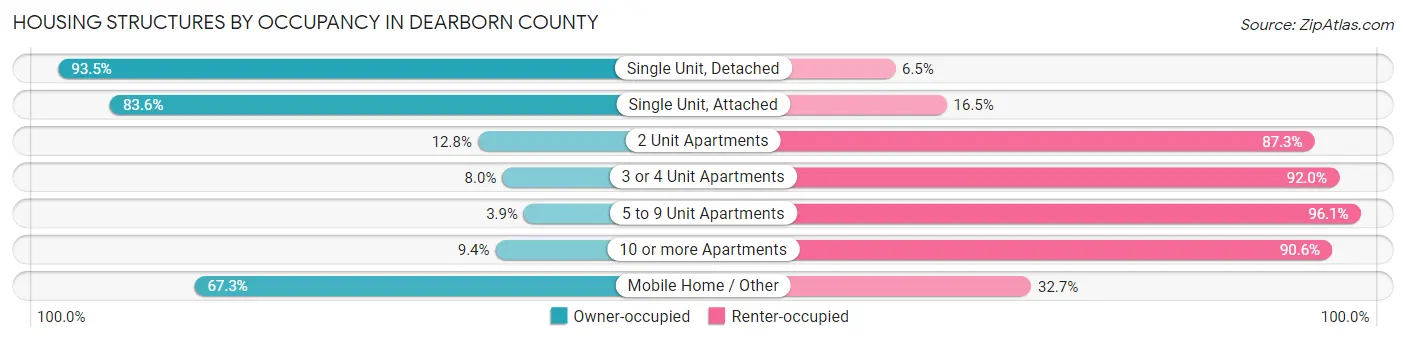
| Structure Type | Owner-occupied | Renter-occupied |
| Single Unit, Detached | 15,366 (93.5%) | 1,072 (6.5%) |
| Single Unit, Attached | 579 (83.6%) | 114 (16.5%) |
| 2 Unit Apartments | 44 (12.8%) | 301 (87.3%) |
| 3 or 4 Unit Apartments | 27 (8.0%) | 309 (92.0%) |
| 5 to 9 Unit Apartments | 18 (3.9%) | 446 (96.1%) |
| 10 or more Apartments | 93 (9.4%) | 901 (90.6%) |
| Mobile Home / Other | 434 (67.3%) | 211 (32.7%) |
| Total | 16,561 (83.2%) | 3,354 (16.8%) |
Housing Structures by Number of Rooms in Dearborn County
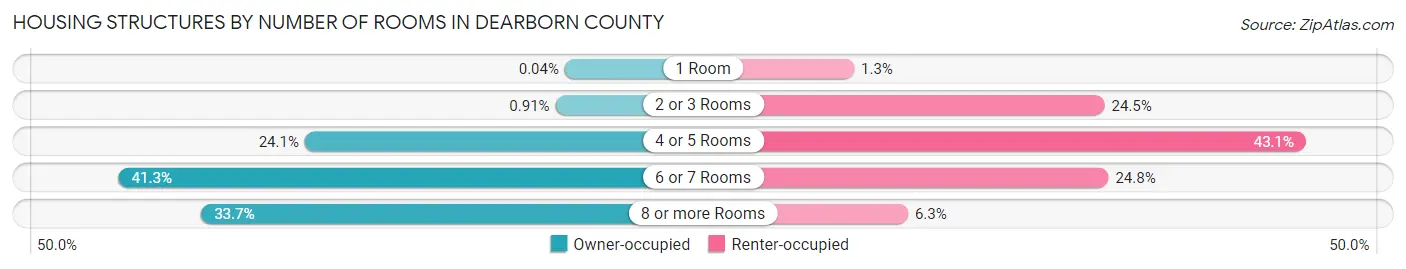
| Number of Rooms | Owner-occupied | Renter-occupied |
| 1 Room | 7 (0.0%) | 44 (1.3%) |
| 2 or 3 Rooms | 150 (0.9%) | 821 (24.5%) |
| 4 or 5 Rooms | 3,990 (24.1%) | 1,445 (43.1%) |
| 6 or 7 Rooms | 6,839 (41.3%) | 833 (24.8%) |
| 8 or more Rooms | 5,575 (33.7%) | 211 (6.3%) |
| Total | 16,561 (100.0%) | 3,354 (100.0%) |
Housing Structure by Heating Type in Dearborn County
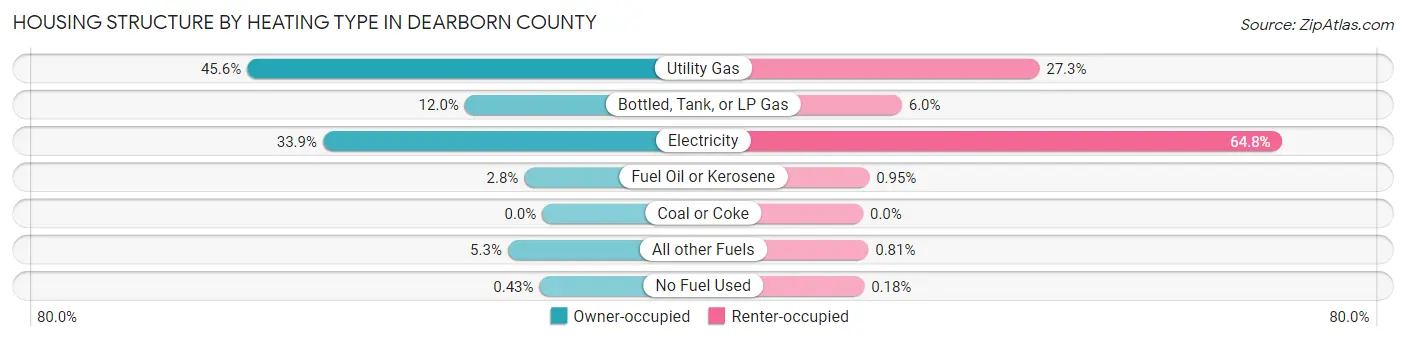
| Heating Type | Owner-occupied | Renter-occupied |
| Utility Gas | 7,555 (45.6%) | 914 (27.3%) |
| Bottled, Tank, or LP Gas | 1,983 (12.0%) | 201 (6.0%) |
| Electricity | 5,614 (33.9%) | 2,174 (64.8%) |
| Fuel Oil or Kerosene | 458 (2.8%) | 32 (0.9%) |
| Coal or Coke | 0 (0.0%) | 0 (0.0%) |
| All other Fuels | 880 (5.3%) | 27 (0.8%) |
| No Fuel Used | 71 (0.4%) | 6 (0.2%) |
| Total | 16,561 (100.0%) | 3,354 (100.0%) |
Household Vehicle Usage in Dearborn County
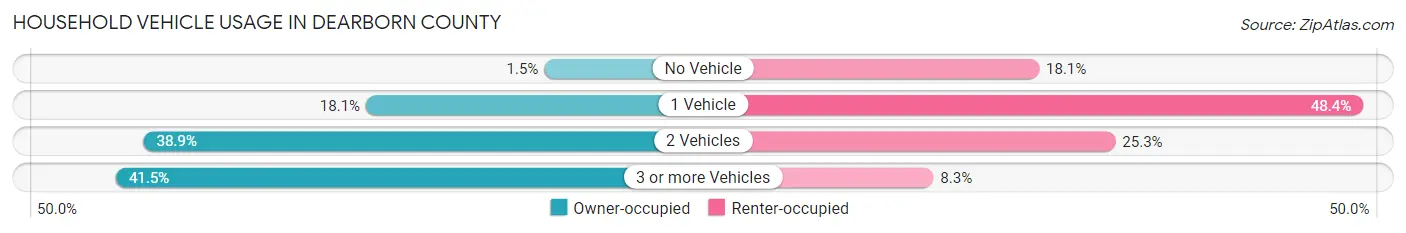
| Vehicles per Household | Owner-occupied | Renter-occupied |
| No Vehicle | 248 (1.5%) | 608 (18.1%) |
| 1 Vehicle | 3,004 (18.1%) | 1,622 (48.4%) |
| 2 Vehicles | 6,441 (38.9%) | 847 (25.3%) |
| 3 or more Vehicles | 6,868 (41.5%) | 277 (8.3%) |
| Total | 16,561 (100.0%) | 3,354 (100.0%) |
Real Estate & Mortgages in Dearborn County
Real Estate and Mortgage Overview in Dearborn County
| Characteristic | Without Mortgage | With Mortgage |
| Housing Units | 5,355 | 11,206 |
| Median Property Value | $193,200 | $218,100 |
| Median Household Income | $67,772 | $2,226 |
| Monthly Housing Costs | $480 | $361 |
| Real Estate Taxes | $1,568 | $199 |
Property Value by Mortgage Status in Dearborn County
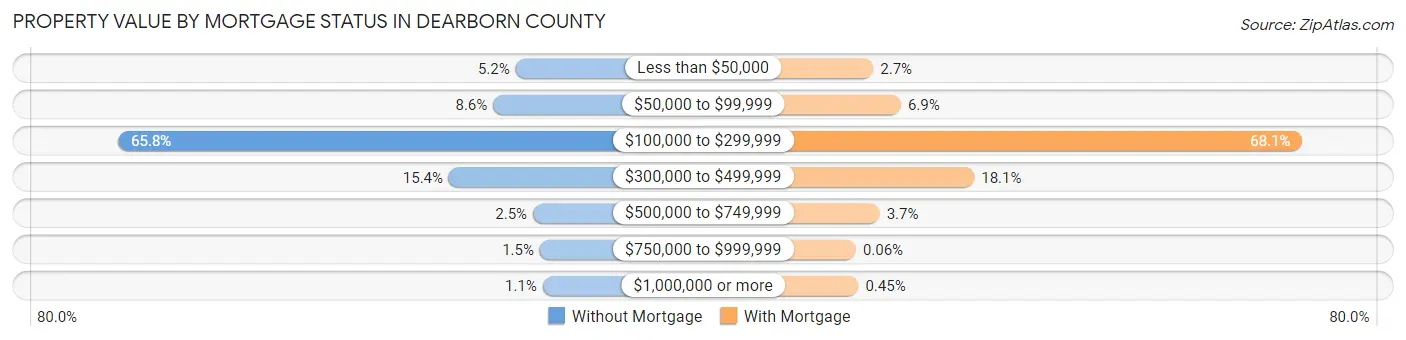
| Property Value | Without Mortgage | With Mortgage |
| Less than $50,000 | 278 (5.2%) | 304 (2.7%) |
| $50,000 to $99,999 | 461 (8.6%) | 775 (6.9%) |
| $100,000 to $299,999 | 3,522 (65.8%) | 7,630 (68.1%) |
| $300,000 to $499,999 | 822 (15.3%) | 2,027 (18.1%) |
| $500,000 to $749,999 | 136 (2.5%) | 413 (3.7%) |
| $750,000 to $999,999 | 80 (1.5%) | 7 (0.1%) |
| $1,000,000 or more | 56 (1.1%) | 50 (0.4%) |
| Total | 5,355 (100.0%) | 11,206 (100.0%) |
Household Income by Mortgage Status in Dearborn County
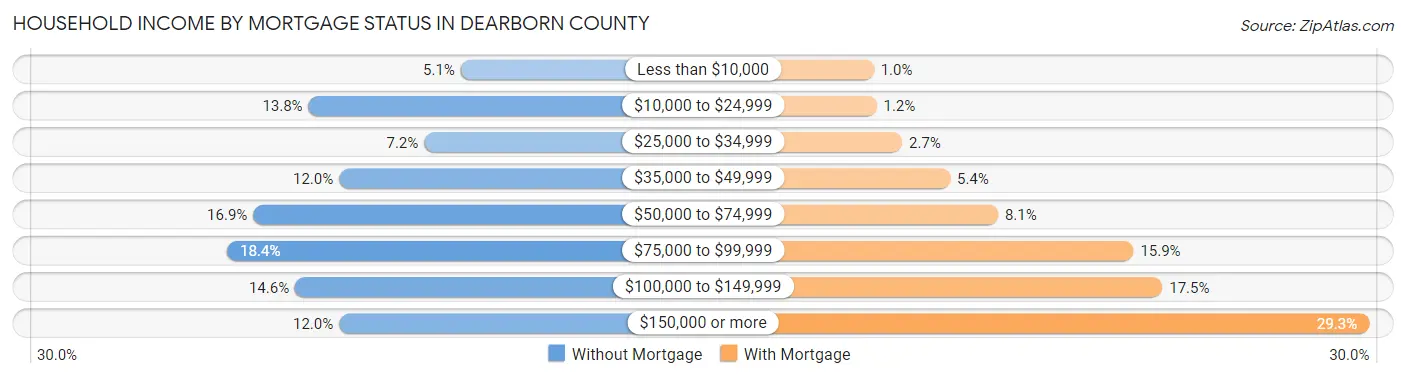
| Household Income | Without Mortgage | With Mortgage |
| Less than $10,000 | 272 (5.1%) | 116 (1.0%) |
| $10,000 to $24,999 | 738 (13.8%) | 134 (1.2%) |
| $25,000 to $34,999 | 384 (7.2%) | 298 (2.7%) |
| $35,000 to $49,999 | 644 (12.0%) | 605 (5.4%) |
| $50,000 to $74,999 | 907 (16.9%) | 912 (8.1%) |
| $75,000 to $99,999 | 987 (18.4%) | 1,779 (15.9%) |
| $100,000 to $149,999 | 779 (14.5%) | 1,964 (17.5%) |
| $150,000 or more | 644 (12.0%) | 3,288 (29.3%) |
| Total | 5,355 (100.0%) | 11,206 (100.0%) |
Property Value to Household Income Ratio in Dearborn County
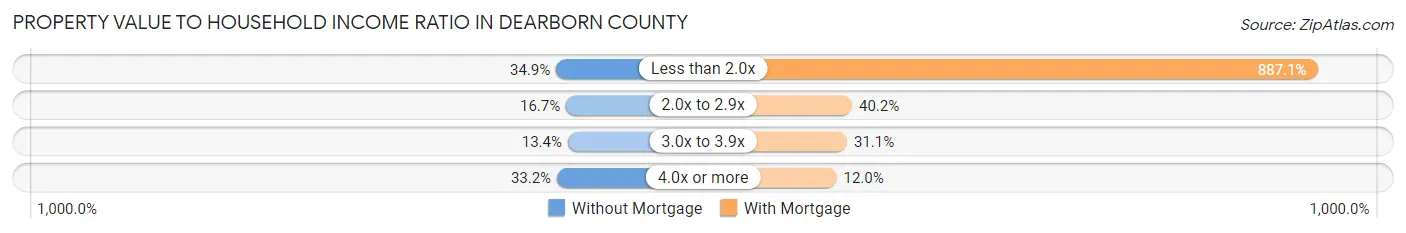
| Value-to-Income Ratio | Without Mortgage | With Mortgage |
| Less than 2.0x | 1,867 (34.9%) | 99,407 (887.1%) |
| 2.0x to 2.9x | 895 (16.7%) | 4,506 (40.2%) |
| 3.0x to 3.9x | 718 (13.4%) | 3,488 (31.1%) |
| 4.0x or more | 1,779 (33.2%) | 1,347 (12.0%) |
| Total | 5,355 (100.0%) | 11,206 (100.0%) |
Real Estate Taxes by Mortgage Status in Dearborn County
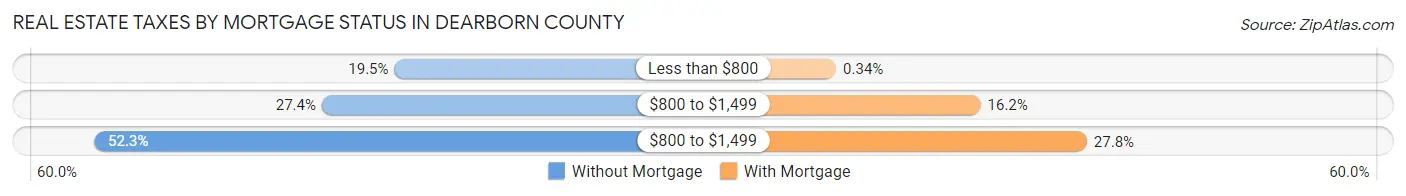
| Property Taxes | Without Mortgage | With Mortgage |
| Less than $800 | 1,043 (19.5%) | 38 (0.3%) |
| $800 to $1,499 | 1,469 (27.4%) | 1,812 (16.2%) |
| $800 to $1,499 | 2,799 (52.3%) | 3,117 (27.8%) |
| Total | 5,355 (100.0%) | 11,206 (100.0%) |
Health & Disability in Dearborn County
Health Insurance Coverage by Age in Dearborn County
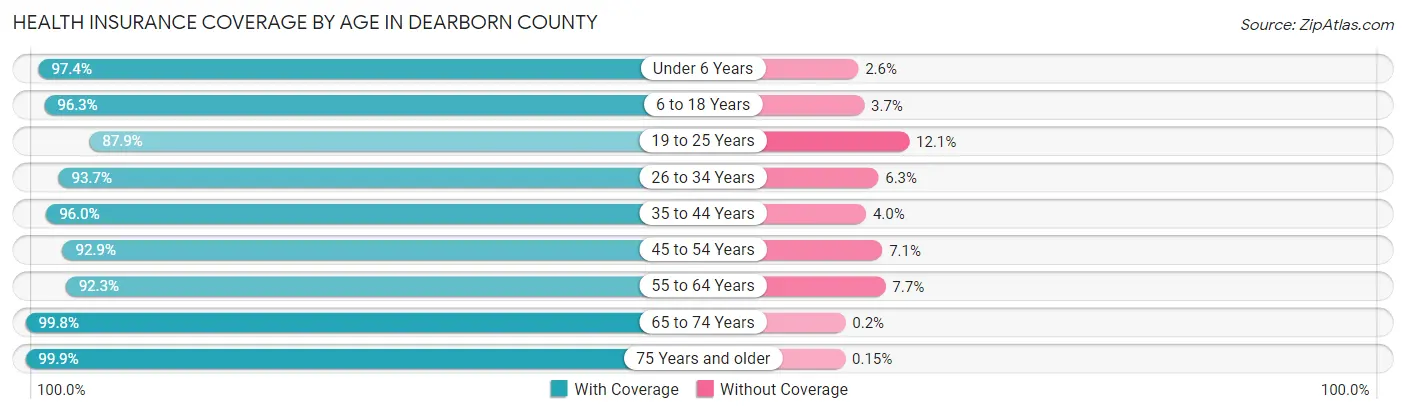
| Age Bracket | With Coverage | Without Coverage |
| Under 6 Years | 3,259 (97.4%) | 87 (2.6%) |
| 6 to 18 Years | 8,118 (96.3%) | 311 (3.7%) |
| 19 to 25 Years | 3,453 (87.9%) | 475 (12.1%) |
| 26 to 34 Years | 4,743 (93.7%) | 321 (6.3%) |
| 35 to 44 Years | 5,822 (96.0%) | 245 (4.0%) |
| 45 to 54 Years | 6,330 (92.9%) | 482 (7.1%) |
| 55 to 64 Years | 6,943 (92.3%) | 577 (7.7%) |
| 65 to 74 Years | 5,608 (99.8%) | 11 (0.2%) |
| 75 Years and older | 3,424 (99.9%) | 5 (0.2%) |
| Total | 47,700 (95.0%) | 2,514 (5.0%) |
Health Insurance Coverage by Citizenship Status in Dearborn County
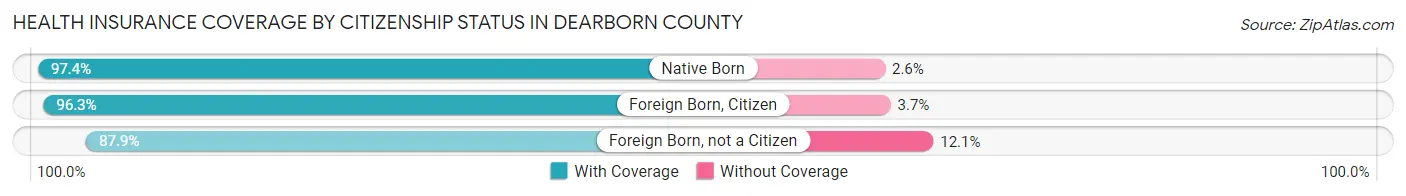
| Citizenship Status | With Coverage | Without Coverage |
| Native Born | 3,259 (97.4%) | 87 (2.6%) |
| Foreign Born, Citizen | 8,118 (96.3%) | 311 (3.7%) |
| Foreign Born, not a Citizen | 3,453 (87.9%) | 475 (12.1%) |
Health Insurance Coverage by Household Income in Dearborn County
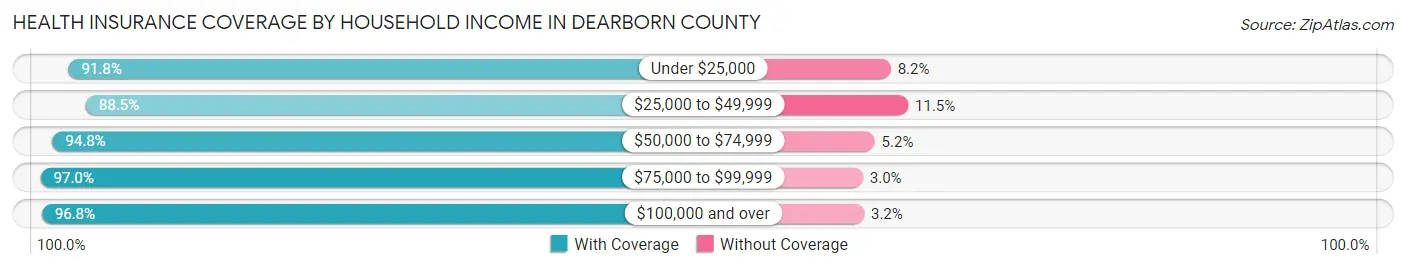
| Household Income | With Coverage | Without Coverage |
| Under $25,000 | 4,079 (91.8%) | 366 (8.2%) |
| $25,000 to $49,999 | 5,680 (88.5%) | 737 (11.5%) |
| $50,000 to $74,999 | 6,958 (94.8%) | 383 (5.2%) |
| $75,000 to $99,999 | 8,256 (97.0%) | 256 (3.0%) |
| $100,000 and over | 22,688 (96.8%) | 758 (3.2%) |
Public vs Private Health Insurance Coverage by Age in Dearborn County
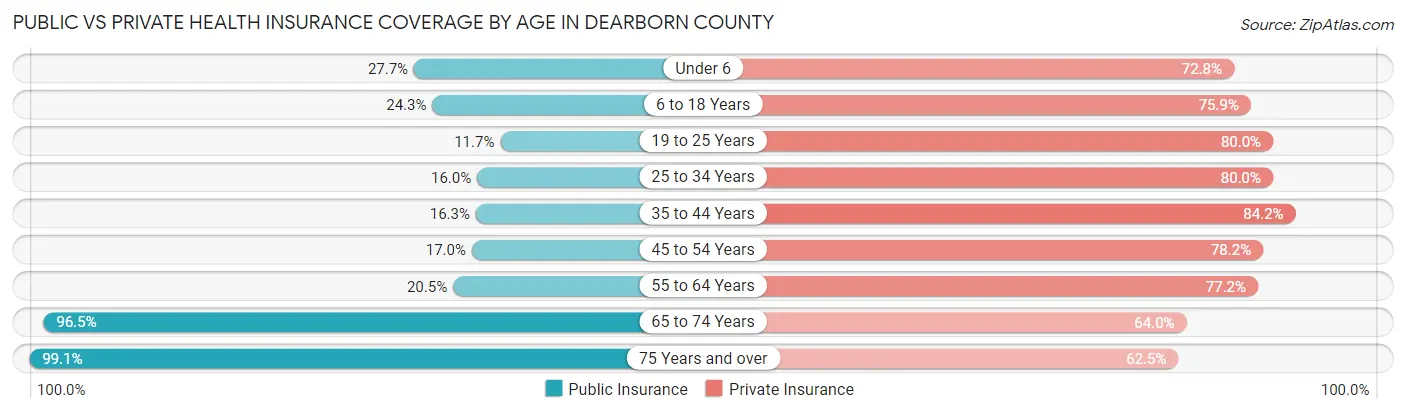
| Age Bracket | Public Insurance | Private Insurance |
| Under 6 | 928 (27.7%) | 2,435 (72.8%) |
| 6 to 18 Years | 2,051 (24.3%) | 6,398 (75.9%) |
| 19 to 25 Years | 460 (11.7%) | 3,143 (80.0%) |
| 25 to 34 Years | 811 (16.0%) | 4,051 (80.0%) |
| 35 to 44 Years | 986 (16.3%) | 5,108 (84.2%) |
| 45 to 54 Years | 1,158 (17.0%) | 5,325 (78.2%) |
| 55 to 64 Years | 1,541 (20.5%) | 5,807 (77.2%) |
| 65 to 74 Years | 5,424 (96.5%) | 3,594 (64.0%) |
| 75 Years and over | 3,399 (99.1%) | 2,142 (62.5%) |
| Total | 16,758 (33.4%) | 38,003 (75.7%) |
Disability Status by Sex by Age in Dearborn County
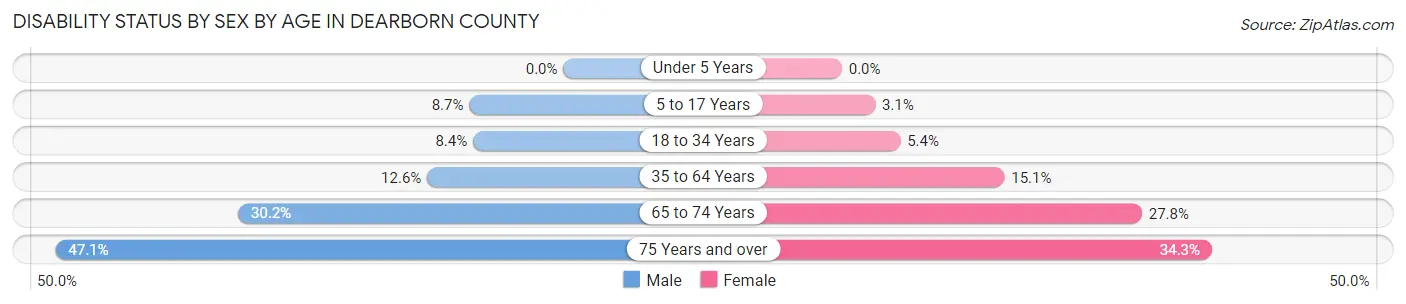
| Age Bracket | Male | Female |
| Under 5 Years | 0 (0.0%) | 0 (0.0%) |
| 5 to 17 Years | 380 (8.7%) | 129 (3.1%) |
| 18 to 34 Years | 404 (8.4%) | 256 (5.4%) |
| 35 to 64 Years | 1,292 (12.6%) | 1,535 (15.1%) |
| 65 to 74 Years | 841 (30.2%) | 789 (27.8%) |
| 75 Years and over | 691 (47.1%) | 674 (34.3%) |
Disability Class by Sex by Age in Dearborn County
Disability Class: Hearing Difficulty
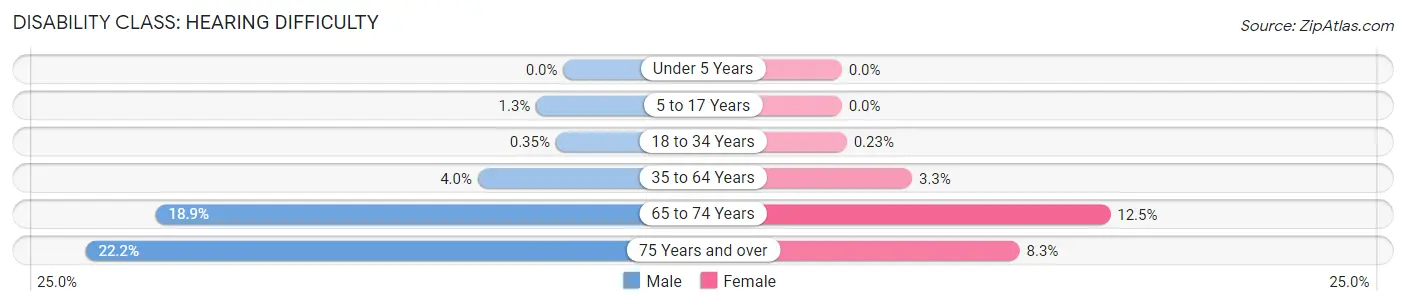
| Age Bracket | Male | Female |
| Under 5 Years | 0 (0.0%) | 0 (0.0%) |
| 5 to 17 Years | 55 (1.3%) | 0 (0.0%) |
| 18 to 34 Years | 17 (0.4%) | 11 (0.2%) |
| 35 to 64 Years | 406 (4.0%) | 332 (3.3%) |
| 65 to 74 Years | 527 (18.9%) | 353 (12.5%) |
| 75 Years and over | 325 (22.2%) | 162 (8.3%) |
Disability Class: Vision Difficulty
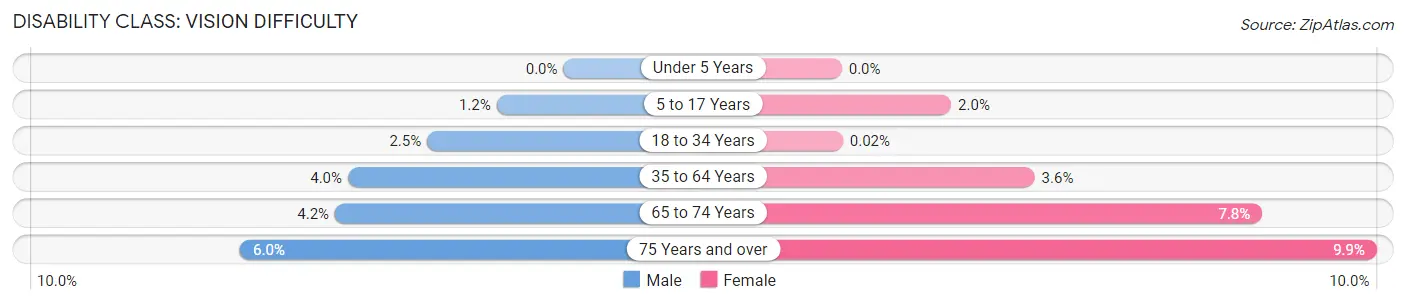
| Age Bracket | Male | Female |
| Under 5 Years | 0 (0.0%) | 0 (0.0%) |
| 5 to 17 Years | 54 (1.2%) | 85 (2.0%) |
| 18 to 34 Years | 122 (2.5%) | 1 (0.0%) |
| 35 to 64 Years | 409 (4.0%) | 364 (3.6%) |
| 65 to 74 Years | 118 (4.2%) | 221 (7.8%) |
| 75 Years and over | 88 (6.0%) | 195 (9.9%) |
Disability Class: Cognitive Difficulty
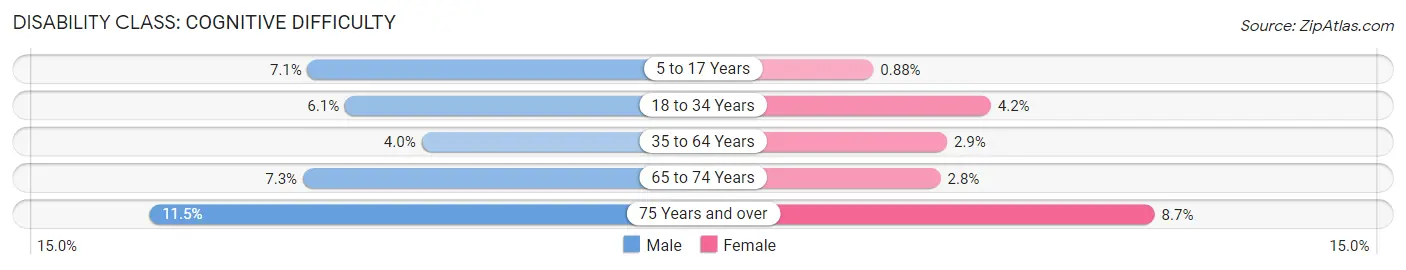
| Age Bracket | Male | Female |
| 5 to 17 Years | 310 (7.1%) | 37 (0.9%) |
| 18 to 34 Years | 293 (6.1%) | 196 (4.2%) |
| 35 to 64 Years | 404 (4.0%) | 298 (2.9%) |
| 65 to 74 Years | 202 (7.2%) | 78 (2.8%) |
| 75 Years and over | 169 (11.5%) | 171 (8.7%) |
Disability Class: Ambulatory Difficulty
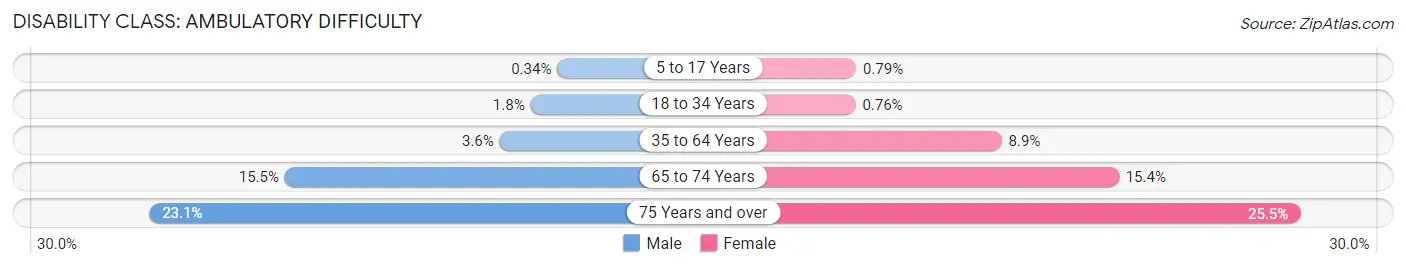
| Age Bracket | Male | Female |
| 5 to 17 Years | 15 (0.3%) | 33 (0.8%) |
| 18 to 34 Years | 88 (1.8%) | 36 (0.8%) |
| 35 to 64 Years | 363 (3.5%) | 906 (8.9%) |
| 65 to 74 Years | 432 (15.5%) | 437 (15.4%) |
| 75 Years and over | 338 (23.1%) | 501 (25.5%) |
Disability Class: Self-Care Difficulty
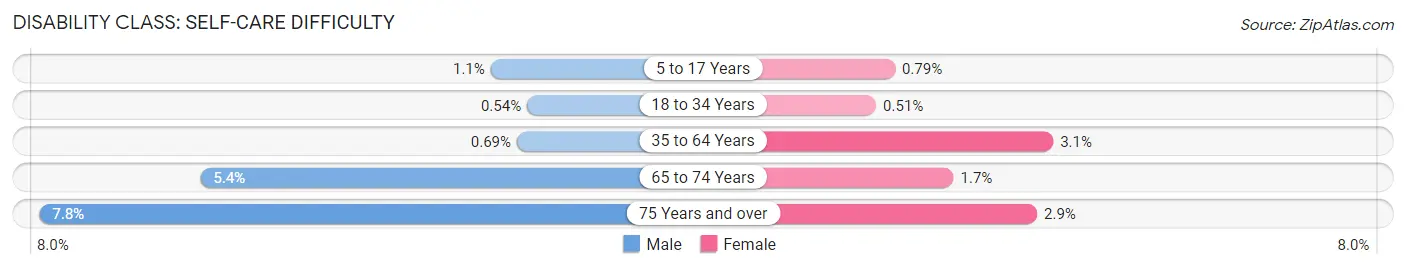
| Age Bracket | Male | Female |
| 5 to 17 Years | 47 (1.1%) | 33 (0.8%) |
| 18 to 34 Years | 26 (0.5%) | 24 (0.5%) |
| 35 to 64 Years | 71 (0.7%) | 320 (3.1%) |
| 65 to 74 Years | 150 (5.4%) | 47 (1.7%) |
| 75 Years and over | 114 (7.8%) | 57 (2.9%) |
Technology Access in Dearborn County
Computing Device Access in Dearborn County
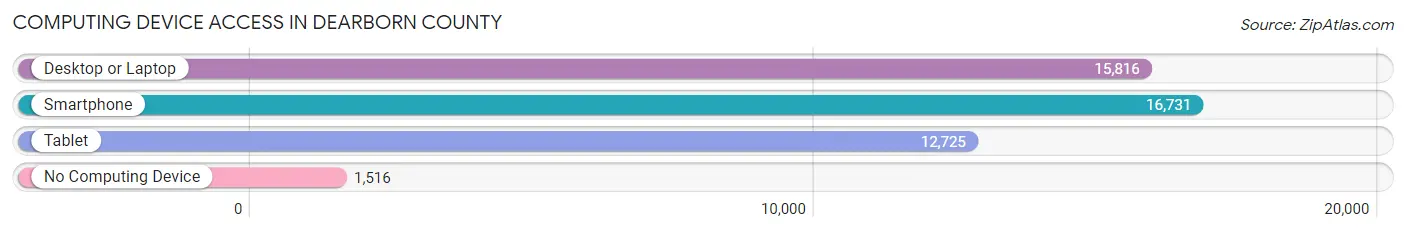
| Device Type | # Households | % Households |
| Desktop or Laptop | 15,816 | 79.4% |
| Smartphone | 16,731 | 84.0% |
| Tablet | 12,725 | 63.9% |
| No Computing Device | 1,516 | 7.6% |
| Total | 19,915 | 100.0% |
Internet Access in Dearborn County
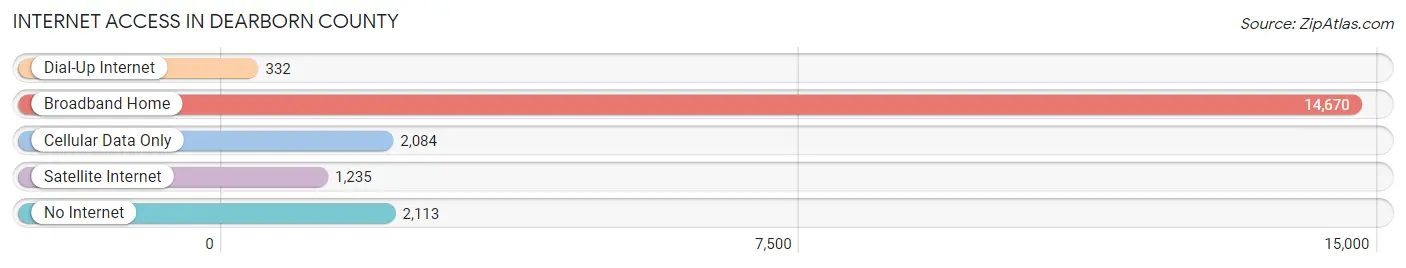
| Internet Type | # Households | % Households |
| Dial-Up Internet | 332 | 1.7% |
| Broadband Home | 14,670 | 73.7% |
| Cellular Data Only | 2,084 | 10.5% |
| Satellite Internet | 1,235 | 6.2% |
| No Internet | 2,113 | 10.6% |
| Total | 19,915 | 100.0% |
Dearborn County Summary
Introduction
Located in the southeastern corner of Indiana, Dearborn County is a rural county with a population of 50,047 as of the 2010 census. The county seat is Lawrenceburg, and the county is part of the Cincinnati-Middletown Metropolitan Statistical Area. Dearborn County is known for its rolling hills, lush forests, and winding rivers, making it a popular destination for outdoor recreation. The county is also home to several historic sites, including the John Paul II Cultural Center and the Lawrenceburg Historic District.
History
Dearborn County was formed in 1803 from parts of Hamilton and Wayne counties. It was named after General Henry Dearborn, who served as Secretary of War under President Thomas Jefferson. The county was originally part of the Northwest Territory, and was later part of the Indiana Territory. The county was officially organized in 1817.
The county was largely agricultural in its early years, with the majority of the population living in small farming communities. The county was also home to several industries, including a woolen mill, a paper mill, and a distillery.
In the late 19th century, the county began to experience a period of growth and development. The Cincinnati, Lawrenceburg, and Aurora Railroad was built in 1881, connecting the county to Cincinnati and other cities in the region. This allowed for increased trade and commerce, and the county’s population began to grow.
Geography
Dearborn County is located in the southeastern corner of Indiana, and is bordered by Ohio to the east, Franklin County to the south, Ripley County to the west, and Switzerland County to the north. The county covers an area of 437 square miles, and is mostly rural, with only a few small towns and villages.
The county is located in the Central Till Plains region of Indiana, and is characterized by rolling hills and lush forests. The county is home to several rivers, including the Great Miami River, the Whitewater River, and the Ohio River.
Economy
The economy of Dearborn County is largely based on agriculture and manufacturing. The county is home to several large farms, and is a major producer of corn, soybeans, and wheat. The county is also home to several manufacturing companies, including a paper mill, a distillery, and a steel mill.
The county is also home to several tourist attractions, including the John Paul II Cultural Center, the Lawrenceburg Historic District, and the Whitewater Valley Railroad. These attractions bring in visitors from all over the region, and help to boost the local economy.
Demographics
As of the 2010 census, the population of Dearborn County was 50,047. The population is largely white (94.3%), with small percentages of African Americans (2.3%), Hispanics (1.3%), and Asians (0.7%). The median household income is $50,945, and the median age is 41.
Conclusion
Dearborn County is a rural county located in the southeastern corner of Indiana. The county is known for its rolling hills, lush forests, and winding rivers, making it a popular destination for outdoor recreation. The county is also home to several historic sites, and is a major producer of corn, soybeans, and wheat. The population of Dearborn County is largely white, with a median household income of $50,945 and a median age of 41.
Common Questions
What is the Total Population of Dearborn County?
Total Population of Dearborn County is 50,709.
What is the Total Male Population of Dearborn County?
Total Male Population of Dearborn County is 25,306.
What is the Total Female Population of Dearborn County?
Total Female Population of Dearborn County is 25,403.
What is the Ratio of Males per 100 Females in Dearborn County?
There are 99.62 Males per 100 Females in Dearborn County.
What is the Ratio of Females per 100 Males in Dearborn County?
There are 100.38 Females per 100 Males in Dearborn County.
What is the Median Population Age in Dearborn County?
Median Population Age in Dearborn County is 42.3 Years.
What is the Average Family Size in Dearborn County
Average Family Size in Dearborn County is 3.0 People.
What is the Average Household Size in Dearborn County
Average Household Size in Dearborn County is 2.5 People.
What is Per Capita Income in Dearborn County?
Per Capita income in Dearborn County is $36,005.
What is the Median Family Income in Dearborn County?
Median Family Income in Dearborn County is $94,954.
What is the Median Household income in Dearborn County?
Median Household Income in Dearborn County is $80,352.
What is Income or Wage Gap in Dearborn County?
Income or Wage Gap in Dearborn County is 37.8%.
Women in Dearborn County earn 62.2 cents for every dollar earned by a man.
What is Family Income Deficit in Dearborn County?
Family Income Deficit in Dearborn County is $13,594.
Families that are below poverty line in Dearborn County earn $13,594 less on average than the poverty threshold level.
What is Inequality or Gini Index in Dearborn County?
Inequality or Gini Index in Dearborn County is 0.40.
How Large is the Labor Force in Dearborn County?
There are 26,353 People in the Labor Forcein in Dearborn County.
What is the Percentage of People in the Labor Force in Dearborn County?
64.3% of People are in the Labor Force in Dearborn County.
What is the Unemployment Rate in Dearborn County?
Unemployment Rate in Dearborn County is 2.1%.