Daviess County, IN
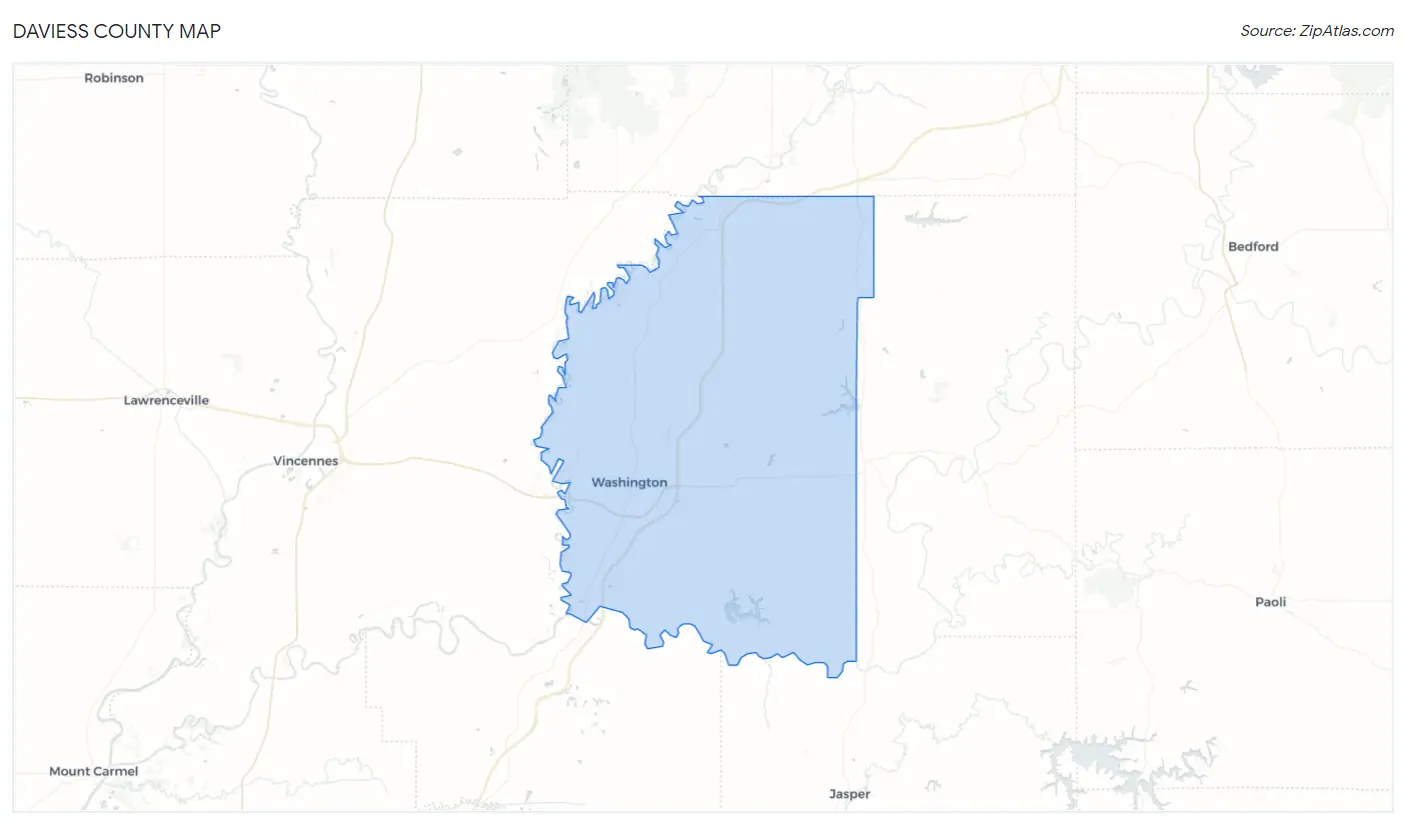
Daviess County Map
Daviess County Overview
33,337
TOTAL POPULATION
16,621
MALE POPULATION
16,716
FEMALE POPULATION
99.43
MALES / 100 FEMALES
100.57
FEMALES / 100 MALES
34.9
MEDIAN AGE
3.4
AVG FAMILY SIZE
2.8
AVG HOUSEHOLD SIZE
$28,886
PER CAPITA INCOME
$82,994
AVG FAMILY INCOME
$64,113
AVG HOUSEHOLD INCOME
43.5%
WAGE / INCOME GAP [ % ]
56.5¢/ $1
WAGE / INCOME GAP [ $ ]
$10,422
FAMILY INCOME DEFICIT
0.42
INEQUALITY / GINI INDEX
15,570
LABOR FORCE [ PEOPLE ]
62.9%
PERCENT IN LABOR FORCE
1.9%
UNEMPLOYMENT RATE
Daviess County Area Codes
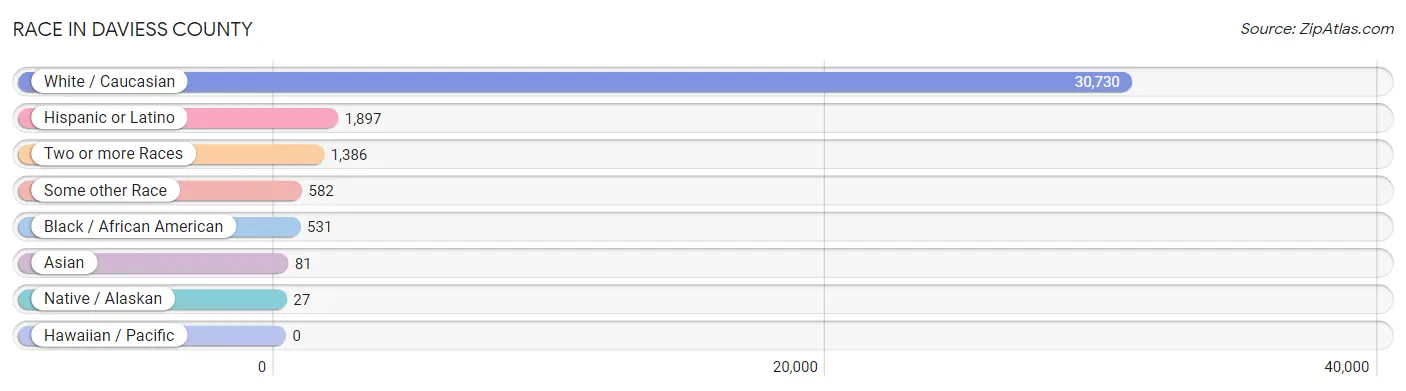
Race in Daviess County
The most populous races in Daviess County are White / Caucasian (30,730 | 92.2%), Hispanic or Latino (1,897 | 5.7%), and Two or more Races (1,386 | 4.2%).
| Race | # Population | % Population |
| Asian | 81 | 0.2% |
| Black / African American | 531 | 1.6% |
| Hawaiian / Pacific | 0 | 0.0% |
| Hispanic or Latino | 1,897 | 5.7% |
| Native / Alaskan | 27 | 0.1% |
| White / Caucasian | 30,730 | 92.2% |
| Two or more Races | 1,386 | 4.2% |
| Some other Race | 582 | 1.8% |
| Total | 33,337 | 100.0% |
Ancestry in Daviess County
The most populous ancestries reported in Daviess County are German (6,880 | 20.6%), American (3,242 | 9.7%), Irish (3,065 | 9.2%), English (2,833 | 8.5%), and Mexican (1,293 | 3.9%), together accounting for 51.9% of all Daviess County residents.

| Ancestry | # Population | % Population |
| African | 57 | 0.2% |
| American | 3,242 | 9.7% |
| Austrian | 18 | 0.1% |
| Basque | 11 | 0.0% |
| Belgian | 33 | 0.1% |
| Belizean | 12 | 0.0% |
| Bhutanese | 59 | 0.2% |
| Blackfeet | 12 | 0.0% |
| British | 101 | 0.3% |
| Burmese | 9 | 0.0% |
| Canadian | 38 | 0.1% |
| Central American | 478 | 1.4% |
| Cherokee | 30 | 0.1% |
| Chinese | 35 | 0.1% |
| Chippewa | 9 | 0.0% |
| Comanche | 15 | 0.0% |
| Croatian | 40 | 0.1% |
| Cuban | 11 | 0.0% |
| Czech | 24 | 0.1% |
| Danish | 22 | 0.1% |
| Delaware | 4 | 0.0% |
| Dutch | 276 | 0.8% |
| Eastern European | 4 | 0.0% |
| Ecuadorian | 9 | 0.0% |
| English | 2,833 | 8.5% |
| European | 446 | 1.3% |
| French | 632 | 1.9% |
| French Canadian | 117 | 0.4% |
| German | 6,880 | 20.6% |
| Guatemalan | 137 | 0.4% |
| Haitian | 605 | 1.8% |
| Hungarian | 15 | 0.0% |
| Indian (Asian) | 4 | 0.0% |
| Iranian | 7 | 0.0% |
| Irish | 3,065 | 9.2% |
| Italian | 144 | 0.4% |
| Korean | 28 | 0.1% |
| Lumbee | 45 | 0.1% |
| Macedonian | 9 | 0.0% |
| Mexican | 1,293 | 3.9% |
| Nigerian | 32 | 0.1% |
| Northern European | 47 | 0.1% |
| Norwegian | 119 | 0.4% |
| Pennsylvania German | 219 | 0.7% |
| Polish | 233 | 0.7% |
| Portuguese | 66 | 0.2% |
| Puerto Rican | 46 | 0.1% |
| Russian | 21 | 0.1% |
| Salvadoran | 341 | 1.0% |
| Scandinavian | 12 | 0.0% |
| Scotch-Irish | 206 | 0.6% |
| Scottish | 360 | 1.1% |
| Sioux | 11 | 0.0% |
| Slavic | 2 | 0.0% |
| Slovak | 8 | 0.0% |
| Slovene | 6 | 0.0% |
| South American | 9 | 0.0% |
| Spaniard | 10 | 0.0% |
| Sri Lankan | 8 | 0.0% |
| Subsaharan African | 99 | 0.3% |
| Swedish | 71 | 0.2% |
| Swiss | 706 | 2.1% |
| Thai | 24 | 0.1% |
| Welsh | 128 | 0.4% |
| Yugoslavian | 120 | 0.4% | View All 65 Rows |
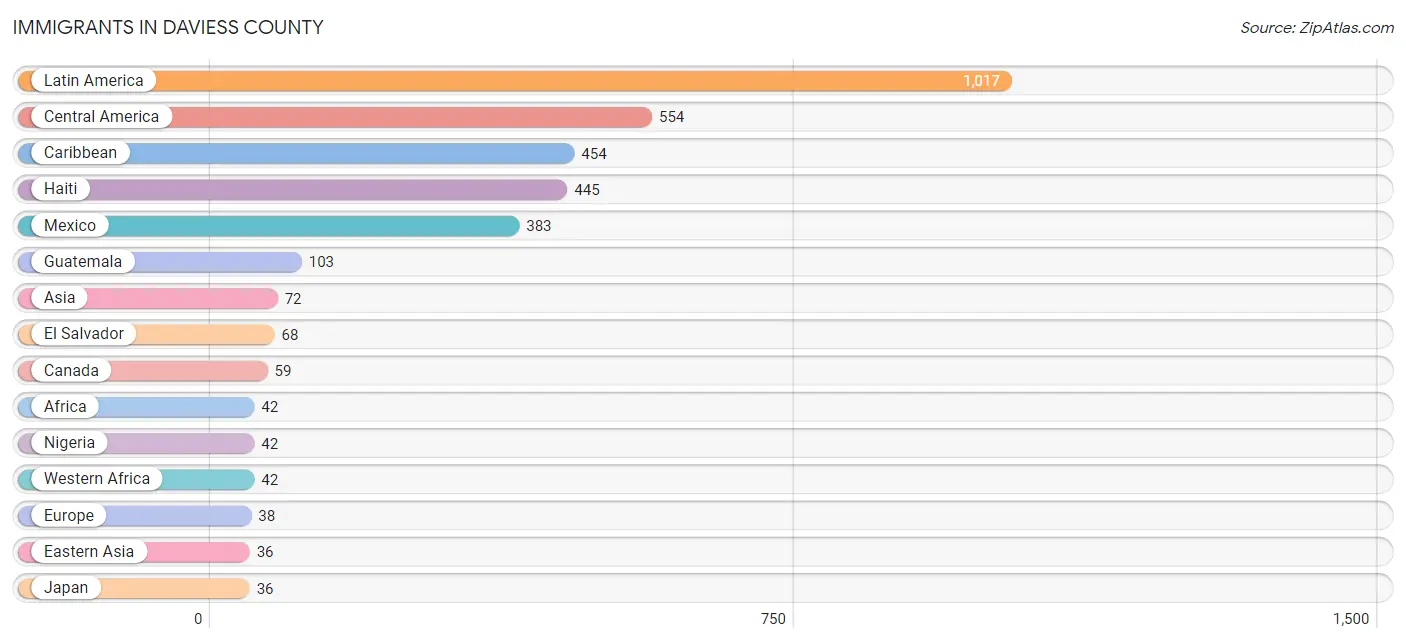
Immigrants in Daviess County
The most numerous immigrant groups reported in Daviess County came from Latin America (1,017 | 3.0%), Central America (554 | 1.7%), Caribbean (454 | 1.4%), Haiti (445 | 1.3%), and Mexico (383 | 1.1%), together accounting for 8.6% of all Daviess County residents.
| Immigration Origin | # Population | % Population |
| Africa | 42 | 0.1% |
| Asia | 72 | 0.2% |
| Belgium | 2 | 0.0% |
| Canada | 59 | 0.2% |
| Caribbean | 454 | 1.4% |
| Central America | 554 | 1.7% |
| Cuba | 9 | 0.0% |
| Denmark | 2 | 0.0% |
| Eastern Asia | 36 | 0.1% |
| Ecuador | 9 | 0.0% |
| El Salvador | 68 | 0.2% |
| England | 5 | 0.0% |
| Europe | 38 | 0.1% |
| Germany | 19 | 0.1% |
| Guatemala | 103 | 0.3% |
| Haiti | 445 | 1.3% |
| India | 18 | 0.1% |
| Japan | 36 | 0.1% |
| Latin America | 1,017 | 3.0% |
| Mexico | 383 | 1.1% |
| Nigeria | 42 | 0.1% |
| Northern Europe | 17 | 0.1% |
| Pakistan | 10 | 0.0% |
| Philippines | 8 | 0.0% |
| South America | 9 | 0.0% |
| South Central Asia | 28 | 0.1% |
| South Eastern Asia | 8 | 0.0% |
| Western Africa | 42 | 0.1% |
| Western Europe | 21 | 0.1% | View All 29 Rows |
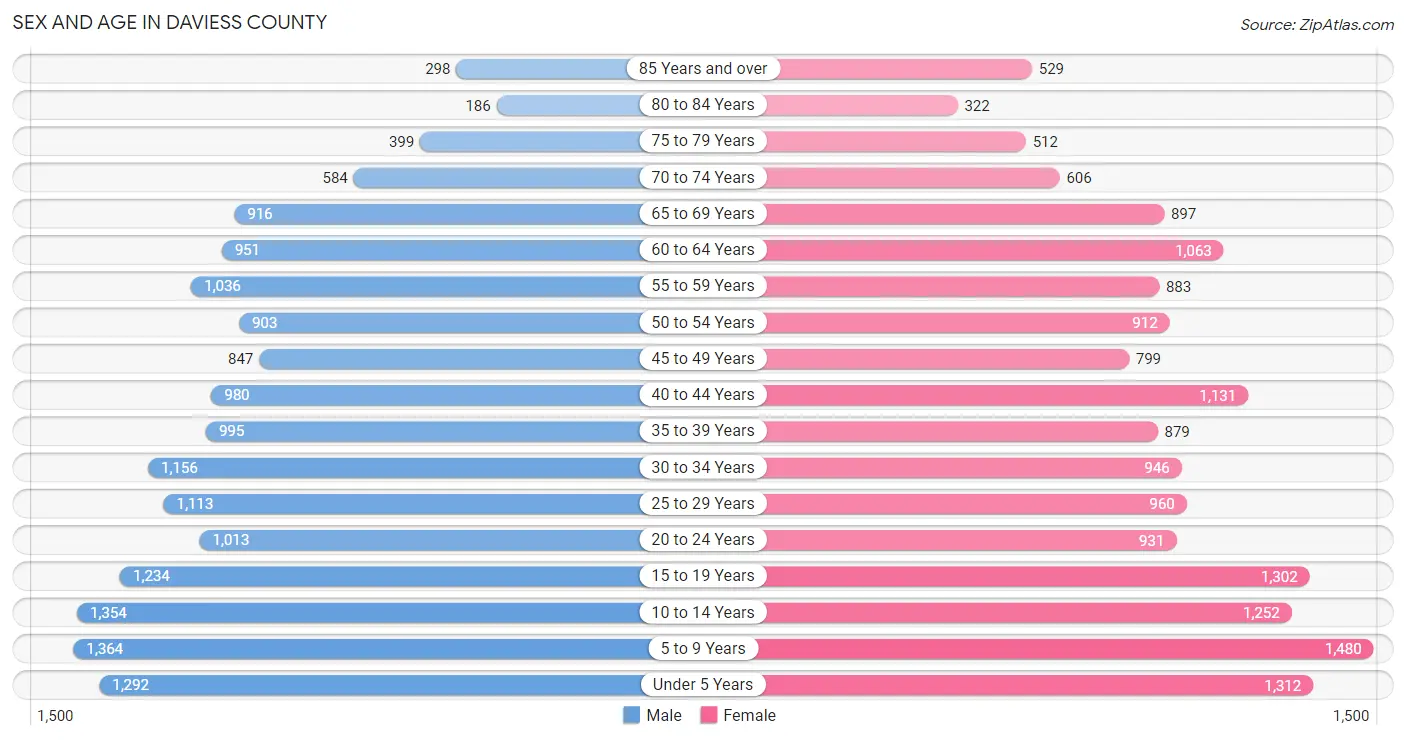
Sex and Age in Daviess County
Sex and Age in Daviess County
The most populous age groups in Daviess County are 5 to 9 Years (1,364 | 8.2%) for men and 5 to 9 Years (1,480 | 8.8%) for women.
| Age Bracket | Male | Female |
| Under 5 Years | 1,292 (7.8%) | 1,312 (7.9%) |
| 5 to 9 Years | 1,364 (8.2%) | 1,480 (8.8%) |
| 10 to 14 Years | 1,354 (8.2%) | 1,252 (7.5%) |
| 15 to 19 Years | 1,234 (7.4%) | 1,302 (7.8%) |
| 20 to 24 Years | 1,013 (6.1%) | 931 (5.6%) |
| 25 to 29 Years | 1,113 (6.7%) | 960 (5.7%) |
| 30 to 34 Years | 1,156 (7.0%) | 946 (5.7%) |
| 35 to 39 Years | 995 (6.0%) | 879 (5.3%) |
| 40 to 44 Years | 980 (5.9%) | 1,131 (6.8%) |
| 45 to 49 Years | 847 (5.1%) | 799 (4.8%) |
| 50 to 54 Years | 903 (5.4%) | 912 (5.5%) |
| 55 to 59 Years | 1,036 (6.2%) | 883 (5.3%) |
| 60 to 64 Years | 951 (5.7%) | 1,063 (6.4%) |
| 65 to 69 Years | 916 (5.5%) | 897 (5.4%) |
| 70 to 74 Years | 584 (3.5%) | 606 (3.6%) |
| 75 to 79 Years | 399 (2.4%) | 512 (3.1%) |
| 80 to 84 Years | 186 (1.1%) | 322 (1.9%) |
| 85 Years and over | 298 (1.8%) | 529 (3.2%) |
| Total | 16,621 (100.0%) | 16,716 (100.0%) |
Families and Households in Daviess County
Median Family Size in Daviess County
The median family size in Daviess County is 3.44 persons per family, with married-couple families (6,805 | 83.8%) accounting for the largest median family size of 3.52 persons per family. On the other hand, single female/mother families (920 | 11.3%) represent the smallest median family size with 2.91 persons per family.

| Family Type | # Families | Family Size |
| Married-Couple | 6,805 (83.8%) | 3.52 |
| Single Male/Father | 399 (4.9%) | 3.30 |
| Single Female/Mother | 920 (11.3%) | 2.91 |
| Total Families | 8,124 (100.0%) | 3.44 |
Median Household Size in Daviess County
The median household size in Daviess County is 2.82 persons per household, with single male/father households (399 | 3.4%) accounting for the largest median household size of 3.61 persons per household. non-family households (3,482 | 30.0%) represent the smallest median household size with 1.20 persons per household.

| Household Type | # Households | Household Size |
| Married-Couple | 6,805 (58.6%) | 3.53 |
| Single Male/Father | 399 (3.4%) | 3.61 |
| Single Female/Mother | 920 (7.9%) | 3.37 |
| Non-family | 3,482 (30.0%) | 1.20 |
| Total Households | 11,606 (100.0%) | 2.82 |
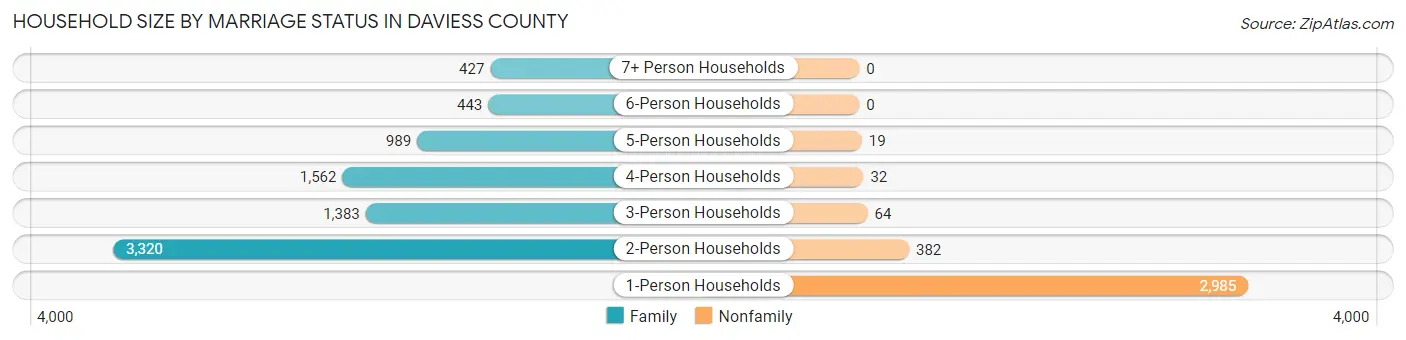
Household Size by Marriage Status in Daviess County
Out of a total of 11,606 households in Daviess County, 8,124 (70.0%) are family households, while 3,482 (30.0%) are nonfamily households. The most numerous type of family households are 2-person households, comprising 3,320, and the most common type of nonfamily households are 1-person households, comprising 2,985.
| Household Size | Family Households | Nonfamily Households |
| 1-Person Households | - | 2,985 (25.7%) |
| 2-Person Households | 3,320 (28.6%) | 382 (3.3%) |
| 3-Person Households | 1,383 (11.9%) | 64 (0.5%) |
| 4-Person Households | 1,562 (13.5%) | 32 (0.3%) |
| 5-Person Households | 989 (8.5%) | 19 (0.2%) |
| 6-Person Households | 443 (3.8%) | 0 (0.0%) |
| 7+ Person Households | 427 (3.7%) | 0 (0.0%) |
| Total | 8,124 (70.0%) | 3,482 (30.0%) |
Female Fertility in Daviess County
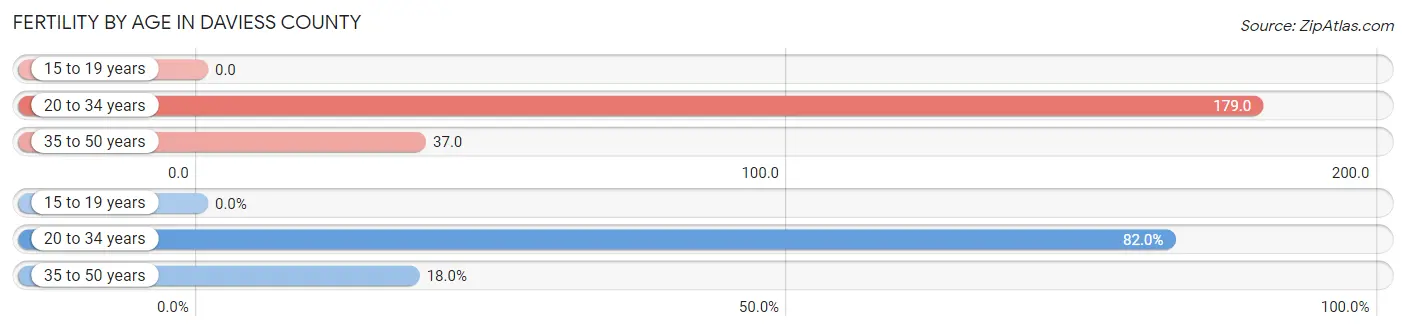
Fertility by Age in Daviess County
Average fertility rate in Daviess County is 86.0 births per 1,000 women. Women in the age bracket of 20 to 34 years have the highest fertility rate with 179.0 births per 1,000 women. Women in the age bracket of 20 to 34 years acount for 82.0% of all women with births.
| Age Bracket | Women with Births | Births / 1,000 Women |
| 15 to 19 years | 0 (0.0%) | 0.0 |
| 20 to 34 years | 507 (82.0%) | 179.0 |
| 35 to 50 years | 111 (18.0%) | 37.0 |
| Total | 618 (100.0%) | 86.0 |
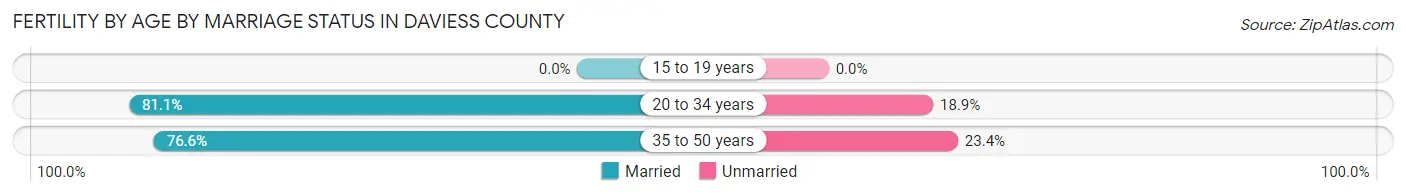
Fertility by Age by Marriage Status in Daviess County
80.3% of women with births (618) in Daviess County are married. The highest percentage of unmarried women with births falls into 35 to 50 years age bracket with 23.4% of them unmarried at the time of birth, while the lowest percentage of unmarried women with births belong to 20 to 34 years age bracket with 18.9% of them unmarried.
| Age Bracket | Married | Unmarried |
| 15 to 19 years | 0 (0.0%) | 0 (0.0%) |
| 20 to 34 years | 411 (81.1%) | 96 (18.9%) |
| 35 to 50 years | 85 (76.6%) | 26 (23.4%) |
| Total | 496 (80.3%) | 122 (19.7%) |
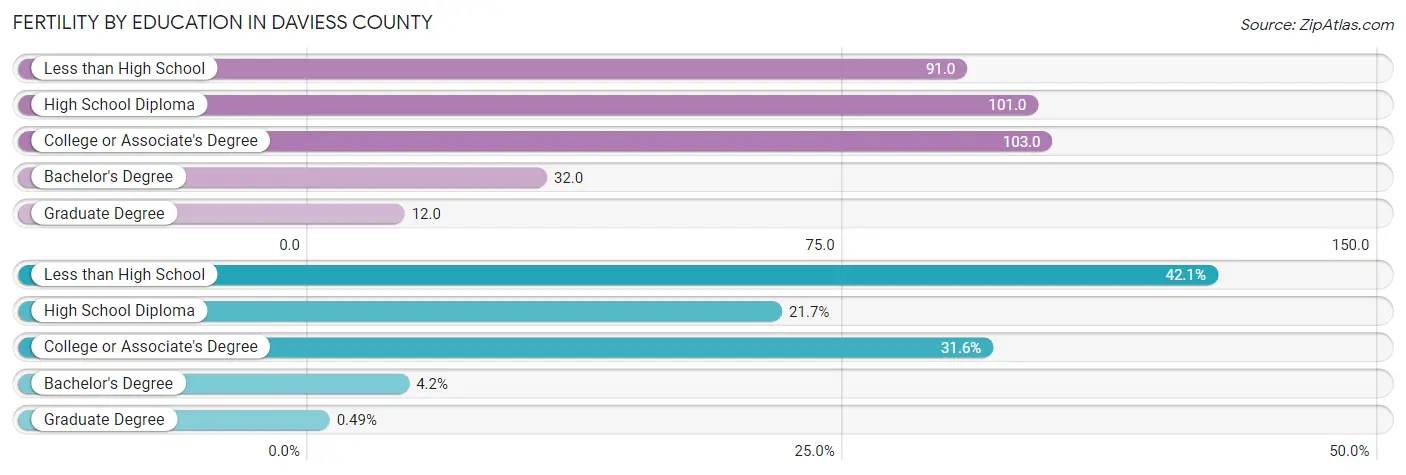
Fertility by Education in Daviess County
Average fertility rate in Daviess County is 86.0 births per 1,000 women. Women with the education attainment of college or associate's degree have the highest fertility rate of 103.0 births per 1,000 women, while women with the education attainment of graduate degree have the lowest fertility at 12.0 births per 1,000 women. Women with the education attainment of less than high school represent 42.1% of all women with births.
| Educational Attainment | Women with Births | Births / 1,000 Women |
| Less than High School | 260 (42.1%) | 91.0 |
| High School Diploma | 134 (21.7%) | 101.0 |
| College or Associate's Degree | 195 (31.6%) | 103.0 |
| Bachelor's Degree | 26 (4.2%) | 32.0 |
| Graduate Degree | 3 (0.5%) | 12.0 |
| Total | 618 (100.0%) | 86.0 |
Fertility by Education by Marriage Status in Daviess County
19.7% of women with births in Daviess County are unmarried. Women with the educational attainment of bachelor's degree are most likely to be married with 100.0% of them married at childbirth, while women with the educational attainment of college or associate's degree are least likely to be married with 40.0% of them unmarried at childbirth.
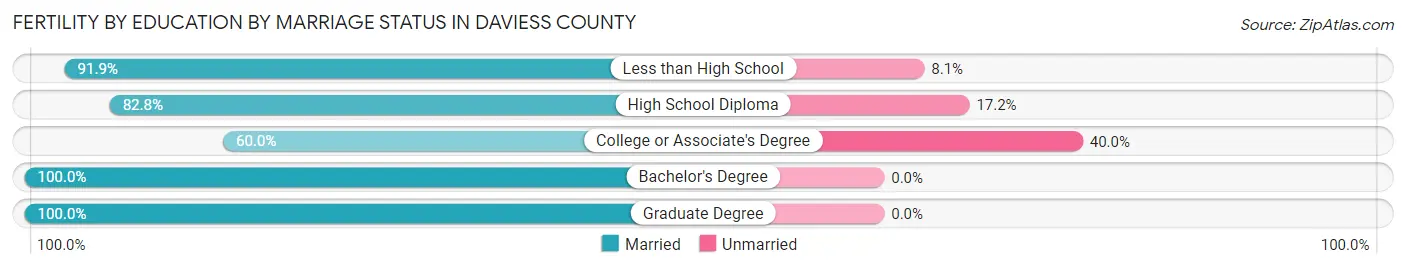
| Educational Attainment | Married | Unmarried |
| Less than High School | 239 (91.9%) | 21 (8.1%) |
| High School Diploma | 111 (82.8%) | 23 (17.2%) |
| College or Associate's Degree | 117 (60.0%) | 78 (40.0%) |
| Bachelor's Degree | 26 (100.0%) | 0 (0.0%) |
| Graduate Degree | 3 (100.0%) | 0 (0.0%) |
| Total | 496 (80.3%) | 122 (19.7%) |
Income in Daviess County
Income Overview in Daviess County
Per Capita Income in Daviess County is $28,886, while median incomes of families and households are $82,994 and $64,113 respectively.
| Characteristic | Number | Measure |
| Per Capita Income | 33,337 | $28,886 |
| Median Family Income | 8,124 | $82,994 |
| Mean Family Income | 8,124 | $96,650 |
| Median Household Income | 11,606 | $64,113 |
| Mean Household Income | 11,606 | $81,481 |
| Income Deficit | 8,124 | $10,422 |
| Wage / Income Gap (%) | 33,337 | 43.50% |
| Wage / Income Gap ($) | 33,337 | 56.50¢ per $1 |
| Gini / Inequality Index | 33,337 | 0.42 |
Earnings by Sex in Daviess County
Average Earnings in Daviess County are $40,042, $49,225 for men and $27,810 for women, a difference of 43.5%.

| Sex | Number | Average Earnings |
| Male | 9,279 (58.0%) | $49,225 |
| Female | 6,715 (42.0%) | $27,810 |
| Total | 15,994 (100.0%) | $40,042 |
Earnings by Sex by Income Bracket in Daviess County
The most common earnings brackets in Daviess County are $55,000 to $64,999 for men (1,116 | 12.0%) and $25,000 to $29,999 for women (661 | 9.8%).
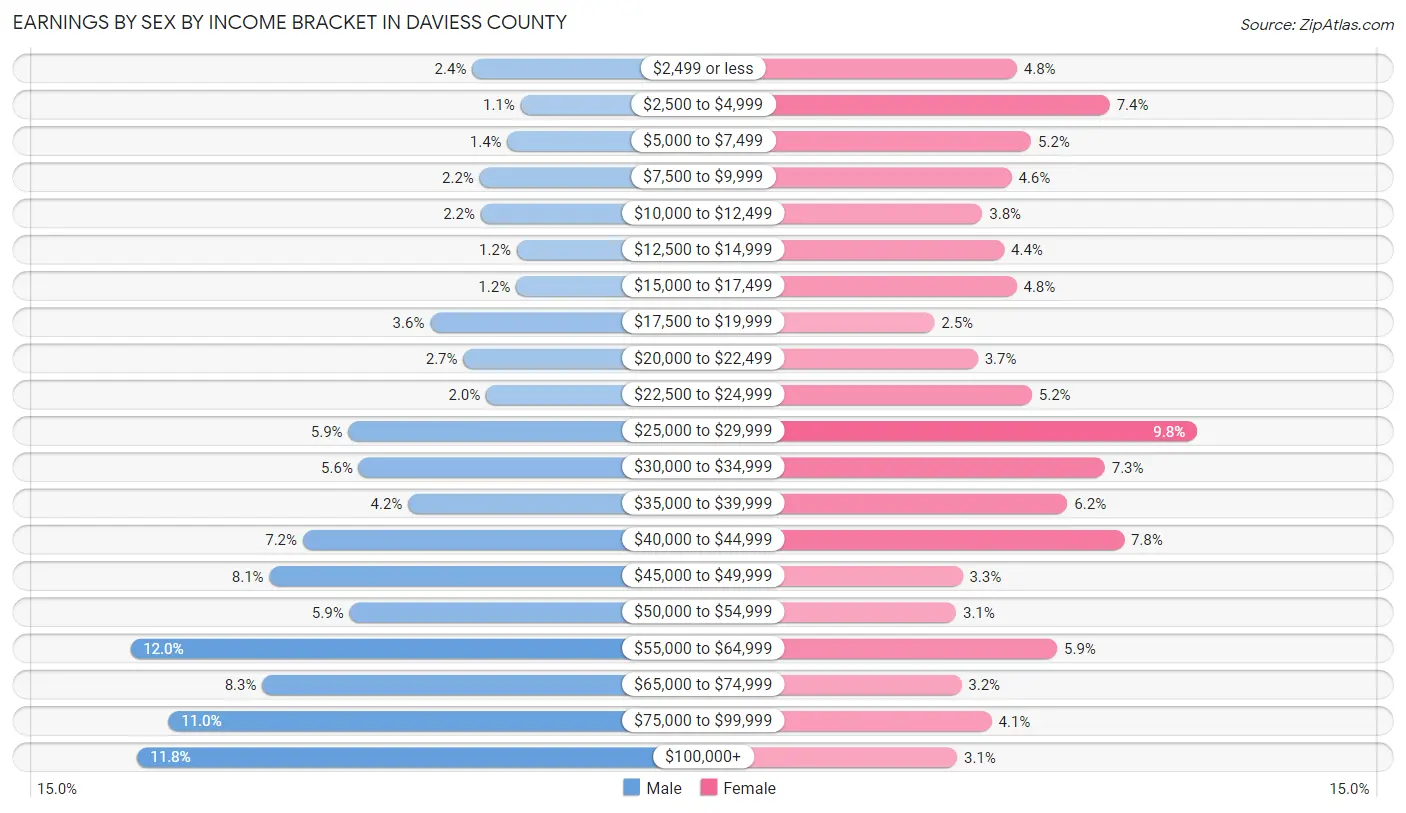
| Income | Male | Female |
| $2,499 or less | 225 (2.4%) | 321 (4.8%) |
| $2,500 to $4,999 | 98 (1.1%) | 496 (7.4%) |
| $5,000 to $7,499 | 133 (1.4%) | 348 (5.2%) |
| $7,500 to $9,999 | 205 (2.2%) | 311 (4.6%) |
| $10,000 to $12,499 | 202 (2.2%) | 256 (3.8%) |
| $12,500 to $14,999 | 109 (1.2%) | 297 (4.4%) |
| $15,000 to $17,499 | 110 (1.2%) | 320 (4.8%) |
| $17,500 to $19,999 | 334 (3.6%) | 165 (2.5%) |
| $20,000 to $22,499 | 248 (2.7%) | 247 (3.7%) |
| $22,500 to $24,999 | 188 (2.0%) | 349 (5.2%) |
| $25,000 to $29,999 | 547 (5.9%) | 661 (9.8%) |
| $30,000 to $34,999 | 521 (5.6%) | 487 (7.2%) |
| $35,000 to $39,999 | 392 (4.2%) | 416 (6.2%) |
| $40,000 to $44,999 | 666 (7.2%) | 523 (7.8%) |
| $45,000 to $49,999 | 753 (8.1%) | 218 (3.3%) |
| $50,000 to $54,999 | 545 (5.9%) | 206 (3.1%) |
| $55,000 to $64,999 | 1,116 (12.0%) | 397 (5.9%) |
| $65,000 to $74,999 | 772 (8.3%) | 216 (3.2%) |
| $75,000 to $99,999 | 1,017 (11.0%) | 273 (4.1%) |
| $100,000+ | 1,098 (11.8%) | 208 (3.1%) |
| Total | 9,279 (100.0%) | 6,715 (100.0%) |
Earnings by Sex by Educational Attainment in Daviess County
Average earnings in Daviess County are $54,896 for men and $30,374 for women, a difference of 44.7%. Men with an educational attainment of graduate degree enjoy the highest average annual earnings of $135,335, while those with high school diploma education earn the least with $46,236. Women with an educational attainment of graduate degree earn the most with the average annual earnings of $52,969, while those with less than high school education have the smallest earnings of $16,500.
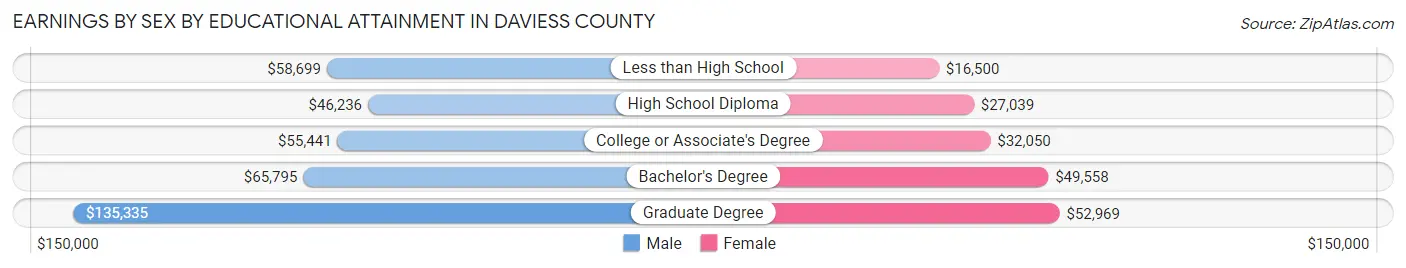
| Educational Attainment | Male Income | Female Income |
| Less than High School | $58,699 | $16,500 |
| High School Diploma | $46,236 | $27,039 |
| College or Associate's Degree | $55,441 | $32,050 |
| Bachelor's Degree | $65,795 | $49,558 |
| Graduate Degree | $135,335 | $52,969 |
| Total | $54,896 | $30,374 |
Family Income in Daviess County
Family Income Brackets in Daviess County
According to the Daviess County family income data, there are 1,877 families falling into the $100,000 to $149,999 income range, which is the most common income bracket and makes up 23.1% of all families. Conversely, the $10,000 to $14,999 income bracket is the least frequent group with only 146 families (1.8%) belonging to this category.

| Income Bracket | # Families | % Families |
| Less than $10,000 | 195 | 2.4% |
| $10,000 to $14,999 | 146 | 1.8% |
| $15,000 to $24,999 | 325 | 4.0% |
| $25,000 to $34,999 | 520 | 6.4% |
| $35,000 to $49,999 | 983 | 12.1% |
| $50,000 to $74,999 | 1,584 | 19.5% |
| $75,000 to $99,999 | 1,194 | 14.7% |
| $100,000 to $149,999 | 1,877 | 23.1% |
| $150,000 to $199,999 | 804 | 9.9% |
| $200,000+ | 504 | 6.2% |
Family Income by Famaliy Size in Daviess County
7+ person families (379 | 4.7%) account for the highest median family income in Daviess County with $118,750 per family, while 2-person families (3,541 | 43.6%) have the highest median income of $31,766 per family member.
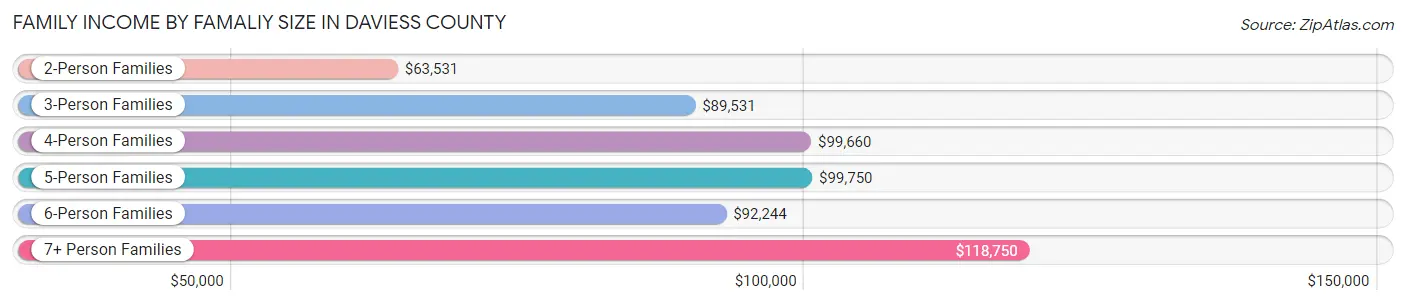
| Income Bracket | # Families | Median Income |
| 2-Person Families | 3,541 (43.6%) | $63,531 |
| 3-Person Families | 1,343 (16.5%) | $89,531 |
| 4-Person Families | 1,504 (18.5%) | $99,660 |
| 5-Person Families | 909 (11.2%) | $99,750 |
| 6-Person Families | 448 (5.5%) | $92,244 |
| 7+ Person Families | 379 (4.7%) | $118,750 |
| Total | 8,124 (100.0%) | $82,994 |
Family Income by Number of Earners in Daviess County
The median family income in Daviess County is $82,994, with families comprising 3+ earners (1,193) having the highest median family income of $139,967, while families with no earners (1,029) have the lowest median family income of $40,575, accounting for 14.7% and 12.7% of families, respectively.
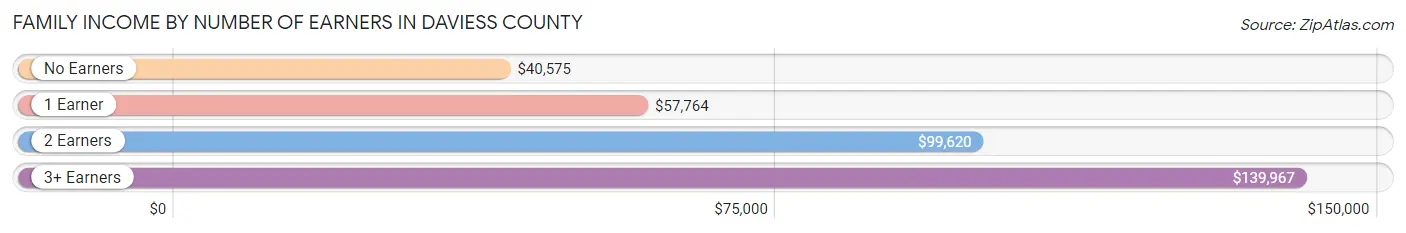
| Number of Earners | # Families | Median Income |
| No Earners | 1,029 (12.7%) | $40,575 |
| 1 Earner | 2,818 (34.7%) | $57,764 |
| 2 Earners | 3,084 (38.0%) | $99,620 |
| 3+ Earners | 1,193 (14.7%) | $139,967 |
| Total | 8,124 (100.0%) | $82,994 |
Household Income in Daviess County
Household Income Brackets in Daviess County
With 2,356 households falling in the category, the $50,000 to $74,999 income range is the most frequent in Daviess County, accounting for 20.3% of all households. In contrast, only 337 households (2.9%) fall into the less than $10,000 income bracket, making it the least populous group.
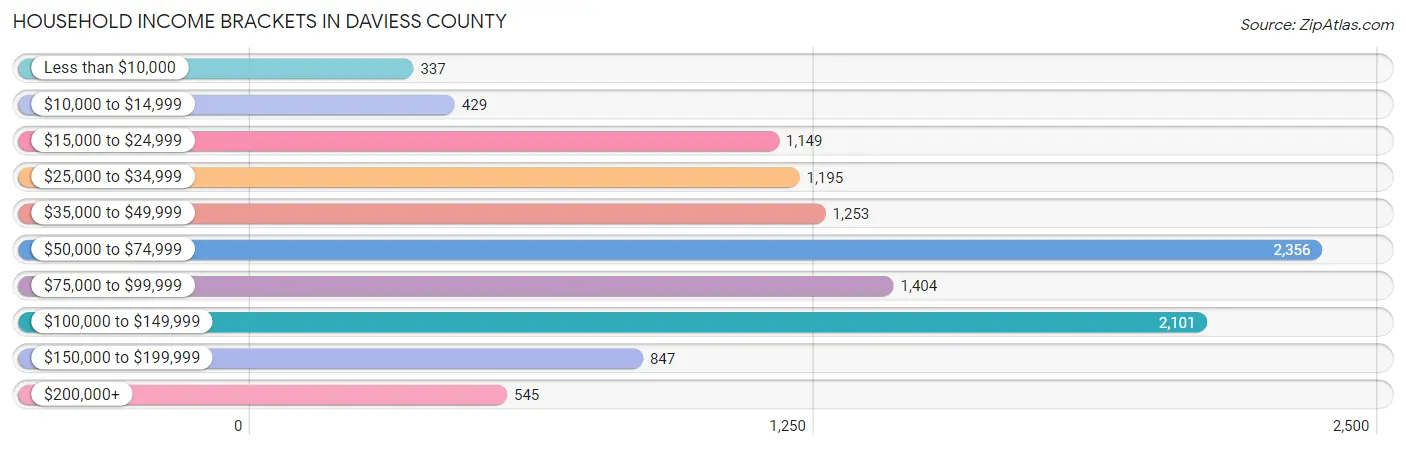
| Income Bracket | # Households | % Households |
| Less than $10,000 | 337 | 2.9% |
| $10,000 to $14,999 | 429 | 3.7% |
| $15,000 to $24,999 | 1,149 | 9.9% |
| $25,000 to $34,999 | 1,195 | 10.3% |
| $35,000 to $49,999 | 1,253 | 10.8% |
| $50,000 to $74,999 | 2,356 | 20.3% |
| $75,000 to $99,999 | 1,404 | 12.1% |
| $100,000 to $149,999 | 2,101 | 18.1% |
| $150,000 to $199,999 | 847 | 7.3% |
| $200,000+ | 545 | 4.7% |
Household Income by Householder Age in Daviess County
The median household income in Daviess County is $64,113, with the highest median household income of $84,365 found in the 45 to 64 years age bracket for the primary householder. A total of 4,299 households (37.0%) fall into this category. Meanwhile, the 65+ years age bracket for the primary householder has the lowest median household income of $41,076, with 3,103 households (26.7%) in this group.
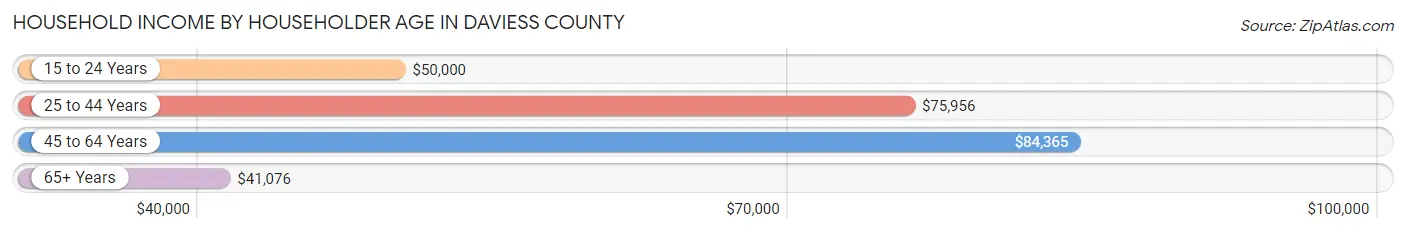
| Income Bracket | # Households | Median Income |
| 15 to 24 Years | 426 (3.7%) | $50,000 |
| 25 to 44 Years | 3,778 (32.6%) | $75,956 |
| 45 to 64 Years | 4,299 (37.0%) | $84,365 |
| 65+ Years | 3,103 (26.7%) | $41,076 |
| Total | 11,606 (100.0%) | $64,113 |
Poverty in Daviess County
Income Below Poverty by Sex and Age in Daviess County
With 8.9% poverty level for males and 10.3% for females among the residents of Daviess County, under 5 year old males and under 5 year old females are the most vulnerable to poverty, with 246 males (20.0%) and 196 females (15.2%) in their respective age groups living below the poverty level.
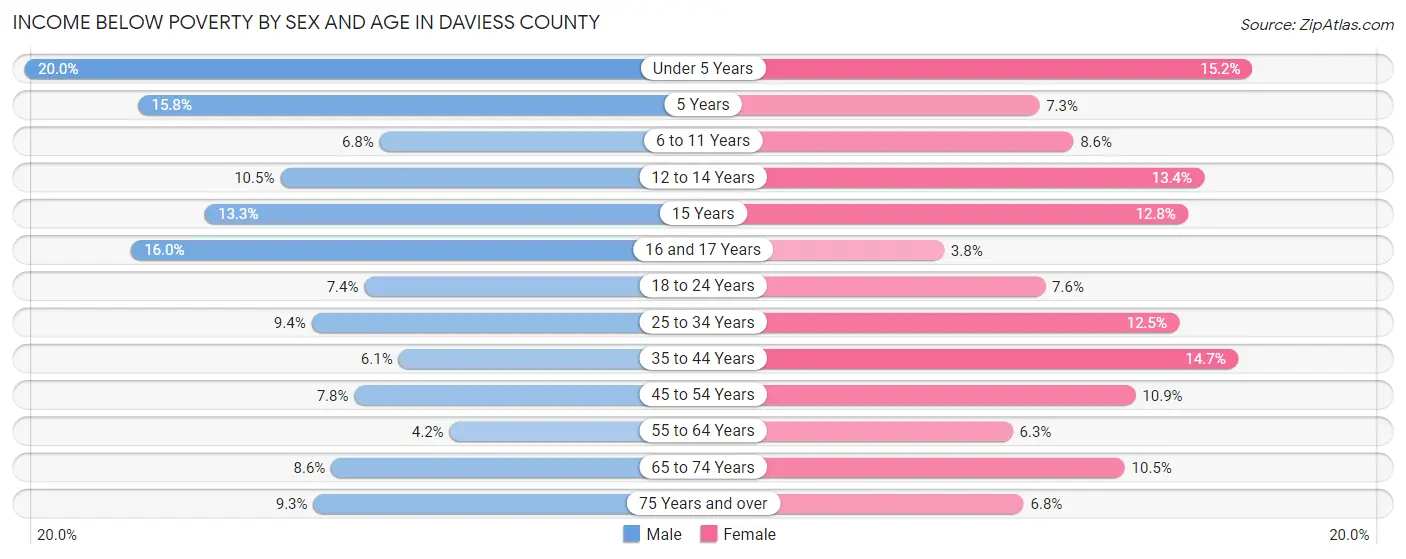
| Age Bracket | Male | Female |
| Under 5 Years | 246 (20.0%) | 196 (15.2%) |
| 5 Years | 38 (15.8%) | 25 (7.3%) |
| 6 to 11 Years | 114 (6.8%) | 144 (8.6%) |
| 12 to 14 Years | 82 (10.5%) | 89 (13.4%) |
| 15 Years | 27 (13.3%) | 42 (12.8%) |
| 16 and 17 Years | 98 (16.0%) | 22 (3.8%) |
| 18 to 24 Years | 103 (7.4%) | 100 (7.5%) |
| 25 to 34 Years | 210 (9.3%) | 238 (12.5%) |
| 35 to 44 Years | 119 (6.1%) | 294 (14.7%) |
| 45 to 54 Years | 134 (7.8%) | 186 (10.9%) |
| 55 to 64 Years | 81 (4.2%) | 122 (6.3%) |
| 65 to 74 Years | 126 (8.6%) | 151 (10.5%) |
| 75 Years and over | 80 (9.3%) | 83 (6.8%) |
| Total | 1,458 (8.9%) | 1,692 (10.3%) |
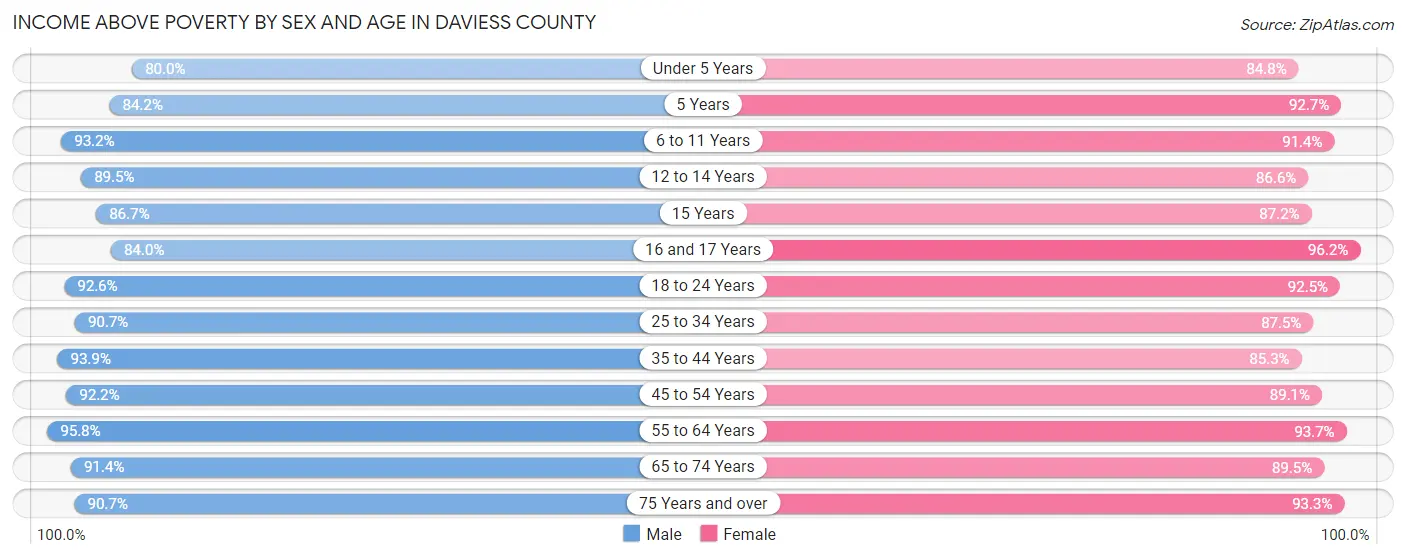
Income Above Poverty by Sex and Age in Daviess County
According to the poverty statistics in Daviess County, males aged 55 to 64 years and females aged 16 and 17 years are the age groups that are most secure financially, with 95.8% of males and 96.2% of females in these age groups living above the poverty line.
| Age Bracket | Male | Female |
| Under 5 Years | 985 (80.0%) | 1,090 (84.8%) |
| 5 Years | 203 (84.2%) | 316 (92.7%) |
| 6 to 11 Years | 1,558 (93.2%) | 1,532 (91.4%) |
| 12 to 14 Years | 698 (89.5%) | 573 (86.6%) |
| 15 Years | 176 (86.7%) | 285 (87.2%) |
| 16 and 17 Years | 513 (84.0%) | 559 (96.2%) |
| 18 to 24 Years | 1,291 (92.6%) | 1,225 (92.4%) |
| 25 to 34 Years | 2,036 (90.6%) | 1,664 (87.5%) |
| 35 to 44 Years | 1,826 (93.9%) | 1,707 (85.3%) |
| 45 to 54 Years | 1,593 (92.2%) | 1,520 (89.1%) |
| 55 to 64 Years | 1,832 (95.8%) | 1,803 (93.7%) |
| 65 to 74 Years | 1,336 (91.4%) | 1,287 (89.5%) |
| 75 Years and over | 782 (90.7%) | 1,147 (93.2%) |
| Total | 14,829 (91.0%) | 14,708 (89.7%) |
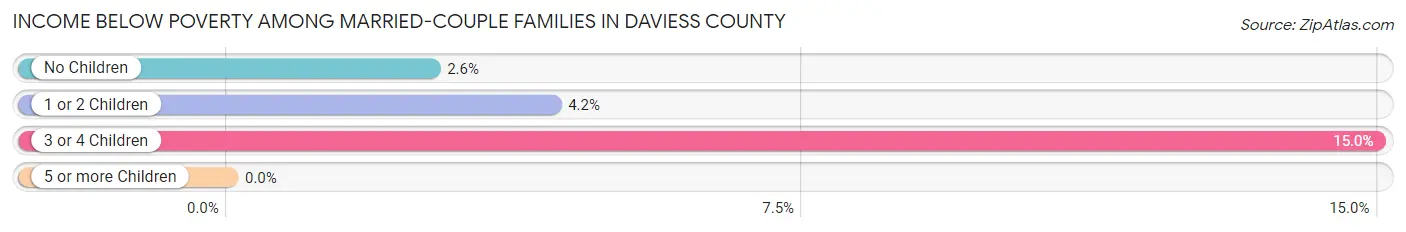
Income Below Poverty Among Married-Couple Families in Daviess County
The poverty statistics for married-couple families in Daviess County show that 4.5% or 309 of the total 6,805 families live below the poverty line. Families with 3 or 4 children have the highest poverty rate of 15.0%, comprising of 124 families. On the other hand, families with 5 or more children have the lowest poverty rate of 0.0%, which includes 0 families.
| Children | Above Poverty | Below Poverty |
| No Children | 3,389 (97.4%) | 92 (2.6%) |
| 1 or 2 Children | 2,112 (95.8%) | 93 (4.2%) |
| 3 or 4 Children | 704 (85.0%) | 124 (15.0%) |
| 5 or more Children | 291 (100.0%) | 0 (0.0%) |
| Total | 6,496 (95.5%) | 309 (4.5%) |
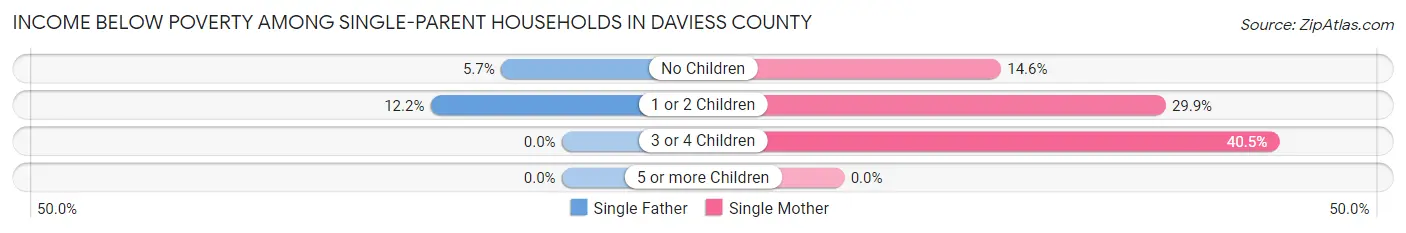
Income Below Poverty Among Single-Parent Households in Daviess County
According to the poverty data in Daviess County, 8.3% or 33 single-father households and 26.5% or 244 single-mother households are living below the poverty line. Among single-father households, those with 1 or 2 children have the highest poverty rate, with 22 households (12.2%) experiencing poverty. Likewise, among single-mother households, those with 3 or 4 children have the highest poverty rate, with 45 households (40.5%) falling below the poverty line.
| Children | Single Father | Single Mother |
| No Children | 11 (5.7%) | 41 (14.6%) |
| 1 or 2 Children | 22 (12.2%) | 158 (29.9%) |
| 3 or 4 Children | 0 (0.0%) | 45 (40.5%) |
| 5 or more Children | 0 (0.0%) | 0 (0.0%) |
| Total | 33 (8.3%) | 244 (26.5%) |
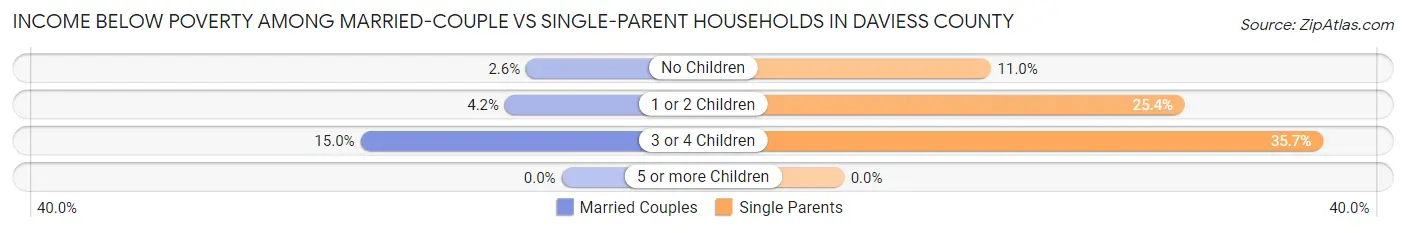
Income Below Poverty Among Married-Couple vs Single-Parent Households in Daviess County
The poverty data for Daviess County shows that 309 of the married-couple family households (4.5%) and 277 of the single-parent households (21.0%) are living below the poverty level. Within the married-couple family households, those with 3 or 4 children have the highest poverty rate, with 124 households (15.0%) falling below the poverty line. Among the single-parent households, those with 3 or 4 children have the highest poverty rate, with 45 household (35.7%) living below poverty.
| Children | Married-Couple Families | Single-Parent Households |
| No Children | 92 (2.6%) | 52 (11.0%) |
| 1 or 2 Children | 93 (4.2%) | 180 (25.4%) |
| 3 or 4 Children | 124 (15.0%) | 45 (35.7%) |
| 5 or more Children | 0 (0.0%) | 0 (0.0%) |
| Total | 309 (4.5%) | 277 (21.0%) |
Employment Characteristics in Daviess County
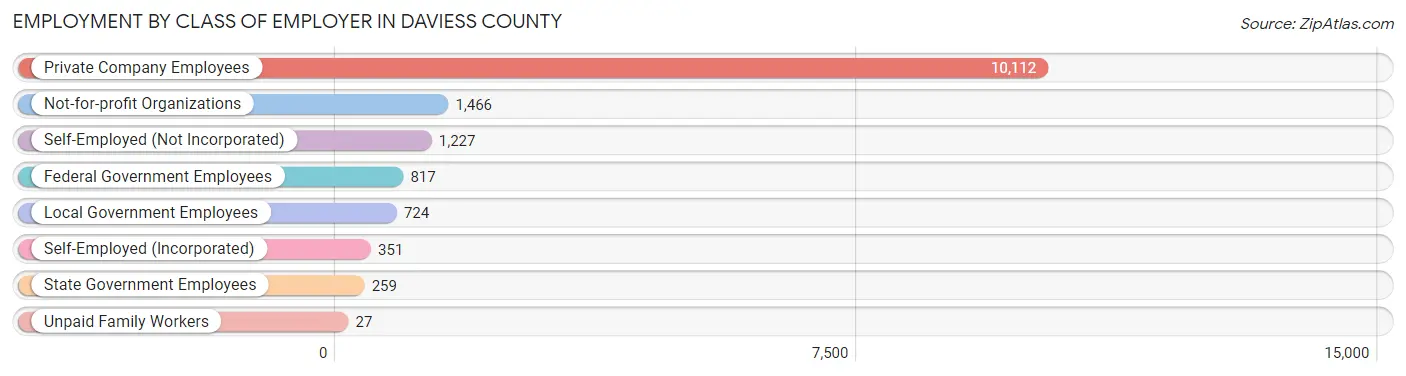
Employment by Class of Employer in Daviess County
Among the 14,983 employed individuals in Daviess County, private company employees (10,112 | 67.5%), not-for-profit organizations (1,466 | 9.8%), and self-employed (not incorporated) (1,227 | 8.2%) make up the most common classes of employment.
| Employer Class | # Employees | % Employees |
| Private Company Employees | 10,112 | 67.5% |
| Self-Employed (Incorporated) | 351 | 2.3% |
| Self-Employed (Not Incorporated) | 1,227 | 8.2% |
| Not-for-profit Organizations | 1,466 | 9.8% |
| Local Government Employees | 724 | 4.8% |
| State Government Employees | 259 | 1.7% |
| Federal Government Employees | 817 | 5.4% |
| Unpaid Family Workers | 27 | 0.2% |
| Total | 14,983 | 100.0% |
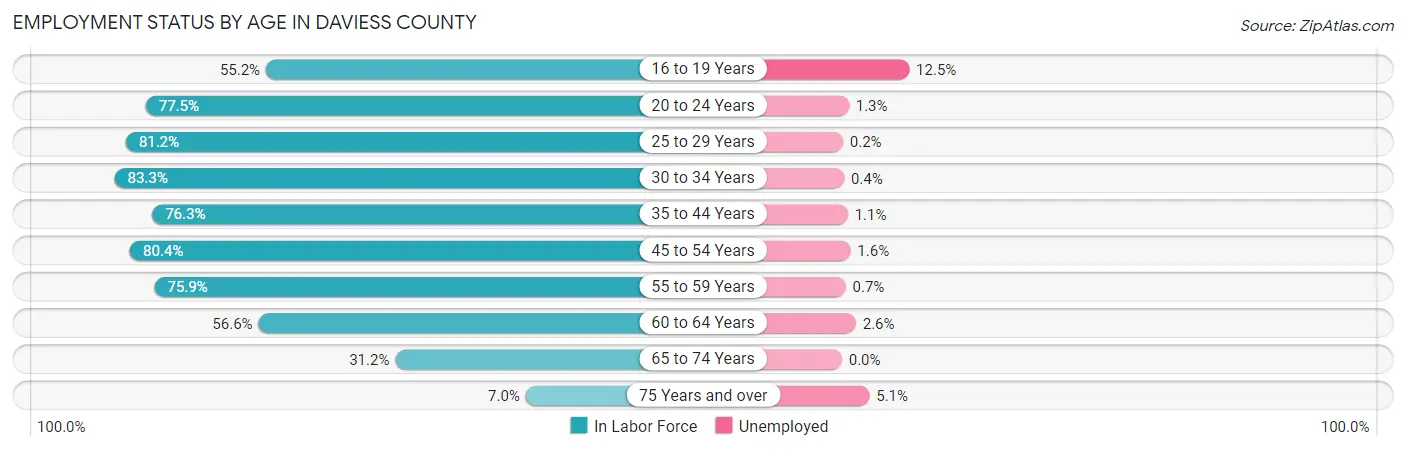
Employment Status by Age in Daviess County
According to the labor force statistics for Daviess County, out of the total population over 16 years of age (24,753), 62.9% or 15,570 individuals are in the labor force, with 1.9% or 296 of them unemployed. The age group with the highest labor force participation rate is 30 to 34 years, with 83.3% or 1,751 individuals in the labor force. Within the labor force, the 16 to 19 years age range has the highest percentage of unemployed individuals, with 12.5% or 138 of them being unemployed.
| Age Bracket | In Labor Force | Unemployed |
| 16 to 19 Years | 1,107 (55.2%) | 138 (12.5%) |
| 20 to 24 Years | 1,507 (77.5%) | 20 (1.3%) |
| 25 to 29 Years | 1,683 (81.2%) | 3 (0.2%) |
| 30 to 34 Years | 1,751 (83.3%) | 7 (0.4%) |
| 35 to 44 Years | 3,041 (76.3%) | 33 (1.1%) |
| 45 to 54 Years | 2,783 (80.4%) | 45 (1.6%) |
| 55 to 59 Years | 1,457 (75.9%) | 10 (0.7%) |
| 60 to 64 Years | 1,140 (56.6%) | 30 (2.6%) |
| 65 to 74 Years | 937 (31.2%) | 0 (0.0%) |
| 75 Years and over | 157 (7.0%) | 8 (5.1%) |
| Total | 15,570 (62.9%) | 296 (1.9%) |
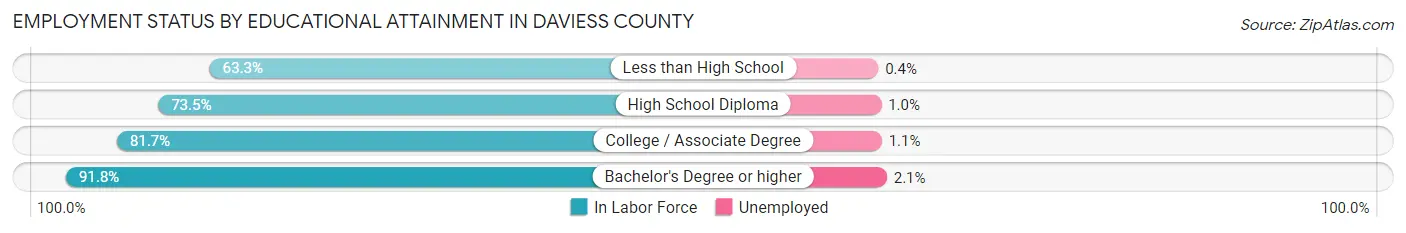
Employment Status by Educational Attainment in Daviess County
According to labor force statistics for Daviess County, 76.2% of individuals (11,852) out of the total population between 25 and 64 years of age (15,554) are in the labor force, with 1.1% or 130 of them being unemployed. The group with the highest labor force participation rate are those with the educational attainment of bachelor's degree or higher, with 91.8% or 2,128 individuals in the labor force. Within the labor force, individuals with bachelor's degree or higher education have the highest percentage of unemployment, with 2.1% or 45 of them being unemployed.
| Educational Attainment | In Labor Force | Unemployed |
| Less than High School | 2,383 (63.3%) | 15 (0.4%) |
| High School Diploma | 3,567 (73.5%) | 49 (1.0%) |
| College / Associate Degree | 3,773 (81.7%) | 51 (1.1%) |
| Bachelor's Degree or higher | 2,128 (91.8%) | 49 (2.1%) |
| Total | 11,852 (76.2%) | 171 (1.1%) |
Employment Occupations by Sex in Daviess County
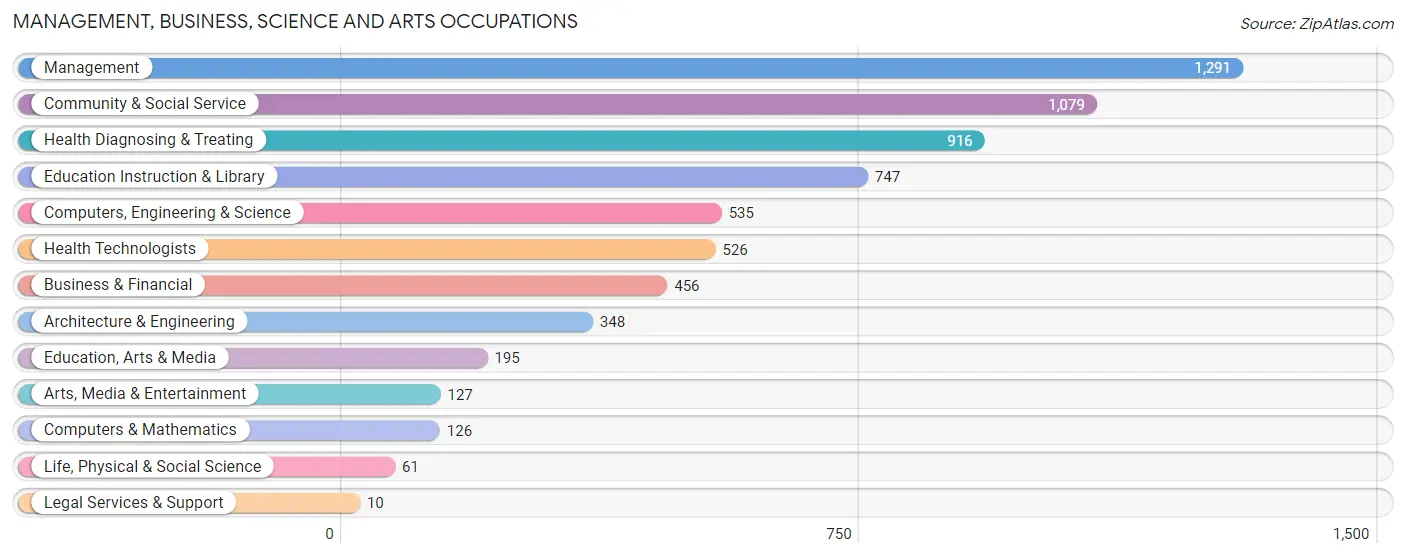
Management, Business, Science and Arts Occupations
The most common Management, Business, Science and Arts occupations in Daviess County are Management (1,291 | 8.5%), Community & Social Service (1,079 | 7.1%), Health Diagnosing & Treating (916 | 6.0%), Education Instruction & Library (747 | 4.9%), and Computers, Engineering & Science (535 | 3.5%).
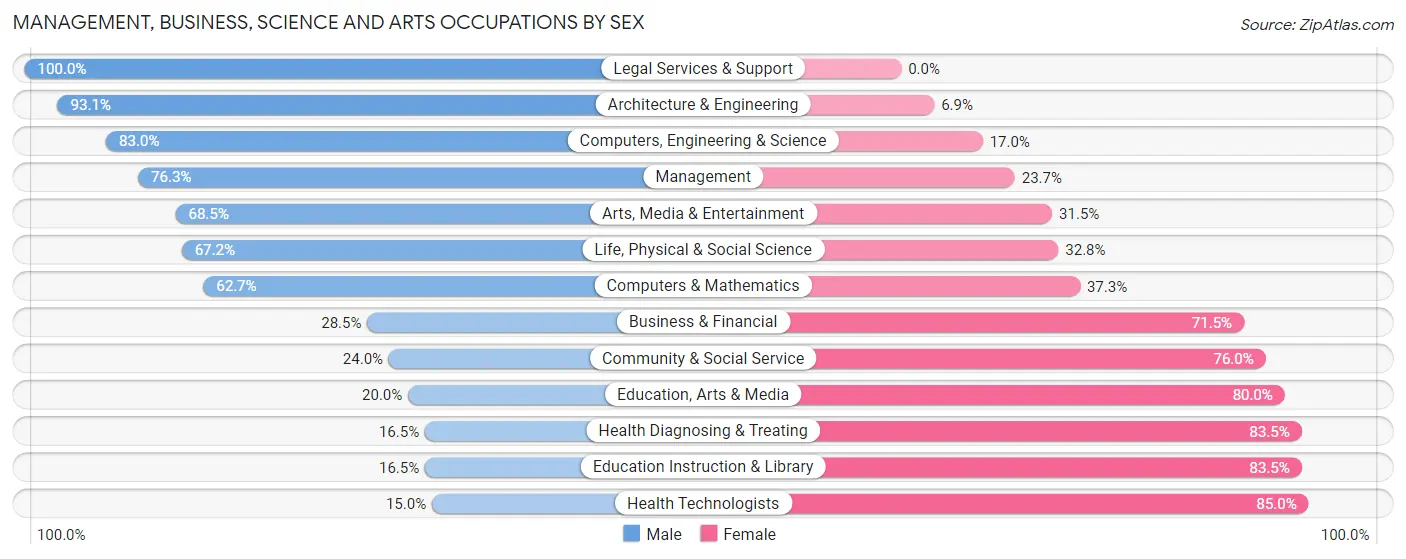
Management, Business, Science and Arts Occupations by Sex
Within the Management, Business, Science and Arts occupations in Daviess County, the most male-oriented occupations are Legal Services & Support (100.0%), Architecture & Engineering (93.1%), and Computers, Engineering & Science (83.0%), while the most female-oriented occupations are Health Technologists (85.0%), Education Instruction & Library (83.5%), and Health Diagnosing & Treating (83.5%).
| Occupation | Male | Female |
| Management | 985 (76.3%) | 306 (23.7%) |
| Business & Financial | 130 (28.5%) | 326 (71.5%) |
| Computers, Engineering & Science | 444 (83.0%) | 91 (17.0%) |
| Computers & Mathematics | 79 (62.7%) | 47 (37.3%) |
| Architecture & Engineering | 324 (93.1%) | 24 (6.9%) |
| Life, Physical & Social Science | 41 (67.2%) | 20 (32.8%) |
| Community & Social Service | 259 (24.0%) | 820 (76.0%) |
| Education, Arts & Media | 39 (20.0%) | 156 (80.0%) |
| Legal Services & Support | 10 (100.0%) | 0 (0.0%) |
| Education Instruction & Library | 123 (16.5%) | 624 (83.5%) |
| Arts, Media & Entertainment | 87 (68.5%) | 40 (31.5%) |
| Health Diagnosing & Treating | 151 (16.5%) | 765 (83.5%) |
| Health Technologists | 79 (15.0%) | 447 (85.0%) |
| Total (Category) | 1,969 (46.0%) | 2,308 (54.0%) |
| Total (Overall) | 8,890 (58.3%) | 6,358 (41.7%) |
Services Occupations
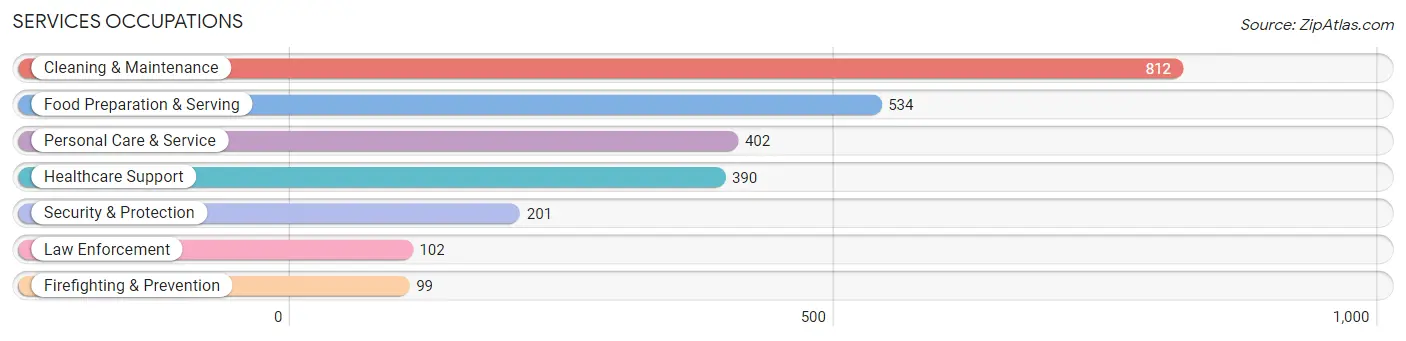
The most common Services occupations in Daviess County are Cleaning & Maintenance (812 | 5.3%), Food Preparation & Serving (534 | 3.5%), Personal Care & Service (402 | 2.6%), Healthcare Support (390 | 2.6%), and Security & Protection (201 | 1.3%).
Services Occupations by Sex
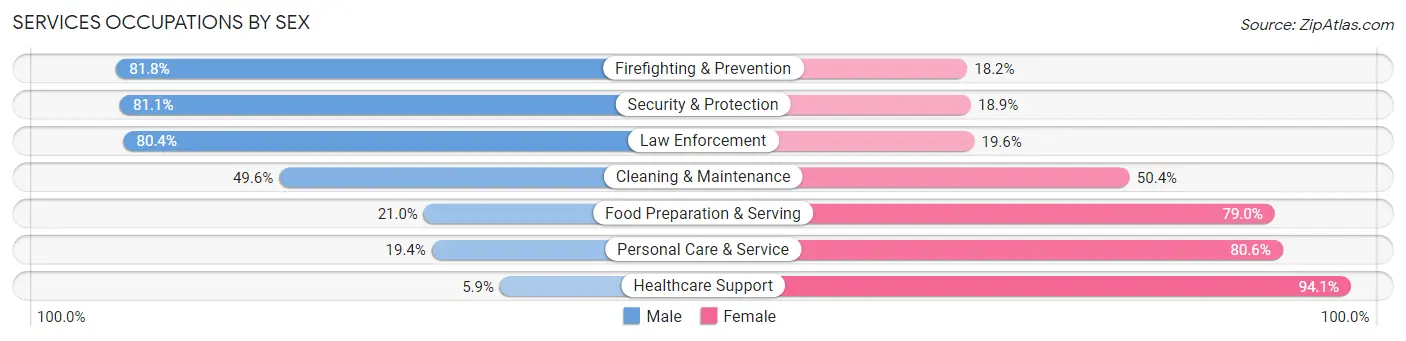
Within the Services occupations in Daviess County, the most male-oriented occupations are Firefighting & Prevention (81.8%), Security & Protection (81.1%), and Law Enforcement (80.4%), while the most female-oriented occupations are Healthcare Support (94.1%), Personal Care & Service (80.6%), and Food Preparation & Serving (79.0%).
| Occupation | Male | Female |
| Healthcare Support | 23 (5.9%) | 367 (94.1%) |
| Security & Protection | 163 (81.1%) | 38 (18.9%) |
| Firefighting & Prevention | 81 (81.8%) | 18 (18.2%) |
| Law Enforcement | 82 (80.4%) | 20 (19.6%) |
| Food Preparation & Serving | 112 (21.0%) | 422 (79.0%) |
| Cleaning & Maintenance | 403 (49.6%) | 409 (50.4%) |
| Personal Care & Service | 78 (19.4%) | 324 (80.6%) |
| Total (Category) | 779 (33.3%) | 1,560 (66.7%) |
| Total (Overall) | 8,890 (58.3%) | 6,358 (41.7%) |
Sales and Office Occupations
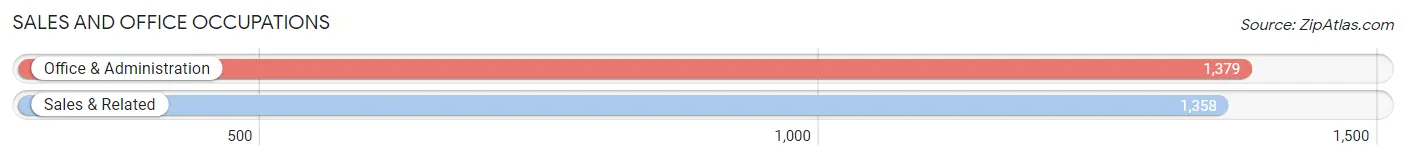
The most common Sales and Office occupations in Daviess County are Office & Administration (1,379 | 9.0%), and Sales & Related (1,358 | 8.9%).
Sales and Office Occupations by Sex
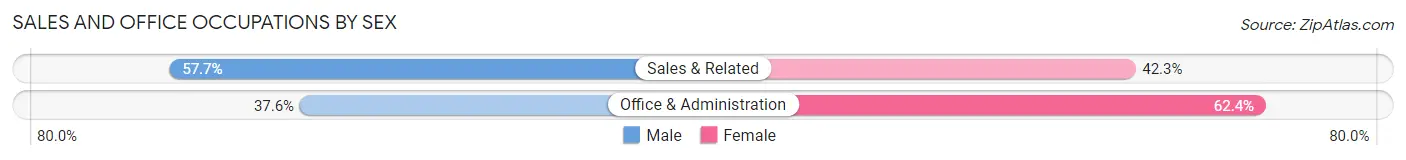
| Occupation | Male | Female |
| Sales & Related | 784 (57.7%) | 574 (42.3%) |
| Office & Administration | 519 (37.6%) | 860 (62.4%) |
| Total (Category) | 1,303 (47.6%) | 1,434 (52.4%) |
| Total (Overall) | 8,890 (58.3%) | 6,358 (41.7%) |
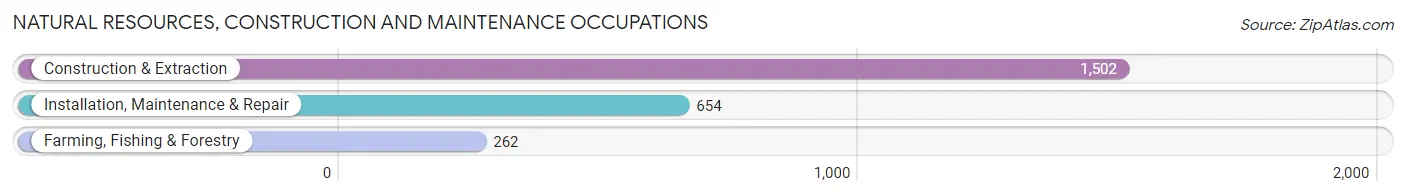
Natural Resources, Construction and Maintenance Occupations
The most common Natural Resources, Construction and Maintenance occupations in Daviess County are Construction & Extraction (1,502 | 9.9%), Installation, Maintenance & Repair (654 | 4.3%), and Farming, Fishing & Forestry (262 | 1.7%).
Natural Resources, Construction and Maintenance Occupations by Sex
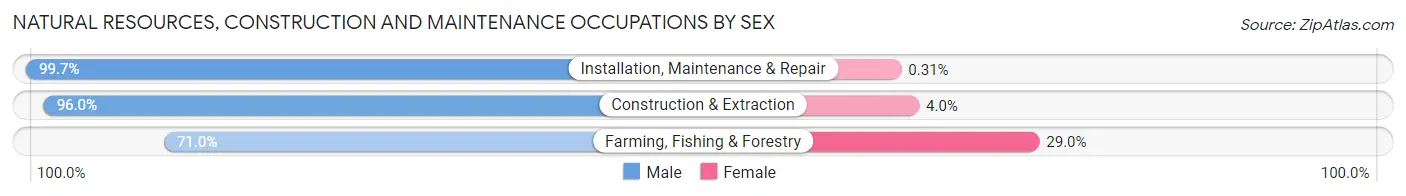
| Occupation | Male | Female |
| Farming, Fishing & Forestry | 186 (71.0%) | 76 (29.0%) |
| Construction & Extraction | 1,442 (96.0%) | 60 (4.0%) |
| Installation, Maintenance & Repair | 652 (99.7%) | 2 (0.3%) |
| Total (Category) | 2,280 (94.3%) | 138 (5.7%) |
| Total (Overall) | 8,890 (58.3%) | 6,358 (41.7%) |
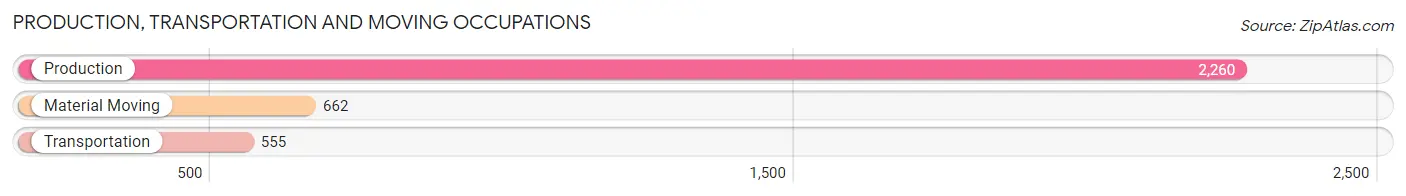
Production, Transportation and Moving Occupations
The most common Production, Transportation and Moving occupations in Daviess County are Production (2,260 | 14.8%), Material Moving (662 | 4.3%), and Transportation (555 | 3.6%).
Production, Transportation and Moving Occupations by Sex
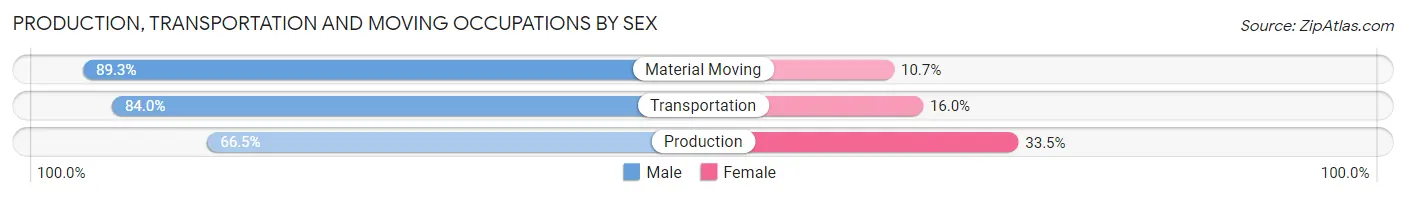
| Occupation | Male | Female |
| Production | 1,502 (66.5%) | 758 (33.5%) |
| Transportation | 466 (84.0%) | 89 (16.0%) |
| Material Moving | 591 (89.3%) | 71 (10.7%) |
| Total (Category) | 2,559 (73.6%) | 918 (26.4%) |
| Total (Overall) | 8,890 (58.3%) | 6,358 (41.7%) |
Employment Industries by Sex in Daviess County
Employment Industries in Daviess County
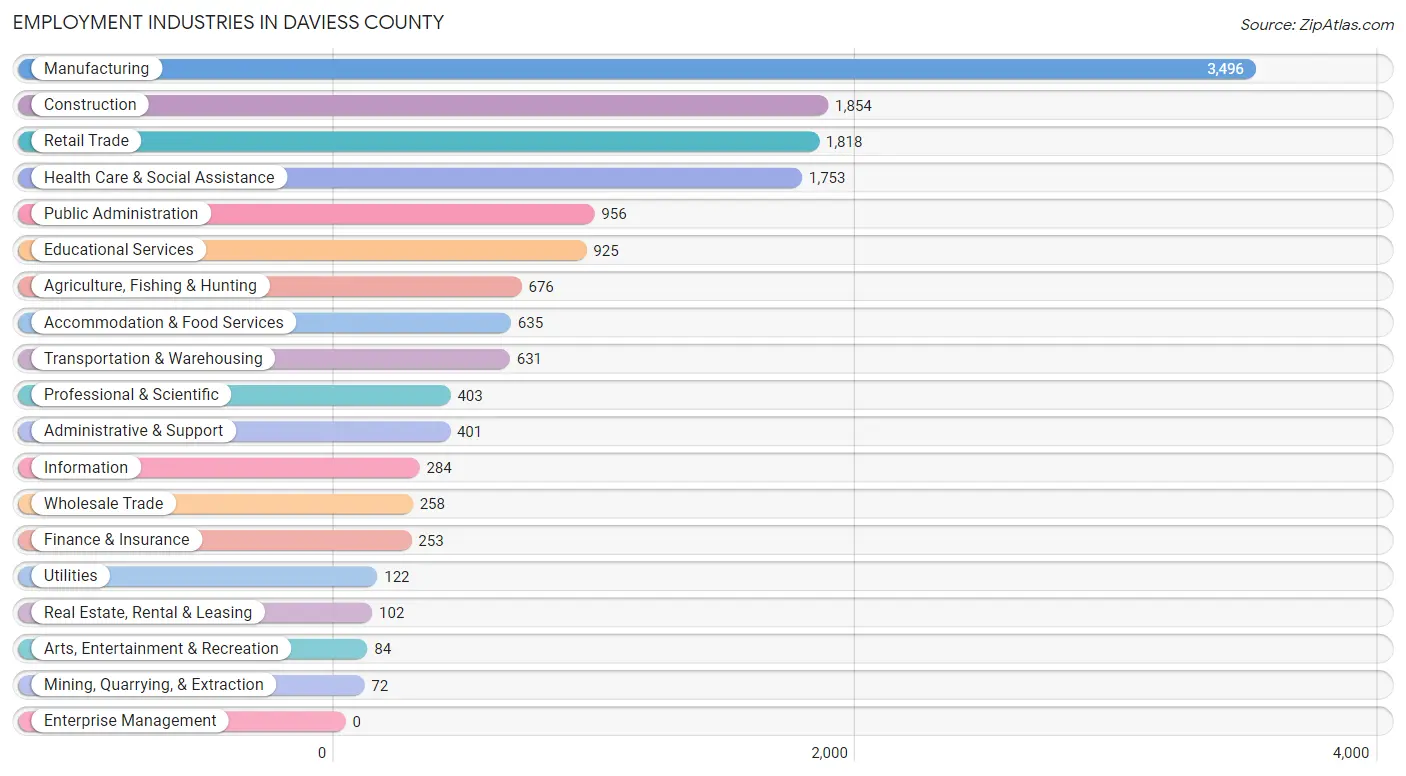
The major employment industries in Daviess County include Manufacturing (3,496 | 22.9%), Construction (1,854 | 12.2%), Retail Trade (1,818 | 11.9%), Health Care & Social Assistance (1,753 | 11.5%), and Public Administration (956 | 6.3%).
Employment Industries by Sex in Daviess County
The Daviess County industries that see more men than women are Mining, Quarrying, & Extraction (100.0%), Utilities (97.5%), and Construction (96.7%), whereas the industries that tend to have a higher number of women are Health Care & Social Assistance (85.3%), Educational Services (83.7%), and Accommodation & Food Services (74.0%).

| Industry | Male | Female |
| Agriculture, Fishing & Hunting | 538 (79.6%) | 138 (20.4%) |
| Mining, Quarrying, & Extraction | 72 (100.0%) | 0 (0.0%) |
| Construction | 1,792 (96.7%) | 62 (3.3%) |
| Manufacturing | 2,397 (68.6%) | 1,099 (31.4%) |
| Wholesale Trade | 200 (77.5%) | 58 (22.5%) |
| Retail Trade | 1,018 (56.0%) | 800 (44.0%) |
| Transportation & Warehousing | 520 (82.4%) | 111 (17.6%) |
| Utilities | 119 (97.5%) | 3 (2.5%) |
| Information | 147 (51.8%) | 137 (48.2%) |
| Finance & Insurance | 128 (50.6%) | 125 (49.4%) |
| Real Estate, Rental & Leasing | 79 (77.4%) | 23 (22.6%) |
| Professional & Scientific | 261 (64.8%) | 142 (35.2%) |
| Enterprise Management | 0 (0.0%) | 0 (0.0%) |
| Administrative & Support | 140 (34.9%) | 261 (65.1%) |
| Educational Services | 151 (16.3%) | 774 (83.7%) |
| Health Care & Social Assistance | 257 (14.7%) | 1,496 (85.3%) |
| Arts, Entertainment & Recreation | 44 (52.4%) | 40 (47.6%) |
| Accommodation & Food Services | 165 (26.0%) | 470 (74.0%) |
| Public Administration | 658 (68.8%) | 298 (31.2%) |
| Total | 8,890 (58.3%) | 6,358 (41.7%) |
Education in Daviess County
School Enrollment in Daviess County
The most common levels of schooling among the 7,295 students in Daviess County are elementary school (2,186 | 30.0%), middle school (2,045 | 28.0%), and high school (1,668 | 22.9%).
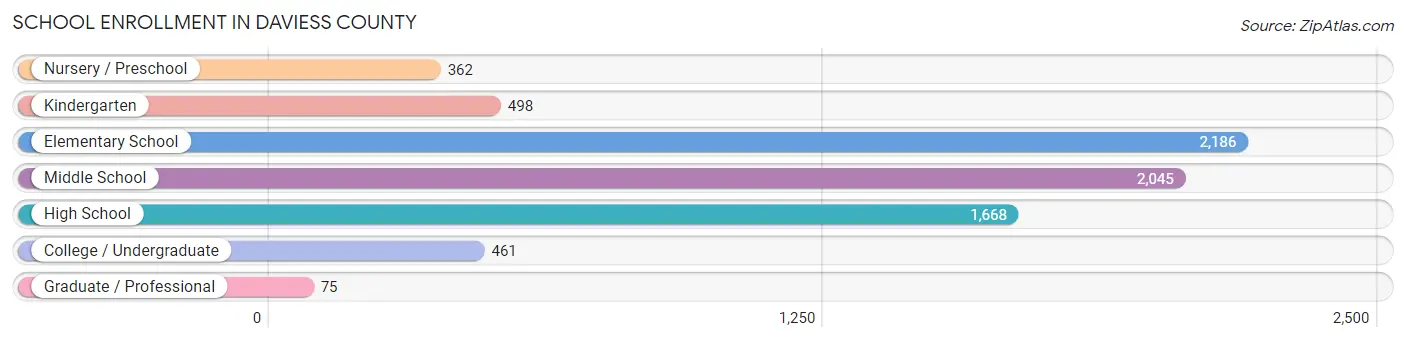
| School Level | # Students | % Students |
| Nursery / Preschool | 362 | 5.0% |
| Kindergarten | 498 | 6.8% |
| Elementary School | 2,186 | 30.0% |
| Middle School | 2,045 | 28.0% |
| High School | 1,668 | 22.9% |
| College / Undergraduate | 461 | 6.3% |
| Graduate / Professional | 75 | 1.0% |
| Total | 7,295 | 100.0% |
School Enrollment by Age by Funding Source in Daviess County
Out of a total of 7,295 students who are enrolled in schools in Daviess County, 2,364 (32.4%) attend a private institution, while the remaining 4,931 (67.6%) are enrolled in public schools. The age group of 5 to 9 year old has the highest likelihood of being enrolled in private schools, with 996 (42.4% in the age bracket) enrolled. Conversely, the age group of 20 to 24 year olds has the lowest likelihood of being enrolled in a private school, with 300 (96.2% in the age bracket) attending a public institution.
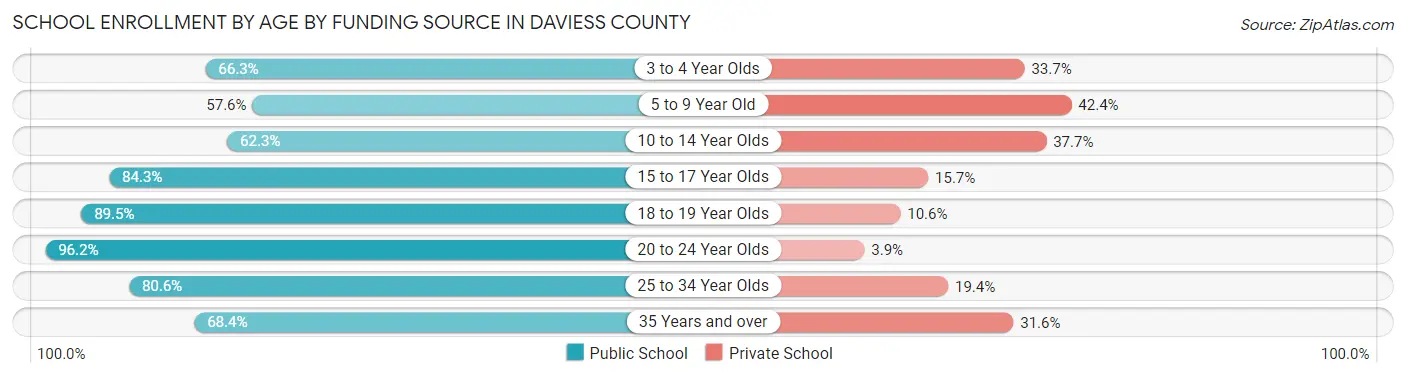
| Age Bracket | Public School | Private School |
| 3 to 4 Year Olds | 128 (66.3%) | 65 (33.7%) |
| 5 to 9 Year Old | 1,352 (57.6%) | 996 (42.4%) |
| 10 to 14 Year Olds | 1,614 (62.3%) | 978 (37.7%) |
| 15 to 17 Year Olds | 1,120 (84.3%) | 209 (15.7%) |
| 18 to 19 Year Olds | 212 (89.4%) | 25 (10.5%) |
| 20 to 24 Year Olds | 300 (96.2%) | 12 (3.8%) |
| 25 to 34 Year Olds | 58 (80.6%) | 14 (19.4%) |
| 35 Years and over | 145 (68.4%) | 67 (31.6%) |
| Total | 4,931 (67.6%) | 2,364 (32.4%) |
Educational Attainment by Field of Study in Daviess County
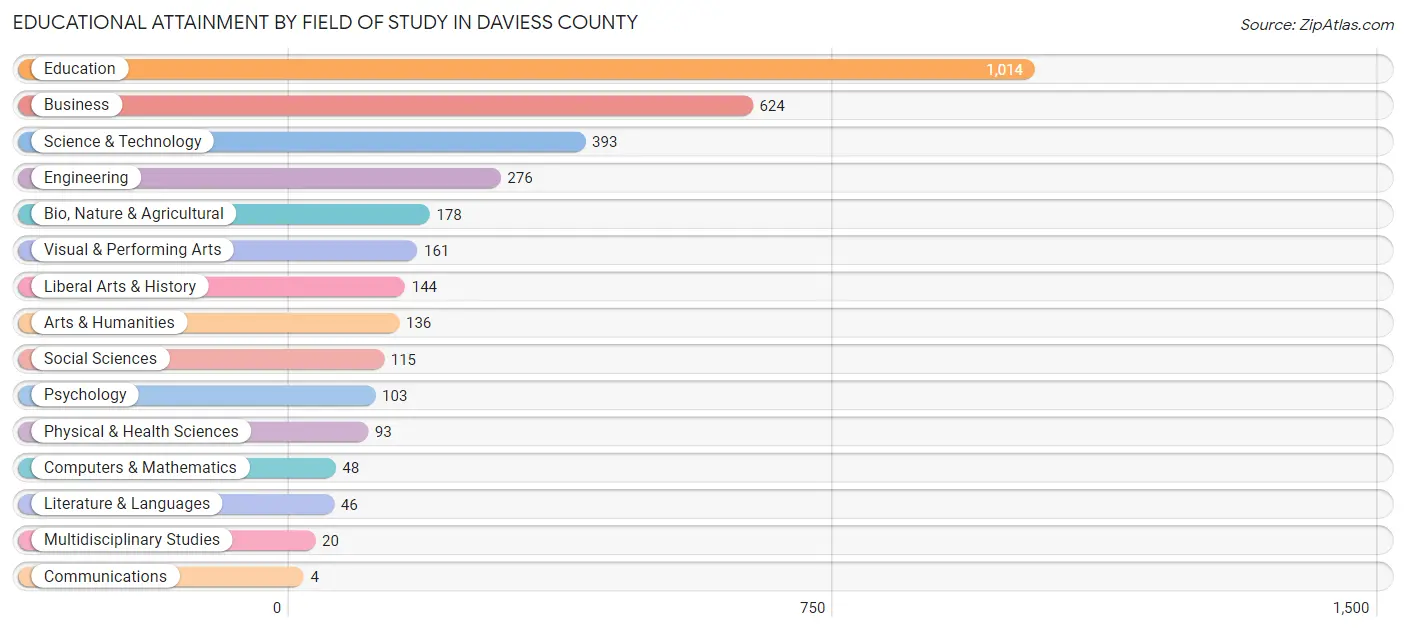
Education (1,014 | 30.2%), business (624 | 18.6%), science & technology (393 | 11.7%), engineering (276 | 8.2%), and bio, nature & agricultural (178 | 5.3%) are the most common fields of study among 3,355 individuals in Daviess County who have obtained a bachelor's degree or higher.
| Field of Study | # Graduates | % Graduates |
| Computers & Mathematics | 48 | 1.4% |
| Bio, Nature & Agricultural | 178 | 5.3% |
| Physical & Health Sciences | 93 | 2.8% |
| Psychology | 103 | 3.1% |
| Social Sciences | 115 | 3.4% |
| Engineering | 276 | 8.2% |
| Multidisciplinary Studies | 20 | 0.6% |
| Science & Technology | 393 | 11.7% |
| Business | 624 | 18.6% |
| Education | 1,014 | 30.2% |
| Literature & Languages | 46 | 1.4% |
| Liberal Arts & History | 144 | 4.3% |
| Visual & Performing Arts | 161 | 4.8% |
| Communications | 4 | 0.1% |
| Arts & Humanities | 136 | 4.1% |
| Total | 3,355 | 100.0% |
Transportation & Commute in Daviess County
Vehicle Availability by Sex in Daviess County
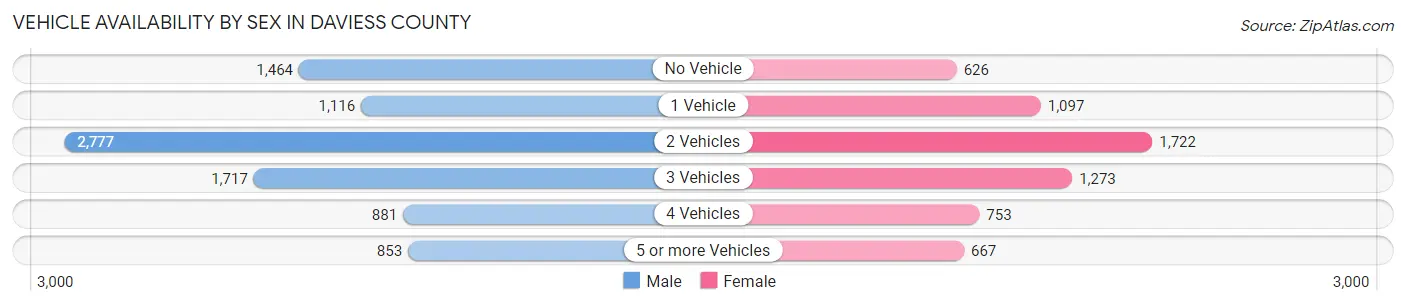
The most prevalent vehicle ownership categories in Daviess County are males with 2 vehicles (2,777, accounting for 31.5%) and females with 2 vehicles (1,722, making up 45.2%).
| Vehicles Available | Male | Female |
| No Vehicle | 1,464 (16.6%) | 626 (10.2%) |
| 1 Vehicle | 1,116 (12.7%) | 1,097 (17.9%) |
| 2 Vehicles | 2,777 (31.5%) | 1,722 (28.1%) |
| 3 Vehicles | 1,717 (19.5%) | 1,273 (20.7%) |
| 4 Vehicles | 881 (10.0%) | 753 (12.3%) |
| 5 or more Vehicles | 853 (9.7%) | 667 (10.9%) |
| Total | 8,808 (100.0%) | 6,138 (100.0%) |
Commute Time in Daviess County
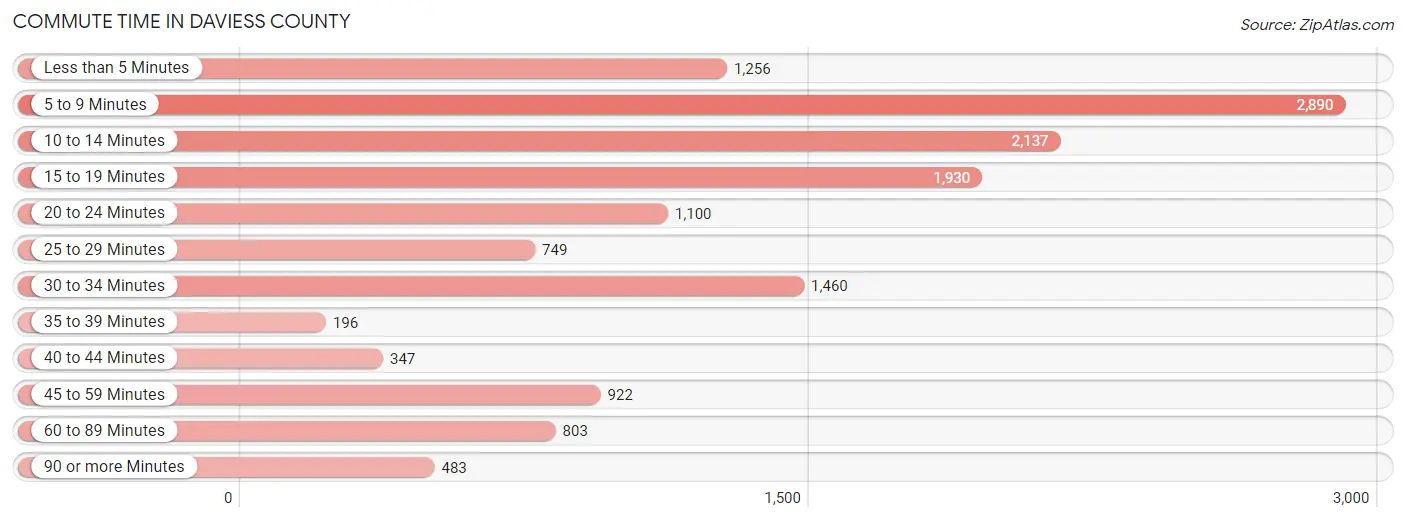
The most frequently occuring commute durations in Daviess County are 5 to 9 minutes (2,890 commuters, 20.3%), 10 to 14 minutes (2,137 commuters, 15.0%), and 15 to 19 minutes (1,930 commuters, 13.5%).
| Commute Time | # Commuters | % Commuters |
| Less than 5 Minutes | 1,256 | 8.8% |
| 5 to 9 Minutes | 2,890 | 20.3% |
| 10 to 14 Minutes | 2,137 | 15.0% |
| 15 to 19 Minutes | 1,930 | 13.5% |
| 20 to 24 Minutes | 1,100 | 7.7% |
| 25 to 29 Minutes | 749 | 5.2% |
| 30 to 34 Minutes | 1,460 | 10.2% |
| 35 to 39 Minutes | 196 | 1.4% |
| 40 to 44 Minutes | 347 | 2.4% |
| 45 to 59 Minutes | 922 | 6.5% |
| 60 to 89 Minutes | 803 | 5.6% |
| 90 or more Minutes | 483 | 3.4% |
Commute Time by Sex in Daviess County
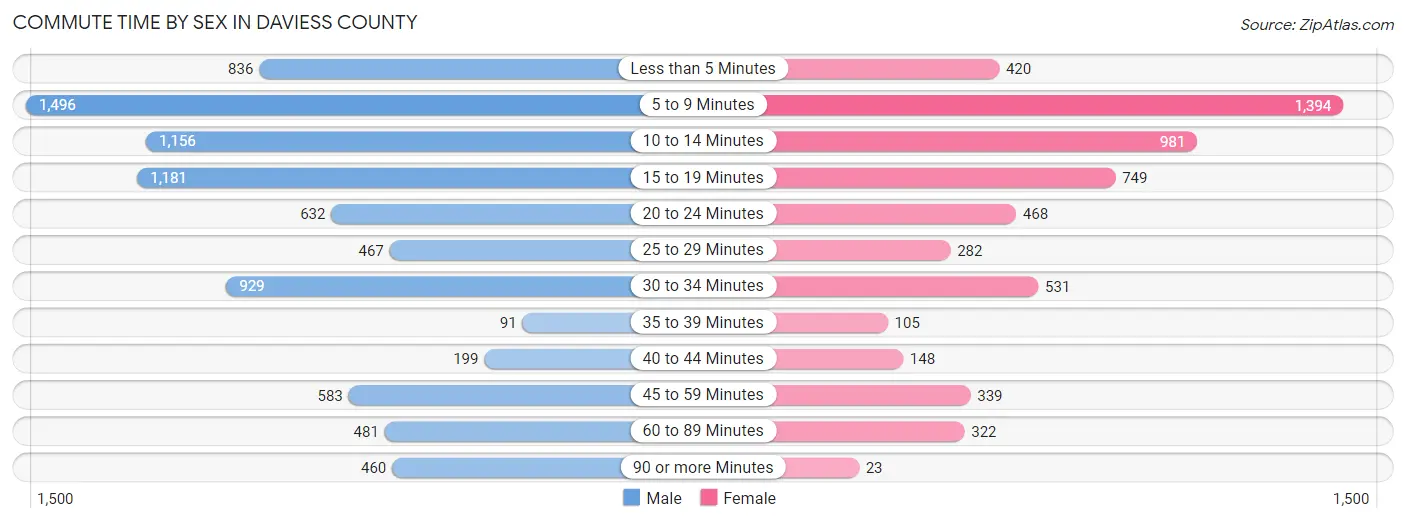
The most common commute times in Daviess County are 5 to 9 minutes (1,496 commuters, 17.6%) for males and 5 to 9 minutes (1,394 commuters, 24.2%) for females.
| Commute Time | Male | Female |
| Less than 5 Minutes | 836 (9.8%) | 420 (7.3%) |
| 5 to 9 Minutes | 1,496 (17.6%) | 1,394 (24.2%) |
| 10 to 14 Minutes | 1,156 (13.6%) | 981 (17.0%) |
| 15 to 19 Minutes | 1,181 (13.9%) | 749 (13.0%) |
| 20 to 24 Minutes | 632 (7.4%) | 468 (8.1%) |
| 25 to 29 Minutes | 467 (5.5%) | 282 (4.9%) |
| 30 to 34 Minutes | 929 (10.9%) | 531 (9.2%) |
| 35 to 39 Minutes | 91 (1.1%) | 105 (1.8%) |
| 40 to 44 Minutes | 199 (2.3%) | 148 (2.6%) |
| 45 to 59 Minutes | 583 (6.9%) | 339 (5.9%) |
| 60 to 89 Minutes | 481 (5.7%) | 322 (5.6%) |
| 90 or more Minutes | 460 (5.4%) | 23 (0.4%) |
Time of Departure to Work by Sex in Daviess County
The most frequent times of departure to work in Daviess County are 6:00 AM to 6:29 AM (1,603, 18.8%) for males and 7:00 AM to 7:29 AM (1,047, 18.2%) for females.
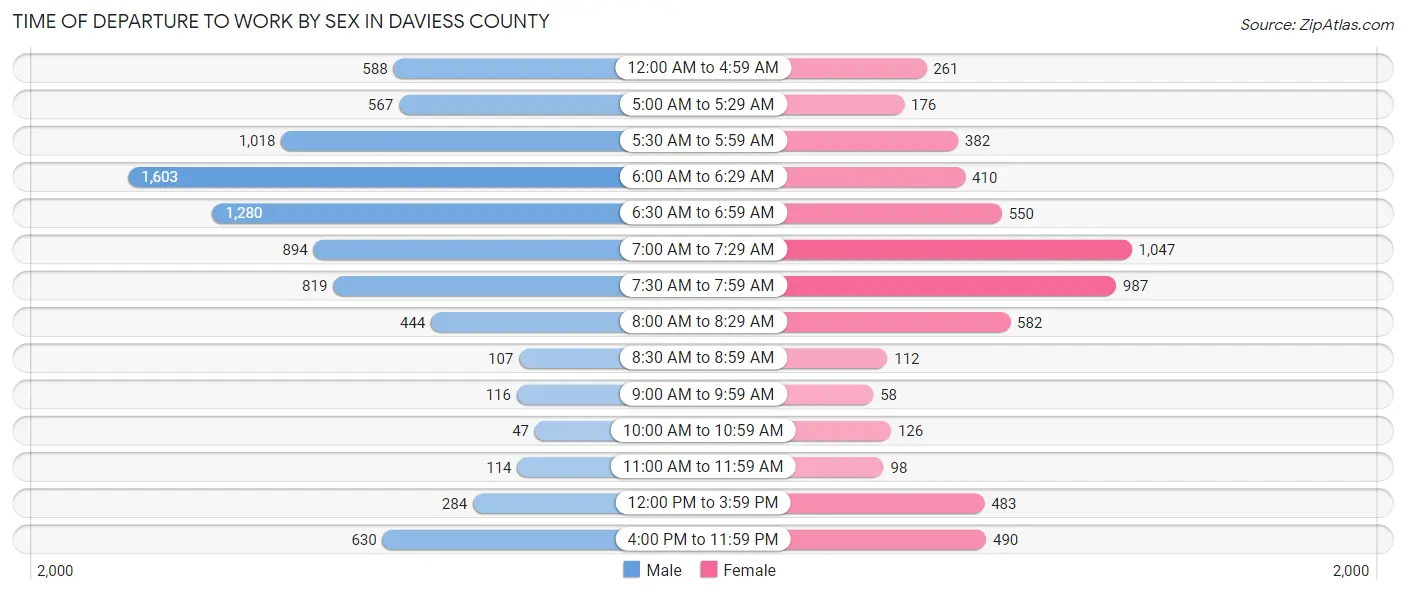
| Time of Departure | Male | Female |
| 12:00 AM to 4:59 AM | 588 (6.9%) | 261 (4.5%) |
| 5:00 AM to 5:29 AM | 567 (6.7%) | 176 (3.0%) |
| 5:30 AM to 5:59 AM | 1,018 (12.0%) | 382 (6.6%) |
| 6:00 AM to 6:29 AM | 1,603 (18.8%) | 410 (7.1%) |
| 6:30 AM to 6:59 AM | 1,280 (15.0%) | 550 (9.6%) |
| 7:00 AM to 7:29 AM | 894 (10.5%) | 1,047 (18.2%) |
| 7:30 AM to 7:59 AM | 819 (9.6%) | 987 (17.1%) |
| 8:00 AM to 8:29 AM | 444 (5.2%) | 582 (10.1%) |
| 8:30 AM to 8:59 AM | 107 (1.3%) | 112 (1.9%) |
| 9:00 AM to 9:59 AM | 116 (1.4%) | 58 (1.0%) |
| 10:00 AM to 10:59 AM | 47 (0.5%) | 126 (2.2%) |
| 11:00 AM to 11:59 AM | 114 (1.3%) | 98 (1.7%) |
| 12:00 PM to 3:59 PM | 284 (3.3%) | 483 (8.4%) |
| 4:00 PM to 11:59 PM | 630 (7.4%) | 490 (8.5%) |
| Total | 8,511 (100.0%) | 5,762 (100.0%) |
Housing Occupancy in Daviess County
Occupancy by Ownership in Daviess County
Of the total 11,606 dwellings in Daviess County, owner-occupied units account for 8,161 (70.3%), while renter-occupied units make up 3,445 (29.7%).
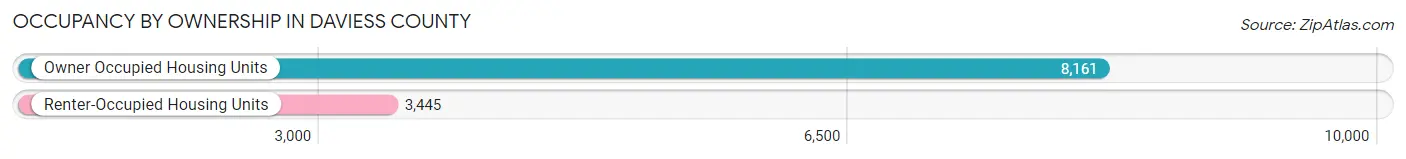
| Occupancy | # Housing Units | % Housing Units |
| Owner Occupied Housing Units | 8,161 | 70.3% |
| Renter-Occupied Housing Units | 3,445 | 29.7% |
| Total Occupied Housing Units | 11,606 | 100.0% |
Occupancy by Household Size in Daviess County
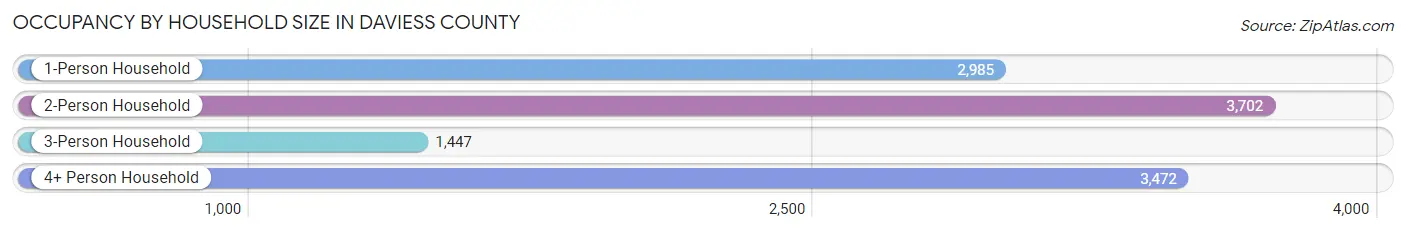
| Household Size | # Housing Units | % Housing Units |
| 1-Person Household | 2,985 | 25.7% |
| 2-Person Household | 3,702 | 31.9% |
| 3-Person Household | 1,447 | 12.5% |
| 4+ Person Household | 3,472 | 29.9% |
| Total Housing Units | 11,606 | 100.0% |
Occupancy by Ownership by Household Size in Daviess County
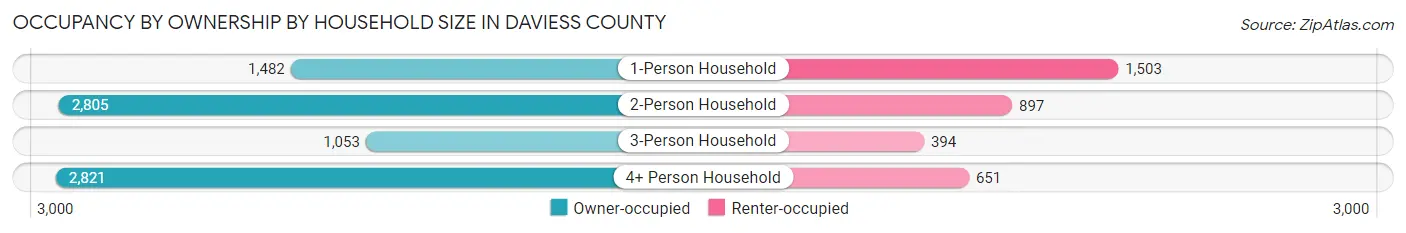
| Household Size | Owner-occupied | Renter-occupied |
| 1-Person Household | 1,482 (49.6%) | 1,503 (50.3%) |
| 2-Person Household | 2,805 (75.8%) | 897 (24.2%) |
| 3-Person Household | 1,053 (72.8%) | 394 (27.2%) |
| 4+ Person Household | 2,821 (81.2%) | 651 (18.8%) |
| Total Housing Units | 8,161 (70.3%) | 3,445 (29.7%) |
Occupancy by Educational Attainment in Daviess County
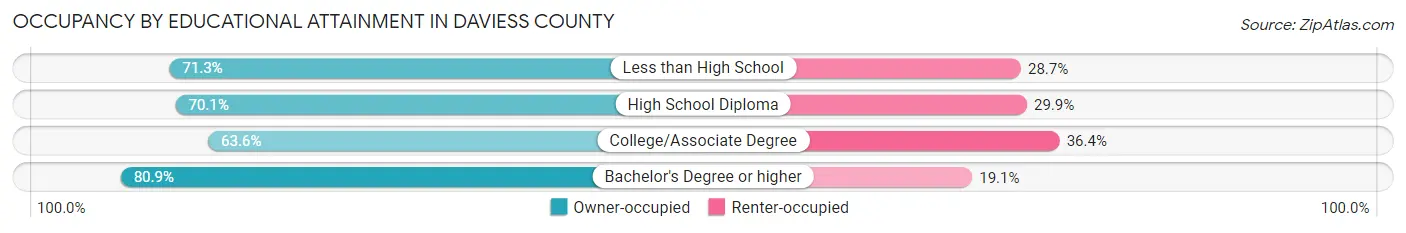
| Household Size | Owner-occupied | Renter-occupied |
| Less than High School | 1,710 (71.3%) | 689 (28.7%) |
| High School Diploma | 2,789 (70.1%) | 1,191 (29.9%) |
| College/Associate Degree | 2,087 (63.6%) | 1,194 (36.4%) |
| Bachelor's Degree or higher | 1,575 (80.9%) | 371 (19.1%) |
Occupancy by Age of Householder in Daviess County
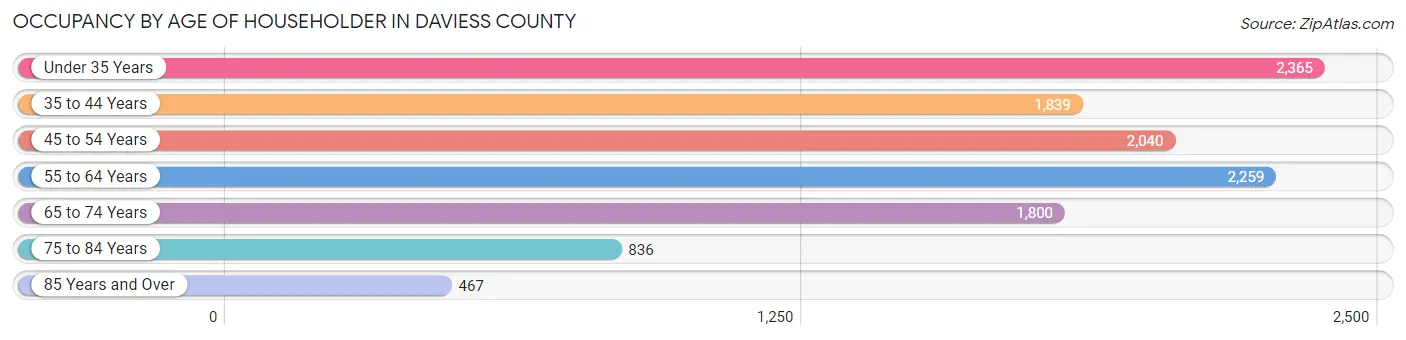
| Age Bracket | # Households | % Households |
| Under 35 Years | 2,365 | 20.4% |
| 35 to 44 Years | 1,839 | 15.9% |
| 45 to 54 Years | 2,040 | 17.6% |
| 55 to 64 Years | 2,259 | 19.5% |
| 65 to 74 Years | 1,800 | 15.5% |
| 75 to 84 Years | 836 | 7.2% |
| 85 Years and Over | 467 | 4.0% |
| Total | 11,606 | 100.0% |
Housing Finances in Daviess County
Median Income by Occupancy in Daviess County
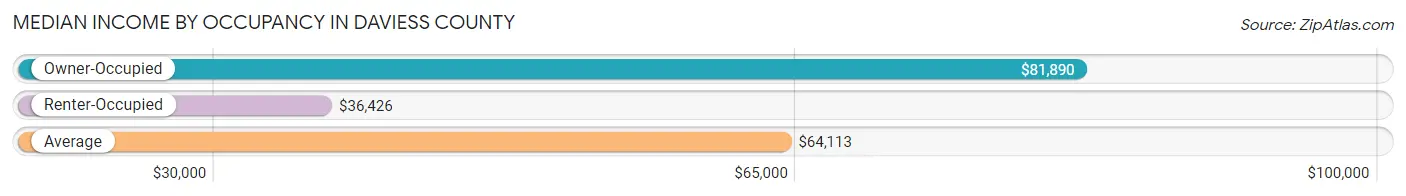
| Occupancy Type | # Households | Median Income |
| Owner-Occupied | 8,161 (70.3%) | $81,890 |
| Renter-Occupied | 3,445 (29.7%) | $36,426 |
| Average | 11,606 (100.0%) | $64,113 |
Occupancy by Householder Income Bracket in Daviess County
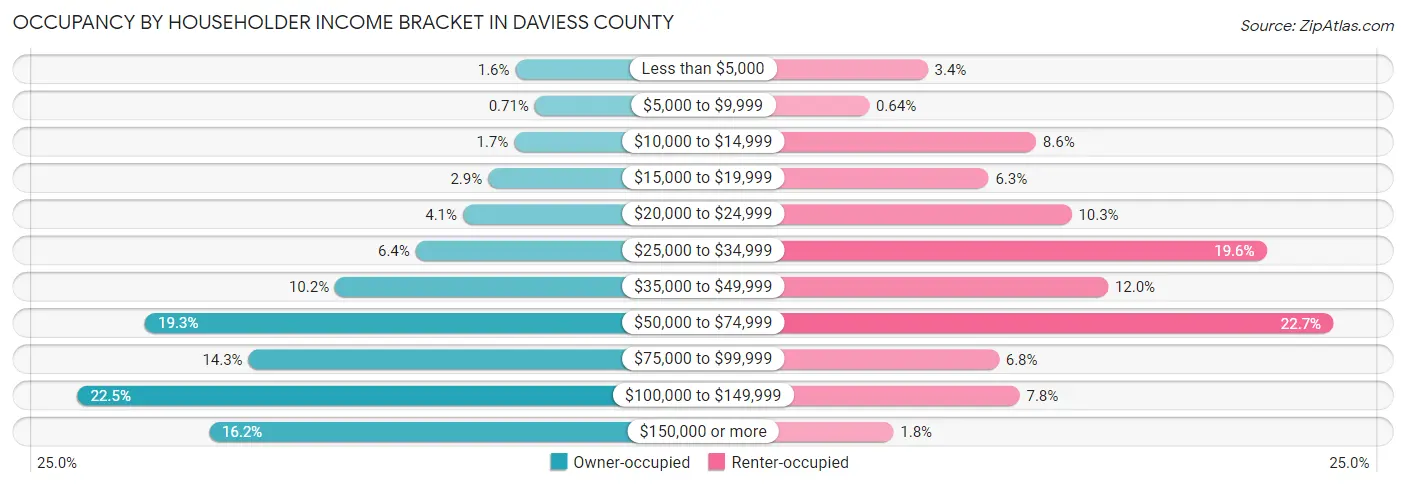
| Income Bracket | Owner-occupied | Renter-occupied |
| Less than $5,000 | 133 (1.6%) | 118 (3.4%) |
| $5,000 to $9,999 | 58 (0.7%) | 22 (0.6%) |
| $10,000 to $14,999 | 138 (1.7%) | 296 (8.6%) |
| $15,000 to $19,999 | 239 (2.9%) | 218 (6.3%) |
| $20,000 to $24,999 | 337 (4.1%) | 354 (10.3%) |
| $25,000 to $34,999 | 521 (6.4%) | 674 (19.6%) |
| $35,000 to $49,999 | 834 (10.2%) | 414 (12.0%) |
| $50,000 to $74,999 | 1,572 (19.3%) | 783 (22.7%) |
| $75,000 to $99,999 | 1,170 (14.3%) | 235 (6.8%) |
| $100,000 to $149,999 | 1,835 (22.5%) | 269 (7.8%) |
| $150,000 or more | 1,324 (16.2%) | 62 (1.8%) |
| Total | 8,161 (100.0%) | 3,445 (100.0%) |
Monthly Housing Cost Tiers in Daviess County
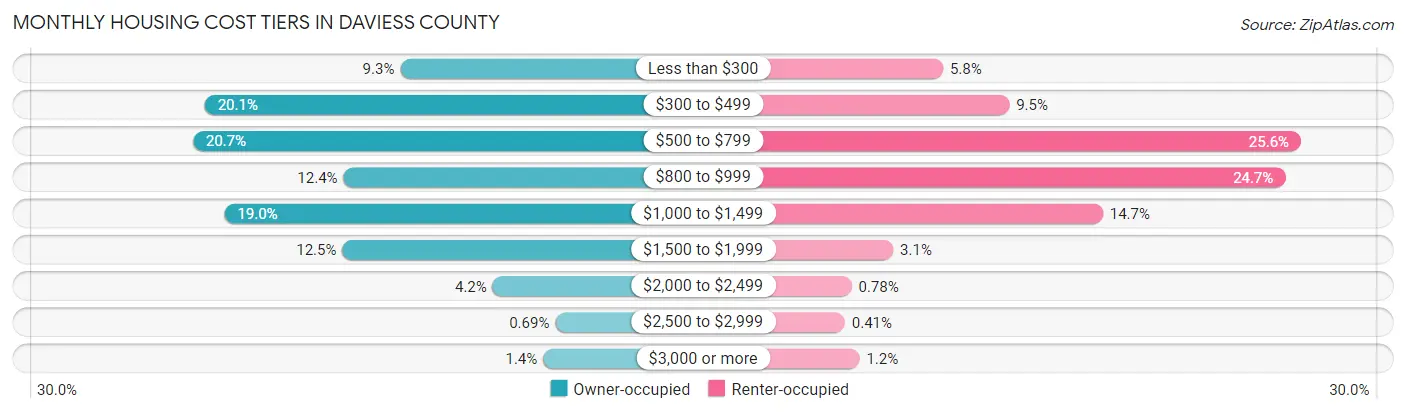
| Monthly Cost | Owner-occupied | Renter-occupied |
| Less than $300 | 755 (9.2%) | 201 (5.8%) |
| $300 to $499 | 1,636 (20.1%) | 327 (9.5%) |
| $500 to $799 | 1,690 (20.7%) | 882 (25.6%) |
| $800 to $999 | 1,011 (12.4%) | 852 (24.7%) |
| $1,000 to $1,499 | 1,547 (19.0%) | 505 (14.7%) |
| $1,500 to $1,999 | 1,016 (12.4%) | 106 (3.1%) |
| $2,000 to $2,499 | 339 (4.2%) | 27 (0.8%) |
| $2,500 to $2,999 | 56 (0.7%) | 14 (0.4%) |
| $3,000 or more | 111 (1.4%) | 42 (1.2%) |
| Total | 8,161 (100.0%) | 3,445 (100.0%) |
Physical Housing Characteristics in Daviess County
Housing Structures in Daviess County
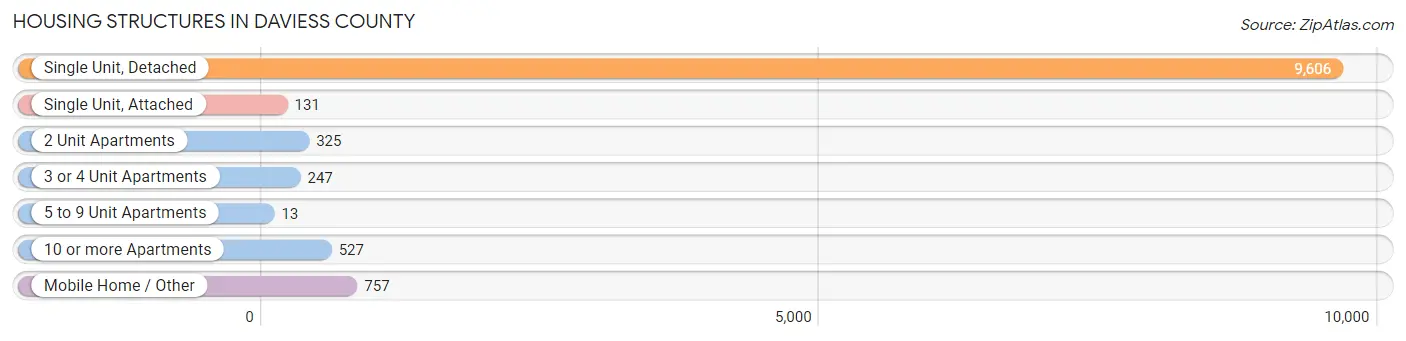
| Structure Type | # Housing Units | % Housing Units |
| Single Unit, Detached | 9,606 | 82.8% |
| Single Unit, Attached | 131 | 1.1% |
| 2 Unit Apartments | 325 | 2.8% |
| 3 or 4 Unit Apartments | 247 | 2.1% |
| 5 to 9 Unit Apartments | 13 | 0.1% |
| 10 or more Apartments | 527 | 4.5% |
| Mobile Home / Other | 757 | 6.5% |
| Total | 11,606 | 100.0% |
Housing Structures by Occupancy in Daviess County
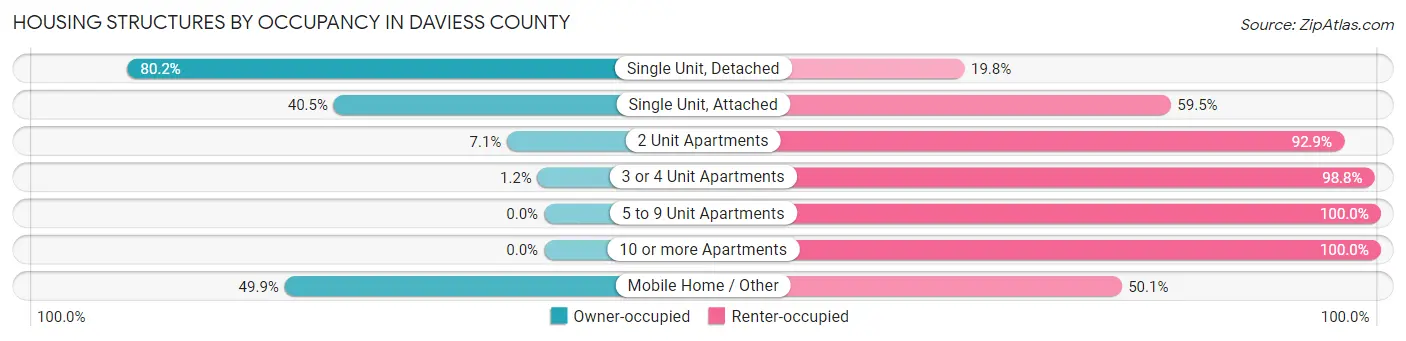
| Structure Type | Owner-occupied | Renter-occupied |
| Single Unit, Detached | 7,704 (80.2%) | 1,902 (19.8%) |
| Single Unit, Attached | 53 (40.5%) | 78 (59.5%) |
| 2 Unit Apartments | 23 (7.1%) | 302 (92.9%) |
| 3 or 4 Unit Apartments | 3 (1.2%) | 244 (98.8%) |
| 5 to 9 Unit Apartments | 0 (0.0%) | 13 (100.0%) |
| 10 or more Apartments | 0 (0.0%) | 527 (100.0%) |
| Mobile Home / Other | 378 (49.9%) | 379 (50.1%) |
| Total | 8,161 (70.3%) | 3,445 (29.7%) |
Housing Structures by Number of Rooms in Daviess County

| Number of Rooms | Owner-occupied | Renter-occupied |
| 1 Room | 0 (0.0%) | 116 (3.4%) |
| 2 or 3 Rooms | 156 (1.9%) | 677 (19.7%) |
| 4 or 5 Rooms | 2,433 (29.8%) | 1,669 (48.4%) |
| 6 or 7 Rooms | 3,068 (37.6%) | 808 (23.4%) |
| 8 or more Rooms | 2,504 (30.7%) | 175 (5.1%) |
| Total | 8,161 (100.0%) | 3,445 (100.0%) |
Housing Structure by Heating Type in Daviess County

| Heating Type | Owner-occupied | Renter-occupied |
| Utility Gas | 4,248 (52.0%) | 1,433 (41.6%) |
| Bottled, Tank, or LP Gas | 1,515 (18.6%) | 398 (11.6%) |
| Electricity | 1,526 (18.7%) | 1,445 (41.9%) |
| Fuel Oil or Kerosene | 134 (1.6%) | 19 (0.5%) |
| Coal or Coke | 366 (4.5%) | 38 (1.1%) |
| All other Fuels | 336 (4.1%) | 43 (1.3%) |
| No Fuel Used | 36 (0.4%) | 69 (2.0%) |
| Total | 8,161 (100.0%) | 3,445 (100.0%) |
Household Vehicle Usage in Daviess County
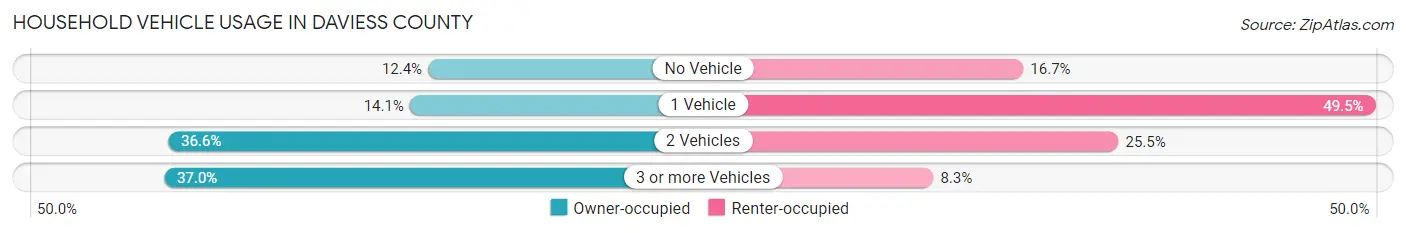
| Vehicles per Household | Owner-occupied | Renter-occupied |
| No Vehicle | 1,008 (12.3%) | 574 (16.7%) |
| 1 Vehicle | 1,147 (14.1%) | 1,706 (49.5%) |
| 2 Vehicles | 2,987 (36.6%) | 880 (25.5%) |
| 3 or more Vehicles | 3,019 (37.0%) | 285 (8.3%) |
| Total | 8,161 (100.0%) | 3,445 (100.0%) |
Real Estate & Mortgages in Daviess County
Real Estate and Mortgage Overview in Daviess County
| Characteristic | Without Mortgage | With Mortgage |
| Housing Units | 3,752 | 4,409 |
| Median Property Value | $150,000 | $200,400 |
| Median Household Income | $66,742 | $901 |
| Monthly Housing Costs | $448 | $102 |
| Real Estate Taxes | $1,145 | $203 |
Property Value by Mortgage Status in Daviess County
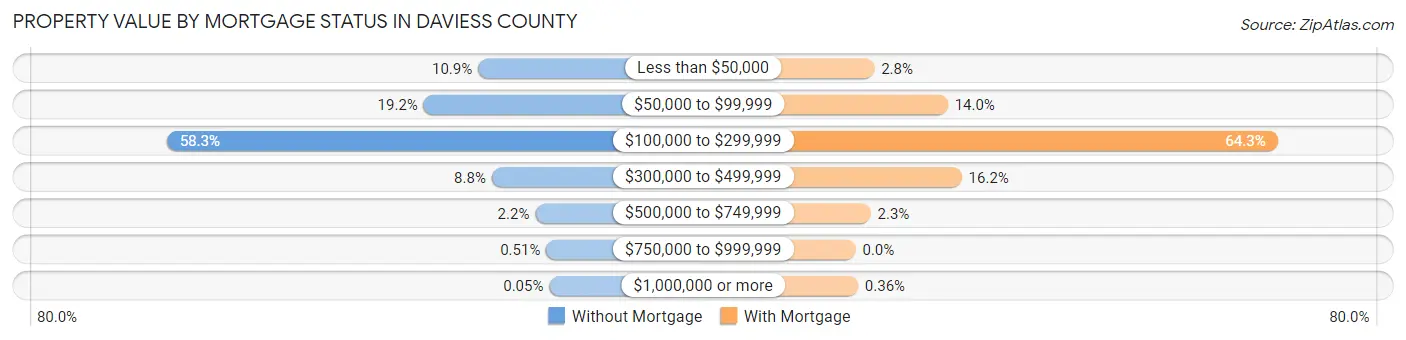
| Property Value | Without Mortgage | With Mortgage |
| Less than $50,000 | 409 (10.9%) | 125 (2.8%) |
| $50,000 to $99,999 | 720 (19.2%) | 619 (14.0%) |
| $100,000 to $299,999 | 2,189 (58.3%) | 2,835 (64.3%) |
| $300,000 to $499,999 | 331 (8.8%) | 713 (16.2%) |
| $500,000 to $749,999 | 82 (2.2%) | 101 (2.3%) |
| $750,000 to $999,999 | 19 (0.5%) | 0 (0.0%) |
| $1,000,000 or more | 2 (0.1%) | 16 (0.4%) |
| Total | 3,752 (100.0%) | 4,409 (100.0%) |
Household Income by Mortgage Status in Daviess County
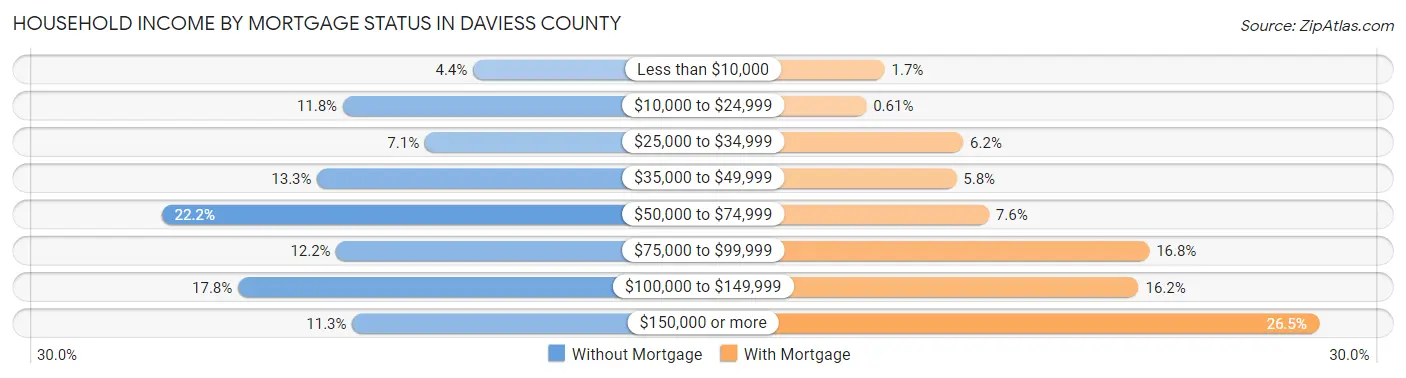
| Household Income | Without Mortgage | With Mortgage |
| Less than $10,000 | 164 (4.4%) | 73 (1.7%) |
| $10,000 to $24,999 | 443 (11.8%) | 27 (0.6%) |
| $25,000 to $34,999 | 267 (7.1%) | 271 (6.1%) |
| $35,000 to $49,999 | 498 (13.3%) | 254 (5.8%) |
| $50,000 to $74,999 | 832 (22.2%) | 336 (7.6%) |
| $75,000 to $99,999 | 457 (12.2%) | 740 (16.8%) |
| $100,000 to $149,999 | 668 (17.8%) | 713 (16.2%) |
| $150,000 or more | 423 (11.3%) | 1,167 (26.5%) |
| Total | 3,752 (100.0%) | 4,409 (100.0%) |
Property Value to Household Income Ratio in Daviess County
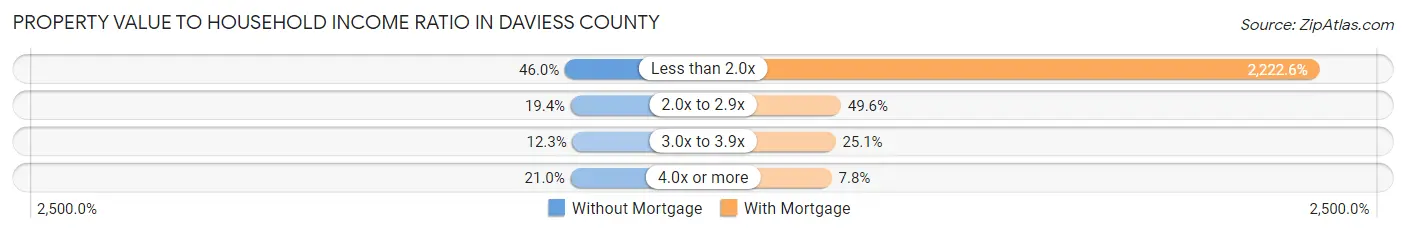
| Value-to-Income Ratio | Without Mortgage | With Mortgage |
| Less than 2.0x | 1,724 (46.0%) | 97,993 (2,222.6%) |
| 2.0x to 2.9x | 729 (19.4%) | 2,188 (49.6%) |
| 3.0x to 3.9x | 461 (12.3%) | 1,108 (25.1%) |
| 4.0x or more | 788 (21.0%) | 343 (7.8%) |
| Total | 3,752 (100.0%) | 4,409 (100.0%) |
Real Estate Taxes by Mortgage Status in Daviess County

| Property Taxes | Without Mortgage | With Mortgage |
| Less than $800 | 1,286 (34.3%) | 8 (0.2%) |
| $800 to $1,499 | 1,028 (27.4%) | 1,020 (23.1%) |
| $800 to $1,499 | 1,307 (34.8%) | 1,404 (31.8%) |
| Total | 3,752 (100.0%) | 4,409 (100.0%) |
Health & Disability in Daviess County
Health Insurance Coverage by Age in Daviess County
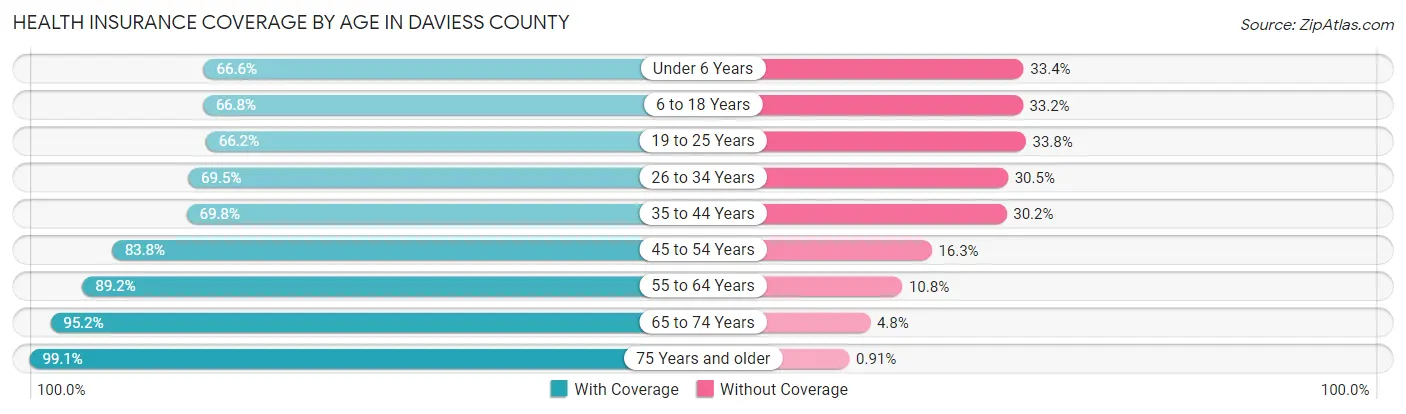
| Age Bracket | With Coverage | Without Coverage |
| Under 6 Years | 2,122 (66.6%) | 1,064 (33.4%) |
| 6 to 18 Years | 4,674 (66.8%) | 2,325 (33.2%) |
| 19 to 25 Years | 1,782 (66.2%) | 910 (33.8%) |
| 26 to 34 Years | 2,618 (69.5%) | 1,148 (30.5%) |
| 35 to 44 Years | 2,740 (69.8%) | 1,186 (30.2%) |
| 45 to 54 Years | 2,875 (83.8%) | 558 (16.3%) |
| 55 to 64 Years | 3,425 (89.2%) | 413 (10.8%) |
| 65 to 74 Years | 2,761 (95.2%) | 139 (4.8%) |
| 75 Years and older | 2,073 (99.1%) | 19 (0.9%) |
| Total | 25,070 (76.4%) | 7,762 (23.6%) |
Health Insurance Coverage by Citizenship Status in Daviess County
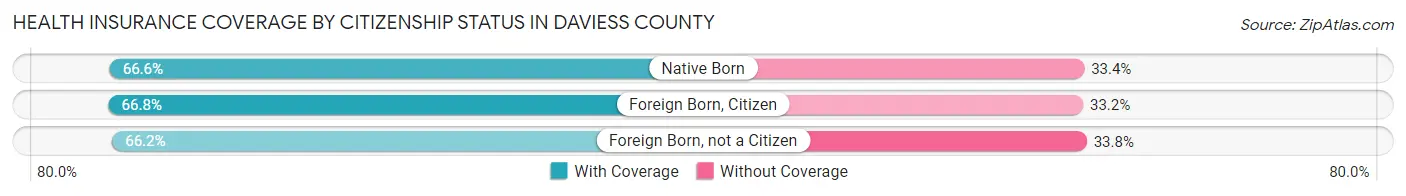
| Citizenship Status | With Coverage | Without Coverage |
| Native Born | 2,122 (66.6%) | 1,064 (33.4%) |
| Foreign Born, Citizen | 4,674 (66.8%) | 2,325 (33.2%) |
| Foreign Born, not a Citizen | 1,782 (66.2%) | 910 (33.8%) |
Health Insurance Coverage by Household Income in Daviess County
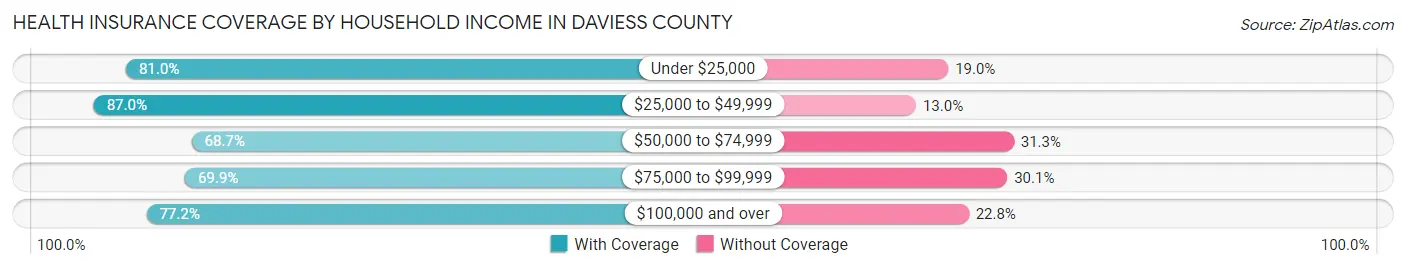
| Household Income | With Coverage | Without Coverage |
| Under $25,000 | 2,571 (81.0%) | 603 (19.0%) |
| $25,000 to $49,999 | 4,635 (87.0%) | 690 (13.0%) |
| $50,000 to $74,999 | 4,366 (68.7%) | 1,987 (31.3%) |
| $75,000 to $99,999 | 3,453 (69.9%) | 1,484 (30.1%) |
| $100,000 and over | 9,973 (77.2%) | 2,952 (22.8%) |
Public vs Private Health Insurance Coverage by Age in Daviess County

| Age Bracket | Public Insurance | Private Insurance |
| Under 6 | 1,018 (32.0%) | 1,173 (36.8%) |
| 6 to 18 Years | 1,491 (21.3%) | 3,475 (49.6%) |
| 19 to 25 Years | 452 (16.8%) | 1,465 (54.4%) |
| 25 to 34 Years | 595 (15.8%) | 2,090 (55.5%) |
| 35 to 44 Years | 496 (12.6%) | 2,396 (61.0%) |
| 45 to 54 Years | 509 (14.8%) | 2,523 (73.5%) |
| 55 to 64 Years | 734 (19.1%) | 2,934 (76.4%) |
| 65 to 74 Years | 2,679 (92.4%) | 1,806 (62.3%) |
| 75 Years and over | 2,065 (98.7%) | 1,468 (70.2%) |
| Total | 10,039 (30.6%) | 19,330 (58.9%) |
Disability Status by Sex by Age in Daviess County
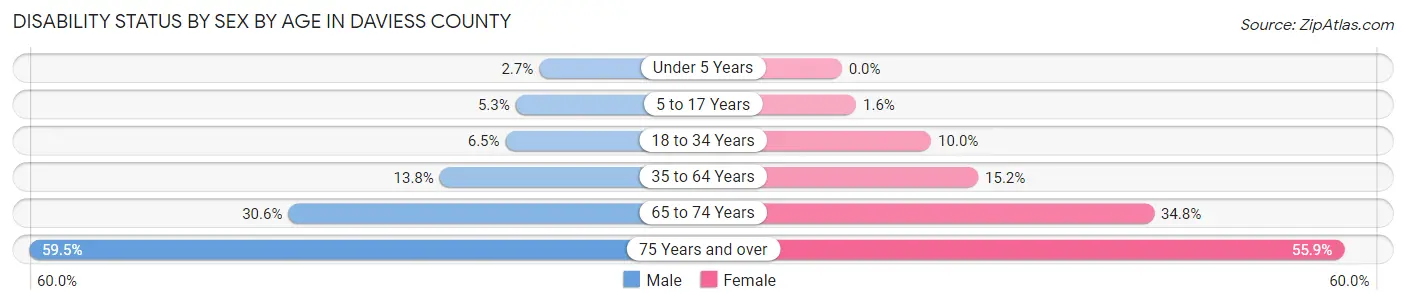
| Age Bracket | Male | Female |
| Under 5 Years | 35 (2.7%) | 0 (0.0%) |
| 5 to 17 Years | 188 (5.3%) | 58 (1.6%) |
| 18 to 34 Years | 235 (6.5%) | 321 (10.0%) |
| 35 to 64 Years | 767 (13.8%) | 855 (15.2%) |
| 65 to 74 Years | 448 (30.6%) | 500 (34.8%) |
| 75 Years and over | 513 (59.5%) | 688 (55.9%) |
Disability Class by Sex by Age in Daviess County
Disability Class: Hearing Difficulty
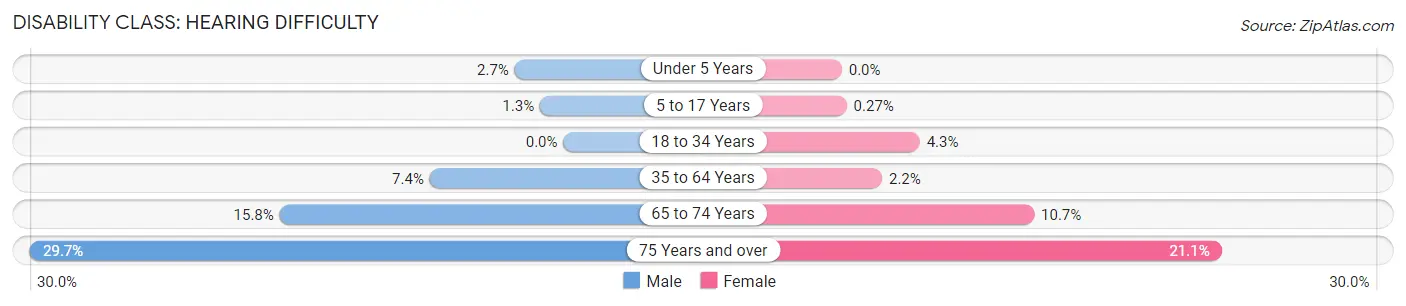
| Age Bracket | Male | Female |
| Under 5 Years | 35 (2.7%) | 0 (0.0%) |
| 5 to 17 Years | 46 (1.3%) | 10 (0.3%) |
| 18 to 34 Years | 0 (0.0%) | 140 (4.3%) |
| 35 to 64 Years | 414 (7.4%) | 126 (2.2%) |
| 65 to 74 Years | 231 (15.8%) | 154 (10.7%) |
| 75 Years and over | 256 (29.7%) | 260 (21.1%) |
Disability Class: Vision Difficulty
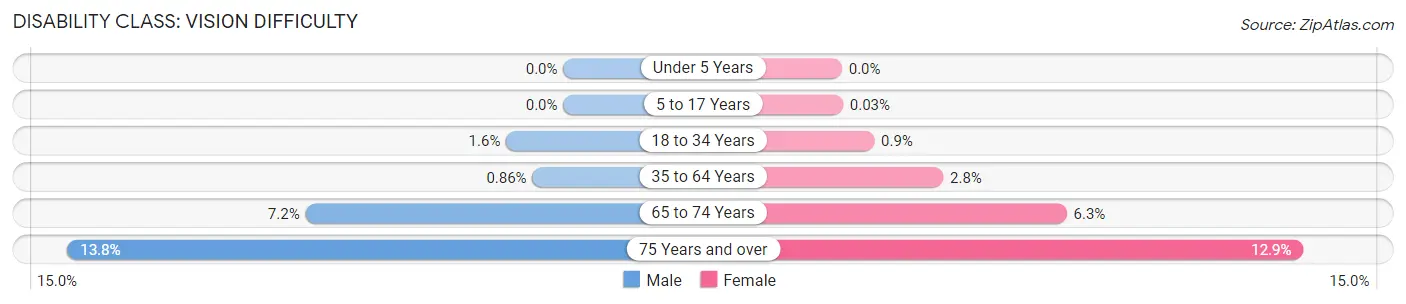
| Age Bracket | Male | Female |
| Under 5 Years | 0 (0.0%) | 0 (0.0%) |
| 5 to 17 Years | 0 (0.0%) | 1 (0.0%) |
| 18 to 34 Years | 58 (1.6%) | 29 (0.9%) |
| 35 to 64 Years | 48 (0.9%) | 159 (2.8%) |
| 65 to 74 Years | 105 (7.2%) | 90 (6.3%) |
| 75 Years and over | 119 (13.8%) | 158 (12.9%) |
Disability Class: Cognitive Difficulty
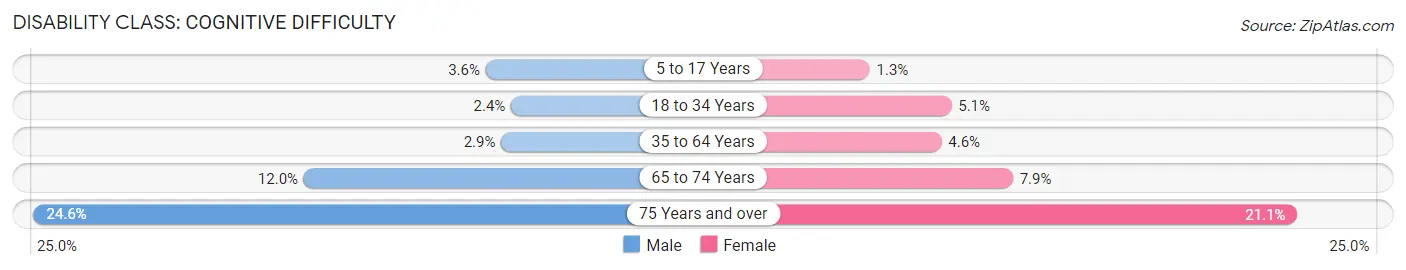
| Age Bracket | Male | Female |
| 5 to 17 Years | 127 (3.6%) | 47 (1.3%) |
| 18 to 34 Years | 88 (2.4%) | 164 (5.1%) |
| 35 to 64 Years | 160 (2.9%) | 260 (4.6%) |
| 65 to 74 Years | 176 (12.0%) | 114 (7.9%) |
| 75 Years and over | 212 (24.6%) | 260 (21.1%) |
Disability Class: Ambulatory Difficulty
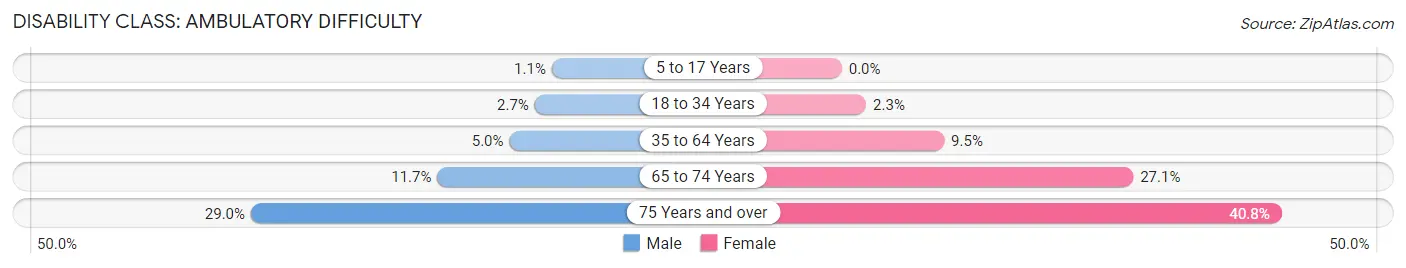
| Age Bracket | Male | Female |
| 5 to 17 Years | 38 (1.1%) | 0 (0.0%) |
| 18 to 34 Years | 97 (2.7%) | 73 (2.3%) |
| 35 to 64 Years | 279 (5.0%) | 535 (9.5%) |
| 65 to 74 Years | 171 (11.7%) | 389 (27.1%) |
| 75 Years and over | 250 (29.0%) | 502 (40.8%) |
Disability Class: Self-Care Difficulty
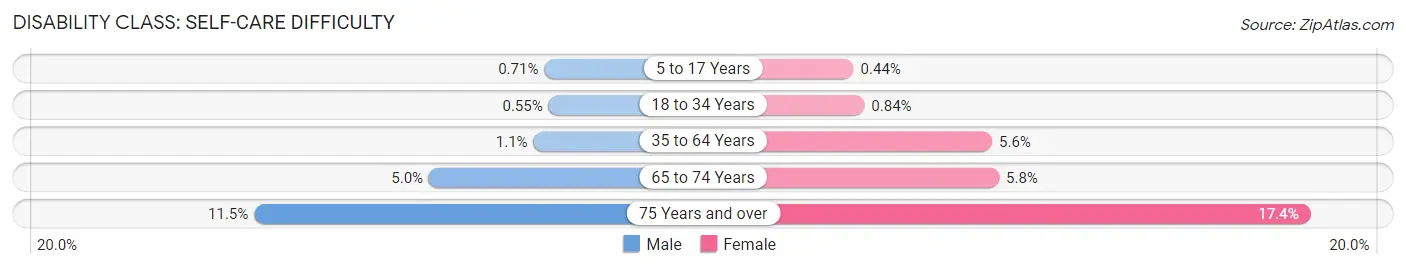
| Age Bracket | Male | Female |
| 5 to 17 Years | 25 (0.7%) | 16 (0.4%) |
| 18 to 34 Years | 20 (0.5%) | 27 (0.8%) |
| 35 to 64 Years | 62 (1.1%) | 314 (5.6%) |
| 65 to 74 Years | 73 (5.0%) | 84 (5.8%) |
| 75 Years and over | 99 (11.5%) | 214 (17.4%) |
Technology Access in Daviess County
Computing Device Access in Daviess County
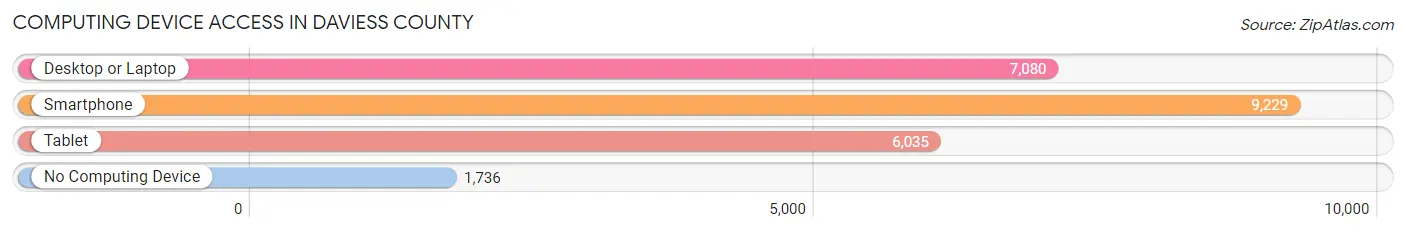
| Device Type | # Households | % Households |
| Desktop or Laptop | 7,080 | 61.0% |
| Smartphone | 9,229 | 79.5% |
| Tablet | 6,035 | 52.0% |
| No Computing Device | 1,736 | 15.0% |
| Total | 11,606 | 100.0% |
Internet Access in Daviess County
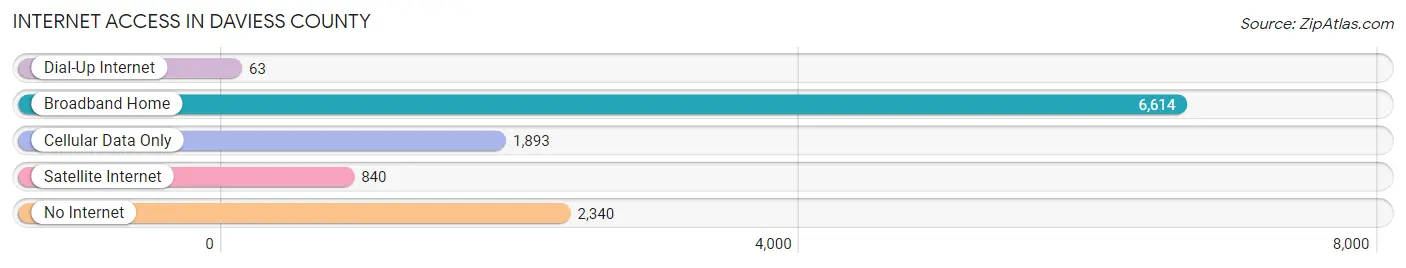
| Internet Type | # Households | % Households |
| Dial-Up Internet | 63 | 0.5% |
| Broadband Home | 6,614 | 57.0% |
| Cellular Data Only | 1,893 | 16.3% |
| Satellite Internet | 840 | 7.2% |
| No Internet | 2,340 | 20.2% |
| Total | 11,606 | 100.0% |
Daviess County Summary
Daviess County, Indiana is located in the southwestern corner of the state, and is part of the Wabash Valley region. It is bordered by Knox County to the north, Greene County to the east, Martin County to the south, and Pike County to the west. The county seat is Washington, and the county is named for Major Joseph Hamilton Daveiss, a Kentucky lawyer and soldier who was killed in the Battle of Tippecanoe in 1811.
Geography
Daviess County covers an area of 437 square miles, and is mostly flat, with some rolling hills in the northern part of the county. The terrain is mostly covered in farmland, with some wooded areas in the northern part of the county. The White River flows through the county, and there are several small lakes and ponds scattered throughout the county. The climate is humid continental, with hot, humid summers and cold, snowy winters.
Demographics
As of the 2010 census, Daviess County had a population of 32,648. The racial makeup of the county was 95.3% White, 1.2% African American, 0.3% Native American, 0.5% Asian, 0.1% Pacific Islander, 1.7% from other races, and 1.1% from two or more races. Hispanic or Latino of any race were 3.3% of the population.
The median household income in the county was $45,845, and the median family income was $54,845. The per capita income was $21,845. About 8.7% of families and 11.3% of the population were below the poverty line, including 15.2% of those under age 18 and 8.2% of those age 65 or over.
Economy
Agriculture is the main economic driver in Daviess County. The county is home to several large farms, and the main crops grown in the county are corn, soybeans, and wheat. Livestock production is also important, with cattle, hogs, and poultry being the main animals raised.
Manufacturing is also an important part of the economy, with several large factories located in the county. The largest employers in the county are the Daviess County Hospital, the Daviess County Public Schools, and the Daviess County Sheriff's Office.
The county also has a thriving tourism industry, with several popular attractions, including the Daviess County Historical Society Museum, the Daviess County Courthouse, and the Daviess County Fairgrounds.
History
Daviess County was formed in 1817 from parts of Knox and Martin Counties. The county was named for Major Joseph Hamilton Daveiss, a Kentucky lawyer and soldier who was killed in the Battle of Tippecanoe in 1811.
The first settlers in the county were mostly from Kentucky and Virginia, and the county was largely agricultural. The first county seat was located in Washington, and the county courthouse was built in 1820.
The county was largely rural until the late 19th century, when the railroad was built through the county. This led to an influx of new settlers, and the county's population began to grow rapidly.
In the early 20th century, the county was hit hard by the Great Depression, and many of the county's farms were abandoned. The county's economy began to recover in the 1950s, and the population began to grow again.
Today, Daviess County is a thriving agricultural and manufacturing center, and is home to a diverse population. The county is also a popular tourist destination, with several attractions, including the Daviess County Historical Society Museum, the Daviess County Courthouse, and the Daviess County Fairgrounds.
Common Questions
What is the Total Population of Daviess County?
Total Population of Daviess County is 33,337.
What is the Total Male Population of Daviess County?
Total Male Population of Daviess County is 16,621.
What is the Total Female Population of Daviess County?
Total Female Population of Daviess County is 16,716.
What is the Ratio of Males per 100 Females in Daviess County?
There are 99.43 Males per 100 Females in Daviess County.
What is the Ratio of Females per 100 Males in Daviess County?
There are 100.57 Females per 100 Males in Daviess County.
What is the Median Population Age in Daviess County?
Median Population Age in Daviess County is 34.9 Years.
What is the Average Family Size in Daviess County
Average Family Size in Daviess County is 3.4 People.
What is the Average Household Size in Daviess County
Average Household Size in Daviess County is 2.8 People.
What is Per Capita Income in Daviess County?
Per Capita income in Daviess County is $28,886.
What is the Median Family Income in Daviess County?
Median Family Income in Daviess County is $82,994.
What is the Median Household income in Daviess County?
Median Household Income in Daviess County is $64,113.
What is Income or Wage Gap in Daviess County?
Income or Wage Gap in Daviess County is 43.5%.
Women in Daviess County earn 56.5 cents for every dollar earned by a man.
What is Family Income Deficit in Daviess County?
Family Income Deficit in Daviess County is $10,422.
Families that are below poverty line in Daviess County earn $10,422 less on average than the poverty threshold level.
What is Inequality or Gini Index in Daviess County?
Inequality or Gini Index in Daviess County is 0.42.
How Large is the Labor Force in Daviess County?
There are 15,570 People in the Labor Forcein in Daviess County.
What is the Percentage of People in the Labor Force in Daviess County?
62.9% of People are in the Labor Force in Daviess County.
What is the Unemployment Rate in Daviess County?
Unemployment Rate in Daviess County is 1.9%.