Crawford County, IN
Crawford County Map
Crawford County Overview
10,511
TOTAL POPULATION
5,422
MALE POPULATION
5,089
FEMALE POPULATION
106.54
MALES / 100 FEMALES
93.86
FEMALES / 100 MALES
44.6
MEDIAN AGE
3.1
AVG FAMILY SIZE
2.4
AVG HOUSEHOLD SIZE
$29,114
PER CAPITA INCOME
$66,122
AVG FAMILY INCOME
$46,706
AVG HOUSEHOLD INCOME
30.2%
WAGE / INCOME GAP [ % ]
69.8¢/ $1
WAGE / INCOME GAP [ $ ]
$8,814
FAMILY INCOME DEFICIT
0.49
INEQUALITY / GINI INDEX
4,484
LABOR FORCE [ PEOPLE ]
53.3%
PERCENT IN LABOR FORCE
3.6%
UNEMPLOYMENT RATE
Crawford County Area Codes
Race in Crawford County
The most populous races in Crawford County are White / Caucasian (10,016 | 95.3%), Two or more Races (373 | 3.5%), and Black / African American (82 | 0.8%).

| Race | # Population | % Population |
| Asian | 9 | 0.1% |
| Black / African American | 82 | 0.8% |
| Hawaiian / Pacific | 0 | 0.0% |
| Hispanic or Latino | 79 | 0.7% |
| Native / Alaskan | 0 | 0.0% |
| White / Caucasian | 10,016 | 95.3% |
| Two or more Races | 373 | 3.5% |
| Some other Race | 31 | 0.3% |
| Total | 10,511 | 100.0% |
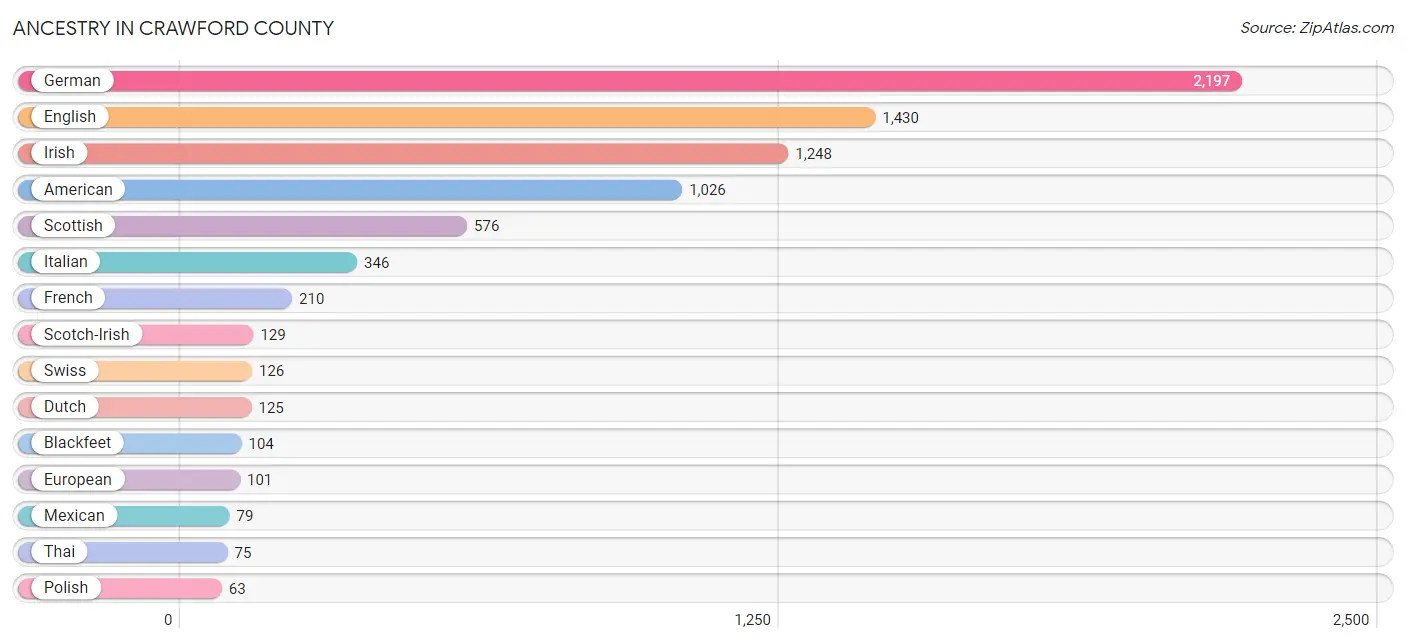
Ancestry in Crawford County
The most populous ancestries reported in Crawford County are German (2,197 | 20.9%), English (1,430 | 13.6%), Irish (1,248 | 11.9%), American (1,026 | 9.8%), and Scottish (576 | 5.5%), together accounting for 61.6% of all Crawford County residents.
| Ancestry | # Population | % Population |
| African | 8 | 0.1% |
| American | 1,026 | 9.8% |
| Arab | 5 | 0.1% |
| Blackfeet | 104 | 1.0% |
| Brazilian | 3 | 0.0% |
| British | 24 | 0.2% |
| Burmese | 50 | 0.5% |
| Canadian | 11 | 0.1% |
| Cherokee | 16 | 0.2% |
| Czech | 2 | 0.0% |
| Dutch | 125 | 1.2% |
| Eastern European | 10 | 0.1% |
| English | 1,430 | 13.6% |
| European | 101 | 1.0% |
| French | 210 | 2.0% |
| French Canadian | 10 | 0.1% |
| German | 2,197 | 20.9% |
| Greek | 5 | 0.1% |
| Hungarian | 24 | 0.2% |
| Irish | 1,248 | 11.9% |
| Italian | 346 | 3.3% |
| Korean | 7 | 0.1% |
| Lithuanian | 28 | 0.3% |
| Mexican | 79 | 0.7% |
| Norwegian | 7 | 0.1% |
| Pennsylvania German | 5 | 0.1% |
| Polish | 63 | 0.6% |
| Russian | 2 | 0.0% |
| Scandinavian | 20 | 0.2% |
| Scotch-Irish | 129 | 1.2% |
| Scottish | 576 | 5.5% |
| Slovene | 20 | 0.2% |
| Subsaharan African | 8 | 0.1% |
| Swedish | 30 | 0.3% |
| Swiss | 126 | 1.2% |
| Thai | 75 | 0.7% |
| Welsh | 12 | 0.1% | View All 37 Rows |
Immigrants in Crawford County
The most numerous immigrant groups reported in Crawford County came from Asia (59 | 0.6%), Eastern Asia (50 | 0.5%), Korea (50 | 0.5%), Latin America (11 | 0.1%), and Europe (10 | 0.1%), together accounting for 1.7% of all Crawford County residents.

| Immigration Origin | # Population | % Population |
| Asia | 59 | 0.6% |
| Brazil | 3 | 0.0% |
| Central America | 8 | 0.1% |
| Eastern Asia | 50 | 0.5% |
| Europe | 10 | 0.1% |
| Germany | 8 | 0.1% |
| India | 9 | 0.1% |
| Korea | 50 | 0.5% |
| Latin America | 11 | 0.1% |
| Mexico | 8 | 0.1% |
| Northern Europe | 2 | 0.0% |
| South America | 3 | 0.0% |
| South Central Asia | 9 | 0.1% |
| Western Europe | 8 | 0.1% | View All 14 Rows |
Sex and Age in Crawford County
Sex and Age in Crawford County
The most populous age groups in Crawford County are 55 to 59 Years (491 | 9.1%) for men and 60 to 64 Years (471 | 9.3%) for women.

| Age Bracket | Male | Female |
| Under 5 Years | 292 (5.4%) | 267 (5.2%) |
| 5 to 9 Years | 314 (5.8%) | 249 (4.9%) |
| 10 to 14 Years | 339 (6.2%) | 390 (7.7%) |
| 15 to 19 Years | 325 (6.0%) | 298 (5.9%) |
| 20 to 24 Years | 276 (5.1%) | 254 (5.0%) |
| 25 to 29 Years | 268 (4.9%) | 294 (5.8%) |
| 30 to 34 Years | 262 (4.8%) | 243 (4.8%) |
| 35 to 39 Years | 327 (6.0%) | 393 (7.7%) |
| 40 to 44 Years | 325 (6.0%) | 171 (3.4%) |
| 45 to 49 Years | 346 (6.4%) | 361 (7.1%) |
| 50 to 54 Years | 401 (7.4%) | 331 (6.5%) |
| 55 to 59 Years | 491 (9.1%) | 322 (6.3%) |
| 60 to 64 Years | 396 (7.3%) | 471 (9.3%) |
| 65 to 69 Years | 400 (7.4%) | 348 (6.8%) |
| 70 to 74 Years | 311 (5.7%) | 276 (5.4%) |
| 75 to 79 Years | 228 (4.2%) | 219 (4.3%) |
| 80 to 84 Years | 51 (0.9%) | 119 (2.3%) |
| 85 Years and over | 70 (1.3%) | 83 (1.6%) |
| Total | 5,422 (100.0%) | 5,089 (100.0%) |
Families and Households in Crawford County
Median Family Size in Crawford County
The median family size in Crawford County is 3.09 persons per family, with married-couple families (2,161 | 81.2%) accounting for the largest median family size of 3.18 persons per family. On the other hand, single female/mother families (381 | 14.3%) represent the smallest median family size with 2.58 persons per family.

| Family Type | # Families | Family Size |
| Married-Couple | 2,161 (81.2%) | 3.18 |
| Single Male/Father | 119 (4.5%) | 3.13 |
| Single Female/Mother | 381 (14.3%) | 2.58 |
| Total Families | 2,661 (100.0%) | 3.09 |
Median Household Size in Crawford County
The median household size in Crawford County is 2.40 persons per household, with single male/father households (119 | 2.7%) accounting for the largest median household size of 3.61 persons per household. non-family households (1,675 | 38.6%) represent the smallest median household size with 1.14 persons per household.

| Household Type | # Households | Household Size |
| Married-Couple | 2,161 (49.8%) | 3.21 |
| Single Male/Father | 119 (2.7%) | 3.61 |
| Single Female/Mother | 381 (8.8%) | 2.91 |
| Non-family | 1,675 (38.6%) | 1.14 |
| Total Households | 4,336 (100.0%) | 2.40 |
Household Size by Marriage Status in Crawford County
Out of a total of 4,336 households in Crawford County, 2,661 (61.4%) are family households, while 1,675 (38.6%) are nonfamily households. The most numerous type of family households are 2-person households, comprising 1,574, and the most common type of nonfamily households are 1-person households, comprising 1,409.

| Household Size | Family Households | Nonfamily Households |
| 1-Person Households | - | 1,409 (32.5%) |
| 2-Person Households | 1,574 (36.3%) | 258 (5.9%) |
| 3-Person Households | 489 (11.3%) | 2 (0.1%) |
| 4-Person Households | 342 (7.9%) | 6 (0.1%) |
| 5-Person Households | 148 (3.4%) | 0 (0.0%) |
| 6-Person Households | 74 (1.7%) | 0 (0.0%) |
| 7+ Person Households | 34 (0.8%) | 0 (0.0%) |
| Total | 2,661 (61.4%) | 1,675 (38.6%) |
Female Fertility in Crawford County
Fertility by Age in Crawford County
Average fertility rate in Crawford County is 56.0 births per 1,000 women. Women in the age bracket of 20 to 34 years have the highest fertility rate with 128.0 births per 1,000 women. Women in the age bracket of 20 to 34 years acount for 87.1% of all women with births.

| Age Bracket | Women with Births | Births / 1,000 Women |
| 15 to 19 years | 0 (0.0%) | 0.0 |
| 20 to 34 years | 101 (87.1%) | 128.0 |
| 35 to 50 years | 15 (12.9%) | 15.0 |
| Total | 116 (100.0%) | 56.0 |
Fertility by Age by Marriage Status in Crawford County
61.2% of women with births (116) in Crawford County are married. The highest percentage of unmarried women with births falls into 35 to 50 years age bracket with 66.7% of them unmarried at the time of birth, while the lowest percentage of unmarried women with births belong to 20 to 34 years age bracket with 34.7% of them unmarried.

| Age Bracket | Married | Unmarried |
| 15 to 19 years | 0 (0.0%) | 0 (0.0%) |
| 20 to 34 years | 66 (65.3%) | 35 (34.6%) |
| 35 to 50 years | 5 (33.3%) | 10 (66.7%) |
| Total | 71 (61.2%) | 45 (38.8%) |
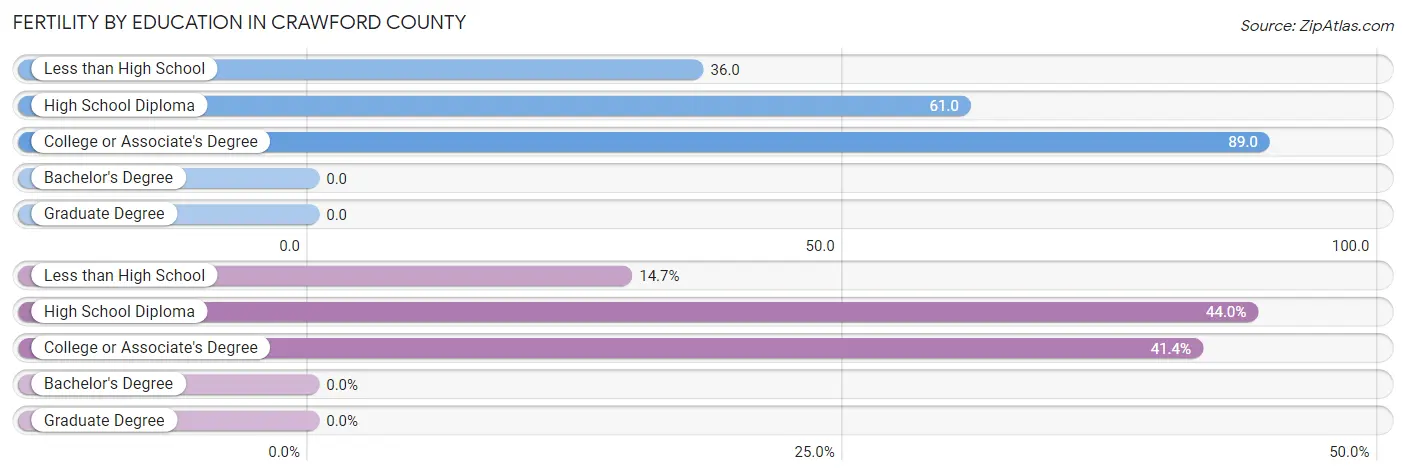
Fertility by Education in Crawford County
| Educational Attainment | Women with Births | Births / 1,000 Women |
| Less than High School | 17 (14.7%) | 36.0 |
| High School Diploma | 51 (44.0%) | 61.0 |
| College or Associate's Degree | 48 (41.4%) | 89.0 |
| Bachelor's Degree | 0 (0.0%) | 0.0 |
| Graduate Degree | 0 (0.0%) | 0.0 |
| Total | 116 (100.0%) | 56.0 |
Fertility by Education by Marriage Status in Crawford County
38.8% of women with births in Crawford County are unmarried. Women with the educational attainment of college or associate's degree are most likely to be married with 83.3% of them married at childbirth, while women with the educational attainment of less than high school are least likely to be married with 58.8% of them unmarried at childbirth.

| Educational Attainment | Married | Unmarried |
| Less than High School | 7 (41.2%) | 10 (58.8%) |
| High School Diploma | 24 (47.1%) | 27 (52.9%) |
| College or Associate's Degree | 40 (83.3%) | 8 (16.7%) |
| Bachelor's Degree | 0 (0.0%) | 0 (0.0%) |
| Graduate Degree | 0 (0.0%) | 0 (0.0%) |
| Total | 71 (61.2%) | 45 (38.8%) |
Income in Crawford County
Income Overview in Crawford County
Per Capita Income in Crawford County is $29,114, while median incomes of families and households are $66,122 and $46,706 respectively.
| Characteristic | Number | Measure |
| Per Capita Income | 10,511 | $29,114 |
| Median Family Income | 2,661 | $66,122 |
| Mean Family Income | 2,661 | $85,301 |
| Median Household Income | 4,336 | $46,706 |
| Mean Household Income | 4,336 | $67,626 |
| Income Deficit | 2,661 | $8,814 |
| Wage / Income Gap (%) | 10,511 | 30.23% |
| Wage / Income Gap ($) | 10,511 | 69.77¢ per $1 |
| Gini / Inequality Index | 10,511 | 0.49 |
Earnings by Sex in Crawford County
Average Earnings in Crawford County are $36,427, $44,449 for men and $31,013 for women, a difference of 30.2%.

| Sex | Number | Average Earnings |
| Male | 2,612 (55.3%) | $44,449 |
| Female | 2,109 (44.7%) | $31,013 |
| Total | 4,721 (100.0%) | $36,427 |
Earnings by Sex by Income Bracket in Crawford County
The most common earnings brackets in Crawford County are $30,000 to $34,999 for men (238 | 9.1%) and $25,000 to $29,999 for women (234 | 11.1%).

| Income | Male | Female |
| $2,499 or less | 126 (4.8%) | 151 (7.2%) |
| $2,500 to $4,999 | 45 (1.7%) | 48 (2.3%) |
| $5,000 to $7,499 | 38 (1.5%) | 71 (3.4%) |
| $7,500 to $9,999 | 110 (4.2%) | 44 (2.1%) |
| $10,000 to $12,499 | 115 (4.4%) | 105 (5.0%) |
| $12,500 to $14,999 | 56 (2.1%) | 49 (2.3%) |
| $15,000 to $17,499 | 45 (1.7%) | 45 (2.1%) |
| $17,500 to $19,999 | 37 (1.4%) | 66 (3.1%) |
| $20,000 to $22,499 | 12 (0.5%) | 151 (7.2%) |
| $22,500 to $24,999 | 94 (3.6%) | 35 (1.7%) |
| $25,000 to $29,999 | 134 (5.1%) | 234 (11.1%) |
| $30,000 to $34,999 | 238 (9.1%) | 223 (10.6%) |
| $35,000 to $39,999 | 77 (2.9%) | 141 (6.7%) |
| $40,000 to $44,999 | 209 (8.0%) | 193 (9.1%) |
| $45,000 to $49,999 | 185 (7.1%) | 116 (5.5%) |
| $50,000 to $54,999 | 195 (7.5%) | 155 (7.3%) |
| $55,000 to $64,999 | 226 (8.6%) | 78 (3.7%) |
| $65,000 to $74,999 | 230 (8.8%) | 38 (1.8%) |
| $75,000 to $99,999 | 229 (8.8%) | 57 (2.7%) |
| $100,000+ | 211 (8.1%) | 109 (5.2%) |
| Total | 2,612 (100.0%) | 2,109 (100.0%) |
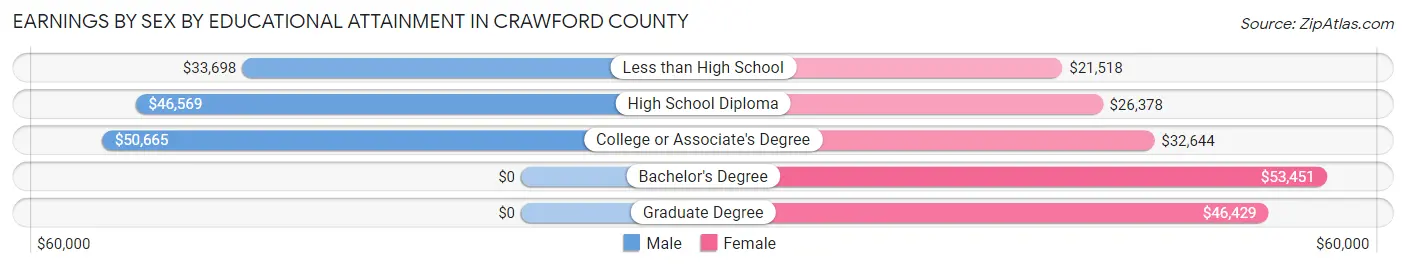
Earnings by Sex by Educational Attainment in Crawford County
Average earnings in Crawford County are $46,430 for men and $31,850 for women, a difference of 31.4%. Men with an educational attainment of college or associate's degree enjoy the highest average annual earnings of $50,665, while those with less than high school education earn the least with $33,698. Women with an educational attainment of bachelor's degree earn the most with the average annual earnings of $53,451, while those with less than high school education have the smallest earnings of $21,518.
| Educational Attainment | Male Income | Female Income |
| Less than High School | $33,698 | $21,518 |
| High School Diploma | $46,569 | $26,378 |
| College or Associate's Degree | $50,665 | $32,644 |
| Bachelor's Degree | - | - |
| Graduate Degree | - | - |
| Total | $46,430 | $31,850 |
Family Income in Crawford County
Family Income Brackets in Crawford County
According to the Crawford County family income data, there are 543 families falling into the $50,000 to $74,999 income range, which is the most common income bracket and makes up 20.4% of all families. Conversely, the $10,000 to $14,999 income bracket is the least frequent group with only 109 families (4.1%) belonging to this category.
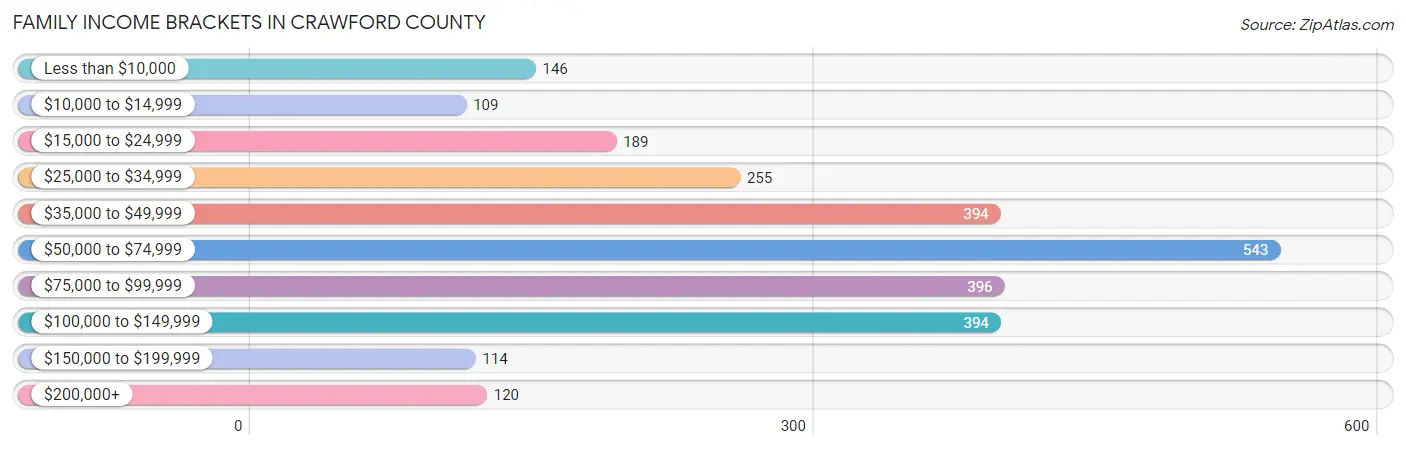
| Income Bracket | # Families | % Families |
| Less than $10,000 | 146 | 5.5% |
| $10,000 to $14,999 | 109 | 4.1% |
| $15,000 to $24,999 | 189 | 7.1% |
| $25,000 to $34,999 | 255 | 9.6% |
| $35,000 to $49,999 | 394 | 14.8% |
| $50,000 to $74,999 | 543 | 20.4% |
| $75,000 to $99,999 | 396 | 14.9% |
| $100,000 to $149,999 | 394 | 14.8% |
| $150,000 to $199,999 | 114 | 4.3% |
| $200,000+ | 120 | 4.5% |
Family Income by Famaliy Size in Crawford County
3-person families (396 | 14.9%) account for the highest median family income in Crawford County with $91,023 per family, while 3-person families (396 | 14.9%) have the highest median income of $30,341 per family member.
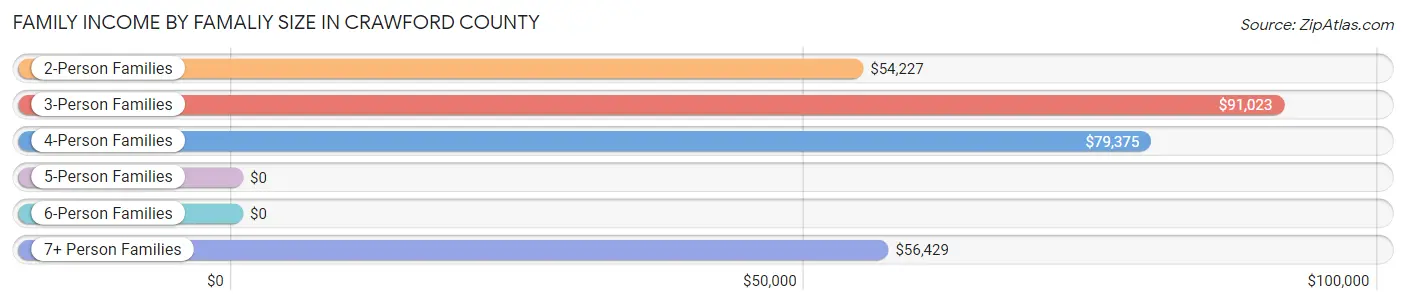
| Income Bracket | # Families | Median Income |
| 2-Person Families | 1,712 (64.3%) | $54,227 |
| 3-Person Families | 396 (14.9%) | $91,023 |
| 4-Person Families | 305 (11.5%) | $79,375 |
| 5-Person Families | 161 (6.0%) | $0 |
| 6-Person Families | 53 (2.0%) | $0 |
| 7+ Person Families | 34 (1.3%) | $56,429 |
| Total | 2,661 (100.0%) | $66,122 |
Family Income by Number of Earners in Crawford County
The median family income in Crawford County is $66,122, with families comprising 3+ earners (117) having the highest median family income of $140,536, while families with no earners (666) have the lowest median family income of $38,333, accounting for 4.4% and 25.0% of families, respectively.

| Number of Earners | # Families | Median Income |
| No Earners | 666 (25.0%) | $38,333 |
| 1 Earner | 902 (33.9%) | $45,556 |
| 2 Earners | 976 (36.7%) | $95,200 |
| 3+ Earners | 117 (4.4%) | $140,536 |
| Total | 2,661 (100.0%) | $66,122 |
Household Income in Crawford County
Household Income Brackets in Crawford County
With 824 households falling in the category, the $50,000 to $74,999 income range is the most frequent in Crawford County, accounting for 19.0% of all households. In contrast, only 117 households (2.7%) fall into the $200,000+ income bracket, making it the least populous group.
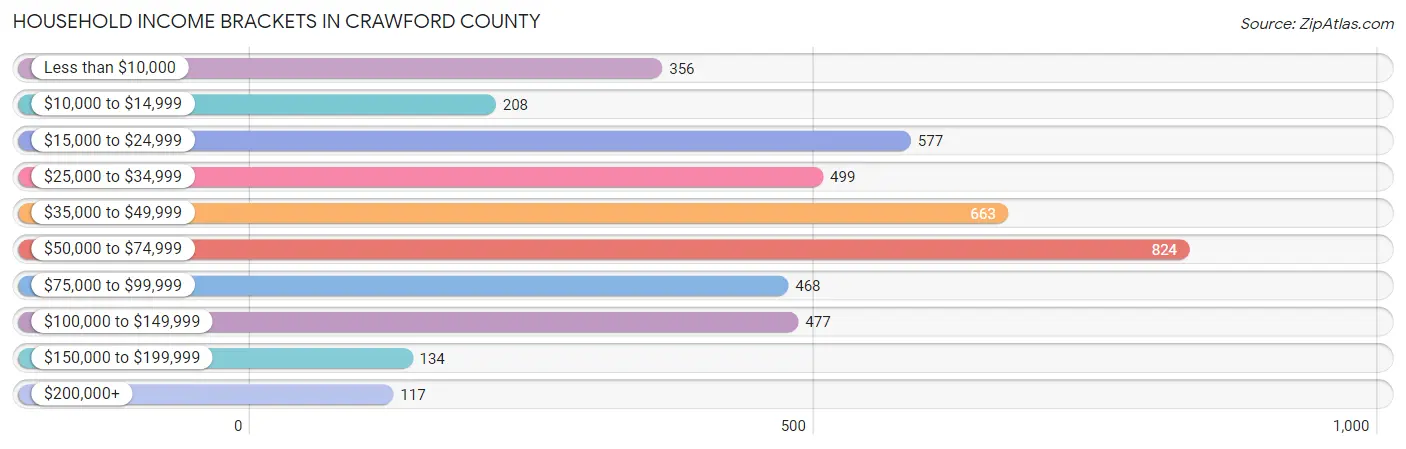
| Income Bracket | # Households | % Households |
| Less than $10,000 | 356 | 8.2% |
| $10,000 to $14,999 | 208 | 4.8% |
| $15,000 to $24,999 | 577 | 13.3% |
| $25,000 to $34,999 | 499 | 11.5% |
| $35,000 to $49,999 | 663 | 15.3% |
| $50,000 to $74,999 | 824 | 19.0% |
| $75,000 to $99,999 | 468 | 10.8% |
| $100,000 to $149,999 | 477 | 11.0% |
| $150,000 to $199,999 | 134 | 3.1% |
| $200,000+ | 117 | 2.7% |
Household Income by Householder Age in Crawford County
The median household income in Crawford County is $46,706, with the highest median household income of $72,500 found in the 25 to 44 years age bracket for the primary householder. A total of 970 households (22.4%) fall into this category. Meanwhile, the 65+ years age bracket for the primary householder has the lowest median household income of $43,605, with 1,336 households (30.8%) in this group.
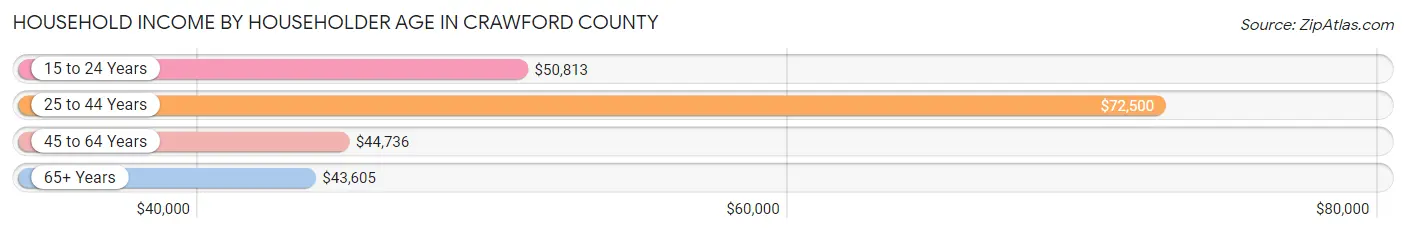
| Income Bracket | # Households | Median Income |
| 15 to 24 Years | 127 (2.9%) | $50,813 |
| 25 to 44 Years | 970 (22.4%) | $72,500 |
| 45 to 64 Years | 1,903 (43.9%) | $44,736 |
| 65+ Years | 1,336 (30.8%) | $43,605 |
| Total | 4,336 (100.0%) | $46,706 |
Poverty in Crawford County
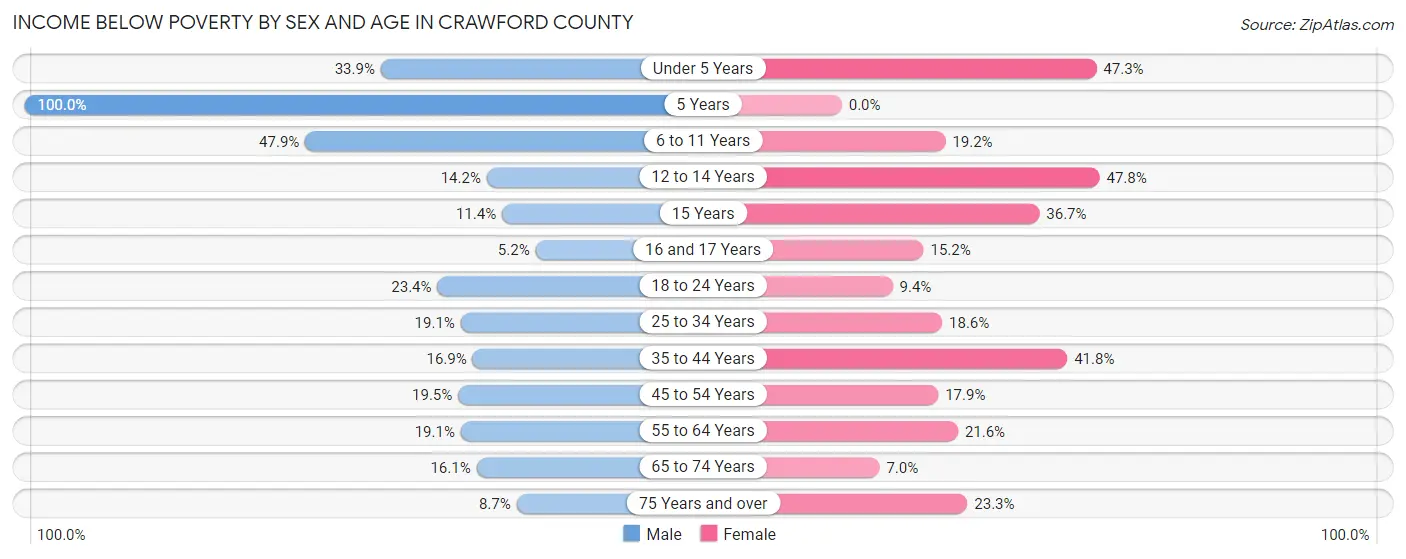
Income Below Poverty by Sex and Age in Crawford County
With 20.8% poverty level for males and 23.1% for females among the residents of Crawford County, 5 year old males and 12 to 14 year old females are the most vulnerable to poverty, with 10 males (100.0%) and 133 females (47.8%) in their respective age groups living below the poverty level.
| Age Bracket | Male | Female |
| Under 5 Years | 99 (33.9%) | 112 (47.3%) |
| 5 Years | 10 (100.0%) | 0 (0.0%) |
| 6 to 11 Years | 207 (47.9%) | 66 (19.2%) |
| 12 to 14 Years | 29 (14.2%) | 133 (47.8%) |
| 15 Years | 18 (11.4%) | 33 (36.7%) |
| 16 and 17 Years | 3 (5.2%) | 17 (15.2%) |
| 18 to 24 Years | 90 (23.4%) | 33 (9.4%) |
| 25 to 34 Years | 101 (19.1%) | 100 (18.6%) |
| 35 to 44 Years | 109 (16.9%) | 236 (41.8%) |
| 45 to 54 Years | 146 (19.5%) | 123 (17.9%) |
| 55 to 64 Years | 169 (19.1%) | 171 (21.6%) |
| 65 to 74 Years | 113 (16.1%) | 43 (7.0%) |
| 75 Years and over | 29 (8.7%) | 93 (23.3%) |
| Total | 1,123 (20.8%) | 1,160 (23.1%) |
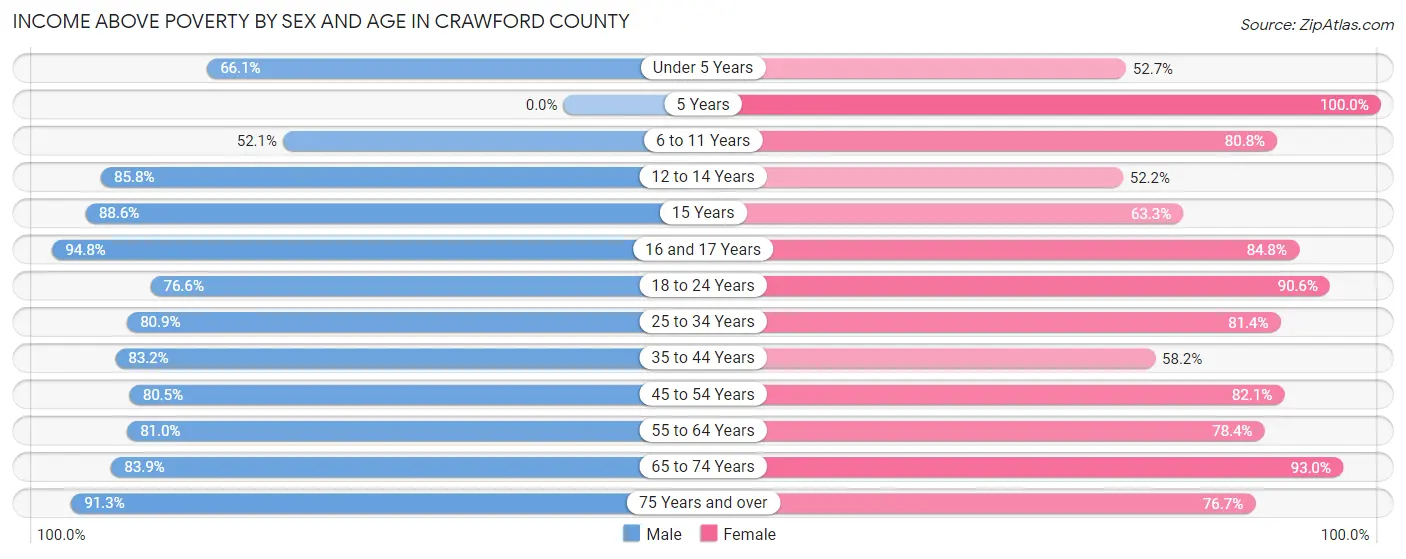
Income Above Poverty by Sex and Age in Crawford County
According to the poverty statistics in Crawford County, males aged 16 and 17 years and females aged 5 years are the age groups that are most secure financially, with 94.8% of males and 100.0% of females in these age groups living above the poverty line.
| Age Bracket | Male | Female |
| Under 5 Years | 193 (66.1%) | 125 (52.7%) |
| 5 Years | 0 (0.0%) | 14 (100.0%) |
| 6 to 11 Years | 225 (52.1%) | 277 (80.8%) |
| 12 to 14 Years | 175 (85.8%) | 145 (52.2%) |
| 15 Years | 140 (88.6%) | 57 (63.3%) |
| 16 and 17 Years | 55 (94.8%) | 95 (84.8%) |
| 18 to 24 Years | 295 (76.6%) | 317 (90.6%) |
| 25 to 34 Years | 429 (80.9%) | 437 (81.4%) |
| 35 to 44 Years | 538 (83.2%) | 328 (58.2%) |
| 45 to 54 Years | 601 (80.5%) | 564 (82.1%) |
| 55 to 64 Years | 718 (80.9%) | 622 (78.4%) |
| 65 to 74 Years | 588 (83.9%) | 571 (93.0%) |
| 75 Years and over | 305 (91.3%) | 306 (76.7%) |
| Total | 4,262 (79.1%) | 3,858 (76.9%) |
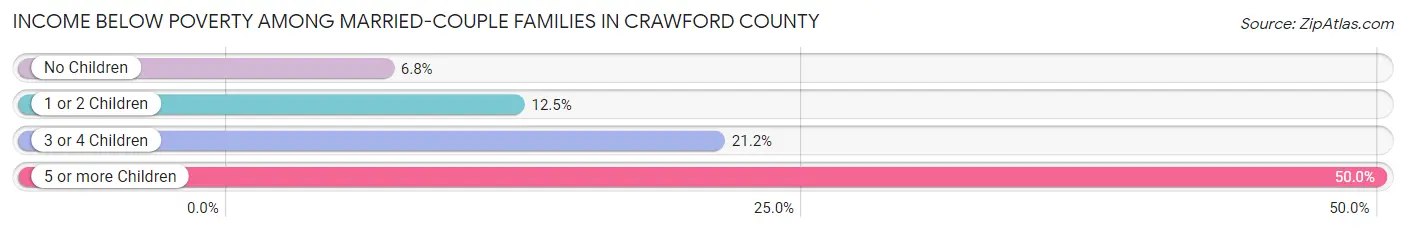
Income Below Poverty Among Married-Couple Families in Crawford County
The poverty statistics for married-couple families in Crawford County show that 9.5% or 206 of the total 2,161 families live below the poverty line. Families with 5 or more children have the highest poverty rate of 50.0%, comprising of 14 families. On the other hand, families with no children have the lowest poverty rate of 6.8%, which includes 104 families.
| Children | Above Poverty | Below Poverty |
| No Children | 1,429 (93.2%) | 104 (6.8%) |
| 1 or 2 Children | 393 (87.5%) | 56 (12.5%) |
| 3 or 4 Children | 119 (78.8%) | 32 (21.2%) |
| 5 or more Children | 14 (50.0%) | 14 (50.0%) |
| Total | 1,955 (90.5%) | 206 (9.5%) |
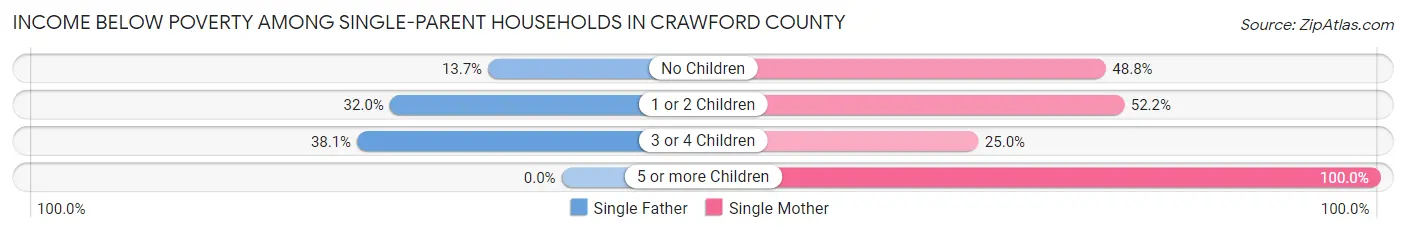
Income Below Poverty Among Single-Parent Households in Crawford County
According to the poverty data in Crawford County, 21.8% or 26 single-father households and 49.3% or 188 single-mother households are living below the poverty line. Among single-father households, those with 3 or 4 children have the highest poverty rate, with 8 households (38.1%) experiencing poverty. Likewise, among single-mother households, those with 5 or more children have the highest poverty rate, with 2 households (100.0%) falling below the poverty line.
| Children | Single Father | Single Mother |
| No Children | 10 (13.7%) | 136 (48.7%) |
| 1 or 2 Children | 8 (32.0%) | 48 (52.2%) |
| 3 or 4 Children | 8 (38.1%) | 2 (25.0%) |
| 5 or more Children | 0 (0.0%) | 2 (100.0%) |
| Total | 26 (21.8%) | 188 (49.3%) |
Income Below Poverty Among Married-Couple vs Single-Parent Households in Crawford County
The poverty data for Crawford County shows that 206 of the married-couple family households (9.5%) and 214 of the single-parent households (42.8%) are living below the poverty level. Within the married-couple family households, those with 5 or more children have the highest poverty rate, with 14 households (50.0%) falling below the poverty line. Among the single-parent households, those with 5 or more children have the highest poverty rate, with 2 household (100.0%) living below poverty.
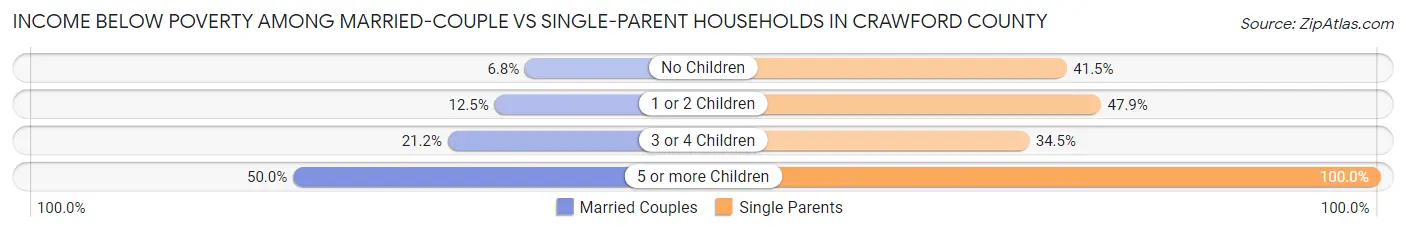
| Children | Married-Couple Families | Single-Parent Households |
| No Children | 104 (6.8%) | 146 (41.5%) |
| 1 or 2 Children | 56 (12.5%) | 56 (47.9%) |
| 3 or 4 Children | 32 (21.2%) | 10 (34.5%) |
| 5 or more Children | 14 (50.0%) | 2 (100.0%) |
| Total | 206 (9.5%) | 214 (42.8%) |
Employment Characteristics in Crawford County
Employment by Class of Employer in Crawford County
Among the 4,279 employed individuals in Crawford County, private company employees (3,061 | 71.5%), local government employees (417 | 9.8%), and self-employed (not incorporated) (240 | 5.6%) make up the most common classes of employment.

| Employer Class | # Employees | % Employees |
| Private Company Employees | 3,061 | 71.5% |
| Self-Employed (Incorporated) | 168 | 3.9% |
| Self-Employed (Not Incorporated) | 240 | 5.6% |
| Not-for-profit Organizations | 210 | 4.9% |
| Local Government Employees | 417 | 9.8% |
| State Government Employees | 169 | 4.0% |
| Federal Government Employees | 14 | 0.3% |
| Unpaid Family Workers | 0 | 0.0% |
| Total | 4,279 | 100.0% |
Employment Status by Age in Crawford County
According to the labor force statistics for Crawford County, out of the total population over 16 years of age (8,412), 53.3% or 4,484 individuals are in the labor force, with 3.6% or 161 of them unemployed. The age group with the highest labor force participation rate is 25 to 29 years, with 79.7% or 448 individuals in the labor force. Within the labor force, the 75 years and over age range has the highest percentage of unemployed individuals, with 20.0% or 13 of them being unemployed.
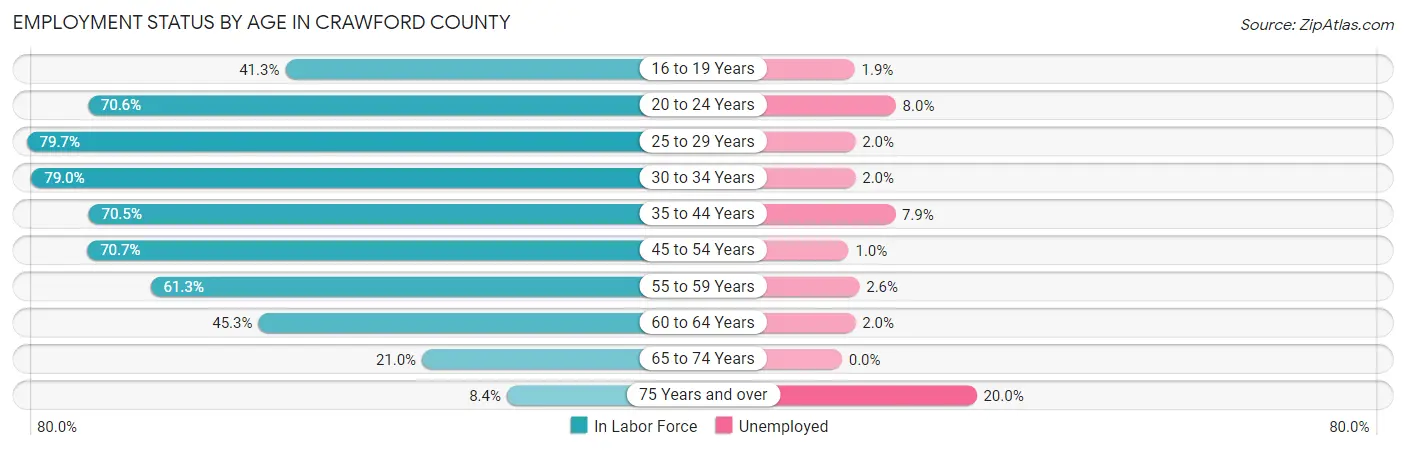
| Age Bracket | In Labor Force | Unemployed |
| 16 to 19 Years | 155 (41.3%) | 3 (1.9%) |
| 20 to 24 Years | 374 (70.6%) | 30 (8.0%) |
| 25 to 29 Years | 448 (79.7%) | 9 (2.0%) |
| 30 to 34 Years | 399 (79.0%) | 8 (2.0%) |
| 35 to 44 Years | 857 (70.5%) | 68 (7.9%) |
| 45 to 54 Years | 1,017 (70.7%) | 10 (1.0%) |
| 55 to 59 Years | 498 (61.3%) | 13 (2.6%) |
| 60 to 64 Years | 393 (45.3%) | 8 (2.0%) |
| 65 to 74 Years | 280 (21.0%) | 0 (0.0%) |
| 75 Years and over | 65 (8.4%) | 13 (20.0%) |
| Total | 4,484 (53.3%) | 161 (3.6%) |
Employment Status by Educational Attainment in Crawford County
According to labor force statistics for Crawford County, 66.9% of individuals (3,614) out of the total population between 25 and 64 years of age (5,402) are in the labor force, with 3.2% or 116 of them being unemployed. The group with the highest labor force participation rate are those with the educational attainment of bachelor's degree or higher, with 86.7% or 482 individuals in the labor force. Within the labor force, individuals with high school diploma education have the highest percentage of unemployment, with 5.9% or 97 of them being unemployed.

| Educational Attainment | In Labor Force | Unemployed |
| Less than High School | 293 (37.5%) | 0 (0.0%) |
| High School Diploma | 1,645 (64.4%) | 151 (5.9%) |
| College / Associate Degree | 1,191 (78.9%) | 24 (1.6%) |
| Bachelor's Degree or higher | 482 (86.7%) | 0 (0.0%) |
| Total | 3,614 (66.9%) | 173 (3.2%) |
Employment Occupations by Sex in Crawford County
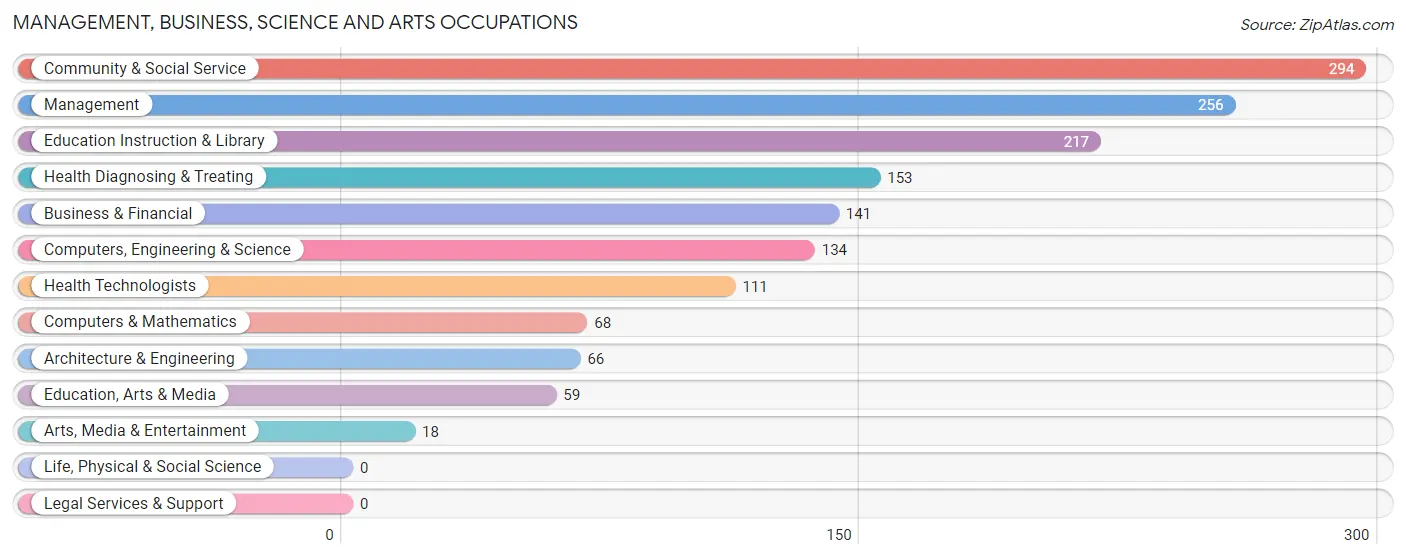
Management, Business, Science and Arts Occupations
The most common Management, Business, Science and Arts occupations in Crawford County are Community & Social Service (294 | 6.8%), Management (256 | 5.9%), Education Instruction & Library (217 | 5.0%), Health Diagnosing & Treating (153 | 3.5%), and Business & Financial (141 | 3.3%).
Management, Business, Science and Arts Occupations by Sex
Within the Management, Business, Science and Arts occupations in Crawford County, the most male-oriented occupations are Architecture & Engineering (100.0%), Arts, Media & Entertainment (100.0%), and Computers, Engineering & Science (82.8%), while the most female-oriented occupations are Health Technologists (100.0%), Health Diagnosing & Treating (93.5%), and Business & Financial (79.4%).

| Occupation | Male | Female |
| Management | 97 (37.9%) | 159 (62.1%) |
| Business & Financial | 29 (20.6%) | 112 (79.4%) |
| Computers, Engineering & Science | 111 (82.8%) | 23 (17.2%) |
| Computers & Mathematics | 45 (66.2%) | 23 (33.8%) |
| Architecture & Engineering | 66 (100.0%) | 0 (0.0%) |
| Life, Physical & Social Science | 0 (0.0%) | 0 (0.0%) |
| Community & Social Service | 117 (39.8%) | 177 (60.2%) |
| Education, Arts & Media | 39 (66.1%) | 20 (33.9%) |
| Legal Services & Support | 0 (0.0%) | 0 (0.0%) |
| Education Instruction & Library | 60 (27.7%) | 157 (72.4%) |
| Arts, Media & Entertainment | 18 (100.0%) | 0 (0.0%) |
| Health Diagnosing & Treating | 10 (6.5%) | 143 (93.5%) |
| Health Technologists | 0 (0.0%) | 111 (100.0%) |
| Total (Category) | 364 (37.2%) | 614 (62.8%) |
| Total (Overall) | 2,380 (55.0%) | 1,945 (45.0%) |
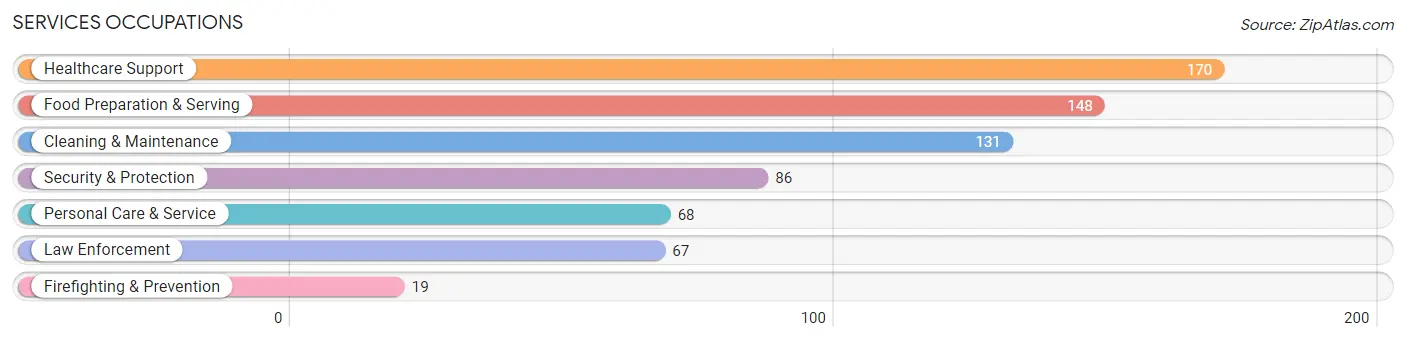
Services Occupations
The most common Services occupations in Crawford County are Healthcare Support (170 | 3.9%), Food Preparation & Serving (148 | 3.4%), Cleaning & Maintenance (131 | 3.0%), Security & Protection (86 | 2.0%), and Personal Care & Service (68 | 1.6%).
Services Occupations by Sex
Within the Services occupations in Crawford County, the most male-oriented occupations are Security & Protection (100.0%), Firefighting & Prevention (100.0%), and Law Enforcement (100.0%), while the most female-oriented occupations are Personal Care & Service (100.0%), Healthcare Support (90.6%), and Food Preparation & Serving (68.2%).

| Occupation | Male | Female |
| Healthcare Support | 16 (9.4%) | 154 (90.6%) |
| Security & Protection | 86 (100.0%) | 0 (0.0%) |
| Firefighting & Prevention | 19 (100.0%) | 0 (0.0%) |
| Law Enforcement | 67 (100.0%) | 0 (0.0%) |
| Food Preparation & Serving | 47 (31.8%) | 101 (68.2%) |
| Cleaning & Maintenance | 97 (74.1%) | 34 (26.0%) |
| Personal Care & Service | 0 (0.0%) | 68 (100.0%) |
| Total (Category) | 246 (40.8%) | 357 (59.2%) |
| Total (Overall) | 2,380 (55.0%) | 1,945 (45.0%) |
Sales and Office Occupations
The most common Sales and Office occupations in Crawford County are Sales & Related (370 | 8.6%), and Office & Administration (268 | 6.2%).

Sales and Office Occupations by Sex

| Occupation | Male | Female |
| Sales & Related | 109 (29.5%) | 261 (70.5%) |
| Office & Administration | 50 (18.7%) | 218 (81.3%) |
| Total (Category) | 159 (24.9%) | 479 (75.1%) |
| Total (Overall) | 2,380 (55.0%) | 1,945 (45.0%) |
Natural Resources, Construction and Maintenance Occupations
The most common Natural Resources, Construction and Maintenance occupations in Crawford County are Construction & Extraction (382 | 8.8%), Installation, Maintenance & Repair (171 | 4.0%), and Farming, Fishing & Forestry (4 | 0.1%).
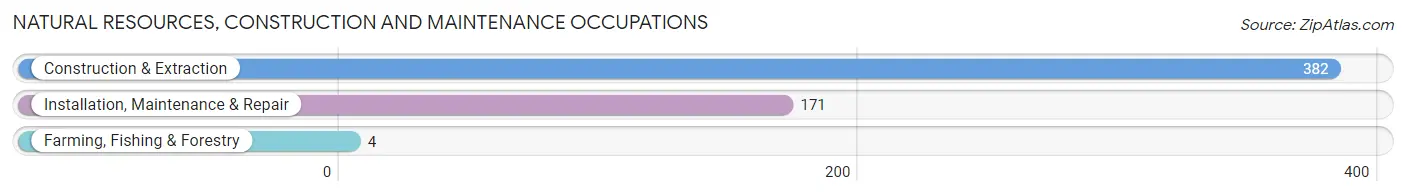
Natural Resources, Construction and Maintenance Occupations by Sex

| Occupation | Male | Female |
| Farming, Fishing & Forestry | 4 (100.0%) | 0 (0.0%) |
| Construction & Extraction | 379 (99.2%) | 3 (0.8%) |
| Installation, Maintenance & Repair | 171 (100.0%) | 0 (0.0%) |
| Total (Category) | 554 (99.5%) | 3 (0.5%) |
| Total (Overall) | 2,380 (55.0%) | 1,945 (45.0%) |
Production, Transportation and Moving Occupations
The most common Production, Transportation and Moving occupations in Crawford County are Production (658 | 15.2%), Transportation (447 | 10.3%), and Material Moving (444 | 10.3%).

Production, Transportation and Moving Occupations by Sex
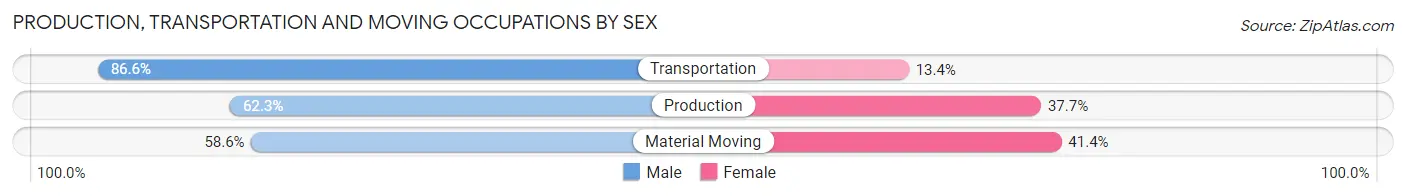
| Occupation | Male | Female |
| Production | 410 (62.3%) | 248 (37.7%) |
| Transportation | 387 (86.6%) | 60 (13.4%) |
| Material Moving | 260 (58.6%) | 184 (41.4%) |
| Total (Category) | 1,057 (68.2%) | 492 (31.8%) |
| Total (Overall) | 2,380 (55.0%) | 1,945 (45.0%) |
Employment Industries by Sex in Crawford County
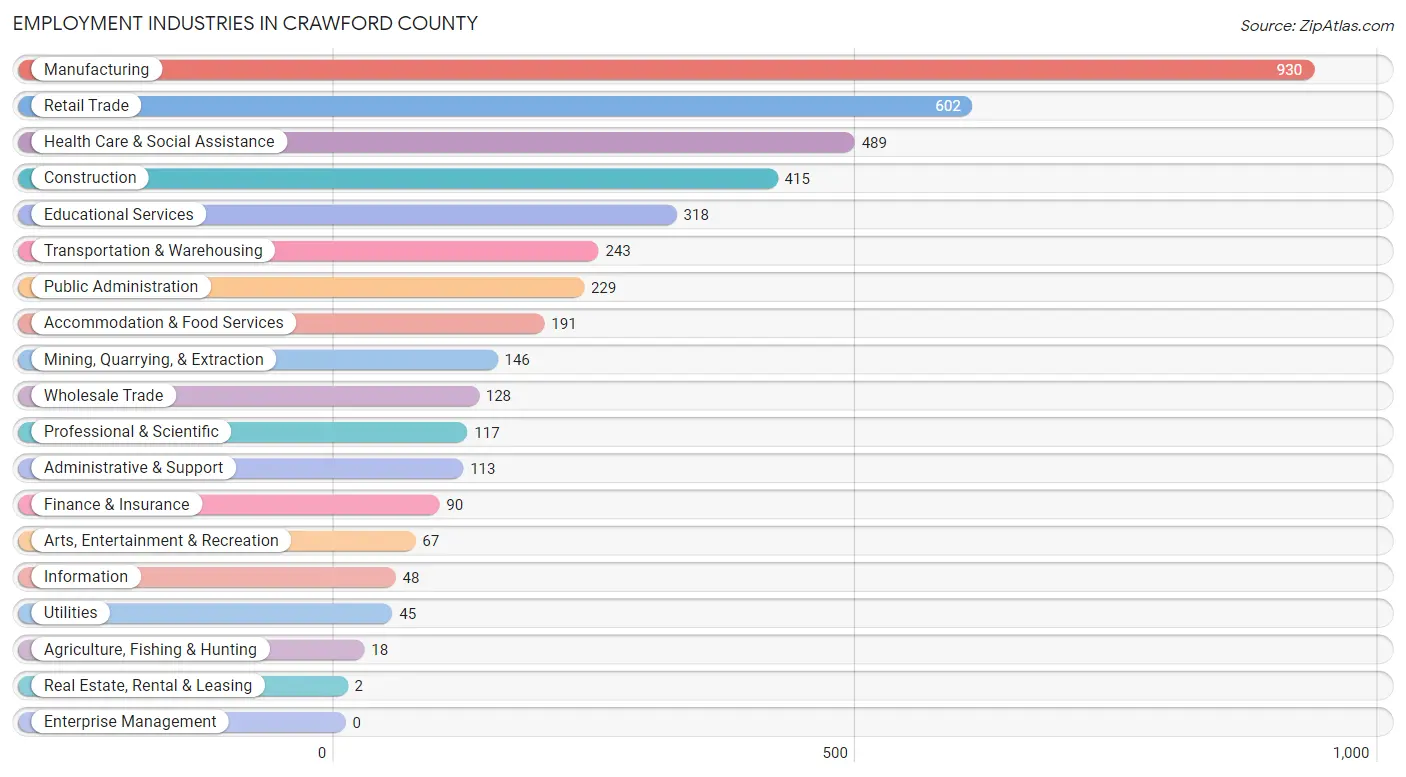
Employment Industries in Crawford County
The major employment industries in Crawford County include Manufacturing (930 | 21.5%), Retail Trade (602 | 13.9%), Health Care & Social Assistance (489 | 11.3%), Construction (415 | 9.6%), and Educational Services (318 | 7.3%).
Employment Industries by Sex in Crawford County
The Crawford County industries that see more men than women are Mining, Quarrying, & Extraction (100.0%), Wholesale Trade (100.0%), and Utilities (100.0%), whereas the industries that tend to have a higher number of women are Health Care & Social Assistance (90.2%), Finance & Insurance (90.0%), and Educational Services (72.0%).
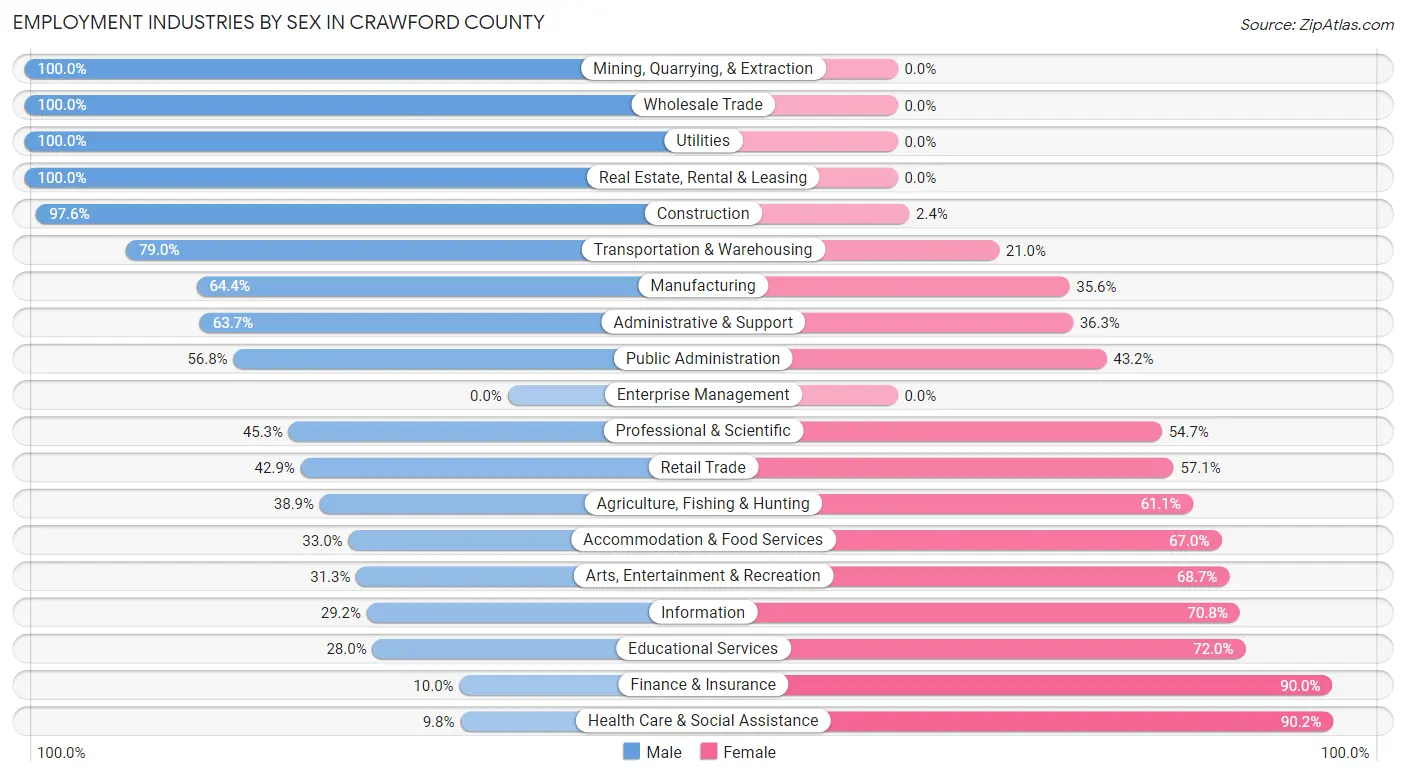
| Industry | Male | Female |
| Agriculture, Fishing & Hunting | 7 (38.9%) | 11 (61.1%) |
| Mining, Quarrying, & Extraction | 146 (100.0%) | 0 (0.0%) |
| Construction | 405 (97.6%) | 10 (2.4%) |
| Manufacturing | 599 (64.4%) | 331 (35.6%) |
| Wholesale Trade | 128 (100.0%) | 0 (0.0%) |
| Retail Trade | 258 (42.9%) | 344 (57.1%) |
| Transportation & Warehousing | 192 (79.0%) | 51 (21.0%) |
| Utilities | 45 (100.0%) | 0 (0.0%) |
| Information | 14 (29.2%) | 34 (70.8%) |
| Finance & Insurance | 9 (10.0%) | 81 (90.0%) |
| Real Estate, Rental & Leasing | 2 (100.0%) | 0 (0.0%) |
| Professional & Scientific | 53 (45.3%) | 64 (54.7%) |
| Enterprise Management | 0 (0.0%) | 0 (0.0%) |
| Administrative & Support | 72 (63.7%) | 41 (36.3%) |
| Educational Services | 89 (28.0%) | 229 (72.0%) |
| Health Care & Social Assistance | 48 (9.8%) | 441 (90.2%) |
| Arts, Entertainment & Recreation | 21 (31.3%) | 46 (68.7%) |
| Accommodation & Food Services | 63 (33.0%) | 128 (67.0%) |
| Public Administration | 130 (56.8%) | 99 (43.2%) |
| Total | 2,380 (55.0%) | 1,945 (45.0%) |
Education in Crawford County
School Enrollment in Crawford County
The most common levels of schooling among the 2,035 students in Crawford County are middle school (644 | 31.7%), elementary school (504 | 24.8%), and high school (500 | 24.6%).

| School Level | # Students | % Students |
| Nursery / Preschool | 64 | 3.1% |
| Kindergarten | 80 | 3.9% |
| Elementary School | 504 | 24.8% |
| Middle School | 644 | 31.7% |
| High School | 500 | 24.6% |
| College / Undergraduate | 217 | 10.7% |
| Graduate / Professional | 26 | 1.3% |
| Total | 2,035 | 100.0% |
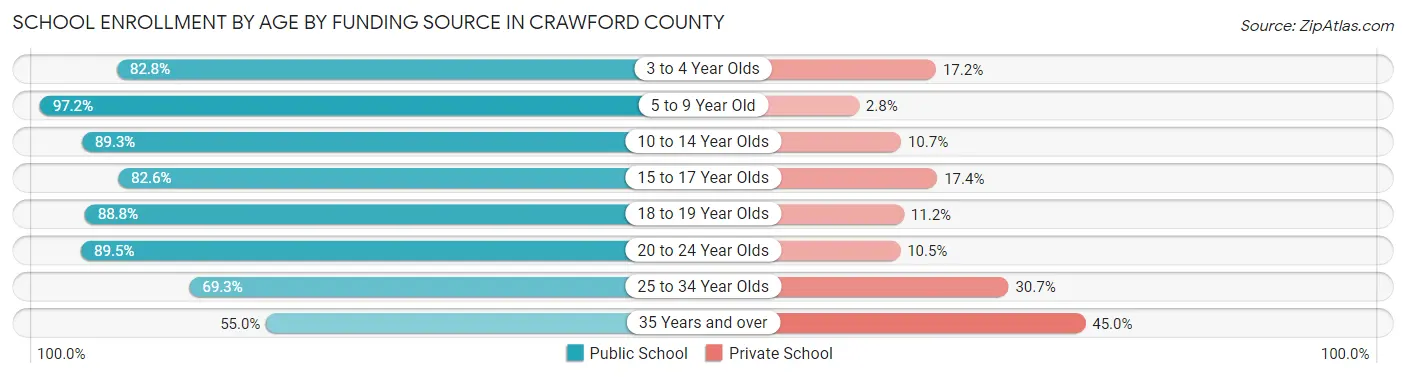
School Enrollment by Age by Funding Source in Crawford County
Out of a total of 2,035 students who are enrolled in schools in Crawford County, 238 (11.7%) attend a private institution, while the remaining 1,797 (88.3%) are enrolled in public schools. The age group of 35 years and over has the highest likelihood of being enrolled in private schools, with 9 (45.0% in the age bracket) enrolled. Conversely, the age group of 5 to 9 year old has the lowest likelihood of being enrolled in a private school, with 514 (97.2% in the age bracket) attending a public institution.
| Age Bracket | Public School | Private School |
| 3 to 4 Year Olds | 53 (82.8%) | 11 (17.2%) |
| 5 to 9 Year Old | 514 (97.2%) | 15 (2.8%) |
| 10 to 14 Year Olds | 644 (89.3%) | 77 (10.7%) |
| 15 to 17 Year Olds | 341 (82.6%) | 72 (17.4%) |
| 18 to 19 Year Olds | 87 (88.8%) | 11 (11.2%) |
| 20 to 24 Year Olds | 68 (89.5%) | 8 (10.5%) |
| 25 to 34 Year Olds | 79 (69.3%) | 35 (30.7%) |
| 35 Years and over | 11 (55.0%) | 9 (45.0%) |
| Total | 1,797 (88.3%) | 238 (11.7%) |
Educational Attainment by Field of Study in Crawford County
Education (287 | 29.7%), business (186 | 19.3%), science & technology (151 | 15.6%), liberal arts & history (76 | 7.9%), and arts & humanities (57 | 5.9%) are the most common fields of study among 966 individuals in Crawford County who have obtained a bachelor's degree or higher.

| Field of Study | # Graduates | % Graduates |
| Computers & Mathematics | 28 | 2.9% |
| Bio, Nature & Agricultural | 52 | 5.4% |
| Physical & Health Sciences | 17 | 1.8% |
| Psychology | 22 | 2.3% |
| Social Sciences | 28 | 2.9% |
| Engineering | 29 | 3.0% |
| Multidisciplinary Studies | 0 | 0.0% |
| Science & Technology | 151 | 15.6% |
| Business | 186 | 19.3% |
| Education | 287 | 29.7% |
| Literature & Languages | 0 | 0.0% |
| Liberal Arts & History | 76 | 7.9% |
| Visual & Performing Arts | 8 | 0.8% |
| Communications | 25 | 2.6% |
| Arts & Humanities | 57 | 5.9% |
| Total | 966 | 100.0% |
Transportation & Commute in Crawford County
Vehicle Availability by Sex in Crawford County
The most prevalent vehicle ownership categories in Crawford County are males with 2 vehicles (787, accounting for 33.7%) and females with 2 vehicles (654, making up 41.1%).

| Vehicles Available | Male | Female |
| No Vehicle | 90 (3.8%) | 38 (2.0%) |
| 1 Vehicle | 305 (13.0%) | 293 (15.3%) |
| 2 Vehicles | 787 (33.7%) | 654 (34.2%) |
| 3 Vehicles | 651 (27.8%) | 523 (27.3%) |
| 4 Vehicles | 215 (9.2%) | 182 (9.5%) |
| 5 or more Vehicles | 291 (12.4%) | 225 (11.7%) |
| Total | 2,339 (100.0%) | 1,915 (100.0%) |
Commute Time in Crawford County
The most frequently occuring commute durations in Crawford County are 30 to 34 minutes (877 commuters, 21.6%), 60 to 89 minutes (740 commuters, 18.2%), and 45 to 59 minutes (592 commuters, 14.6%).

| Commute Time | # Commuters | % Commuters |
| Less than 5 Minutes | 132 | 3.3% |
| 5 to 9 Minutes | 292 | 7.2% |
| 10 to 14 Minutes | 292 | 7.2% |
| 15 to 19 Minutes | 236 | 5.8% |
| 20 to 24 Minutes | 277 | 6.8% |
| 25 to 29 Minutes | 191 | 4.7% |
| 30 to 34 Minutes | 877 | 21.6% |
| 35 to 39 Minutes | 95 | 2.3% |
| 40 to 44 Minutes | 171 | 4.2% |
| 45 to 59 Minutes | 592 | 14.6% |
| 60 to 89 Minutes | 740 | 18.2% |
| 90 or more Minutes | 162 | 4.0% |
Commute Time by Sex in Crawford County
The most common commute times in Crawford County are 30 to 34 minutes (524 commuters, 23.3%) for males and 30 to 34 minutes (353 commuters, 19.6%) for females.

| Commute Time | Male | Female |
| Less than 5 Minutes | 101 (4.5%) | 31 (1.7%) |
| 5 to 9 Minutes | 136 (6.0%) | 156 (8.6%) |
| 10 to 14 Minutes | 112 (5.0%) | 180 (10.0%) |
| 15 to 19 Minutes | 123 (5.5%) | 113 (6.3%) |
| 20 to 24 Minutes | 136 (6.0%) | 141 (7.8%) |
| 25 to 29 Minutes | 116 (5.1%) | 75 (4.2%) |
| 30 to 34 Minutes | 524 (23.3%) | 353 (19.6%) |
| 35 to 39 Minutes | 50 (2.2%) | 45 (2.5%) |
| 40 to 44 Minutes | 53 (2.4%) | 118 (6.5%) |
| 45 to 59 Minutes | 296 (13.2%) | 296 (16.4%) |
| 60 to 89 Minutes | 497 (22.1%) | 243 (13.5%) |
| 90 or more Minutes | 107 (4.8%) | 55 (3.0%) |
Time of Departure to Work by Sex in Crawford County
The most frequent times of departure to work in Crawford County are 5:30 AM to 5:59 AM (357, 15.9%) for males and 6:00 AM to 6:29 AM (333, 18.4%) for females.

| Time of Departure | Male | Female |
| 12:00 AM to 4:59 AM | 332 (14.7%) | 136 (7.5%) |
| 5:00 AM to 5:29 AM | 189 (8.4%) | 33 (1.8%) |
| 5:30 AM to 5:59 AM | 357 (15.9%) | 157 (8.7%) |
| 6:00 AM to 6:29 AM | 291 (12.9%) | 333 (18.4%) |
| 6:30 AM to 6:59 AM | 213 (9.5%) | 125 (6.9%) |
| 7:00 AM to 7:29 AM | 117 (5.2%) | 193 (10.7%) |
| 7:30 AM to 7:59 AM | 134 (5.9%) | 228 (12.6%) |
| 8:00 AM to 8:29 AM | 137 (6.1%) | 140 (7.7%) |
| 8:30 AM to 8:59 AM | 37 (1.6%) | 49 (2.7%) |
| 9:00 AM to 9:59 AM | 45 (2.0%) | 149 (8.3%) |
| 10:00 AM to 10:59 AM | 11 (0.5%) | 10 (0.5%) |
| 11:00 AM to 11:59 AM | 8 (0.4%) | 7 (0.4%) |
| 12:00 PM to 3:59 PM | 172 (7.6%) | 109 (6.0%) |
| 4:00 PM to 11:59 PM | 208 (9.2%) | 137 (7.6%) |
| Total | 2,251 (100.0%) | 1,806 (100.0%) |
Housing Occupancy in Crawford County
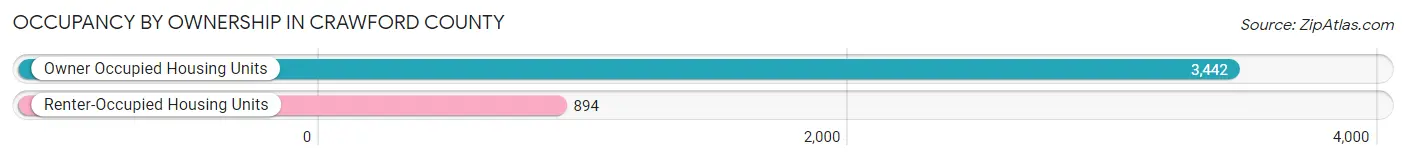
Occupancy by Ownership in Crawford County
Of the total 4,336 dwellings in Crawford County, owner-occupied units account for 3,442 (79.4%), while renter-occupied units make up 894 (20.6%).
| Occupancy | # Housing Units | % Housing Units |
| Owner Occupied Housing Units | 3,442 | 79.4% |
| Renter-Occupied Housing Units | 894 | 20.6% |
| Total Occupied Housing Units | 4,336 | 100.0% |
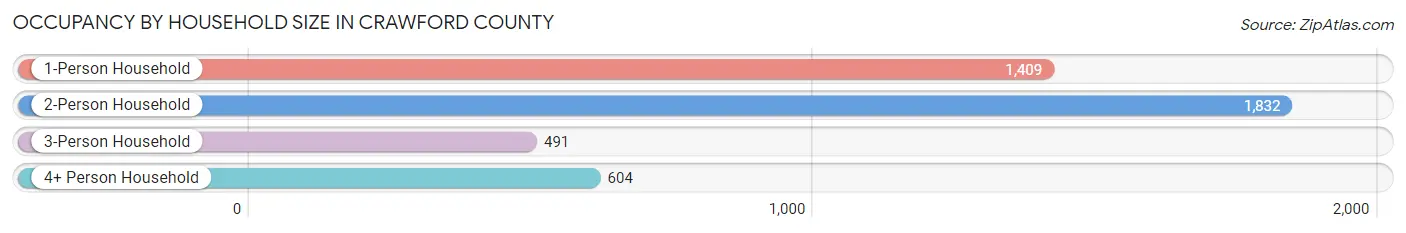
Occupancy by Household Size in Crawford County
| Household Size | # Housing Units | % Housing Units |
| 1-Person Household | 1,409 | 32.5% |
| 2-Person Household | 1,832 | 42.2% |
| 3-Person Household | 491 | 11.3% |
| 4+ Person Household | 604 | 13.9% |
| Total Housing Units | 4,336 | 100.0% |
Occupancy by Ownership by Household Size in Crawford County

| Household Size | Owner-occupied | Renter-occupied |
| 1-Person Household | 1,012 (71.8%) | 397 (28.2%) |
| 2-Person Household | 1,492 (81.4%) | 340 (18.6%) |
| 3-Person Household | 438 (89.2%) | 53 (10.8%) |
| 4+ Person Household | 500 (82.8%) | 104 (17.2%) |
| Total Housing Units | 3,442 (79.4%) | 894 (20.6%) |
Occupancy by Educational Attainment in Crawford County

| Household Size | Owner-occupied | Renter-occupied |
| Less than High School | 423 (76.9%) | 127 (23.1%) |
| High School Diploma | 1,657 (78.3%) | 460 (21.7%) |
| College/Associate Degree | 860 (76.0%) | 272 (24.0%) |
| Bachelor's Degree or higher | 502 (93.5%) | 35 (6.5%) |
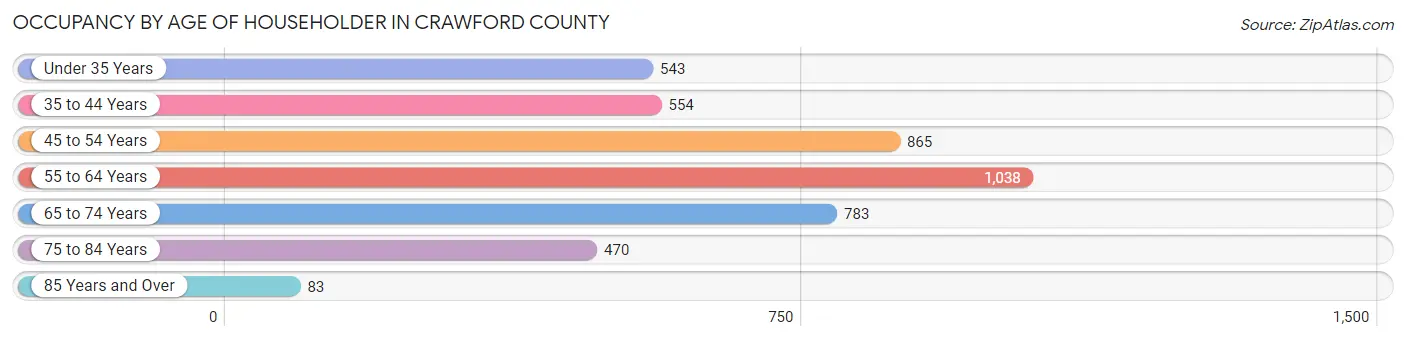
Occupancy by Age of Householder in Crawford County
| Age Bracket | # Households | % Households |
| Under 35 Years | 543 | 12.5% |
| 35 to 44 Years | 554 | 12.8% |
| 45 to 54 Years | 865 | 20.0% |
| 55 to 64 Years | 1,038 | 23.9% |
| 65 to 74 Years | 783 | 18.1% |
| 75 to 84 Years | 470 | 10.8% |
| 85 Years and Over | 83 | 1.9% |
| Total | 4,336 | 100.0% |
Housing Finances in Crawford County
Median Income by Occupancy in Crawford County

| Occupancy Type | # Households | Median Income |
| Owner-Occupied | 3,442 (79.4%) | $54,918 |
| Renter-Occupied | 894 (20.6%) | $30,058 |
| Average | 4,336 (100.0%) | $46,706 |
Occupancy by Householder Income Bracket in Crawford County
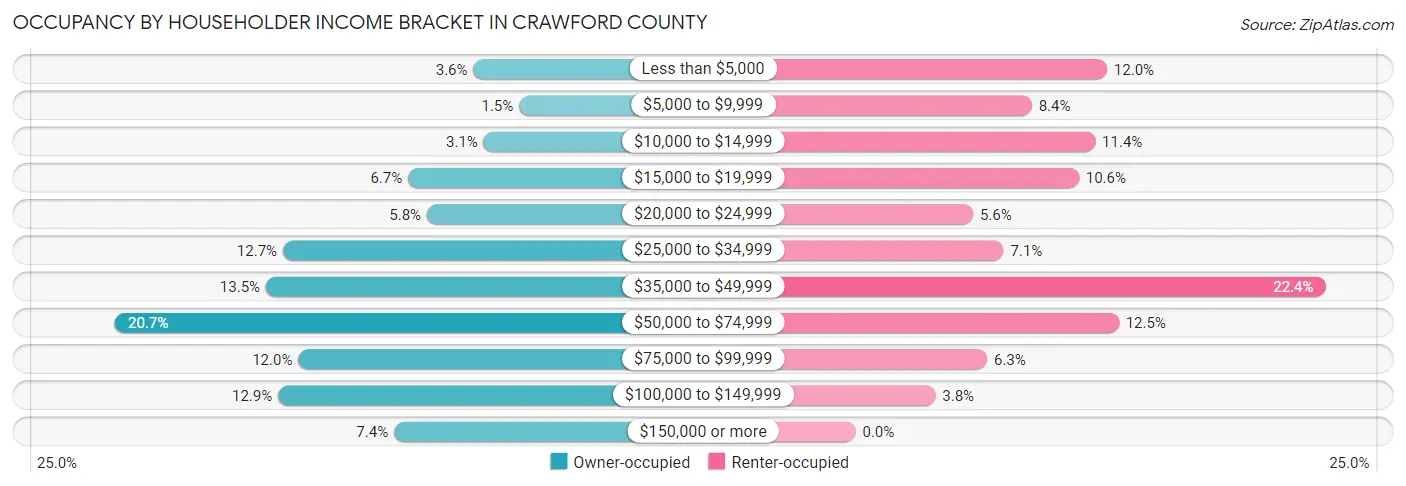
| Income Bracket | Owner-occupied | Renter-occupied |
| Less than $5,000 | 125 (3.6%) | 107 (12.0%) |
| $5,000 to $9,999 | 50 (1.5%) | 75 (8.4%) |
| $10,000 to $14,999 | 108 (3.1%) | 102 (11.4%) |
| $15,000 to $19,999 | 232 (6.7%) | 95 (10.6%) |
| $20,000 to $24,999 | 201 (5.8%) | 50 (5.6%) |
| $25,000 to $34,999 | 437 (12.7%) | 63 (7.0%) |
| $35,000 to $49,999 | 465 (13.5%) | 200 (22.4%) |
| $50,000 to $74,999 | 712 (20.7%) | 112 (12.5%) |
| $75,000 to $99,999 | 412 (12.0%) | 56 (6.3%) |
| $100,000 to $149,999 | 445 (12.9%) | 34 (3.8%) |
| $150,000 or more | 255 (7.4%) | 0 (0.0%) |
| Total | 3,442 (100.0%) | 894 (100.0%) |
Monthly Housing Cost Tiers in Crawford County

| Monthly Cost | Owner-occupied | Renter-occupied |
| Less than $300 | 463 (13.5%) | 47 (5.3%) |
| $300 to $499 | 1,083 (31.5%) | 143 (16.0%) |
| $500 to $799 | 744 (21.6%) | 270 (30.2%) |
| $800 to $999 | 281 (8.2%) | 139 (15.5%) |
| $1,000 to $1,499 | 528 (15.3%) | 112 (12.5%) |
| $1,500 to $1,999 | 286 (8.3%) | 0 (0.0%) |
| $2,000 to $2,499 | 40 (1.2%) | 0 (0.0%) |
| $2,500 to $2,999 | 3 (0.1%) | 0 (0.0%) |
| $3,000 or more | 14 (0.4%) | 0 (0.0%) |
| Total | 3,442 (100.0%) | 894 (100.0%) |
Physical Housing Characteristics in Crawford County
Housing Structures in Crawford County

| Structure Type | # Housing Units | % Housing Units |
| Single Unit, Detached | 3,047 | 70.3% |
| Single Unit, Attached | 47 | 1.1% |
| 2 Unit Apartments | 8 | 0.2% |
| 3 or 4 Unit Apartments | 45 | 1.0% |
| 5 to 9 Unit Apartments | 61 | 1.4% |
| 10 or more Apartments | 34 | 0.8% |
| Mobile Home / Other | 1,094 | 25.2% |
| Total | 4,336 | 100.0% |
Housing Structures by Occupancy in Crawford County
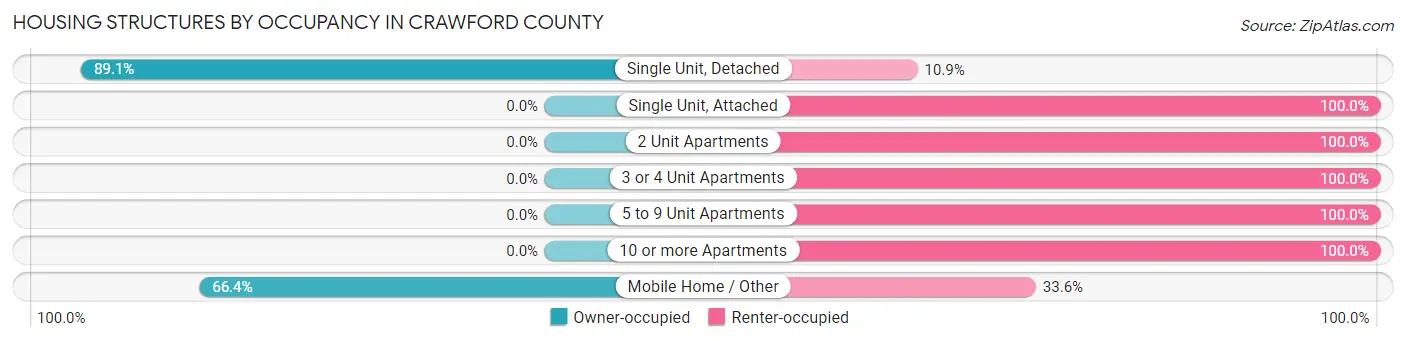
| Structure Type | Owner-occupied | Renter-occupied |
| Single Unit, Detached | 2,716 (89.1%) | 331 (10.9%) |
| Single Unit, Attached | 0 (0.0%) | 47 (100.0%) |
| 2 Unit Apartments | 0 (0.0%) | 8 (100.0%) |
| 3 or 4 Unit Apartments | 0 (0.0%) | 45 (100.0%) |
| 5 to 9 Unit Apartments | 0 (0.0%) | 61 (100.0%) |
| 10 or more Apartments | 0 (0.0%) | 34 (100.0%) |
| Mobile Home / Other | 726 (66.4%) | 368 (33.6%) |
| Total | 3,442 (79.4%) | 894 (20.6%) |
Housing Structures by Number of Rooms in Crawford County
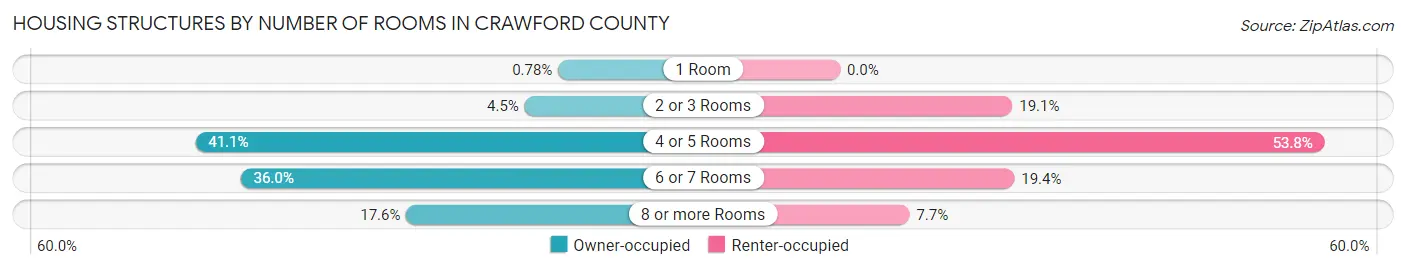
| Number of Rooms | Owner-occupied | Renter-occupied |
| 1 Room | 27 (0.8%) | 0 (0.0%) |
| 2 or 3 Rooms | 155 (4.5%) | 171 (19.1%) |
| 4 or 5 Rooms | 1,413 (41.0%) | 481 (53.8%) |
| 6 or 7 Rooms | 1,240 (36.0%) | 173 (19.4%) |
| 8 or more Rooms | 607 (17.6%) | 69 (7.7%) |
| Total | 3,442 (100.0%) | 894 (100.0%) |
Housing Structure by Heating Type in Crawford County

| Heating Type | Owner-occupied | Renter-occupied |
| Utility Gas | 481 (14.0%) | 152 (17.0%) |
| Bottled, Tank, or LP Gas | 842 (24.5%) | 103 (11.5%) |
| Electricity | 1,549 (45.0%) | 576 (64.4%) |
| Fuel Oil or Kerosene | 50 (1.5%) | 0 (0.0%) |
| Coal or Coke | 0 (0.0%) | 0 (0.0%) |
| All other Fuels | 517 (15.0%) | 59 (6.6%) |
| No Fuel Used | 3 (0.1%) | 4 (0.4%) |
| Total | 3,442 (100.0%) | 894 (100.0%) |
Household Vehicle Usage in Crawford County

| Vehicles per Household | Owner-occupied | Renter-occupied |
| No Vehicle | 71 (2.1%) | 159 (17.8%) |
| 1 Vehicle | 705 (20.5%) | 355 (39.7%) |
| 2 Vehicles | 1,318 (38.3%) | 307 (34.3%) |
| 3 or more Vehicles | 1,348 (39.2%) | 73 (8.2%) |
| Total | 3,442 (100.0%) | 894 (100.0%) |
Real Estate & Mortgages in Crawford County
Real Estate and Mortgage Overview in Crawford County
| Characteristic | Without Mortgage | With Mortgage |
| Housing Units | 2,009 | 1,433 |
| Median Property Value | $89,000 | $132,400 |
| Median Household Income | $42,525 | $182 |
| Monthly Housing Costs | $395 | $11 |
| Real Estate Taxes | $690 | $56 |
Property Value by Mortgage Status in Crawford County

| Property Value | Without Mortgage | With Mortgage |
| Less than $50,000 | 711 (35.4%) | 120 (8.4%) |
| $50,000 to $99,999 | 386 (19.2%) | 415 (29.0%) |
| $100,000 to $299,999 | 794 (39.5%) | 702 (49.0%) |
| $300,000 to $499,999 | 77 (3.8%) | 192 (13.4%) |
| $500,000 to $749,999 | 41 (2.0%) | 0 (0.0%) |
| $750,000 to $999,999 | 0 (0.0%) | 0 (0.0%) |
| $1,000,000 or more | 0 (0.0%) | 4 (0.3%) |
| Total | 2,009 (100.0%) | 1,433 (100.0%) |
Household Income by Mortgage Status in Crawford County

| Household Income | Without Mortgage | With Mortgage |
| Less than $10,000 | 100 (5.0%) | 36 (2.5%) |
| $10,000 to $24,999 | 410 (20.4%) | 75 (5.2%) |
| $25,000 to $34,999 | 346 (17.2%) | 131 (9.1%) |
| $35,000 to $49,999 | 263 (13.1%) | 91 (6.4%) |
| $50,000 to $74,999 | 405 (20.2%) | 202 (14.1%) |
| $75,000 to $99,999 | 201 (10.0%) | 307 (21.4%) |
| $100,000 to $149,999 | 211 (10.5%) | 211 (14.7%) |
| $150,000 or more | 73 (3.6%) | 234 (16.3%) |
| Total | 2,009 (100.0%) | 1,433 (100.0%) |
Property Value to Household Income Ratio in Crawford County
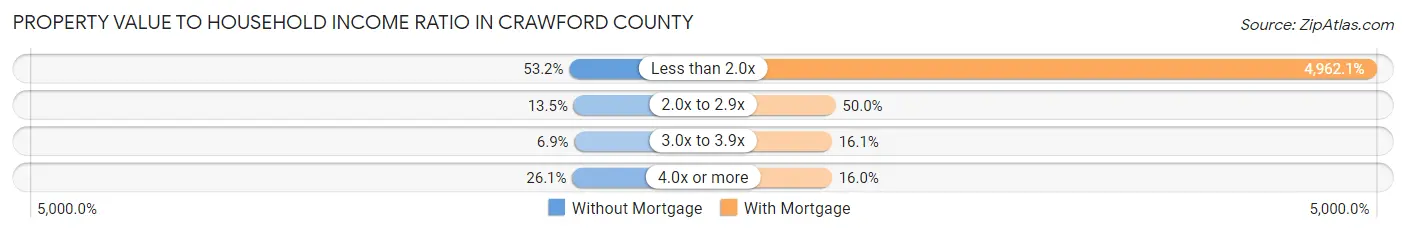
| Value-to-Income Ratio | Without Mortgage | With Mortgage |
| Less than 2.0x | 1,069 (53.2%) | 71,107 (4,962.1%) |
| 2.0x to 2.9x | 272 (13.5%) | 716 (50.0%) |
| 3.0x to 3.9x | 139 (6.9%) | 230 (16.1%) |
| 4.0x or more | 524 (26.1%) | 229 (16.0%) |
| Total | 2,009 (100.0%) | 1,433 (100.0%) |
Real Estate Taxes by Mortgage Status in Crawford County

| Property Taxes | Without Mortgage | With Mortgage |
| Less than $800 | 1,061 (52.8%) | 0 (0.0%) |
| $800 to $1,499 | 465 (23.2%) | 506 (35.3%) |
| $800 to $1,499 | 345 (17.2%) | 453 (31.6%) |
| Total | 2,009 (100.0%) | 1,433 (100.0%) |
Health & Disability in Crawford County
Health Insurance Coverage by Age in Crawford County

| Age Bracket | With Coverage | Without Coverage |
| Under 6 Years | 585 (99.2%) | 5 (0.9%) |
| 6 to 18 Years | 1,773 (99.3%) | 12 (0.7%) |
| 19 to 25 Years | 612 (84.1%) | 116 (15.9%) |
| 26 to 34 Years | 891 (92.0%) | 77 (8.0%) |
| 35 to 44 Years | 1,007 (83.2%) | 204 (16.9%) |
| 45 to 54 Years | 1,221 (85.2%) | 213 (14.8%) |
| 55 to 64 Years | 1,588 (94.5%) | 92 (5.5%) |
| 65 to 74 Years | 1,312 (99.8%) | 3 (0.2%) |
| 75 Years and older | 733 (100.0%) | 0 (0.0%) |
| Total | 9,722 (93.1%) | 722 (6.9%) |
Health Insurance Coverage by Citizenship Status in Crawford County

| Citizenship Status | With Coverage | Without Coverage |
| Native Born | 585 (99.2%) | 5 (0.9%) |
| Foreign Born, Citizen | 1,773 (99.3%) | 12 (0.7%) |
| Foreign Born, not a Citizen | 612 (84.1%) | 116 (15.9%) |
Health Insurance Coverage by Household Income in Crawford County
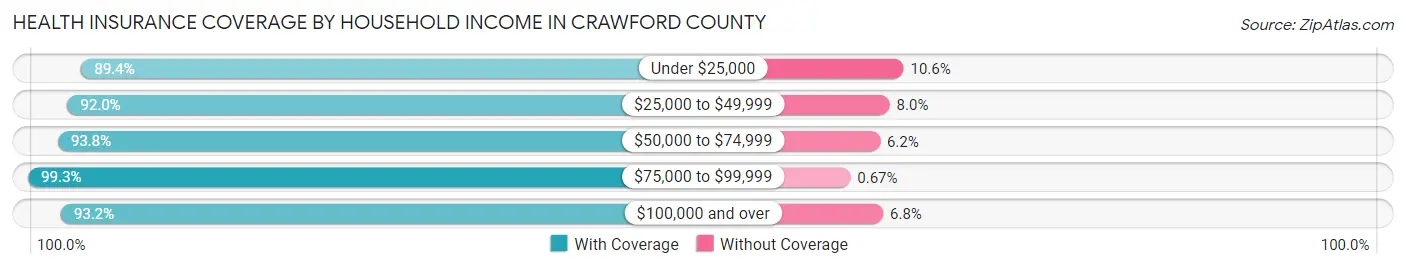
| Household Income | With Coverage | Without Coverage |
| Under $25,000 | 2,044 (89.4%) | 243 (10.6%) |
| $25,000 to $49,999 | 2,152 (92.0%) | 188 (8.0%) |
| $50,000 to $74,999 | 1,643 (93.8%) | 109 (6.2%) |
| $75,000 to $99,999 | 1,480 (99.3%) | 10 (0.7%) |
| $100,000 and over | 2,358 (93.2%) | 172 (6.8%) |
Public vs Private Health Insurance Coverage by Age in Crawford County

| Age Bracket | Public Insurance | Private Insurance |
| Under 6 | 365 (61.9%) | 229 (38.8%) |
| 6 to 18 Years | 1,014 (56.8%) | 778 (43.6%) |
| 19 to 25 Years | 170 (23.4%) | 448 (61.5%) |
| 25 to 34 Years | 325 (33.6%) | 631 (65.2%) |
| 35 to 44 Years | 437 (36.1%) | 609 (50.3%) |
| 45 to 54 Years | 364 (25.4%) | 894 (62.3%) |
| 55 to 64 Years | 605 (36.0%) | 1,076 (64.0%) |
| 65 to 74 Years | 1,301 (98.9%) | 708 (53.8%) |
| 75 Years and over | 733 (100.0%) | 515 (70.3%) |
| Total | 5,314 (50.9%) | 5,888 (56.4%) |
Disability Status by Sex by Age in Crawford County

| Age Bracket | Male | Female |
| Under 5 Years | 0 (0.0%) | 0 (0.0%) |
| 5 to 17 Years | 24 (2.8%) | 31 (3.7%) |
| 18 to 34 Years | 149 (16.3%) | 83 (9.4%) |
| 35 to 64 Years | 471 (20.6%) | 338 (16.5%) |
| 65 to 74 Years | 281 (40.1%) | 140 (22.8%) |
| 75 Years and over | 194 (58.1%) | 199 (49.9%) |
Disability Class by Sex by Age in Crawford County
Disability Class: Hearing Difficulty

| Age Bracket | Male | Female |
| Under 5 Years | 0 (0.0%) | 0 (0.0%) |
| 5 to 17 Years | 0 (0.0%) | 0 (0.0%) |
| 18 to 34 Years | 42 (4.6%) | 0 (0.0%) |
| 35 to 64 Years | 251 (11.0%) | 34 (1.7%) |
| 65 to 74 Years | 115 (16.4%) | 30 (4.9%) |
| 75 Years and over | 136 (40.7%) | 53 (13.3%) |
Disability Class: Vision Difficulty

| Age Bracket | Male | Female |
| Under 5 Years | 0 (0.0%) | 0 (0.0%) |
| 5 to 17 Years | 0 (0.0%) | 1 (0.1%) |
| 18 to 34 Years | 6 (0.7%) | 5 (0.6%) |
| 35 to 64 Years | 99 (4.3%) | 63 (3.1%) |
| 65 to 74 Years | 29 (4.1%) | 43 (7.0%) |
| 75 Years and over | 0 (0.0%) | 46 (11.5%) |
Disability Class: Cognitive Difficulty

| Age Bracket | Male | Female |
| 5 to 17 Years | 24 (2.8%) | 30 (3.6%) |
| 18 to 34 Years | 89 (9.7%) | 71 (8.0%) |
| 35 to 64 Years | 234 (10.3%) | 104 (5.1%) |
| 65 to 74 Years | 97 (13.8%) | 22 (3.6%) |
| 75 Years and over | 14 (4.2%) | 56 (14.0%) |
Disability Class: Ambulatory Difficulty

| Age Bracket | Male | Female |
| 5 to 17 Years | 0 (0.0%) | 0 (0.0%) |
| 18 to 34 Years | 32 (3.5%) | 4 (0.4%) |
| 35 to 64 Years | 226 (9.9%) | 157 (7.7%) |
| 65 to 74 Years | 114 (16.3%) | 90 (14.7%) |
| 75 Years and over | 86 (25.8%) | 150 (37.6%) |
Disability Class: Self-Care Difficulty

| Age Bracket | Male | Female |
| 5 to 17 Years | 8 (0.9%) | 5 (0.6%) |
| 18 to 34 Years | 5 (0.5%) | 0 (0.0%) |
| 35 to 64 Years | 87 (3.8%) | 31 (1.5%) |
| 65 to 74 Years | 24 (3.4%) | 20 (3.3%) |
| 75 Years and over | 37 (11.1%) | 48 (12.0%) |
Technology Access in Crawford County
Computing Device Access in Crawford County

| Device Type | # Households | % Households |
| Desktop or Laptop | 2,499 | 57.6% |
| Smartphone | 3,357 | 77.4% |
| Tablet | 1,752 | 40.4% |
| No Computing Device | 574 | 13.2% |
| Total | 4,336 | 100.0% |
Internet Access in Crawford County

| Internet Type | # Households | % Households |
| Dial-Up Internet | 23 | 0.5% |
| Broadband Home | 1,440 | 33.2% |
| Cellular Data Only | 975 | 22.5% |
| Satellite Internet | 411 | 9.5% |
| No Internet | 1,441 | 33.2% |
| Total | 4,336 | 100.0% |
Crawford County Summary
Crawford County, Indiana is located in the southwestern corner of the state, bordered by the Ohio River to the west and the Wabash River to the east. The county seat is English, and the county was named after William H. Crawford, the United States Secretary of War from 1815 to 1816. The county has a total area of 437 square miles, and a population of 10,890 as of the 2010 census.
History
Crawford County was formed in 1818 from parts of Harrison, Orange, and Dubois counties. The county was named after William H. Crawford, the United States Secretary of War from 1815 to 1816. The first settlers arrived in the area in the early 1800s, and the county was officially organized in 1818.
The county was home to several Native American tribes, including the Miami, Potawatomi, and Shawnee. The first white settlers arrived in the area in the early 1800s, and the county was officially organized in 1818.
The county was an important part of the Underground Railroad, with many of the county's residents helping to hide and transport escaped slaves. The county was also home to several Civil War battles, including the Battle of Corydon in 1863.
Geography
Crawford County is located in the southwestern corner of Indiana, bordered by the Ohio River to the west and the Wabash River to the east. The county has a total area of 437 square miles, and a population of 10,890 as of the 2010 census.
The county is mostly rural, with the majority of the land being used for farming and forestry. The county is home to several state parks, including the Wyandotte Woods State Recreation Area, the Patoka River National Wildlife Refuge, and the Harrison-Crawford State Forest.
Economy
Crawford County has a diverse economy, with the majority of the population employed in the manufacturing, retail, and service sectors. The county is home to several large employers, including the Crawford County Hospital, the Crawford County School Corporation, and the Crawford County Sheriff's Office.
The county is also home to several small businesses, including restaurants, retail stores, and service providers. The county is also home to several wineries, including the Crawford County Winery and the Patoka Valley Winery.
Demographics
As of the 2010 census, the population of Crawford County was 10,890. The racial makeup of the county was 97.3% White, 0.7% African American, 0.3% Native American, 0.2% Asian, 0.1% Pacific Islander, 0.5% from other races, and 0.9% from two or more races. Hispanic or Latino of any race were 1.3% of the population.
The median income for a household in the county was $41,945, and the median income for a family was $50,945. The per capita income for the county was $20,945. About 11.3% of families and 14.2% of the population were below the poverty line, including 19.2% of those under age 18 and 8.2% of those age 65 or over.
Common Questions
What is the Total Population of Crawford County?
Total Population of Crawford County is 10,511.
What is the Total Male Population of Crawford County?
Total Male Population of Crawford County is 5,422.
What is the Total Female Population of Crawford County?
Total Female Population of Crawford County is 5,089.
What is the Ratio of Males per 100 Females in Crawford County?
There are 106.54 Males per 100 Females in Crawford County.
What is the Ratio of Females per 100 Males in Crawford County?
There are 93.86 Females per 100 Males in Crawford County.
What is the Median Population Age in Crawford County?
Median Population Age in Crawford County is 44.6 Years.
What is the Average Family Size in Crawford County
Average Family Size in Crawford County is 3.1 People.
What is the Average Household Size in Crawford County
Average Household Size in Crawford County is 2.4 People.
What is Per Capita Income in Crawford County?
Per Capita income in Crawford County is $29,114.
What is the Median Family Income in Crawford County?
Median Family Income in Crawford County is $66,122.
What is the Median Household income in Crawford County?
Median Household Income in Crawford County is $46,706.
What is Income or Wage Gap in Crawford County?
Income or Wage Gap in Crawford County is 30.2%.
Women in Crawford County earn 69.8 cents for every dollar earned by a man.
What is Family Income Deficit in Crawford County?
Family Income Deficit in Crawford County is $8,814.
Families that are below poverty line in Crawford County earn $8,814 less on average than the poverty threshold level.
What is Inequality or Gini Index in Crawford County?
Inequality or Gini Index in Crawford County is 0.49.
How Large is the Labor Force in Crawford County?
There are 4,484 People in the Labor Forcein in Crawford County.
What is the Percentage of People in the Labor Force in Crawford County?
53.3% of People are in the Labor Force in Crawford County.
What is the Unemployment Rate in Crawford County?
Unemployment Rate in Crawford County is 3.6%.