Clinton County, IN
Clinton County Map

Clinton County Overview
33,020
TOTAL POPULATION
16,560
MALE POPULATION
16,460
FEMALE POPULATION
100.61
MALES / 100 FEMALES
99.40
FEMALES / 100 MALES
36.7
MEDIAN AGE
3.3
AVG FAMILY SIZE
2.6
AVG HOUSEHOLD SIZE
$28,063
PER CAPITA INCOME
$76,828
AVG FAMILY INCOME
$59,515
AVG HOUSEHOLD INCOME
25.1%
WAGE / INCOME GAP [ % ]
74.9¢/ $1
WAGE / INCOME GAP [ $ ]
$9,763
FAMILY INCOME DEFICIT
0.38
INEQUALITY / GINI INDEX
16,091
LABOR FORCE [ PEOPLE ]
64.0%
PERCENT IN LABOR FORCE
3.4%
UNEMPLOYMENT RATE
Clinton County Area Codes
Race in Clinton County
The most populous races in Clinton County are White / Caucasian (28,114 | 85.1%), Hispanic or Latino (5,611 | 17.0%), and Some other Race (2,255 | 6.8%).

| Race | # Population | % Population |
| Asian | 155 | 0.5% |
| Black / African American | 252 | 0.8% |
| Hawaiian / Pacific | 0 | 0.0% |
| Hispanic or Latino | 5,611 | 17.0% |
| Native / Alaskan | 1 | 0.0% |
| White / Caucasian | 28,114 | 85.1% |
| Two or more Races | 2,243 | 6.8% |
| Some other Race | 2,255 | 6.8% |
| Total | 33,020 | 100.0% |
Ancestry in Clinton County
The most populous ancestries reported in Clinton County are Mexican (5,321 | 16.1%), German (4,934 | 14.9%), American (3,022 | 9.1%), English (2,913 | 8.8%), and Irish (1,880 | 5.7%), together accounting for 54.7% of all Clinton County residents.

| Ancestry | # Population | % Population |
| American | 3,022 | 9.1% |
| Apache | 1 | 0.0% |
| Arab | 6 | 0.0% |
| Austrian | 19 | 0.1% |
| Belgian | 2 | 0.0% |
| Bhutanese | 21 | 0.1% |
| Blackfeet | 12 | 0.0% |
| British | 109 | 0.3% |
| Burmese | 14 | 0.0% |
| Canadian | 2 | 0.0% |
| Central American | 109 | 0.3% |
| Cherokee | 53 | 0.2% |
| Chippewa | 1 | 0.0% |
| Colombian | 22 | 0.1% |
| Czech | 20 | 0.1% |
| Danish | 51 | 0.2% |
| Dominican | 30 | 0.1% |
| Dutch | 521 | 1.6% |
| Eastern European | 39 | 0.1% |
| English | 2,913 | 8.8% |
| European | 505 | 1.5% |
| Finnish | 7 | 0.0% |
| French | 378 | 1.1% |
| French Canadian | 34 | 0.1% |
| German | 4,934 | 14.9% |
| Greek | 36 | 0.1% |
| Guatemalan | 6 | 0.0% |
| Hungarian | 41 | 0.1% |
| Indian (Asian) | 24 | 0.1% |
| Irish | 1,880 | 5.7% |
| Italian | 363 | 1.1% |
| Korean | 3 | 0.0% |
| Mexican | 5,321 | 16.1% |
| Nicaraguan | 81 | 0.3% |
| Northern European | 132 | 0.4% |
| Norwegian | 296 | 0.9% |
| Pennsylvania German | 11 | 0.0% |
| Peruvian | 26 | 0.1% |
| Polish | 270 | 0.8% |
| Potawatomi | 8 | 0.0% |
| Puerto Rican | 42 | 0.1% |
| Romanian | 14 | 0.0% |
| Russian | 11 | 0.0% |
| Salvadoran | 22 | 0.1% |
| Scandinavian | 10 | 0.0% |
| Scotch-Irish | 104 | 0.3% |
| Scottish | 373 | 1.1% |
| South American | 48 | 0.2% |
| Spaniard | 10 | 0.0% |
| Sri Lankan | 11 | 0.0% |
| Swedish | 160 | 0.5% |
| Swiss | 25 | 0.1% |
| Syrian | 6 | 0.0% |
| Thai | 39 | 0.1% |
| Turkish | 4 | 0.0% |
| Ukrainian | 15 | 0.1% |
| Welsh | 77 | 0.2% | View All 57 Rows |
Immigrants in Clinton County
The most numerous immigrant groups reported in Clinton County came from Latin America (2,393 | 7.2%), Central America (2,337 | 7.1%), Mexico (2,154 | 6.5%), Asia (142 | 0.4%), and Europe (87 | 0.3%), together accounting for 21.5% of all Clinton County residents.

| Immigration Origin | # Population | % Population |
| Asia | 142 | 0.4% |
| Belgium | 14 | 0.0% |
| Canada | 15 | 0.1% |
| Caribbean | 8 | 0.0% |
| Central America | 2,337 | 7.1% |
| China | 9 | 0.0% |
| Colombia | 22 | 0.1% |
| Dominican Republic | 8 | 0.0% |
| Eastern Asia | 40 | 0.1% |
| Eastern Europe | 49 | 0.2% |
| El Salvador | 71 | 0.2% |
| Europe | 87 | 0.3% |
| Germany | 13 | 0.0% |
| Guatemala | 30 | 0.1% |
| India | 22 | 0.1% |
| Indonesia | 3 | 0.0% |
| Italy | 11 | 0.0% |
| Japan | 17 | 0.1% |
| Korea | 14 | 0.0% |
| Latin America | 2,393 | 7.2% |
| Mexico | 2,154 | 6.5% |
| Nicaragua | 81 | 0.3% |
| Panama | 1 | 0.0% |
| Peru | 26 | 0.1% |
| Philippines | 18 | 0.1% |
| Russia | 49 | 0.2% |
| South America | 48 | 0.2% |
| South Central Asia | 22 | 0.1% |
| South Eastern Asia | 80 | 0.2% |
| Southern Europe | 11 | 0.0% |
| Western Europe | 27 | 0.1% | View All 31 Rows |
Sex and Age in Clinton County
Sex and Age in Clinton County
The most populous age groups in Clinton County are 10 to 14 Years (1,328 | 8.0%) for men and 5 to 9 Years (1,383 | 8.4%) for women.

| Age Bracket | Male | Female |
| Under 5 Years | 1,151 (7.0%) | 1,195 (7.3%) |
| 5 to 9 Years | 1,277 (7.7%) | 1,383 (8.4%) |
| 10 to 14 Years | 1,328 (8.0%) | 967 (5.9%) |
| 15 to 19 Years | 1,319 (8.0%) | 1,130 (6.9%) |
| 20 to 24 Years | 1,018 (6.1%) | 861 (5.2%) |
| 25 to 29 Years | 971 (5.9%) | 967 (5.9%) |
| 30 to 34 Years | 992 (6.0%) | 987 (6.0%) |
| 35 to 39 Years | 1,123 (6.8%) | 925 (5.6%) |
| 40 to 44 Years | 851 (5.1%) | 948 (5.8%) |
| 45 to 49 Years | 969 (5.9%) | 963 (5.9%) |
| 50 to 54 Years | 1,089 (6.6%) | 936 (5.7%) |
| 55 to 59 Years | 1,200 (7.2%) | 990 (6.0%) |
| 60 to 64 Years | 917 (5.5%) | 1,140 (6.9%) |
| 65 to 69 Years | 951 (5.7%) | 956 (5.8%) |
| 70 to 74 Years | 522 (3.2%) | 644 (3.9%) |
| 75 to 79 Years | 417 (2.5%) | 474 (2.9%) |
| 80 to 84 Years | 223 (1.3%) | 478 (2.9%) |
| 85 Years and over | 242 (1.5%) | 516 (3.1%) |
| Total | 16,560 (100.0%) | 16,460 (100.0%) |
Families and Households in Clinton County
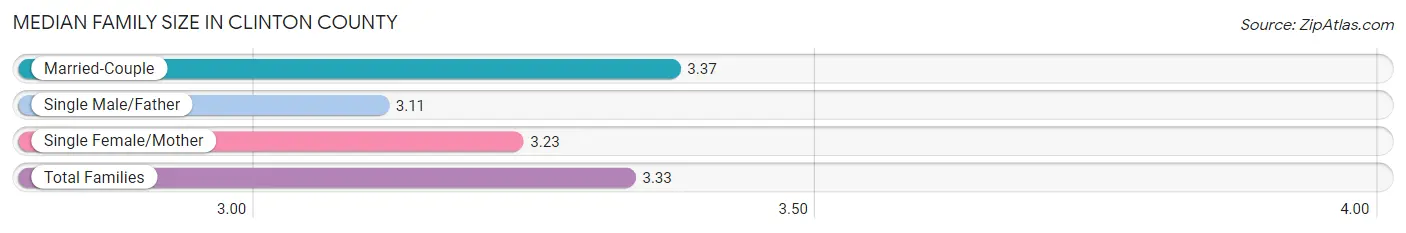
Median Family Size in Clinton County
The median family size in Clinton County is 3.33 persons per family, with married-couple families (5,914 | 76.6%) accounting for the largest median family size of 3.37 persons per family. On the other hand, single male/father families (630 | 8.2%) represent the smallest median family size with 3.11 persons per family.
| Family Type | # Families | Family Size |
| Married-Couple | 5,914 (76.6%) | 3.37 |
| Single Male/Father | 630 (8.2%) | 3.11 |
| Single Female/Mother | 1,176 (15.2%) | 3.23 |
| Total Families | 7,720 (100.0%) | 3.33 |
Median Household Size in Clinton County
The median household size in Clinton County is 2.62 persons per household, with single female/mother households (1,176 | 9.5%) accounting for the largest median household size of 3.48 persons per household. non-family households (4,662 | 37.7%) represent the smallest median household size with 1.26 persons per household.

| Household Type | # Households | Household Size |
| Married-Couple | 5,914 (47.8%) | 3.43 |
| Single Male/Father | 630 (5.1%) | 3.47 |
| Single Female/Mother | 1,176 (9.5%) | 3.48 |
| Non-family | 4,662 (37.7%) | 1.26 |
| Total Households | 12,382 (100.0%) | 2.62 |
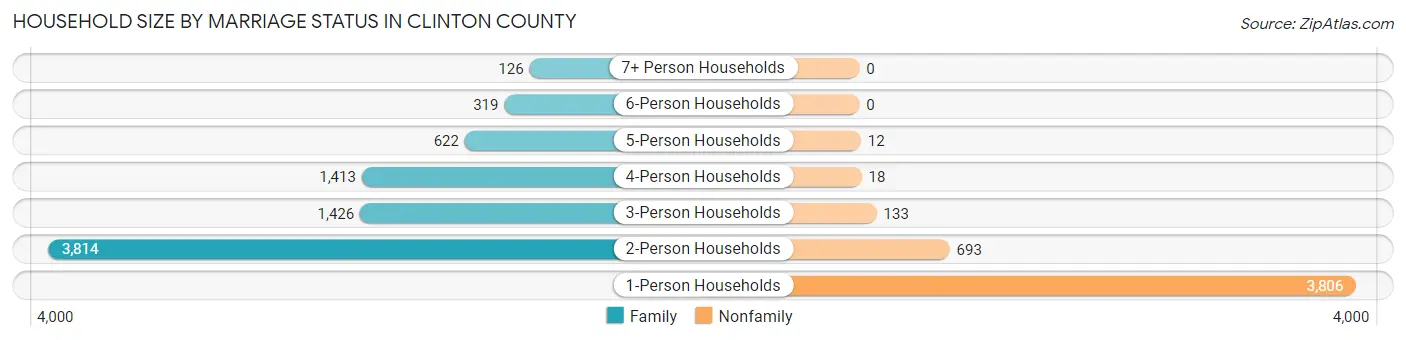
Household Size by Marriage Status in Clinton County
Out of a total of 12,382 households in Clinton County, 7,720 (62.4%) are family households, while 4,662 (37.7%) are nonfamily households. The most numerous type of family households are 2-person households, comprising 3,814, and the most common type of nonfamily households are 1-person households, comprising 3,806.
| Household Size | Family Households | Nonfamily Households |
| 1-Person Households | - | 3,806 (30.7%) |
| 2-Person Households | 3,814 (30.8%) | 693 (5.6%) |
| 3-Person Households | 1,426 (11.5%) | 133 (1.1%) |
| 4-Person Households | 1,413 (11.4%) | 18 (0.2%) |
| 5-Person Households | 622 (5.0%) | 12 (0.1%) |
| 6-Person Households | 319 (2.6%) | 0 (0.0%) |
| 7+ Person Households | 126 (1.0%) | 0 (0.0%) |
| Total | 7,720 (62.4%) | 4,662 (37.7%) |
Female Fertility in Clinton County
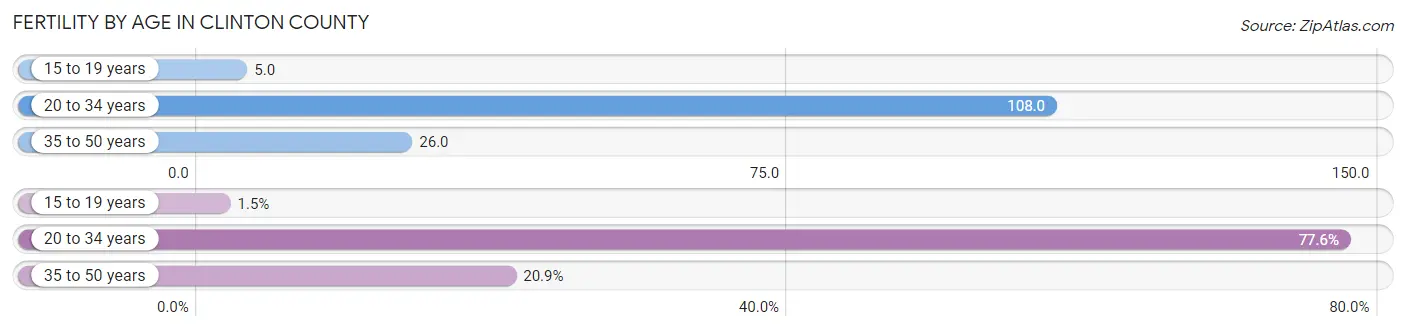
Fertility by Age in Clinton County
Average fertility rate in Clinton County is 56.0 births per 1,000 women. Women in the age bracket of 20 to 34 years have the highest fertility rate with 108.0 births per 1,000 women. Women in the age bracket of 20 to 34 years acount for 77.5% of all women with births.
| Age Bracket | Women with Births | Births / 1,000 Women |
| 15 to 19 years | 6 (1.5%) | 5.0 |
| 20 to 34 years | 304 (77.5%) | 108.0 |
| 35 to 50 years | 82 (20.9%) | 26.0 |
| Total | 392 (100.0%) | 56.0 |
Fertility by Age by Marriage Status in Clinton County
65.3% of women with births (392) in Clinton County are married. The highest percentage of unmarried women with births falls into 15 to 19 years age bracket with 100.0% of them unmarried at the time of birth, while the lowest percentage of unmarried women with births belong to 20 to 34 years age bracket with 28.0% of them unmarried.

| Age Bracket | Married | Unmarried |
| 15 to 19 years | 0 (0.0%) | 6 (100.0%) |
| 20 to 34 years | 219 (72.0%) | 85 (28.0%) |
| 35 to 50 years | 37 (45.1%) | 45 (54.9%) |
| Total | 256 (65.3%) | 136 (34.7%) |
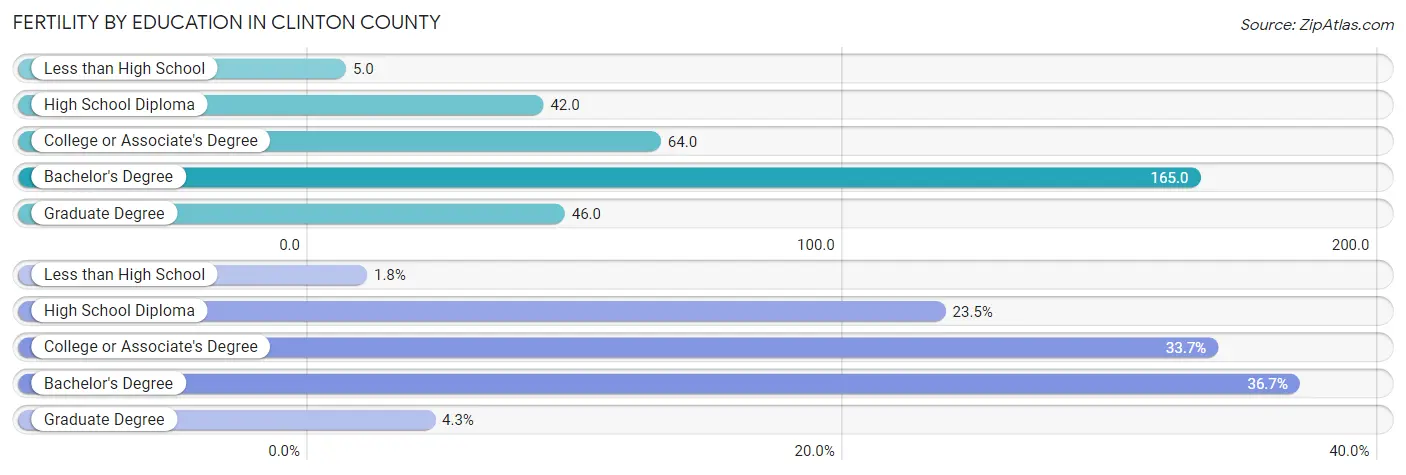
Fertility by Education in Clinton County
Average fertility rate in Clinton County is 56.0 births per 1,000 women. Women with the education attainment of bachelor's degree have the highest fertility rate of 165.0 births per 1,000 women, while women with the education attainment of less than high school have the lowest fertility at 5.0 births per 1,000 women. Women with the education attainment of bachelor's degree represent 36.7% of all women with births.
| Educational Attainment | Women with Births | Births / 1,000 Women |
| Less than High School | 7 (1.8%) | 5.0 |
| High School Diploma | 92 (23.5%) | 42.0 |
| College or Associate's Degree | 132 (33.7%) | 64.0 |
| Bachelor's Degree | 144 (36.7%) | 165.0 |
| Graduate Degree | 17 (4.3%) | 46.0 |
| Total | 392 (100.0%) | 56.0 |
Fertility by Education by Marriage Status in Clinton County
34.7% of women with births in Clinton County are unmarried. Women with the educational attainment of less than high school are most likely to be married with 100.0% of them married at childbirth, while women with the educational attainment of college or associate's degree are least likely to be married with 62.1% of them unmarried at childbirth.

| Educational Attainment | Married | Unmarried |
| Less than High School | 7 (100.0%) | 0 (0.0%) |
| High School Diploma | 66 (71.7%) | 26 (28.3%) |
| College or Associate's Degree | 50 (37.9%) | 82 (62.1%) |
| Bachelor's Degree | 116 (80.6%) | 28 (19.4%) |
| Graduate Degree | 17 (100.0%) | 0 (0.0%) |
| Total | 256 (65.3%) | 136 (34.7%) |
Income in Clinton County
Income Overview in Clinton County
Per Capita Income in Clinton County is $28,063, while median incomes of families and households are $76,828 and $59,515 respectively.
| Characteristic | Number | Measure |
| Per Capita Income | 33,020 | $28,063 |
| Median Family Income | 7,720 | $76,828 |
| Mean Family Income | 7,720 | $86,992 |
| Median Household Income | 12,382 | $59,515 |
| Mean Household Income | 12,382 | $72,316 |
| Income Deficit | 7,720 | $9,763 |
| Wage / Income Gap (%) | 33,020 | 25.07% |
| Wage / Income Gap ($) | 33,020 | 74.93¢ per $1 |
| Gini / Inequality Index | 33,020 | 0.38 |
Earnings by Sex in Clinton County
Average Earnings in Clinton County are $36,824, $42,115 for men and $31,556 for women, a difference of 25.1%.

| Sex | Number | Average Earnings |
| Male | 9,262 (54.5%) | $42,115 |
| Female | 7,735 (45.5%) | $31,556 |
| Total | 16,997 (100.0%) | $36,824 |
Earnings by Sex by Income Bracket in Clinton County
The most common earnings brackets in Clinton County are $55,000 to $64,999 for men (1,011 | 10.9%) and $35,000 to $39,999 for women (716 | 9.3%).
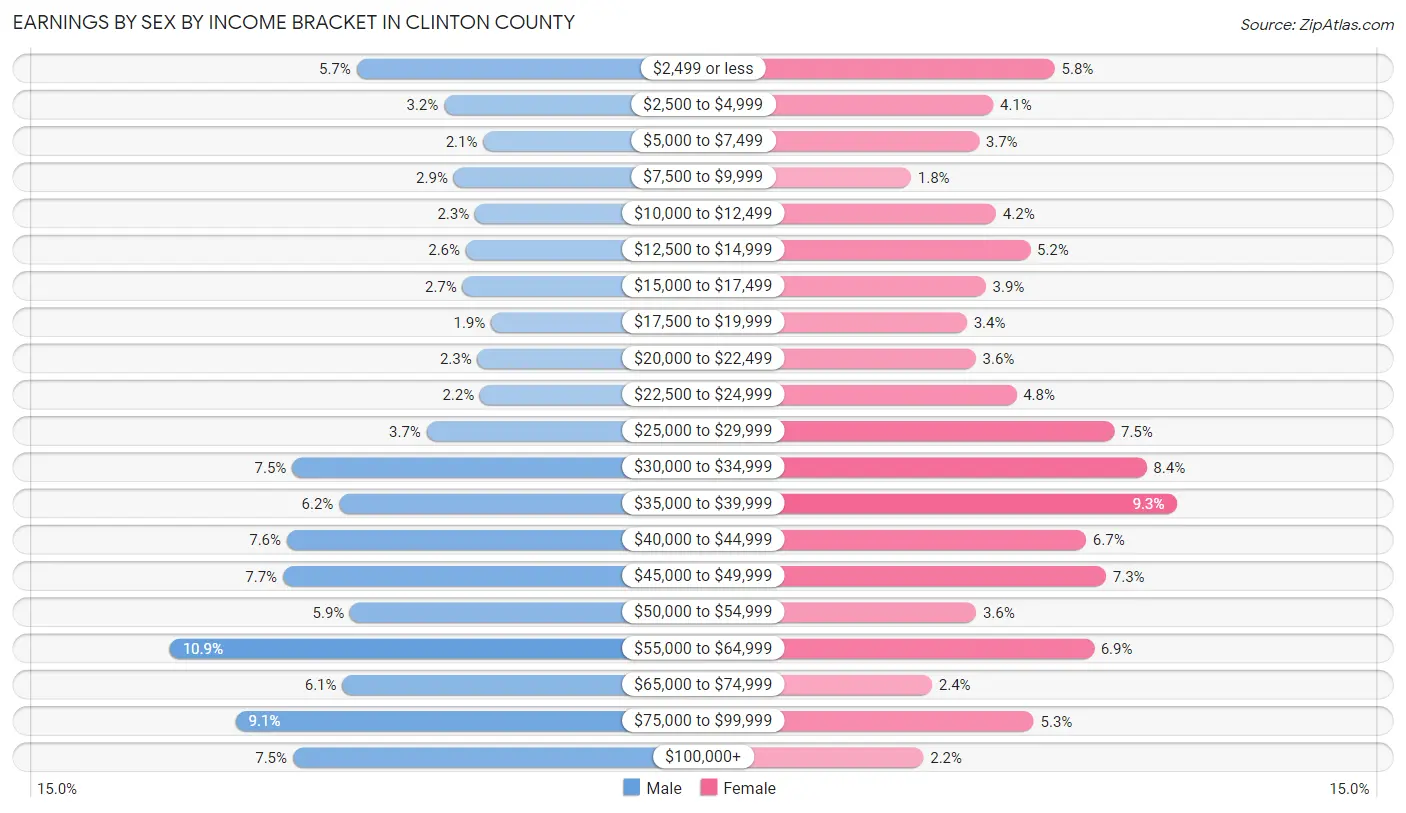
| Income | Male | Female |
| $2,499 or less | 525 (5.7%) | 452 (5.8%) |
| $2,500 to $4,999 | 297 (3.2%) | 318 (4.1%) |
| $5,000 to $7,499 | 195 (2.1%) | 287 (3.7%) |
| $7,500 to $9,999 | 272 (2.9%) | 139 (1.8%) |
| $10,000 to $12,499 | 217 (2.3%) | 324 (4.2%) |
| $12,500 to $14,999 | 241 (2.6%) | 398 (5.1%) |
| $15,000 to $17,499 | 249 (2.7%) | 302 (3.9%) |
| $17,500 to $19,999 | 175 (1.9%) | 261 (3.4%) |
| $20,000 to $22,499 | 210 (2.3%) | 280 (3.6%) |
| $22,500 to $24,999 | 204 (2.2%) | 368 (4.8%) |
| $25,000 to $29,999 | 343 (3.7%) | 581 (7.5%) |
| $30,000 to $34,999 | 693 (7.5%) | 651 (8.4%) |
| $35,000 to $39,999 | 571 (6.2%) | 716 (9.3%) |
| $40,000 to $44,999 | 707 (7.6%) | 520 (6.7%) |
| $45,000 to $49,999 | 717 (7.7%) | 563 (7.3%) |
| $50,000 to $54,999 | 542 (5.9%) | 281 (3.6%) |
| $55,000 to $64,999 | 1,011 (10.9%) | 537 (6.9%) |
| $65,000 to $74,999 | 562 (6.1%) | 185 (2.4%) |
| $75,000 to $99,999 | 840 (9.1%) | 406 (5.2%) |
| $100,000+ | 691 (7.5%) | 166 (2.1%) |
| Total | 9,262 (100.0%) | 7,735 (100.0%) |
Earnings by Sex by Educational Attainment in Clinton County
Average earnings in Clinton County are $46,528 for men and $35,042 for women, a difference of 24.7%. Men with an educational attainment of bachelor's degree enjoy the highest average annual earnings of $73,053, while those with less than high school education earn the least with $35,054. Women with an educational attainment of graduate degree earn the most with the average annual earnings of $58,402, while those with high school diploma education have the smallest earnings of $28,908.

| Educational Attainment | Male Income | Female Income |
| Less than High School | $35,054 | $32,950 |
| High School Diploma | $44,003 | $28,908 |
| College or Associate's Degree | $56,620 | $35,942 |
| Bachelor's Degree | $73,053 | $44,438 |
| Graduate Degree | $59,605 | $58,402 |
| Total | $46,528 | $35,042 |
Family Income in Clinton County
Family Income Brackets in Clinton County
According to the Clinton County family income data, there are 1,644 families falling into the $50,000 to $74,999 income range, which is the most common income bracket and makes up 21.3% of all families. Conversely, the $10,000 to $14,999 income bracket is the least frequent group with only 39 families (0.5%) belonging to this category.

| Income Bracket | # Families | % Families |
| Less than $10,000 | 162 | 2.1% |
| $10,000 to $14,999 | 39 | 0.5% |
| $15,000 to $24,999 | 363 | 4.7% |
| $25,000 to $34,999 | 479 | 6.2% |
| $35,000 to $49,999 | 1,073 | 13.9% |
| $50,000 to $74,999 | 1,644 | 21.3% |
| $75,000 to $99,999 | 1,575 | 20.4% |
| $100,000 to $149,999 | 1,606 | 20.8% |
| $150,000 to $199,999 | 486 | 6.3% |
| $200,000+ | 293 | 3.8% |
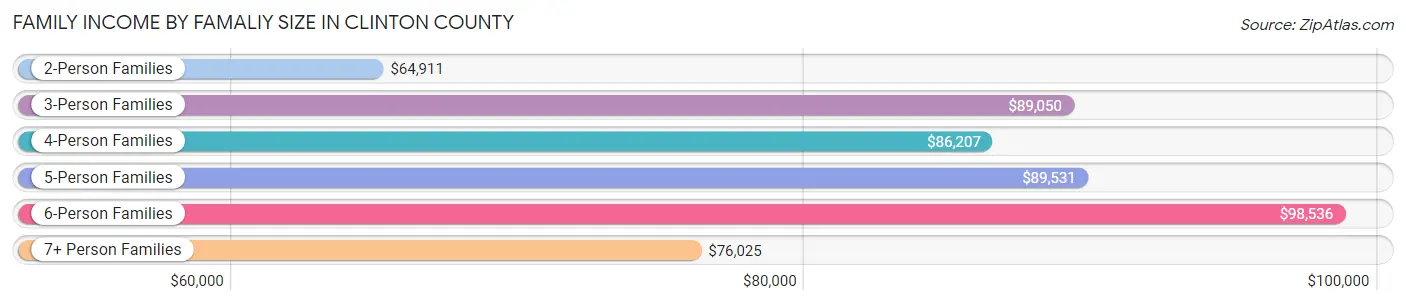
Family Income by Famaliy Size in Clinton County
6-person families (241 | 3.1%) account for the highest median family income in Clinton County with $98,536 per family, while 2-person families (4,005 | 51.9%) have the highest median income of $32,456 per family member.
| Income Bracket | # Families | Median Income |
| 2-Person Families | 4,005 (51.9%) | $64,911 |
| 3-Person Families | 1,435 (18.6%) | $89,050 |
| 4-Person Families | 1,364 (17.7%) | $86,207 |
| 5-Person Families | 565 (7.3%) | $89,531 |
| 6-Person Families | 241 (3.1%) | $98,536 |
| 7+ Person Families | 110 (1.4%) | $76,025 |
| Total | 7,720 (100.0%) | $76,828 |
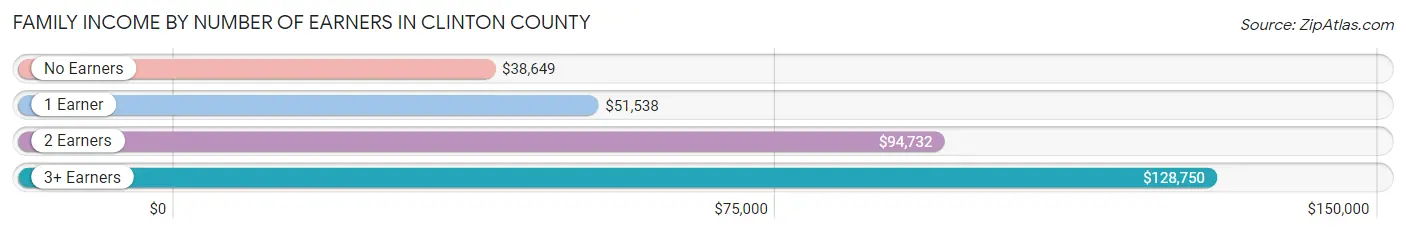
Family Income by Number of Earners in Clinton County
The median family income in Clinton County is $76,828, with families comprising 3+ earners (912) having the highest median family income of $128,750, while families with no earners (1,126) have the lowest median family income of $38,649, accounting for 11.8% and 14.6% of families, respectively.
| Number of Earners | # Families | Median Income |
| No Earners | 1,126 (14.6%) | $38,649 |
| 1 Earner | 2,436 (31.6%) | $51,538 |
| 2 Earners | 3,246 (42.0%) | $94,732 |
| 3+ Earners | 912 (11.8%) | $128,750 |
| Total | 7,720 (100.0%) | $76,828 |
Household Income in Clinton County
Household Income Brackets in Clinton County
With 2,538 households falling in the category, the $50,000 to $74,999 income range is the most frequent in Clinton County, accounting for 20.5% of all households. In contrast, only 248 households (2.0%) fall into the $10,000 to $14,999 income bracket, making it the least populous group.

| Income Bracket | # Households | % Households |
| Less than $10,000 | 384 | 3.1% |
| $10,000 to $14,999 | 248 | 2.0% |
| $15,000 to $24,999 | 1,288 | 10.4% |
| $25,000 to $34,999 | 1,176 | 9.5% |
| $35,000 to $49,999 | 1,994 | 16.1% |
| $50,000 to $74,999 | 2,538 | 20.5% |
| $75,000 to $99,999 | 1,981 | 16.0% |
| $100,000 to $149,999 | 1,919 | 15.5% |
| $150,000 to $199,999 | 532 | 4.3% |
| $200,000+ | 310 | 2.5% |
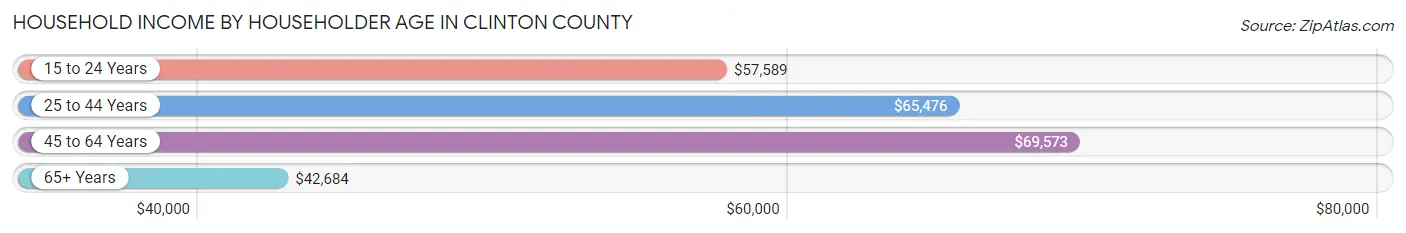
Household Income by Householder Age in Clinton County
The median household income in Clinton County is $59,515, with the highest median household income of $69,573 found in the 45 to 64 years age bracket for the primary householder. A total of 4,842 households (39.1%) fall into this category. Meanwhile, the 65+ years age bracket for the primary householder has the lowest median household income of $42,684, with 3,362 households (27.2%) in this group.
| Income Bracket | # Households | Median Income |
| 15 to 24 Years | 444 (3.6%) | $57,589 |
| 25 to 44 Years | 3,734 (30.2%) | $65,476 |
| 45 to 64 Years | 4,842 (39.1%) | $69,573 |
| 65+ Years | 3,362 (27.2%) | $42,684 |
| Total | 12,382 (100.0%) | $59,515 |
Poverty in Clinton County
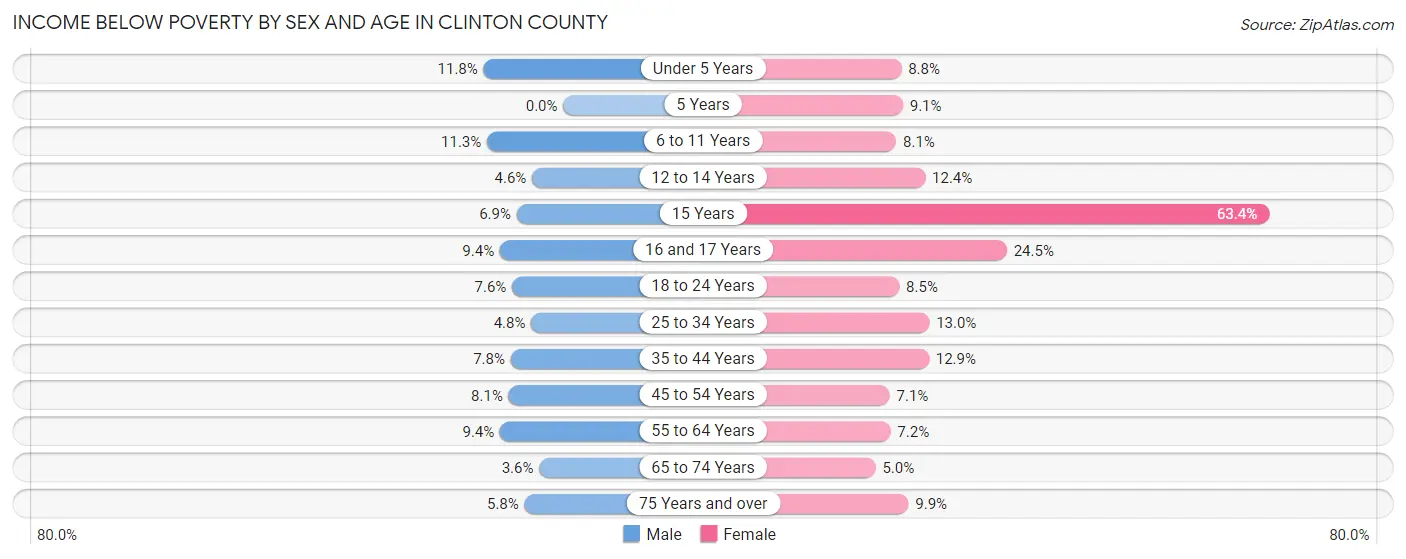
Income Below Poverty by Sex and Age in Clinton County
With 7.7% poverty level for males and 10.3% for females among the residents of Clinton County, under 5 year old males and 15 year old females are the most vulnerable to poverty, with 135 males (11.8%) and 118 females (63.4%) in their respective age groups living below the poverty level.
| Age Bracket | Male | Female |
| Under 5 Years | 135 (11.8%) | 95 (8.8%) |
| 5 Years | 0 (0.0%) | 26 (9.1%) |
| 6 to 11 Years | 186 (11.3%) | 115 (8.1%) |
| 12 to 14 Years | 34 (4.6%) | 70 (12.4%) |
| 15 Years | 27 (6.9%) | 118 (63.4%) |
| 16 and 17 Years | 45 (9.4%) | 120 (24.5%) |
| 18 to 24 Years | 110 (7.6%) | 112 (8.5%) |
| 25 to 34 Years | 92 (4.8%) | 251 (13.0%) |
| 35 to 44 Years | 152 (7.8%) | 241 (12.9%) |
| 45 to 54 Years | 165 (8.1%) | 133 (7.1%) |
| 55 to 64 Years | 198 (9.4%) | 152 (7.2%) |
| 65 to 74 Years | 51 (3.6%) | 78 (5.0%) |
| 75 Years and over | 46 (5.8%) | 125 (9.9%) |
| Total | 1,241 (7.7%) | 1,636 (10.3%) |
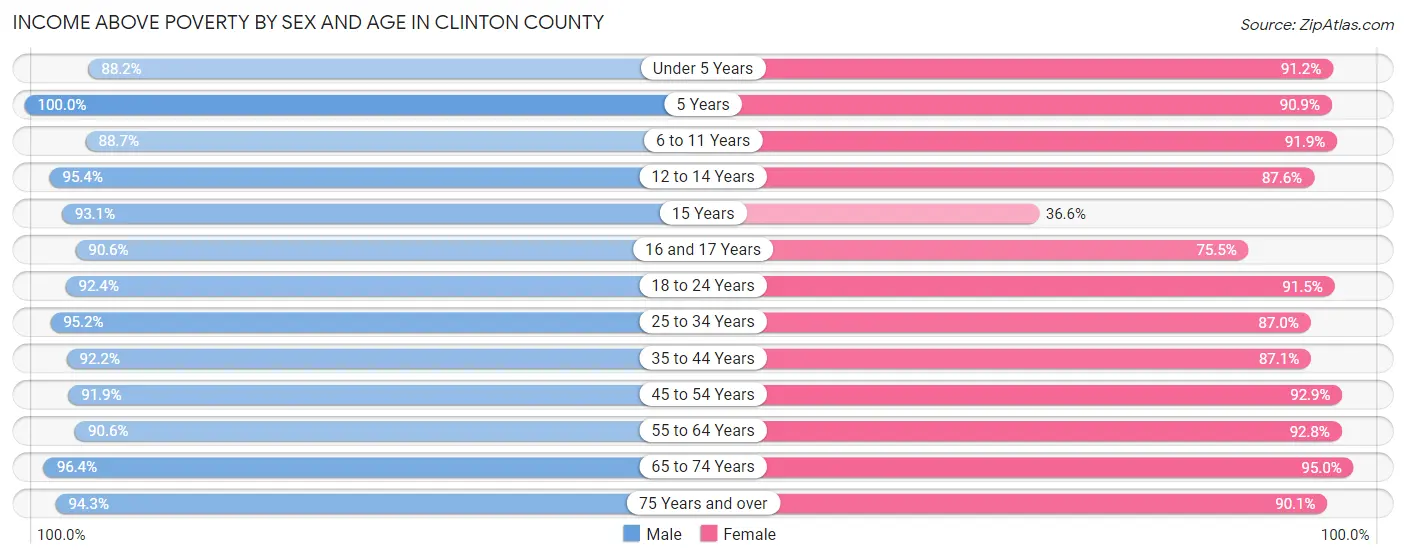
Income Above Poverty by Sex and Age in Clinton County
According to the poverty statistics in Clinton County, males aged 5 years and females aged 65 to 74 years are the age groups that are most secure financially, with 100.0% of males and 95.0% of females in these age groups living above the poverty line.
| Age Bracket | Male | Female |
| Under 5 Years | 1,005 (88.2%) | 982 (91.2%) |
| 5 Years | 93 (100.0%) | 261 (90.9%) |
| 6 to 11 Years | 1,457 (88.7%) | 1,311 (91.9%) |
| 12 to 14 Years | 701 (95.4%) | 496 (87.6%) |
| 15 Years | 364 (93.1%) | 68 (36.6%) |
| 16 and 17 Years | 433 (90.6%) | 370 (75.5%) |
| 18 to 24 Years | 1,337 (92.4%) | 1,203 (91.5%) |
| 25 to 34 Years | 1,841 (95.2%) | 1,683 (87.0%) |
| 35 to 44 Years | 1,797 (92.2%) | 1,624 (87.1%) |
| 45 to 54 Years | 1,870 (91.9%) | 1,740 (92.9%) |
| 55 to 64 Years | 1,911 (90.6%) | 1,953 (92.8%) |
| 65 to 74 Years | 1,377 (96.4%) | 1,483 (95.0%) |
| 75 Years and over | 754 (94.3%) | 1,140 (90.1%) |
| Total | 14,940 (92.3%) | 14,314 (89.7%) |
Income Below Poverty Among Married-Couple Families in Clinton County
The poverty statistics for married-couple families in Clinton County show that 3.0% or 178 of the total 5,914 families live below the poverty line. Families with 3 or 4 children have the highest poverty rate of 5.9%, comprising of 34 families. On the other hand, families with 5 or more children have the lowest poverty rate of 0.0%, which includes 0 families.

| Children | Above Poverty | Below Poverty |
| No Children | 3,400 (97.8%) | 78 (2.2%) |
| 1 or 2 Children | 1,777 (96.4%) | 66 (3.6%) |
| 3 or 4 Children | 538 (94.1%) | 34 (5.9%) |
| 5 or more Children | 21 (100.0%) | 0 (0.0%) |
| Total | 5,736 (97.0%) | 178 (3.0%) |
Income Below Poverty Among Single-Parent Households in Clinton County
According to the poverty data in Clinton County, 13.2% or 83 single-father households and 15.6% or 183 single-mother households are living below the poverty line. Among single-father households, those with no children have the highest poverty rate, with 58 households (22.4%) experiencing poverty. Likewise, among single-mother households, those with 5 or more children have the highest poverty rate, with 7 households (100.0%) falling below the poverty line.

| Children | Single Father | Single Mother |
| No Children | 58 (22.4%) | 4 (0.8%) |
| 1 or 2 Children | 25 (8.0%) | 108 (20.8%) |
| 3 or 4 Children | 0 (0.0%) | 64 (47.4%) |
| 5 or more Children | 0 (0.0%) | 7 (100.0%) |
| Total | 83 (13.2%) | 183 (15.6%) |
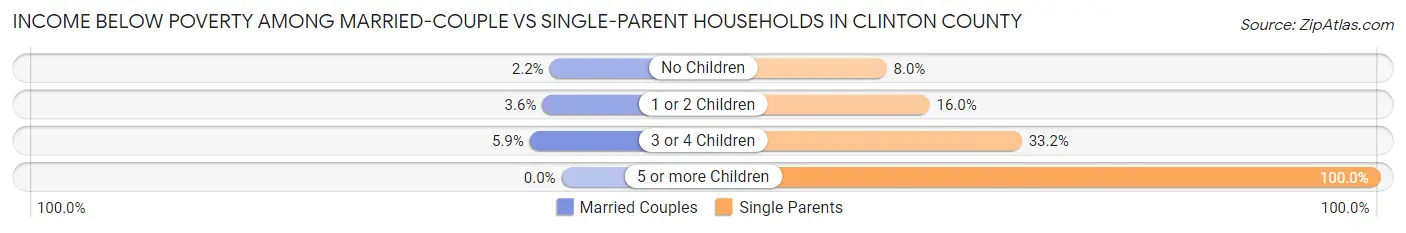
Income Below Poverty Among Married-Couple vs Single-Parent Households in Clinton County
The poverty data for Clinton County shows that 178 of the married-couple family households (3.0%) and 266 of the single-parent households (14.7%) are living below the poverty level. Within the married-couple family households, those with 3 or 4 children have the highest poverty rate, with 34 households (5.9%) falling below the poverty line. Among the single-parent households, those with 5 or more children have the highest poverty rate, with 7 household (100.0%) living below poverty.
| Children | Married-Couple Families | Single-Parent Households |
| No Children | 78 (2.2%) | 62 (8.0%) |
| 1 or 2 Children | 66 (3.6%) | 133 (16.0%) |
| 3 or 4 Children | 34 (5.9%) | 64 (33.2%) |
| 5 or more Children | 0 (0.0%) | 7 (100.0%) |
| Total | 178 (3.0%) | 266 (14.7%) |
Employment Characteristics in Clinton County
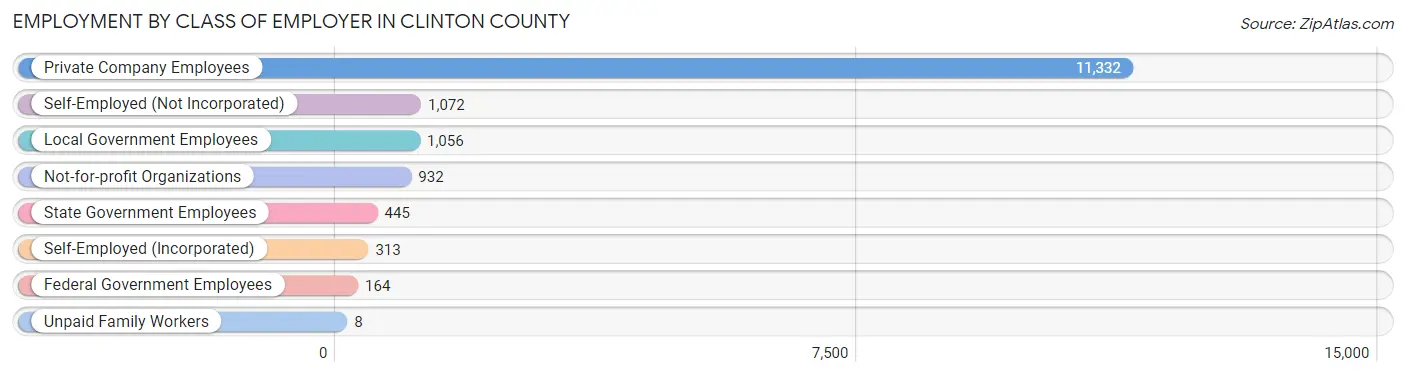
Employment by Class of Employer in Clinton County
Among the 15,322 employed individuals in Clinton County, private company employees (11,332 | 74.0%), self-employed (not incorporated) (1,072 | 7.0%), and local government employees (1,056 | 6.9%) make up the most common classes of employment.
| Employer Class | # Employees | % Employees |
| Private Company Employees | 11,332 | 74.0% |
| Self-Employed (Incorporated) | 313 | 2.0% |
| Self-Employed (Not Incorporated) | 1,072 | 7.0% |
| Not-for-profit Organizations | 932 | 6.1% |
| Local Government Employees | 1,056 | 6.9% |
| State Government Employees | 445 | 2.9% |
| Federal Government Employees | 164 | 1.1% |
| Unpaid Family Workers | 8 | 0.1% |
| Total | 15,322 | 100.0% |
Employment Status by Age in Clinton County
According to the labor force statistics for Clinton County, out of the total population over 16 years of age (25,142), 64.0% or 16,091 individuals are in the labor force, with 3.4% or 547 of them unemployed. The age group with the highest labor force participation rate is 25 to 29 years, with 86.6% or 1,678 individuals in the labor force. Within the labor force, the 20 to 24 years age range has the highest percentage of unemployed individuals, with 7.8% or 124 of them being unemployed.

| Age Bracket | In Labor Force | Unemployed |
| 16 to 19 Years | 962 (51.4%) | 71 (7.4%) |
| 20 to 24 Years | 1,588 (84.5%) | 124 (7.8%) |
| 25 to 29 Years | 1,678 (86.6%) | 72 (4.3%) |
| 30 to 34 Years | 1,583 (80.0%) | 33 (2.1%) |
| 35 to 44 Years | 3,151 (81.9%) | 91 (2.9%) |
| 45 to 54 Years | 3,379 (85.4%) | 98 (2.9%) |
| 55 to 59 Years | 1,614 (73.7%) | 26 (1.6%) |
| 60 to 64 Years | 1,199 (58.3%) | 35 (2.9%) |
| 65 to 74 Years | 784 (25.5%) | 0 (0.0%) |
| 75 Years and over | 153 (6.5%) | 0 (0.0%) |
| Total | 16,091 (64.0%) | 547 (3.4%) |
Employment Status by Educational Attainment in Clinton County
According to labor force statistics for Clinton County, 78.9% of individuals (12,599) out of the total population between 25 and 64 years of age (15,968) are in the labor force, with 2.8% or 353 of them being unemployed. The group with the highest labor force participation rate are those with the educational attainment of college / associate degree, with 86.9% or 3,897 individuals in the labor force. Within the labor force, individuals with less than high school education have the highest percentage of unemployment, with 5.6% or 74 of them being unemployed.

| Educational Attainment | In Labor Force | Unemployed |
| Less than High School | 1,328 (61.8%) | 120 (5.6%) |
| High School Diploma | 5,083 (76.1%) | 214 (3.2%) |
| College / Associate Degree | 3,897 (86.9%) | 76 (1.7%) |
| Bachelor's Degree or higher | 2,299 (86.6%) | 61 (2.3%) |
| Total | 12,599 (78.9%) | 447 (2.8%) |
Employment Occupations by Sex in Clinton County
Management, Business, Science and Arts Occupations
The most common Management, Business, Science and Arts occupations in Clinton County are Community & Social Service (1,132 | 7.3%), Management (973 | 6.3%), Education Instruction & Library (864 | 5.6%), Health Diagnosing & Treating (726 | 4.7%), and Health Technologists (539 | 3.5%).
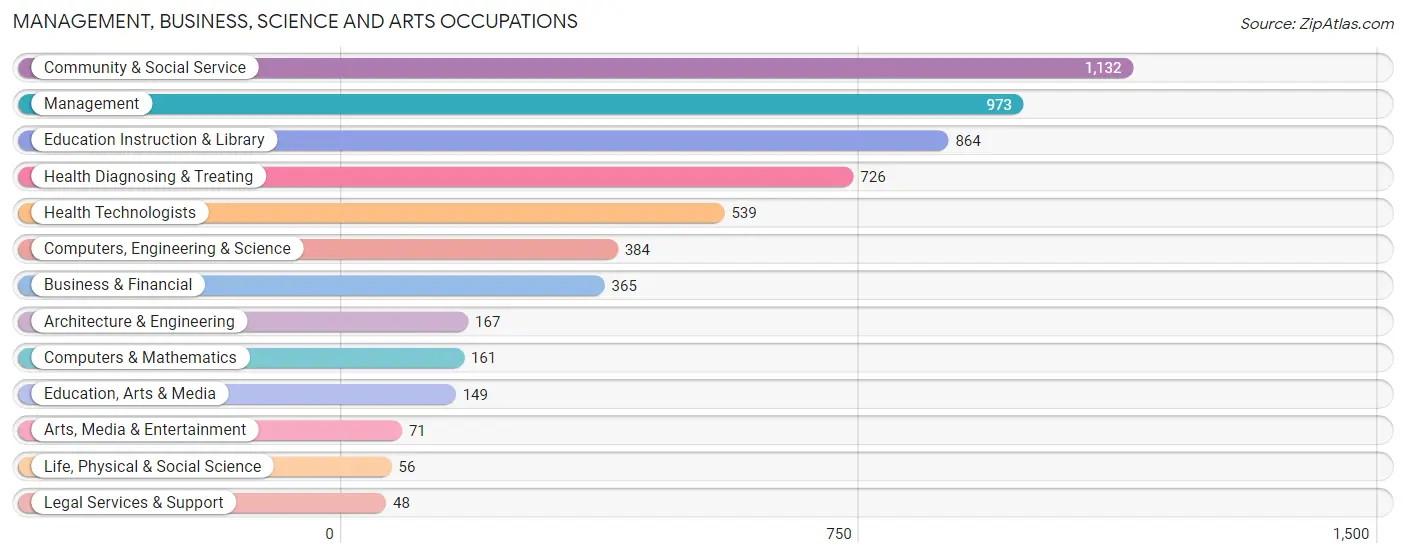
Management, Business, Science and Arts Occupations by Sex
Within the Management, Business, Science and Arts occupations in Clinton County, the most male-oriented occupations are Architecture & Engineering (95.2%), Computers, Engineering & Science (81.8%), and Computers & Mathematics (78.9%), while the most female-oriented occupations are Health Diagnosing & Treating (87.7%), Health Technologists (85.7%), and Business & Financial (85.5%).

| Occupation | Male | Female |
| Management | 689 (70.8%) | 284 (29.2%) |
| Business & Financial | 53 (14.5%) | 312 (85.5%) |
| Computers, Engineering & Science | 314 (81.8%) | 70 (18.2%) |
| Computers & Mathematics | 127 (78.9%) | 34 (21.1%) |
| Architecture & Engineering | 159 (95.2%) | 8 (4.8%) |
| Life, Physical & Social Science | 28 (50.0%) | 28 (50.0%) |
| Community & Social Service | 258 (22.8%) | 874 (77.2%) |
| Education, Arts & Media | 40 (26.9%) | 109 (73.2%) |
| Legal Services & Support | 16 (33.3%) | 32 (66.7%) |
| Education Instruction & Library | 189 (21.9%) | 675 (78.1%) |
| Arts, Media & Entertainment | 13 (18.3%) | 58 (81.7%) |
| Health Diagnosing & Treating | 89 (12.3%) | 637 (87.7%) |
| Health Technologists | 77 (14.3%) | 462 (85.7%) |
| Total (Category) | 1,403 (39.2%) | 2,177 (60.8%) |
| Total (Overall) | 8,357 (53.8%) | 7,167 (46.2%) |
Services Occupations
The most common Services occupations in Clinton County are Food Preparation & Serving (810 | 5.2%), Cleaning & Maintenance (651 | 4.2%), Healthcare Support (523 | 3.4%), Security & Protection (302 | 1.9%), and Personal Care & Service (290 | 1.9%).

Services Occupations by Sex
Within the Services occupations in Clinton County, the most male-oriented occupations are Law Enforcement (100.0%), Cleaning & Maintenance (75.4%), and Security & Protection (75.2%), while the most female-oriented occupations are Healthcare Support (96.6%), Personal Care & Service (72.4%), and Food Preparation & Serving (61.4%).

| Occupation | Male | Female |
| Healthcare Support | 18 (3.4%) | 505 (96.6%) |
| Security & Protection | 227 (75.2%) | 75 (24.8%) |
| Firefighting & Prevention | 102 (57.6%) | 75 (42.4%) |
| Law Enforcement | 125 (100.0%) | 0 (0.0%) |
| Food Preparation & Serving | 313 (38.6%) | 497 (61.4%) |
| Cleaning & Maintenance | 491 (75.4%) | 160 (24.6%) |
| Personal Care & Service | 80 (27.6%) | 210 (72.4%) |
| Total (Category) | 1,129 (43.8%) | 1,447 (56.2%) |
| Total (Overall) | 8,357 (53.8%) | 7,167 (46.2%) |
Sales and Office Occupations
The most common Sales and Office occupations in Clinton County are Office & Administration (1,530 | 9.9%), and Sales & Related (993 | 6.4%).
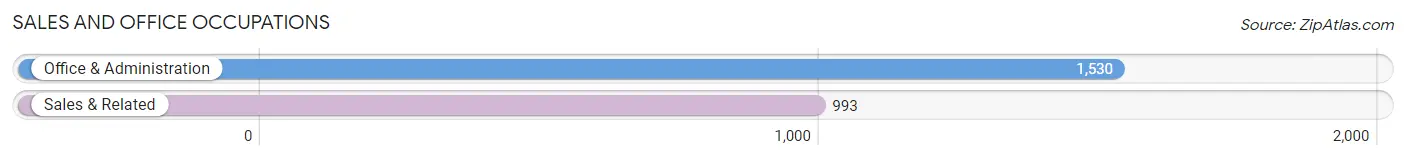
Sales and Office Occupations by Sex

| Occupation | Male | Female |
| Sales & Related | 425 (42.8%) | 568 (57.2%) |
| Office & Administration | 299 (19.5%) | 1,231 (80.5%) |
| Total (Category) | 724 (28.7%) | 1,799 (71.3%) |
| Total (Overall) | 8,357 (53.8%) | 7,167 (46.2%) |
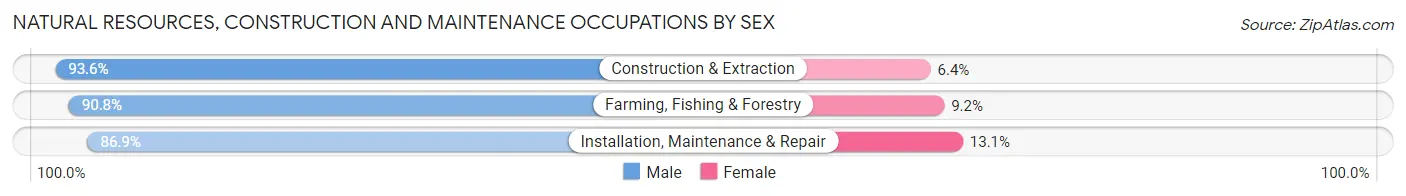
Natural Resources, Construction and Maintenance Occupations
The most common Natural Resources, Construction and Maintenance occupations in Clinton County are Construction & Extraction (1,018 | 6.6%), Installation, Maintenance & Repair (1,015 | 6.5%), and Farming, Fishing & Forestry (217 | 1.4%).

Natural Resources, Construction and Maintenance Occupations by Sex
| Occupation | Male | Female |
| Farming, Fishing & Forestry | 197 (90.8%) | 20 (9.2%) |
| Construction & Extraction | 953 (93.6%) | 65 (6.4%) |
| Installation, Maintenance & Repair | 882 (86.9%) | 133 (13.1%) |
| Total (Category) | 2,032 (90.3%) | 218 (9.7%) |
| Total (Overall) | 8,357 (53.8%) | 7,167 (46.2%) |
Production, Transportation and Moving Occupations
The most common Production, Transportation and Moving occupations in Clinton County are Production (2,502 | 16.1%), Material Moving (1,411 | 9.1%), and Transportation (682 | 4.4%).
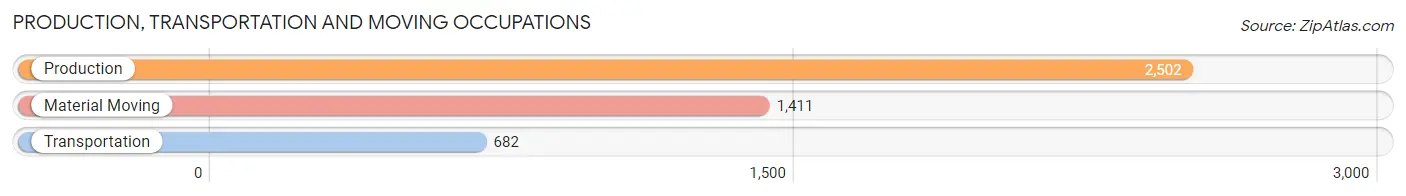
Production, Transportation and Moving Occupations by Sex
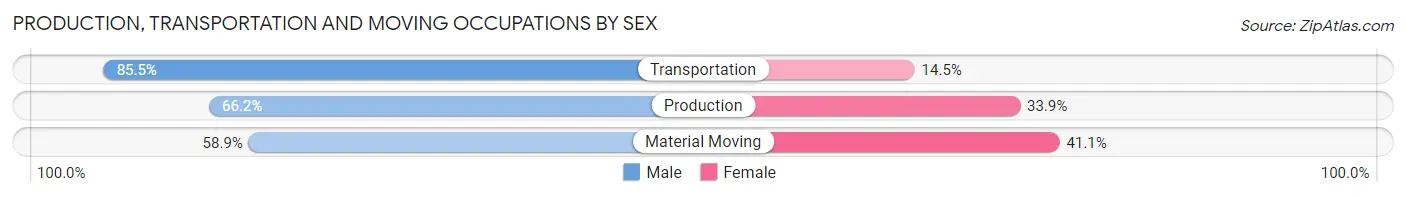
| Occupation | Male | Female |
| Production | 1,655 (66.1%) | 847 (33.9%) |
| Transportation | 583 (85.5%) | 99 (14.5%) |
| Material Moving | 831 (58.9%) | 580 (41.1%) |
| Total (Category) | 3,069 (66.8%) | 1,526 (33.2%) |
| Total (Overall) | 8,357 (53.8%) | 7,167 (46.2%) |
Employment Industries by Sex in Clinton County
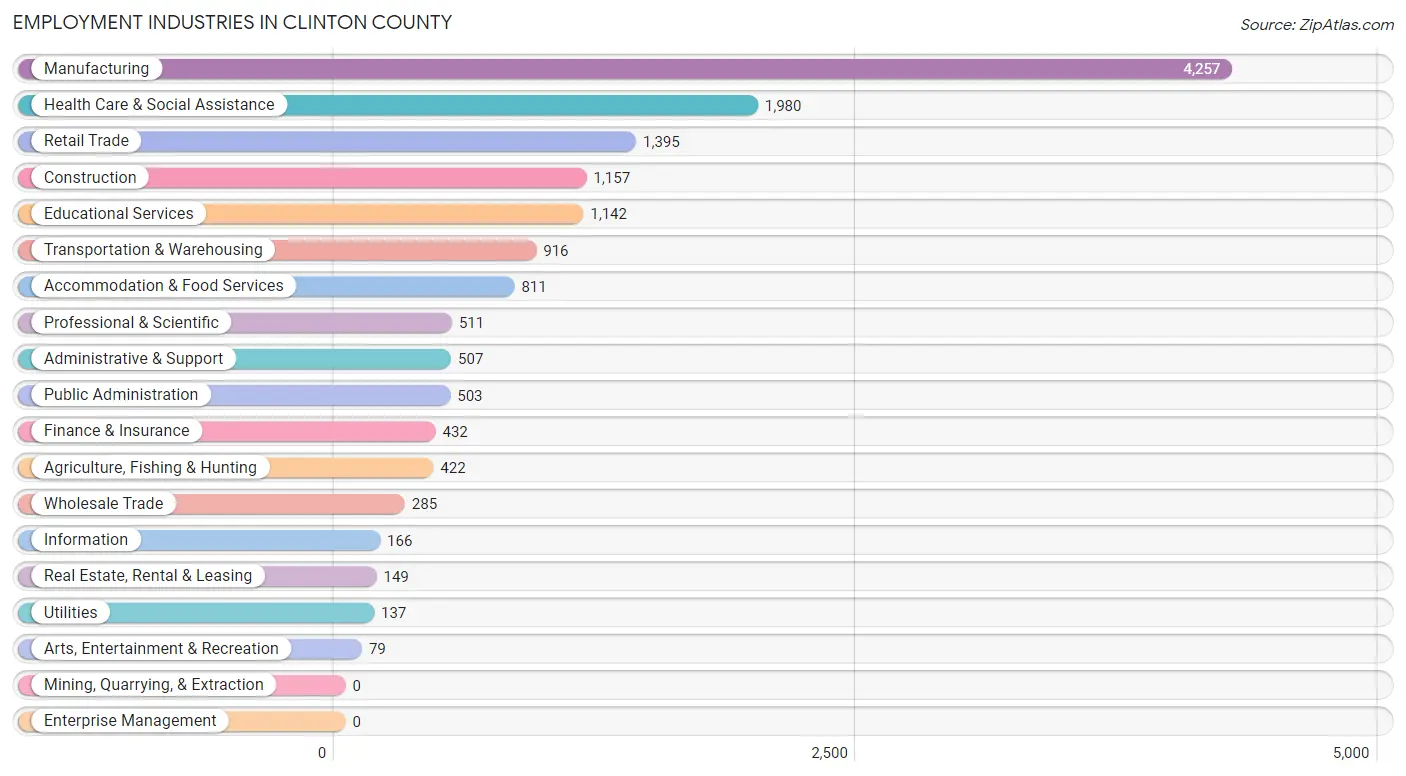
Employment Industries in Clinton County
The major employment industries in Clinton County include Manufacturing (4,257 | 27.4%), Health Care & Social Assistance (1,980 | 12.8%), Retail Trade (1,395 | 9.0%), Construction (1,157 | 7.4%), and Educational Services (1,142 | 7.4%).
Employment Industries by Sex in Clinton County
The Clinton County industries that see more men than women are Construction (91.6%), Utilities (91.2%), and Agriculture, Fishing & Hunting (84.4%), whereas the industries that tend to have a higher number of women are Health Care & Social Assistance (88.1%), Educational Services (80.8%), and Retail Trade (60.5%).

| Industry | Male | Female |
| Agriculture, Fishing & Hunting | 356 (84.4%) | 66 (15.6%) |
| Mining, Quarrying, & Extraction | 0 (0.0%) | 0 (0.0%) |
| Construction | 1,060 (91.6%) | 97 (8.4%) |
| Manufacturing | 2,879 (67.6%) | 1,378 (32.4%) |
| Wholesale Trade | 240 (84.2%) | 45 (15.8%) |
| Retail Trade | 551 (39.5%) | 844 (60.5%) |
| Transportation & Warehousing | 660 (72.1%) | 256 (28.0%) |
| Utilities | 125 (91.2%) | 12 (8.8%) |
| Information | 66 (39.8%) | 100 (60.2%) |
| Finance & Insurance | 178 (41.2%) | 254 (58.8%) |
| Real Estate, Rental & Leasing | 93 (62.4%) | 56 (37.6%) |
| Professional & Scientific | 209 (40.9%) | 302 (59.1%) |
| Enterprise Management | 0 (0.0%) | 0 (0.0%) |
| Administrative & Support | 324 (63.9%) | 183 (36.1%) |
| Educational Services | 219 (19.2%) | 923 (80.8%) |
| Health Care & Social Assistance | 236 (11.9%) | 1,744 (88.1%) |
| Arts, Entertainment & Recreation | 44 (55.7%) | 35 (44.3%) |
| Accommodation & Food Services | 437 (53.9%) | 374 (46.1%) |
| Public Administration | 278 (55.3%) | 225 (44.7%) |
| Total | 8,357 (53.8%) | 7,167 (46.2%) |
Education in Clinton County
School Enrollment in Clinton County
The most common levels of schooling among the 8,188 students in Clinton County are high school (2,340 | 28.6%), elementary school (2,056 | 25.1%), and middle school (1,852 | 22.6%).

| School Level | # Students | % Students |
| Nursery / Preschool | 359 | 4.4% |
| Kindergarten | 495 | 6.0% |
| Elementary School | 2,056 | 25.1% |
| Middle School | 1,852 | 22.6% |
| High School | 2,340 | 28.6% |
| College / Undergraduate | 1,010 | 12.3% |
| Graduate / Professional | 76 | 0.9% |
| Total | 8,188 | 100.0% |
School Enrollment by Age by Funding Source in Clinton County
Out of a total of 8,188 students who are enrolled in schools in Clinton County, 647 (7.9%) attend a private institution, while the remaining 7,541 (92.1%) are enrolled in public schools. The age group of 3 to 4 year olds has the highest likelihood of being enrolled in private schools, with 86 (28.7% in the age bracket) enrolled. Conversely, the age group of 18 to 19 year olds has the lowest likelihood of being enrolled in a private school, with 699 (97.4% in the age bracket) attending a public institution.

| Age Bracket | Public School | Private School |
| 3 to 4 Year Olds | 214 (71.3%) | 86 (28.7%) |
| 5 to 9 Year Old | 2,255 (93.2%) | 164 (6.8%) |
| 10 to 14 Year Olds | 2,078 (90.5%) | 217 (9.5%) |
| 15 to 17 Year Olds | 1,452 (94.0%) | 93 (6.0%) |
| 18 to 19 Year Olds | 699 (97.4%) | 19 (2.6%) |
| 20 to 24 Year Olds | 478 (92.1%) | 41 (7.9%) |
| 25 to 34 Year Olds | 207 (93.7%) | 14 (6.3%) |
| 35 Years and over | 155 (90.6%) | 16 (9.4%) |
| Total | 7,541 (92.1%) | 647 (7.9%) |
Educational Attainment by Field of Study in Clinton County
Education (859 | 23.5%), business (551 | 15.1%), science & technology (486 | 13.3%), bio, nature & agricultural (343 | 9.4%), and arts & humanities (275 | 7.5%) are the most common fields of study among 3,658 individuals in Clinton County who have obtained a bachelor's degree or higher.

| Field of Study | # Graduates | % Graduates |
| Computers & Mathematics | 35 | 1.0% |
| Bio, Nature & Agricultural | 343 | 9.4% |
| Physical & Health Sciences | 83 | 2.3% |
| Psychology | 154 | 4.2% |
| Social Sciences | 260 | 7.1% |
| Engineering | 129 | 3.5% |
| Multidisciplinary Studies | 14 | 0.4% |
| Science & Technology | 486 | 13.3% |
| Business | 551 | 15.1% |
| Education | 859 | 23.5% |
| Literature & Languages | 95 | 2.6% |
| Liberal Arts & History | 208 | 5.7% |
| Visual & Performing Arts | 99 | 2.7% |
| Communications | 67 | 1.8% |
| Arts & Humanities | 275 | 7.5% |
| Total | 3,658 | 100.0% |
Transportation & Commute in Clinton County
Vehicle Availability by Sex in Clinton County
The most prevalent vehicle ownership categories in Clinton County are males with 2 vehicles (3,146, accounting for 38.1%) and females with 2 vehicles (2,530, making up 44.6%).

| Vehicles Available | Male | Female |
| No Vehicle | 141 (1.7%) | 63 (0.9%) |
| 1 Vehicle | 956 (11.6%) | 1,185 (16.8%) |
| 2 Vehicles | 3,146 (38.1%) | 2,530 (35.8%) |
| 3 Vehicles | 2,200 (26.7%) | 1,939 (27.5%) |
| 4 Vehicles | 1,133 (13.7%) | 986 (14.0%) |
| 5 or more Vehicles | 676 (8.2%) | 354 (5.0%) |
| Total | 8,252 (100.0%) | 7,057 (100.0%) |
Commute Time in Clinton County
The most frequently occuring commute durations in Clinton County are 10 to 14 minutes (2,573 commuters, 17.8%), 30 to 34 minutes (1,825 commuters, 12.7%), and 5 to 9 minutes (1,788 commuters, 12.4%).

| Commute Time | # Commuters | % Commuters |
| Less than 5 Minutes | 831 | 5.8% |
| 5 to 9 Minutes | 1,788 | 12.4% |
| 10 to 14 Minutes | 2,573 | 17.8% |
| 15 to 19 Minutes | 1,752 | 12.1% |
| 20 to 24 Minutes | 1,786 | 12.4% |
| 25 to 29 Minutes | 1,628 | 11.3% |
| 30 to 34 Minutes | 1,825 | 12.7% |
| 35 to 39 Minutes | 458 | 3.2% |
| 40 to 44 Minutes | 412 | 2.9% |
| 45 to 59 Minutes | 1,048 | 7.3% |
| 60 to 89 Minutes | 298 | 2.1% |
| 90 or more Minutes | 32 | 0.2% |
Commute Time by Sex in Clinton County
The most common commute times in Clinton County are 10 to 14 minutes (1,278 commuters, 16.4%) for males and 10 to 14 minutes (1,295 commuters, 19.6%) for females.
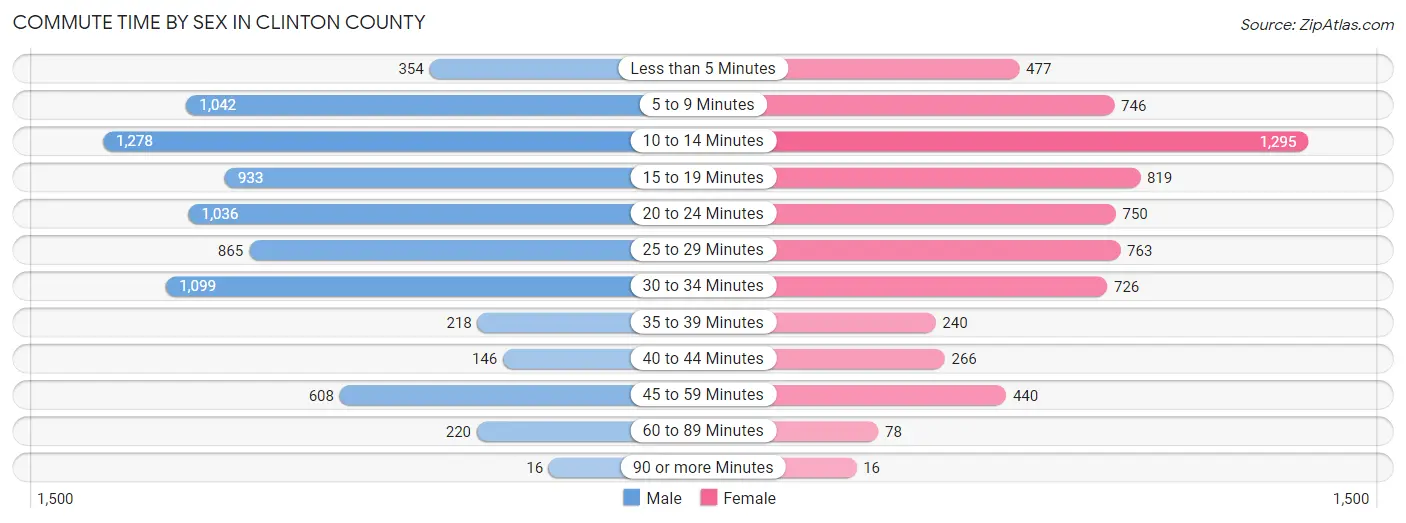
| Commute Time | Male | Female |
| Less than 5 Minutes | 354 (4.5%) | 477 (7.2%) |
| 5 to 9 Minutes | 1,042 (13.3%) | 746 (11.3%) |
| 10 to 14 Minutes | 1,278 (16.4%) | 1,295 (19.6%) |
| 15 to 19 Minutes | 933 (11.9%) | 819 (12.4%) |
| 20 to 24 Minutes | 1,036 (13.3%) | 750 (11.3%) |
| 25 to 29 Minutes | 865 (11.1%) | 763 (11.5%) |
| 30 to 34 Minutes | 1,099 (14.1%) | 726 (11.0%) |
| 35 to 39 Minutes | 218 (2.8%) | 240 (3.6%) |
| 40 to 44 Minutes | 146 (1.9%) | 266 (4.0%) |
| 45 to 59 Minutes | 608 (7.8%) | 440 (6.7%) |
| 60 to 89 Minutes | 220 (2.8%) | 78 (1.2%) |
| 90 or more Minutes | 16 (0.2%) | 16 (0.2%) |
Time of Departure to Work by Sex in Clinton County
The most frequent times of departure to work in Clinton County are 7:00 AM to 7:29 AM (1,255, 16.1%) for males and 7:30 AM to 7:59 AM (1,038, 15.7%) for females.

| Time of Departure | Male | Female |
| 12:00 AM to 4:59 AM | 549 (7.0%) | 505 (7.6%) |
| 5:00 AM to 5:29 AM | 582 (7.4%) | 365 (5.5%) |
| 5:30 AM to 5:59 AM | 710 (9.1%) | 322 (4.9%) |
| 6:00 AM to 6:29 AM | 824 (10.5%) | 555 (8.4%) |
| 6:30 AM to 6:59 AM | 768 (9.8%) | 382 (5.8%) |
| 7:00 AM to 7:29 AM | 1,255 (16.1%) | 856 (12.9%) |
| 7:30 AM to 7:59 AM | 708 (9.1%) | 1,038 (15.7%) |
| 8:00 AM to 8:29 AM | 469 (6.0%) | 493 (7.4%) |
| 8:30 AM to 8:59 AM | 148 (1.9%) | 328 (5.0%) |
| 9:00 AM to 9:59 AM | 162 (2.1%) | 377 (5.7%) |
| 10:00 AM to 10:59 AM | 55 (0.7%) | 143 (2.2%) |
| 11:00 AM to 11:59 AM | 11 (0.1%) | 68 (1.0%) |
| 12:00 PM to 3:59 PM | 618 (7.9%) | 484 (7.3%) |
| 4:00 PM to 11:59 PM | 956 (12.2%) | 700 (10.6%) |
| Total | 7,815 (100.0%) | 6,616 (100.0%) |
Housing Occupancy in Clinton County
Occupancy by Ownership in Clinton County
Of the total 12,382 dwellings in Clinton County, owner-occupied units account for 9,001 (72.7%), while renter-occupied units make up 3,381 (27.3%).

| Occupancy | # Housing Units | % Housing Units |
| Owner Occupied Housing Units | 9,001 | 72.7% |
| Renter-Occupied Housing Units | 3,381 | 27.3% |
| Total Occupied Housing Units | 12,382 | 100.0% |
Occupancy by Household Size in Clinton County
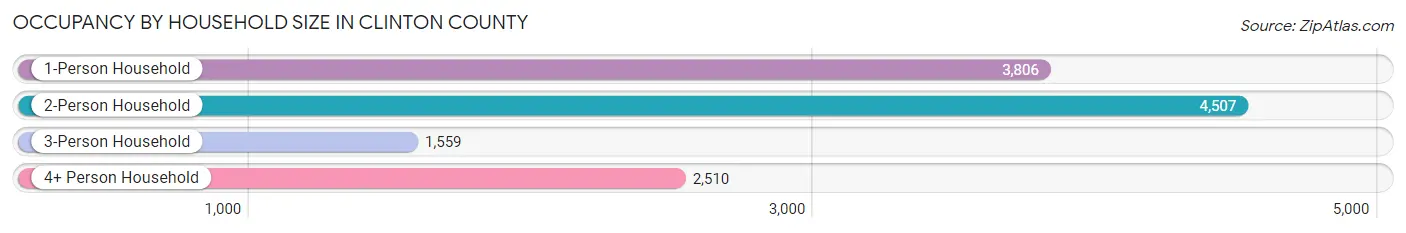
| Household Size | # Housing Units | % Housing Units |
| 1-Person Household | 3,806 | 30.7% |
| 2-Person Household | 4,507 | 36.4% |
| 3-Person Household | 1,559 | 12.6% |
| 4+ Person Household | 2,510 | 20.3% |
| Total Housing Units | 12,382 | 100.0% |
Occupancy by Ownership by Household Size in Clinton County

| Household Size | Owner-occupied | Renter-occupied |
| 1-Person Household | 2,284 (60.0%) | 1,522 (40.0%) |
| 2-Person Household | 3,698 (82.1%) | 809 (17.9%) |
| 3-Person Household | 1,121 (71.9%) | 438 (28.1%) |
| 4+ Person Household | 1,898 (75.6%) | 612 (24.4%) |
| Total Housing Units | 9,001 (72.7%) | 3,381 (27.3%) |
Occupancy by Educational Attainment in Clinton County
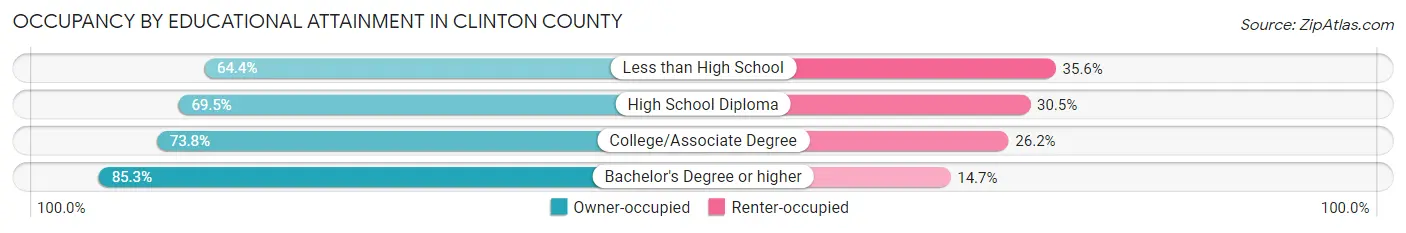
| Household Size | Owner-occupied | Renter-occupied |
| Less than High School | 1,032 (64.4%) | 570 (35.6%) |
| High School Diploma | 3,646 (69.5%) | 1,601 (30.5%) |
| College/Associate Degree | 2,541 (73.8%) | 903 (26.2%) |
| Bachelor's Degree or higher | 1,782 (85.3%) | 307 (14.7%) |
Occupancy by Age of Householder in Clinton County

| Age Bracket | # Households | % Households |
| Under 35 Years | 2,201 | 17.8% |
| 35 to 44 Years | 1,977 | 16.0% |
| 45 to 54 Years | 2,217 | 17.9% |
| 55 to 64 Years | 2,625 | 21.2% |
| 65 to 74 Years | 1,925 | 15.5% |
| 75 to 84 Years | 953 | 7.7% |
| 85 Years and Over | 484 | 3.9% |
| Total | 12,382 | 100.0% |
Housing Finances in Clinton County
Median Income by Occupancy in Clinton County
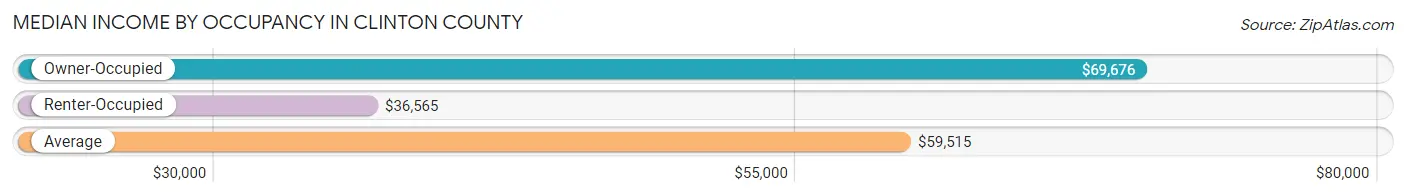
| Occupancy Type | # Households | Median Income |
| Owner-Occupied | 9,001 (72.7%) | $69,676 |
| Renter-Occupied | 3,381 (27.3%) | $36,565 |
| Average | 12,382 (100.0%) | $59,515 |
Occupancy by Householder Income Bracket in Clinton County

| Income Bracket | Owner-occupied | Renter-occupied |
| Less than $5,000 | 158 (1.8%) | 114 (3.4%) |
| $5,000 to $9,999 | 37 (0.4%) | 72 (2.1%) |
| $10,000 to $14,999 | 97 (1.1%) | 155 (4.6%) |
| $15,000 to $19,999 | 288 (3.2%) | 308 (9.1%) |
| $20,000 to $24,999 | 412 (4.6%) | 278 (8.2%) |
| $25,000 to $34,999 | 556 (6.2%) | 622 (18.4%) |
| $35,000 to $49,999 | 1,376 (15.3%) | 619 (18.3%) |
| $50,000 to $74,999 | 1,869 (20.8%) | 675 (20.0%) |
| $75,000 to $99,999 | 1,563 (17.4%) | 419 (12.4%) |
| $100,000 to $149,999 | 1,814 (20.2%) | 101 (3.0%) |
| $150,000 or more | 831 (9.2%) | 18 (0.5%) |
| Total | 9,001 (100.0%) | 3,381 (100.0%) |
Monthly Housing Cost Tiers in Clinton County

| Monthly Cost | Owner-occupied | Renter-occupied |
| Less than $300 | 802 (8.9%) | 42 (1.2%) |
| $300 to $499 | 1,812 (20.1%) | 216 (6.4%) |
| $500 to $799 | 1,750 (19.4%) | 1,183 (35.0%) |
| $800 to $999 | 1,270 (14.1%) | 829 (24.5%) |
| $1,000 to $1,499 | 2,263 (25.1%) | 956 (28.3%) |
| $1,500 to $1,999 | 680 (7.5%) | 10 (0.3%) |
| $2,000 to $2,499 | 232 (2.6%) | 0 (0.0%) |
| $2,500 to $2,999 | 162 (1.8%) | 0 (0.0%) |
| $3,000 or more | 30 (0.3%) | 0 (0.0%) |
| Total | 9,001 (100.0%) | 3,381 (100.0%) |
Physical Housing Characteristics in Clinton County
Housing Structures in Clinton County
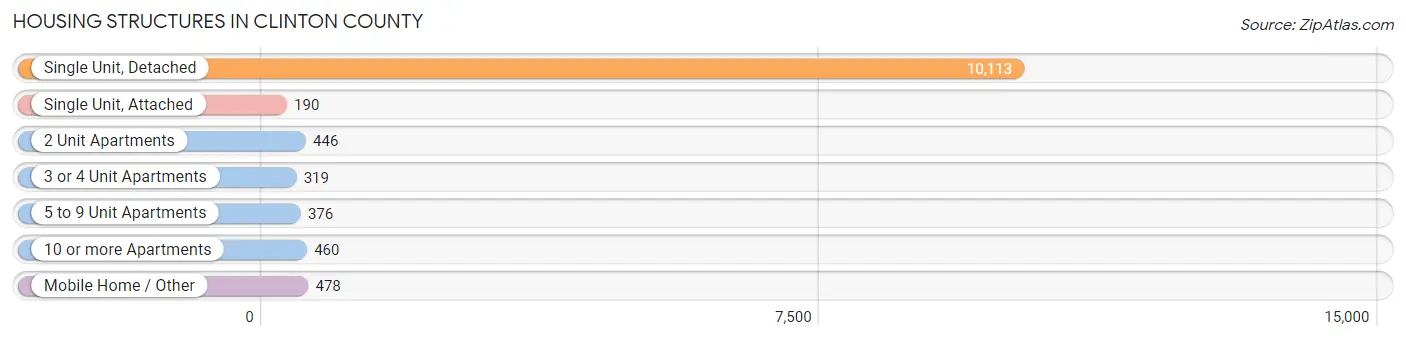
| Structure Type | # Housing Units | % Housing Units |
| Single Unit, Detached | 10,113 | 81.7% |
| Single Unit, Attached | 190 | 1.5% |
| 2 Unit Apartments | 446 | 3.6% |
| 3 or 4 Unit Apartments | 319 | 2.6% |
| 5 to 9 Unit Apartments | 376 | 3.0% |
| 10 or more Apartments | 460 | 3.7% |
| Mobile Home / Other | 478 | 3.9% |
| Total | 12,382 | 100.0% |
Housing Structures by Occupancy in Clinton County

| Structure Type | Owner-occupied | Renter-occupied |
| Single Unit, Detached | 8,512 (84.2%) | 1,601 (15.8%) |
| Single Unit, Attached | 107 (56.3%) | 83 (43.7%) |
| 2 Unit Apartments | 31 (7.0%) | 415 (93.0%) |
| 3 or 4 Unit Apartments | 18 (5.6%) | 301 (94.4%) |
| 5 to 9 Unit Apartments | 12 (3.2%) | 364 (96.8%) |
| 10 or more Apartments | 0 (0.0%) | 460 (100.0%) |
| Mobile Home / Other | 321 (67.1%) | 157 (32.9%) |
| Total | 9,001 (72.7%) | 3,381 (27.3%) |
Housing Structures by Number of Rooms in Clinton County

| Number of Rooms | Owner-occupied | Renter-occupied |
| 1 Room | 31 (0.3%) | 103 (3.0%) |
| 2 or 3 Rooms | 59 (0.7%) | 724 (21.4%) |
| 4 or 5 Rooms | 1,860 (20.7%) | 1,300 (38.5%) |
| 6 or 7 Rooms | 4,193 (46.6%) | 972 (28.7%) |
| 8 or more Rooms | 2,858 (31.8%) | 282 (8.3%) |
| Total | 9,001 (100.0%) | 3,381 (100.0%) |
Housing Structure by Heating Type in Clinton County
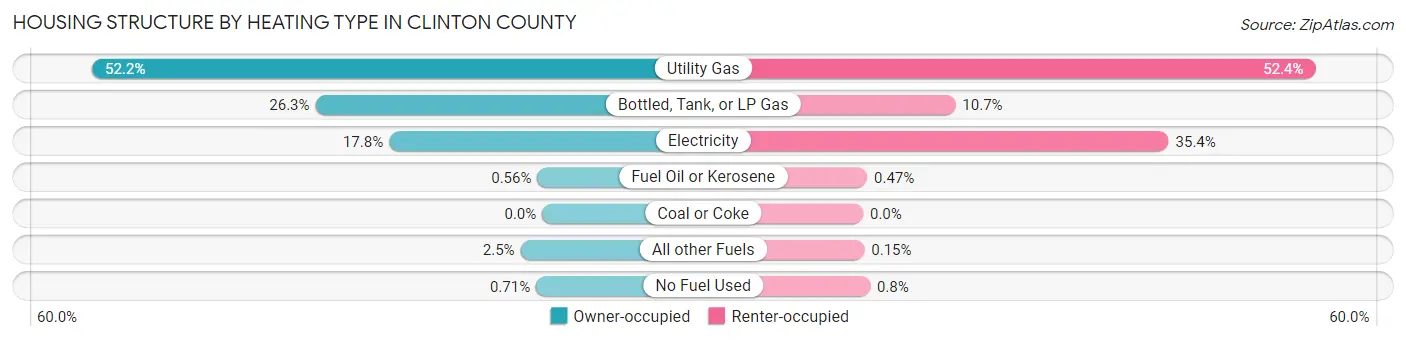
| Heating Type | Owner-occupied | Renter-occupied |
| Utility Gas | 4,697 (52.2%) | 1,773 (52.4%) |
| Bottled, Tank, or LP Gas | 2,366 (26.3%) | 362 (10.7%) |
| Electricity | 1,598 (17.7%) | 1,198 (35.4%) |
| Fuel Oil or Kerosene | 50 (0.6%) | 16 (0.5%) |
| Coal or Coke | 0 (0.0%) | 0 (0.0%) |
| All other Fuels | 226 (2.5%) | 5 (0.2%) |
| No Fuel Used | 64 (0.7%) | 27 (0.8%) |
| Total | 9,001 (100.0%) | 3,381 (100.0%) |
Household Vehicle Usage in Clinton County

| Vehicles per Household | Owner-occupied | Renter-occupied |
| No Vehicle | 186 (2.1%) | 412 (12.2%) |
| 1 Vehicle | 1,833 (20.4%) | 1,565 (46.3%) |
| 2 Vehicles | 3,870 (43.0%) | 827 (24.5%) |
| 3 or more Vehicles | 3,112 (34.6%) | 577 (17.1%) |
| Total | 9,001 (100.0%) | 3,381 (100.0%) |
Real Estate & Mortgages in Clinton County
Real Estate and Mortgage Overview in Clinton County
| Characteristic | Without Mortgage | With Mortgage |
| Housing Units | 3,633 | 5,368 |
| Median Property Value | $126,000 | $147,200 |
| Median Household Income | $52,491 | $540 |
| Monthly Housing Costs | $418 | $30 |
| Real Estate Taxes | $972 | $87 |
Property Value by Mortgage Status in Clinton County
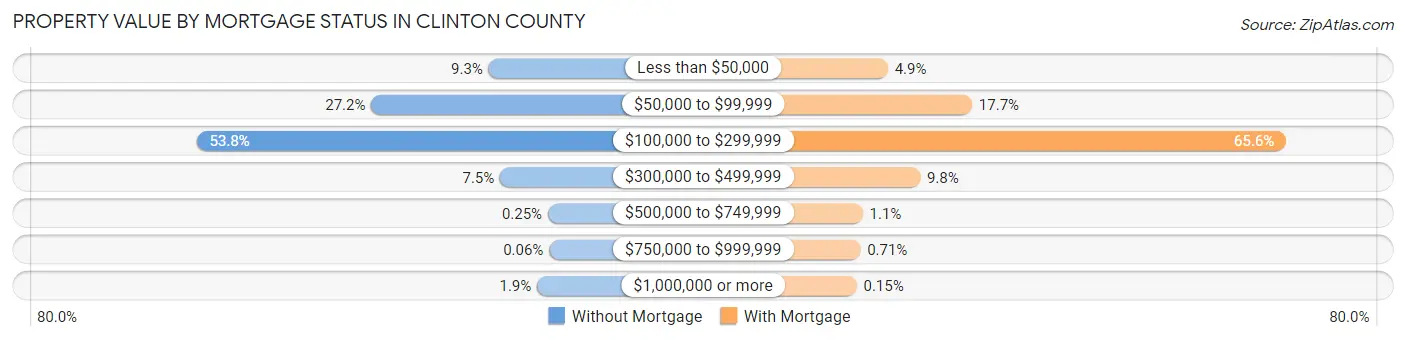
| Property Value | Without Mortgage | With Mortgage |
| Less than $50,000 | 337 (9.3%) | 263 (4.9%) |
| $50,000 to $99,999 | 987 (27.2%) | 952 (17.7%) |
| $100,000 to $299,999 | 1,955 (53.8%) | 3,522 (65.6%) |
| $300,000 to $499,999 | 274 (7.5%) | 527 (9.8%) |
| $500,000 to $749,999 | 9 (0.3%) | 58 (1.1%) |
| $750,000 to $999,999 | 2 (0.1%) | 38 (0.7%) |
| $1,000,000 or more | 69 (1.9%) | 8 (0.2%) |
| Total | 3,633 (100.0%) | 5,368 (100.0%) |
Household Income by Mortgage Status in Clinton County
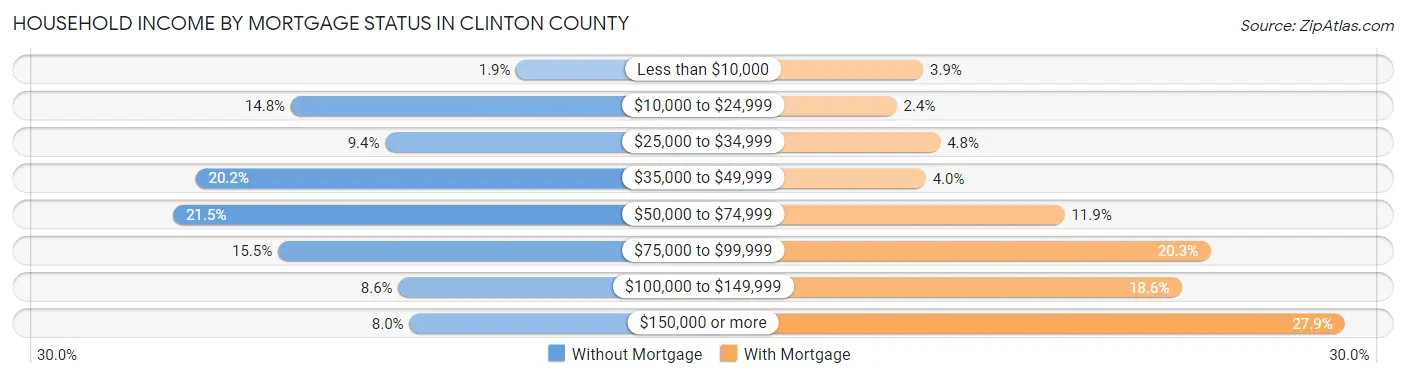
| Household Income | Without Mortgage | With Mortgage |
| Less than $10,000 | 69 (1.9%) | 207 (3.9%) |
| $10,000 to $24,999 | 537 (14.8%) | 126 (2.4%) |
| $25,000 to $34,999 | 341 (9.4%) | 260 (4.8%) |
| $35,000 to $49,999 | 735 (20.2%) | 215 (4.0%) |
| $50,000 to $74,999 | 782 (21.5%) | 641 (11.9%) |
| $75,000 to $99,999 | 564 (15.5%) | 1,087 (20.3%) |
| $100,000 to $149,999 | 314 (8.6%) | 999 (18.6%) |
| $150,000 or more | 291 (8.0%) | 1,500 (27.9%) |
| Total | 3,633 (100.0%) | 5,368 (100.0%) |
Property Value to Household Income Ratio in Clinton County
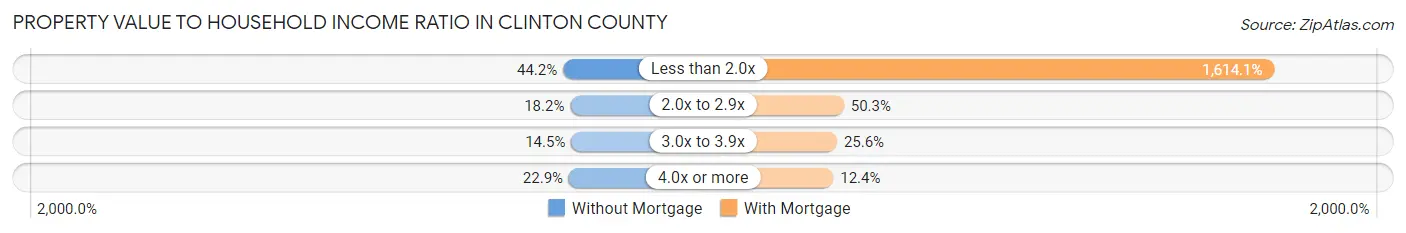
| Value-to-Income Ratio | Without Mortgage | With Mortgage |
| Less than 2.0x | 1,605 (44.2%) | 86,642 (1,614.0%) |
| 2.0x to 2.9x | 661 (18.2%) | 2,698 (50.3%) |
| 3.0x to 3.9x | 525 (14.4%) | 1,372 (25.6%) |
| 4.0x or more | 830 (22.9%) | 663 (12.3%) |
| Total | 3,633 (100.0%) | 5,368 (100.0%) |
Real Estate Taxes by Mortgage Status in Clinton County

| Property Taxes | Without Mortgage | With Mortgage |
| Less than $800 | 1,559 (42.9%) | 64 (1.2%) |
| $800 to $1,499 | 1,230 (33.9%) | 2,127 (39.6%) |
| $800 to $1,499 | 723 (19.9%) | 1,849 (34.4%) |
| Total | 3,633 (100.0%) | 5,368 (100.0%) |
Health & Disability in Clinton County
Health Insurance Coverage by Age in Clinton County

| Age Bracket | With Coverage | Without Coverage |
| Under 6 Years | 2,689 (95.1%) | 138 (4.9%) |
| 6 to 18 Years | 6,321 (95.1%) | 323 (4.9%) |
| 19 to 25 Years | 2,143 (84.1%) | 406 (15.9%) |
| 26 to 34 Years | 2,767 (80.5%) | 671 (19.5%) |
| 35 to 44 Years | 3,353 (87.9%) | 461 (12.1%) |
| 45 to 54 Years | 3,540 (90.6%) | 368 (9.4%) |
| 55 to 64 Years | 3,931 (93.3%) | 283 (6.7%) |
| 65 to 74 Years | 2,989 (100.0%) | 0 (0.0%) |
| 75 Years and older | 2,065 (100.0%) | 0 (0.0%) |
| Total | 29,798 (91.8%) | 2,650 (8.2%) |
Health Insurance Coverage by Citizenship Status in Clinton County
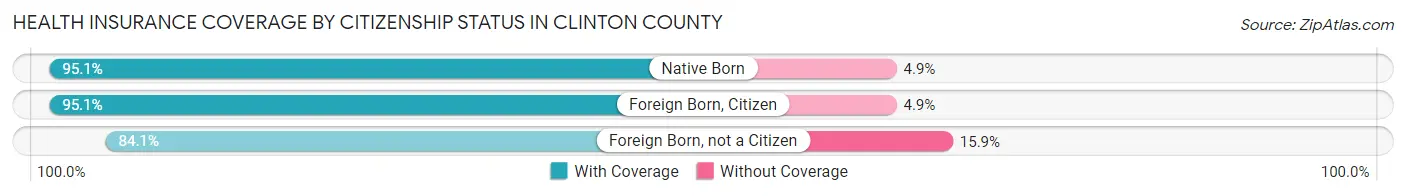
| Citizenship Status | With Coverage | Without Coverage |
| Native Born | 2,689 (95.1%) | 138 (4.9%) |
| Foreign Born, Citizen | 6,321 (95.1%) | 323 (4.9%) |
| Foreign Born, not a Citizen | 2,143 (84.1%) | 406 (15.9%) |
Health Insurance Coverage by Household Income in Clinton County

| Household Income | With Coverage | Without Coverage |
| Under $25,000 | 2,609 (90.4%) | 276 (9.6%) |
| $25,000 to $49,999 | 5,775 (91.2%) | 558 (8.8%) |
| $50,000 to $74,999 | 6,415 (87.0%) | 955 (13.0%) |
| $75,000 to $99,999 | 6,488 (95.5%) | 306 (4.5%) |
| $100,000 and over | 8,478 (94.0%) | 546 (6.0%) |
Public vs Private Health Insurance Coverage by Age in Clinton County
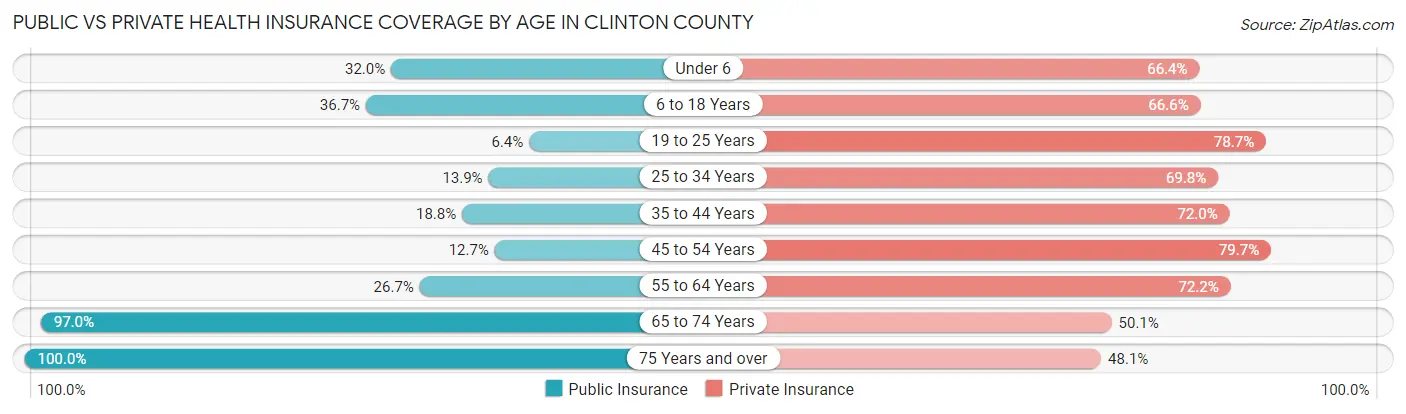
| Age Bracket | Public Insurance | Private Insurance |
| Under 6 | 904 (32.0%) | 1,876 (66.4%) |
| 6 to 18 Years | 2,435 (36.6%) | 4,423 (66.6%) |
| 19 to 25 Years | 162 (6.4%) | 2,007 (78.7%) |
| 25 to 34 Years | 478 (13.9%) | 2,401 (69.8%) |
| 35 to 44 Years | 717 (18.8%) | 2,745 (72.0%) |
| 45 to 54 Years | 498 (12.7%) | 3,113 (79.7%) |
| 55 to 64 Years | 1,124 (26.7%) | 3,041 (72.2%) |
| 65 to 74 Years | 2,899 (97.0%) | 1,497 (50.1%) |
| 75 Years and over | 2,065 (100.0%) | 994 (48.1%) |
| Total | 11,282 (34.8%) | 22,097 (68.1%) |
Disability Status by Sex by Age in Clinton County

| Age Bracket | Male | Female |
| Under 5 Years | 0 (0.0%) | 17 (1.4%) |
| 5 to 17 Years | 160 (4.6%) | 94 (3.1%) |
| 18 to 34 Years | 90 (2.7%) | 217 (6.7%) |
| 35 to 64 Years | 579 (9.5%) | 812 (13.9%) |
| 65 to 74 Years | 453 (31.7%) | 346 (22.2%) |
| 75 Years and over | 370 (46.3%) | 533 (42.1%) |
Disability Class by Sex by Age in Clinton County
Disability Class: Hearing Difficulty
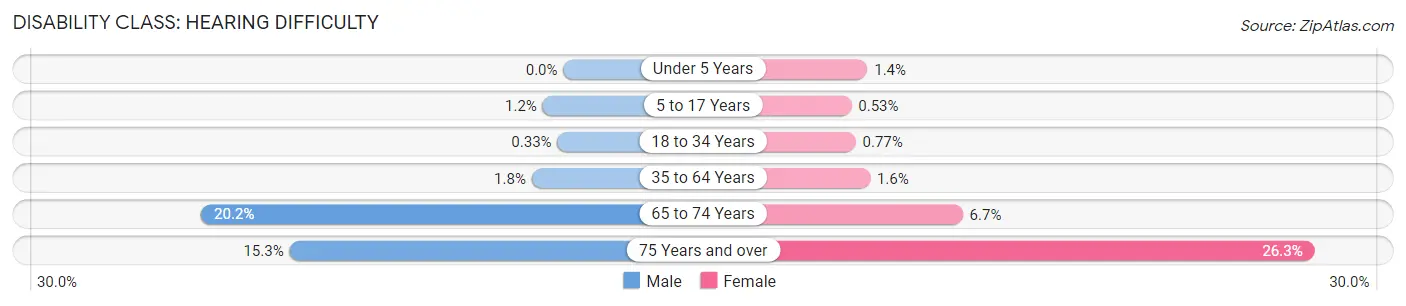
| Age Bracket | Male | Female |
| Under 5 Years | 0 (0.0%) | 17 (1.4%) |
| 5 to 17 Years | 40 (1.1%) | 16 (0.5%) |
| 18 to 34 Years | 11 (0.3%) | 25 (0.8%) |
| 35 to 64 Years | 107 (1.8%) | 92 (1.6%) |
| 65 to 74 Years | 288 (20.2%) | 105 (6.7%) |
| 75 Years and over | 122 (15.2%) | 333 (26.3%) |
Disability Class: Vision Difficulty

| Age Bracket | Male | Female |
| Under 5 Years | 0 (0.0%) | 0 (0.0%) |
| 5 to 17 Years | 31 (0.9%) | 0 (0.0%) |
| 18 to 34 Years | 43 (1.3%) | 80 (2.5%) |
| 35 to 64 Years | 187 (3.1%) | 156 (2.7%) |
| 65 to 74 Years | 15 (1.1%) | 40 (2.6%) |
| 75 Years and over | 122 (15.2%) | 161 (12.7%) |
Disability Class: Cognitive Difficulty

| Age Bracket | Male | Female |
| 5 to 17 Years | 108 (3.1%) | 37 (1.2%) |
| 18 to 34 Years | 69 (2.1%) | 134 (4.1%) |
| 35 to 64 Years | 149 (2.5%) | 242 (4.1%) |
| 65 to 74 Years | 139 (9.7%) | 27 (1.7%) |
| 75 Years and over | 91 (11.4%) | 201 (15.9%) |
Disability Class: Ambulatory Difficulty

| Age Bracket | Male | Female |
| 5 to 17 Years | 2 (0.1%) | 2 (0.1%) |
| 18 to 34 Years | 0 (0.0%) | 0 (0.0%) |
| 35 to 64 Years | 300 (4.9%) | 609 (10.4%) |
| 65 to 74 Years | 228 (16.0%) | 233 (14.9%) |
| 75 Years and over | 237 (29.6%) | 204 (16.1%) |
Disability Class: Self-Care Difficulty

| Age Bracket | Male | Female |
| 5 to 17 Years | 14 (0.4%) | 43 (1.4%) |
| 18 to 34 Years | 3 (0.1%) | 0 (0.0%) |
| 35 to 64 Years | 68 (1.1%) | 49 (0.8%) |
| 65 to 74 Years | 71 (5.0%) | 25 (1.6%) |
| 75 Years and over | 104 (13.0%) | 96 (7.6%) |
Technology Access in Clinton County
Computing Device Access in Clinton County
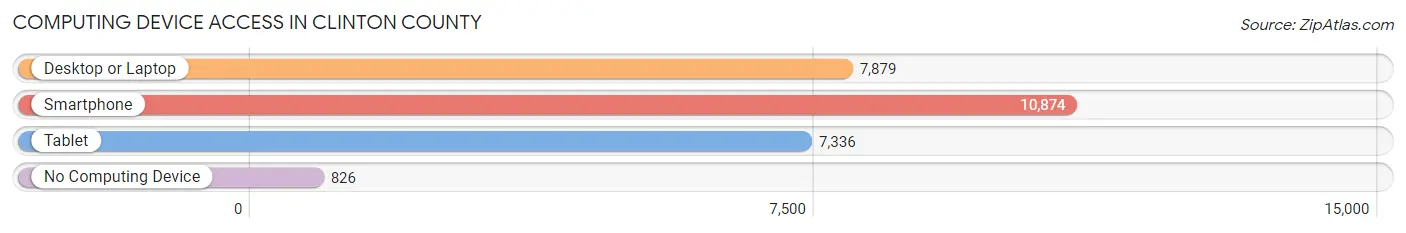
| Device Type | # Households | % Households |
| Desktop or Laptop | 7,879 | 63.6% |
| Smartphone | 10,874 | 87.8% |
| Tablet | 7,336 | 59.3% |
| No Computing Device | 826 | 6.7% |
| Total | 12,382 | 100.0% |
Internet Access in Clinton County

| Internet Type | # Households | % Households |
| Dial-Up Internet | 32 | 0.3% |
| Broadband Home | 5,946 | 48.0% |
| Cellular Data Only | 3,456 | 27.9% |
| Satellite Internet | 991 | 8.0% |
| No Internet | 2,177 | 17.6% |
| Total | 12,382 | 100.0% |
Clinton County Summary
County History
Clinton County, Indiana is located in the central part of the state and is part of the Lafayette metropolitan area. The county was established in 1829 and was named after DeWitt Clinton, the seventh Governor of New York. The county seat is located in the city of Frankfort, which was founded in 1829 and is the oldest city in the county.
The first settlers in the area were of French and German descent, and the county was originally part of Tippecanoe County. The first county courthouse was built in 1831 and the county was officially organized in 1833. The county was originally divided into three townships: Union, Jackson, and Warren.
The county experienced rapid growth in the late 19th century due to the construction of the Wabash and Erie Canal, which connected the Great Lakes to the Ohio River. The canal was completed in 1853 and brought an influx of settlers to the area. The county also experienced a population boom due to the discovery of natural gas in the area in the late 19th century.
Geography
Clinton County is located in the central part of Indiana and is bordered by Tippecanoe County to the north, Carroll County to the east, Montgomery County to the south, and Warren County to the west. The county covers an area of 437 square miles and is home to a population of 32,845 people, as of the 2010 census.
The county is mostly flat and is drained by the Wabash River, which forms the western border of the county. The county is also home to several small lakes, including Lake Freeman, Lake Shafer, and Lake Cicott. The county is mostly rural, with the majority of the population living in the cities of Frankfort, Michigantown, and Mulberry.
Economy
The economy of Clinton County is largely based on agriculture and manufacturing. The county is home to several large agricultural operations, including grain and livestock farms. The county is also home to several manufacturing companies, including a steel mill, a paper mill, and a plastics factory.
The county is also home to several small businesses, including restaurants, retail stores, and service providers. The county is also home to several educational institutions, including Purdue University, Ivy Tech Community College, and Indiana State University.
Demographics
As of the 2010 census, the population of Clinton County was 32,845, with a population density of 75 people per square mile. The racial makeup of the county was 95.3% White, 1.3% African American, 0.4% Native American, 0.7% Asian, 0.1% Pacific Islander, 0.7% from other races, and 1.5% from two or more races. Hispanic or Latino of any race were 2.2% of the population.
The median income for a household in the county was $45,837, and the median income for a family was $54,837. The per capita income for the county was $21,837. About 8.7% of families and 11.3% of the population were below the poverty line, including 15.2% of those under age 18 and 8.2% of those age 65 or over.
Common Questions
What is the Total Population of Clinton County?
Total Population of Clinton County is 33,020.
What is the Total Male Population of Clinton County?
Total Male Population of Clinton County is 16,560.
What is the Total Female Population of Clinton County?
Total Female Population of Clinton County is 16,460.
What is the Ratio of Males per 100 Females in Clinton County?
There are 100.61 Males per 100 Females in Clinton County.
What is the Ratio of Females per 100 Males in Clinton County?
There are 99.40 Females per 100 Males in Clinton County.
What is the Median Population Age in Clinton County?
Median Population Age in Clinton County is 36.7 Years.
What is the Average Family Size in Clinton County
Average Family Size in Clinton County is 3.3 People.
What is the Average Household Size in Clinton County
Average Household Size in Clinton County is 2.6 People.
What is Per Capita Income in Clinton County?
Per Capita income in Clinton County is $28,063.
What is the Median Family Income in Clinton County?
Median Family Income in Clinton County is $76,828.
What is the Median Household income in Clinton County?
Median Household Income in Clinton County is $59,515.
What is Income or Wage Gap in Clinton County?
Income or Wage Gap in Clinton County is 25.1%.
Women in Clinton County earn 74.9 cents for every dollar earned by a man.
What is Family Income Deficit in Clinton County?
Family Income Deficit in Clinton County is $9,763.
Families that are below poverty line in Clinton County earn $9,763 less on average than the poverty threshold level.
What is Inequality or Gini Index in Clinton County?
Inequality or Gini Index in Clinton County is 0.38.
How Large is the Labor Force in Clinton County?
There are 16,091 People in the Labor Forcein in Clinton County.
What is the Percentage of People in the Labor Force in Clinton County?
64.0% of People are in the Labor Force in Clinton County.
What is the Unemployment Rate in Clinton County?
Unemployment Rate in Clinton County is 3.4%.