Clark County, IN
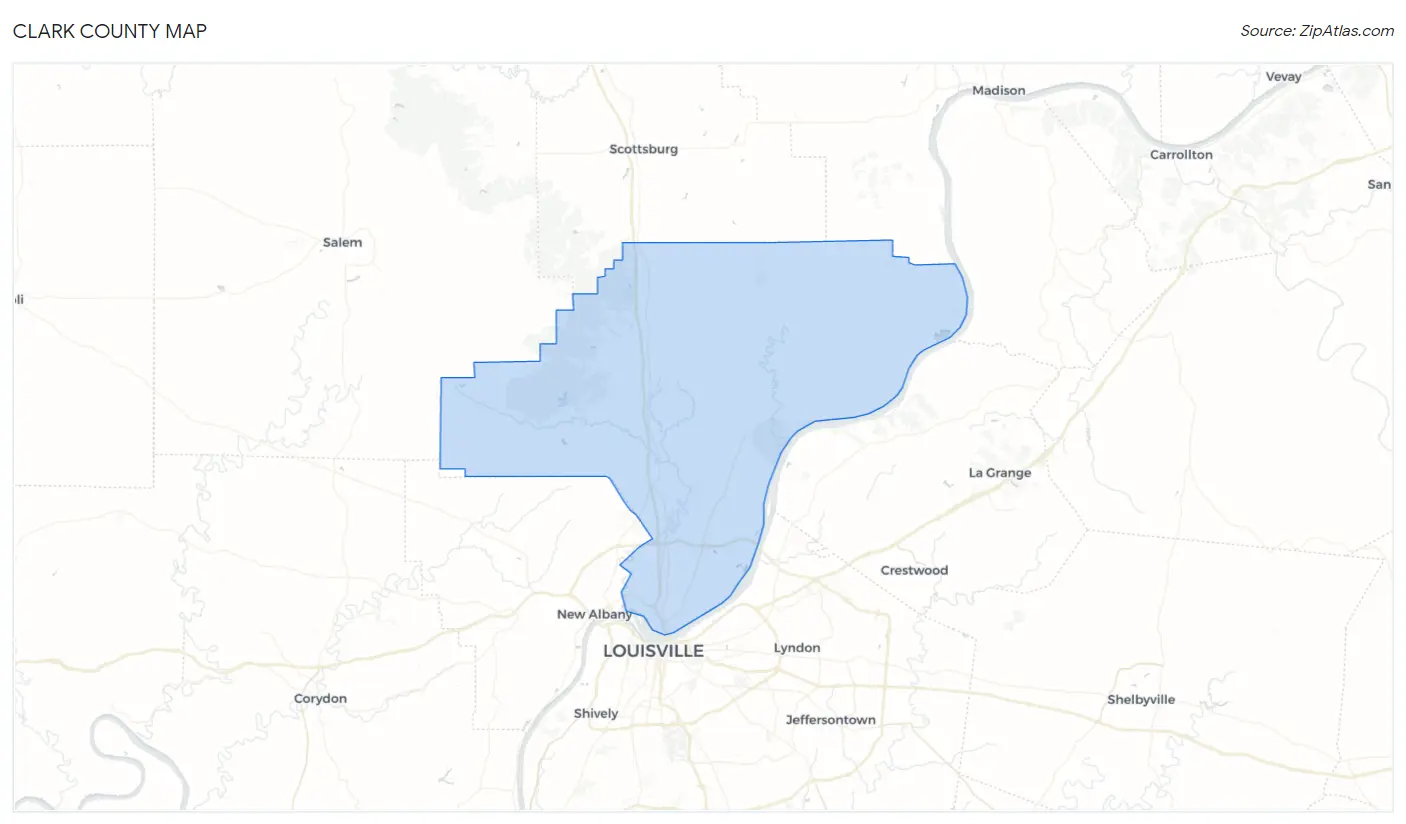
Clark County Map
Clark County Overview
121,484
TOTAL POPULATION
59,727
MALE POPULATION
61,757
FEMALE POPULATION
96.71
MALES / 100 FEMALES
103.40
FEMALES / 100 MALES
39.6
MEDIAN AGE
3.1
AVG FAMILY SIZE
2.5
AVG HOUSEHOLD SIZE
$34,946
PER CAPITA INCOME
$81,592
AVG FAMILY INCOME
$69,005
AVG HOUSEHOLD INCOME
21.3%
WAGE / INCOME GAP [ % ]
78.7¢/ $1
WAGE / INCOME GAP [ $ ]
$8,787
FAMILY INCOME DEFICIT
0.41
INEQUALITY / GINI INDEX
64,737
LABOR FORCE [ PEOPLE ]
66.3%
PERCENT IN LABOR FORCE
3.7%
UNEMPLOYMENT RATE
Clark County Area Codes
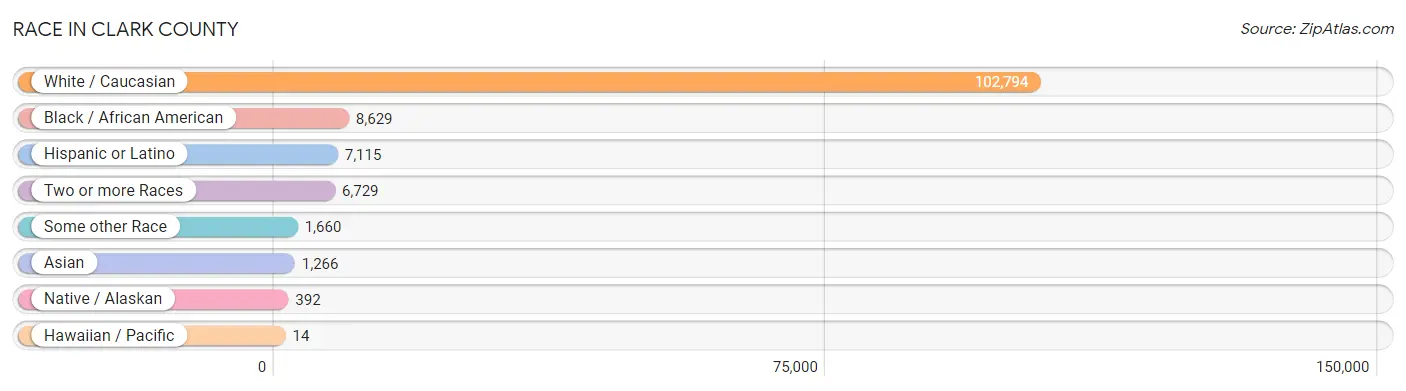
Race in Clark County
The most populous races in Clark County are White / Caucasian (102,794 | 84.6%), Black / African American (8,629 | 7.1%), and Hispanic or Latino (7,115 | 5.9%).
| Race | # Population | % Population |
| Asian | 1,266 | 1.0% |
| Black / African American | 8,629 | 7.1% |
| Hawaiian / Pacific | 14 | 0.0% |
| Hispanic or Latino | 7,115 | 5.9% |
| Native / Alaskan | 392 | 0.3% |
| White / Caucasian | 102,794 | 84.6% |
| Two or more Races | 6,729 | 5.5% |
| Some other Race | 1,660 | 1.4% |
| Total | 121,484 | 100.0% |
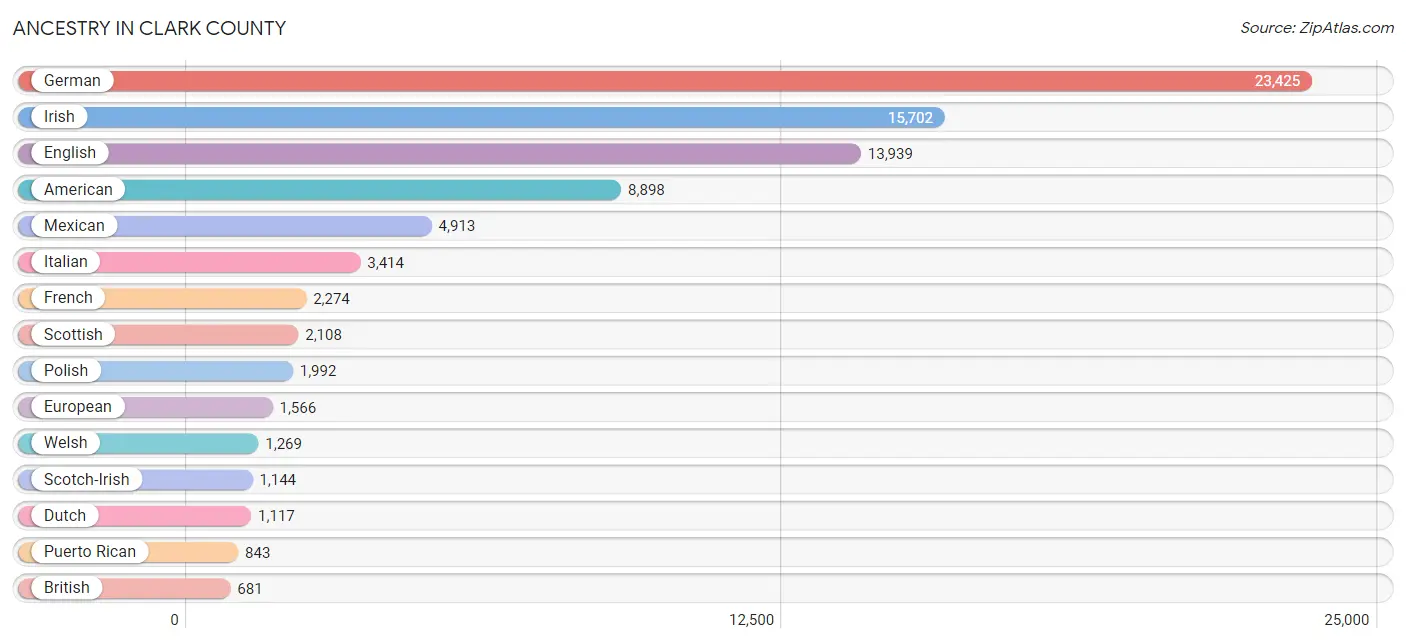
Ancestry in Clark County
The most populous ancestries reported in Clark County are German (23,425 | 19.3%), Irish (15,702 | 12.9%), English (13,939 | 11.5%), American (8,898 | 7.3%), and Mexican (4,913 | 4.0%), together accounting for 55.0% of all Clark County residents.
| Ancestry | # Population | % Population |
| African | 422 | 0.4% |
| American | 8,898 | 7.3% |
| Arab | 114 | 0.1% |
| Argentinean | 13 | 0.0% |
| Armenian | 26 | 0.0% |
| Austrian | 249 | 0.2% |
| Belgian | 76 | 0.1% |
| Belizean | 114 | 0.1% |
| Bhutanese | 88 | 0.1% |
| Blackfeet | 163 | 0.1% |
| Brazilian | 5 | 0.0% |
| British | 681 | 0.6% |
| Bulgarian | 21 | 0.0% |
| Burmese | 114 | 0.1% |
| Cambodian | 37 | 0.0% |
| Canadian | 160 | 0.1% |
| Celtic | 3 | 0.0% |
| Central American | 612 | 0.5% |
| Central American Indian | 18 | 0.0% |
| Cherokee | 234 | 0.2% |
| Chickasaw | 6 | 0.0% |
| Chippewa | 19 | 0.0% |
| Colombian | 183 | 0.2% |
| Croatian | 28 | 0.0% |
| Crow | 116 | 0.1% |
| Cuban | 172 | 0.1% |
| Czech | 164 | 0.1% |
| Czechoslovakian | 13 | 0.0% |
| Danish | 21 | 0.0% |
| Dutch | 1,117 | 0.9% |
| Dutch West Indian | 30 | 0.0% |
| Eastern European | 201 | 0.2% |
| Ecuadorian | 52 | 0.0% |
| Egyptian | 1 | 0.0% |
| English | 13,939 | 11.5% |
| Ethiopian | 16 | 0.0% |
| European | 1,566 | 1.3% |
| Filipino | 33 | 0.0% |
| Finnish | 69 | 0.1% |
| French | 2,274 | 1.9% |
| French Canadian | 143 | 0.1% |
| German | 23,425 | 19.3% |
| Greek | 161 | 0.1% |
| Guamanian / Chamorro | 11 | 0.0% |
| Guatemalan | 80 | 0.1% |
| Haitian | 85 | 0.1% |
| Honduran | 288 | 0.2% |
| Hungarian | 164 | 0.1% |
| Icelander | 145 | 0.1% |
| Indian (Asian) | 572 | 0.5% |
| Iranian | 139 | 0.1% |
| Irish | 15,702 | 12.9% |
| Iroquois | 35 | 0.0% |
| Israeli | 12 | 0.0% |
| Italian | 3,414 | 2.8% |
| Jamaican | 10 | 0.0% |
| Japanese | 29 | 0.0% |
| Jordanian | 5 | 0.0% |
| Kiowa | 11 | 0.0% |
| Korean | 148 | 0.1% |
| Latvian | 8 | 0.0% |
| Lebanese | 98 | 0.1% |
| Lithuanian | 9 | 0.0% |
| Malaysian | 21 | 0.0% |
| Mexican | 4,913 | 4.0% |
| Mexican American Indian | 336 | 0.3% |
| Native Hawaiian | 111 | 0.1% |
| Navajo | 31 | 0.0% |
| New Zealander | 48 | 0.0% |
| Nicaraguan | 73 | 0.1% |
| Northern European | 24 | 0.0% |
| Norwegian | 540 | 0.4% |
| Pakistani | 16 | 0.0% |
| Panamanian | 8 | 0.0% |
| Pennsylvania German | 23 | 0.0% |
| Pima | 46 | 0.0% |
| Polish | 1,992 | 1.6% |
| Portuguese | 221 | 0.2% |
| Puerto Rican | 843 | 0.7% |
| Romanian | 129 | 0.1% |
| Russian | 258 | 0.2% |
| Salvadoran | 163 | 0.1% |
| Scandinavian | 233 | 0.2% |
| Scotch-Irish | 1,144 | 0.9% |
| Scottish | 2,108 | 1.7% |
| Serbian | 12 | 0.0% |
| Shoshone | 6 | 0.0% |
| Sierra Leonean | 62 | 0.1% |
| Sioux | 4 | 0.0% |
| Slavic | 15 | 0.0% |
| Slovak | 32 | 0.0% |
| Somali | 17 | 0.0% |
| South American | 262 | 0.2% |
| Spaniard | 65 | 0.1% |
| Spanish | 80 | 0.1% |
| Sri Lankan | 303 | 0.3% |
| Subsaharan African | 517 | 0.4% |
| Swedish | 198 | 0.2% |
| Swiss | 311 | 0.3% |
| Thai | 337 | 0.3% |
| Turkish | 12 | 0.0% |
| Ukrainian | 50 | 0.0% |
| Venezuelan | 14 | 0.0% |
| Welsh | 1,269 | 1.0% |
| West Indian | 88 | 0.1% | View All 105 Rows |
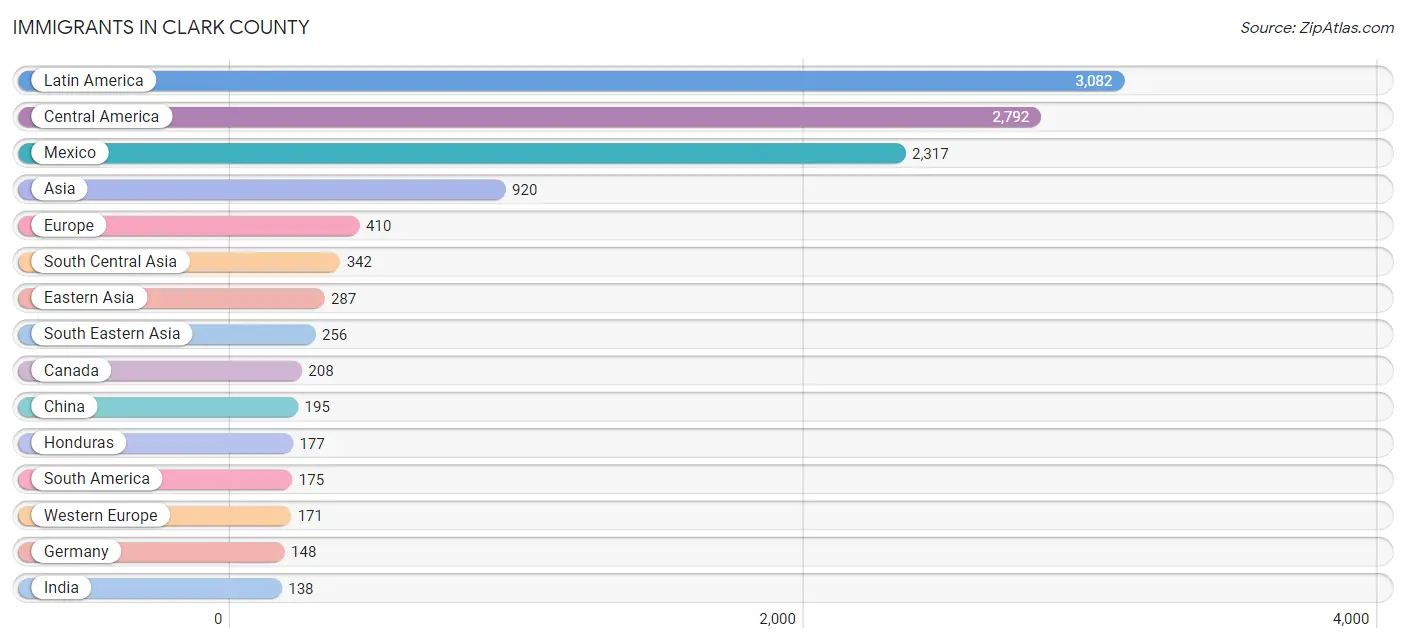
Immigrants in Clark County
The most numerous immigrant groups reported in Clark County came from Latin America (3,082 | 2.5%), Central America (2,792 | 2.3%), Mexico (2,317 | 1.9%), Asia (920 | 0.8%), and Europe (410 | 0.3%), together accounting for 7.9% of all Clark County residents.
| Immigration Origin | # Population | % Population |
| Africa | 129 | 0.1% |
| Asia | 920 | 0.8% |
| Belize | 114 | 0.1% |
| Brazil | 5 | 0.0% |
| Bulgaria | 8 | 0.0% |
| Cambodia | 9 | 0.0% |
| Canada | 208 | 0.2% |
| Caribbean | 115 | 0.1% |
| Central America | 2,792 | 2.3% |
| China | 195 | 0.2% |
| Colombia | 136 | 0.1% |
| Cuba | 55 | 0.1% |
| Eastern Africa | 32 | 0.0% |
| Eastern Asia | 287 | 0.2% |
| Eastern Europe | 112 | 0.1% |
| Ecuador | 14 | 0.0% |
| El Salvador | 77 | 0.1% |
| England | 28 | 0.0% |
| Europe | 410 | 0.3% |
| Germany | 148 | 0.1% |
| Greece | 8 | 0.0% |
| Guatemala | 41 | 0.0% |
| Guyana | 20 | 0.0% |
| Haiti | 3 | 0.0% |
| Honduras | 177 | 0.2% |
| India | 138 | 0.1% |
| Indonesia | 61 | 0.1% |
| Iran | 47 | 0.0% |
| Ireland | 39 | 0.0% |
| Italy | 17 | 0.0% |
| Korea | 55 | 0.1% |
| Latin America | 3,082 | 2.5% |
| Lebanon | 35 | 0.0% |
| Mexico | 2,317 | 1.9% |
| Nepal | 3 | 0.0% |
| Netherlands | 23 | 0.0% |
| Nicaragua | 66 | 0.1% |
| Northern Europe | 102 | 0.1% |
| Oceania | 17 | 0.0% |
| Pakistan | 110 | 0.1% |
| Philippines | 65 | 0.1% |
| Romania | 50 | 0.0% |
| Russia | 41 | 0.0% |
| Scotland | 17 | 0.0% |
| Sierra Leone | 62 | 0.1% |
| South Africa | 35 | 0.0% |
| South America | 175 | 0.1% |
| South Central Asia | 342 | 0.3% |
| South Eastern Asia | 256 | 0.2% |
| Southern Europe | 25 | 0.0% |
| Sri Lanka | 44 | 0.0% |
| Trinidad and Tobago | 4 | 0.0% |
| Ukraine | 13 | 0.0% |
| Vietnam | 121 | 0.1% |
| Western Africa | 62 | 0.1% |
| Western Asia | 35 | 0.0% |
| Western Europe | 171 | 0.1% | View All 57 Rows |
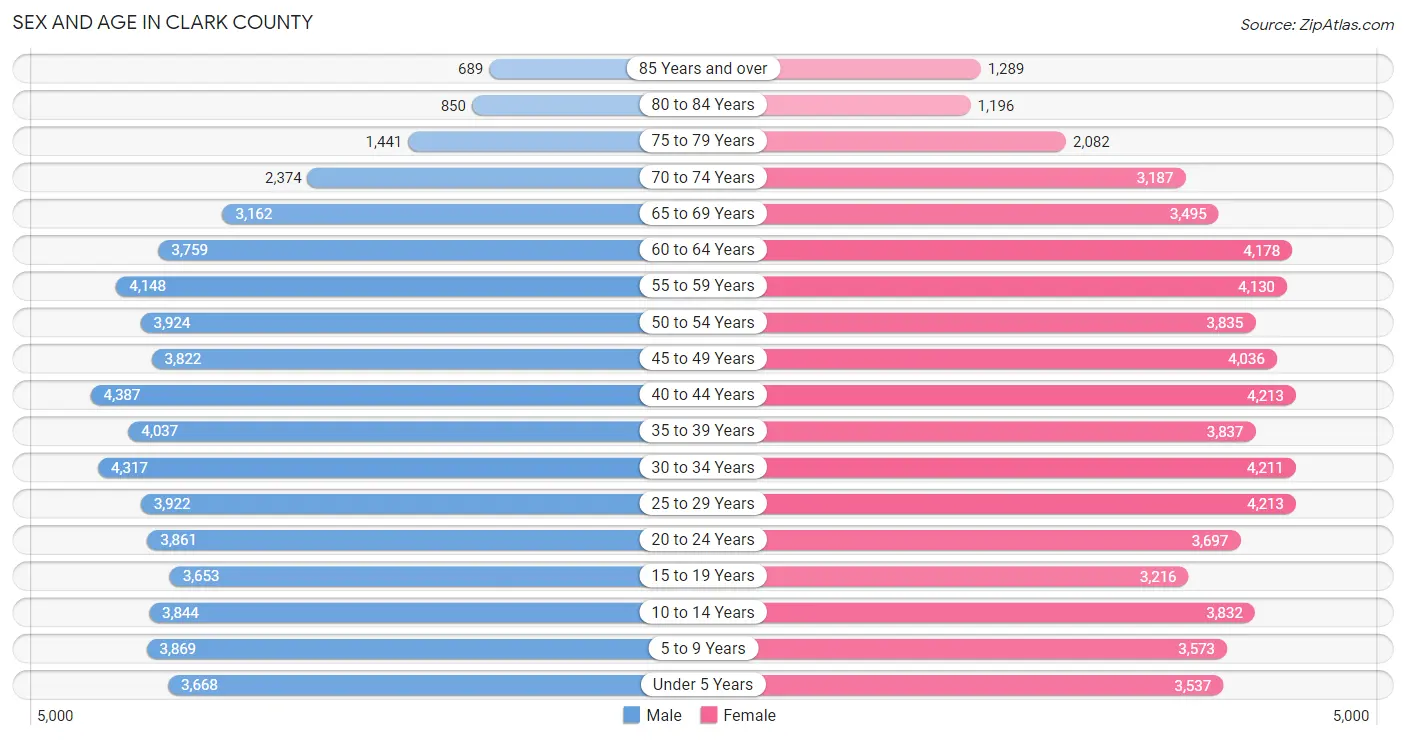
Sex and Age in Clark County
Sex and Age in Clark County
The most populous age groups in Clark County are 40 to 44 Years (4,387 | 7.3%) for men and 25 to 29 Years (4,213 | 6.8%) for women.
| Age Bracket | Male | Female |
| Under 5 Years | 3,668 (6.1%) | 3,537 (5.7%) |
| 5 to 9 Years | 3,869 (6.5%) | 3,573 (5.8%) |
| 10 to 14 Years | 3,844 (6.4%) | 3,832 (6.2%) |
| 15 to 19 Years | 3,653 (6.1%) | 3,216 (5.2%) |
| 20 to 24 Years | 3,861 (6.5%) | 3,697 (6.0%) |
| 25 to 29 Years | 3,922 (6.6%) | 4,213 (6.8%) |
| 30 to 34 Years | 4,317 (7.2%) | 4,211 (6.8%) |
| 35 to 39 Years | 4,037 (6.8%) | 3,837 (6.2%) |
| 40 to 44 Years | 4,387 (7.3%) | 4,213 (6.8%) |
| 45 to 49 Years | 3,822 (6.4%) | 4,036 (6.5%) |
| 50 to 54 Years | 3,924 (6.6%) | 3,835 (6.2%) |
| 55 to 59 Years | 4,148 (6.9%) | 4,130 (6.7%) |
| 60 to 64 Years | 3,759 (6.3%) | 4,178 (6.8%) |
| 65 to 69 Years | 3,162 (5.3%) | 3,495 (5.7%) |
| 70 to 74 Years | 2,374 (4.0%) | 3,187 (5.2%) |
| 75 to 79 Years | 1,441 (2.4%) | 2,082 (3.4%) |
| 80 to 84 Years | 850 (1.4%) | 1,196 (1.9%) |
| 85 Years and over | 689 (1.1%) | 1,289 (2.1%) |
| Total | 59,727 (100.0%) | 61,757 (100.0%) |
Families and Households in Clark County
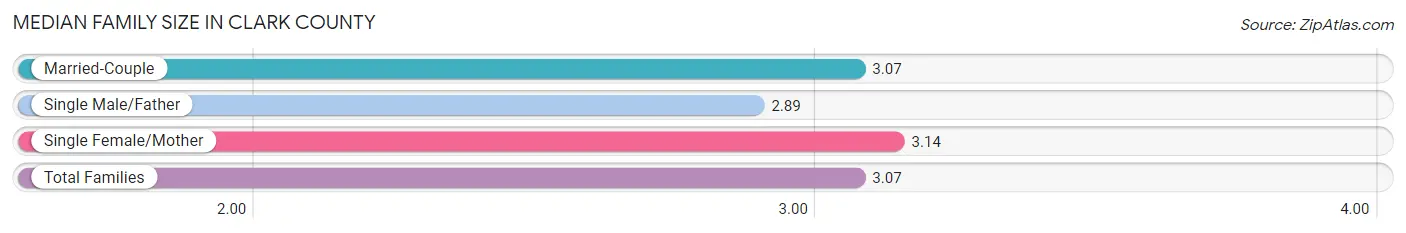
Median Family Size in Clark County
The median family size in Clark County is 3.07 persons per family, with single female/mother families (5,439 | 17.3%) accounting for the largest median family size of 3.14 persons per family. On the other hand, single male/father families (3,057 | 9.7%) represent the smallest median family size with 2.89 persons per family.
| Family Type | # Families | Family Size |
| Married-Couple | 22,967 (73.0%) | 3.07 |
| Single Male/Father | 3,057 (9.7%) | 2.89 |
| Single Female/Mother | 5,439 (17.3%) | 3.14 |
| Total Families | 31,463 (100.0%) | 3.07 |
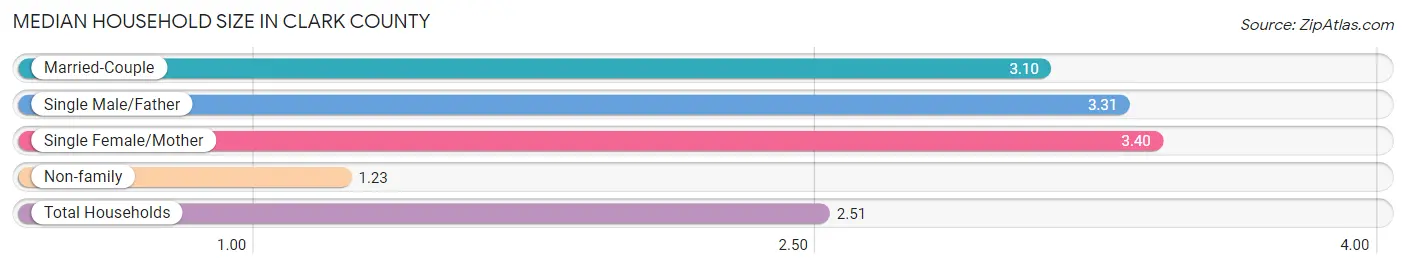
Median Household Size in Clark County
The median household size in Clark County is 2.51 persons per household, with single female/mother households (5,439 | 11.4%) accounting for the largest median household size of 3.4 persons per household. non-family households (16,381 | 34.2%) represent the smallest median household size with 1.23 persons per household.
| Household Type | # Households | Household Size |
| Married-Couple | 22,967 (48.0%) | 3.10 |
| Single Male/Father | 3,057 (6.4%) | 3.31 |
| Single Female/Mother | 5,439 (11.4%) | 3.40 |
| Non-family | 16,381 (34.2%) | 1.23 |
| Total Households | 47,844 (100.0%) | 2.51 |
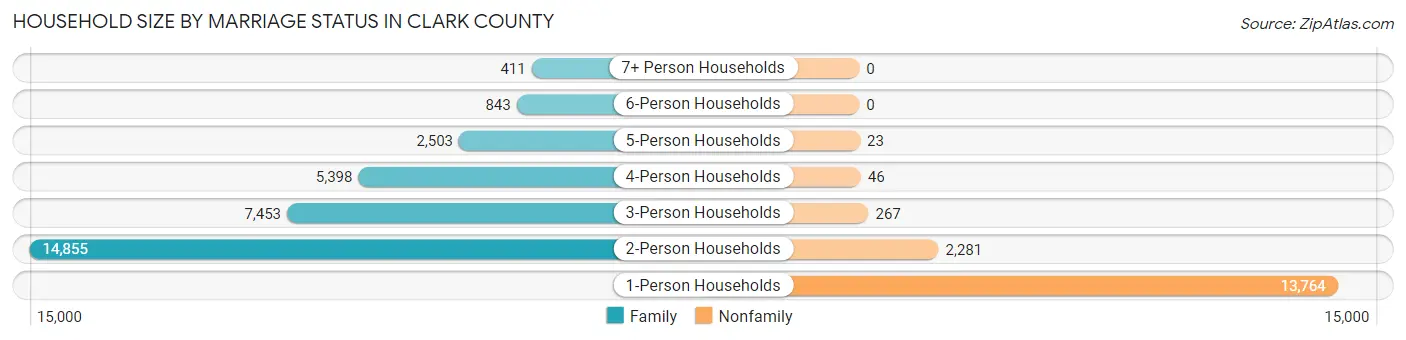
Household Size by Marriage Status in Clark County
Out of a total of 47,844 households in Clark County, 31,463 (65.8%) are family households, while 16,381 (34.2%) are nonfamily households. The most numerous type of family households are 2-person households, comprising 14,855, and the most common type of nonfamily households are 1-person households, comprising 13,764.
| Household Size | Family Households | Nonfamily Households |
| 1-Person Households | - | 13,764 (28.8%) |
| 2-Person Households | 14,855 (31.0%) | 2,281 (4.8%) |
| 3-Person Households | 7,453 (15.6%) | 267 (0.6%) |
| 4-Person Households | 5,398 (11.3%) | 46 (0.1%) |
| 5-Person Households | 2,503 (5.2%) | 23 (0.1%) |
| 6-Person Households | 843 (1.8%) | 0 (0.0%) |
| 7+ Person Households | 411 (0.9%) | 0 (0.0%) |
| Total | 31,463 (65.8%) | 16,381 (34.2%) |
Female Fertility in Clark County
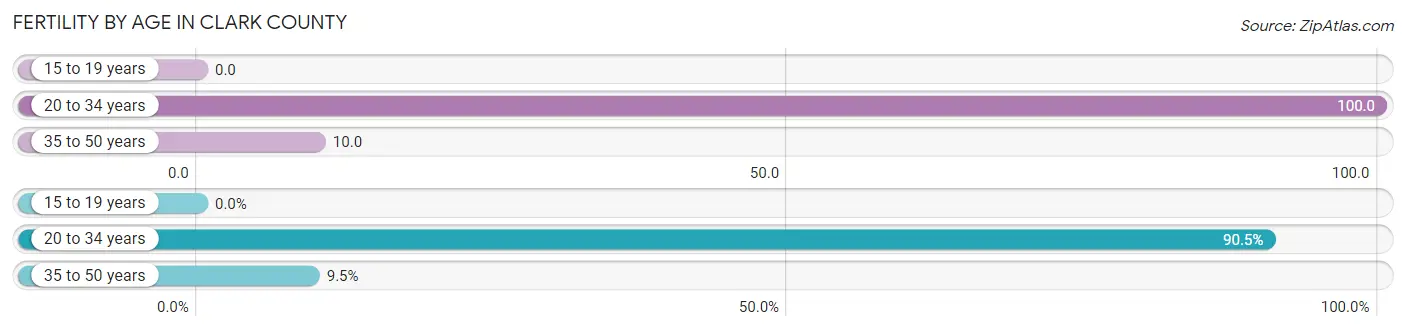
Fertility by Age in Clark County
Average fertility rate in Clark County is 48.0 births per 1,000 women. Women in the age bracket of 20 to 34 years have the highest fertility rate with 100.0 births per 1,000 women. Women in the age bracket of 20 to 34 years acount for 90.5% of all women with births.
| Age Bracket | Women with Births | Births / 1,000 Women |
| 15 to 19 years | 0 (0.0%) | 0.0 |
| 20 to 34 years | 1,213 (90.5%) | 100.0 |
| 35 to 50 years | 127 (9.5%) | 10.0 |
| Total | 1,340 (100.0%) | 48.0 |
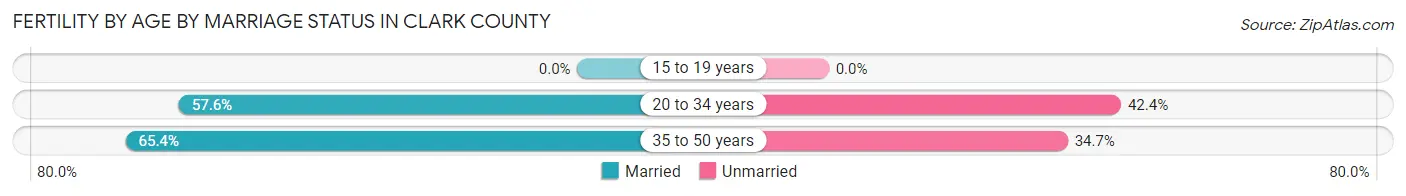
Fertility by Age by Marriage Status in Clark County
58.4% of women with births (1,340) in Clark County are married. The highest percentage of unmarried women with births falls into 20 to 34 years age bracket with 42.4% of them unmarried at the time of birth, while the lowest percentage of unmarried women with births belong to 35 to 50 years age bracket with 34.7% of them unmarried.
| Age Bracket | Married | Unmarried |
| 15 to 19 years | 0 (0.0%) | 0 (0.0%) |
| 20 to 34 years | 699 (57.6%) | 514 (42.4%) |
| 35 to 50 years | 83 (65.3%) | 44 (34.6%) |
| Total | 783 (58.4%) | 557 (41.6%) |
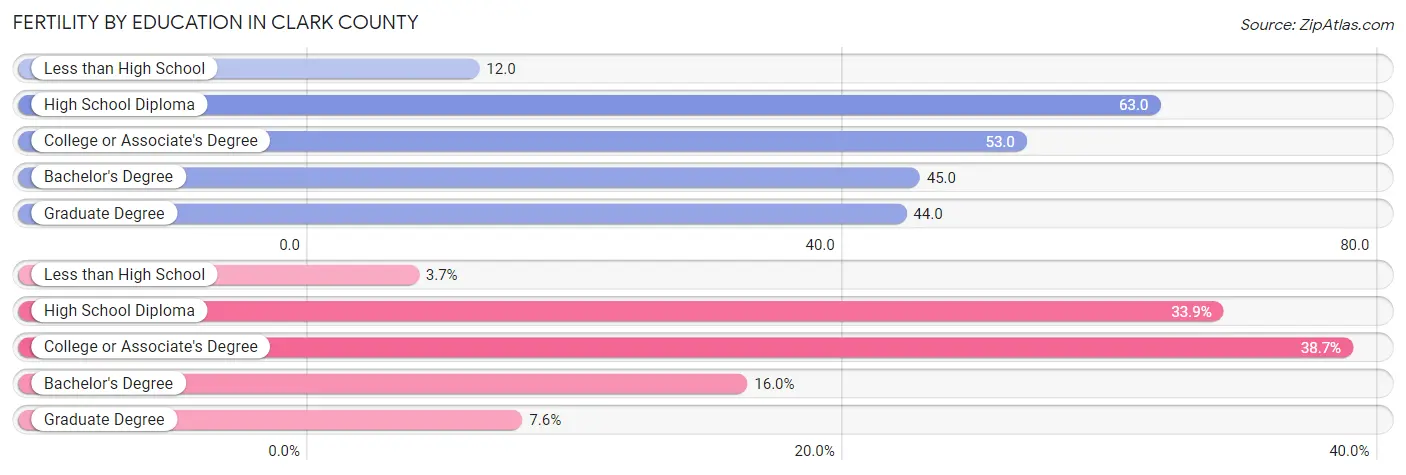
Fertility by Education in Clark County
Average fertility rate in Clark County is 48.0 births per 1,000 women. Women with the education attainment of high school diploma have the highest fertility rate of 63.0 births per 1,000 women, while women with the education attainment of less than high school have the lowest fertility at 12.0 births per 1,000 women. Women with the education attainment of college or associate's degree represent 38.7% of all women with births.
| Educational Attainment | Women with Births | Births / 1,000 Women |
| Less than High School | 50 (3.7%) | 12.0 |
| High School Diploma | 454 (33.9%) | 63.0 |
| College or Associate's Degree | 519 (38.7%) | 53.0 |
| Bachelor's Degree | 215 (16.0%) | 45.0 |
| Graduate Degree | 102 (7.6%) | 44.0 |
| Total | 1,340 (100.0%) | 48.0 |
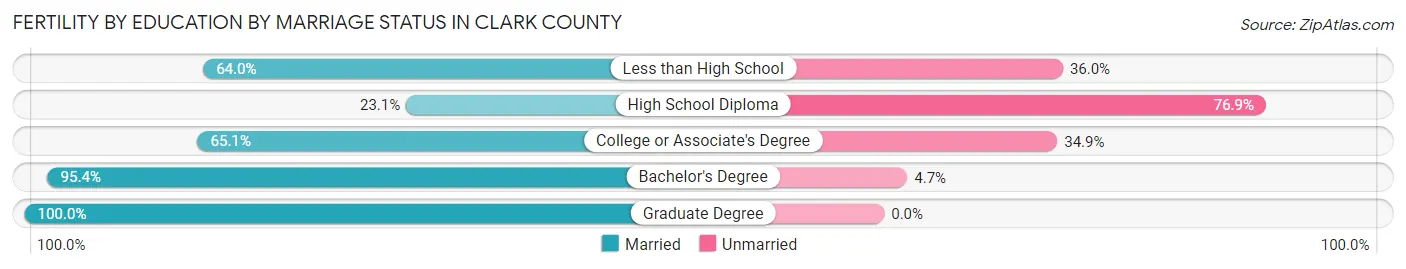
Fertility by Education by Marriage Status in Clark County
41.6% of women with births in Clark County are unmarried. Women with the educational attainment of graduate degree are most likely to be married with 100.0% of them married at childbirth, while women with the educational attainment of high school diploma are least likely to be married with 76.9% of them unmarried at childbirth.
| Educational Attainment | Married | Unmarried |
| Less than High School | 32 (64.0%) | 18 (36.0%) |
| High School Diploma | 105 (23.1%) | 349 (76.9%) |
| College or Associate's Degree | 338 (65.1%) | 181 (34.9%) |
| Bachelor's Degree | 205 (95.4%) | 10 (4.6%) |
| Graduate Degree | 102 (100.0%) | 0 (0.0%) |
| Total | 783 (58.4%) | 557 (41.6%) |
Income in Clark County
Income Overview in Clark County
Per Capita Income in Clark County is $34,946, while median incomes of families and households are $81,592 and $69,005 respectively.
| Characteristic | Number | Measure |
| Per Capita Income | 121,484 | $34,946 |
| Median Family Income | 31,463 | $81,592 |
| Mean Family Income | 31,463 | $101,200 |
| Median Household Income | 47,844 | $69,005 |
| Mean Household Income | 47,844 | $85,658 |
| Income Deficit | 31,463 | $8,787 |
| Wage / Income Gap (%) | 121,484 | 21.29% |
| Wage / Income Gap ($) | 121,484 | 78.71¢ per $1 |
| Gini / Inequality Index | 121,484 | 0.41 |
Earnings by Sex in Clark County
Average Earnings in Clark County are $41,673, $46,369 for men and $36,498 for women, a difference of 21.3%.
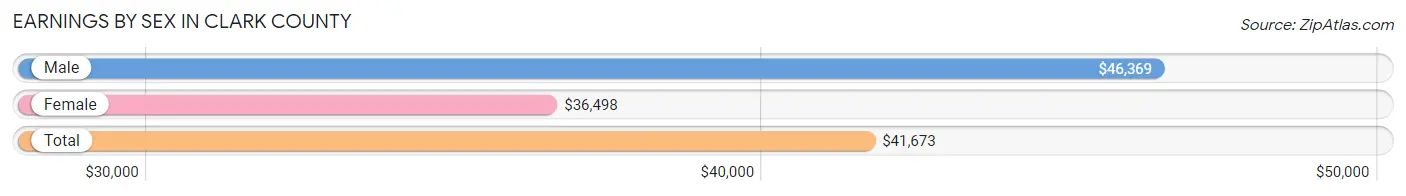
| Sex | Number | Average Earnings |
| Male | 35,453 (52.7%) | $46,369 |
| Female | 31,873 (47.3%) | $36,498 |
| Total | 67,326 (100.0%) | $41,673 |
Earnings by Sex by Income Bracket in Clark County
The most common earnings brackets in Clark County are $100,000+ for men (4,242 | 12.0%) and $30,000 to $34,999 for women (2,581 | 8.1%).
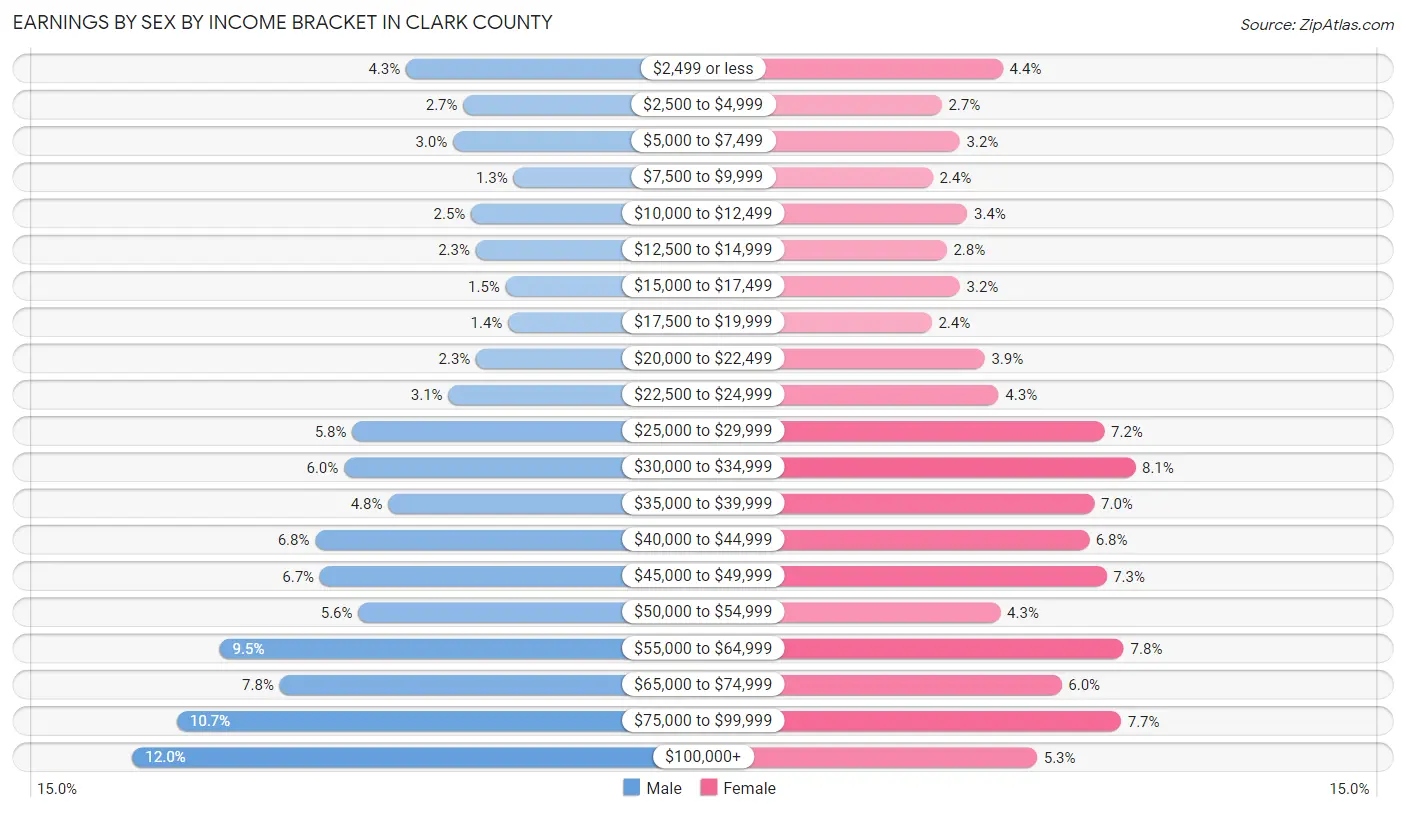
| Income | Male | Female |
| $2,499 or less | 1,516 (4.3%) | 1,397 (4.4%) |
| $2,500 to $4,999 | 946 (2.7%) | 847 (2.7%) |
| $5,000 to $7,499 | 1,050 (3.0%) | 1,010 (3.2%) |
| $7,500 to $9,999 | 446 (1.3%) | 767 (2.4%) |
| $10,000 to $12,499 | 870 (2.5%) | 1,076 (3.4%) |
| $12,500 to $14,999 | 822 (2.3%) | 892 (2.8%) |
| $15,000 to $17,499 | 524 (1.5%) | 1,009 (3.2%) |
| $17,500 to $19,999 | 501 (1.4%) | 757 (2.4%) |
| $20,000 to $22,499 | 819 (2.3%) | 1,235 (3.9%) |
| $22,500 to $24,999 | 1,095 (3.1%) | 1,357 (4.3%) |
| $25,000 to $29,999 | 2,054 (5.8%) | 2,304 (7.2%) |
| $30,000 to $34,999 | 2,133 (6.0%) | 2,581 (8.1%) |
| $35,000 to $39,999 | 1,694 (4.8%) | 2,215 (7.0%) |
| $40,000 to $44,999 | 2,423 (6.8%) | 2,168 (6.8%) |
| $45,000 to $49,999 | 2,375 (6.7%) | 2,325 (7.3%) |
| $50,000 to $54,999 | 1,991 (5.6%) | 1,375 (4.3%) |
| $55,000 to $64,999 | 3,376 (9.5%) | 2,480 (7.8%) |
| $65,000 to $74,999 | 2,775 (7.8%) | 1,923 (6.0%) |
| $75,000 to $99,999 | 3,801 (10.7%) | 2,454 (7.7%) |
| $100,000+ | 4,242 (12.0%) | 1,701 (5.3%) |
| Total | 35,453 (100.0%) | 31,873 (100.0%) |
Earnings by Sex by Educational Attainment in Clark County
Average earnings in Clark County are $51,962 for men and $40,971 for women, a difference of 21.1%. Men with an educational attainment of graduate degree enjoy the highest average annual earnings of $80,581, while those with less than high school education earn the least with $38,472. Women with an educational attainment of graduate degree earn the most with the average annual earnings of $65,646, while those with less than high school education have the smallest earnings of $22,625.
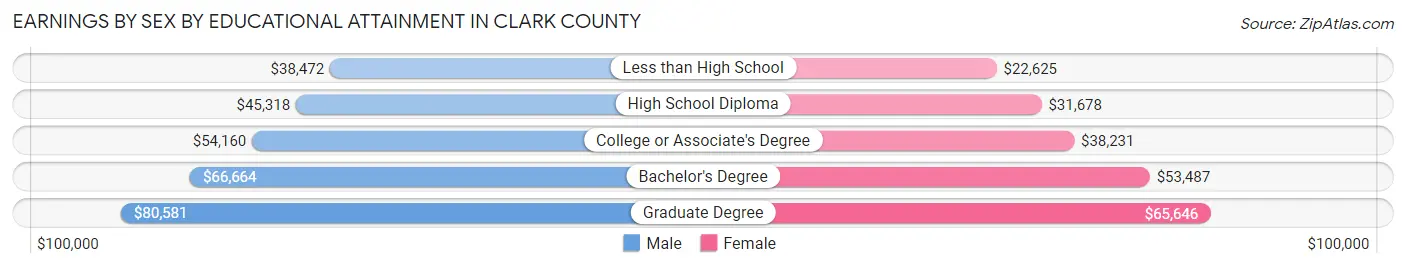
| Educational Attainment | Male Income | Female Income |
| Less than High School | $38,472 | $22,625 |
| High School Diploma | $45,318 | $31,678 |
| College or Associate's Degree | $54,160 | $38,231 |
| Bachelor's Degree | $66,664 | $53,487 |
| Graduate Degree | $80,581 | $65,646 |
| Total | $51,962 | $40,971 |
Family Income in Clark County
Family Income Brackets in Clark County
According to the Clark County family income data, there are 6,827 families falling into the $100,000 to $149,999 income range, which is the most common income bracket and makes up 21.7% of all families. Conversely, the less than $10,000 income bracket is the least frequent group with only 503 families (1.6%) belonging to this category.
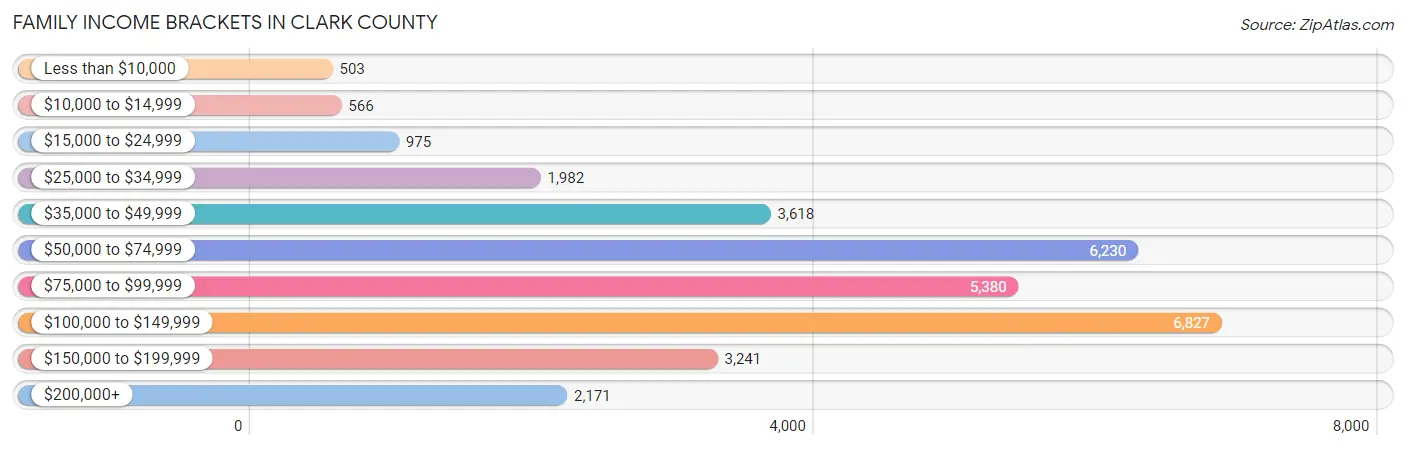
| Income Bracket | # Families | % Families |
| Less than $10,000 | 503 | 1.6% |
| $10,000 to $14,999 | 566 | 1.8% |
| $15,000 to $24,999 | 975 | 3.1% |
| $25,000 to $34,999 | 1,982 | 6.3% |
| $35,000 to $49,999 | 3,618 | 11.5% |
| $50,000 to $74,999 | 6,230 | 19.8% |
| $75,000 to $99,999 | 5,380 | 17.1% |
| $100,000 to $149,999 | 6,827 | 21.7% |
| $150,000 to $199,999 | 3,241 | 10.3% |
| $200,000+ | 2,171 | 6.9% |
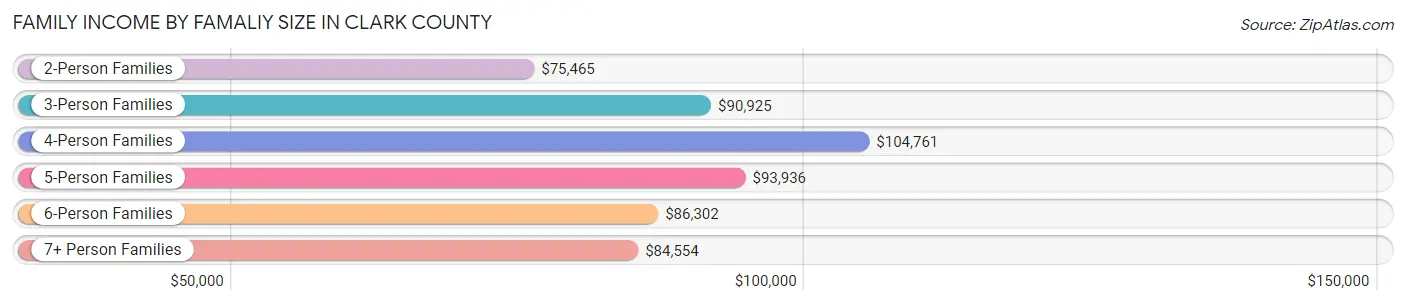
Family Income by Famaliy Size in Clark County
4-person families (5,530 | 17.6%) account for the highest median family income in Clark County with $104,761 per family, while 2-person families (16,104 | 51.2%) have the highest median income of $37,732 per family member.
| Income Bracket | # Families | Median Income |
| 2-Person Families | 16,104 (51.2%) | $75,465 |
| 3-Person Families | 6,965 (22.1%) | $90,925 |
| 4-Person Families | 5,530 (17.6%) | $104,761 |
| 5-Person Families | 1,800 (5.7%) | $93,936 |
| 6-Person Families | 705 (2.2%) | $86,302 |
| 7+ Person Families | 359 (1.1%) | $84,554 |
| Total | 31,463 (100.0%) | $81,592 |
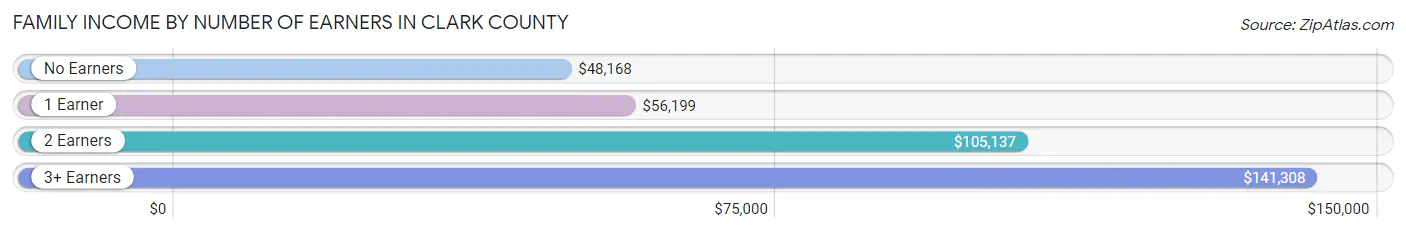
Family Income by Number of Earners in Clark County
The median family income in Clark County is $81,592, with families comprising 3+ earners (3,256) having the highest median family income of $141,308, while families with no earners (4,080) have the lowest median family income of $48,168, accounting for 10.3% and 13.0% of families, respectively.
| Number of Earners | # Families | Median Income |
| No Earners | 4,080 (13.0%) | $48,168 |
| 1 Earner | 10,212 (32.5%) | $56,199 |
| 2 Earners | 13,915 (44.2%) | $105,137 |
| 3+ Earners | 3,256 (10.3%) | $141,308 |
| Total | 31,463 (100.0%) | $81,592 |
Household Income in Clark County
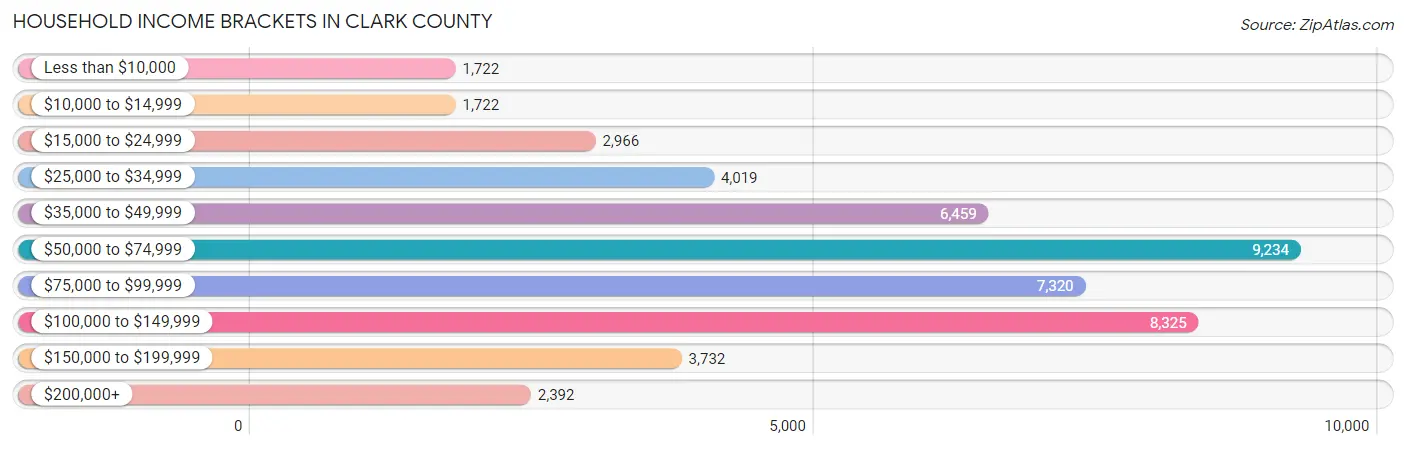
Household Income Brackets in Clark County
With 9,234 households falling in the category, the $50,000 to $74,999 income range is the most frequent in Clark County, accounting for 19.3% of all households. In contrast, only 1,722 households (3.6%) fall into the less than $10,000 income bracket, making it the least populous group.
| Income Bracket | # Households | % Households |
| Less than $10,000 | 1,722 | 3.6% |
| $10,000 to $14,999 | 1,722 | 3.6% |
| $15,000 to $24,999 | 2,966 | 6.2% |
| $25,000 to $34,999 | 4,019 | 8.4% |
| $35,000 to $49,999 | 6,459 | 13.5% |
| $50,000 to $74,999 | 9,234 | 19.3% |
| $75,000 to $99,999 | 7,320 | 15.3% |
| $100,000 to $149,999 | 8,325 | 17.4% |
| $150,000 to $199,999 | 3,732 | 7.8% |
| $200,000+ | 2,392 | 5.0% |
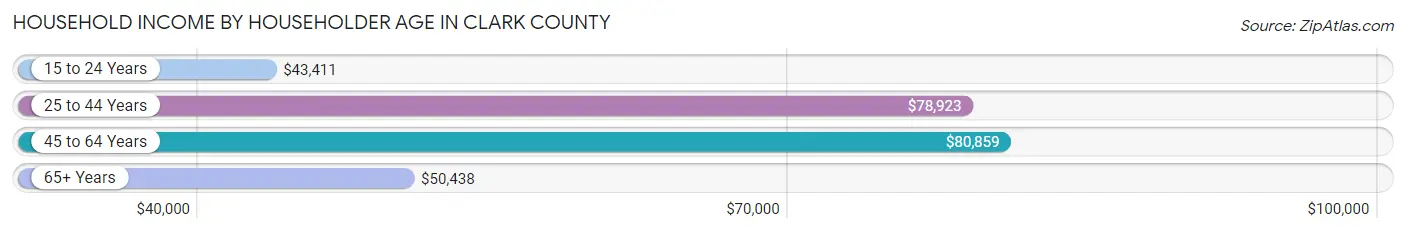
Household Income by Householder Age in Clark County
The median household income in Clark County is $69,005, with the highest median household income of $80,859 found in the 45 to 64 years age bracket for the primary householder. A total of 17,809 households (37.2%) fall into this category. Meanwhile, the 15 to 24 years age bracket for the primary householder has the lowest median household income of $43,411, with 1,630 households (3.4%) in this group.
| Income Bracket | # Households | Median Income |
| 15 to 24 Years | 1,630 (3.4%) | $43,411 |
| 25 to 44 Years | 16,187 (33.8%) | $78,923 |
| 45 to 64 Years | 17,809 (37.2%) | $80,859 |
| 65+ Years | 12,218 (25.5%) | $50,438 |
| Total | 47,844 (100.0%) | $69,005 |
Poverty in Clark County
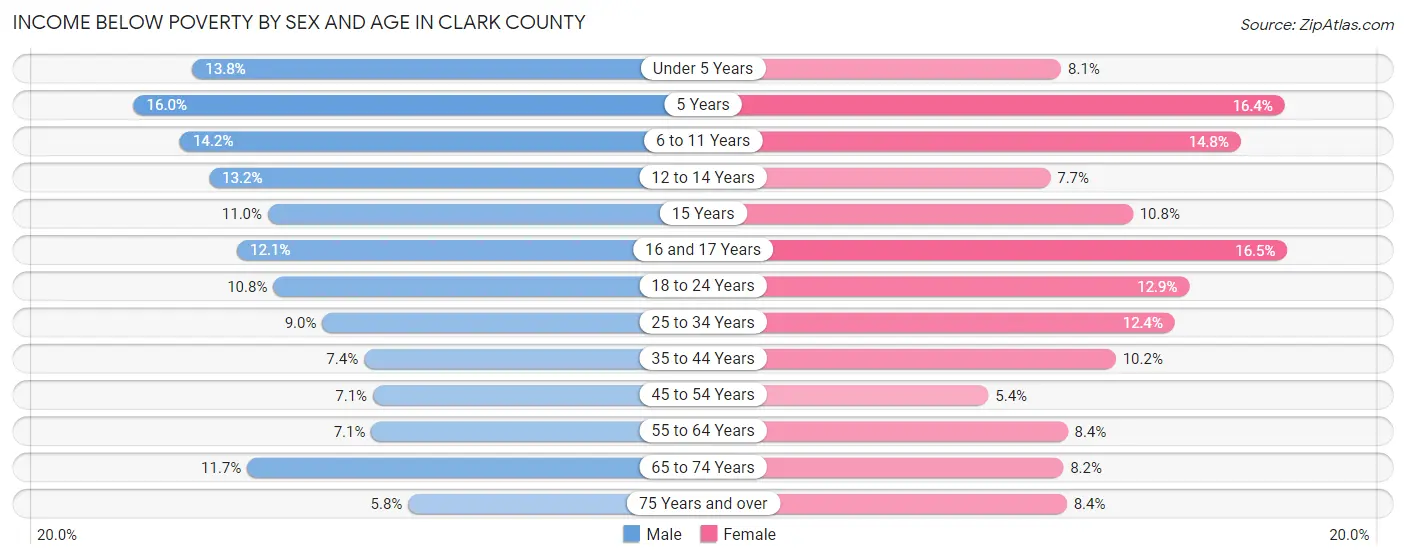
Income Below Poverty by Sex and Age in Clark County
With 9.6% poverty level for males and 9.8% for females among the residents of Clark County, 5 year old males and 16 and 17 year old females are the most vulnerable to poverty, with 118 males (16.0%) and 242 females (16.5%) in their respective age groups living below the poverty level.
| Age Bracket | Male | Female |
| Under 5 Years | 495 (13.8%) | 285 (8.1%) |
| 5 Years | 118 (16.0%) | 135 (16.4%) |
| 6 to 11 Years | 622 (14.2%) | 594 (14.8%) |
| 12 to 14 Years | 298 (13.2%) | 193 (7.7%) |
| 15 Years | 94 (11.0%) | 70 (10.8%) |
| 16 and 17 Years | 186 (12.1%) | 242 (16.5%) |
| 18 to 24 Years | 542 (10.8%) | 617 (12.9%) |
| 25 to 34 Years | 731 (8.9%) | 1,037 (12.4%) |
| 35 to 44 Years | 613 (7.4%) | 815 (10.2%) |
| 45 to 54 Years | 540 (7.1%) | 425 (5.4%) |
| 55 to 64 Years | 560 (7.1%) | 682 (8.4%) |
| 65 to 74 Years | 644 (11.7%) | 539 (8.2%) |
| 75 Years and over | 166 (5.8%) | 366 (8.4%) |
| Total | 5,609 (9.6%) | 6,000 (9.8%) |
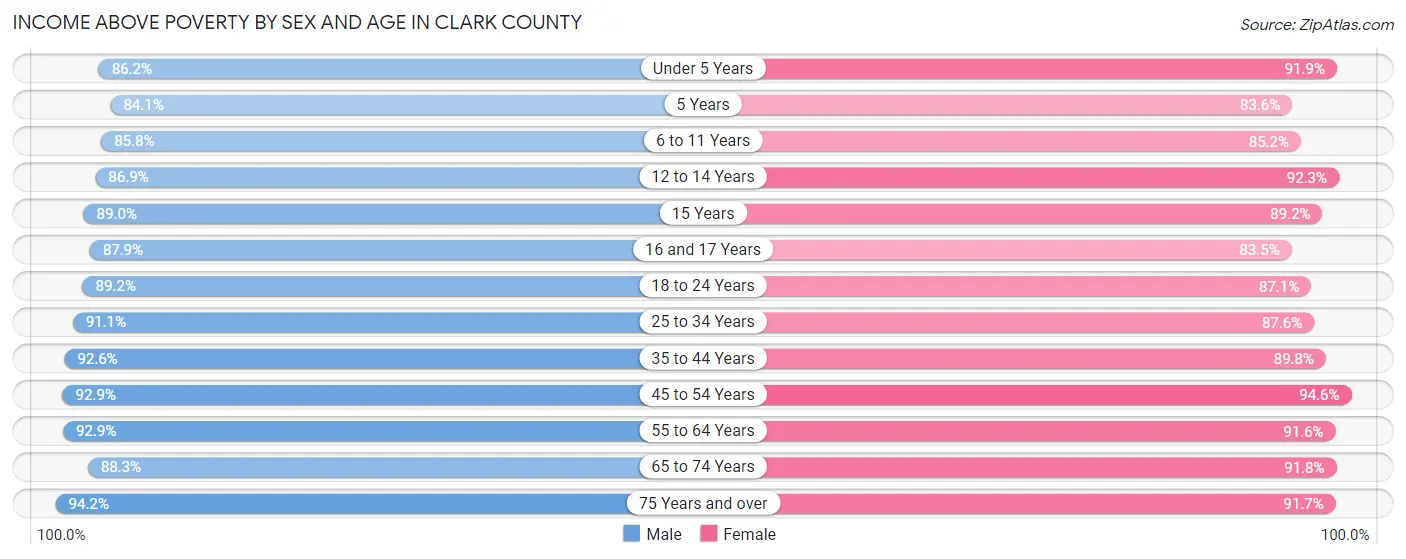
Income Above Poverty by Sex and Age in Clark County
According to the poverty statistics in Clark County, males aged 75 years and over and females aged 45 to 54 years are the age groups that are most secure financially, with 94.2% of males and 94.6% of females in these age groups living above the poverty line.
| Age Bracket | Male | Female |
| Under 5 Years | 3,099 (86.2%) | 3,216 (91.9%) |
| 5 Years | 622 (84.1%) | 686 (83.6%) |
| 6 to 11 Years | 3,748 (85.8%) | 3,417 (85.2%) |
| 12 to 14 Years | 1,968 (86.9%) | 2,302 (92.3%) |
| 15 Years | 763 (89.0%) | 578 (89.2%) |
| 16 and 17 Years | 1,350 (87.9%) | 1,221 (83.5%) |
| 18 to 24 Years | 4,489 (89.2%) | 4,167 (87.1%) |
| 25 to 34 Years | 7,441 (91.0%) | 7,350 (87.6%) |
| 35 to 44 Years | 7,668 (92.6%) | 7,198 (89.8%) |
| 45 to 54 Years | 7,099 (92.9%) | 7,389 (94.6%) |
| 55 to 64 Years | 7,297 (92.9%) | 7,460 (91.6%) |
| 65 to 74 Years | 4,842 (88.3%) | 6,015 (91.8%) |
| 75 Years and over | 2,716 (94.2%) | 4,015 (91.6%) |
| Total | 53,102 (90.4%) | 55,014 (90.2%) |
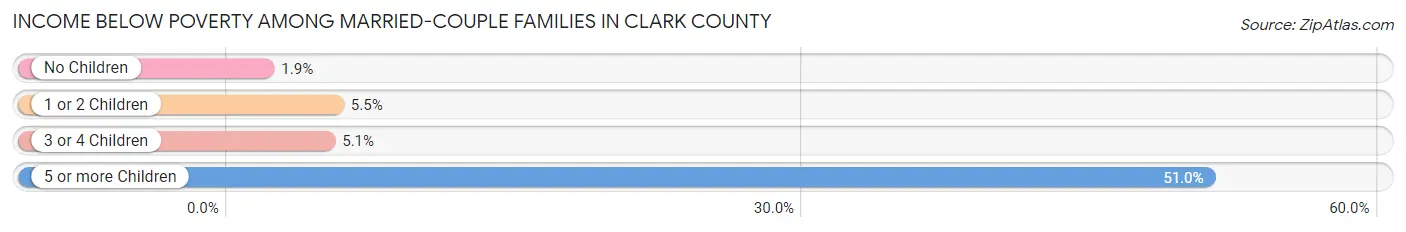
Income Below Poverty Among Married-Couple Families in Clark County
The poverty statistics for married-couple families in Clark County show that 3.6% or 832 of the total 22,967 families live below the poverty line. Families with 5 or more children have the highest poverty rate of 51.0%, comprising of 98 families. On the other hand, families with no children have the lowest poverty rate of 1.9%, which includes 272 families.
| Children | Above Poverty | Below Poverty |
| No Children | 14,024 (98.1%) | 272 (1.9%) |
| 1 or 2 Children | 6,560 (94.5%) | 384 (5.5%) |
| 3 or 4 Children | 1,457 (94.9%) | 78 (5.1%) |
| 5 or more Children | 94 (49.0%) | 98 (51.0%) |
| Total | 22,135 (96.4%) | 832 (3.6%) |
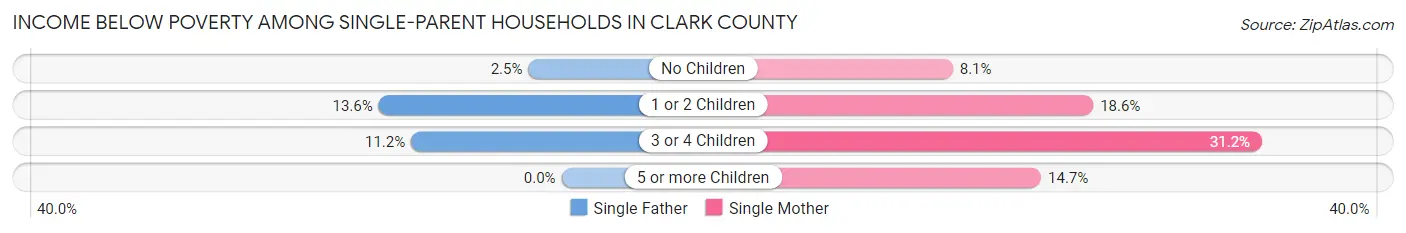
Income Below Poverty Among Single-Parent Households in Clark County
According to the poverty data in Clark County, 9.1% or 278 single-father households and 16.0% or 868 single-mother households are living below the poverty line. Among single-father households, those with 1 or 2 children have the highest poverty rate, with 212 households (13.6%) experiencing poverty. Likewise, among single-mother households, those with 3 or 4 children have the highest poverty rate, with 220 households (31.2%) falling below the poverty line.
| Children | Single Father | Single Mother |
| No Children | 29 (2.5%) | 179 (8.1%) |
| 1 or 2 Children | 212 (13.6%) | 464 (18.6%) |
| 3 or 4 Children | 37 (11.2%) | 220 (31.2%) |
| 5 or more Children | 0 (0.0%) | 5 (14.7%) |
| Total | 278 (9.1%) | 868 (16.0%) |
Income Below Poverty Among Married-Couple vs Single-Parent Households in Clark County
The poverty data for Clark County shows that 832 of the married-couple family households (3.6%) and 1,146 of the single-parent households (13.5%) are living below the poverty level. Within the married-couple family households, those with 5 or more children have the highest poverty rate, with 98 households (51.0%) falling below the poverty line. Among the single-parent households, those with 3 or 4 children have the highest poverty rate, with 257 household (24.8%) living below poverty.
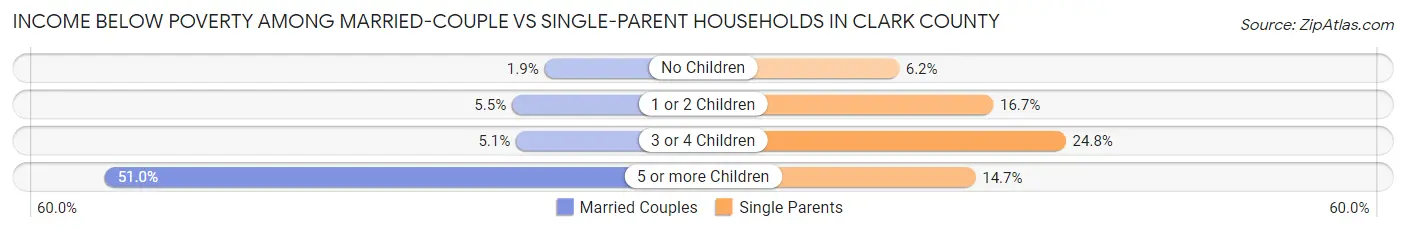
| Children | Married-Couple Families | Single-Parent Households |
| No Children | 272 (1.9%) | 208 (6.2%) |
| 1 or 2 Children | 384 (5.5%) | 676 (16.7%) |
| 3 or 4 Children | 78 (5.1%) | 257 (24.8%) |
| 5 or more Children | 98 (51.0%) | 5 (14.7%) |
| Total | 832 (3.6%) | 1,146 (13.5%) |
Employment Characteristics in Clark County
Employment by Class of Employer in Clark County
Among the 61,188 employed individuals in Clark County, private company employees (46,296 | 75.7%), not-for-profit organizations (4,000 | 6.5%), and local government employees (3,482 | 5.7%) make up the most common classes of employment.
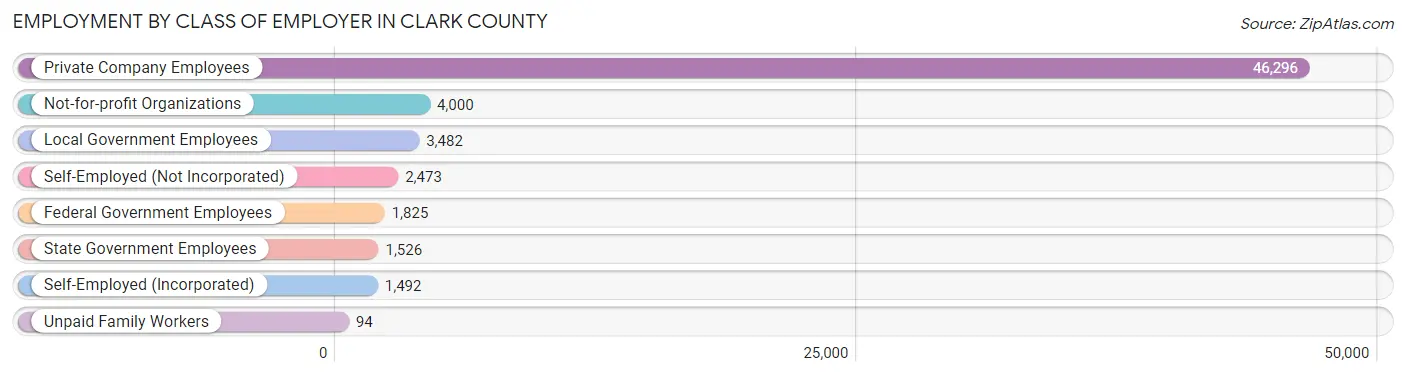
| Employer Class | # Employees | % Employees |
| Private Company Employees | 46,296 | 75.7% |
| Self-Employed (Incorporated) | 1,492 | 2.4% |
| Self-Employed (Not Incorporated) | 2,473 | 4.0% |
| Not-for-profit Organizations | 4,000 | 6.5% |
| Local Government Employees | 3,482 | 5.7% |
| State Government Employees | 1,526 | 2.5% |
| Federal Government Employees | 1,825 | 3.0% |
| Unpaid Family Workers | 94 | 0.2% |
| Total | 61,188 | 100.0% |
Employment Status by Age in Clark County
According to the labor force statistics for Clark County, out of the total population over 16 years of age (97,643), 66.3% or 64,737 individuals are in the labor force, with 3.7% or 2,395 of them unemployed. The age group with the highest labor force participation rate is 25 to 29 years, with 85.8% or 6,980 individuals in the labor force. Within the labor force, the 16 to 19 years age range has the highest percentage of unemployed individuals, with 6.7% or 186 of them being unemployed.
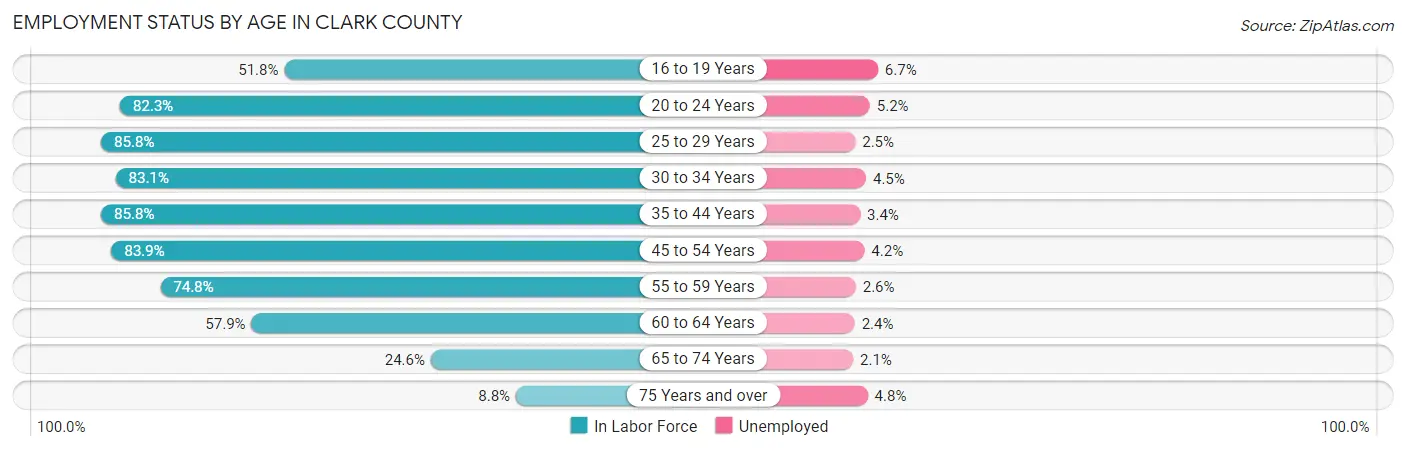
| Age Bracket | In Labor Force | Unemployed |
| 16 to 19 Years | 2,772 (51.8%) | 186 (6.7%) |
| 20 to 24 Years | 6,220 (82.3%) | 323 (5.2%) |
| 25 to 29 Years | 6,980 (85.8%) | 174 (2.5%) |
| 30 to 34 Years | 7,087 (83.1%) | 319 (4.5%) |
| 35 to 44 Years | 14,135 (85.8%) | 481 (3.4%) |
| 45 to 54 Years | 13,103 (83.9%) | 550 (4.2%) |
| 55 to 59 Years | 6,192 (74.8%) | 161 (2.6%) |
| 60 to 64 Years | 4,596 (57.9%) | 110 (2.4%) |
| 65 to 74 Years | 3,006 (24.6%) | 63 (2.1%) |
| 75 Years and over | 664 (8.8%) | 32 (4.8%) |
| Total | 64,737 (66.3%) | 2,395 (3.7%) |
Employment Status by Educational Attainment in Clark County
According to labor force statistics for Clark County, 80.2% of individuals (52,105) out of the total population between 25 and 64 years of age (64,969) are in the labor force, with 3.5% or 1,824 of them being unemployed. The group with the highest labor force participation rate are those with the educational attainment of bachelor's degree or higher, with 90.2% or 15,305 individuals in the labor force. Within the labor force, individuals with high school diploma education have the highest percentage of unemployment, with 5.5% or 810 of them being unemployed.
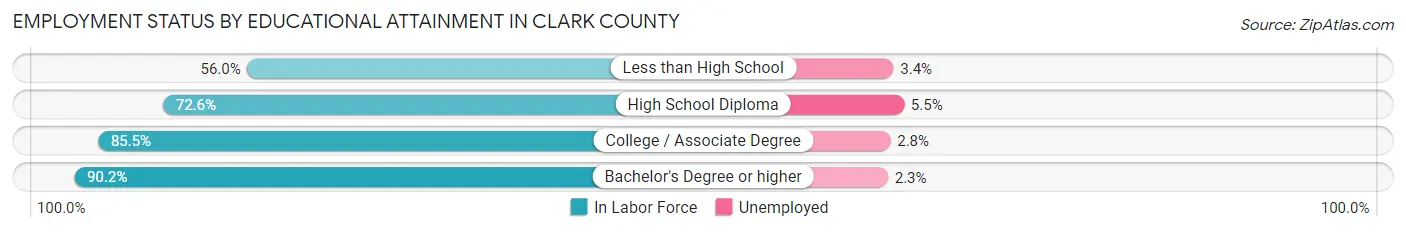
| Educational Attainment | In Labor Force | Unemployed |
| Less than High School | 3,115 (56.0%) | 189 (3.4%) |
| High School Diploma | 14,735 (72.6%) | 1,116 (5.5%) |
| College / Associate Degree | 18,931 (85.5%) | 620 (2.8%) |
| Bachelor's Degree or higher | 15,305 (90.2%) | 390 (2.3%) |
| Total | 52,105 (80.2%) | 2,274 (3.5%) |
Employment Occupations by Sex in Clark County
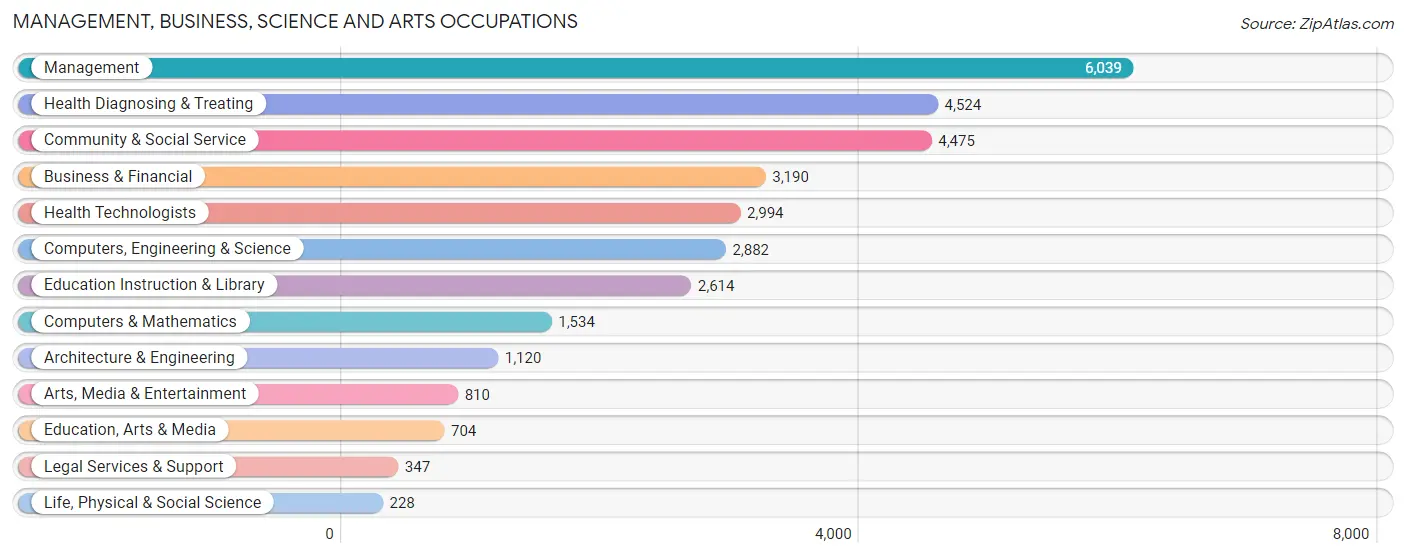
Management, Business, Science and Arts Occupations
The most common Management, Business, Science and Arts occupations in Clark County are Management (6,039 | 9.7%), Health Diagnosing & Treating (4,524 | 7.3%), Community & Social Service (4,475 | 7.2%), Business & Financial (3,190 | 5.1%), and Health Technologists (2,994 | 4.8%).
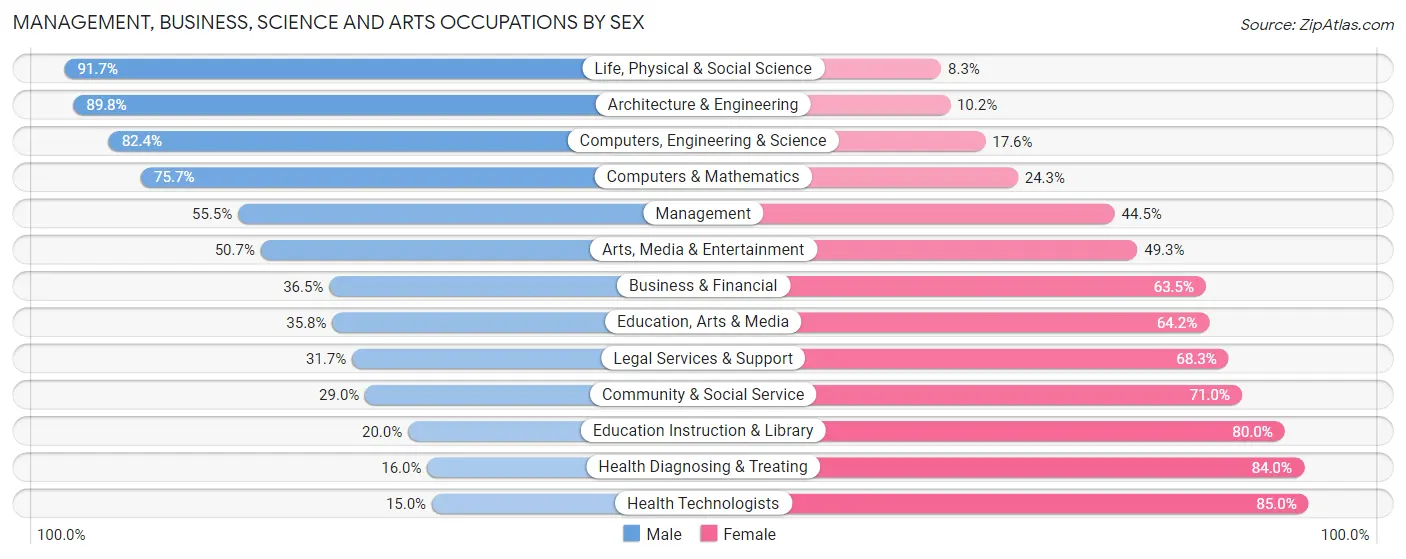
Management, Business, Science and Arts Occupations by Sex
Within the Management, Business, Science and Arts occupations in Clark County, the most male-oriented occupations are Life, Physical & Social Science (91.7%), Architecture & Engineering (89.8%), and Computers, Engineering & Science (82.4%), while the most female-oriented occupations are Health Technologists (85.0%), Health Diagnosing & Treating (84.0%), and Education Instruction & Library (80.0%).
| Occupation | Male | Female |
| Management | 3,350 (55.5%) | 2,689 (44.5%) |
| Business & Financial | 1,163 (36.5%) | 2,027 (63.5%) |
| Computers, Engineering & Science | 2,376 (82.4%) | 506 (17.6%) |
| Computers & Mathematics | 1,161 (75.7%) | 373 (24.3%) |
| Architecture & Engineering | 1,006 (89.8%) | 114 (10.2%) |
| Life, Physical & Social Science | 209 (91.7%) | 19 (8.3%) |
| Community & Social Service | 1,296 (29.0%) | 3,179 (71.0%) |
| Education, Arts & Media | 252 (35.8%) | 452 (64.2%) |
| Legal Services & Support | 110 (31.7%) | 237 (68.3%) |
| Education Instruction & Library | 523 (20.0%) | 2,091 (80.0%) |
| Arts, Media & Entertainment | 411 (50.7%) | 399 (49.3%) |
| Health Diagnosing & Treating | 724 (16.0%) | 3,800 (84.0%) |
| Health Technologists | 450 (15.0%) | 2,544 (85.0%) |
| Total (Category) | 8,909 (42.2%) | 12,201 (57.8%) |
| Total (Overall) | 32,776 (52.6%) | 29,489 (47.4%) |
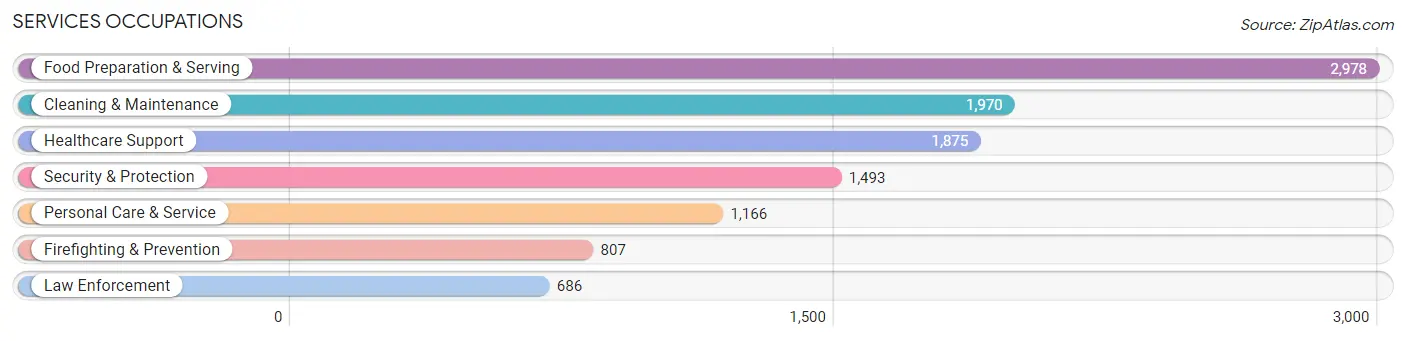
Services Occupations
The most common Services occupations in Clark County are Food Preparation & Serving (2,978 | 4.8%), Cleaning & Maintenance (1,970 | 3.2%), Healthcare Support (1,875 | 3.0%), Security & Protection (1,493 | 2.4%), and Personal Care & Service (1,166 | 1.9%).
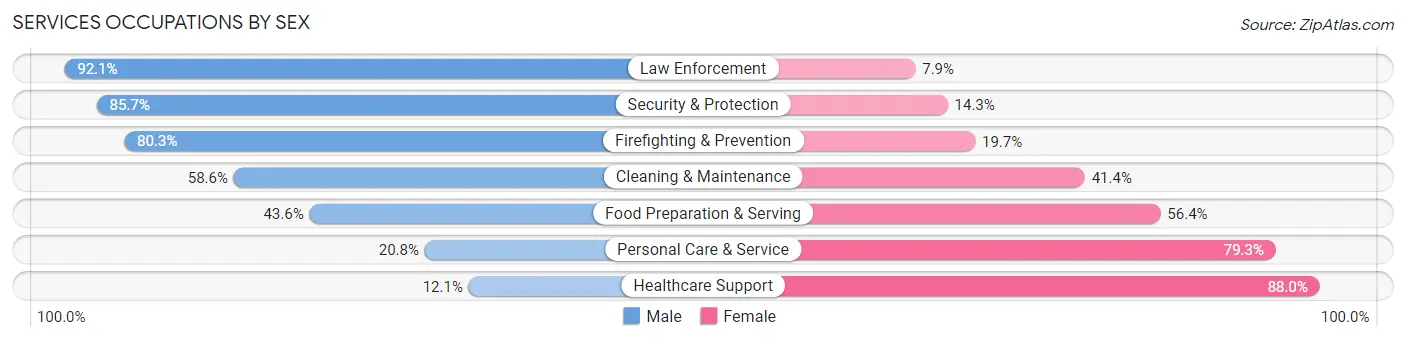
Services Occupations by Sex
Within the Services occupations in Clark County, the most male-oriented occupations are Law Enforcement (92.1%), Security & Protection (85.7%), and Firefighting & Prevention (80.3%), while the most female-oriented occupations are Healthcare Support (87.9%), Personal Care & Service (79.2%), and Food Preparation & Serving (56.4%).
| Occupation | Male | Female |
| Healthcare Support | 226 (12.0%) | 1,649 (87.9%) |
| Security & Protection | 1,280 (85.7%) | 213 (14.3%) |
| Firefighting & Prevention | 648 (80.3%) | 159 (19.7%) |
| Law Enforcement | 632 (92.1%) | 54 (7.9%) |
| Food Preparation & Serving | 1,298 (43.6%) | 1,680 (56.4%) |
| Cleaning & Maintenance | 1,154 (58.6%) | 816 (41.4%) |
| Personal Care & Service | 242 (20.7%) | 924 (79.2%) |
| Total (Category) | 4,200 (44.3%) | 5,282 (55.7%) |
| Total (Overall) | 32,776 (52.6%) | 29,489 (47.4%) |
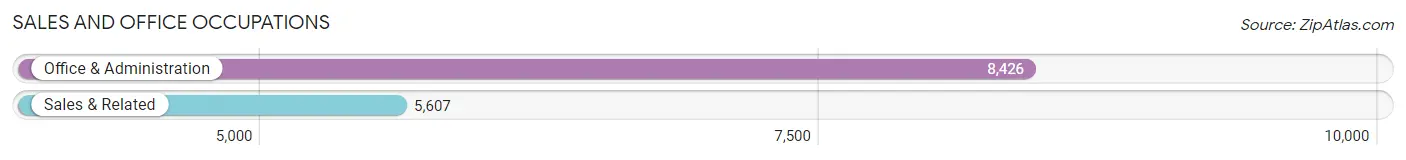
Sales and Office Occupations
The most common Sales and Office occupations in Clark County are Office & Administration (8,426 | 13.5%), and Sales & Related (5,607 | 9.0%).
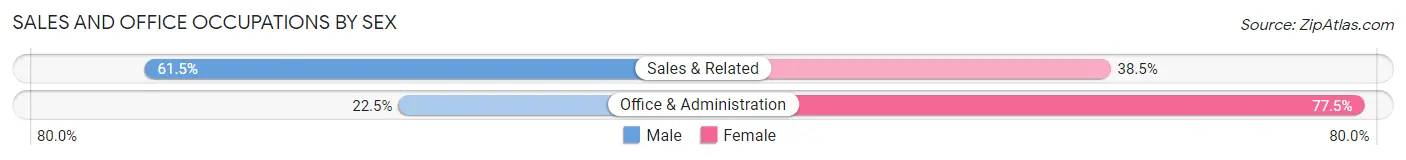
Sales and Office Occupations by Sex
| Occupation | Male | Female |
| Sales & Related | 3,450 (61.5%) | 2,157 (38.5%) |
| Office & Administration | 1,897 (22.5%) | 6,529 (77.5%) |
| Total (Category) | 5,347 (38.1%) | 8,686 (61.9%) |
| Total (Overall) | 32,776 (52.6%) | 29,489 (47.4%) |
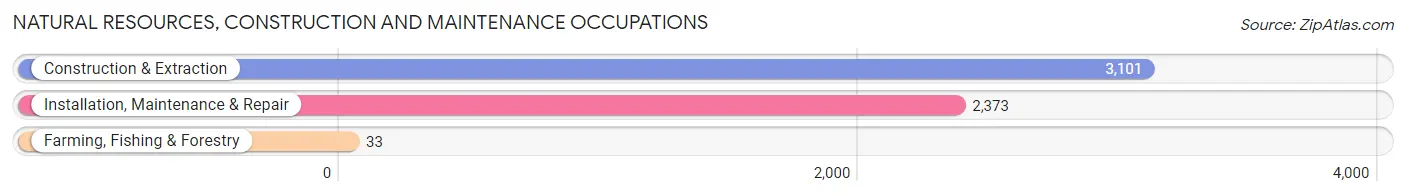
Natural Resources, Construction and Maintenance Occupations
The most common Natural Resources, Construction and Maintenance occupations in Clark County are Construction & Extraction (3,101 | 5.0%), Installation, Maintenance & Repair (2,373 | 3.8%), and Farming, Fishing & Forestry (33 | 0.1%).
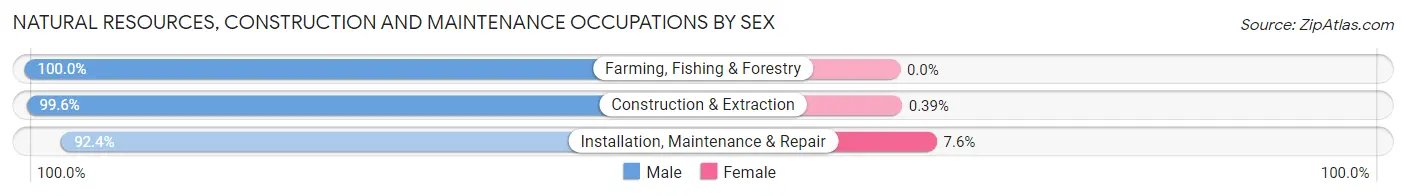
Natural Resources, Construction and Maintenance Occupations by Sex
| Occupation | Male | Female |
| Farming, Fishing & Forestry | 33 (100.0%) | 0 (0.0%) |
| Construction & Extraction | 3,089 (99.6%) | 12 (0.4%) |
| Installation, Maintenance & Repair | 2,192 (92.4%) | 181 (7.6%) |
| Total (Category) | 5,314 (96.5%) | 193 (3.5%) |
| Total (Overall) | 32,776 (52.6%) | 29,489 (47.4%) |
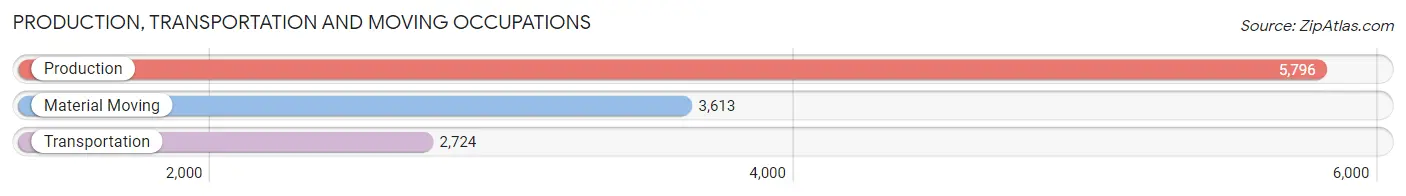
Production, Transportation and Moving Occupations
The most common Production, Transportation and Moving occupations in Clark County are Production (5,796 | 9.3%), Material Moving (3,613 | 5.8%), and Transportation (2,724 | 4.4%).
Production, Transportation and Moving Occupations by Sex
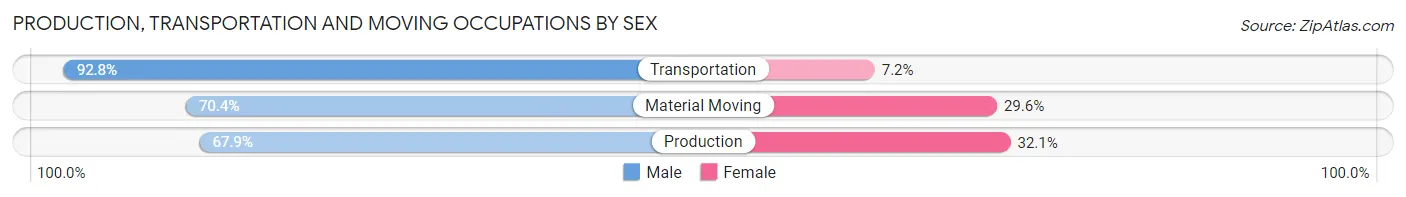
| Occupation | Male | Female |
| Production | 3,935 (67.9%) | 1,861 (32.1%) |
| Transportation | 2,528 (92.8%) | 196 (7.2%) |
| Material Moving | 2,543 (70.4%) | 1,070 (29.6%) |
| Total (Category) | 9,006 (74.2%) | 3,127 (25.8%) |
| Total (Overall) | 32,776 (52.6%) | 29,489 (47.4%) |
Employment Industries by Sex in Clark County
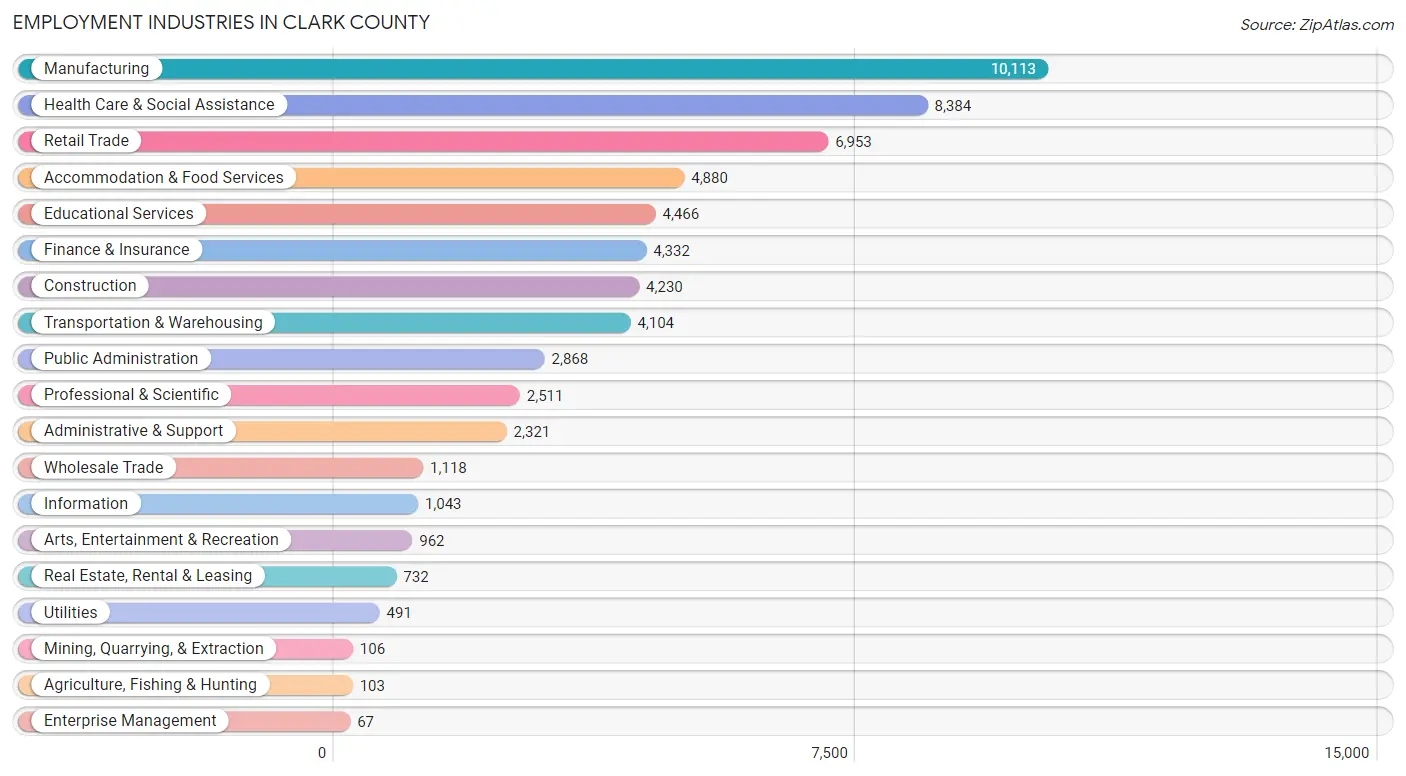
Employment Industries in Clark County
The major employment industries in Clark County include Manufacturing (10,113 | 16.2%), Health Care & Social Assistance (8,384 | 13.5%), Retail Trade (6,953 | 11.2%), Accommodation & Food Services (4,880 | 7.8%), and Educational Services (4,466 | 7.2%).
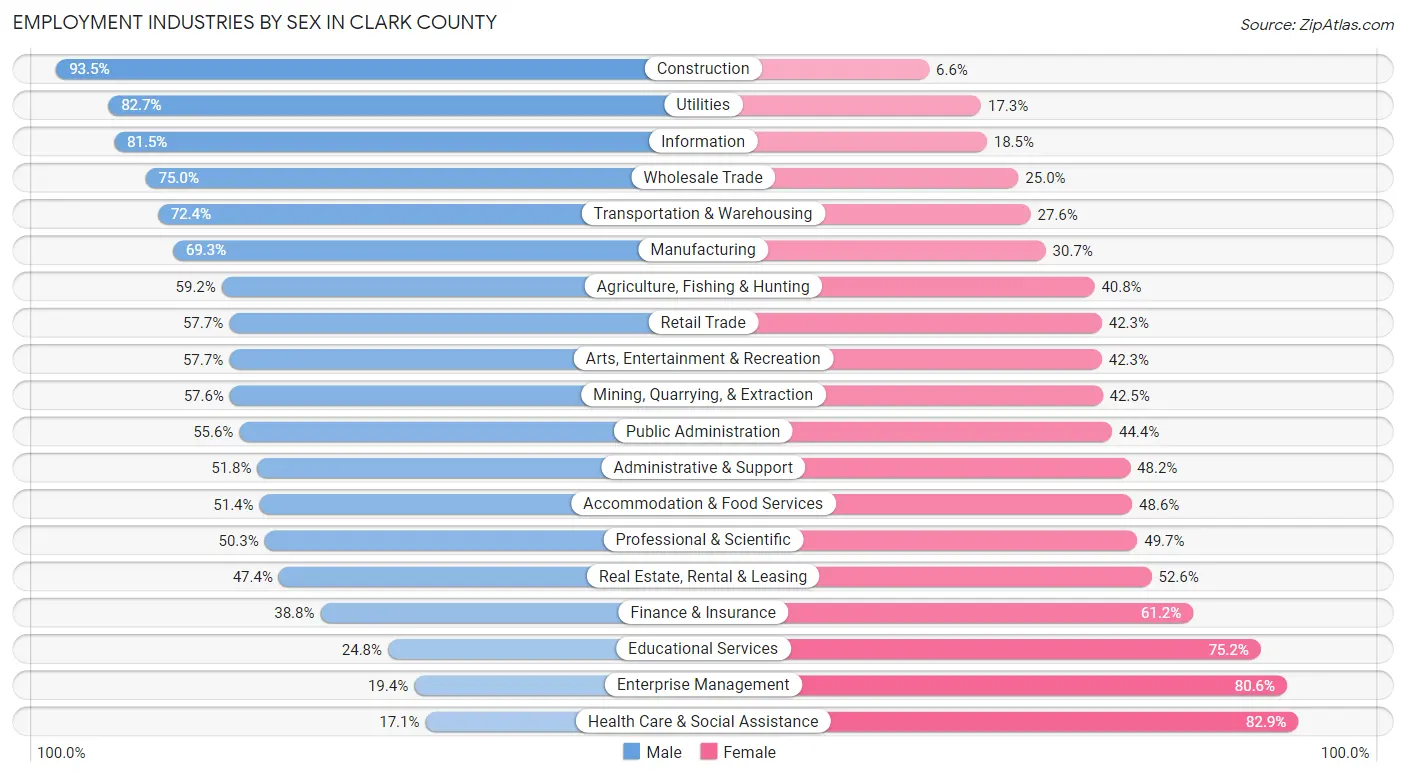
Employment Industries by Sex in Clark County
The Clark County industries that see more men than women are Construction (93.4%), Utilities (82.7%), and Information (81.5%), whereas the industries that tend to have a higher number of women are Health Care & Social Assistance (82.9%), Enterprise Management (80.6%), and Educational Services (75.2%).
| Industry | Male | Female |
| Agriculture, Fishing & Hunting | 61 (59.2%) | 42 (40.8%) |
| Mining, Quarrying, & Extraction | 61 (57.6%) | 45 (42.4%) |
| Construction | 3,953 (93.4%) | 277 (6.6%) |
| Manufacturing | 7,010 (69.3%) | 3,103 (30.7%) |
| Wholesale Trade | 838 (75.0%) | 280 (25.0%) |
| Retail Trade | 4,012 (57.7%) | 2,941 (42.3%) |
| Transportation & Warehousing | 2,973 (72.4%) | 1,131 (27.6%) |
| Utilities | 406 (82.7%) | 85 (17.3%) |
| Information | 850 (81.5%) | 193 (18.5%) |
| Finance & Insurance | 1,681 (38.8%) | 2,651 (61.2%) |
| Real Estate, Rental & Leasing | 347 (47.4%) | 385 (52.6%) |
| Professional & Scientific | 1,264 (50.3%) | 1,247 (49.7%) |
| Enterprise Management | 13 (19.4%) | 54 (80.6%) |
| Administrative & Support | 1,203 (51.8%) | 1,118 (48.2%) |
| Educational Services | 1,108 (24.8%) | 3,358 (75.2%) |
| Health Care & Social Assistance | 1,430 (17.1%) | 6,954 (82.9%) |
| Arts, Entertainment & Recreation | 555 (57.7%) | 407 (42.3%) |
| Accommodation & Food Services | 2,509 (51.4%) | 2,371 (48.6%) |
| Public Administration | 1,594 (55.6%) | 1,274 (44.4%) |
| Total | 32,776 (52.6%) | 29,489 (47.4%) |
Education in Clark County
School Enrollment in Clark County
The most common levels of schooling among the 26,478 students in Clark County are high school (6,448 | 24.3%), middle school (6,000 | 22.7%), and elementary school (5,456 | 20.6%).
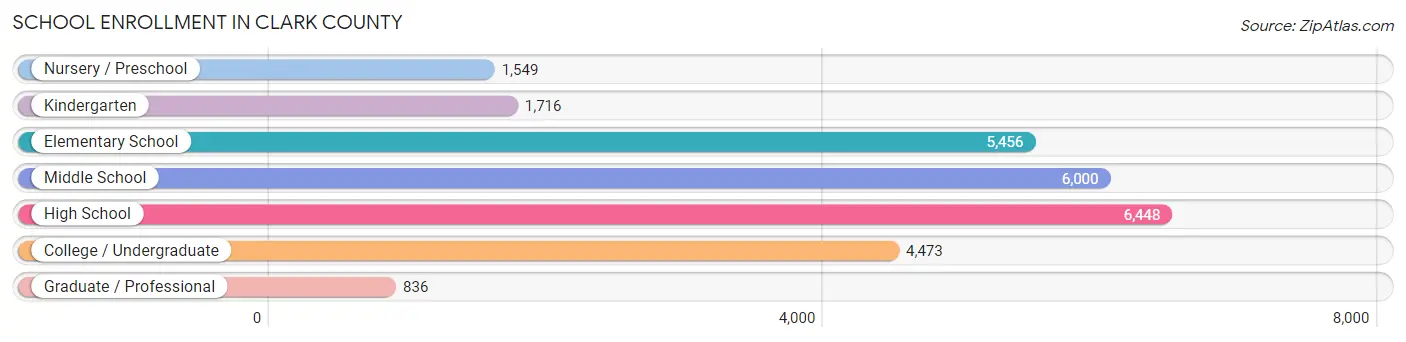
| School Level | # Students | % Students |
| Nursery / Preschool | 1,549 | 5.9% |
| Kindergarten | 1,716 | 6.5% |
| Elementary School | 5,456 | 20.6% |
| Middle School | 6,000 | 22.7% |
| High School | 6,448 | 24.3% |
| College / Undergraduate | 4,473 | 16.9% |
| Graduate / Professional | 836 | 3.2% |
| Total | 26,478 | 100.0% |
School Enrollment by Age by Funding Source in Clark County
Out of a total of 26,478 students who are enrolled in schools in Clark County, 4,554 (17.2%) attend a private institution, while the remaining 21,924 (82.8%) are enrolled in public schools. The age group of 3 to 4 year olds has the highest likelihood of being enrolled in private schools, with 421 (42.8% in the age bracket) enrolled. Conversely, the age group of 25 to 34 year olds has the lowest likelihood of being enrolled in a private school, with 1,214 (89.3% in the age bracket) attending a public institution.
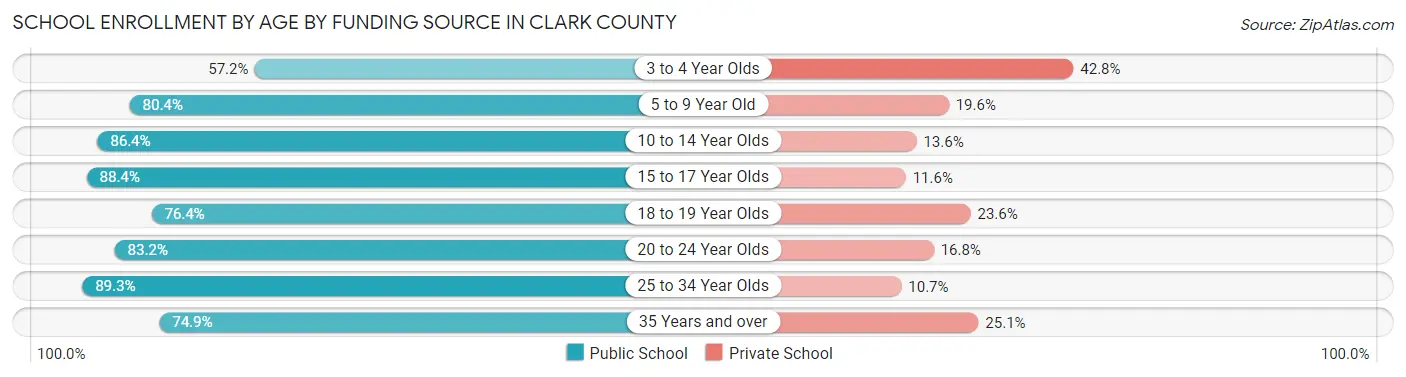
| Age Bracket | Public School | Private School |
| 3 to 4 Year Olds | 563 (57.2%) | 421 (42.8%) |
| 5 to 9 Year Old | 5,660 (80.4%) | 1,377 (19.6%) |
| 10 to 14 Year Olds | 6,574 (86.4%) | 1,031 (13.6%) |
| 15 to 17 Year Olds | 3,894 (88.4%) | 509 (11.6%) |
| 18 to 19 Year Olds | 1,328 (76.4%) | 411 (23.6%) |
| 20 to 24 Year Olds | 1,797 (83.2%) | 362 (16.8%) |
| 25 to 34 Year Olds | 1,214 (89.3%) | 146 (10.7%) |
| 35 Years and over | 892 (74.9%) | 299 (25.1%) |
| Total | 21,924 (82.8%) | 4,554 (17.2%) |
Educational Attainment by Field of Study in Clark County
Business (5,154 | 23.2%), education (3,283 | 14.8%), science & technology (2,947 | 13.3%), communications (1,382 | 6.2%), and engineering (1,230 | 5.6%) are the most common fields of study among 22,174 individuals in Clark County who have obtained a bachelor's degree or higher.

| Field of Study | # Graduates | % Graduates |
| Computers & Mathematics | 963 | 4.3% |
| Bio, Nature & Agricultural | 1,104 | 5.0% |
| Physical & Health Sciences | 560 | 2.5% |
| Psychology | 960 | 4.3% |
| Social Sciences | 1,130 | 5.1% |
| Engineering | 1,230 | 5.6% |
| Multidisciplinary Studies | 96 | 0.4% |
| Science & Technology | 2,947 | 13.3% |
| Business | 5,154 | 23.2% |
| Education | 3,283 | 14.8% |
| Literature & Languages | 740 | 3.3% |
| Liberal Arts & History | 1,204 | 5.4% |
| Visual & Performing Arts | 530 | 2.4% |
| Communications | 1,382 | 6.2% |
| Arts & Humanities | 891 | 4.0% |
| Total | 22,174 | 100.0% |
Transportation & Commute in Clark County
Vehicle Availability by Sex in Clark County
The most prevalent vehicle ownership categories in Clark County are males with 2 vehicles (14,653, accounting for 45.4%) and females with 2 vehicles (12,123, making up 50.8%).
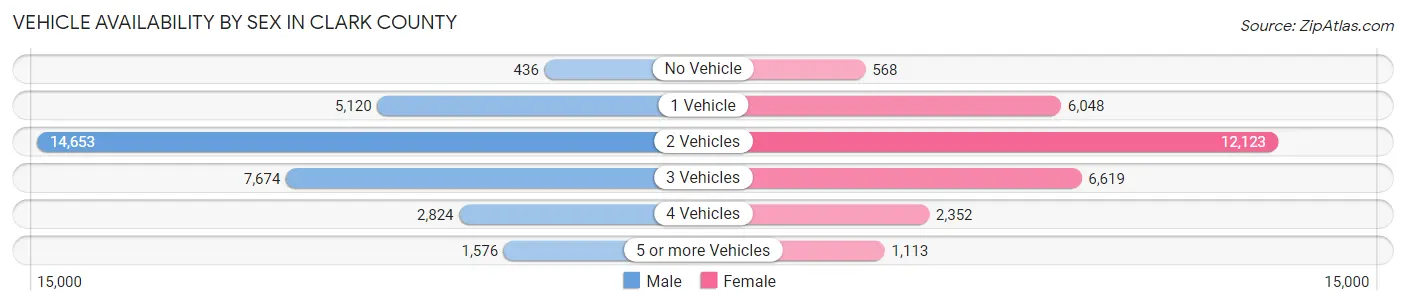
| Vehicles Available | Male | Female |
| No Vehicle | 436 (1.3%) | 568 (2.0%) |
| 1 Vehicle | 5,120 (15.9%) | 6,048 (21.0%) |
| 2 Vehicles | 14,653 (45.4%) | 12,123 (42.1%) |
| 3 Vehicles | 7,674 (23.8%) | 6,619 (23.0%) |
| 4 Vehicles | 2,824 (8.7%) | 2,352 (8.2%) |
| 5 or more Vehicles | 1,576 (4.9%) | 1,113 (3.9%) |
| Total | 32,283 (100.0%) | 28,823 (100.0%) |
Commute Time in Clark County
The most frequently occuring commute durations in Clark County are 20 to 24 minutes (11,002 commuters, 19.9%), 15 to 19 minutes (10,087 commuters, 18.3%), and 30 to 34 minutes (8,065 commuters, 14.6%).
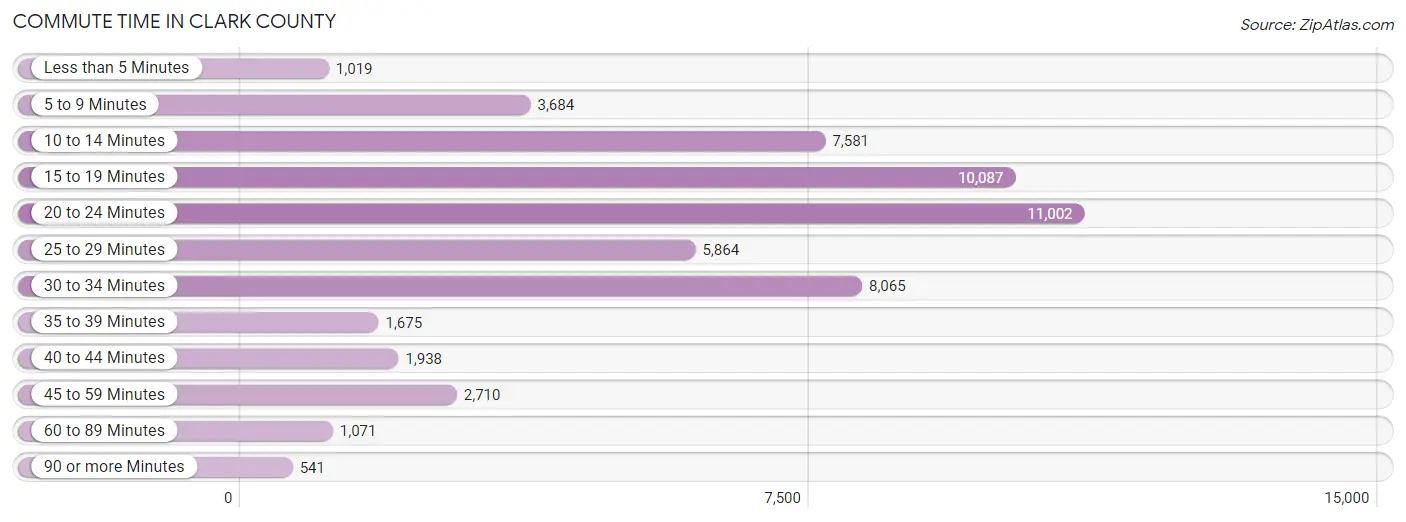
| Commute Time | # Commuters | % Commuters |
| Less than 5 Minutes | 1,019 | 1.8% |
| 5 to 9 Minutes | 3,684 | 6.7% |
| 10 to 14 Minutes | 7,581 | 13.7% |
| 15 to 19 Minutes | 10,087 | 18.3% |
| 20 to 24 Minutes | 11,002 | 19.9% |
| 25 to 29 Minutes | 5,864 | 10.6% |
| 30 to 34 Minutes | 8,065 | 14.6% |
| 35 to 39 Minutes | 1,675 | 3.0% |
| 40 to 44 Minutes | 1,938 | 3.5% |
| 45 to 59 Minutes | 2,710 | 4.9% |
| 60 to 89 Minutes | 1,071 | 1.9% |
| 90 or more Minutes | 541 | 1.0% |
Commute Time by Sex in Clark County
The most common commute times in Clark County are 20 to 24 minutes (5,606 commuters, 18.8%) for males and 20 to 24 minutes (5,396 commuters, 21.2%) for females.
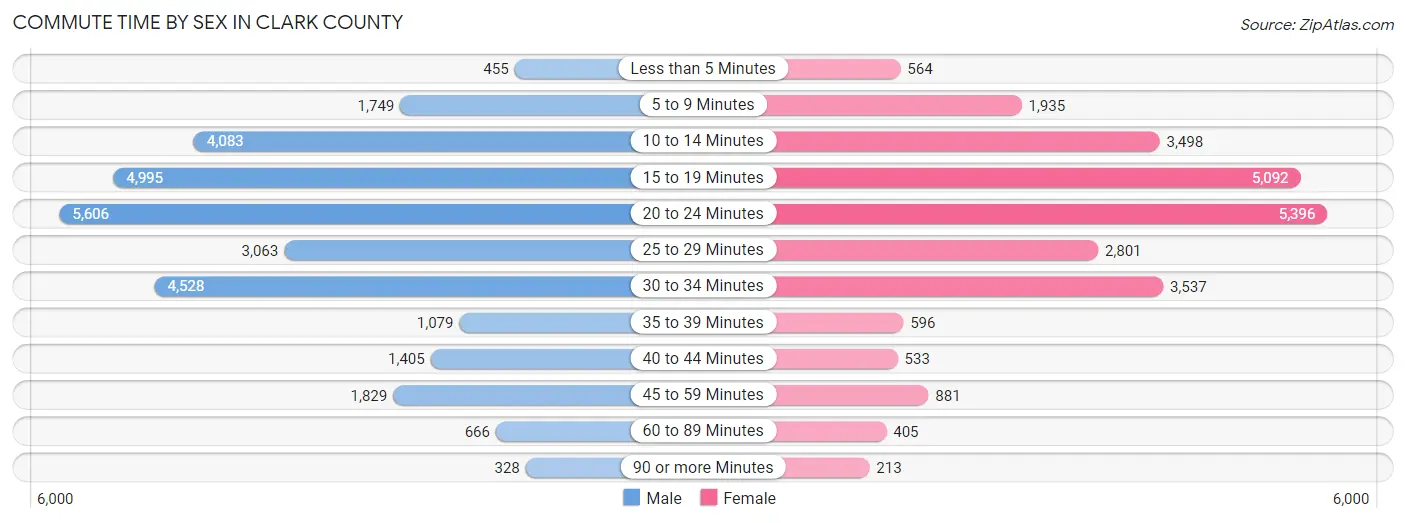
| Commute Time | Male | Female |
| Less than 5 Minutes | 455 (1.5%) | 564 (2.2%) |
| 5 to 9 Minutes | 1,749 (5.9%) | 1,935 (7.6%) |
| 10 to 14 Minutes | 4,083 (13.7%) | 3,498 (13.7%) |
| 15 to 19 Minutes | 4,995 (16.8%) | 5,092 (20.0%) |
| 20 to 24 Minutes | 5,606 (18.8%) | 5,396 (21.2%) |
| 25 to 29 Minutes | 3,063 (10.3%) | 2,801 (11.0%) |
| 30 to 34 Minutes | 4,528 (15.2%) | 3,537 (13.9%) |
| 35 to 39 Minutes | 1,079 (3.6%) | 596 (2.3%) |
| 40 to 44 Minutes | 1,405 (4.7%) | 533 (2.1%) |
| 45 to 59 Minutes | 1,829 (6.1%) | 881 (3.5%) |
| 60 to 89 Minutes | 666 (2.2%) | 405 (1.6%) |
| 90 or more Minutes | 328 (1.1%) | 213 (0.8%) |
Time of Departure to Work by Sex in Clark County
The most frequent times of departure to work in Clark County are 7:00 AM to 7:29 AM (3,841, 12.9%) for males and 7:30 AM to 7:59 AM (4,217, 16.6%) for females.
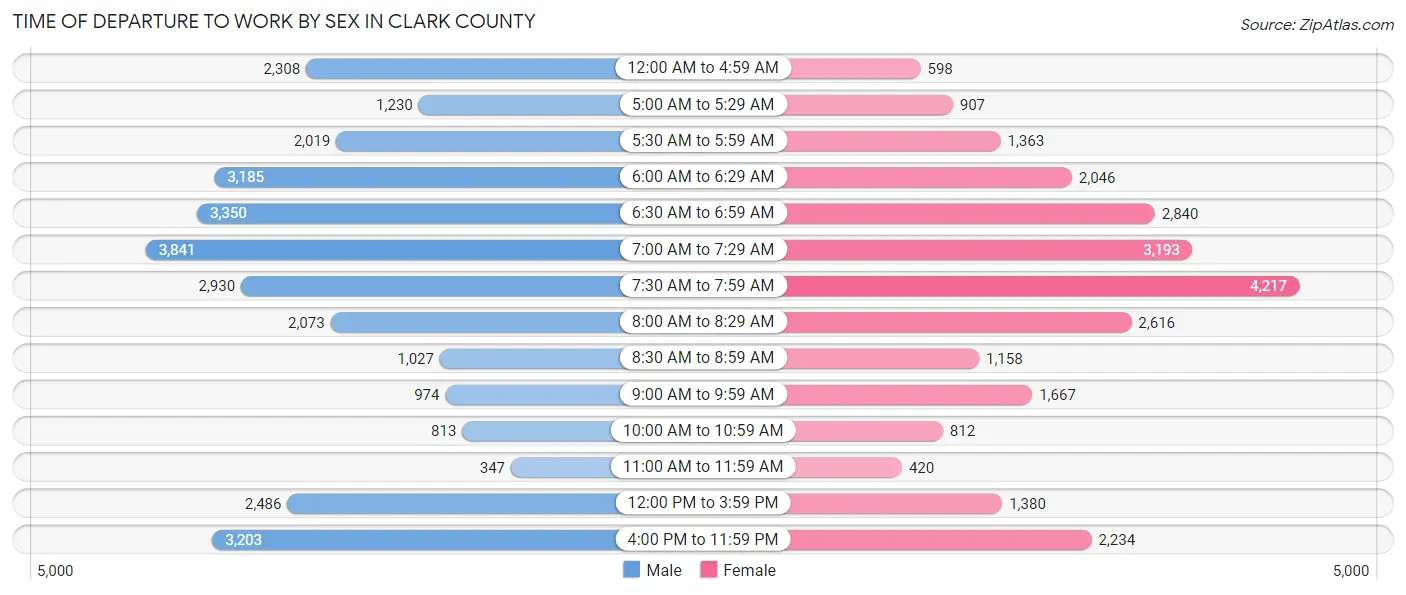
| Time of Departure | Male | Female |
| 12:00 AM to 4:59 AM | 2,308 (7.7%) | 598 (2.4%) |
| 5:00 AM to 5:29 AM | 1,230 (4.1%) | 907 (3.6%) |
| 5:30 AM to 5:59 AM | 2,019 (6.8%) | 1,363 (5.4%) |
| 6:00 AM to 6:29 AM | 3,185 (10.7%) | 2,046 (8.0%) |
| 6:30 AM to 6:59 AM | 3,350 (11.3%) | 2,840 (11.2%) |
| 7:00 AM to 7:29 AM | 3,841 (12.9%) | 3,193 (12.6%) |
| 7:30 AM to 7:59 AM | 2,930 (9.8%) | 4,217 (16.6%) |
| 8:00 AM to 8:29 AM | 2,073 (7.0%) | 2,616 (10.3%) |
| 8:30 AM to 8:59 AM | 1,027 (3.5%) | 1,158 (4.5%) |
| 9:00 AM to 9:59 AM | 974 (3.3%) | 1,667 (6.6%) |
| 10:00 AM to 10:59 AM | 813 (2.7%) | 812 (3.2%) |
| 11:00 AM to 11:59 AM | 347 (1.2%) | 420 (1.7%) |
| 12:00 PM to 3:59 PM | 2,486 (8.4%) | 1,380 (5.4%) |
| 4:00 PM to 11:59 PM | 3,203 (10.7%) | 2,234 (8.8%) |
| Total | 29,786 (100.0%) | 25,451 (100.0%) |
Housing Occupancy in Clark County
Occupancy by Ownership in Clark County
Of the total 47,844 dwellings in Clark County, owner-occupied units account for 35,643 (74.5%), while renter-occupied units make up 12,201 (25.5%).
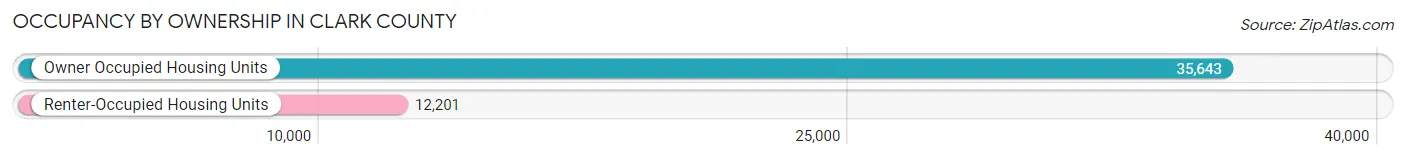
| Occupancy | # Housing Units | % Housing Units |
| Owner Occupied Housing Units | 35,643 | 74.5% |
| Renter-Occupied Housing Units | 12,201 | 25.5% |
| Total Occupied Housing Units | 47,844 | 100.0% |
Occupancy by Household Size in Clark County
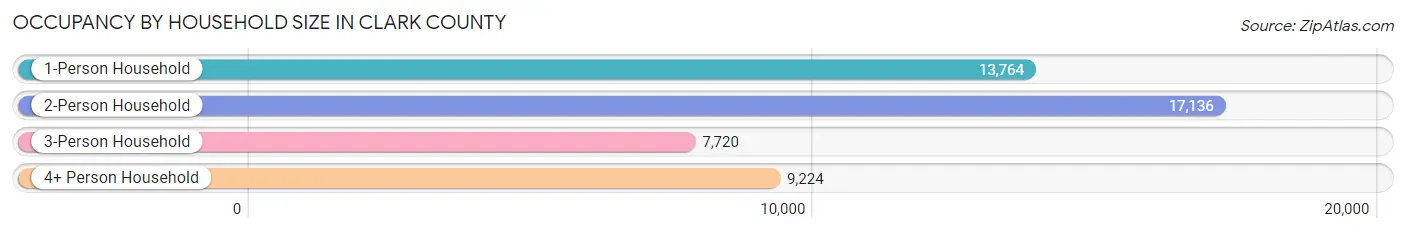
| Household Size | # Housing Units | % Housing Units |
| 1-Person Household | 13,764 | 28.8% |
| 2-Person Household | 17,136 | 35.8% |
| 3-Person Household | 7,720 | 16.1% |
| 4+ Person Household | 9,224 | 19.3% |
| Total Housing Units | 47,844 | 100.0% |
Occupancy by Ownership by Household Size in Clark County
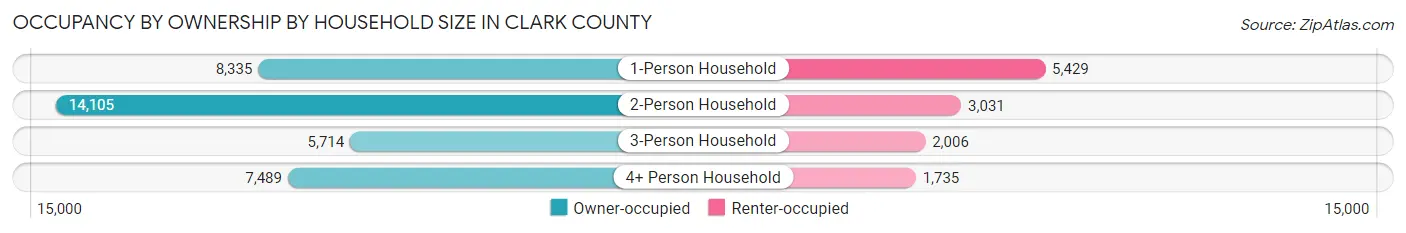
| Household Size | Owner-occupied | Renter-occupied |
| 1-Person Household | 8,335 (60.6%) | 5,429 (39.4%) |
| 2-Person Household | 14,105 (82.3%) | 3,031 (17.7%) |
| 3-Person Household | 5,714 (74.0%) | 2,006 (26.0%) |
| 4+ Person Household | 7,489 (81.2%) | 1,735 (18.8%) |
| Total Housing Units | 35,643 (74.5%) | 12,201 (25.5%) |
Occupancy by Educational Attainment in Clark County
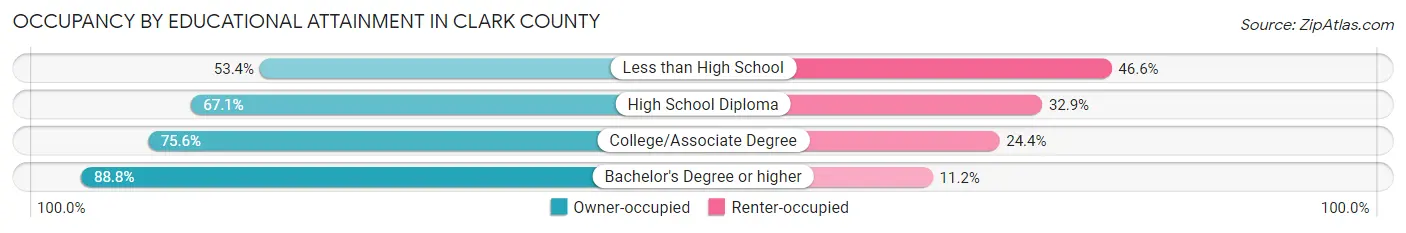
| Household Size | Owner-occupied | Renter-occupied |
| Less than High School | 2,145 (53.4%) | 1,875 (46.6%) |
| High School Diploma | 9,990 (67.1%) | 4,891 (32.9%) |
| College/Associate Degree | 12,550 (75.6%) | 4,053 (24.4%) |
| Bachelor's Degree or higher | 10,958 (88.8%) | 1,382 (11.2%) |
Occupancy by Age of Householder in Clark County
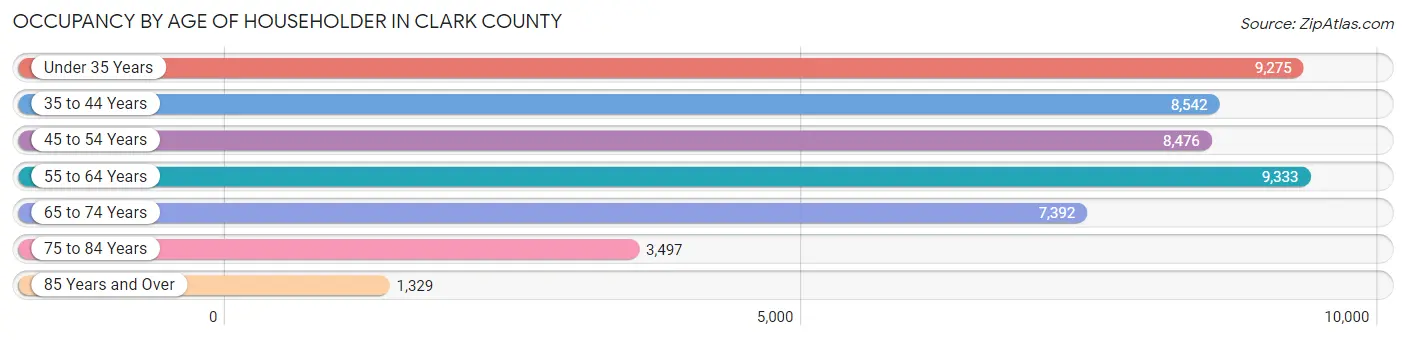
| Age Bracket | # Households | % Households |
| Under 35 Years | 9,275 | 19.4% |
| 35 to 44 Years | 8,542 | 17.8% |
| 45 to 54 Years | 8,476 | 17.7% |
| 55 to 64 Years | 9,333 | 19.5% |
| 65 to 74 Years | 7,392 | 15.4% |
| 75 to 84 Years | 3,497 | 7.3% |
| 85 Years and Over | 1,329 | 2.8% |
| Total | 47,844 | 100.0% |
Housing Finances in Clark County
Median Income by Occupancy in Clark County
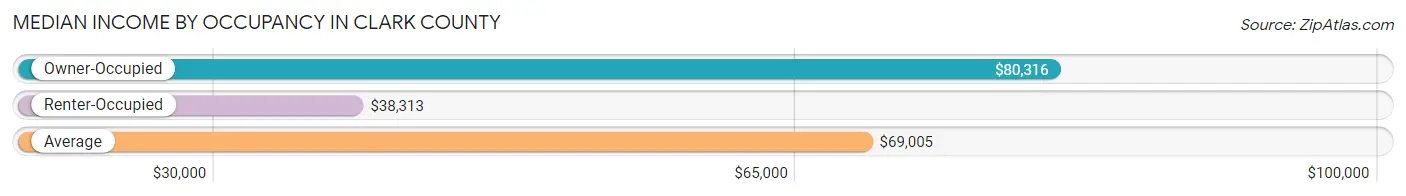
| Occupancy Type | # Households | Median Income |
| Owner-Occupied | 35,643 (74.5%) | $80,316 |
| Renter-Occupied | 12,201 (25.5%) | $38,313 |
| Average | 47,844 (100.0%) | $69,005 |
Occupancy by Householder Income Bracket in Clark County
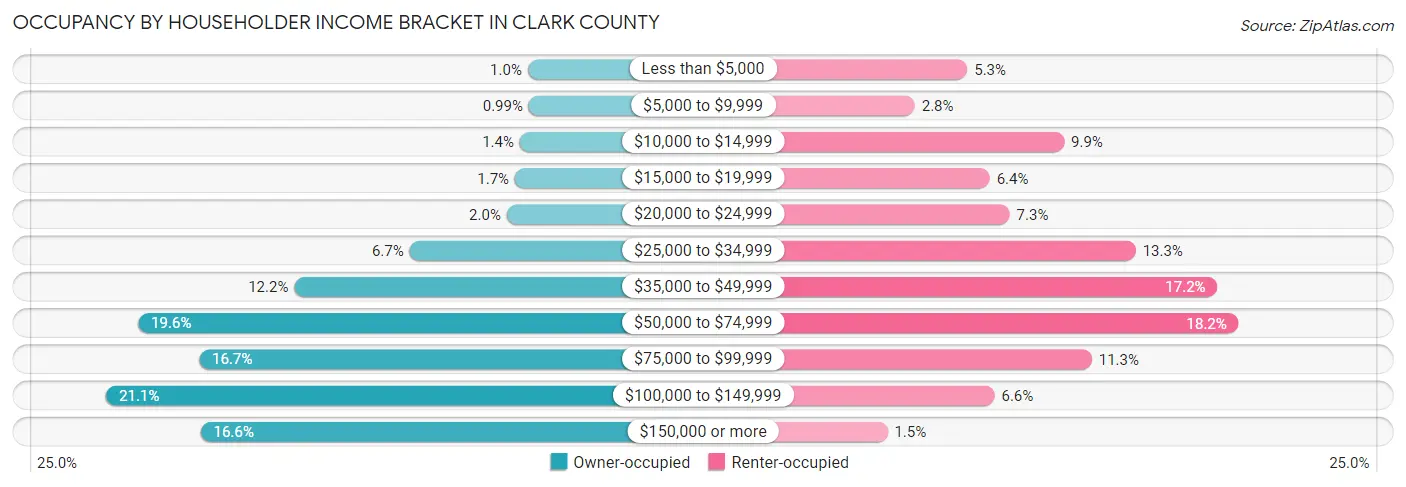
| Income Bracket | Owner-occupied | Renter-occupied |
| Less than $5,000 | 370 (1.0%) | 649 (5.3%) |
| $5,000 to $9,999 | 353 (1.0%) | 344 (2.8%) |
| $10,000 to $14,999 | 505 (1.4%) | 1,212 (9.9%) |
| $15,000 to $19,999 | 588 (1.7%) | 780 (6.4%) |
| $20,000 to $24,999 | 727 (2.0%) | 895 (7.3%) |
| $25,000 to $34,999 | 2,379 (6.7%) | 1,628 (13.3%) |
| $35,000 to $49,999 | 4,335 (12.2%) | 2,102 (17.2%) |
| $50,000 to $74,999 | 6,986 (19.6%) | 2,225 (18.2%) |
| $75,000 to $99,999 | 5,949 (16.7%) | 1,373 (11.3%) |
| $100,000 to $149,999 | 7,527 (21.1%) | 808 (6.6%) |
| $150,000 or more | 5,924 (16.6%) | 185 (1.5%) |
| Total | 35,643 (100.0%) | 12,201 (100.0%) |
Monthly Housing Cost Tiers in Clark County
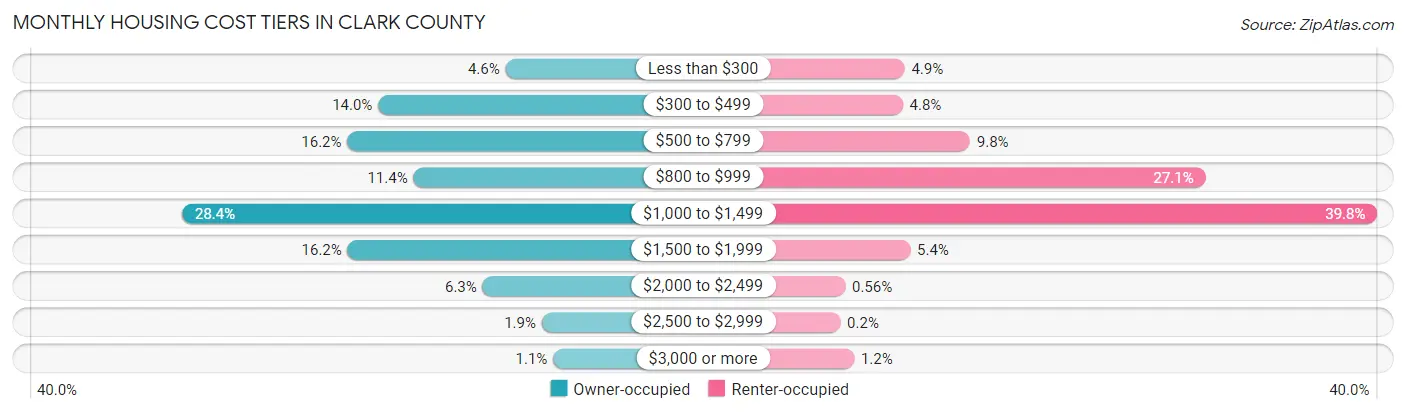
| Monthly Cost | Owner-occupied | Renter-occupied |
| Less than $300 | 1,633 (4.6%) | 603 (4.9%) |
| $300 to $499 | 4,974 (14.0%) | 586 (4.8%) |
| $500 to $799 | 5,784 (16.2%) | 1,189 (9.8%) |
| $800 to $999 | 4,049 (11.4%) | 3,308 (27.1%) |
| $1,000 to $1,499 | 10,128 (28.4%) | 4,851 (39.8%) |
| $1,500 to $1,999 | 5,777 (16.2%) | 653 (5.3%) |
| $2,000 to $2,499 | 2,236 (6.3%) | 68 (0.6%) |
| $2,500 to $2,999 | 680 (1.9%) | 24 (0.2%) |
| $3,000 or more | 382 (1.1%) | 149 (1.2%) |
| Total | 35,643 (100.0%) | 12,201 (100.0%) |
Physical Housing Characteristics in Clark County
Housing Structures in Clark County
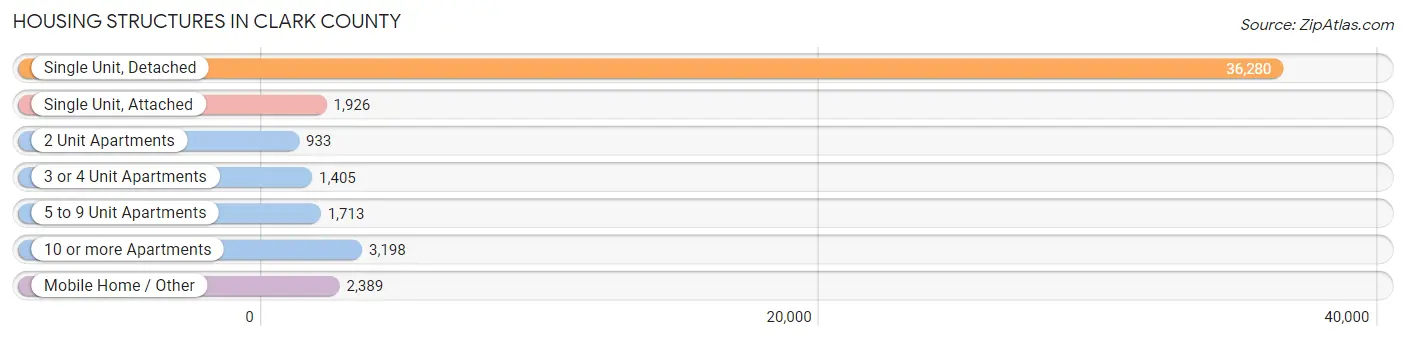
| Structure Type | # Housing Units | % Housing Units |
| Single Unit, Detached | 36,280 | 75.8% |
| Single Unit, Attached | 1,926 | 4.0% |
| 2 Unit Apartments | 933 | 1.9% |
| 3 or 4 Unit Apartments | 1,405 | 2.9% |
| 5 to 9 Unit Apartments | 1,713 | 3.6% |
| 10 or more Apartments | 3,198 | 6.7% |
| Mobile Home / Other | 2,389 | 5.0% |
| Total | 47,844 | 100.0% |
Housing Structures by Occupancy in Clark County
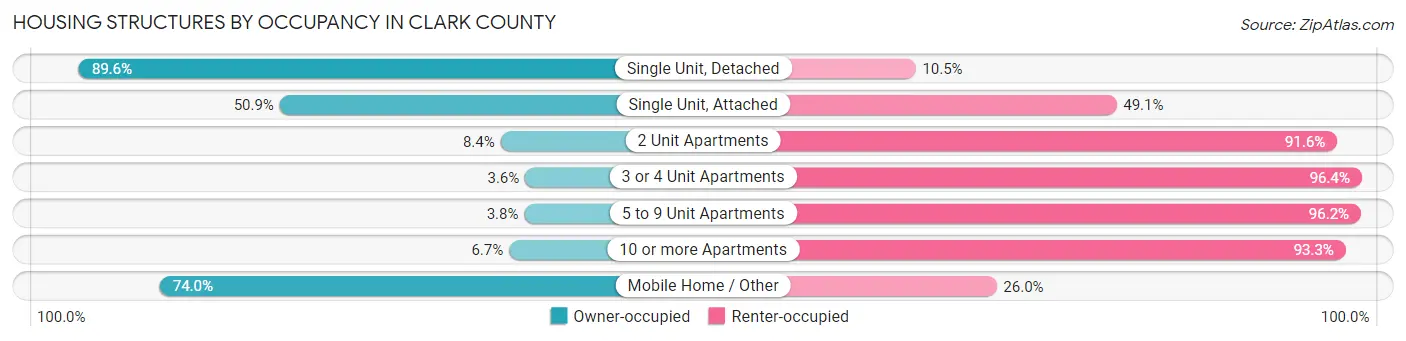
| Structure Type | Owner-occupied | Renter-occupied |
| Single Unit, Detached | 32,487 (89.5%) | 3,793 (10.4%) |
| Single Unit, Attached | 980 (50.9%) | 946 (49.1%) |
| 2 Unit Apartments | 78 (8.4%) | 855 (91.6%) |
| 3 or 4 Unit Apartments | 51 (3.6%) | 1,354 (96.4%) |
| 5 to 9 Unit Apartments | 65 (3.8%) | 1,648 (96.2%) |
| 10 or more Apartments | 215 (6.7%) | 2,983 (93.3%) |
| Mobile Home / Other | 1,767 (74.0%) | 622 (26.0%) |
| Total | 35,643 (74.5%) | 12,201 (25.5%) |
Housing Structures by Number of Rooms in Clark County
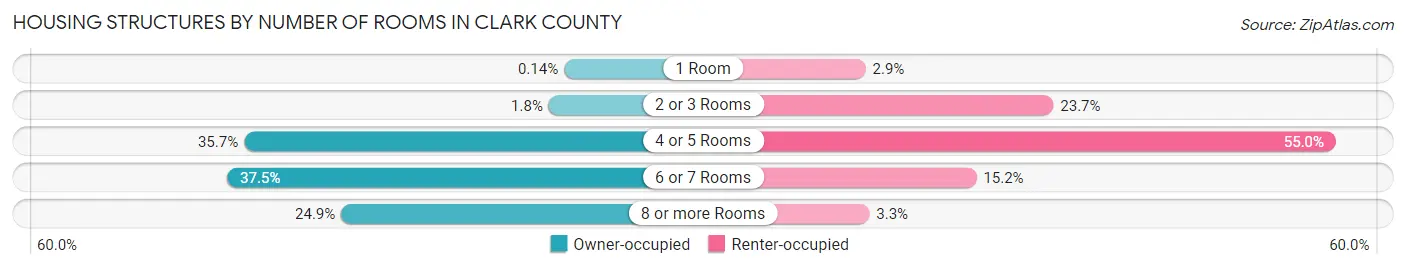
| Number of Rooms | Owner-occupied | Renter-occupied |
| 1 Room | 50 (0.1%) | 348 (2.9%) |
| 2 or 3 Rooms | 653 (1.8%) | 2,890 (23.7%) |
| 4 or 5 Rooms | 12,705 (35.6%) | 6,715 (55.0%) |
| 6 or 7 Rooms | 13,372 (37.5%) | 1,849 (15.1%) |
| 8 or more Rooms | 8,863 (24.9%) | 399 (3.3%) |
| Total | 35,643 (100.0%) | 12,201 (100.0%) |
Housing Structure by Heating Type in Clark County
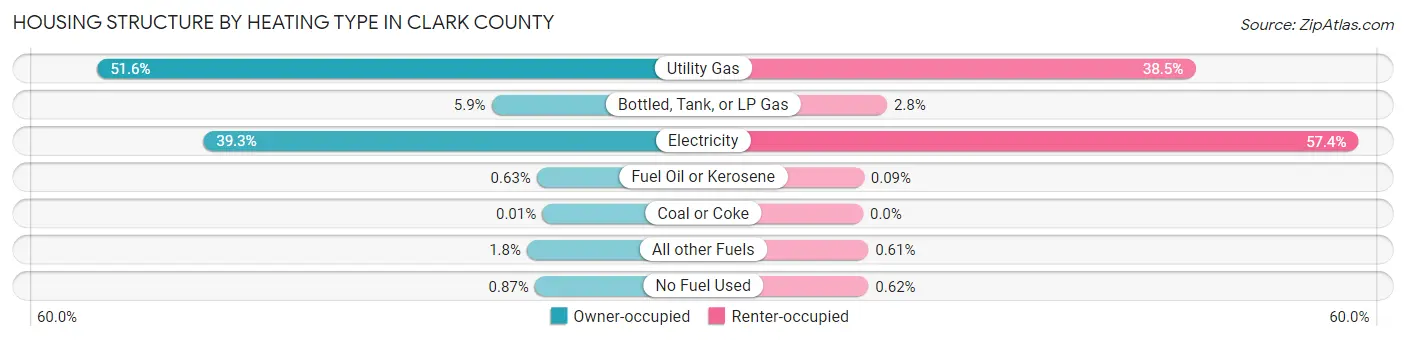
| Heating Type | Owner-occupied | Renter-occupied |
| Utility Gas | 18,383 (51.6%) | 4,696 (38.5%) |
| Bottled, Tank, or LP Gas | 2,093 (5.9%) | 338 (2.8%) |
| Electricity | 14,002 (39.3%) | 7,005 (57.4%) |
| Fuel Oil or Kerosene | 223 (0.6%) | 11 (0.1%) |
| Coal or Coke | 2 (0.0%) | 0 (0.0%) |
| All other Fuels | 631 (1.8%) | 75 (0.6%) |
| No Fuel Used | 309 (0.9%) | 76 (0.6%) |
| Total | 35,643 (100.0%) | 12,201 (100.0%) |
Household Vehicle Usage in Clark County
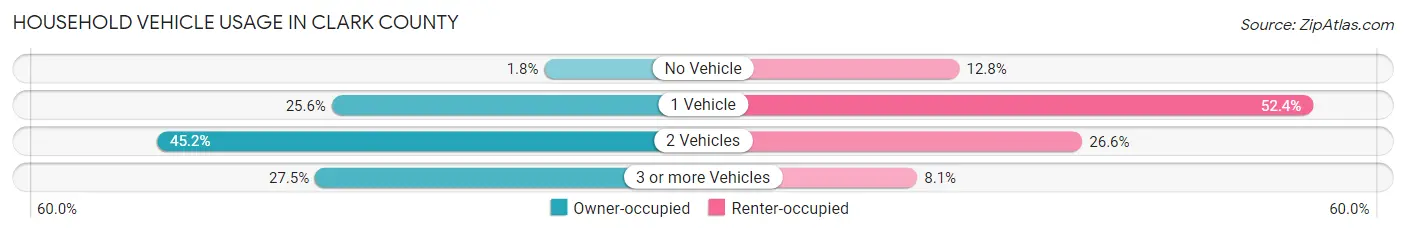
| Vehicles per Household | Owner-occupied | Renter-occupied |
| No Vehicle | 633 (1.8%) | 1,567 (12.8%) |
| 1 Vehicle | 9,124 (25.6%) | 6,398 (52.4%) |
| 2 Vehicles | 16,097 (45.2%) | 3,246 (26.6%) |
| 3 or more Vehicles | 9,789 (27.5%) | 990 (8.1%) |
| Total | 35,643 (100.0%) | 12,201 (100.0%) |
Real Estate & Mortgages in Clark County
Real Estate and Mortgage Overview in Clark County
| Characteristic | Without Mortgage | With Mortgage |
| Housing Units | 11,430 | 24,213 |
| Median Property Value | $170,600 | $204,000 |
| Median Household Income | $62,102 | $4,782 |
| Monthly Housing Costs | $479 | $351 |
| Real Estate Taxes | $1,309 | $450 |
Property Value by Mortgage Status in Clark County
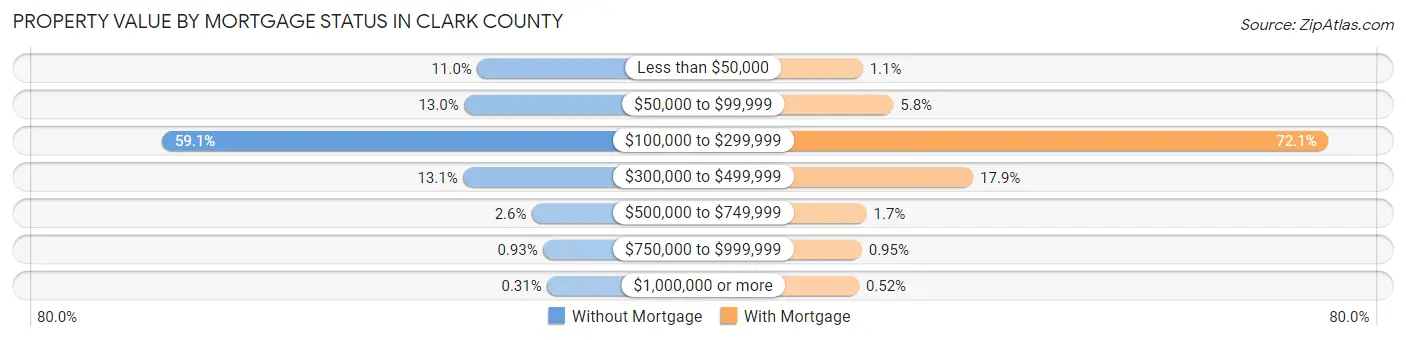
| Property Value | Without Mortgage | With Mortgage |
| Less than $50,000 | 1,253 (11.0%) | 263 (1.1%) |
| $50,000 to $99,999 | 1,482 (13.0%) | 1,394 (5.8%) |
| $100,000 to $299,999 | 6,752 (59.1%) | 17,454 (72.1%) |
| $300,000 to $499,999 | 1,500 (13.1%) | 4,340 (17.9%) |
| $500,000 to $749,999 | 302 (2.6%) | 406 (1.7%) |
| $750,000 to $999,999 | 106 (0.9%) | 231 (0.9%) |
| $1,000,000 or more | 35 (0.3%) | 125 (0.5%) |
| Total | 11,430 (100.0%) | 24,213 (100.0%) |
Household Income by Mortgage Status in Clark County
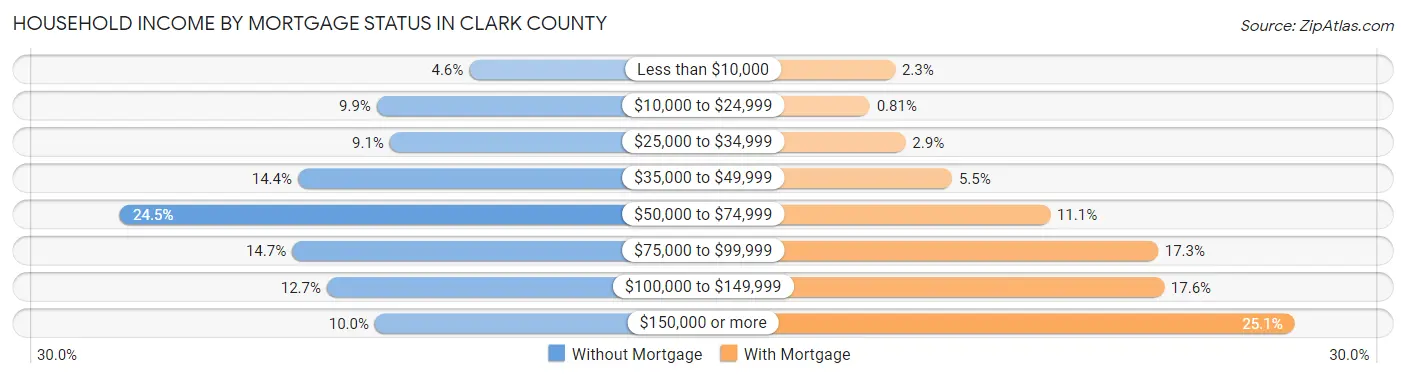
| Household Income | Without Mortgage | With Mortgage |
| Less than $10,000 | 526 (4.6%) | 544 (2.2%) |
| $10,000 to $24,999 | 1,129 (9.9%) | 197 (0.8%) |
| $25,000 to $34,999 | 1,045 (9.1%) | 691 (2.9%) |
| $35,000 to $49,999 | 1,645 (14.4%) | 1,334 (5.5%) |
| $50,000 to $74,999 | 2,805 (24.5%) | 2,690 (11.1%) |
| $75,000 to $99,999 | 1,683 (14.7%) | 4,181 (17.3%) |
| $100,000 to $149,999 | 1,455 (12.7%) | 4,266 (17.6%) |
| $150,000 or more | 1,142 (10.0%) | 6,072 (25.1%) |
| Total | 11,430 (100.0%) | 24,213 (100.0%) |
Property Value to Household Income Ratio in Clark County
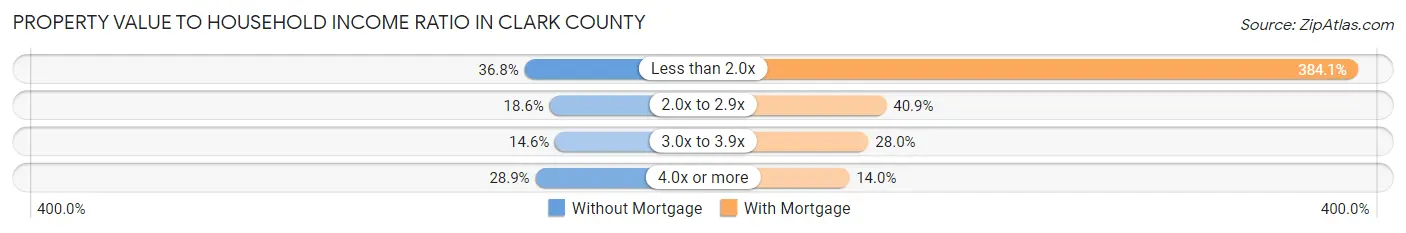
| Value-to-Income Ratio | Without Mortgage | With Mortgage |
| Less than 2.0x | 4,209 (36.8%) | 93,003 (384.1%) |
| 2.0x to 2.9x | 2,121 (18.6%) | 9,911 (40.9%) |
| 3.0x to 3.9x | 1,668 (14.6%) | 6,767 (28.0%) |
| 4.0x or more | 3,302 (28.9%) | 3,396 (14.0%) |
| Total | 11,430 (100.0%) | 24,213 (100.0%) |
Real Estate Taxes by Mortgage Status in Clark County
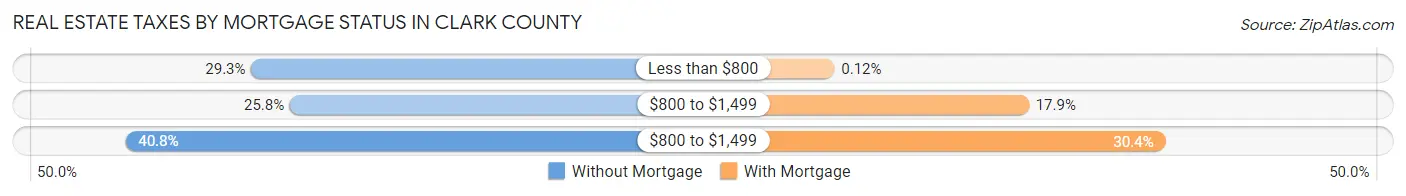
| Property Taxes | Without Mortgage | With Mortgage |
| Less than $800 | 3,348 (29.3%) | 30 (0.1%) |
| $800 to $1,499 | 2,944 (25.8%) | 4,328 (17.9%) |
| $800 to $1,499 | 4,663 (40.8%) | 7,350 (30.4%) |
| Total | 11,430 (100.0%) | 24,213 (100.0%) |
Health & Disability in Clark County
Health Insurance Coverage by Age in Clark County
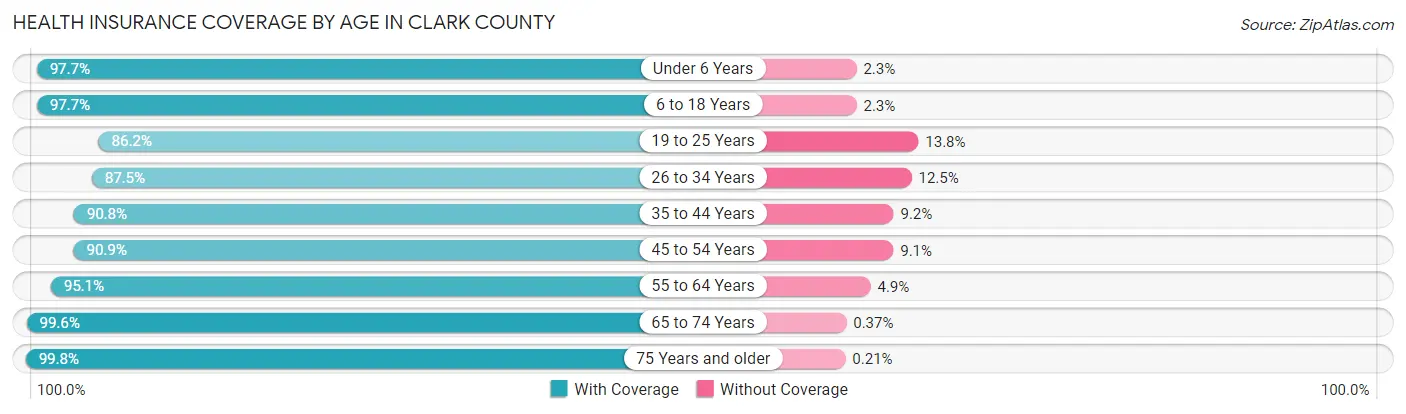
| Age Bracket | With Coverage | Without Coverage |
| Under 6 Years | 8,650 (97.7%) | 201 (2.3%) |
| 6 to 18 Years | 18,893 (97.7%) | 440 (2.3%) |
| 19 to 25 Years | 8,811 (86.2%) | 1,412 (13.8%) |
| 26 to 34 Years | 12,898 (87.5%) | 1,849 (12.5%) |
| 35 to 44 Years | 14,773 (90.8%) | 1,493 (9.2%) |
| 45 to 54 Years | 14,041 (90.9%) | 1,412 (9.1%) |
| 55 to 64 Years | 15,216 (95.1%) | 783 (4.9%) |
| 65 to 74 Years | 11,996 (99.6%) | 44 (0.4%) |
| 75 Years and older | 7,248 (99.8%) | 15 (0.2%) |
| Total | 112,526 (93.6%) | 7,649 (6.4%) |
Health Insurance Coverage by Citizenship Status in Clark County
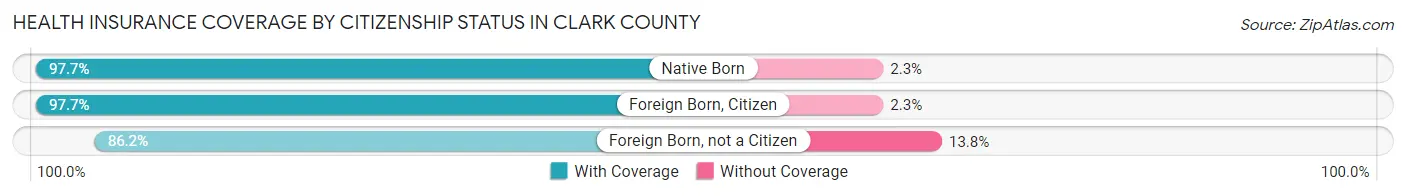
| Citizenship Status | With Coverage | Without Coverage |
| Native Born | 8,650 (97.7%) | 201 (2.3%) |
| Foreign Born, Citizen | 18,893 (97.7%) | 440 (2.3%) |
| Foreign Born, not a Citizen | 8,811 (86.2%) | 1,412 (13.8%) |
Health Insurance Coverage by Household Income in Clark County
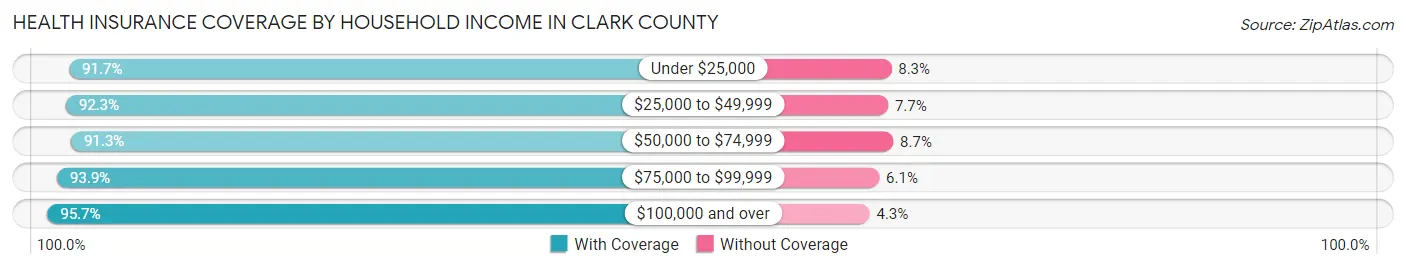
| Household Income | With Coverage | Without Coverage |
| Under $25,000 | 9,124 (91.7%) | 829 (8.3%) |
| $25,000 to $49,999 | 19,466 (92.3%) | 1,628 (7.7%) |
| $50,000 to $74,999 | 20,293 (91.3%) | 1,931 (8.7%) |
| $75,000 to $99,999 | 19,515 (93.9%) | 1,259 (6.1%) |
| $100,000 and over | 43,871 (95.7%) | 1,951 (4.3%) |
Public vs Private Health Insurance Coverage by Age in Clark County
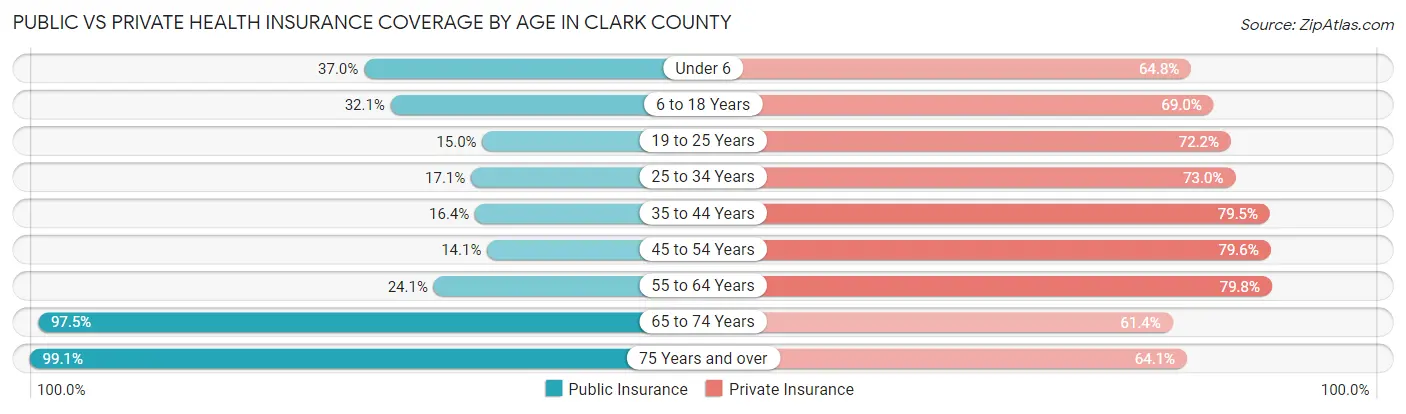
| Age Bracket | Public Insurance | Private Insurance |
| Under 6 | 3,273 (37.0%) | 5,739 (64.8%) |
| 6 to 18 Years | 6,197 (32.1%) | 13,343 (69.0%) |
| 19 to 25 Years | 1,535 (15.0%) | 7,382 (72.2%) |
| 25 to 34 Years | 2,525 (17.1%) | 10,768 (73.0%) |
| 35 to 44 Years | 2,664 (16.4%) | 12,924 (79.4%) |
| 45 to 54 Years | 2,183 (14.1%) | 12,298 (79.6%) |
| 55 to 64 Years | 3,849 (24.1%) | 12,767 (79.8%) |
| 65 to 74 Years | 11,741 (97.5%) | 7,393 (61.4%) |
| 75 Years and over | 7,195 (99.1%) | 4,652 (64.0%) |
| Total | 41,162 (34.3%) | 87,266 (72.6%) |
Disability Status by Sex by Age in Clark County
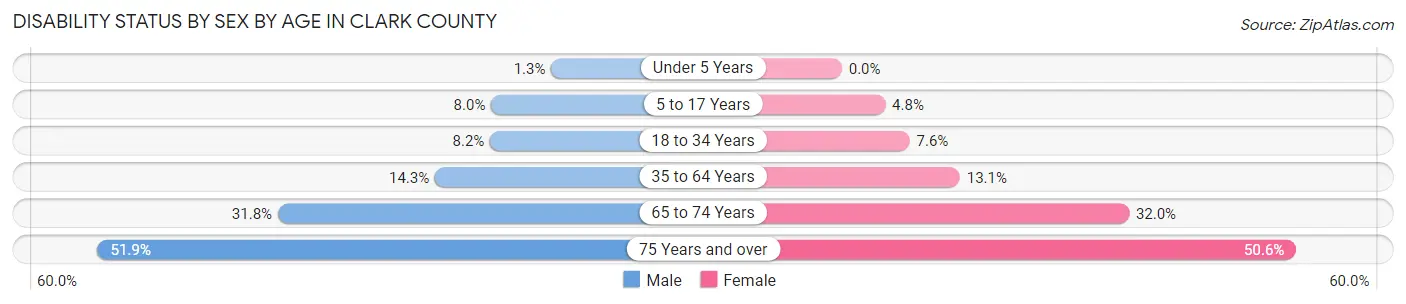
| Age Bracket | Male | Female |
| Under 5 Years | 49 (1.3%) | 0 (0.0%) |
| 5 to 17 Years | 811 (8.0%) | 460 (4.8%) |
| 18 to 34 Years | 1,073 (8.2%) | 994 (7.5%) |
| 35 to 64 Years | 3,394 (14.3%) | 3,150 (13.1%) |
| 65 to 74 Years | 1,744 (31.8%) | 2,096 (32.0%) |
| 75 Years and over | 1,495 (51.9%) | 2,217 (50.6%) |
Disability Class by Sex by Age in Clark County
Disability Class: Hearing Difficulty
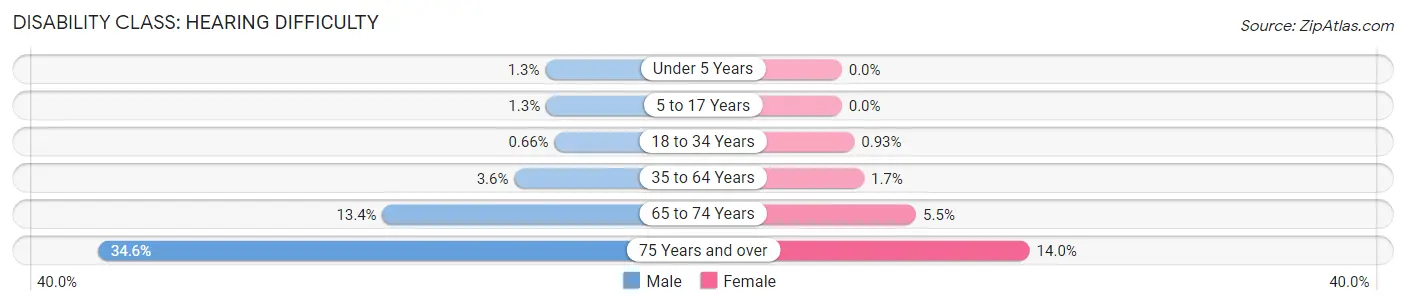
| Age Bracket | Male | Female |
| Under 5 Years | 49 (1.3%) | 0 (0.0%) |
| 5 to 17 Years | 130 (1.3%) | 0 (0.0%) |
| 18 to 34 Years | 87 (0.7%) | 122 (0.9%) |
| 35 to 64 Years | 865 (3.6%) | 396 (1.7%) |
| 65 to 74 Years | 737 (13.4%) | 362 (5.5%) |
| 75 Years and over | 996 (34.6%) | 611 (14.0%) |
Disability Class: Vision Difficulty
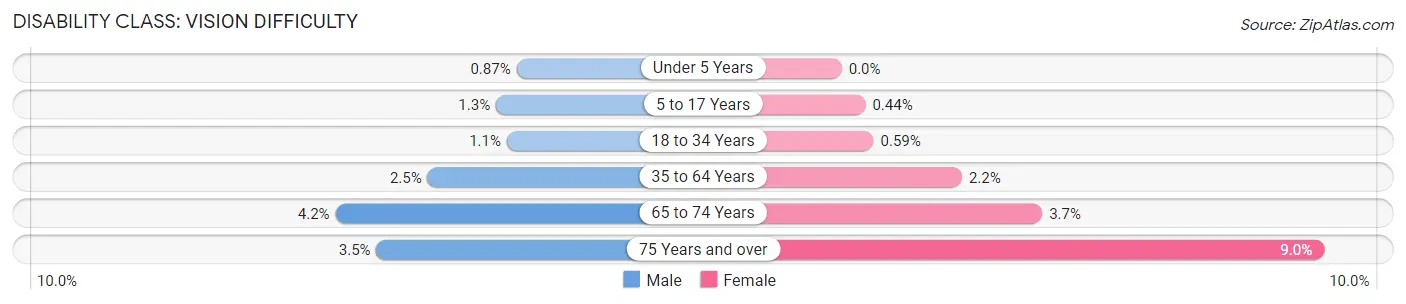
| Age Bracket | Male | Female |
| Under 5 Years | 32 (0.9%) | 0 (0.0%) |
| 5 to 17 Years | 126 (1.3%) | 42 (0.4%) |
| 18 to 34 Years | 138 (1.1%) | 78 (0.6%) |
| 35 to 64 Years | 599 (2.5%) | 535 (2.2%) |
| 65 to 74 Years | 232 (4.2%) | 244 (3.7%) |
| 75 Years and over | 100 (3.5%) | 392 (8.9%) |
Disability Class: Cognitive Difficulty
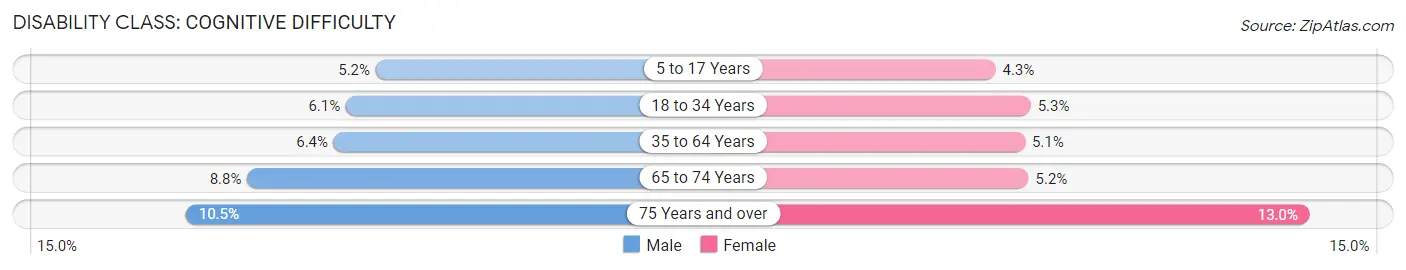
| Age Bracket | Male | Female |
| 5 to 17 Years | 527 (5.2%) | 407 (4.3%) |
| 18 to 34 Years | 797 (6.0%) | 693 (5.3%) |
| 35 to 64 Years | 1,518 (6.4%) | 1,223 (5.1%) |
| 65 to 74 Years | 483 (8.8%) | 341 (5.2%) |
| 75 Years and over | 303 (10.5%) | 571 (13.0%) |
Disability Class: Ambulatory Difficulty
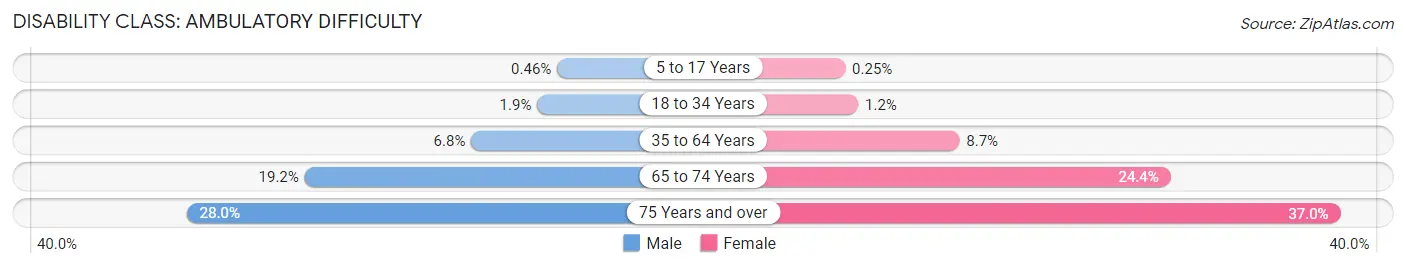
| Age Bracket | Male | Female |
| 5 to 17 Years | 46 (0.5%) | 24 (0.3%) |
| 18 to 34 Years | 256 (1.9%) | 160 (1.2%) |
| 35 to 64 Years | 1,624 (6.8%) | 2,092 (8.7%) |
| 65 to 74 Years | 1,054 (19.2%) | 1,600 (24.4%) |
| 75 Years and over | 806 (28.0%) | 1,622 (37.0%) |
Disability Class: Self-Care Difficulty
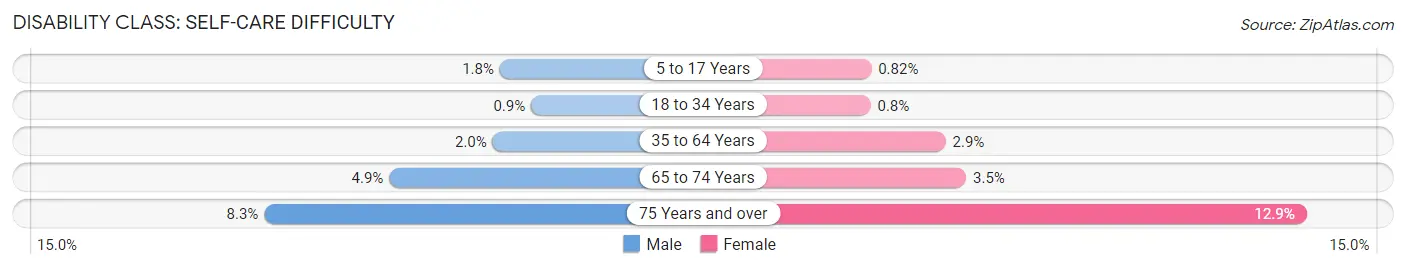
| Age Bracket | Male | Female |
| 5 to 17 Years | 179 (1.8%) | 78 (0.8%) |
| 18 to 34 Years | 119 (0.9%) | 106 (0.8%) |
| 35 to 64 Years | 469 (2.0%) | 692 (2.9%) |
| 65 to 74 Years | 266 (4.9%) | 227 (3.5%) |
| 75 Years and over | 240 (8.3%) | 567 (12.9%) |
Technology Access in Clark County
Computing Device Access in Clark County
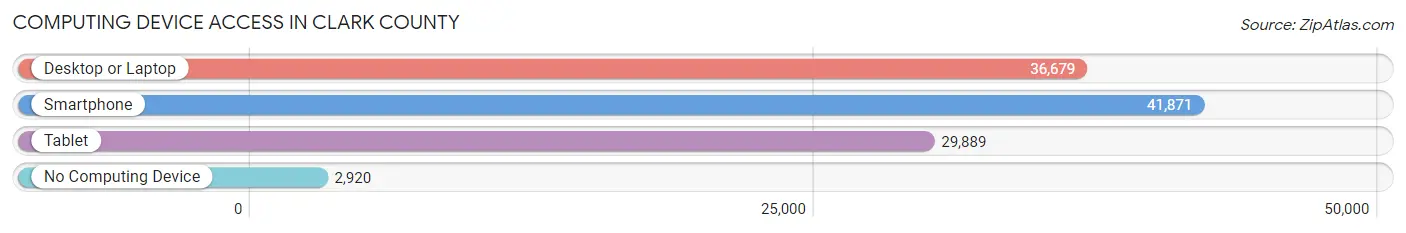
| Device Type | # Households | % Households |
| Desktop or Laptop | 36,679 | 76.7% |
| Smartphone | 41,871 | 87.5% |
| Tablet | 29,889 | 62.5% |
| No Computing Device | 2,920 | 6.1% |
| Total | 47,844 | 100.0% |
Internet Access in Clark County
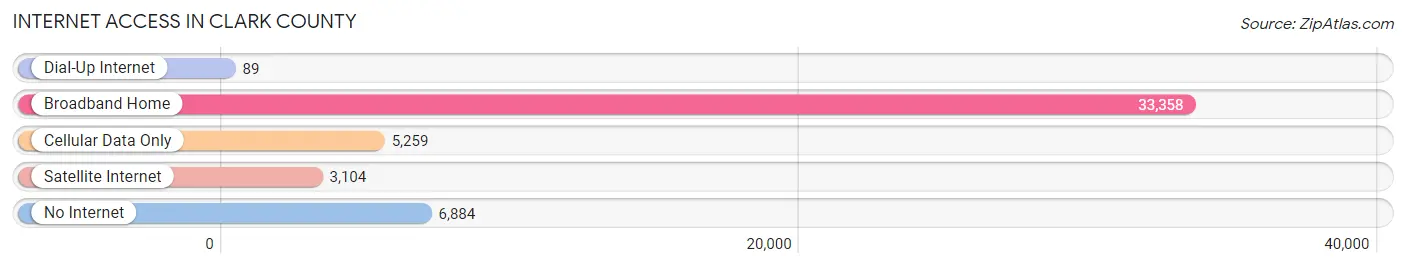
| Internet Type | # Households | % Households |
| Dial-Up Internet | 89 | 0.2% |
| Broadband Home | 33,358 | 69.7% |
| Cellular Data Only | 5,259 | 11.0% |
| Satellite Internet | 3,104 | 6.5% |
| No Internet | 6,884 | 14.4% |
| Total | 47,844 | 100.0% |
Clark County Summary
Clark County, Indiana is located in the south-central part of the state, and is part of the Louisville/Jefferson County, Kentucky-Indiana metropolitan area. It is bordered by Floyd County to the north, Washington County to the east, Scott County to the south, and Jefferson County, Kentucky to the west. The county seat is Jeffersonville, and the largest city is Clarksville.
History
Clark County was formed in 1801 from parts of Knox and Floyd counties. It was named for George Rogers Clark, a Revolutionary War hero who captured Fort Sackville in Vincennes in 1779. The county was originally part of the Northwest Territory, and was part of the Indiana Territory when it was formed in 1800.
The first settlers in the area were mostly of German and Scots-Irish descent. The first county seat was established in Springville in 1802, but was moved to Jeffersonville in 1808. The county was largely agricultural, with the main crops being corn, wheat, and tobacco.
Geography
Clark County covers an area of 437 square miles, and is located in the south-central part of the state. It is bordered by Floyd County to the north, Washington County to the east, Scott County to the south, and Jefferson County, Kentucky to the west. The county is mostly flat, with some rolling hills in the northern part. The Ohio River forms the western border of the county.
The climate is humid continental, with hot, humid summers and cold, wet winters. The average annual temperature is 54°F, and the average annual precipitation is 43 inches.
Economy
The economy of Clark County is largely based on manufacturing and services. The largest employers in the county are the River Ridge Commerce Center, the Clark Memorial Hospital, and the Clark County School Corporation.
The county is also home to several large companies, including the Cummins Engine Company, the Louisville and Nashville Railroad, and the Louisville Gas and Electric Company.
Demographics
As of the 2010 census, the population of Clark County was 110,232, making it the sixth most populous county in Indiana. The population density was 250 people per square mile. The racial makeup of the county was 90.2% White, 5.3% African American, 0.5% Native American, 1.3% Asian, 0.1% Pacific Islander, 1.2% from other races, and 1.4% from two or more races. Hispanic or Latino of any race were 3.2% of the population.
The median income for a household in the county was $50,945, and the median income for a family was $60,945. The per capita income for the county was $25,945. About 8.2% of families and 10.3% of the population were below the poverty line, including 14.2% of those under age 18 and 6.2% of those age 65 or over.
Common Questions
What is the Total Population of Clark County?
Total Population of Clark County is 121,484.
What is the Total Male Population of Clark County?
Total Male Population of Clark County is 59,727.
What is the Total Female Population of Clark County?
Total Female Population of Clark County is 61,757.
What is the Ratio of Males per 100 Females in Clark County?
There are 96.71 Males per 100 Females in Clark County.
What is the Ratio of Females per 100 Males in Clark County?
There are 103.40 Females per 100 Males in Clark County.
What is the Median Population Age in Clark County?
Median Population Age in Clark County is 39.6 Years.
What is the Average Family Size in Clark County
Average Family Size in Clark County is 3.1 People.
What is the Average Household Size in Clark County
Average Household Size in Clark County is 2.5 People.
What is Per Capita Income in Clark County?
Per Capita income in Clark County is $34,946.
What is the Median Family Income in Clark County?
Median Family Income in Clark County is $81,592.
What is the Median Household income in Clark County?
Median Household Income in Clark County is $69,005.
What is Income or Wage Gap in Clark County?
Income or Wage Gap in Clark County is 21.3%.
Women in Clark County earn 78.7 cents for every dollar earned by a man.
What is Family Income Deficit in Clark County?
Family Income Deficit in Clark County is $8,787.
Families that are below poverty line in Clark County earn $8,787 less on average than the poverty threshold level.
What is Inequality or Gini Index in Clark County?
Inequality or Gini Index in Clark County is 0.41.
How Large is the Labor Force in Clark County?
There are 64,737 People in the Labor Forcein in Clark County.
What is the Percentage of People in the Labor Force in Clark County?
66.3% of People are in the Labor Force in Clark County.
What is the Unemployment Rate in Clark County?
Unemployment Rate in Clark County is 3.7%.