Cass County, IN
Cass County Map
Cass County Overview
37,820
TOTAL POPULATION
18,812
MALE POPULATION
19,008
FEMALE POPULATION
98.97
MALES / 100 FEMALES
101.04
FEMALES / 100 MALES
41.3
MEDIAN AGE
3.0
AVG FAMILY SIZE
2.5
AVG HOUSEHOLD SIZE
$28,391
PER CAPITA INCOME
$70,908
AVG FAMILY INCOME
$55,862
AVG HOUSEHOLD INCOME
30.7%
WAGE / INCOME GAP [ % ]
69.3¢/ $1
WAGE / INCOME GAP [ $ ]
$10,331
FAMILY INCOME DEFICIT
0.40
INEQUALITY / GINI INDEX
19,117
LABOR FORCE [ PEOPLE ]
62.9%
PERCENT IN LABOR FORCE
4.2%
UNEMPLOYMENT RATE
Race in Cass County
The most populous races in Cass County are White / Caucasian (31,085 | 82.2%), Hispanic or Latino (6,371 | 16.9%), and Some other Race (3,085 | 8.2%).

| Race | # Population | % Population |
| Asian | 536 | 1.4% |
| Black / African American | 494 | 1.3% |
| Hawaiian / Pacific | 0 | 0.0% |
| Hispanic or Latino | 6,371 | 16.9% |
| Native / Alaskan | 203 | 0.5% |
| White / Caucasian | 31,085 | 82.2% |
| Two or more Races | 2,417 | 6.4% |
| Some other Race | 3,085 | 8.2% |
| Total | 37,820 | 100.0% |
Ancestry in Cass County
The most populous ancestries reported in Cass County are German (6,916 | 18.3%), Mexican (4,343 | 11.5%), Irish (3,423 | 9.0%), English (2,956 | 7.8%), and American (2,787 | 7.4%), together accounting for 54.0% of all Cass County residents.

| Ancestry | # Population | % Population |
| American | 2,787 | 7.4% |
| Apache | 6 | 0.0% |
| Austrian | 7 | 0.0% |
| Belgian | 18 | 0.1% |
| Bhutanese | 111 | 0.3% |
| Blackfeet | 2 | 0.0% |
| British | 89 | 0.2% |
| Burmese | 35 | 0.1% |
| Central American | 663 | 1.8% |
| Cherokee | 67 | 0.2% |
| Cheyenne | 13 | 0.0% |
| Choctaw | 4 | 0.0% |
| Cuban | 169 | 0.4% |
| Czech | 49 | 0.1% |
| Czechoslovakian | 9 | 0.0% |
| Danish | 57 | 0.2% |
| Dominican | 90 | 0.2% |
| Dutch | 490 | 1.3% |
| Eastern European | 41 | 0.1% |
| Ecuadorian | 55 | 0.2% |
| English | 2,956 | 7.8% |
| Ethiopian | 3 | 0.0% |
| European | 613 | 1.6% |
| Finnish | 20 | 0.1% |
| French | 396 | 1.1% |
| French Canadian | 25 | 0.1% |
| German | 6,916 | 18.3% |
| Greek | 16 | 0.0% |
| Guamanian / Chamorro | 9 | 0.0% |
| Guatemalan | 274 | 0.7% |
| Haitian | 238 | 0.6% |
| Honduran | 81 | 0.2% |
| Hungarian | 32 | 0.1% |
| Icelander | 14 | 0.0% |
| Indian (Asian) | 168 | 0.4% |
| Indonesian | 236 | 0.6% |
| Irish | 3,423 | 9.0% |
| Iroquois | 5 | 0.0% |
| Israeli | 1 | 0.0% |
| Italian | 1,095 | 2.9% |
| Kenyan | 69 | 0.2% |
| Korean | 124 | 0.3% |
| Laotian | 21 | 0.1% |
| Lithuanian | 7 | 0.0% |
| Malaysian | 11 | 0.0% |
| Mexican | 4,343 | 11.5% |
| Mexican American Indian | 133 | 0.4% |
| Norwegian | 169 | 0.4% |
| Pennsylvania German | 88 | 0.2% |
| Peruvian | 267 | 0.7% |
| Polish | 171 | 0.4% |
| Potawatomi | 2 | 0.0% |
| Puerto Rican | 244 | 0.6% |
| Romanian | 35 | 0.1% |
| Russian | 55 | 0.2% |
| Salvadoran | 308 | 0.8% |
| Scandinavian | 5 | 0.0% |
| Scotch-Irish | 123 | 0.3% |
| Scottish | 449 | 1.2% |
| Serbian | 22 | 0.1% |
| Sioux | 4 | 0.0% |
| Slovak | 25 | 0.1% |
| South African | 80 | 0.2% |
| South American | 385 | 1.0% |
| Spaniard | 7 | 0.0% |
| Sri Lankan | 7 | 0.0% |
| Subsaharan African | 152 | 0.4% |
| Swedish | 94 | 0.3% |
| Swiss | 66 | 0.2% |
| Thai | 127 | 0.3% |
| Trinidadian and Tobagonian | 18 | 0.1% |
| Ukrainian | 3 | 0.0% |
| Venezuelan | 63 | 0.2% |
| Welsh | 254 | 0.7% | View All 74 Rows |
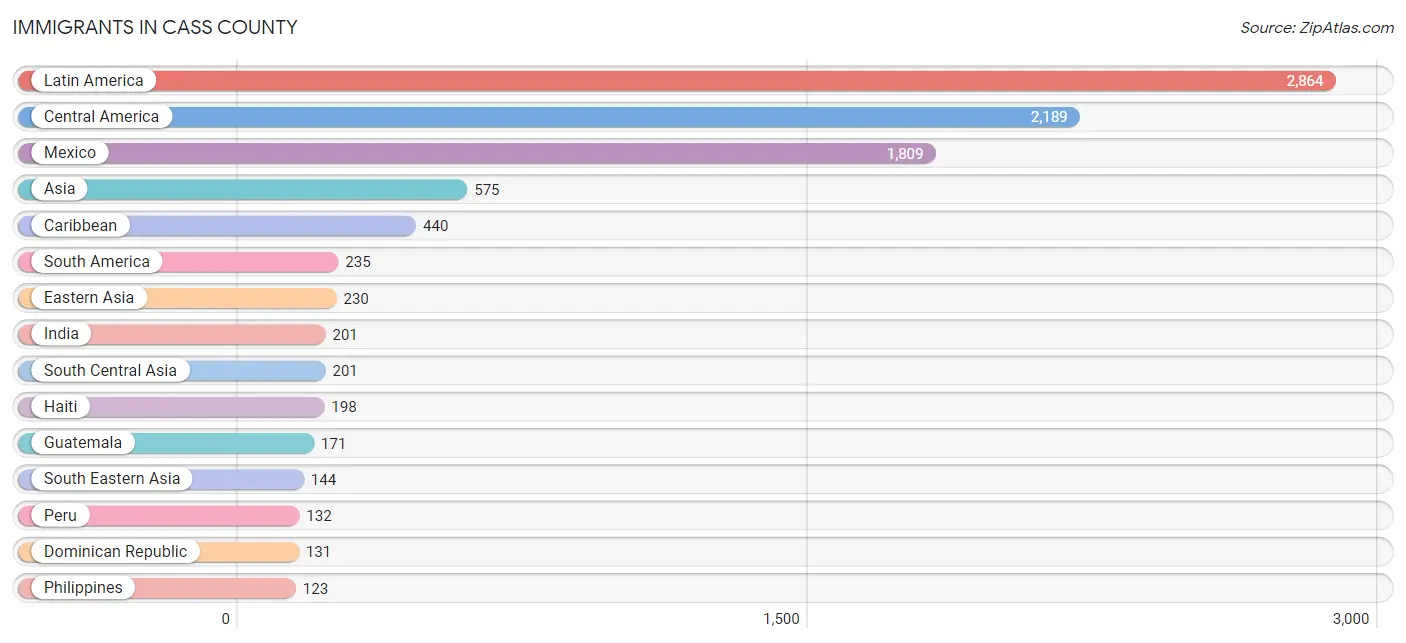
Immigrants in Cass County
The most numerous immigrant groups reported in Cass County came from Latin America (2,864 | 7.6%), Central America (2,189 | 5.8%), Mexico (1,809 | 4.8%), Asia (575 | 1.5%), and Caribbean (440 | 1.2%), together accounting for 20.8% of all Cass County residents.
| Immigration Origin | # Population | % Population |
| Asia | 575 | 1.5% |
| Belgium | 8 | 0.0% |
| Caribbean | 440 | 1.2% |
| Central America | 2,189 | 5.8% |
| China | 121 | 0.3% |
| Cuba | 93 | 0.3% |
| Dominican Republic | 131 | 0.4% |
| Eastern Asia | 230 | 0.6% |
| El Salvador | 106 | 0.3% |
| Europe | 63 | 0.2% |
| Germany | 55 | 0.2% |
| Guatemala | 171 | 0.4% |
| Haiti | 198 | 0.5% |
| Honduras | 103 | 0.3% |
| India | 201 | 0.5% |
| Indonesia | 21 | 0.1% |
| Japan | 52 | 0.1% |
| Korea | 57 | 0.2% |
| Latin America | 2,864 | 7.6% |
| Mexico | 1,809 | 4.8% |
| Peru | 132 | 0.4% |
| Philippines | 123 | 0.3% |
| South America | 235 | 0.6% |
| South Central Asia | 201 | 0.5% |
| South Eastern Asia | 144 | 0.4% |
| Taiwan | 72 | 0.2% |
| Trinidad and Tobago | 18 | 0.1% |
| Venezuela | 103 | 0.3% |
| Western Europe | 63 | 0.2% | View All 29 Rows |
Sex and Age in Cass County
Sex and Age in Cass County
The most populous age groups in Cass County are 60 to 64 Years (1,487 | 7.9%) for men and 55 to 59 Years (1,481 | 7.8%) for women.

| Age Bracket | Male | Female |
| Under 5 Years | 1,115 (5.9%) | 1,033 (5.4%) |
| 5 to 9 Years | 1,118 (5.9%) | 1,042 (5.5%) |
| 10 to 14 Years | 1,363 (7.2%) | 1,332 (7.0%) |
| 15 to 19 Years | 1,266 (6.7%) | 1,137 (6.0%) |
| 20 to 24 Years | 1,118 (5.9%) | 1,249 (6.6%) |
| 25 to 29 Years | 1,151 (6.1%) | 1,148 (6.0%) |
| 30 to 34 Years | 1,017 (5.4%) | 969 (5.1%) |
| 35 to 39 Years | 1,125 (6.0%) | 950 (5.0%) |
| 40 to 44 Years | 1,128 (6.0%) | 1,268 (6.7%) |
| 45 to 49 Years | 1,179 (6.3%) | 1,179 (6.2%) |
| 50 to 54 Years | 1,334 (7.1%) | 1,148 (6.0%) |
| 55 to 59 Years | 1,426 (7.6%) | 1,481 (7.8%) |
| 60 to 64 Years | 1,487 (7.9%) | 1,228 (6.5%) |
| 65 to 69 Years | 1,075 (5.7%) | 1,183 (6.2%) |
| 70 to 74 Years | 732 (3.9%) | 805 (4.2%) |
| 75 to 79 Years | 466 (2.5%) | 610 (3.2%) |
| 80 to 84 Years | 365 (1.9%) | 533 (2.8%) |
| 85 Years and over | 347 (1.8%) | 713 (3.7%) |
| Total | 18,812 (100.0%) | 19,008 (100.0%) |
Families and Households in Cass County
Median Family Size in Cass County
The median family size in Cass County is 3.03 persons per family, with married-couple families (7,108 | 74.1%) accounting for the largest median family size of 3.04 persons per family. On the other hand, single male/father families (704 | 7.3%) represent the smallest median family size with 2.94 persons per family.

| Family Type | # Families | Family Size |
| Married-Couple | 7,108 (74.1%) | 3.04 |
| Single Male/Father | 704 (7.3%) | 2.94 |
| Single Female/Mother | 1,787 (18.6%) | 3.04 |
| Total Families | 9,599 (100.0%) | 3.03 |
Median Household Size in Cass County
The median household size in Cass County is 2.46 persons per household, with single male/father households (704 | 4.7%) accounting for the largest median household size of 3.46 persons per household. non-family households (5,371 | 35.9%) represent the smallest median household size with 1.25 persons per household.

| Household Type | # Households | Household Size |
| Married-Couple | 7,108 (47.5%) | 3.07 |
| Single Male/Father | 704 (4.7%) | 3.46 |
| Single Female/Mother | 1,787 (11.9%) | 3.29 |
| Non-family | 5,371 (35.9%) | 1.25 |
| Total Households | 14,970 (100.0%) | 2.46 |
Household Size by Marriage Status in Cass County
Out of a total of 14,970 households in Cass County, 9,599 (64.1%) are family households, while 5,371 (35.9%) are nonfamily households. The most numerous type of family households are 2-person households, comprising 4,587, and the most common type of nonfamily households are 1-person households, comprising 4,595.

| Household Size | Family Households | Nonfamily Households |
| 1-Person Households | - | 4,595 (30.7%) |
| 2-Person Households | 4,587 (30.6%) | 578 (3.9%) |
| 3-Person Households | 1,930 (12.9%) | 95 (0.6%) |
| 4-Person Households | 1,858 (12.4%) | 74 (0.5%) |
| 5-Person Households | 786 (5.2%) | 29 (0.2%) |
| 6-Person Households | 308 (2.1%) | 0 (0.0%) |
| 7+ Person Households | 130 (0.9%) | 0 (0.0%) |
| Total | 9,599 (64.1%) | 5,371 (35.9%) |
Female Fertility in Cass County
Fertility by Age in Cass County
Average fertility rate in Cass County is 40.0 births per 1,000 women. Women in the age bracket of 20 to 34 years have the highest fertility rate with 78.0 births per 1,000 women. Women in the age bracket of 20 to 34 years acount for 80.2% of all women with births.

| Age Bracket | Women with Births | Births / 1,000 Women |
| 15 to 19 years | 0 (0.0%) | 0.0 |
| 20 to 34 years | 263 (80.2%) | 78.0 |
| 35 to 50 years | 65 (19.8%) | 18.0 |
| Total | 328 (100.0%) | 40.0 |
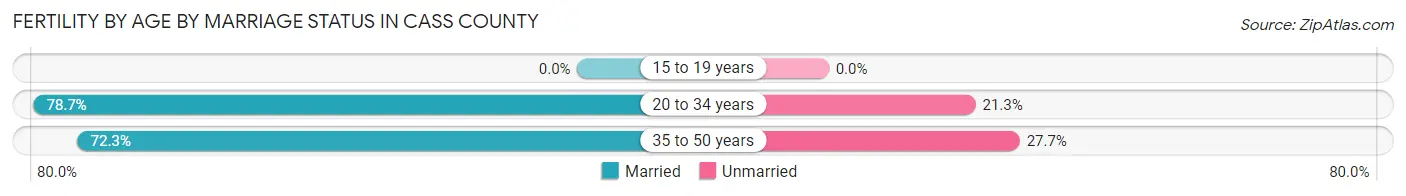
Fertility by Age by Marriage Status in Cass County
77.4% of women with births (328) in Cass County are married. The highest percentage of unmarried women with births falls into 35 to 50 years age bracket with 27.7% of them unmarried at the time of birth, while the lowest percentage of unmarried women with births belong to 20 to 34 years age bracket with 21.3% of them unmarried.
| Age Bracket | Married | Unmarried |
| 15 to 19 years | 0 (0.0%) | 0 (0.0%) |
| 20 to 34 years | 207 (78.7%) | 56 (21.3%) |
| 35 to 50 years | 47 (72.3%) | 18 (27.7%) |
| Total | 254 (77.4%) | 74 (22.6%) |
Fertility by Education in Cass County

| Educational Attainment | Women with Births | Births / 1,000 Women |
| Less than High School | 112 (34.2%) | 56.0 |
| High School Diploma | 88 (26.8%) | 36.0 |
| College or Associate's Degree | 128 (39.0%) | 50.0 |
| Bachelor's Degree | 0 (0.0%) | 0.0 |
| Graduate Degree | 0 (0.0%) | 0.0 |
| Total | 328 (100.0%) | 40.0 |
Fertility by Education by Marriage Status in Cass County
22.6% of women with births in Cass County are unmarried. Women with the educational attainment of less than high school are most likely to be married with 89.3% of them married at childbirth, while women with the educational attainment of high school diploma are least likely to be married with 42.0% of them unmarried at childbirth.

| Educational Attainment | Married | Unmarried |
| Less than High School | 100 (89.3%) | 12 (10.7%) |
| High School Diploma | 51 (58.0%) | 37 (42.0%) |
| College or Associate's Degree | 103 (80.5%) | 25 (19.5%) |
| Bachelor's Degree | 0 (0.0%) | 0 (0.0%) |
| Graduate Degree | 0 (0.0%) | 0 (0.0%) |
| Total | 254 (77.4%) | 74 (22.6%) |
Income in Cass County
Income Overview in Cass County
Per Capita Income in Cass County is $28,391, while median incomes of families and households are $70,908 and $55,862 respectively.
| Characteristic | Number | Measure |
| Per Capita Income | 37,820 | $28,391 |
| Median Family Income | 9,599 | $70,908 |
| Mean Family Income | 9,599 | $80,926 |
| Median Household Income | 14,970 | $55,862 |
| Mean Household Income | 14,970 | $68,534 |
| Income Deficit | 9,599 | $10,331 |
| Wage / Income Gap (%) | 37,820 | 30.70% |
| Wage / Income Gap ($) | 37,820 | 69.30¢ per $1 |
| Gini / Inequality Index | 37,820 | 0.40 |
Earnings by Sex in Cass County
Average Earnings in Cass County are $35,311, $42,120 for men and $29,191 for women, a difference of 30.7%.

| Sex | Number | Average Earnings |
| Male | 10,410 (52.2%) | $42,120 |
| Female | 9,525 (47.8%) | $29,191 |
| Total | 19,935 (100.0%) | $35,311 |
Earnings by Sex by Income Bracket in Cass County
The most common earnings brackets in Cass County are $75,000 to $99,999 for men (998 | 9.6%) and $35,000 to $39,999 for women (943 | 9.9%).

| Income | Male | Female |
| $2,499 or less | 638 (6.1%) | 547 (5.7%) |
| $2,500 to $4,999 | 243 (2.3%) | 345 (3.6%) |
| $5,000 to $7,499 | 271 (2.6%) | 352 (3.7%) |
| $7,500 to $9,999 | 297 (2.9%) | 367 (3.8%) |
| $10,000 to $12,499 | 198 (1.9%) | 541 (5.7%) |
| $12,500 to $14,999 | 156 (1.5%) | 462 (4.9%) |
| $15,000 to $17,499 | 379 (3.6%) | 369 (3.9%) |
| $17,500 to $19,999 | 271 (2.6%) | 238 (2.5%) |
| $20,000 to $22,499 | 143 (1.4%) | 379 (4.0%) |
| $22,500 to $24,999 | 242 (2.3%) | 439 (4.6%) |
| $25,000 to $29,999 | 704 (6.8%) | 882 (9.3%) |
| $30,000 to $34,999 | 660 (6.3%) | 740 (7.8%) |
| $35,000 to $39,999 | 629 (6.0%) | 943 (9.9%) |
| $40,000 to $44,999 | 708 (6.8%) | 784 (8.2%) |
| $45,000 to $49,999 | 738 (7.1%) | 379 (4.0%) |
| $50,000 to $54,999 | 609 (5.9%) | 277 (2.9%) |
| $55,000 to $64,999 | 920 (8.8%) | 671 (7.0%) |
| $65,000 to $74,999 | 685 (6.6%) | 408 (4.3%) |
| $75,000 to $99,999 | 998 (9.6%) | 247 (2.6%) |
| $100,000+ | 921 (8.8%) | 155 (1.6%) |
| Total | 10,410 (100.0%) | 9,525 (100.0%) |
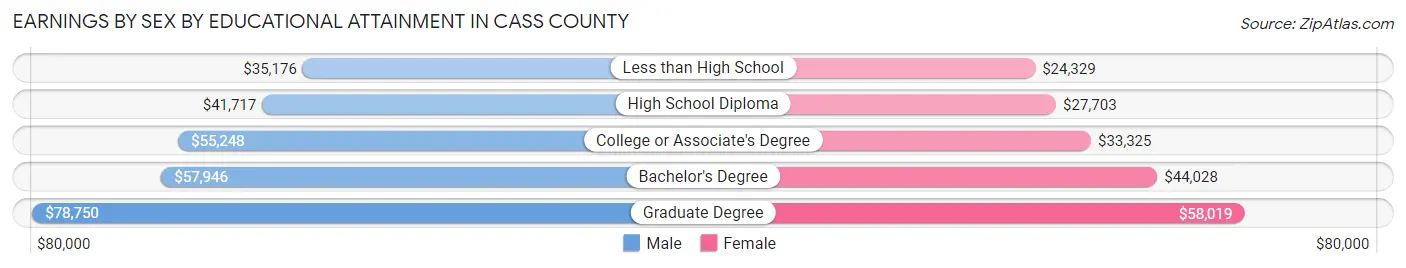
Earnings by Sex by Educational Attainment in Cass County
Average earnings in Cass County are $46,528 for men and $32,570 for women, a difference of 30.0%. Men with an educational attainment of graduate degree enjoy the highest average annual earnings of $78,750, while those with less than high school education earn the least with $35,176. Women with an educational attainment of graduate degree earn the most with the average annual earnings of $58,019, while those with less than high school education have the smallest earnings of $24,329.
| Educational Attainment | Male Income | Female Income |
| Less than High School | $35,176 | $24,329 |
| High School Diploma | $41,717 | $27,703 |
| College or Associate's Degree | $55,248 | $33,325 |
| Bachelor's Degree | $57,946 | $44,028 |
| Graduate Degree | $78,750 | $58,019 |
| Total | $46,528 | $32,570 |
Family Income in Cass County
Family Income Brackets in Cass County
According to the Cass County family income data, there are 2,131 families falling into the $50,000 to $74,999 income range, which is the most common income bracket and makes up 22.2% of all families. Conversely, the $10,000 to $14,999 income bracket is the least frequent group with only 221 families (2.3%) belonging to this category.
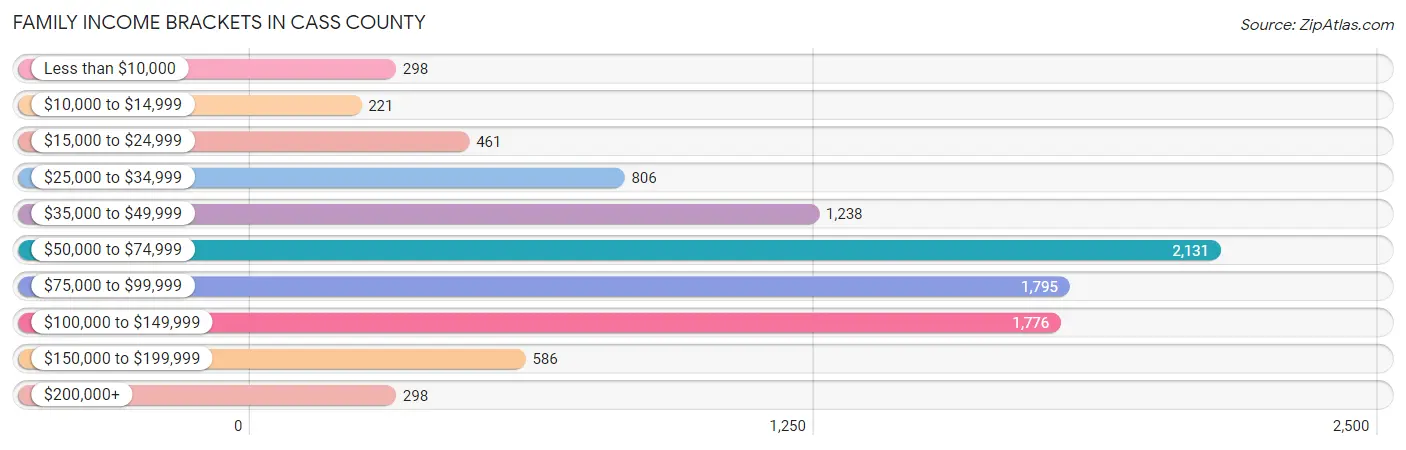
| Income Bracket | # Families | % Families |
| Less than $10,000 | 298 | 3.1% |
| $10,000 to $14,999 | 221 | 2.3% |
| $15,000 to $24,999 | 461 | 4.8% |
| $25,000 to $34,999 | 806 | 8.4% |
| $35,000 to $49,999 | 1,238 | 12.9% |
| $50,000 to $74,999 | 2,131 | 22.2% |
| $75,000 to $99,999 | 1,795 | 18.7% |
| $100,000 to $149,999 | 1,776 | 18.5% |
| $150,000 to $199,999 | 586 | 6.1% |
| $200,000+ | 298 | 3.1% |
Family Income by Famaliy Size in Cass County
7+ person families (98 | 1.0%) account for the highest median family income in Cass County with $85,948 per family, while 2-person families (5,025 | 52.3%) have the highest median income of $34,671 per family member.

| Income Bracket | # Families | Median Income |
| 2-Person Families | 5,025 (52.3%) | $69,342 |
| 3-Person Families | 1,779 (18.5%) | $72,623 |
| 4-Person Families | 1,692 (17.6%) | $77,308 |
| 5-Person Families | 691 (7.2%) | $72,847 |
| 6-Person Families | 314 (3.3%) | $63,553 |
| 7+ Person Families | 98 (1.0%) | $85,948 |
| Total | 9,599 (100.0%) | $70,908 |
Family Income by Number of Earners in Cass County
The median family income in Cass County is $70,908, with families comprising 3+ earners (982) having the highest median family income of $120,000, while families with no earners (1,388) have the lowest median family income of $45,101, accounting for 10.2% and 14.5% of families, respectively.

| Number of Earners | # Families | Median Income |
| No Earners | 1,388 (14.5%) | $45,101 |
| 1 Earner | 3,356 (35.0%) | $50,253 |
| 2 Earners | 3,873 (40.4%) | $87,357 |
| 3+ Earners | 982 (10.2%) | $120,000 |
| Total | 9,599 (100.0%) | $70,908 |
Household Income in Cass County
Household Income Brackets in Cass County
With 3,039 households falling in the category, the $50,000 to $74,999 income range is the most frequent in Cass County, accounting for 20.3% of all households. In contrast, only 314 households (2.1%) fall into the $200,000+ income bracket, making it the least populous group.

| Income Bracket | # Households | % Households |
| Less than $10,000 | 599 | 4.0% |
| $10,000 to $14,999 | 734 | 4.9% |
| $15,000 to $24,999 | 1,602 | 10.7% |
| $25,000 to $34,999 | 1,452 | 9.7% |
| $35,000 to $49,999 | 2,156 | 14.4% |
| $50,000 to $74,999 | 3,039 | 20.3% |
| $75,000 to $99,999 | 2,141 | 14.3% |
| $100,000 to $149,999 | 2,231 | 14.9% |
| $150,000 to $199,999 | 674 | 4.5% |
| $200,000+ | 314 | 2.1% |
Household Income by Householder Age in Cass County
The median household income in Cass County is $55,862, with the highest median household income of $64,157 found in the 25 to 44 years age bracket for the primary householder. A total of 4,312 households (28.8%) fall into this category. Meanwhile, the 15 to 24 years age bracket for the primary householder has the lowest median household income of $35,982, with 460 households (3.1%) in this group.

| Income Bracket | # Households | Median Income |
| 15 to 24 Years | 460 (3.1%) | $35,982 |
| 25 to 44 Years | 4,312 (28.8%) | $64,157 |
| 45 to 64 Years | 5,857 (39.1%) | $60,550 |
| 65+ Years | 4,341 (29.0%) | $45,712 |
| Total | 14,970 (100.0%) | $55,862 |
Poverty in Cass County
Income Below Poverty by Sex and Age in Cass County
With 13.9% poverty level for males and 13.9% for females among the residents of Cass County, 5 year old males and 5 year old females are the most vulnerable to poverty, with 154 males (45.8%) and 43 females (30.5%) in their respective age groups living below the poverty level.

| Age Bracket | Male | Female |
| Under 5 Years | 179 (16.3%) | 190 (18.8%) |
| 5 Years | 154 (45.8%) | 43 (30.5%) |
| 6 to 11 Years | 283 (22.2%) | 242 (17.4%) |
| 12 to 14 Years | 141 (18.6%) | 70 (9.2%) |
| 15 Years | 0 (0.0%) | 24 (11.4%) |
| 16 and 17 Years | 46 (9.8%) | 59 (9.3%) |
| 18 to 24 Years | 311 (19.5%) | 315 (20.5%) |
| 25 to 34 Years | 327 (15.6%) | 303 (14.4%) |
| 35 to 44 Years | 276 (12.4%) | 294 (13.3%) |
| 45 to 54 Years | 273 (11.0%) | 353 (15.2%) |
| 55 to 64 Years | 340 (11.8%) | 366 (13.5%) |
| 65 to 74 Years | 122 (6.9%) | 174 (8.9%) |
| 75 Years and over | 81 (7.4%) | 151 (9.4%) |
| Total | 2,533 (13.9%) | 2,584 (13.9%) |
Income Above Poverty by Sex and Age in Cass County
According to the poverty statistics in Cass County, males aged 15 years and females aged 65 to 74 years are the age groups that are most secure financially, with 100.0% of males and 91.1% of females in these age groups living above the poverty line.
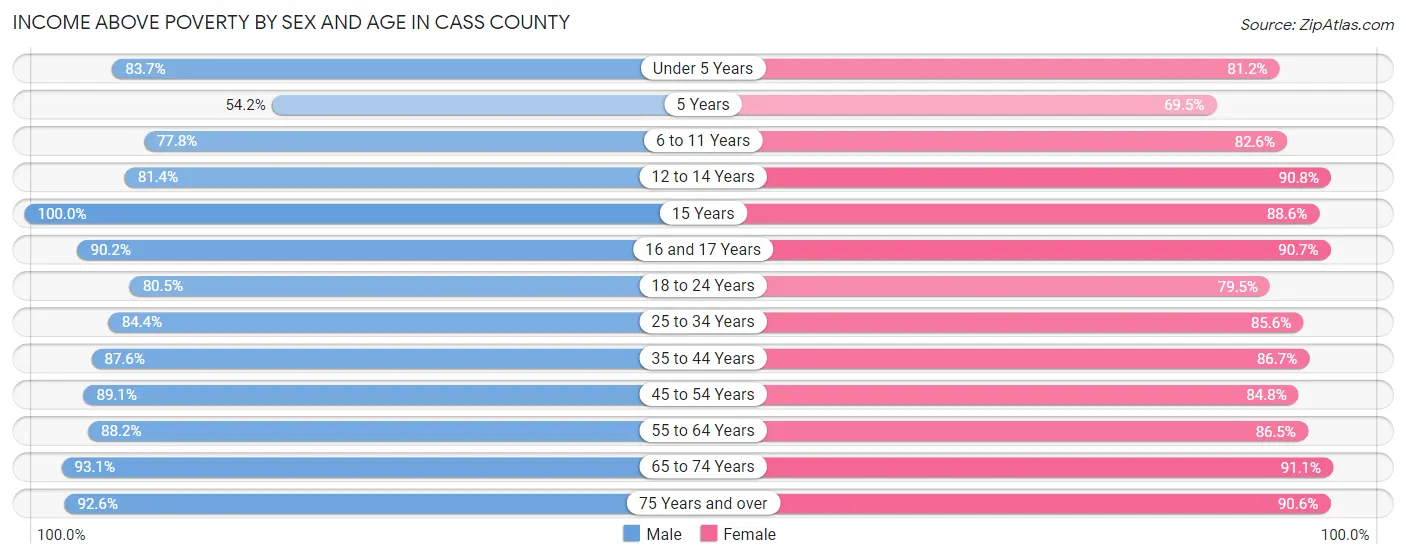
| Age Bracket | Male | Female |
| Under 5 Years | 920 (83.7%) | 822 (81.2%) |
| 5 Years | 182 (54.2%) | 98 (69.5%) |
| 6 to 11 Years | 994 (77.8%) | 1,148 (82.6%) |
| 12 to 14 Years | 617 (81.4%) | 688 (90.8%) |
| 15 Years | 195 (100.0%) | 186 (88.6%) |
| 16 and 17 Years | 422 (90.2%) | 574 (90.7%) |
| 18 to 24 Years | 1,282 (80.5%) | 1,218 (79.4%) |
| 25 to 34 Years | 1,764 (84.4%) | 1,803 (85.6%) |
| 35 to 44 Years | 1,944 (87.6%) | 1,919 (86.7%) |
| 45 to 54 Years | 2,220 (89.0%) | 1,964 (84.8%) |
| 55 to 64 Years | 2,544 (88.2%) | 2,339 (86.5%) |
| 65 to 74 Years | 1,652 (93.1%) | 1,790 (91.1%) |
| 75 Years and over | 1,012 (92.6%) | 1,457 (90.6%) |
| Total | 15,748 (86.1%) | 16,006 (86.1%) |
Income Below Poverty Among Married-Couple Families in Cass County
The poverty statistics for married-couple families in Cass County show that 4.8% or 341 of the total 7,108 families live below the poverty line. Families with 5 or more children have the highest poverty rate of 24.0%, comprising of 19 families. On the other hand, families with no children have the lowest poverty rate of 3.3%, which includes 146 families.

| Children | Above Poverty | Below Poverty |
| No Children | 4,282 (96.7%) | 146 (3.3%) |
| 1 or 2 Children | 1,997 (96.3%) | 77 (3.7%) |
| 3 or 4 Children | 428 (81.2%) | 99 (18.8%) |
| 5 or more Children | 60 (75.9%) | 19 (24.0%) |
| Total | 6,767 (95.2%) | 341 (4.8%) |
Income Below Poverty Among Single-Parent Households in Cass County
According to the poverty data in Cass County, 20.2% or 142 single-father households and 27.0% or 483 single-mother households are living below the poverty line. Among single-father households, those with 3 or 4 children have the highest poverty rate, with 58 households (68.2%) experiencing poverty. Likewise, among single-mother households, those with 1 or 2 children have the highest poverty rate, with 270 households (30.1%) falling below the poverty line.

| Children | Single Father | Single Mother |
| No Children | 31 (15.3%) | 153 (29.2%) |
| 1 or 2 Children | 53 (12.7%) | 270 (30.1%) |
| 3 or 4 Children | 58 (68.2%) | 60 (18.3%) |
| 5 or more Children | 0 (0.0%) | 0 (0.0%) |
| Total | 142 (20.2%) | 483 (27.0%) |
Income Below Poverty Among Married-Couple vs Single-Parent Households in Cass County
The poverty data for Cass County shows that 341 of the married-couple family households (4.8%) and 625 of the single-parent households (25.1%) are living below the poverty level. Within the married-couple family households, those with 5 or more children have the highest poverty rate, with 19 households (24.0%) falling below the poverty line. Among the single-parent households, those with 3 or 4 children have the highest poverty rate, with 118 household (28.6%) living below poverty.
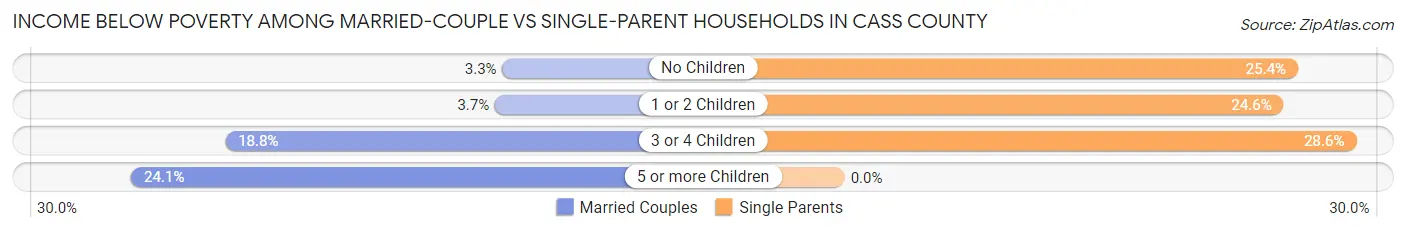
| Children | Married-Couple Families | Single-Parent Households |
| No Children | 146 (3.3%) | 184 (25.4%) |
| 1 or 2 Children | 77 (3.7%) | 323 (24.6%) |
| 3 or 4 Children | 99 (18.8%) | 118 (28.6%) |
| 5 or more Children | 19 (24.0%) | 0 (0.0%) |
| Total | 341 (4.8%) | 625 (25.1%) |
Employment Characteristics in Cass County
Employment by Class of Employer in Cass County
Among the 17,896 employed individuals in Cass County, private company employees (12,967 | 72.5%), not-for-profit organizations (1,603 | 9.0%), and local government employees (1,221 | 6.8%) make up the most common classes of employment.
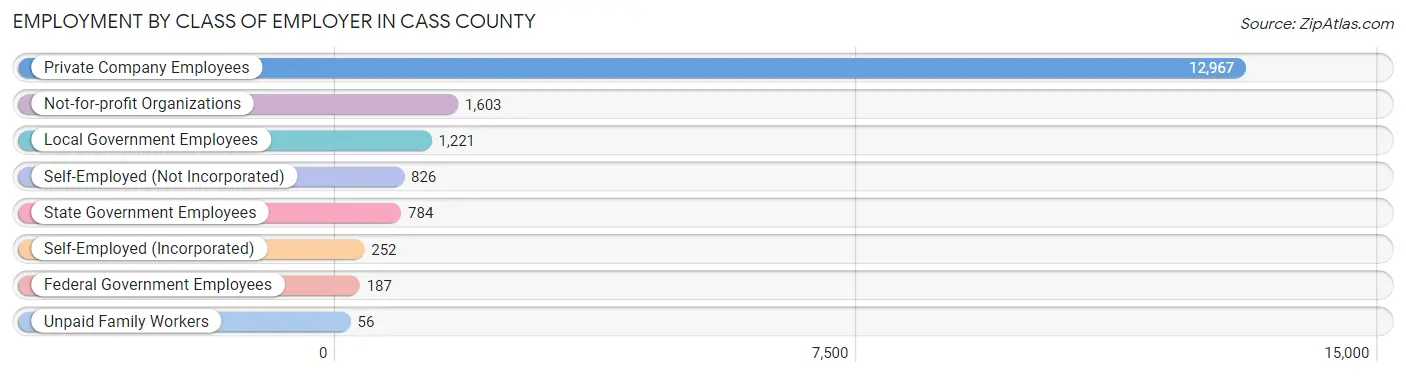
| Employer Class | # Employees | % Employees |
| Private Company Employees | 12,967 | 72.5% |
| Self-Employed (Incorporated) | 252 | 1.4% |
| Self-Employed (Not Incorporated) | 826 | 4.6% |
| Not-for-profit Organizations | 1,603 | 9.0% |
| Local Government Employees | 1,221 | 6.8% |
| State Government Employees | 784 | 4.4% |
| Federal Government Employees | 187 | 1.0% |
| Unpaid Family Workers | 56 | 0.3% |
| Total | 17,896 | 100.0% |
Employment Status by Age in Cass County
According to the labor force statistics for Cass County, out of the total population over 16 years of age (30,393), 62.9% or 19,117 individuals are in the labor force, with 4.2% or 803 of them unemployed. The age group with the highest labor force participation rate is 30 to 34 years, with 83.9% or 1,666 individuals in the labor force. Within the labor force, the 60 to 64 years age range has the highest percentage of unemployed individuals, with 10.9% or 174 of them being unemployed.
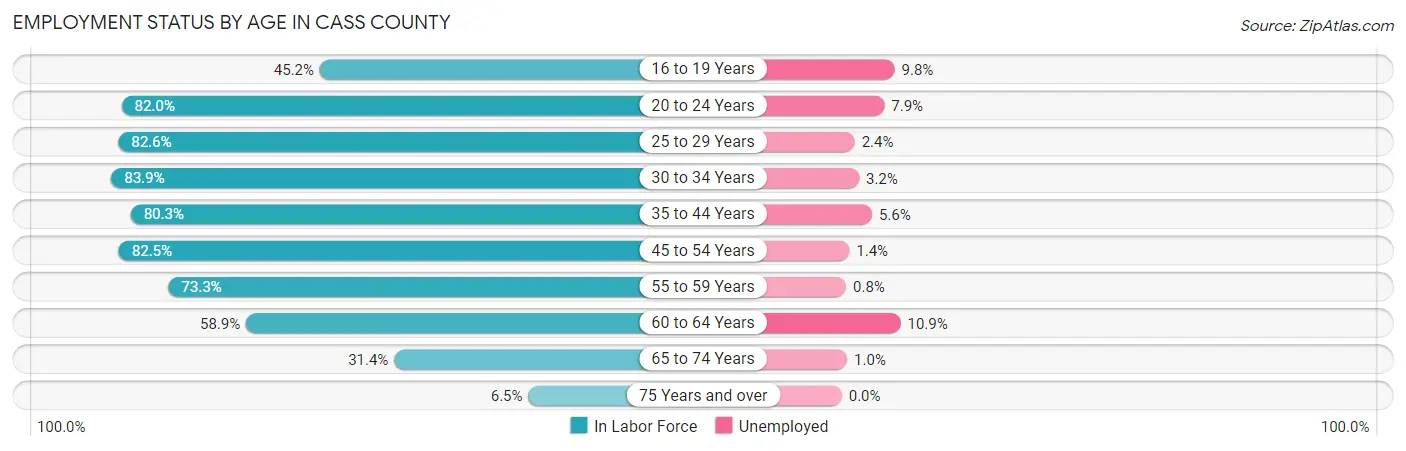
| Age Bracket | In Labor Force | Unemployed |
| 16 to 19 Years | 895 (45.2%) | 88 (9.8%) |
| 20 to 24 Years | 1,941 (82.0%) | 153 (7.9%) |
| 25 to 29 Years | 1,899 (82.6%) | 46 (2.4%) |
| 30 to 34 Years | 1,666 (83.9%) | 53 (3.2%) |
| 35 to 44 Years | 3,590 (80.3%) | 201 (5.6%) |
| 45 to 54 Years | 3,993 (82.5%) | 56 (1.4%) |
| 55 to 59 Years | 2,131 (73.3%) | 17 (0.8%) |
| 60 to 64 Years | 1,599 (58.9%) | 174 (10.9%) |
| 65 to 74 Years | 1,192 (31.4%) | 12 (1.0%) |
| 75 Years and over | 197 (6.5%) | 0 (0.0%) |
| Total | 19,117 (62.9%) | 803 (4.2%) |
Employment Status by Educational Attainment in Cass County
According to labor force statistics for Cass County, 77.4% of individuals (14,875) out of the total population between 25 and 64 years of age (19,218) are in the labor force, with 3.7% or 550 of them being unemployed. The group with the highest labor force participation rate are those with the educational attainment of bachelor's degree or higher, with 87.9% or 2,662 individuals in the labor force. Within the labor force, individuals with less than high school education have the highest percentage of unemployment, with 7.5% or 126 of them being unemployed.

| Educational Attainment | In Labor Force | Unemployed |
| Less than High School | 1,685 (60.5%) | 209 (7.5%) |
| High School Diploma | 5,868 (77.5%) | 356 (4.7%) |
| College / Associate Degree | 4,661 (79.9%) | 146 (2.5%) |
| Bachelor's Degree or higher | 2,662 (87.9%) | 33 (1.1%) |
| Total | 14,875 (77.4%) | 711 (3.7%) |
Employment Occupations by Sex in Cass County
Management, Business, Science and Arts Occupations
The most common Management, Business, Science and Arts occupations in Cass County are Management (1,518 | 8.3%), Community & Social Service (1,440 | 7.9%), Health Diagnosing & Treating (999 | 5.5%), Education Instruction & Library (814 | 4.5%), and Health Technologists (527 | 2.9%).

Management, Business, Science and Arts Occupations by Sex
Within the Management, Business, Science and Arts occupations in Cass County, the most male-oriented occupations are Computers & Mathematics (93.3%), Life, Physical & Social Science (91.2%), and Computers, Engineering & Science (90.1%), while the most female-oriented occupations are Education Instruction & Library (89.9%), Health Technologists (86.7%), and Health Diagnosing & Treating (82.0%).
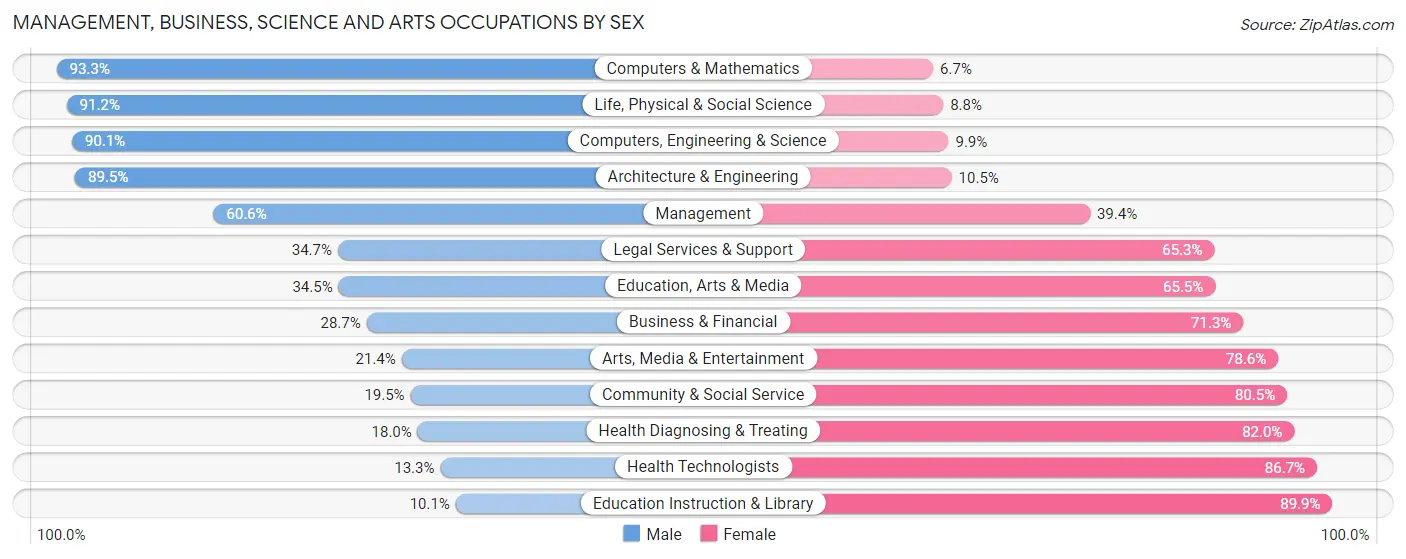
| Occupation | Male | Female |
| Management | 920 (60.6%) | 598 (39.4%) |
| Business & Financial | 84 (28.7%) | 209 (71.3%) |
| Computers, Engineering & Science | 219 (90.1%) | 24 (9.9%) |
| Computers & Mathematics | 14 (93.3%) | 1 (6.7%) |
| Architecture & Engineering | 153 (89.5%) | 18 (10.5%) |
| Life, Physical & Social Science | 52 (91.2%) | 5 (8.8%) |
| Community & Social Service | 281 (19.5%) | 1,159 (80.5%) |
| Education, Arts & Media | 145 (34.5%) | 275 (65.5%) |
| Legal Services & Support | 26 (34.7%) | 49 (65.3%) |
| Education Instruction & Library | 82 (10.1%) | 732 (89.9%) |
| Arts, Media & Entertainment | 28 (21.4%) | 103 (78.6%) |
| Health Diagnosing & Treating | 180 (18.0%) | 819 (82.0%) |
| Health Technologists | 70 (13.3%) | 457 (86.7%) |
| Total (Category) | 1,684 (37.5%) | 2,809 (62.5%) |
| Total (Overall) | 9,425 (51.6%) | 8,844 (48.4%) |
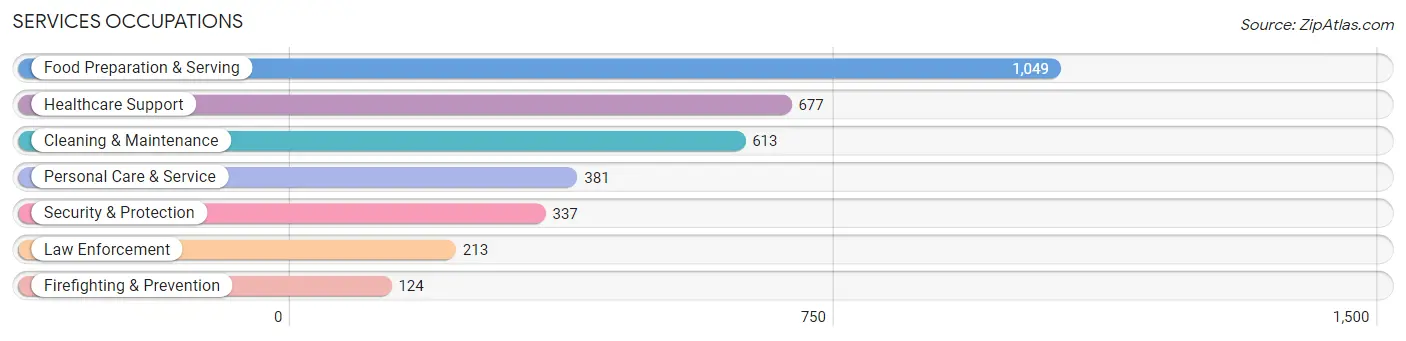
Services Occupations
The most common Services occupations in Cass County are Food Preparation & Serving (1,049 | 5.7%), Healthcare Support (677 | 3.7%), Cleaning & Maintenance (613 | 3.4%), Personal Care & Service (381 | 2.1%), and Security & Protection (337 | 1.8%).
Services Occupations by Sex
Within the Services occupations in Cass County, the most male-oriented occupations are Law Enforcement (87.8%), Security & Protection (81.6%), and Firefighting & Prevention (71.0%), while the most female-oriented occupations are Personal Care & Service (89.0%), Healthcare Support (88.2%), and Food Preparation & Serving (66.2%).
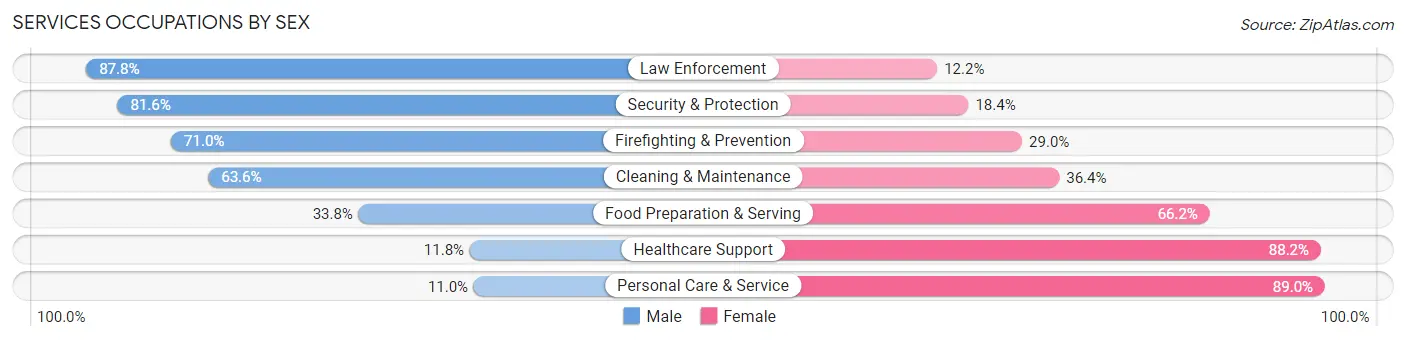
| Occupation | Male | Female |
| Healthcare Support | 80 (11.8%) | 597 (88.2%) |
| Security & Protection | 275 (81.6%) | 62 (18.4%) |
| Firefighting & Prevention | 88 (71.0%) | 36 (29.0%) |
| Law Enforcement | 187 (87.8%) | 26 (12.2%) |
| Food Preparation & Serving | 355 (33.8%) | 694 (66.2%) |
| Cleaning & Maintenance | 390 (63.6%) | 223 (36.4%) |
| Personal Care & Service | 42 (11.0%) | 339 (89.0%) |
| Total (Category) | 1,142 (37.4%) | 1,915 (62.6%) |
| Total (Overall) | 9,425 (51.6%) | 8,844 (48.4%) |
Sales and Office Occupations
The most common Sales and Office occupations in Cass County are Office & Administration (1,708 | 9.3%), and Sales & Related (1,687 | 9.2%).

Sales and Office Occupations by Sex

| Occupation | Male | Female |
| Sales & Related | 909 (53.9%) | 778 (46.1%) |
| Office & Administration | 320 (18.7%) | 1,388 (81.3%) |
| Total (Category) | 1,229 (36.2%) | 2,166 (63.8%) |
| Total (Overall) | 9,425 (51.6%) | 8,844 (48.4%) |
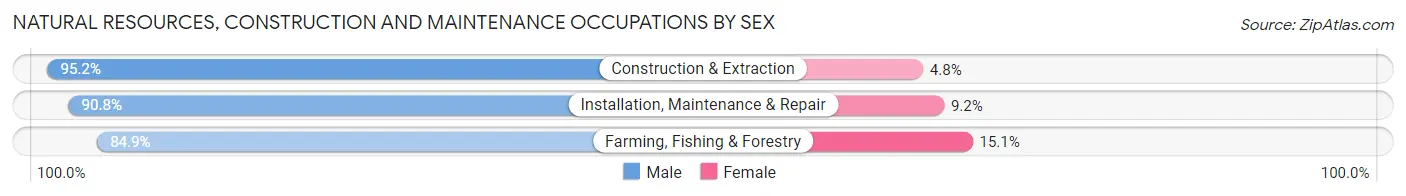
Natural Resources, Construction and Maintenance Occupations
The most common Natural Resources, Construction and Maintenance occupations in Cass County are Installation, Maintenance & Repair (905 | 5.0%), Construction & Extraction (795 | 4.3%), and Farming, Fishing & Forestry (139 | 0.8%).

Natural Resources, Construction and Maintenance Occupations by Sex
| Occupation | Male | Female |
| Farming, Fishing & Forestry | 118 (84.9%) | 21 (15.1%) |
| Construction & Extraction | 757 (95.2%) | 38 (4.8%) |
| Installation, Maintenance & Repair | 822 (90.8%) | 83 (9.2%) |
| Total (Category) | 1,697 (92.3%) | 142 (7.7%) |
| Total (Overall) | 9,425 (51.6%) | 8,844 (48.4%) |
Production, Transportation and Moving Occupations
The most common Production, Transportation and Moving occupations in Cass County are Production (3,439 | 18.8%), Material Moving (1,100 | 6.0%), and Transportation (946 | 5.2%).

Production, Transportation and Moving Occupations by Sex

| Occupation | Male | Female |
| Production | 2,096 (61.0%) | 1,343 (39.1%) |
| Transportation | 879 (92.9%) | 67 (7.1%) |
| Material Moving | 698 (63.4%) | 402 (36.5%) |
| Total (Category) | 3,673 (67.0%) | 1,812 (33.0%) |
| Total (Overall) | 9,425 (51.6%) | 8,844 (48.4%) |
Employment Industries by Sex in Cass County
Employment Industries in Cass County
The major employment industries in Cass County include Manufacturing (5,245 | 28.7%), Health Care & Social Assistance (2,734 | 15.0%), Retail Trade (1,964 | 10.7%), Educational Services (1,152 | 6.3%), and Construction (1,071 | 5.9%).

Employment Industries by Sex in Cass County
The Cass County industries that see more men than women are Mining, Quarrying, & Extraction (100.0%), Construction (88.3%), and Agriculture, Fishing & Hunting (88.2%), whereas the industries that tend to have a higher number of women are Health Care & Social Assistance (85.7%), Educational Services (83.4%), and Professional & Scientific (81.5%).

| Industry | Male | Female |
| Agriculture, Fishing & Hunting | 277 (88.2%) | 37 (11.8%) |
| Mining, Quarrying, & Extraction | 48 (100.0%) | 0 (0.0%) |
| Construction | 946 (88.3%) | 125 (11.7%) |
| Manufacturing | 3,491 (66.6%) | 1,754 (33.4%) |
| Wholesale Trade | 231 (77.5%) | 67 (22.5%) |
| Retail Trade | 1,091 (55.5%) | 873 (44.5%) |
| Transportation & Warehousing | 560 (78.5%) | 153 (21.5%) |
| Utilities | 112 (74.7%) | 38 (25.3%) |
| Information | 206 (63.0%) | 121 (37.0%) |
| Finance & Insurance | 171 (31.1%) | 379 (68.9%) |
| Real Estate, Rental & Leasing | 103 (75.7%) | 33 (24.3%) |
| Professional & Scientific | 46 (18.5%) | 203 (81.5%) |
| Enterprise Management | 0 (0.0%) | 0 (0.0%) |
| Administrative & Support | 293 (62.3%) | 177 (37.7%) |
| Educational Services | 191 (16.6%) | 961 (83.4%) |
| Health Care & Social Assistance | 390 (14.3%) | 2,344 (85.7%) |
| Arts, Entertainment & Recreation | 33 (19.9%) | 133 (80.1%) |
| Accommodation & Food Services | 473 (48.7%) | 498 (51.3%) |
| Public Administration | 434 (52.7%) | 389 (47.3%) |
| Total | 9,425 (51.6%) | 8,844 (48.4%) |
Education in Cass County
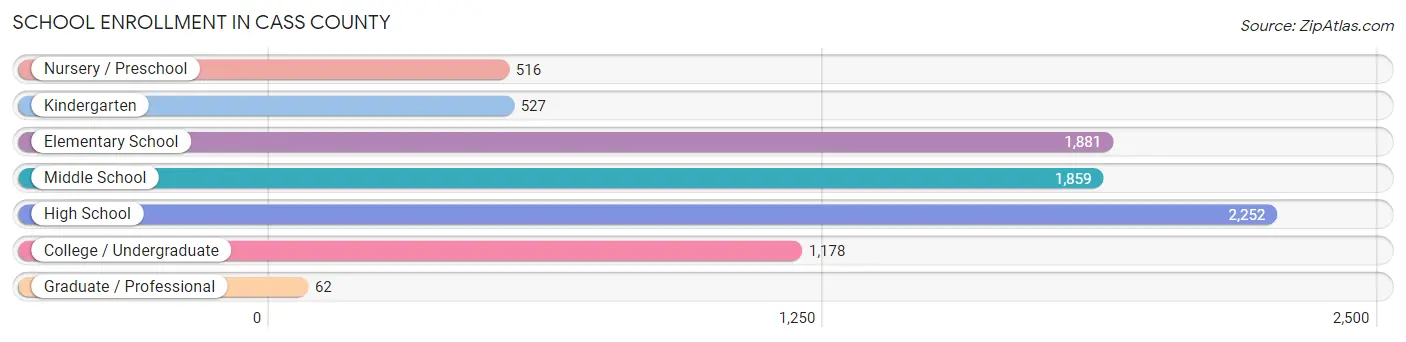
School Enrollment in Cass County
The most common levels of schooling among the 8,275 students in Cass County are high school (2,252 | 27.2%), elementary school (1,881 | 22.7%), and middle school (1,859 | 22.5%).
| School Level | # Students | % Students |
| Nursery / Preschool | 516 | 6.2% |
| Kindergarten | 527 | 6.4% |
| Elementary School | 1,881 | 22.7% |
| Middle School | 1,859 | 22.5% |
| High School | 2,252 | 27.2% |
| College / Undergraduate | 1,178 | 14.2% |
| Graduate / Professional | 62 | 0.7% |
| Total | 8,275 | 100.0% |
School Enrollment by Age by Funding Source in Cass County
Out of a total of 8,275 students who are enrolled in schools in Cass County, 679 (8.2%) attend a private institution, while the remaining 7,596 (91.8%) are enrolled in public schools. The age group of 35 years and over has the highest likelihood of being enrolled in private schools, with 68 (32.4% in the age bracket) enrolled. Conversely, the age group of 18 to 19 year olds has the lowest likelihood of being enrolled in a private school, with 622 (95.8% in the age bracket) attending a public institution.

| Age Bracket | Public School | Private School |
| 3 to 4 Year Olds | 375 (80.1%) | 93 (19.9%) |
| 5 to 9 Year Old | 1,949 (94.6%) | 111 (5.4%) |
| 10 to 14 Year Olds | 2,338 (93.2%) | 170 (6.8%) |
| 15 to 17 Year Olds | 1,408 (91.8%) | 125 (8.2%) |
| 18 to 19 Year Olds | 622 (95.8%) | 27 (4.2%) |
| 20 to 24 Year Olds | 632 (90.7%) | 65 (9.3%) |
| 25 to 34 Year Olds | 128 (85.3%) | 22 (14.7%) |
| 35 Years and over | 142 (67.6%) | 68 (32.4%) |
| Total | 7,596 (91.8%) | 679 (8.2%) |
Educational Attainment by Field of Study in Cass County
Education (1,060 | 24.5%), business (744 | 17.2%), science & technology (571 | 13.2%), arts & humanities (293 | 6.8%), and bio, nature & agricultural (273 | 6.3%) are the most common fields of study among 4,317 individuals in Cass County who have obtained a bachelor's degree or higher.

| Field of Study | # Graduates | % Graduates |
| Computers & Mathematics | 29 | 0.7% |
| Bio, Nature & Agricultural | 273 | 6.3% |
| Physical & Health Sciences | 116 | 2.7% |
| Psychology | 178 | 4.1% |
| Social Sciences | 221 | 5.1% |
| Engineering | 249 | 5.8% |
| Multidisciplinary Studies | 11 | 0.3% |
| Science & Technology | 571 | 13.2% |
| Business | 744 | 17.2% |
| Education | 1,060 | 24.5% |
| Literature & Languages | 158 | 3.7% |
| Liberal Arts & History | 255 | 5.9% |
| Visual & Performing Arts | 94 | 2.2% |
| Communications | 65 | 1.5% |
| Arts & Humanities | 293 | 6.8% |
| Total | 4,317 | 100.0% |
Transportation & Commute in Cass County
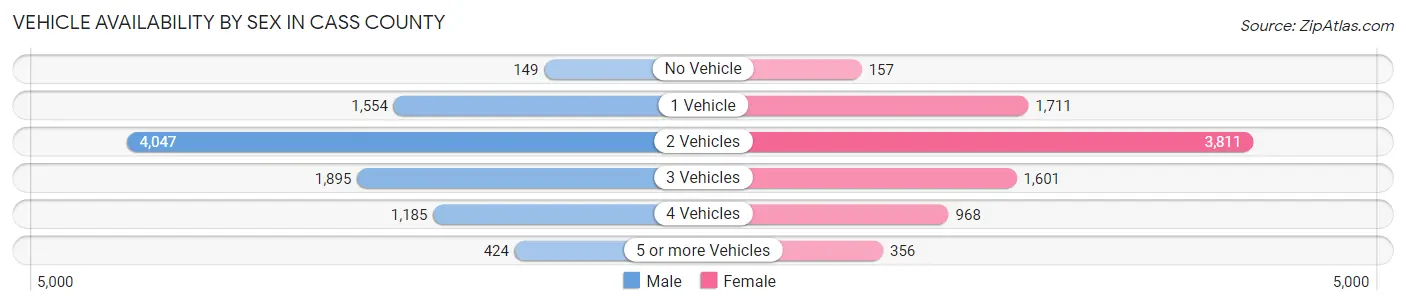
Vehicle Availability by Sex in Cass County
The most prevalent vehicle ownership categories in Cass County are males with 2 vehicles (4,047, accounting for 43.7%) and females with 2 vehicles (3,811, making up 47.0%).
| Vehicles Available | Male | Female |
| No Vehicle | 149 (1.6%) | 157 (1.8%) |
| 1 Vehicle | 1,554 (16.8%) | 1,711 (19.9%) |
| 2 Vehicles | 4,047 (43.7%) | 3,811 (44.3%) |
| 3 Vehicles | 1,895 (20.5%) | 1,601 (18.6%) |
| 4 Vehicles | 1,185 (12.8%) | 968 (11.3%) |
| 5 or more Vehicles | 424 (4.6%) | 356 (4.1%) |
| Total | 9,254 (100.0%) | 8,604 (100.0%) |
Commute Time in Cass County
The most frequently occuring commute durations in Cass County are 10 to 14 minutes (3,975 commuters, 22.9%), 5 to 9 minutes (2,855 commuters, 16.4%), and 15 to 19 minutes (2,563 commuters, 14.8%).

| Commute Time | # Commuters | % Commuters |
| Less than 5 Minutes | 714 | 4.1% |
| 5 to 9 Minutes | 2,855 | 16.4% |
| 10 to 14 Minutes | 3,975 | 22.9% |
| 15 to 19 Minutes | 2,563 | 14.8% |
| 20 to 24 Minutes | 2,109 | 12.1% |
| 25 to 29 Minutes | 756 | 4.3% |
| 30 to 34 Minutes | 1,489 | 8.6% |
| 35 to 39 Minutes | 340 | 2.0% |
| 40 to 44 Minutes | 415 | 2.4% |
| 45 to 59 Minutes | 1,288 | 7.4% |
| 60 to 89 Minutes | 390 | 2.2% |
| 90 or more Minutes | 470 | 2.7% |
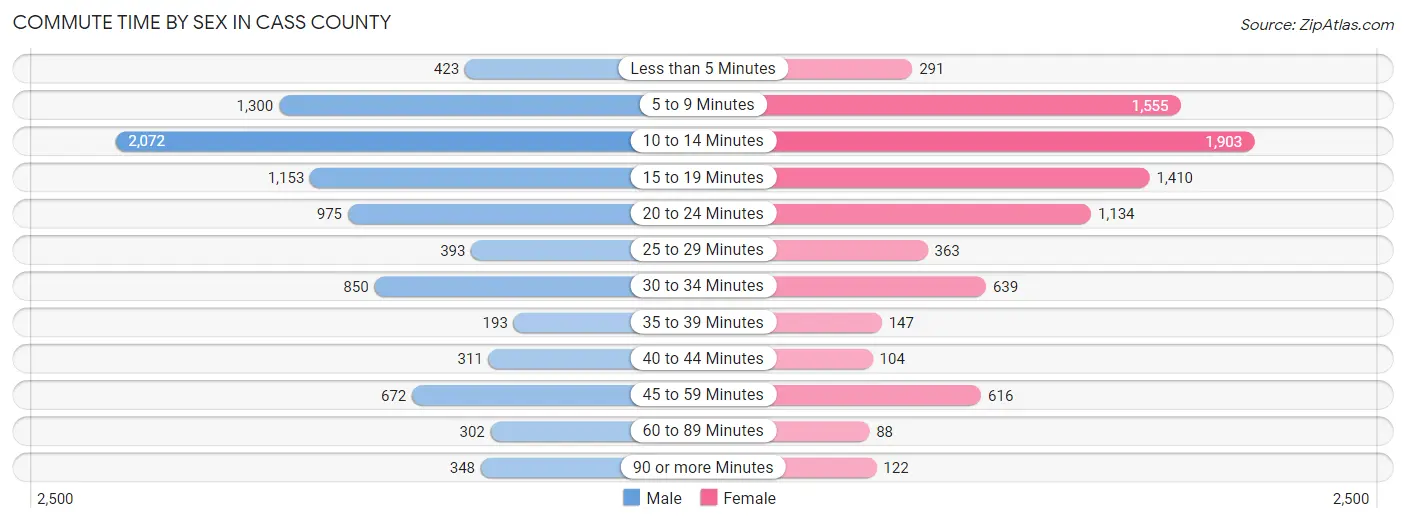
Commute Time by Sex in Cass County
The most common commute times in Cass County are 10 to 14 minutes (2,072 commuters, 23.0%) for males and 10 to 14 minutes (1,903 commuters, 22.7%) for females.
| Commute Time | Male | Female |
| Less than 5 Minutes | 423 (4.7%) | 291 (3.5%) |
| 5 to 9 Minutes | 1,300 (14.5%) | 1,555 (18.6%) |
| 10 to 14 Minutes | 2,072 (23.0%) | 1,903 (22.7%) |
| 15 to 19 Minutes | 1,153 (12.8%) | 1,410 (16.8%) |
| 20 to 24 Minutes | 975 (10.8%) | 1,134 (13.6%) |
| 25 to 29 Minutes | 393 (4.4%) | 363 (4.3%) |
| 30 to 34 Minutes | 850 (9.5%) | 639 (7.6%) |
| 35 to 39 Minutes | 193 (2.1%) | 147 (1.8%) |
| 40 to 44 Minutes | 311 (3.5%) | 104 (1.2%) |
| 45 to 59 Minutes | 672 (7.5%) | 616 (7.4%) |
| 60 to 89 Minutes | 302 (3.4%) | 88 (1.1%) |
| 90 or more Minutes | 348 (3.9%) | 122 (1.5%) |
Time of Departure to Work by Sex in Cass County
The most frequent times of departure to work in Cass County are 12:00 PM to 3:59 PM (1,365, 15.2%) for males and 7:00 AM to 7:29 AM (1,124, 13.4%) for females.

| Time of Departure | Male | Female |
| 12:00 AM to 4:59 AM | 961 (10.7%) | 597 (7.1%) |
| 5:00 AM to 5:29 AM | 820 (9.1%) | 536 (6.4%) |
| 5:30 AM to 5:59 AM | 525 (5.8%) | 471 (5.6%) |
| 6:00 AM to 6:29 AM | 845 (9.4%) | 555 (6.6%) |
| 6:30 AM to 6:59 AM | 996 (11.1%) | 811 (9.7%) |
| 7:00 AM to 7:29 AM | 999 (11.1%) | 1,124 (13.4%) |
| 7:30 AM to 7:59 AM | 782 (8.7%) | 916 (10.9%) |
| 8:00 AM to 8:29 AM | 540 (6.0%) | 843 (10.1%) |
| 8:30 AM to 8:59 AM | 149 (1.7%) | 405 (4.8%) |
| 9:00 AM to 9:59 AM | 199 (2.2%) | 408 (4.9%) |
| 10:00 AM to 10:59 AM | 84 (0.9%) | 170 (2.0%) |
| 11:00 AM to 11:59 AM | 73 (0.8%) | 65 (0.8%) |
| 12:00 PM to 3:59 PM | 1,365 (15.2%) | 920 (11.0%) |
| 4:00 PM to 11:59 PM | 654 (7.3%) | 551 (6.6%) |
| Total | 8,992 (100.0%) | 8,372 (100.0%) |
Housing Occupancy in Cass County
Occupancy by Ownership in Cass County
Of the total 14,970 dwellings in Cass County, owner-occupied units account for 11,189 (74.7%), while renter-occupied units make up 3,781 (25.3%).
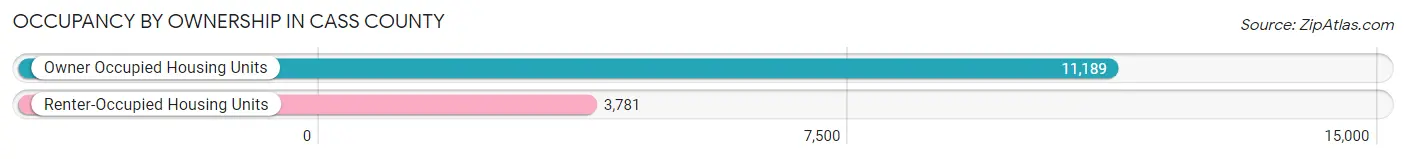
| Occupancy | # Housing Units | % Housing Units |
| Owner Occupied Housing Units | 11,189 | 74.7% |
| Renter-Occupied Housing Units | 3,781 | 25.3% |
| Total Occupied Housing Units | 14,970 | 100.0% |
Occupancy by Household Size in Cass County

| Household Size | # Housing Units | % Housing Units |
| 1-Person Household | 4,595 | 30.7% |
| 2-Person Household | 5,165 | 34.5% |
| 3-Person Household | 2,025 | 13.5% |
| 4+ Person Household | 3,185 | 21.3% |
| Total Housing Units | 14,970 | 100.0% |
Occupancy by Ownership by Household Size in Cass County

| Household Size | Owner-occupied | Renter-occupied |
| 1-Person Household | 2,971 (64.7%) | 1,624 (35.3%) |
| 2-Person Household | 4,283 (82.9%) | 882 (17.1%) |
| 3-Person Household | 1,579 (78.0%) | 446 (22.0%) |
| 4+ Person Household | 2,356 (74.0%) | 829 (26.0%) |
| Total Housing Units | 11,189 (74.7%) | 3,781 (25.3%) |
Occupancy by Educational Attainment in Cass County

| Household Size | Owner-occupied | Renter-occupied |
| Less than High School | 1,283 (67.6%) | 614 (32.4%) |
| High School Diploma | 4,114 (70.1%) | 1,751 (29.9%) |
| College/Associate Degree | 3,530 (77.3%) | 1,038 (22.7%) |
| Bachelor's Degree or higher | 2,262 (85.7%) | 378 (14.3%) |
Occupancy by Age of Householder in Cass County
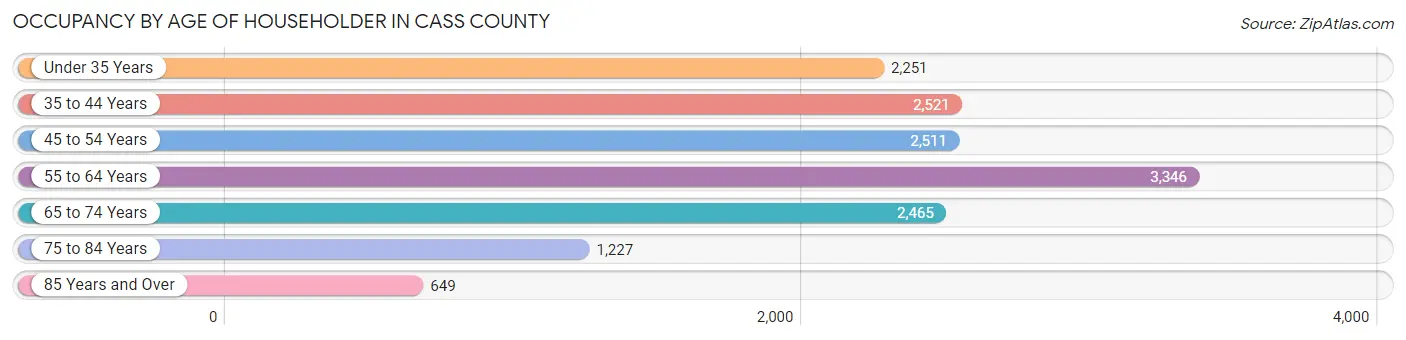
| Age Bracket | # Households | % Households |
| Under 35 Years | 2,251 | 15.0% |
| 35 to 44 Years | 2,521 | 16.8% |
| 45 to 54 Years | 2,511 | 16.8% |
| 55 to 64 Years | 3,346 | 22.4% |
| 65 to 74 Years | 2,465 | 16.5% |
| 75 to 84 Years | 1,227 | 8.2% |
| 85 Years and Over | 649 | 4.3% |
| Total | 14,970 | 100.0% |
Housing Finances in Cass County
Median Income by Occupancy in Cass County
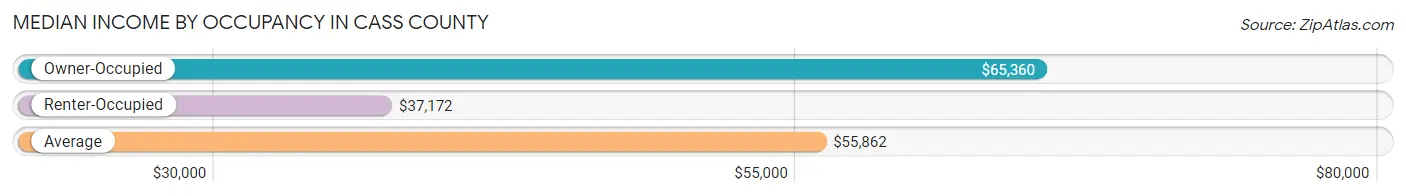
| Occupancy Type | # Households | Median Income |
| Owner-Occupied | 11,189 (74.7%) | $65,360 |
| Renter-Occupied | 3,781 (25.3%) | $37,172 |
| Average | 14,970 (100.0%) | $55,862 |
Occupancy by Householder Income Bracket in Cass County
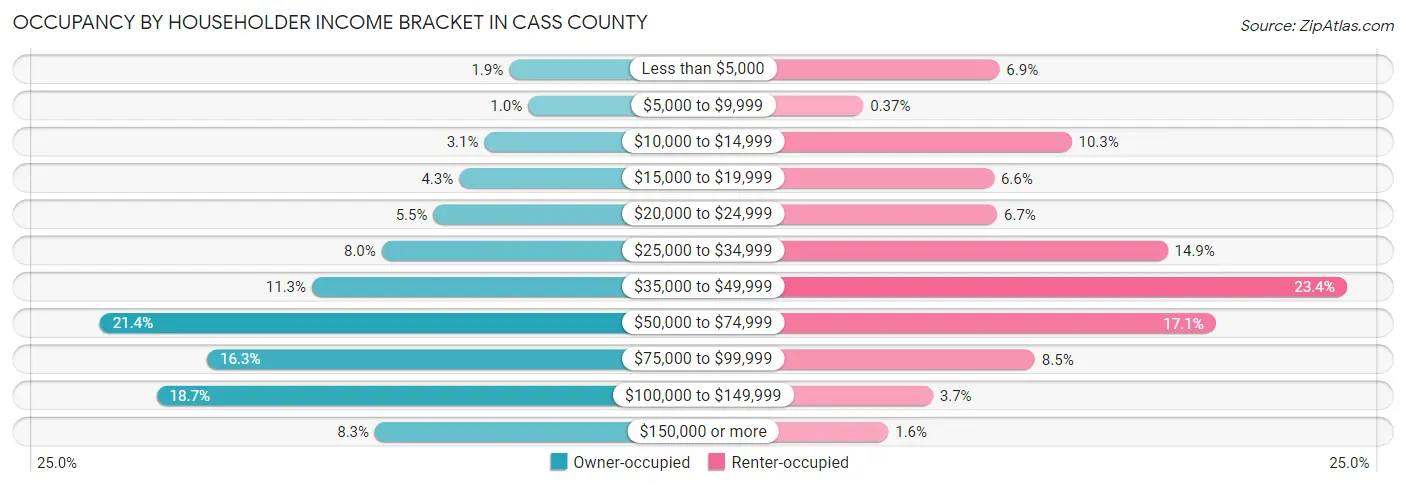
| Income Bracket | Owner-occupied | Renter-occupied |
| Less than $5,000 | 216 (1.9%) | 259 (6.9%) |
| $5,000 to $9,999 | 115 (1.0%) | 14 (0.4%) |
| $10,000 to $14,999 | 348 (3.1%) | 389 (10.3%) |
| $15,000 to $19,999 | 482 (4.3%) | 249 (6.6%) |
| $20,000 to $24,999 | 620 (5.5%) | 255 (6.7%) |
| $25,000 to $34,999 | 895 (8.0%) | 562 (14.9%) |
| $35,000 to $49,999 | 1,267 (11.3%) | 884 (23.4%) |
| $50,000 to $74,999 | 2,397 (21.4%) | 648 (17.1%) |
| $75,000 to $99,999 | 1,825 (16.3%) | 323 (8.5%) |
| $100,000 to $149,999 | 2,093 (18.7%) | 139 (3.7%) |
| $150,000 or more | 931 (8.3%) | 59 (1.6%) |
| Total | 11,189 (100.0%) | 3,781 (100.0%) |
Monthly Housing Cost Tiers in Cass County
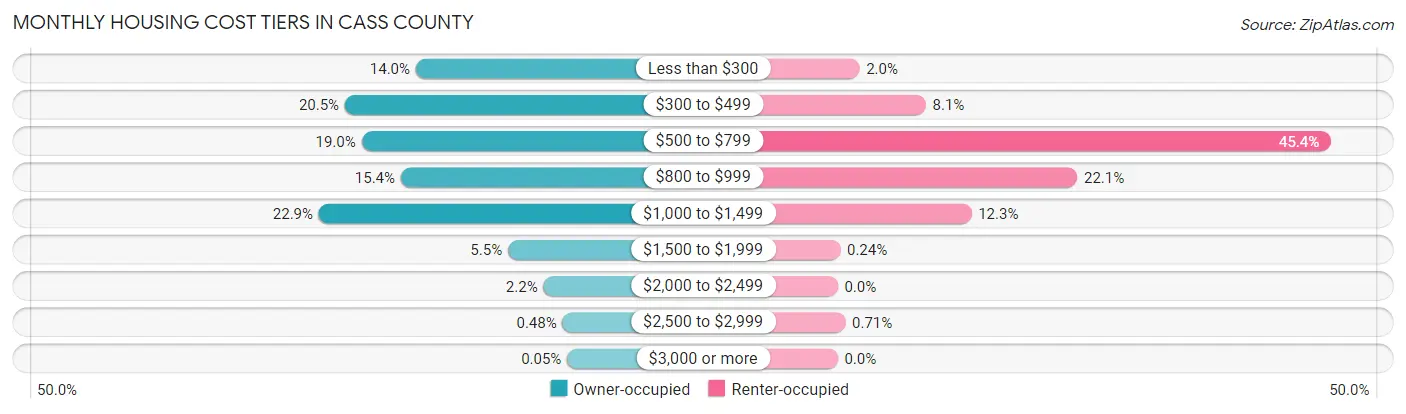
| Monthly Cost | Owner-occupied | Renter-occupied |
| Less than $300 | 1,564 (14.0%) | 76 (2.0%) |
| $300 to $499 | 2,295 (20.5%) | 307 (8.1%) |
| $500 to $799 | 2,124 (19.0%) | 1,718 (45.4%) |
| $800 to $999 | 1,719 (15.4%) | 834 (22.1%) |
| $1,000 to $1,499 | 2,563 (22.9%) | 466 (12.3%) |
| $1,500 to $1,999 | 615 (5.5%) | 9 (0.2%) |
| $2,000 to $2,499 | 249 (2.2%) | 0 (0.0%) |
| $2,500 to $2,999 | 54 (0.5%) | 27 (0.7%) |
| $3,000 or more | 6 (0.1%) | 0 (0.0%) |
| Total | 11,189 (100.0%) | 3,781 (100.0%) |
Physical Housing Characteristics in Cass County
Housing Structures in Cass County

| Structure Type | # Housing Units | % Housing Units |
| Single Unit, Detached | 12,459 | 83.2% |
| Single Unit, Attached | 206 | 1.4% |
| 2 Unit Apartments | 526 | 3.5% |
| 3 or 4 Unit Apartments | 301 | 2.0% |
| 5 to 9 Unit Apartments | 411 | 2.8% |
| 10 or more Apartments | 334 | 2.2% |
| Mobile Home / Other | 733 | 4.9% |
| Total | 14,970 | 100.0% |
Housing Structures by Occupancy in Cass County
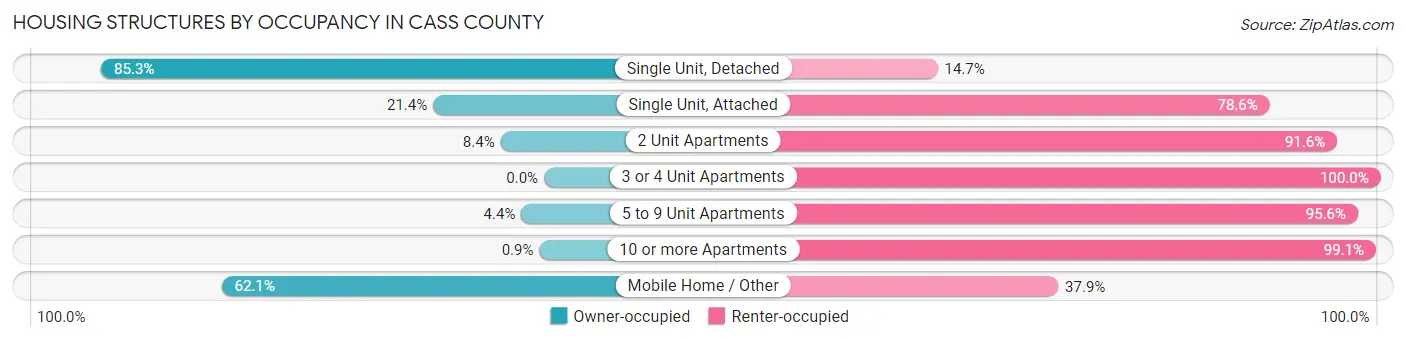
| Structure Type | Owner-occupied | Renter-occupied |
| Single Unit, Detached | 10,625 (85.3%) | 1,834 (14.7%) |
| Single Unit, Attached | 44 (21.4%) | 162 (78.6%) |
| 2 Unit Apartments | 44 (8.4%) | 482 (91.6%) |
| 3 or 4 Unit Apartments | 0 (0.0%) | 301 (100.0%) |
| 5 to 9 Unit Apartments | 18 (4.4%) | 393 (95.6%) |
| 10 or more Apartments | 3 (0.9%) | 331 (99.1%) |
| Mobile Home / Other | 455 (62.1%) | 278 (37.9%) |
| Total | 11,189 (74.7%) | 3,781 (25.3%) |
Housing Structures by Number of Rooms in Cass County

| Number of Rooms | Owner-occupied | Renter-occupied |
| 1 Room | 0 (0.0%) | 179 (4.7%) |
| 2 or 3 Rooms | 204 (1.8%) | 733 (19.4%) |
| 4 or 5 Rooms | 2,786 (24.9%) | 1,554 (41.1%) |
| 6 or 7 Rooms | 4,622 (41.3%) | 680 (18.0%) |
| 8 or more Rooms | 3,577 (32.0%) | 635 (16.8%) |
| Total | 11,189 (100.0%) | 3,781 (100.0%) |
Housing Structure by Heating Type in Cass County
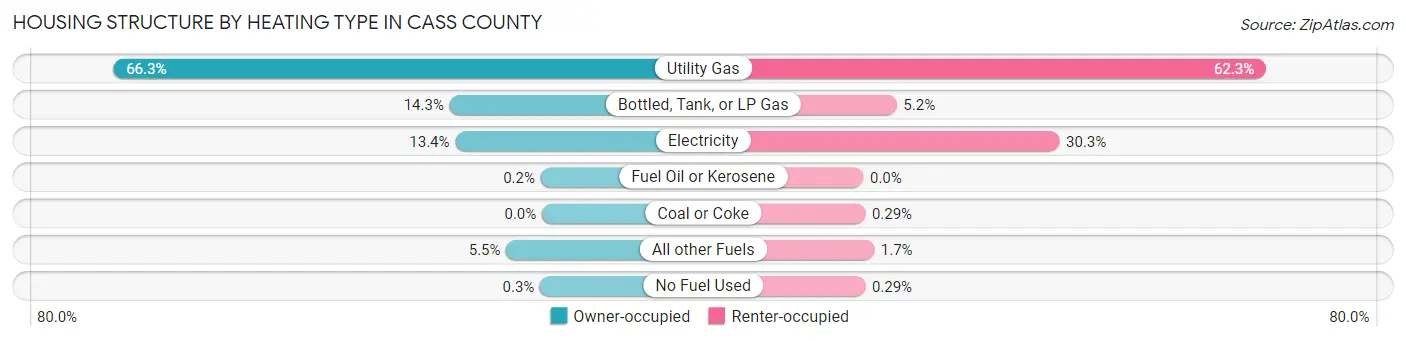
| Heating Type | Owner-occupied | Renter-occupied |
| Utility Gas | 7,417 (66.3%) | 2,355 (62.3%) |
| Bottled, Tank, or LP Gas | 1,598 (14.3%) | 195 (5.2%) |
| Electricity | 1,500 (13.4%) | 1,146 (30.3%) |
| Fuel Oil or Kerosene | 22 (0.2%) | 0 (0.0%) |
| Coal or Coke | 0 (0.0%) | 11 (0.3%) |
| All other Fuels | 618 (5.5%) | 63 (1.7%) |
| No Fuel Used | 34 (0.3%) | 11 (0.3%) |
| Total | 11,189 (100.0%) | 3,781 (100.0%) |
Household Vehicle Usage in Cass County

| Vehicles per Household | Owner-occupied | Renter-occupied |
| No Vehicle | 269 (2.4%) | 559 (14.8%) |
| 1 Vehicle | 2,882 (25.8%) | 2,131 (56.4%) |
| 2 Vehicles | 4,759 (42.5%) | 898 (23.7%) |
| 3 or more Vehicles | 3,279 (29.3%) | 193 (5.1%) |
| Total | 11,189 (100.0%) | 3,781 (100.0%) |
Real Estate & Mortgages in Cass County
Real Estate and Mortgage Overview in Cass County
| Characteristic | Without Mortgage | With Mortgage |
| Housing Units | 4,794 | 6,395 |
| Median Property Value | $83,500 | $130,500 |
| Median Household Income | $50,650 | $667 |
| Monthly Housing Costs | $373 | $0 |
| Real Estate Taxes | $700 | $294 |
Property Value by Mortgage Status in Cass County

| Property Value | Without Mortgage | With Mortgage |
| Less than $50,000 | 1,048 (21.9%) | 290 (4.5%) |
| $50,000 to $99,999 | 1,765 (36.8%) | 1,917 (30.0%) |
| $100,000 to $299,999 | 1,700 (35.5%) | 3,852 (60.2%) |
| $300,000 to $499,999 | 227 (4.7%) | 299 (4.7%) |
| $500,000 to $749,999 | 25 (0.5%) | 20 (0.3%) |
| $750,000 to $999,999 | 19 (0.4%) | 7 (0.1%) |
| $1,000,000 or more | 10 (0.2%) | 10 (0.2%) |
| Total | 4,794 (100.0%) | 6,395 (100.0%) |
Household Income by Mortgage Status in Cass County

| Household Income | Without Mortgage | With Mortgage |
| Less than $10,000 | 215 (4.5%) | 258 (4.0%) |
| $10,000 to $24,999 | 924 (19.3%) | 116 (1.8%) |
| $25,000 to $34,999 | 568 (11.8%) | 526 (8.2%) |
| $35,000 to $49,999 | 631 (13.2%) | 327 (5.1%) |
| $50,000 to $74,999 | 1,187 (24.8%) | 636 (10.0%) |
| $75,000 to $99,999 | 508 (10.6%) | 1,210 (18.9%) |
| $100,000 to $149,999 | 497 (10.4%) | 1,317 (20.6%) |
| $150,000 or more | 264 (5.5%) | 1,596 (25.0%) |
| Total | 4,794 (100.0%) | 6,395 (100.0%) |
Property Value to Household Income Ratio in Cass County
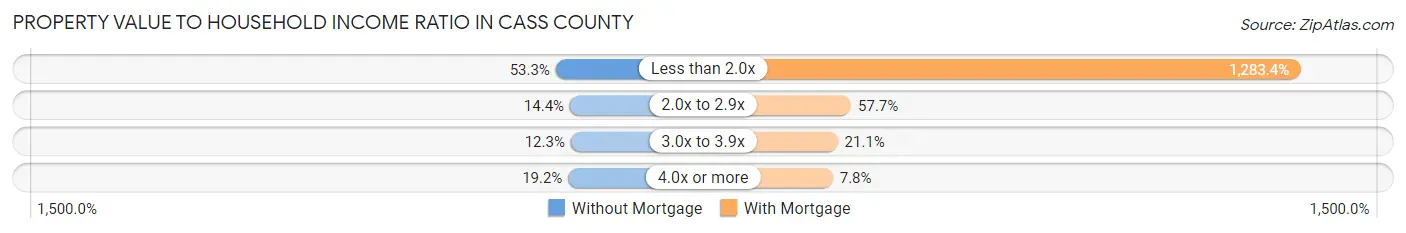
| Value-to-Income Ratio | Without Mortgage | With Mortgage |
| Less than 2.0x | 2,553 (53.2%) | 82,075 (1,283.4%) |
| 2.0x to 2.9x | 692 (14.4%) | 3,690 (57.7%) |
| 3.0x to 3.9x | 589 (12.3%) | 1,349 (21.1%) |
| 4.0x or more | 919 (19.2%) | 500 (7.8%) |
| Total | 4,794 (100.0%) | 6,395 (100.0%) |
Real Estate Taxes by Mortgage Status in Cass County

| Property Taxes | Without Mortgage | With Mortgage |
| Less than $800 | 2,525 (52.7%) | 31 (0.5%) |
| $800 to $1,499 | 1,159 (24.2%) | 2,599 (40.6%) |
| $800 to $1,499 | 678 (14.1%) | 2,134 (33.4%) |
| Total | 4,794 (100.0%) | 6,395 (100.0%) |
Health & Disability in Cass County
Health Insurance Coverage by Age in Cass County

| Age Bracket | With Coverage | Without Coverage |
| Under 6 Years | 2,459 (93.7%) | 166 (6.3%) |
| 6 to 18 Years | 6,147 (96.8%) | 205 (3.2%) |
| 19 to 25 Years | 2,672 (89.9%) | 300 (10.1%) |
| 26 to 34 Years | 3,341 (86.8%) | 509 (13.2%) |
| 35 to 44 Years | 3,755 (84.7%) | 678 (15.3%) |
| 45 to 54 Years | 4,449 (92.8%) | 347 (7.2%) |
| 55 to 64 Years | 5,068 (90.7%) | 521 (9.3%) |
| 65 to 74 Years | 3,738 (100.0%) | 0 (0.0%) |
| 75 Years and older | 2,665 (98.7%) | 36 (1.3%) |
| Total | 34,294 (92.5%) | 2,762 (7.4%) |
Health Insurance Coverage by Citizenship Status in Cass County

| Citizenship Status | With Coverage | Without Coverage |
| Native Born | 2,459 (93.7%) | 166 (6.3%) |
| Foreign Born, Citizen | 6,147 (96.8%) | 205 (3.2%) |
| Foreign Born, not a Citizen | 2,672 (89.9%) | 300 (10.1%) |
Health Insurance Coverage by Household Income in Cass County

| Household Income | With Coverage | Without Coverage |
| Under $25,000 | 3,754 (82.3%) | 810 (17.7%) |
| $25,000 to $49,999 | 6,917 (87.7%) | 973 (12.3%) |
| $50,000 to $74,999 | 7,694 (95.0%) | 404 (5.0%) |
| $75,000 to $99,999 | 5,849 (96.7%) | 203 (3.4%) |
| $100,000 and over | 9,829 (96.7%) | 336 (3.3%) |
Public vs Private Health Insurance Coverage by Age in Cass County

| Age Bracket | Public Insurance | Private Insurance |
| Under 6 | 1,131 (43.1%) | 1,528 (58.2%) |
| 6 to 18 Years | 2,488 (39.2%) | 4,080 (64.2%) |
| 19 to 25 Years | 669 (22.5%) | 2,122 (71.4%) |
| 25 to 34 Years | 747 (19.4%) | 2,693 (70.0%) |
| 35 to 44 Years | 930 (21.0%) | 3,024 (68.2%) |
| 45 to 54 Years | 810 (16.9%) | 3,858 (80.4%) |
| 55 to 64 Years | 1,204 (21.5%) | 4,083 (73.1%) |
| 65 to 74 Years | 3,568 (95.5%) | 2,290 (61.3%) |
| 75 Years and over | 2,640 (97.7%) | 1,884 (69.8%) |
| Total | 14,187 (38.3%) | 25,562 (69.0%) |
Disability Status by Sex by Age in Cass County
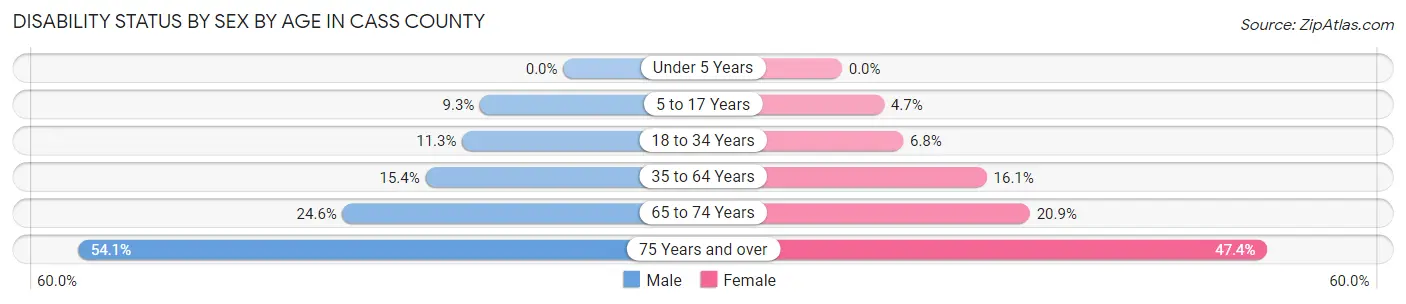
| Age Bracket | Male | Female |
| Under 5 Years | 0 (0.0%) | 0 (0.0%) |
| 5 to 17 Years | 290 (9.3%) | 151 (4.7%) |
| 18 to 34 Years | 412 (11.3%) | 248 (6.8%) |
| 35 to 64 Years | 1,164 (15.3%) | 1,167 (16.1%) |
| 65 to 74 Years | 436 (24.6%) | 411 (20.9%) |
| 75 Years and over | 591 (54.1%) | 762 (47.4%) |
Disability Class by Sex by Age in Cass County
Disability Class: Hearing Difficulty
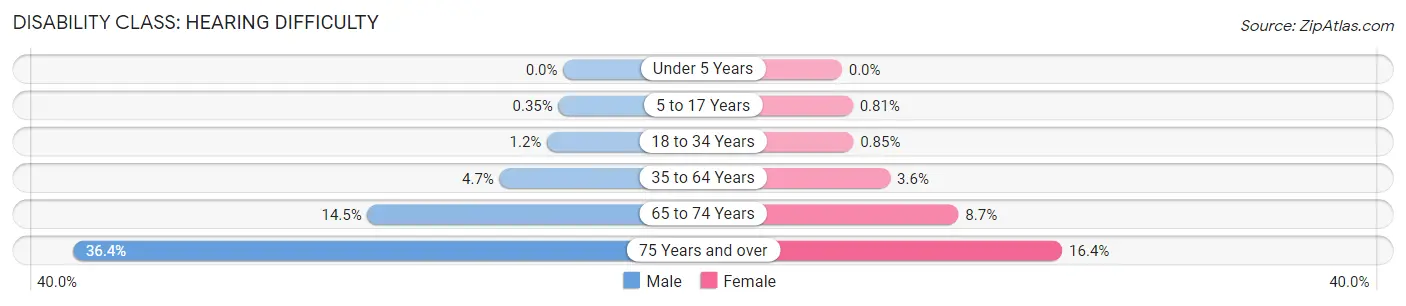
| Age Bracket | Male | Female |
| Under 5 Years | 0 (0.0%) | 0 (0.0%) |
| 5 to 17 Years | 11 (0.4%) | 26 (0.8%) |
| 18 to 34 Years | 44 (1.2%) | 31 (0.9%) |
| 35 to 64 Years | 359 (4.7%) | 260 (3.6%) |
| 65 to 74 Years | 258 (14.5%) | 170 (8.7%) |
| 75 Years and over | 398 (36.4%) | 263 (16.4%) |
Disability Class: Vision Difficulty
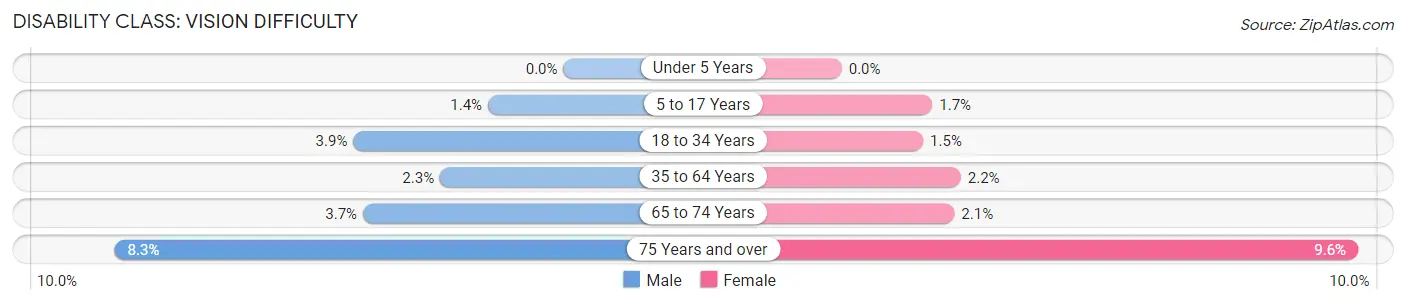
| Age Bracket | Male | Female |
| Under 5 Years | 0 (0.0%) | 0 (0.0%) |
| 5 to 17 Years | 44 (1.4%) | 54 (1.7%) |
| 18 to 34 Years | 143 (3.9%) | 55 (1.5%) |
| 35 to 64 Years | 174 (2.3%) | 160 (2.2%) |
| 65 to 74 Years | 66 (3.7%) | 41 (2.1%) |
| 75 Years and over | 91 (8.3%) | 154 (9.6%) |
Disability Class: Cognitive Difficulty

| Age Bracket | Male | Female |
| 5 to 17 Years | 258 (8.2%) | 84 (2.6%) |
| 18 to 34 Years | 204 (5.6%) | 150 (4.1%) |
| 35 to 64 Years | 462 (6.1%) | 474 (6.6%) |
| 65 to 74 Years | 87 (4.9%) | 19 (1.0%) |
| 75 Years and over | 129 (11.8%) | 195 (12.1%) |
Disability Class: Ambulatory Difficulty

| Age Bracket | Male | Female |
| 5 to 17 Years | 18 (0.6%) | 13 (0.4%) |
| 18 to 34 Years | 75 (2.1%) | 22 (0.6%) |
| 35 to 64 Years | 384 (5.1%) | 502 (6.9%) |
| 65 to 74 Years | 166 (9.4%) | 288 (14.7%) |
| 75 Years and over | 390 (35.7%) | 569 (35.4%) |
Disability Class: Self-Care Difficulty

| Age Bracket | Male | Female |
| 5 to 17 Years | 36 (1.1%) | 29 (0.9%) |
| 18 to 34 Years | 80 (2.2%) | 0 (0.0%) |
| 35 to 64 Years | 58 (0.8%) | 103 (1.4%) |
| 65 to 74 Years | 64 (3.6%) | 36 (1.8%) |
| 75 Years and over | 155 (14.2%) | 123 (7.6%) |
Technology Access in Cass County
Computing Device Access in Cass County
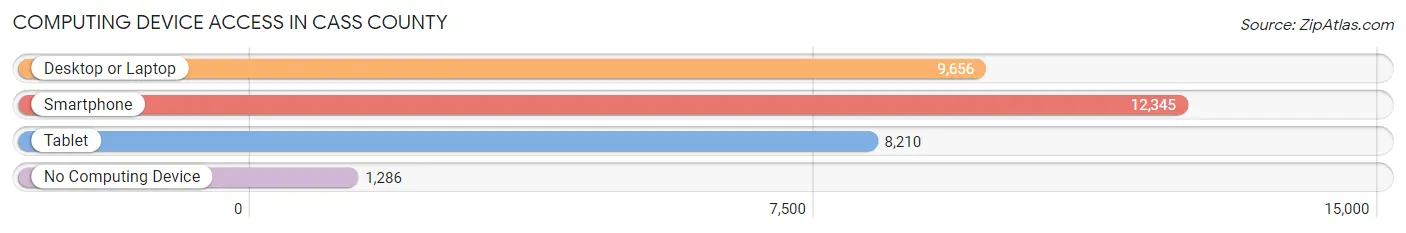
| Device Type | # Households | % Households |
| Desktop or Laptop | 9,656 | 64.5% |
| Smartphone | 12,345 | 82.5% |
| Tablet | 8,210 | 54.8% |
| No Computing Device | 1,286 | 8.6% |
| Total | 14,970 | 100.0% |
Internet Access in Cass County

| Internet Type | # Households | % Households |
| Dial-Up Internet | 17 | 0.1% |
| Broadband Home | 8,477 | 56.6% |
| Cellular Data Only | 2,379 | 15.9% |
| Satellite Internet | 1,635 | 10.9% |
| No Internet | 2,810 | 18.8% |
| Total | 14,970 | 100.0% |
Cass County Summary
Cass County, Indiana is located in the northern part of the state and is part of the Logansport, Indiana Metropolitan Statistical Area. The county was established in 1828 and named after General Lewis Cass, who was the Governor of the Michigan Territory at the time. The county seat is Logansport, which is also the largest city in the county. As of the 2010 census, the population of Cass County was 38,966.
Geography
Cass County is located in the northern part of Indiana and is bordered by Fulton County to the north, Miami County to the east, Carroll County to the south, and White County to the west. The county has a total area of 437 square miles, of which 434 square miles is land and 3 square miles is water. The county is mostly flat with some rolling hills in the northern part. The highest point in the county is located in the northern part near the town of Royal Center, and is 890 feet above sea level. The county is drained by the Eel River, which flows through the county from north to south.
Economy
The economy of Cass County is largely based on agriculture and manufacturing. The county is home to several large agricultural operations, including the Logansport Grain Company, which is the largest grain elevator in the state. Other major agricultural products include corn, soybeans, wheat, and hay. Manufacturing is also an important part of the economy, with several large companies located in the county, including the Logansport Foundry and Machine Company, the Logansport Steel Company, and the Logansport Plastics Company.
Demographics
As of the 2010 census, there were 38,966 people, 15,717 households, and 10,845 families living in Cass County. The population density was 89.3 people per square mile. The racial makeup of the county was 95.3% White, 1.3% African American, 0.3% Native American, 0.5% Asian, 0.1% Pacific Islander, 1.2% from other races, and 1.3% from two or more races. Hispanic or Latino of any race were 3.2% of the population.
The median income for a household in the county was $41,945 and the median income for a family was $51,945. The per capita income for the county was $20,945. About 10.3% of families and 13.2% of the population were below the poverty line, including 17.2% of those under age 18 and 8.2% of those age 65 or over.
Conclusion
Cass County, Indiana is a rural county located in the northern part of the state. The county is home to a diverse economy, with agriculture and manufacturing being the two main industries. The population of the county is largely white, with a small percentage of African Americans, Native Americans, Asians, and other races. The median income for a household in the county is slightly above the state average, and the poverty rate is slightly below the state average.
Common Questions
What is the Total Population of Cass County?
Total Population of Cass County is 37,820.
What is the Total Male Population of Cass County?
Total Male Population of Cass County is 18,812.
What is the Total Female Population of Cass County?
Total Female Population of Cass County is 19,008.
What is the Ratio of Males per 100 Females in Cass County?
There are 98.97 Males per 100 Females in Cass County.
What is the Ratio of Females per 100 Males in Cass County?
There are 101.04 Females per 100 Males in Cass County.
What is the Median Population Age in Cass County?
Median Population Age in Cass County is 41.3 Years.
What is the Average Family Size in Cass County
Average Family Size in Cass County is 3.0 People.
What is the Average Household Size in Cass County
Average Household Size in Cass County is 2.5 People.
What is Per Capita Income in Cass County?
Per Capita income in Cass County is $28,391.
What is the Median Family Income in Cass County?
Median Family Income in Cass County is $70,908.
What is the Median Household income in Cass County?
Median Household Income in Cass County is $55,862.
What is Income or Wage Gap in Cass County?
Income or Wage Gap in Cass County is 30.7%.
Women in Cass County earn 69.3 cents for every dollar earned by a man.
What is Family Income Deficit in Cass County?
Family Income Deficit in Cass County is $10,331.
Families that are below poverty line in Cass County earn $10,331 less on average than the poverty threshold level.
What is Inequality or Gini Index in Cass County?
Inequality or Gini Index in Cass County is 0.40.
How Large is the Labor Force in Cass County?
There are 19,117 People in the Labor Forcein in Cass County.
What is the Percentage of People in the Labor Force in Cass County?
62.9% of People are in the Labor Force in Cass County.
What is the Unemployment Rate in Cass County?
Unemployment Rate in Cass County is 4.2%.