Brown County, IN
Brown County Map

Brown County Overview
15,513
TOTAL POPULATION
7,767
MALE POPULATION
7,746
FEMALE POPULATION
100.27
MALES / 100 FEMALES
99.73
FEMALES / 100 MALES
50.7
MEDIAN AGE
2.6
AVG FAMILY SIZE
2.3
AVG HOUSEHOLD SIZE
$40,792
PER CAPITA INCOME
$85,791
AVG FAMILY INCOME
$73,933
AVG HOUSEHOLD INCOME
38.5%
WAGE / INCOME GAP [ % ]
61.5¢/ $1
WAGE / INCOME GAP [ $ ]
$8,622
FAMILY INCOME DEFICIT
0.44
INEQUALITY / GINI INDEX
7,625
LABOR FORCE [ PEOPLE ]
57.6%
PERCENT IN LABOR FORCE
3.9%
UNEMPLOYMENT RATE
Brown County Area Codes
Race in Brown County
The most populous races in Brown County are White / Caucasian (14,896 | 96.0%), Hispanic or Latino (324 | 2.1%), and Two or more Races (293 | 1.9%).

| Race | # Population | % Population |
| Asian | 88 | 0.6% |
| Black / African American | 92 | 0.6% |
| Hawaiian / Pacific | 56 | 0.4% |
| Hispanic or Latino | 324 | 2.1% |
| Native / Alaskan | 54 | 0.4% |
| White / Caucasian | 14,896 | 96.0% |
| Two or more Races | 293 | 1.9% |
| Some other Race | 34 | 0.2% |
| Total | 15,513 | 100.0% |
Ancestry in Brown County
The most populous ancestries reported in Brown County are German (3,258 | 21.0%), English (2,315 | 14.9%), American (1,742 | 11.2%), Irish (1,741 | 11.2%), and European (448 | 2.9%), together accounting for 61.3% of all Brown County residents.

| Ancestry | # Population | % Population |
| American | 1,742 | 11.2% |
| Australian | 6 | 0.0% |
| Belgian | 9 | 0.1% |
| Blackfeet | 18 | 0.1% |
| British | 57 | 0.4% |
| Burmese | 3 | 0.0% |
| Canadian | 26 | 0.2% |
| Cherokee | 59 | 0.4% |
| Czech | 55 | 0.4% |
| Danish | 17 | 0.1% |
| Dutch | 148 | 0.9% |
| Eastern European | 16 | 0.1% |
| English | 2,315 | 14.9% |
| European | 448 | 2.9% |
| French | 303 | 1.9% |
| French American Indian | 3 | 0.0% |
| French Canadian | 52 | 0.3% |
| German | 3,258 | 21.0% |
| Greek | 15 | 0.1% |
| Hungarian | 36 | 0.2% |
| Indonesian | 60 | 0.4% |
| Irish | 1,741 | 11.2% |
| Iroquois | 8 | 0.1% |
| Italian | 283 | 1.8% |
| Korean | 46 | 0.3% |
| Lithuanian | 37 | 0.2% |
| Mexican | 119 | 0.8% |
| Navajo | 41 | 0.3% |
| Northern European | 18 | 0.1% |
| Norwegian | 144 | 0.9% |
| Polish | 406 | 2.6% |
| Portuguese | 9 | 0.1% |
| Romanian | 7 | 0.1% |
| Russian | 16 | 0.1% |
| Samoan | 56 | 0.4% |
| Scandinavian | 4 | 0.0% |
| Scotch-Irish | 101 | 0.6% |
| Scottish | 416 | 2.7% |
| Slavic | 15 | 0.1% |
| Slovak | 6 | 0.0% |
| Slovene | 10 | 0.1% |
| Spaniard | 136 | 0.9% |
| Spanish | 69 | 0.4% |
| Swedish | 85 | 0.5% |
| Swiss | 53 | 0.3% |
| Welsh | 144 | 0.9% | View All 46 Rows |
Immigrants in Brown County
The most numerous immigrant groups reported in Brown County came from Europe (150 | 1.0%), Northern Europe (99 | 0.6%), Asia (88 | 0.6%), South Eastern Asia (87 | 0.6%), and Latin America (50 | 0.3%), together accounting for 3.1% of all Brown County residents.

| Immigration Origin | # Population | % Population |
| Asia | 88 | 0.6% |
| Brazil | 9 | 0.1% |
| Central America | 41 | 0.3% |
| Eastern Asia | 1 | 0.0% |
| England | 11 | 0.1% |
| Europe | 150 | 1.0% |
| Germany | 25 | 0.2% |
| Korea | 1 | 0.0% |
| Latin America | 50 | 0.3% |
| Mexico | 41 | 0.3% |
| Northern Europe | 99 | 0.6% |
| Philippines | 27 | 0.2% |
| Scotland | 20 | 0.1% |
| South America | 9 | 0.1% |
| South Eastern Asia | 87 | 0.6% |
| Southern Europe | 26 | 0.2% |
| Spain | 26 | 0.2% |
| Western Europe | 25 | 0.2% | View All 18 Rows |
Sex and Age in Brown County
Sex and Age in Brown County
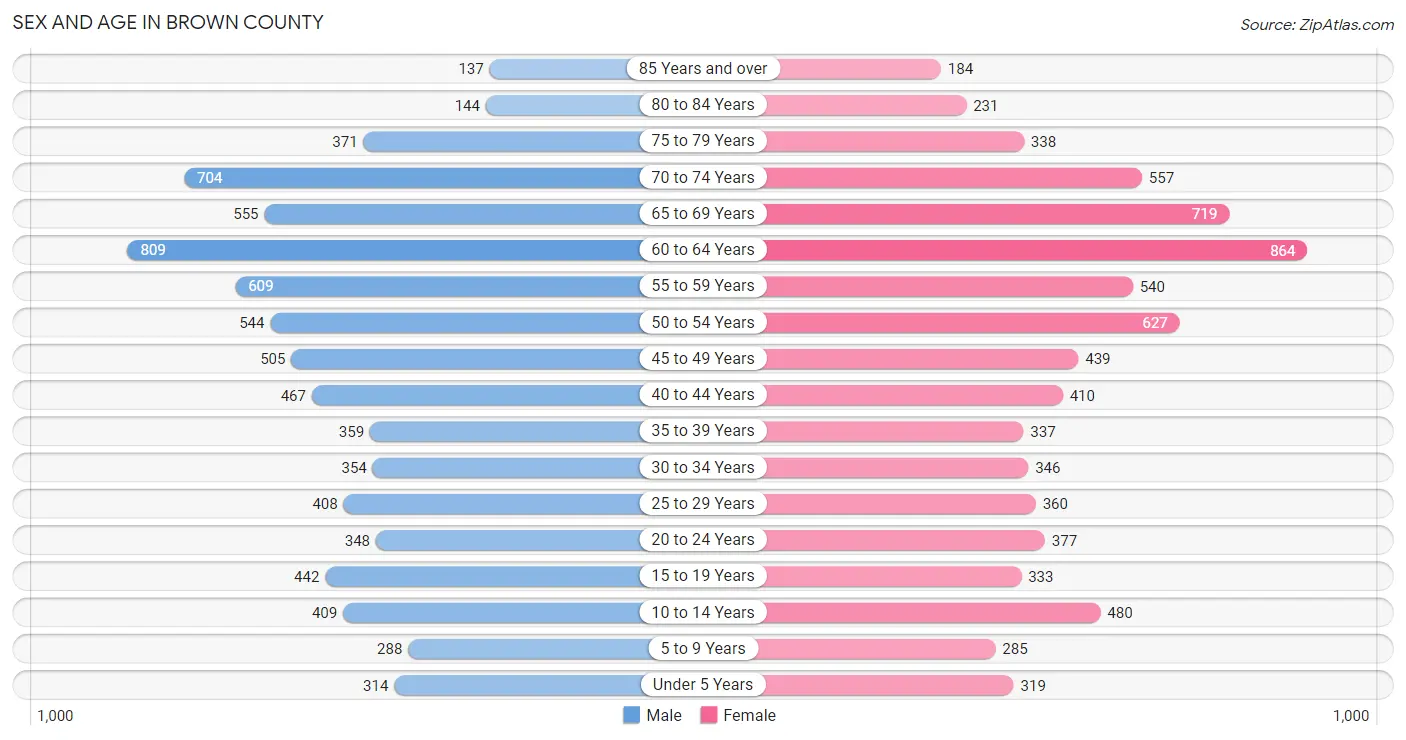
The most populous age groups in Brown County are 60 to 64 Years (809 | 10.4%) for men and 60 to 64 Years (864 | 11.2%) for women.
| Age Bracket | Male | Female |
| Under 5 Years | 314 (4.0%) | 319 (4.1%) |
| 5 to 9 Years | 288 (3.7%) | 285 (3.7%) |
| 10 to 14 Years | 409 (5.3%) | 480 (6.2%) |
| 15 to 19 Years | 442 (5.7%) | 333 (4.3%) |
| 20 to 24 Years | 348 (4.5%) | 377 (4.9%) |
| 25 to 29 Years | 408 (5.2%) | 360 (4.6%) |
| 30 to 34 Years | 354 (4.6%) | 346 (4.5%) |
| 35 to 39 Years | 359 (4.6%) | 337 (4.3%) |
| 40 to 44 Years | 467 (6.0%) | 410 (5.3%) |
| 45 to 49 Years | 505 (6.5%) | 439 (5.7%) |
| 50 to 54 Years | 544 (7.0%) | 627 (8.1%) |
| 55 to 59 Years | 609 (7.8%) | 540 (7.0%) |
| 60 to 64 Years | 809 (10.4%) | 864 (11.2%) |
| 65 to 69 Years | 555 (7.1%) | 719 (9.3%) |
| 70 to 74 Years | 704 (9.1%) | 557 (7.2%) |
| 75 to 79 Years | 371 (4.8%) | 338 (4.4%) |
| 80 to 84 Years | 144 (1.8%) | 231 (3.0%) |
| 85 Years and over | 137 (1.8%) | 184 (2.4%) |
| Total | 7,767 (100.0%) | 7,746 (100.0%) |
Families and Households in Brown County
Median Family Size in Brown County
The median family size in Brown County is 2.62 persons per family, with married-couple families (4,215 | 84.4%) accounting for the largest median family size of 2.64 persons per family. On the other hand, single male/father families (278 | 5.6%) represent the smallest median family size with 2.28 persons per family.

| Family Type | # Families | Family Size |
| Married-Couple | 4,215 (84.4%) | 2.64 |
| Single Male/Father | 278 (5.6%) | 2.28 |
| Single Female/Mother | 499 (10.0%) | 2.62 |
| Total Families | 4,992 (100.0%) | 2.62 |
Median Household Size in Brown County
The median household size in Brown County is 2.34 persons per household, with single female/mother households (499 | 7.6%) accounting for the largest median household size of 2.86 persons per household. non-family households (1,588 | 24.1%) represent the smallest median household size with 1.16 persons per household.

| Household Type | # Households | Household Size |
| Married-Couple | 4,215 (64.1%) | 2.70 |
| Single Male/Father | 278 (4.2%) | 2.62 |
| Single Female/Mother | 499 (7.6%) | 2.86 |
| Non-family | 1,588 (24.1%) | 1.16 |
| Total Households | 6,580 (100.0%) | 2.34 |
Household Size by Marriage Status in Brown County
Out of a total of 6,580 households in Brown County, 4,992 (75.9%) are family households, while 1,588 (24.1%) are nonfamily households. The most numerous type of family households are 2-person households, comprising 2,925, and the most common type of nonfamily households are 1-person households, comprising 1,373.

| Household Size | Family Households | Nonfamily Households |
| 1-Person Households | - | 1,373 (20.9%) |
| 2-Person Households | 2,925 (44.5%) | 192 (2.9%) |
| 3-Person Households | 902 (13.7%) | 6 (0.1%) |
| 4-Person Households | 713 (10.8%) | 17 (0.3%) |
| 5-Person Households | 246 (3.7%) | 0 (0.0%) |
| 6-Person Households | 146 (2.2%) | 0 (0.0%) |
| 7+ Person Households | 60 (0.9%) | 0 (0.0%) |
| Total | 4,992 (75.9%) | 1,588 (24.1%) |
Female Fertility in Brown County
Fertility by Age in Brown County
Average fertility rate in Brown County is 53.0 births per 1,000 women. Women in the age bracket of 20 to 34 years have the highest fertility rate with 113.0 births per 1,000 women. Women in the age bracket of 20 to 34 years acount for 81.9% of all women with births.

| Age Bracket | Women with Births | Births / 1,000 Women |
| 15 to 19 years | 0 (0.0%) | 0.0 |
| 20 to 34 years | 122 (81.9%) | 113.0 |
| 35 to 50 years | 27 (18.1%) | 20.0 |
| Total | 149 (100.0%) | 53.0 |
Fertility by Age by Marriage Status in Brown County
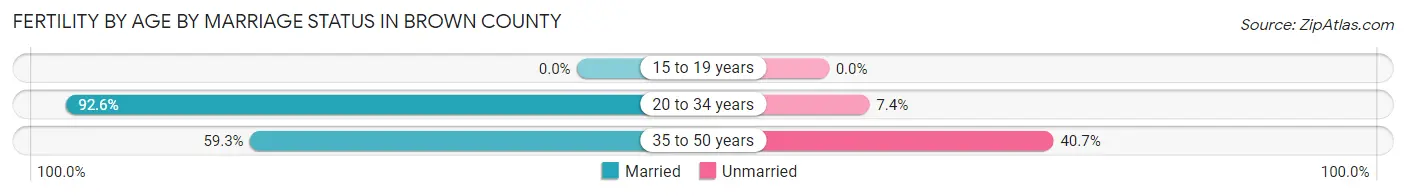
86.6% of women with births (149) in Brown County are married. The highest percentage of unmarried women with births falls into 35 to 50 years age bracket with 40.7% of them unmarried at the time of birth, while the lowest percentage of unmarried women with births belong to 20 to 34 years age bracket with 7.4% of them unmarried.
| Age Bracket | Married | Unmarried |
| 15 to 19 years | 0 (0.0%) | 0 (0.0%) |
| 20 to 34 years | 113 (92.6%) | 9 (7.4%) |
| 35 to 50 years | 16 (59.3%) | 11 (40.7%) |
| Total | 129 (86.6%) | 20 (13.4%) |
Fertility by Education in Brown County

| Educational Attainment | Women with Births | Births / 1,000 Women |
| Less than High School | 0 (0.0%) | 0.0 |
| High School Diploma | 9 (6.0%) | 13.0 |
| College or Associate's Degree | 77 (51.7%) | 72.0 |
| Bachelor's Degree | 63 (42.3%) | 135.0 |
| Graduate Degree | 0 (0.0%) | 0.0 |
| Total | 149 (100.0%) | 53.0 |
Fertility by Education by Marriage Status in Brown County
13.4% of women with births in Brown County are unmarried. Women with the educational attainment of bachelor's degree are most likely to be married with 100.0% of them married at childbirth, while women with the educational attainment of high school diploma are least likely to be married with 100.0% of them unmarried at childbirth.

| Educational Attainment | Married | Unmarried |
| Less than High School | 0 (0.0%) | 0 (0.0%) |
| High School Diploma | 0 (0.0%) | 9 (100.0%) |
| College or Associate's Degree | 66 (85.7%) | 11 (14.3%) |
| Bachelor's Degree | 63 (100.0%) | 0 (0.0%) |
| Graduate Degree | 0 (0.0%) | 0 (0.0%) |
| Total | 129 (86.6%) | 20 (13.4%) |
Income in Brown County
Income Overview in Brown County
Per Capita Income in Brown County is $40,792, while median incomes of families and households are $85,791 and $73,933 respectively.
| Characteristic | Number | Measure |
| Per Capita Income | 15,513 | $40,792 |
| Median Family Income | 4,992 | $85,791 |
| Mean Family Income | 4,992 | $99,766 |
| Median Household Income | 6,580 | $73,933 |
| Mean Household Income | 6,580 | $95,212 |
| Income Deficit | 4,992 | $8,622 |
| Wage / Income Gap (%) | 15,513 | 38.45% |
| Wage / Income Gap ($) | 15,513 | 61.55¢ per $1 |
| Gini / Inequality Index | 15,513 | 0.44 |
Earnings by Sex in Brown County
Average Earnings in Brown County are $40,048, $51,250 for men and $31,544 for women, a difference of 38.5%.

| Sex | Number | Average Earnings |
| Male | 4,330 (53.3%) | $51,250 |
| Female | 3,787 (46.7%) | $31,544 |
| Total | 8,117 (100.0%) | $40,048 |
Earnings by Sex by Income Bracket in Brown County
The most common earnings brackets in Brown County are $100,000+ for men (707 | 16.3%) and $75,000 to $99,999 for women (430 | 11.4%).

| Income | Male | Female |
| $2,499 or less | 262 (6.0%) | 256 (6.8%) |
| $2,500 to $4,999 | 83 (1.9%) | 265 (7.0%) |
| $5,000 to $7,499 | 146 (3.4%) | 176 (4.6%) |
| $7,500 to $9,999 | 128 (3.0%) | 83 (2.2%) |
| $10,000 to $12,499 | 74 (1.7%) | 160 (4.2%) |
| $12,500 to $14,999 | 180 (4.2%) | 57 (1.5%) |
| $15,000 to $17,499 | 28 (0.6%) | 96 (2.5%) |
| $17,500 to $19,999 | 144 (3.3%) | 186 (4.9%) |
| $20,000 to $22,499 | 77 (1.8%) | 200 (5.3%) |
| $22,500 to $24,999 | 143 (3.3%) | 107 (2.8%) |
| $25,000 to $29,999 | 227 (5.2%) | 213 (5.6%) |
| $30,000 to $34,999 | 156 (3.6%) | 320 (8.5%) |
| $35,000 to $39,999 | 57 (1.3%) | 229 (6.0%) |
| $40,000 to $44,999 | 226 (5.2%) | 190 (5.0%) |
| $45,000 to $49,999 | 191 (4.4%) | 173 (4.6%) |
| $50,000 to $54,999 | 102 (2.4%) | 89 (2.4%) |
| $55,000 to $64,999 | 467 (10.8%) | 251 (6.6%) |
| $65,000 to $74,999 | 387 (8.9%) | 112 (3.0%) |
| $75,000 to $99,999 | 545 (12.6%) | 430 (11.4%) |
| $100,000+ | 707 (16.3%) | 194 (5.1%) |
| Total | 4,330 (100.0%) | 3,787 (100.0%) |
Earnings by Sex by Educational Attainment in Brown County
Average earnings in Brown County are $58,159 for men and $34,325 for women, a difference of 41.0%. Men with an educational attainment of graduate degree enjoy the highest average annual earnings of $112,667, while those with less than high school education earn the least with $32,917. Women with an educational attainment of graduate degree earn the most with the average annual earnings of $87,661, while those with less than high school education have the smallest earnings of $15,991.

| Educational Attainment | Male Income | Female Income |
| Less than High School | $32,917 | $15,991 |
| High School Diploma | $52,247 | $19,702 |
| College or Associate's Degree | $56,071 | $37,746 |
| Bachelor's Degree | $65,590 | $44,792 |
| Graduate Degree | $112,667 | $87,661 |
| Total | $58,159 | $34,325 |
Family Income in Brown County
Family Income Brackets in Brown County
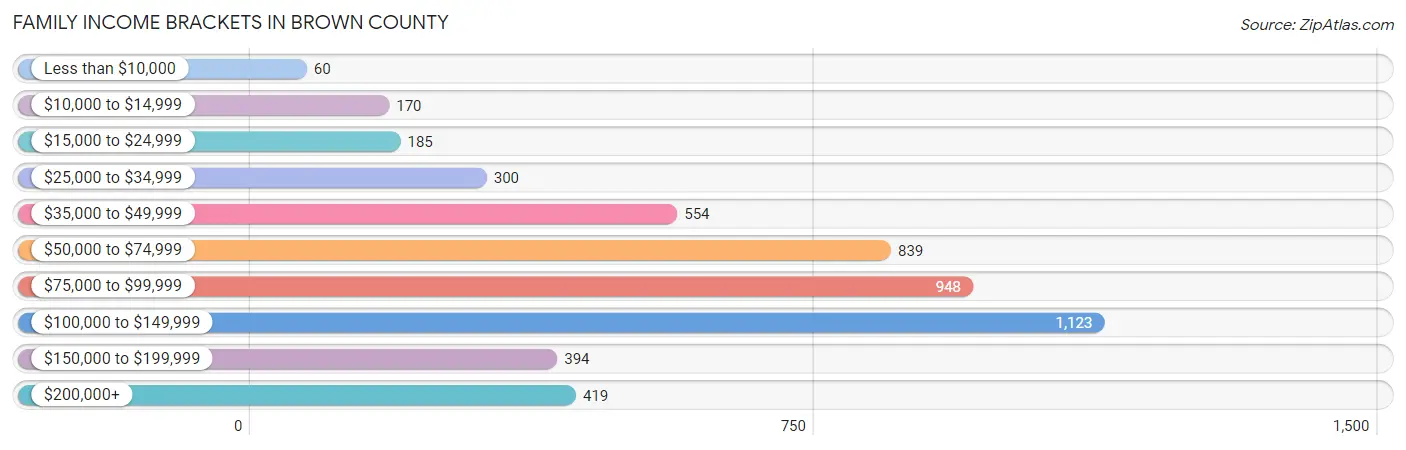
According to the Brown County family income data, there are 1,123 families falling into the $100,000 to $149,999 income range, which is the most common income bracket and makes up 22.5% of all families. Conversely, the less than $10,000 income bracket is the least frequent group with only 60 families (1.2%) belonging to this category.
| Income Bracket | # Families | % Families |
| Less than $10,000 | 60 | 1.2% |
| $10,000 to $14,999 | 170 | 3.4% |
| $15,000 to $24,999 | 185 | 3.7% |
| $25,000 to $34,999 | 300 | 6.0% |
| $35,000 to $49,999 | 554 | 11.1% |
| $50,000 to $74,999 | 839 | 16.8% |
| $75,000 to $99,999 | 948 | 19.0% |
| $100,000 to $149,999 | 1,123 | 22.5% |
| $150,000 to $199,999 | 394 | 7.9% |
| $200,000+ | 419 | 8.4% |
Family Income by Famaliy Size in Brown County
6-person families (161 | 3.2%) account for the highest median family income in Brown County with $98,237 per family, while 2-person families (2,998 | 60.1%) have the highest median income of $40,134 per family member.

| Income Bracket | # Families | Median Income |
| 2-Person Families | 2,998 (60.1%) | $80,268 |
| 3-Person Families | 874 (17.5%) | $86,506 |
| 4-Person Families | 757 (15.2%) | $84,241 |
| 5-Person Families | 191 (3.8%) | $97,284 |
| 6-Person Families | 161 (3.2%) | $98,237 |
| 7+ Person Families | 11 (0.2%) | $0 |
| Total | 4,992 (100.0%) | $85,791 |
Family Income by Number of Earners in Brown County
The median family income in Brown County is $85,791, with families comprising 3+ earners (457) having the highest median family income of $126,509, while families with no earners (1,126) have the lowest median family income of $49,063, accounting for 9.1% and 22.6% of families, respectively.

| Number of Earners | # Families | Median Income |
| No Earners | 1,126 (22.6%) | $49,063 |
| 1 Earner | 1,457 (29.2%) | $75,129 |
| 2 Earners | 1,952 (39.1%) | $101,500 |
| 3+ Earners | 457 (9.1%) | $126,509 |
| Total | 4,992 (100.0%) | $85,791 |
Household Income in Brown County
Household Income Brackets in Brown County
With 1,250 households falling in the category, the $100,000 to $149,999 income range is the most frequent in Brown County, accounting for 19.0% of all households. In contrast, only 178 households (2.7%) fall into the less than $10,000 income bracket, making it the least populous group.

| Income Bracket | # Households | % Households |
| Less than $10,000 | 178 | 2.7% |
| $10,000 to $14,999 | 263 | 4.0% |
| $15,000 to $24,999 | 447 | 6.8% |
| $25,000 to $34,999 | 592 | 9.0% |
| $35,000 to $49,999 | 783 | 11.9% |
| $50,000 to $74,999 | 1,059 | 16.1% |
| $75,000 to $99,999 | 1,007 | 15.3% |
| $100,000 to $149,999 | 1,250 | 19.0% |
| $150,000 to $199,999 | 454 | 6.9% |
| $200,000+ | 546 | 8.3% |
Household Income by Householder Age in Brown County
The median household income in Brown County is $73,933, with the highest median household income of $94,762 found in the 45 to 64 years age bracket for the primary householder. A total of 2,594 households (39.4%) fall into this category. Meanwhile, the 15 to 24 years age bracket for the primary householder has the lowest median household income of $0, with 138 households (2.1%) in this group.

| Income Bracket | # Households | Median Income |
| 15 to 24 Years | 138 (2.1%) | $0 |
| 25 to 44 Years | 1,275 (19.4%) | $85,854 |
| 45 to 64 Years | 2,594 (39.4%) | $94,762 |
| 65+ Years | 2,573 (39.1%) | $52,072 |
| Total | 6,580 (100.0%) | $73,933 |
Poverty in Brown County
Income Below Poverty by Sex and Age in Brown County
With 6.5% poverty level for males and 9.9% for females among the residents of Brown County, under 5 year old males and 35 to 44 year old females are the most vulnerable to poverty, with 73 males (24.7%) and 154 females (20.6%) in their respective age groups living below the poverty level.

| Age Bracket | Male | Female |
| Under 5 Years | 73 (24.7%) | 45 (14.1%) |
| 5 Years | 0 (0.0%) | 11 (19.3%) |
| 6 to 11 Years | 0 (0.0%) | 48 (14.4%) |
| 12 to 14 Years | 35 (13.3%) | 0 (0.0%) |
| 15 Years | 22 (19.3%) | 6 (9.0%) |
| 16 and 17 Years | 10 (5.6%) | 0 (0.0%) |
| 18 to 24 Years | 5 (1.0%) | 77 (17.1%) |
| 25 to 34 Years | 45 (5.9%) | 35 (5.0%) |
| 35 to 44 Years | 33 (4.0%) | 154 (20.6%) |
| 45 to 54 Years | 95 (9.1%) | 81 (7.6%) |
| 55 to 64 Years | 87 (6.2%) | 121 (8.6%) |
| 65 to 74 Years | 53 (4.2%) | 94 (7.4%) |
| 75 Years and over | 37 (5.9%) | 79 (11.7%) |
| Total | 495 (6.5%) | 751 (9.9%) |
Income Above Poverty by Sex and Age in Brown County
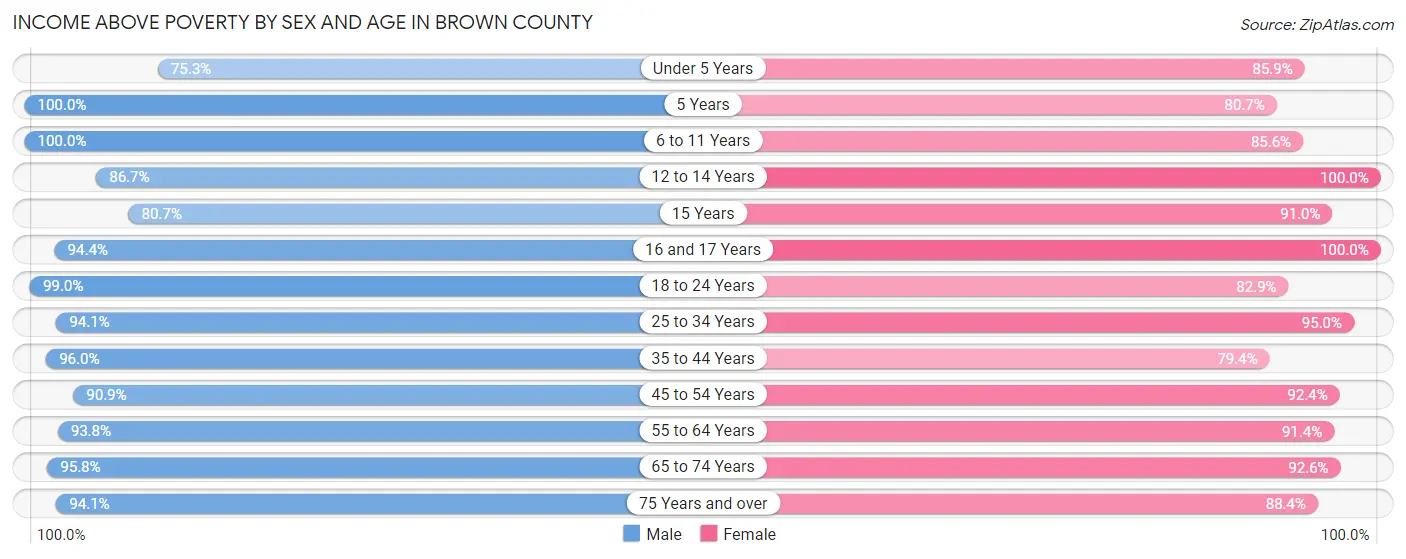
According to the poverty statistics in Brown County, males aged 5 years and females aged 12 to 14 years are the age groups that are most secure financially, with 100.0% of males and 100.0% of females in these age groups living above the poverty line.
| Age Bracket | Male | Female |
| Under 5 Years | 222 (75.2%) | 274 (85.9%) |
| 5 Years | 42 (100.0%) | 46 (80.7%) |
| 6 to 11 Years | 359 (100.0%) | 285 (85.6%) |
| 12 to 14 Years | 228 (86.7%) | 313 (100.0%) |
| 15 Years | 92 (80.7%) | 61 (91.0%) |
| 16 and 17 Years | 169 (94.4%) | 192 (100.0%) |
| 18 to 24 Years | 491 (99.0%) | 373 (82.9%) |
| 25 to 34 Years | 717 (94.1%) | 671 (95.0%) |
| 35 to 44 Years | 787 (96.0%) | 593 (79.4%) |
| 45 to 54 Years | 954 (90.9%) | 985 (92.4%) |
| 55 to 64 Years | 1,326 (93.8%) | 1,278 (91.3%) |
| 65 to 74 Years | 1,200 (95.8%) | 1,168 (92.5%) |
| 75 Years and over | 589 (94.1%) | 599 (88.3%) |
| Total | 7,176 (93.5%) | 6,838 (90.1%) |
Income Below Poverty Among Married-Couple Families in Brown County
The poverty statistics for married-couple families in Brown County show that 4.3% or 180 of the total 4,215 families live below the poverty line. Families with no children have the highest poverty rate of 5.2%, comprising of 157 families. On the other hand, families with 3 or 4 children have the lowest poverty rate of 0.0%, which includes 0 families.
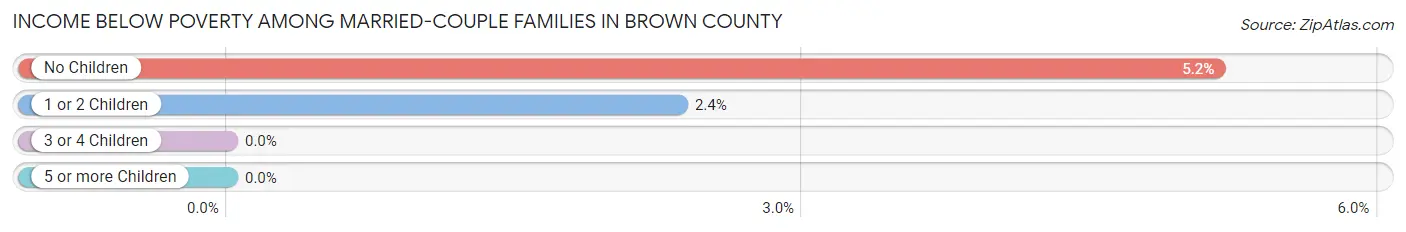
| Children | Above Poverty | Below Poverty |
| No Children | 2,886 (94.8%) | 157 (5.2%) |
| 1 or 2 Children | 957 (97.7%) | 23 (2.4%) |
| 3 or 4 Children | 192 (100.0%) | 0 (0.0%) |
| 5 or more Children | 0 (0.0%) | 0 (0.0%) |
| Total | 4,035 (95.7%) | 180 (4.3%) |
Income Below Poverty Among Single-Parent Households in Brown County

| Children | Single Father | Single Mother |
| No Children | 0 (0.0%) | 7 (4.4%) |
| 1 or 2 Children | 0 (0.0%) | 95 (34.4%) |
| 3 or 4 Children | 0 (0.0%) | 53 (84.1%) |
| 5 or more Children | 0 (0.0%) | 0 (0.0%) |
| Total | 0 (0.0%) | 155 (31.1%) |
Income Below Poverty Among Married-Couple vs Single-Parent Households in Brown County
The poverty data for Brown County shows that 180 of the married-couple family households (4.3%) and 155 of the single-parent households (20.0%) are living below the poverty level. Within the married-couple family households, those with no children have the highest poverty rate, with 157 households (5.2%) falling below the poverty line. Among the single-parent households, those with 3 or 4 children have the highest poverty rate, with 53 household (70.7%) living below poverty.

| Children | Married-Couple Families | Single-Parent Households |
| No Children | 157 (5.2%) | 7 (3.2%) |
| 1 or 2 Children | 23 (2.4%) | 95 (19.7%) |
| 3 or 4 Children | 0 (0.0%) | 53 (70.7%) |
| 5 or more Children | 0 (0.0%) | 0 (0.0%) |
| Total | 180 (4.3%) | 155 (20.0%) |
Employment Characteristics in Brown County
Employment by Class of Employer in Brown County
Among the 7,134 employed individuals in Brown County, private company employees (4,887 | 68.5%), self-employed (not incorporated) (602 | 8.4%), and local government employees (511 | 7.2%) make up the most common classes of employment.
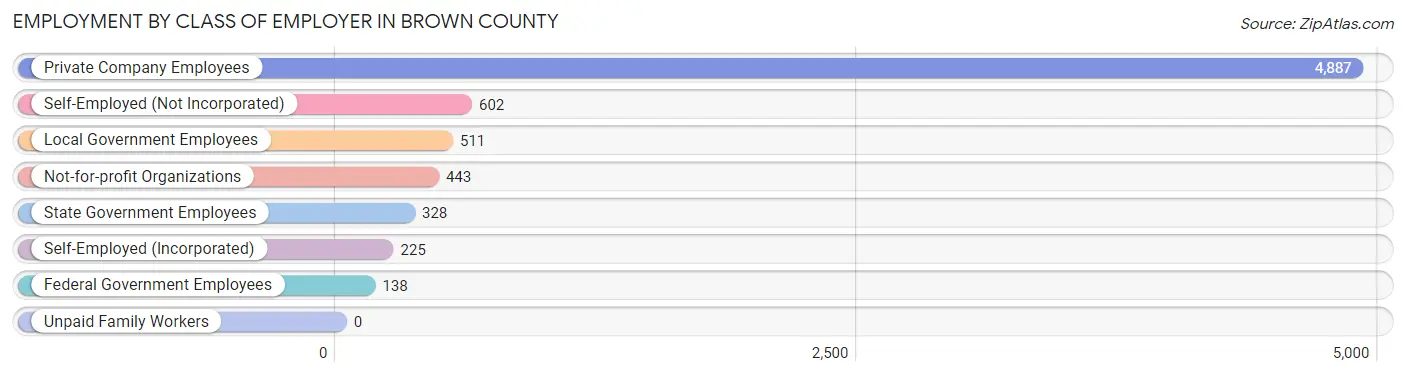
| Employer Class | # Employees | % Employees |
| Private Company Employees | 4,887 | 68.5% |
| Self-Employed (Incorporated) | 225 | 3.2% |
| Self-Employed (Not Incorporated) | 602 | 8.4% |
| Not-for-profit Organizations | 443 | 6.2% |
| Local Government Employees | 511 | 7.2% |
| State Government Employees | 328 | 4.6% |
| Federal Government Employees | 138 | 1.9% |
| Unpaid Family Workers | 0 | 0.0% |
| Total | 7,134 | 100.0% |
Employment Status by Age in Brown County
According to the labor force statistics for Brown County, out of the total population over 16 years of age (13,237), 57.6% or 7,625 individuals are in the labor force, with 3.9% or 297 of them unemployed. The age group with the highest labor force participation rate is 25 to 29 years, with 88.3% or 678 individuals in the labor force. Within the labor force, the 75 years and over age range has the highest percentage of unemployed individuals, with 13.2% or 5 of them being unemployed.

| Age Bracket | In Labor Force | Unemployed |
| 16 to 19 Years | 245 (41.2%) | 31 (12.7%) |
| 20 to 24 Years | 605 (83.4%) | 41 (6.8%) |
| 25 to 29 Years | 678 (88.3%) | 82 (12.1%) |
| 30 to 34 Years | 577 (82.4%) | 0 (0.0%) |
| 35 to 44 Years | 1,309 (83.2%) | 20 (1.5%) |
| 45 to 54 Years | 1,758 (83.1%) | 86 (4.9%) |
| 55 to 59 Years | 904 (78.7%) | 20 (2.2%) |
| 60 to 64 Years | 907 (54.2%) | 8 (0.9%) |
| 65 to 74 Years | 603 (23.8%) | 0 (0.0%) |
| 75 Years and over | 38 (2.7%) | 5 (13.2%) |
| Total | 7,625 (57.6%) | 297 (3.9%) |
Employment Status by Educational Attainment in Brown County
According to labor force statistics for Brown County, 76.8% of individuals (6,127) out of the total population between 25 and 64 years of age (7,978) are in the labor force, with 3.5% or 214 of them being unemployed. The group with the highest labor force participation rate are those with the educational attainment of bachelor's degree or higher, with 81.8% or 1,647 individuals in the labor force. Within the labor force, individuals with college / associate degree education have the highest percentage of unemployment, with 8.1% or 173 of them being unemployed.

| Educational Attainment | In Labor Force | Unemployed |
| Less than High School | 398 (69.7%) | 17 (3.0%) |
| High School Diploma | 1,952 (71.1%) | 33 (1.2%) |
| College / Associate Degree | 2,134 (80.6%) | 214 (8.1%) |
| Bachelor's Degree or higher | 1,647 (81.8%) | 10 (0.5%) |
| Total | 6,127 (76.8%) | 279 (3.5%) |
Employment Occupations by Sex in Brown County
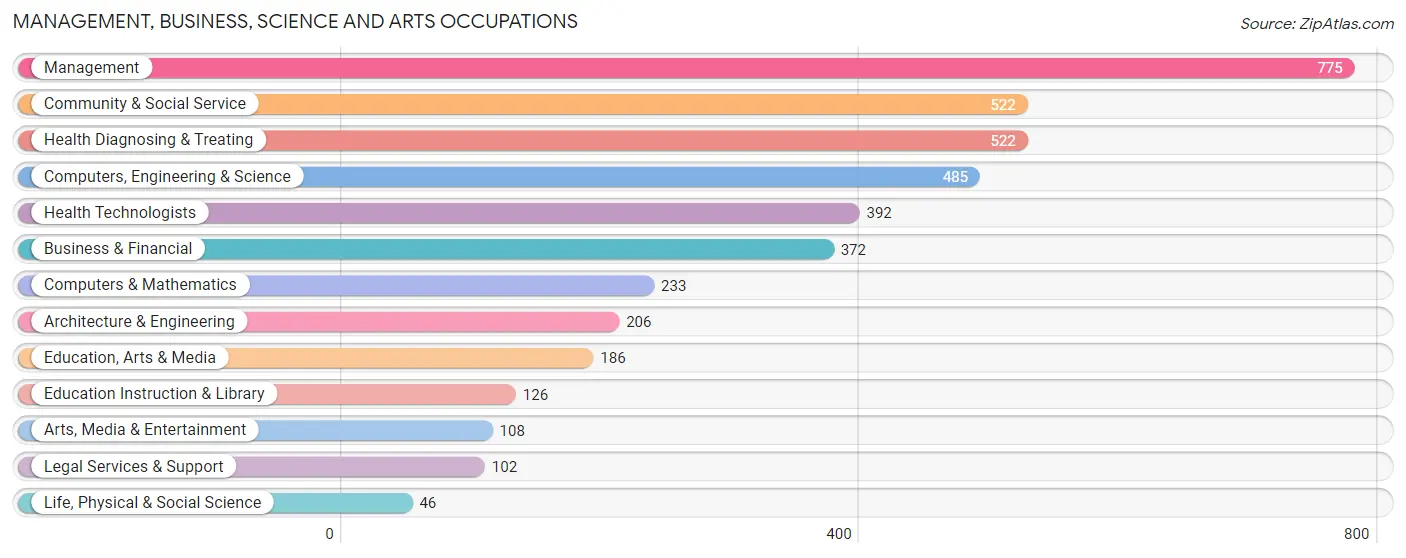
Management, Business, Science and Arts Occupations
The most common Management, Business, Science and Arts occupations in Brown County are Management (775 | 10.6%), Community & Social Service (522 | 7.1%), Health Diagnosing & Treating (522 | 7.1%), Computers, Engineering & Science (485 | 6.6%), and Health Technologists (392 | 5.3%).
Management, Business, Science and Arts Occupations by Sex
Within the Management, Business, Science and Arts occupations in Brown County, the most male-oriented occupations are Life, Physical & Social Science (100.0%), Architecture & Engineering (97.1%), and Computers, Engineering & Science (85.8%), while the most female-oriented occupations are Education Instruction & Library (91.3%), Health Technologists (79.8%), and Health Diagnosing & Treating (77.6%).

| Occupation | Male | Female |
| Management | 503 (64.9%) | 272 (35.1%) |
| Business & Financial | 119 (32.0%) | 253 (68.0%) |
| Computers, Engineering & Science | 416 (85.8%) | 69 (14.2%) |
| Computers & Mathematics | 170 (73.0%) | 63 (27.0%) |
| Architecture & Engineering | 200 (97.1%) | 6 (2.9%) |
| Life, Physical & Social Science | 46 (100.0%) | 0 (0.0%) |
| Community & Social Service | 165 (31.6%) | 357 (68.4%) |
| Education, Arts & Media | 95 (51.1%) | 91 (48.9%) |
| Legal Services & Support | 25 (24.5%) | 77 (75.5%) |
| Education Instruction & Library | 11 (8.7%) | 115 (91.3%) |
| Arts, Media & Entertainment | 34 (31.5%) | 74 (68.5%) |
| Health Diagnosing & Treating | 117 (22.4%) | 405 (77.6%) |
| Health Technologists | 79 (20.2%) | 313 (79.8%) |
| Total (Category) | 1,320 (49.3%) | 1,356 (50.7%) |
| Total (Overall) | 3,887 (53.0%) | 3,442 (47.0%) |
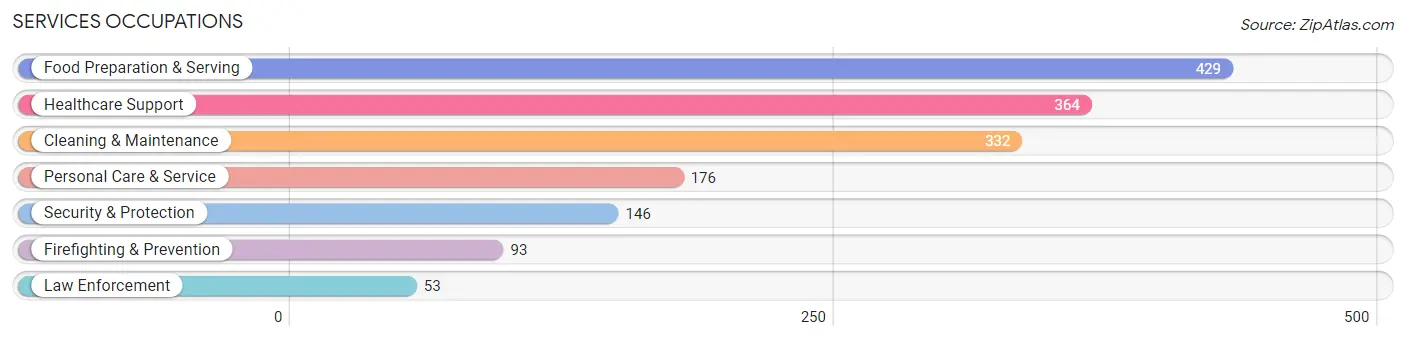
Services Occupations
The most common Services occupations in Brown County are Food Preparation & Serving (429 | 5.9%), Healthcare Support (364 | 5.0%), Cleaning & Maintenance (332 | 4.5%), Personal Care & Service (176 | 2.4%), and Security & Protection (146 | 2.0%).
Services Occupations by Sex
Within the Services occupations in Brown County, the most male-oriented occupations are Law Enforcement (100.0%), Security & Protection (96.6%), and Firefighting & Prevention (94.6%), while the most female-oriented occupations are Healthcare Support (94.0%), Personal Care & Service (91.5%), and Food Preparation & Serving (54.3%).

| Occupation | Male | Female |
| Healthcare Support | 22 (6.0%) | 342 (94.0%) |
| Security & Protection | 141 (96.6%) | 5 (3.4%) |
| Firefighting & Prevention | 88 (94.6%) | 5 (5.4%) |
| Law Enforcement | 53 (100.0%) | 0 (0.0%) |
| Food Preparation & Serving | 196 (45.7%) | 233 (54.3%) |
| Cleaning & Maintenance | 152 (45.8%) | 180 (54.2%) |
| Personal Care & Service | 15 (8.5%) | 161 (91.5%) |
| Total (Category) | 526 (36.3%) | 921 (63.6%) |
| Total (Overall) | 3,887 (53.0%) | 3,442 (47.0%) |
Sales and Office Occupations
The most common Sales and Office occupations in Brown County are Office & Administration (745 | 10.2%), and Sales & Related (587 | 8.0%).

Sales and Office Occupations by Sex
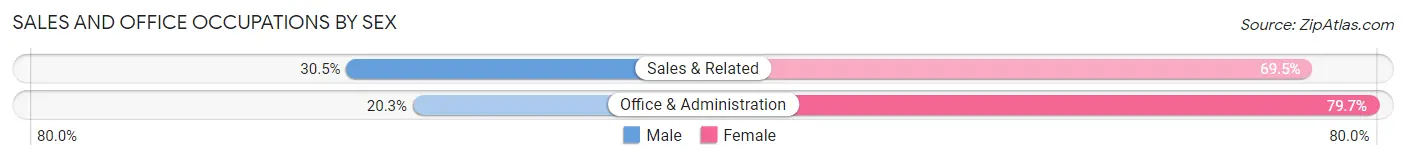
| Occupation | Male | Female |
| Sales & Related | 179 (30.5%) | 408 (69.5%) |
| Office & Administration | 151 (20.3%) | 594 (79.7%) |
| Total (Category) | 330 (24.8%) | 1,002 (75.2%) |
| Total (Overall) | 3,887 (53.0%) | 3,442 (47.0%) |
Natural Resources, Construction and Maintenance Occupations
The most common Natural Resources, Construction and Maintenance occupations in Brown County are Construction & Extraction (648 | 8.8%), Installation, Maintenance & Repair (257 | 3.5%), and Farming, Fishing & Forestry (58 | 0.8%).
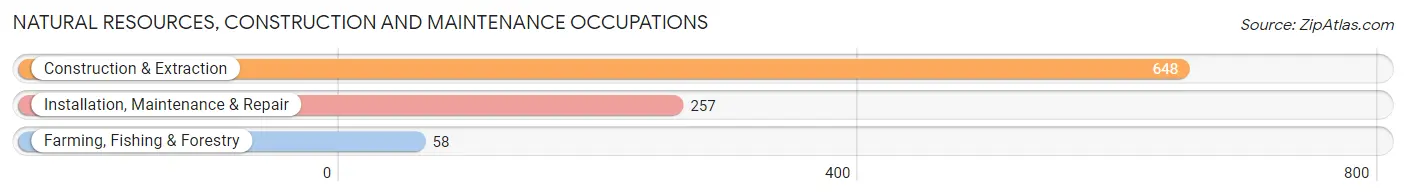
Natural Resources, Construction and Maintenance Occupations by Sex

| Occupation | Male | Female |
| Farming, Fishing & Forestry | 58 (100.0%) | 0 (0.0%) |
| Construction & Extraction | 642 (99.1%) | 6 (0.9%) |
| Installation, Maintenance & Repair | 257 (100.0%) | 0 (0.0%) |
| Total (Category) | 957 (99.4%) | 6 (0.6%) |
| Total (Overall) | 3,887 (53.0%) | 3,442 (47.0%) |
Production, Transportation and Moving Occupations
The most common Production, Transportation and Moving occupations in Brown County are Production (556 | 7.6%), Transportation (227 | 3.1%), and Material Moving (128 | 1.8%).

Production, Transportation and Moving Occupations by Sex

| Occupation | Male | Female |
| Production | 401 (72.1%) | 155 (27.9%) |
| Transportation | 225 (99.1%) | 2 (0.9%) |
| Material Moving | 128 (100.0%) | 0 (0.0%) |
| Total (Category) | 754 (82.8%) | 157 (17.2%) |
| Total (Overall) | 3,887 (53.0%) | 3,442 (47.0%) |
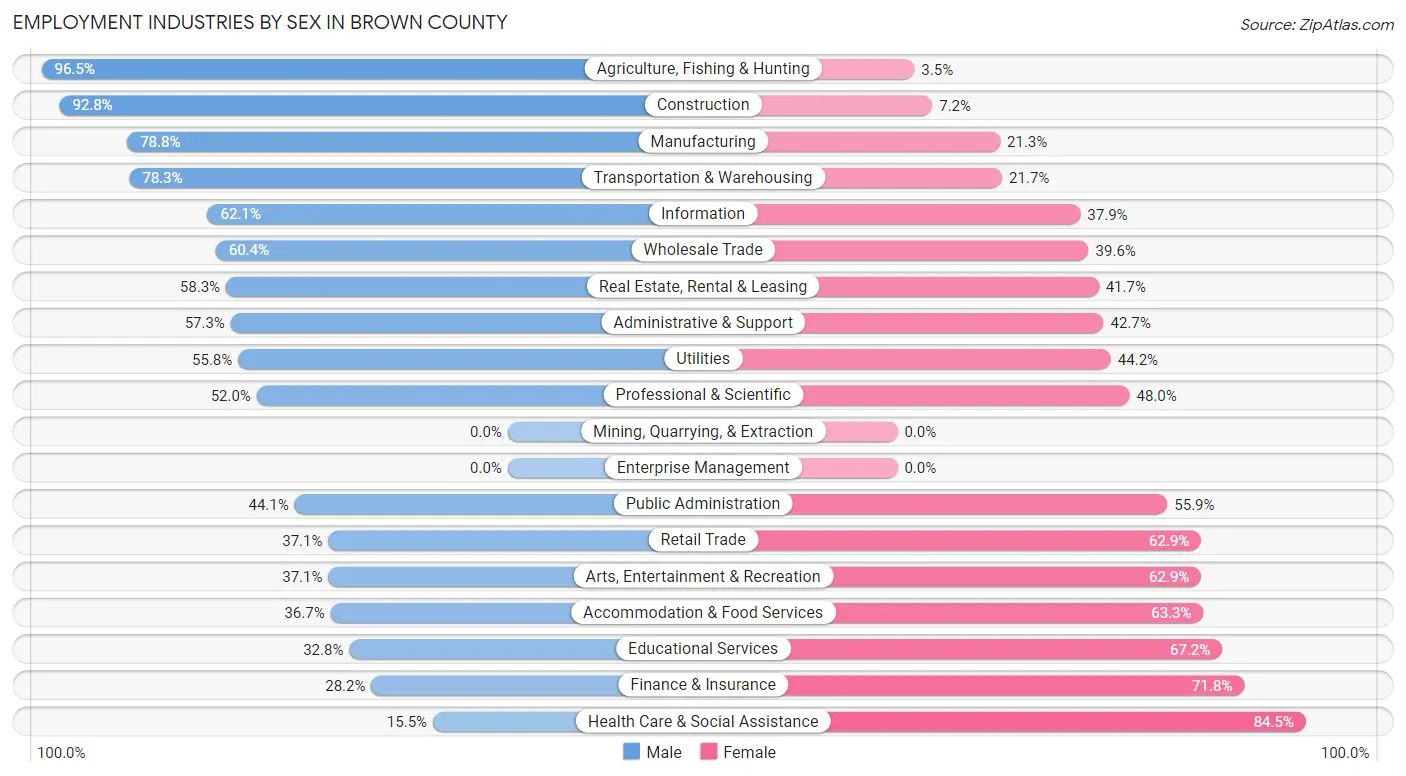
Employment Industries by Sex in Brown County
Employment Industries in Brown County
The major employment industries in Brown County include Manufacturing (1,285 | 17.5%), Health Care & Social Assistance (981 | 13.4%), Retail Trade (859 | 11.7%), Construction (762 | 10.4%), and Accommodation & Food Services (526 | 7.2%).

Employment Industries by Sex in Brown County
The Brown County industries that see more men than women are Agriculture, Fishing & Hunting (96.5%), Construction (92.8%), and Manufacturing (78.7%), whereas the industries that tend to have a higher number of women are Health Care & Social Assistance (84.5%), Finance & Insurance (71.8%), and Educational Services (67.2%).
| Industry | Male | Female |
| Agriculture, Fishing & Hunting | 137 (96.5%) | 5 (3.5%) |
| Mining, Quarrying, & Extraction | 0 (0.0%) | 0 (0.0%) |
| Construction | 707 (92.8%) | 55 (7.2%) |
| Manufacturing | 1,012 (78.7%) | 273 (21.2%) |
| Wholesale Trade | 58 (60.4%) | 38 (39.6%) |
| Retail Trade | 319 (37.1%) | 540 (62.9%) |
| Transportation & Warehousing | 224 (78.3%) | 62 (21.7%) |
| Utilities | 48 (55.8%) | 38 (44.2%) |
| Information | 41 (62.1%) | 25 (37.9%) |
| Finance & Insurance | 85 (28.2%) | 216 (71.8%) |
| Real Estate, Rental & Leasing | 42 (58.3%) | 30 (41.7%) |
| Professional & Scientific | 159 (52.0%) | 147 (48.0%) |
| Enterprise Management | 0 (0.0%) | 0 (0.0%) |
| Administrative & Support | 125 (57.3%) | 93 (42.7%) |
| Educational Services | 126 (32.8%) | 258 (67.2%) |
| Health Care & Social Assistance | 152 (15.5%) | 829 (84.5%) |
| Arts, Entertainment & Recreation | 52 (37.1%) | 88 (62.9%) |
| Accommodation & Food Services | 193 (36.7%) | 333 (63.3%) |
| Public Administration | 203 (44.1%) | 257 (55.9%) |
| Total | 3,887 (53.0%) | 3,442 (47.0%) |
Education in Brown County
School Enrollment in Brown County
The most common levels of schooling among the 2,610 students in Brown County are middle school (789 | 30.2%), high school (683 | 26.2%), and college / undergraduate (414 | 15.9%).

| School Level | # Students | % Students |
| Nursery / Preschool | 163 | 6.2% |
| Kindergarten | 88 | 3.4% |
| Elementary School | 405 | 15.5% |
| Middle School | 789 | 30.2% |
| High School | 683 | 26.2% |
| College / Undergraduate | 414 | 15.9% |
| Graduate / Professional | 68 | 2.6% |
| Total | 2,610 | 100.0% |
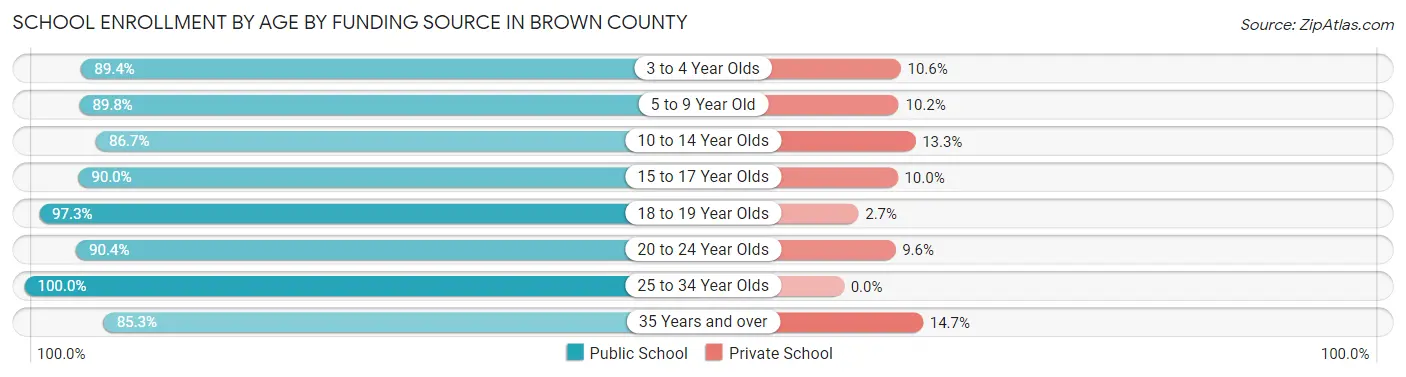
School Enrollment by Age by Funding Source in Brown County
Out of a total of 2,610 students who are enrolled in schools in Brown County, 277 (10.6%) attend a private institution, while the remaining 2,333 (89.4%) are enrolled in public schools. The age group of 35 years and over has the highest likelihood of being enrolled in private schools, with 23 (14.7% in the age bracket) enrolled. Conversely, the age group of 25 to 34 year olds has the lowest likelihood of being enrolled in a private school, with 111 (100.0% in the age bracket) attending a public institution.
| Age Bracket | Public School | Private School |
| 3 to 4 Year Olds | 76 (89.4%) | 9 (10.6%) |
| 5 to 9 Year Old | 448 (89.8%) | 51 (10.2%) |
| 10 to 14 Year Olds | 768 (86.7%) | 118 (13.3%) |
| 15 to 17 Year Olds | 494 (90.0%) | 55 (10.0%) |
| 18 to 19 Year Olds | 143 (97.3%) | 4 (2.7%) |
| 20 to 24 Year Olds | 160 (90.4%) | 17 (9.6%) |
| 25 to 34 Year Olds | 111 (100.0%) | 0 (0.0%) |
| 35 Years and over | 133 (85.3%) | 23 (14.7%) |
| Total | 2,333 (89.4%) | 277 (10.6%) |
Educational Attainment by Field of Study in Brown County
Education (550 | 15.3%), science & technology (487 | 13.5%), business (446 | 12.4%), engineering (338 | 9.4%), and social sciences (278 | 7.7%) are the most common fields of study among 3,598 individuals in Brown County who have obtained a bachelor's degree or higher.

| Field of Study | # Graduates | % Graduates |
| Computers & Mathematics | 125 | 3.5% |
| Bio, Nature & Agricultural | 202 | 5.6% |
| Physical & Health Sciences | 106 | 2.9% |
| Psychology | 111 | 3.1% |
| Social Sciences | 278 | 7.7% |
| Engineering | 338 | 9.4% |
| Multidisciplinary Studies | 32 | 0.9% |
| Science & Technology | 487 | 13.5% |
| Business | 446 | 12.4% |
| Education | 550 | 15.3% |
| Literature & Languages | 234 | 6.5% |
| Liberal Arts & History | 239 | 6.6% |
| Visual & Performing Arts | 138 | 3.8% |
| Communications | 173 | 4.8% |
| Arts & Humanities | 139 | 3.9% |
| Total | 3,598 | 100.0% |
Transportation & Commute in Brown County
Vehicle Availability by Sex in Brown County
The most prevalent vehicle ownership categories in Brown County are males with 2 vehicles (1,242, accounting for 33.2%) and females with 2 vehicles (1,042, making up 36.6%).

| Vehicles Available | Male | Female |
| No Vehicle | 43 (1.1%) | 65 (1.9%) |
| 1 Vehicle | 450 (12.0%) | 401 (11.8%) |
| 2 Vehicles | 1,242 (33.2%) | 1,042 (30.7%) |
| 3 Vehicles | 989 (26.4%) | 972 (28.7%) |
| 4 Vehicles | 511 (13.7%) | 613 (18.1%) |
| 5 or more Vehicles | 507 (13.6%) | 298 (8.8%) |
| Total | 3,742 (100.0%) | 3,391 (100.0%) |
Commute Time in Brown County
The most frequently occuring commute durations in Brown County are 45 to 59 minutes (1,066 commuters, 16.5%), 30 to 34 minutes (963 commuters, 14.9%), and 20 to 24 minutes (787 commuters, 12.2%).
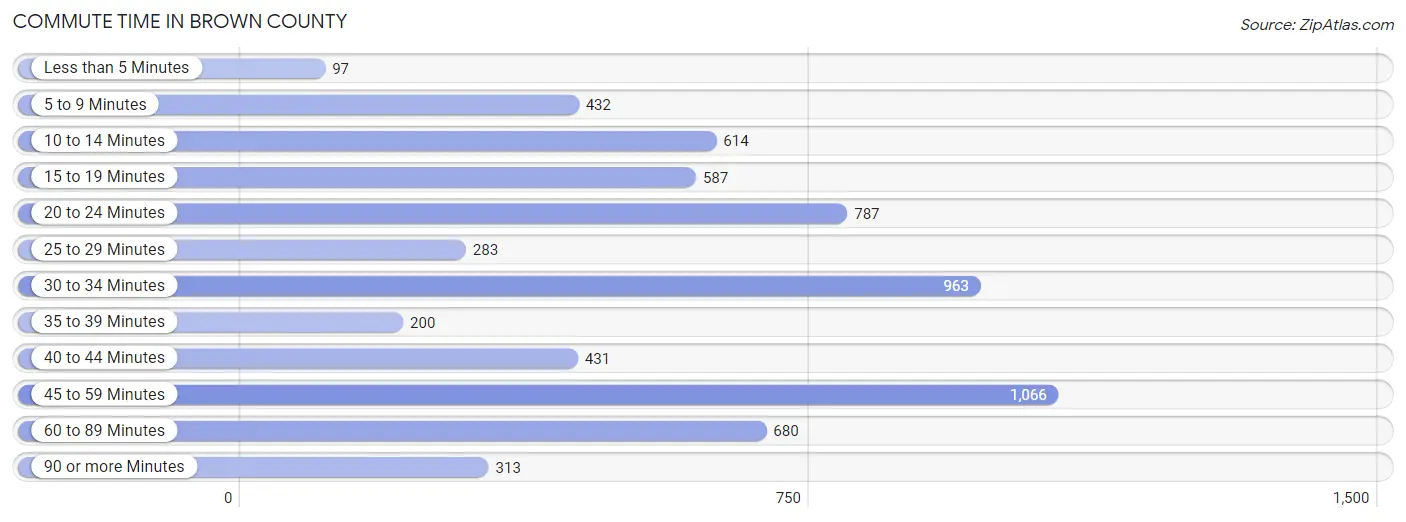
| Commute Time | # Commuters | % Commuters |
| Less than 5 Minutes | 97 | 1.5% |
| 5 to 9 Minutes | 432 | 6.7% |
| 10 to 14 Minutes | 614 | 9.5% |
| 15 to 19 Minutes | 587 | 9.1% |
| 20 to 24 Minutes | 787 | 12.2% |
| 25 to 29 Minutes | 283 | 4.4% |
| 30 to 34 Minutes | 963 | 14.9% |
| 35 to 39 Minutes | 200 | 3.1% |
| 40 to 44 Minutes | 431 | 6.7% |
| 45 to 59 Minutes | 1,066 | 16.5% |
| 60 to 89 Minutes | 680 | 10.5% |
| 90 or more Minutes | 313 | 4.9% |
Commute Time by Sex in Brown County
The most common commute times in Brown County are 45 to 59 minutes (537 commuters, 16.0%) for males and 45 to 59 minutes (529 commuters, 17.1%) for females.

| Commute Time | Male | Female |
| Less than 5 Minutes | 13 (0.4%) | 84 (2.7%) |
| 5 to 9 Minutes | 153 (4.5%) | 279 (9.0%) |
| 10 to 14 Minutes | 345 (10.2%) | 269 (8.7%) |
| 15 to 19 Minutes | 227 (6.7%) | 360 (11.7%) |
| 20 to 24 Minutes | 320 (9.5%) | 467 (15.1%) |
| 25 to 29 Minutes | 94 (2.8%) | 189 (6.1%) |
| 30 to 34 Minutes | 527 (15.7%) | 436 (14.1%) |
| 35 to 39 Minutes | 93 (2.8%) | 107 (3.5%) |
| 40 to 44 Minutes | 292 (8.7%) | 139 (4.5%) |
| 45 to 59 Minutes | 537 (16.0%) | 529 (17.1%) |
| 60 to 89 Minutes | 492 (14.6%) | 188 (6.1%) |
| 90 or more Minutes | 273 (8.1%) | 40 (1.3%) |
Time of Departure to Work by Sex in Brown County
The most frequent times of departure to work in Brown County are 6:00 AM to 6:29 AM (423, 12.6%) for males and 7:00 AM to 7:29 AM (464, 15.0%) for females.

| Time of Departure | Male | Female |
| 12:00 AM to 4:59 AM | 297 (8.8%) | 21 (0.7%) |
| 5:00 AM to 5:29 AM | 211 (6.3%) | 91 (2.9%) |
| 5:30 AM to 5:59 AM | 164 (4.9%) | 118 (3.8%) |
| 6:00 AM to 6:29 AM | 423 (12.6%) | 260 (8.4%) |
| 6:30 AM to 6:59 AM | 231 (6.9%) | 254 (8.2%) |
| 7:00 AM to 7:29 AM | 310 (9.2%) | 464 (15.0%) |
| 7:30 AM to 7:59 AM | 352 (10.5%) | 383 (12.4%) |
| 8:00 AM to 8:29 AM | 281 (8.4%) | 257 (8.3%) |
| 8:30 AM to 8:59 AM | 122 (3.6%) | 304 (9.9%) |
| 9:00 AM to 9:59 AM | 172 (5.1%) | 169 (5.5%) |
| 10:00 AM to 10:59 AM | 80 (2.4%) | 122 (4.0%) |
| 11:00 AM to 11:59 AM | 71 (2.1%) | 223 (7.2%) |
| 12:00 PM to 3:59 PM | 410 (12.2%) | 140 (4.5%) |
| 4:00 PM to 11:59 PM | 242 (7.2%) | 281 (9.1%) |
| Total | 3,366 (100.0%) | 3,087 (100.0%) |
Housing Occupancy in Brown County
Occupancy by Ownership in Brown County
Of the total 6,580 dwellings in Brown County, owner-occupied units account for 5,633 (85.6%), while renter-occupied units make up 947 (14.4%).
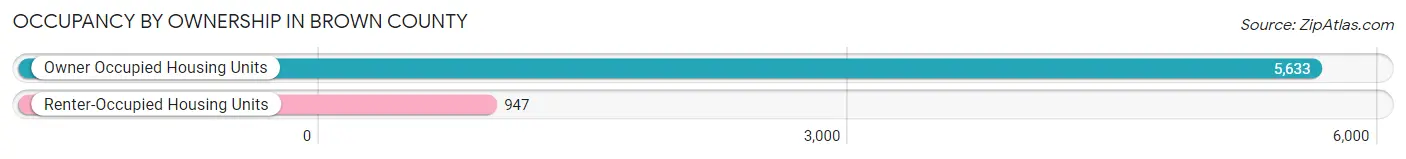
| Occupancy | # Housing Units | % Housing Units |
| Owner Occupied Housing Units | 5,633 | 85.6% |
| Renter-Occupied Housing Units | 947 | 14.4% |
| Total Occupied Housing Units | 6,580 | 100.0% |
Occupancy by Household Size in Brown County

| Household Size | # Housing Units | % Housing Units |
| 1-Person Household | 1,373 | 20.9% |
| 2-Person Household | 3,117 | 47.4% |
| 3-Person Household | 908 | 13.8% |
| 4+ Person Household | 1,182 | 18.0% |
| Total Housing Units | 6,580 | 100.0% |
Occupancy by Ownership by Household Size in Brown County
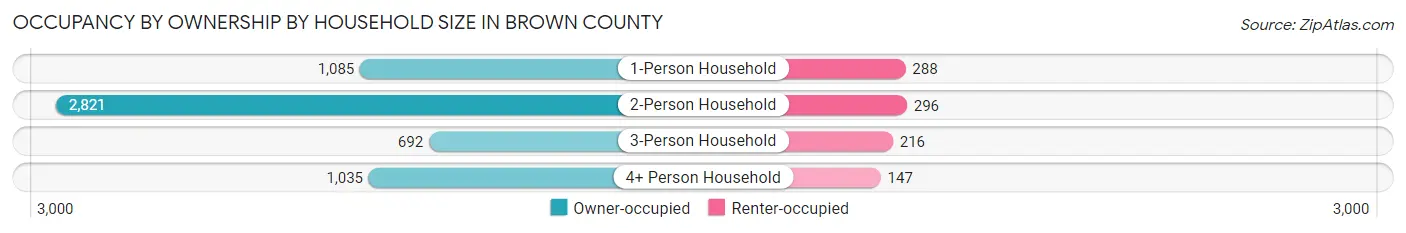
| Household Size | Owner-occupied | Renter-occupied |
| 1-Person Household | 1,085 (79.0%) | 288 (21.0%) |
| 2-Person Household | 2,821 (90.5%) | 296 (9.5%) |
| 3-Person Household | 692 (76.2%) | 216 (23.8%) |
| 4+ Person Household | 1,035 (87.6%) | 147 (12.4%) |
| Total Housing Units | 5,633 (85.6%) | 947 (14.4%) |
Occupancy by Educational Attainment in Brown County

| Household Size | Owner-occupied | Renter-occupied |
| Less than High School | 316 (70.9%) | 130 (29.1%) |
| High School Diploma | 1,749 (85.5%) | 297 (14.5%) |
| College/Associate Degree | 1,722 (82.7%) | 361 (17.3%) |
| Bachelor's Degree or higher | 1,846 (92.1%) | 159 (7.9%) |
Occupancy by Age of Householder in Brown County
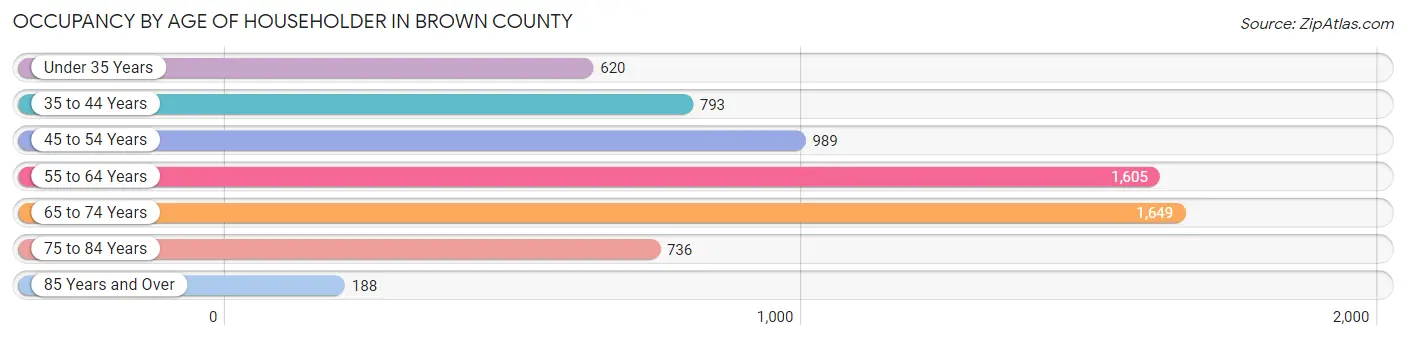
| Age Bracket | # Households | % Households |
| Under 35 Years | 620 | 9.4% |
| 35 to 44 Years | 793 | 12.0% |
| 45 to 54 Years | 989 | 15.0% |
| 55 to 64 Years | 1,605 | 24.4% |
| 65 to 74 Years | 1,649 | 25.1% |
| 75 to 84 Years | 736 | 11.2% |
| 85 Years and Over | 188 | 2.9% |
| Total | 6,580 | 100.0% |
Housing Finances in Brown County
Median Income by Occupancy in Brown County

| Occupancy Type | # Households | Median Income |
| Owner-Occupied | 5,633 (85.6%) | $82,363 |
| Renter-Occupied | 947 (14.4%) | $33,210 |
| Average | 6,580 (100.0%) | $73,933 |
Occupancy by Householder Income Bracket in Brown County
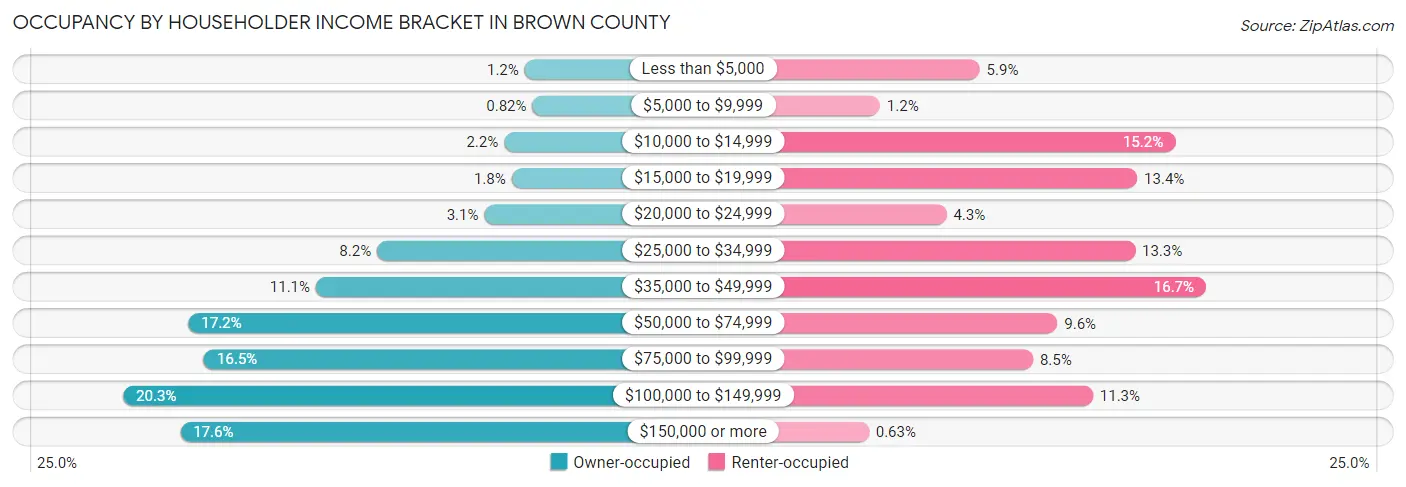
| Income Bracket | Owner-occupied | Renter-occupied |
| Less than $5,000 | 67 (1.2%) | 56 (5.9%) |
| $5,000 to $9,999 | 46 (0.8%) | 11 (1.2%) |
| $10,000 to $14,999 | 122 (2.2%) | 144 (15.2%) |
| $15,000 to $19,999 | 102 (1.8%) | 127 (13.4%) |
| $20,000 to $24,999 | 175 (3.1%) | 41 (4.3%) |
| $25,000 to $34,999 | 463 (8.2%) | 126 (13.3%) |
| $35,000 to $49,999 | 627 (11.1%) | 158 (16.7%) |
| $50,000 to $74,999 | 969 (17.2%) | 91 (9.6%) |
| $75,000 to $99,999 | 927 (16.5%) | 80 (8.5%) |
| $100,000 to $149,999 | 1,144 (20.3%) | 107 (11.3%) |
| $150,000 or more | 991 (17.6%) | 6 (0.6%) |
| Total | 5,633 (100.0%) | 947 (100.0%) |
Monthly Housing Cost Tiers in Brown County

| Monthly Cost | Owner-occupied | Renter-occupied |
| Less than $300 | 298 (5.3%) | 38 (4.0%) |
| $300 to $499 | 781 (13.9%) | 3 (0.3%) |
| $500 to $799 | 1,132 (20.1%) | 212 (22.4%) |
| $800 to $999 | 690 (12.2%) | 303 (32.0%) |
| $1,000 to $1,499 | 1,480 (26.3%) | 305 (32.2%) |
| $1,500 to $1,999 | 526 (9.3%) | 29 (3.1%) |
| $2,000 to $2,499 | 418 (7.4%) | 0 (0.0%) |
| $2,500 to $2,999 | 208 (3.7%) | 4 (0.4%) |
| $3,000 or more | 100 (1.8%) | 0 (0.0%) |
| Total | 5,633 (100.0%) | 947 (100.0%) |
Physical Housing Characteristics in Brown County
Housing Structures in Brown County

| Structure Type | # Housing Units | % Housing Units |
| Single Unit, Detached | 5,730 | 87.1% |
| Single Unit, Attached | 129 | 2.0% |
| 2 Unit Apartments | 113 | 1.7% |
| 3 or 4 Unit Apartments | 37 | 0.6% |
| 5 to 9 Unit Apartments | 58 | 0.9% |
| 10 or more Apartments | 201 | 3.0% |
| Mobile Home / Other | 312 | 4.7% |
| Total | 6,580 | 100.0% |
Housing Structures by Occupancy in Brown County
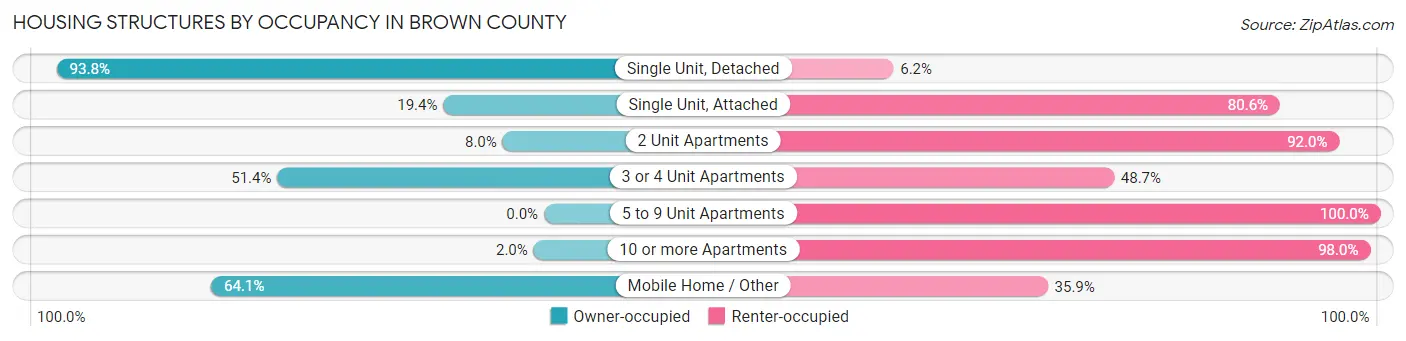
| Structure Type | Owner-occupied | Renter-occupied |
| Single Unit, Detached | 5,376 (93.8%) | 354 (6.2%) |
| Single Unit, Attached | 25 (19.4%) | 104 (80.6%) |
| 2 Unit Apartments | 9 (8.0%) | 104 (92.0%) |
| 3 or 4 Unit Apartments | 19 (51.3%) | 18 (48.6%) |
| 5 to 9 Unit Apartments | 0 (0.0%) | 58 (100.0%) |
| 10 or more Apartments | 4 (2.0%) | 197 (98.0%) |
| Mobile Home / Other | 200 (64.1%) | 112 (35.9%) |
| Total | 5,633 (85.6%) | 947 (14.4%) |
Housing Structures by Number of Rooms in Brown County

| Number of Rooms | Owner-occupied | Renter-occupied |
| 1 Room | 19 (0.3%) | 11 (1.2%) |
| 2 or 3 Rooms | 250 (4.4%) | 257 (27.1%) |
| 4 or 5 Rooms | 1,919 (34.1%) | 459 (48.5%) |
| 6 or 7 Rooms | 2,144 (38.1%) | 151 (16.0%) |
| 8 or more Rooms | 1,301 (23.1%) | 69 (7.3%) |
| Total | 5,633 (100.0%) | 947 (100.0%) |
Housing Structure by Heating Type in Brown County

| Heating Type | Owner-occupied | Renter-occupied |
| Utility Gas | 946 (16.8%) | 114 (12.0%) |
| Bottled, Tank, or LP Gas | 1,943 (34.5%) | 124 (13.1%) |
| Electricity | 1,977 (35.1%) | 625 (66.0%) |
| Fuel Oil or Kerosene | 122 (2.2%) | 0 (0.0%) |
| Coal or Coke | 0 (0.0%) | 0 (0.0%) |
| All other Fuels | 631 (11.2%) | 84 (8.9%) |
| No Fuel Used | 14 (0.3%) | 0 (0.0%) |
| Total | 5,633 (100.0%) | 947 (100.0%) |
Household Vehicle Usage in Brown County
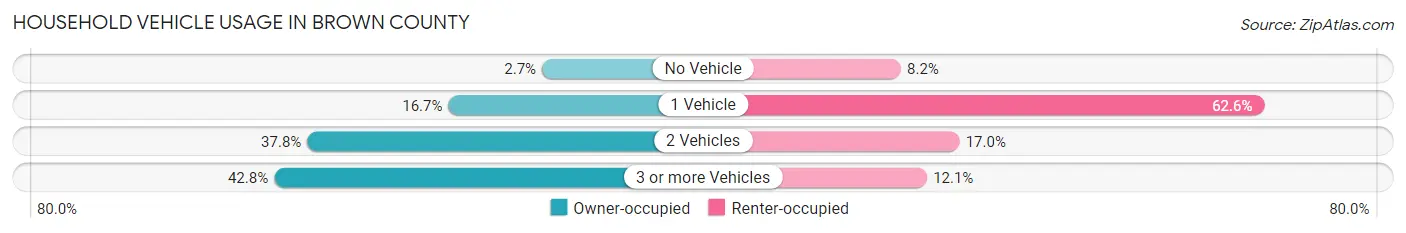
| Vehicles per Household | Owner-occupied | Renter-occupied |
| No Vehicle | 154 (2.7%) | 78 (8.2%) |
| 1 Vehicle | 942 (16.7%) | 593 (62.6%) |
| 2 Vehicles | 2,129 (37.8%) | 161 (17.0%) |
| 3 or more Vehicles | 2,408 (42.7%) | 115 (12.1%) |
| Total | 5,633 (100.0%) | 947 (100.0%) |
Real Estate & Mortgages in Brown County
Real Estate and Mortgage Overview in Brown County
| Characteristic | Without Mortgage | With Mortgage |
| Housing Units | 2,158 | 3,475 |
| Median Property Value | $219,000 | $233,500 |
| Median Household Income | $61,515 | $614 |
| Monthly Housing Costs | $518 | $100 |
| Real Estate Taxes | $1,055 | $92 |
Property Value by Mortgage Status in Brown County

| Property Value | Without Mortgage | With Mortgage |
| Less than $50,000 | 156 (7.2%) | 73 (2.1%) |
| $50,000 to $99,999 | 160 (7.4%) | 158 (4.5%) |
| $100,000 to $299,999 | 1,218 (56.4%) | 1,977 (56.9%) |
| $300,000 to $499,999 | 363 (16.8%) | 794 (22.9%) |
| $500,000 to $749,999 | 212 (9.8%) | 345 (9.9%) |
| $750,000 to $999,999 | 45 (2.1%) | 101 (2.9%) |
| $1,000,000 or more | 4 (0.2%) | 27 (0.8%) |
| Total | 2,158 (100.0%) | 3,475 (100.0%) |
Household Income by Mortgage Status in Brown County

| Household Income | Without Mortgage | With Mortgage |
| Less than $10,000 | 86 (4.0%) | 104 (3.0%) |
| $10,000 to $24,999 | 218 (10.1%) | 27 (0.8%) |
| $25,000 to $34,999 | 235 (10.9%) | 181 (5.2%) |
| $35,000 to $49,999 | 285 (13.2%) | 228 (6.6%) |
| $50,000 to $74,999 | 429 (19.9%) | 342 (9.8%) |
| $75,000 to $99,999 | 163 (7.5%) | 540 (15.5%) |
| $100,000 to $149,999 | 365 (16.9%) | 764 (22.0%) |
| $150,000 or more | 377 (17.5%) | 779 (22.4%) |
| Total | 2,158 (100.0%) | 3,475 (100.0%) |
Property Value to Household Income Ratio in Brown County
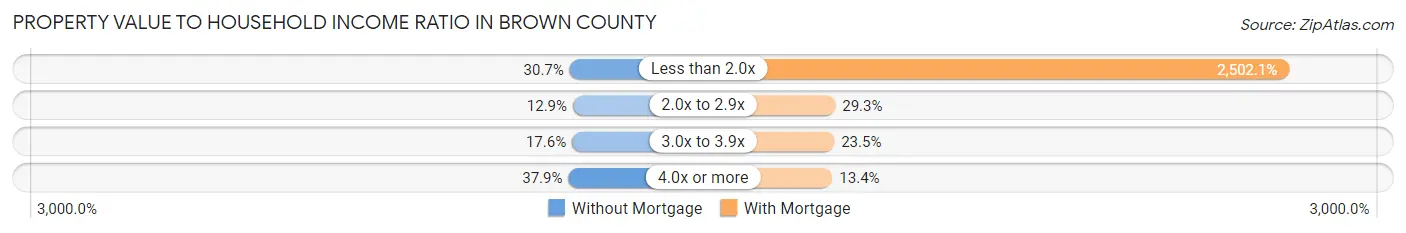
| Value-to-Income Ratio | Without Mortgage | With Mortgage |
| Less than 2.0x | 663 (30.7%) | 86,947 (2,502.1%) |
| 2.0x to 2.9x | 278 (12.9%) | 1,019 (29.3%) |
| 3.0x to 3.9x | 380 (17.6%) | 816 (23.5%) |
| 4.0x or more | 817 (37.9%) | 467 (13.4%) |
| Total | 2,158 (100.0%) | 3,475 (100.0%) |
Real Estate Taxes by Mortgage Status in Brown County

| Property Taxes | Without Mortgage | With Mortgage |
| Less than $800 | 675 (31.3%) | 0 (0.0%) |
| $800 to $1,499 | 855 (39.6%) | 1,132 (32.6%) |
| $800 to $1,499 | 564 (26.1%) | 988 (28.4%) |
| Total | 2,158 (100.0%) | 3,475 (100.0%) |
Health & Disability in Brown County
Health Insurance Coverage by Age in Brown County

| Age Bracket | With Coverage | Without Coverage |
| Under 6 Years | 729 (94.8%) | 40 (5.2%) |
| 6 to 18 Years | 1,857 (91.9%) | 163 (8.1%) |
| 19 to 25 Years | 915 (89.3%) | 110 (10.7%) |
| 26 to 34 Years | 1,083 (87.0%) | 162 (13.0%) |
| 35 to 44 Years | 1,323 (84.4%) | 244 (15.6%) |
| 45 to 54 Years | 1,852 (87.6%) | 263 (12.4%) |
| 55 to 64 Years | 2,632 (93.6%) | 180 (6.4%) |
| 65 to 74 Years | 2,505 (99.6%) | 10 (0.4%) |
| 75 Years and older | 1,304 (100.0%) | 0 (0.0%) |
| Total | 14,200 (92.4%) | 1,172 (7.6%) |
Health Insurance Coverage by Citizenship Status in Brown County
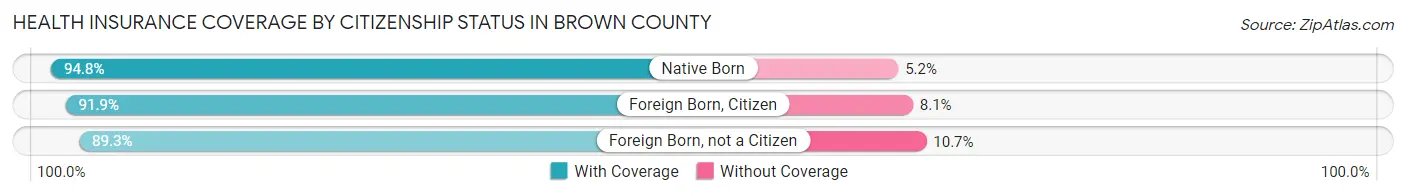
| Citizenship Status | With Coverage | Without Coverage |
| Native Born | 729 (94.8%) | 40 (5.2%) |
| Foreign Born, Citizen | 1,857 (91.9%) | 163 (8.1%) |
| Foreign Born, not a Citizen | 915 (89.3%) | 110 (10.7%) |
Health Insurance Coverage by Household Income in Brown County

| Household Income | With Coverage | Without Coverage |
| Under $25,000 | 1,344 (89.4%) | 160 (10.6%) |
| $25,000 to $49,999 | 2,232 (91.2%) | 215 (8.8%) |
| $50,000 to $74,999 | 2,123 (87.5%) | 303 (12.5%) |
| $75,000 to $99,999 | 2,565 (93.9%) | 166 (6.1%) |
| $100,000 and over | 5,931 (94.8%) | 328 (5.2%) |
Public vs Private Health Insurance Coverage by Age in Brown County

| Age Bracket | Public Insurance | Private Insurance |
| Under 6 | 232 (30.2%) | 529 (68.8%) |
| 6 to 18 Years | 596 (29.5%) | 1,288 (63.8%) |
| 19 to 25 Years | 149 (14.5%) | 766 (74.7%) |
| 25 to 34 Years | 244 (19.6%) | 866 (69.6%) |
| 35 to 44 Years | 308 (19.7%) | 1,022 (65.2%) |
| 45 to 54 Years | 223 (10.5%) | 1,634 (77.3%) |
| 55 to 64 Years | 532 (18.9%) | 2,247 (79.9%) |
| 65 to 74 Years | 2,430 (96.6%) | 1,396 (55.5%) |
| 75 Years and over | 1,304 (100.0%) | 883 (67.7%) |
| Total | 6,018 (39.2%) | 10,631 (69.2%) |
Disability Status by Sex by Age in Brown County
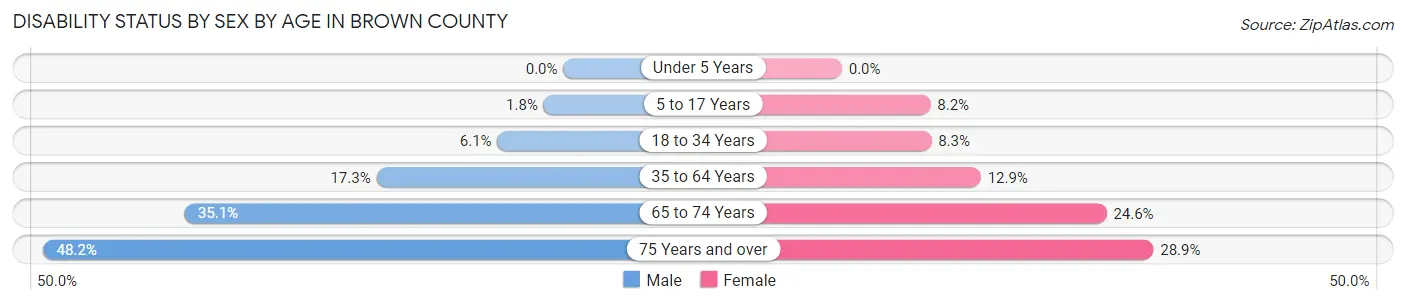
| Age Bracket | Male | Female |
| Under 5 Years | 0 (0.0%) | 0 (0.0%) |
| 5 to 17 Years | 18 (1.8%) | 84 (8.2%) |
| 18 to 34 Years | 77 (6.1%) | 96 (8.3%) |
| 35 to 64 Years | 569 (17.3%) | 414 (12.9%) |
| 65 to 74 Years | 440 (35.1%) | 310 (24.6%) |
| 75 Years and over | 302 (48.2%) | 196 (28.9%) |
Disability Class by Sex by Age in Brown County
Disability Class: Hearing Difficulty

| Age Bracket | Male | Female |
| Under 5 Years | 0 (0.0%) | 0 (0.0%) |
| 5 to 17 Years | 0 (0.0%) | 0 (0.0%) |
| 18 to 34 Years | 0 (0.0%) | 10 (0.9%) |
| 35 to 64 Years | 265 (8.1%) | 128 (4.0%) |
| 65 to 74 Years | 235 (18.8%) | 96 (7.6%) |
| 75 Years and over | 149 (23.8%) | 69 (10.2%) |
Disability Class: Vision Difficulty

| Age Bracket | Male | Female |
| Under 5 Years | 0 (0.0%) | 0 (0.0%) |
| 5 to 17 Years | 0 (0.0%) | 11 (1.1%) |
| 18 to 34 Years | 0 (0.0%) | 19 (1.6%) |
| 35 to 64 Years | 33 (1.0%) | 58 (1.8%) |
| 65 to 74 Years | 118 (9.4%) | 64 (5.1%) |
| 75 Years and over | 37 (5.9%) | 57 (8.4%) |
Disability Class: Cognitive Difficulty

| Age Bracket | Male | Female |
| 5 to 17 Years | 18 (1.8%) | 73 (7.1%) |
| 18 to 34 Years | 28 (2.2%) | 63 (5.4%) |
| 35 to 64 Years | 77 (2.4%) | 139 (4.3%) |
| 65 to 74 Years | 56 (4.5%) | 25 (2.0%) |
| 75 Years and over | 51 (8.2%) | 43 (6.3%) |
Disability Class: Ambulatory Difficulty

| Age Bracket | Male | Female |
| 5 to 17 Years | 0 (0.0%) | 11 (1.1%) |
| 18 to 34 Years | 0 (0.0%) | 23 (2.0%) |
| 35 to 64 Years | 279 (8.5%) | 155 (4.8%) |
| 65 to 74 Years | 165 (13.2%) | 213 (16.9%) |
| 75 Years and over | 165 (26.4%) | 89 (13.1%) |
Disability Class: Self-Care Difficulty

| Age Bracket | Male | Female |
| 5 to 17 Years | 0 (0.0%) | 11 (1.1%) |
| 18 to 34 Years | 20 (1.6%) | 11 (0.9%) |
| 35 to 64 Years | 36 (1.1%) | 36 (1.1%) |
| 65 to 74 Years | 44 (3.5%) | 80 (6.3%) |
| 75 Years and over | 68 (10.9%) | 36 (5.3%) |
Technology Access in Brown County
Computing Device Access in Brown County
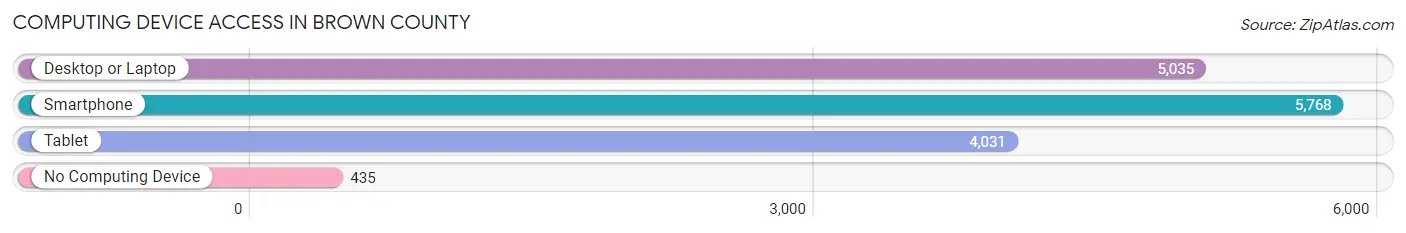
| Device Type | # Households | % Households |
| Desktop or Laptop | 5,035 | 76.5% |
| Smartphone | 5,768 | 87.7% |
| Tablet | 4,031 | 61.3% |
| No Computing Device | 435 | 6.6% |
| Total | 6,580 | 100.0% |
Internet Access in Brown County

| Internet Type | # Households | % Households |
| Dial-Up Internet | 28 | 0.4% |
| Broadband Home | 3,649 | 55.5% |
| Cellular Data Only | 1,533 | 23.3% |
| Satellite Internet | 771 | 11.7% |
| No Internet | 837 | 12.7% |
| Total | 6,580 | 100.0% |
Brown County Summary
Brown County, Indiana is located in the south-central part of the state, and is part of the Indianapolis metropolitan area. It is bordered by Monroe, Jackson, Bartholomew, Johnson, Morgan, and Lawrence counties. The county seat is Nashville, and the county was named for General Jacob Brown, a hero of the War of 1812.
History
Brown County was formed in 1836 from parts of Monroe, Jackson, and Bartholomew counties. The county was named for General Jacob Brown, a hero of the War of 1812. The first settlers arrived in the area in the early 1800s, and the county was officially organized in 1836.
The county was largely agricultural in its early years, with corn, wheat, and livestock being the main crops. The county also had a thriving timber industry, with the White River providing an easy means of transportation for logs.
In the late 1800s, the county began to develop a tourism industry, with the Brown County State Park being established in 1929. The park is now the largest state park in Indiana, and is a popular destination for hikers, campers, and nature lovers.
Geography
Brown County is located in the south-central part of Indiana, and is part of the Indianapolis metropolitan area. It is bordered by Monroe, Jackson, Bartholomew, Johnson, Morgan, and Lawrence counties. The county has a total area of 517 square miles, of which 514 square miles is land and 3 square miles is water.
The county is mostly hilly, with the highest point being the summit of Beanblossom Hill at 1,065 feet above sea level. The White River runs through the county, and there are several small lakes and ponds scattered throughout the area.
Economy
The economy of Brown County is largely based on tourism, with the Brown County State Park being the main attraction. The park is home to a variety of outdoor activities, including hiking, camping, fishing, and horseback riding.
The county also has a thriving agricultural industry, with corn, wheat, and livestock being the main crops. There is also a small manufacturing sector, with several small factories producing a variety of products.
Demographics
As of the 2010 census, the population of Brown County was 15,242. The population density was 29.6 people per square mile. The racial makeup of the county was 95.3% White, 1.2% African American, 0.4% Native American, 0.5% Asian, 0.1% Pacific Islander, 1.2% from other races, and 1.3% from two or more races. Hispanic or Latino of any race were 3.2% of the population.
The median income for a household in the county was $41,945, and the median income for a family was $50,945. The per capita income for the county was $21,945. About 11.2% of families and 14.2% of the population were below the poverty line, including 19.2% of those under age 18 and 8.2% of those age 65 or over.
Common Questions
What is the Total Population of Brown County?
Total Population of Brown County is 15,513.
What is the Total Male Population of Brown County?
Total Male Population of Brown County is 7,767.
What is the Total Female Population of Brown County?
Total Female Population of Brown County is 7,746.
What is the Ratio of Males per 100 Females in Brown County?
There are 100.27 Males per 100 Females in Brown County.
What is the Ratio of Females per 100 Males in Brown County?
There are 99.73 Females per 100 Males in Brown County.
What is the Median Population Age in Brown County?
Median Population Age in Brown County is 50.7 Years.
What is the Average Family Size in Brown County
Average Family Size in Brown County is 2.6 People.
What is the Average Household Size in Brown County
Average Household Size in Brown County is 2.3 People.
What is Per Capita Income in Brown County?
Per Capita income in Brown County is $40,792.
What is the Median Family Income in Brown County?
Median Family Income in Brown County is $85,791.
What is the Median Household income in Brown County?
Median Household Income in Brown County is $73,933.
What is Income or Wage Gap in Brown County?
Income or Wage Gap in Brown County is 38.5%.
Women in Brown County earn 61.5 cents for every dollar earned by a man.
What is Family Income Deficit in Brown County?
Family Income Deficit in Brown County is $8,622.
Families that are below poverty line in Brown County earn $8,622 less on average than the poverty threshold level.
What is Inequality or Gini Index in Brown County?
Inequality or Gini Index in Brown County is 0.44.
How Large is the Labor Force in Brown County?
There are 7,625 People in the Labor Forcein in Brown County.
What is the Percentage of People in the Labor Force in Brown County?
57.6% of People are in the Labor Force in Brown County.
What is the Unemployment Rate in Brown County?
Unemployment Rate in Brown County is 3.9%.