Boone County, IN
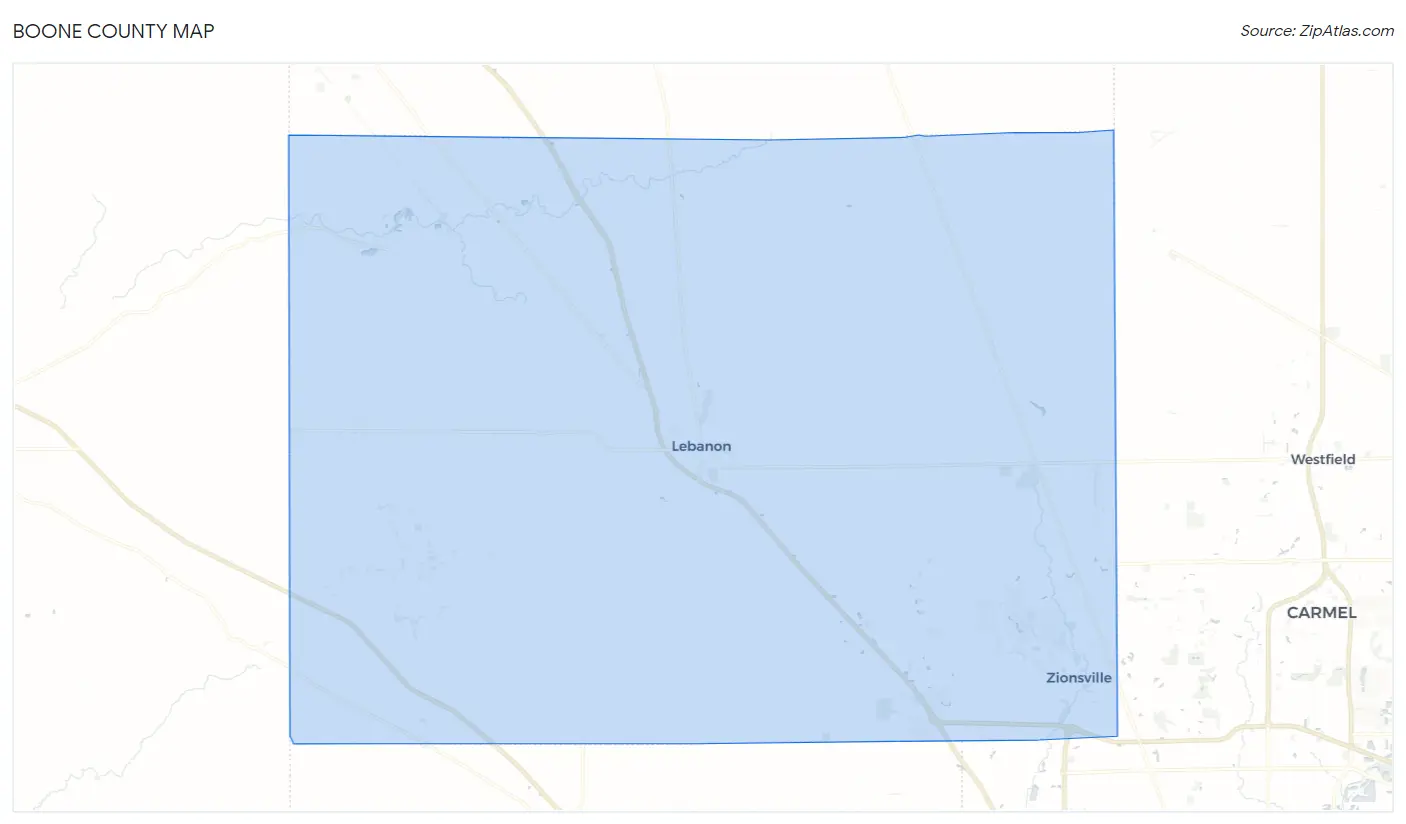
Boone County Map
Boone County Overview
71,235
TOTAL POPULATION
35,557
MALE POPULATION
35,678
FEMALE POPULATION
99.66
MALES / 100 FEMALES
100.34
FEMALES / 100 MALES
38.3
MEDIAN AGE
3.1
AVG FAMILY SIZE
2.6
AVG HOUSEHOLD SIZE
$54,866
PER CAPITA INCOME
$121,097
AVG FAMILY INCOME
$103,038
AVG HOUSEHOLD INCOME
34.4%
WAGE / INCOME GAP [ % ]
65.6¢/ $1
WAGE / INCOME GAP [ $ ]
$11,047
FAMILY INCOME DEFICIT
0.48
INEQUALITY / GINI INDEX
38,188
LABOR FORCE [ PEOPLE ]
69.6%
PERCENT IN LABOR FORCE
3.1%
UNEMPLOYMENT RATE
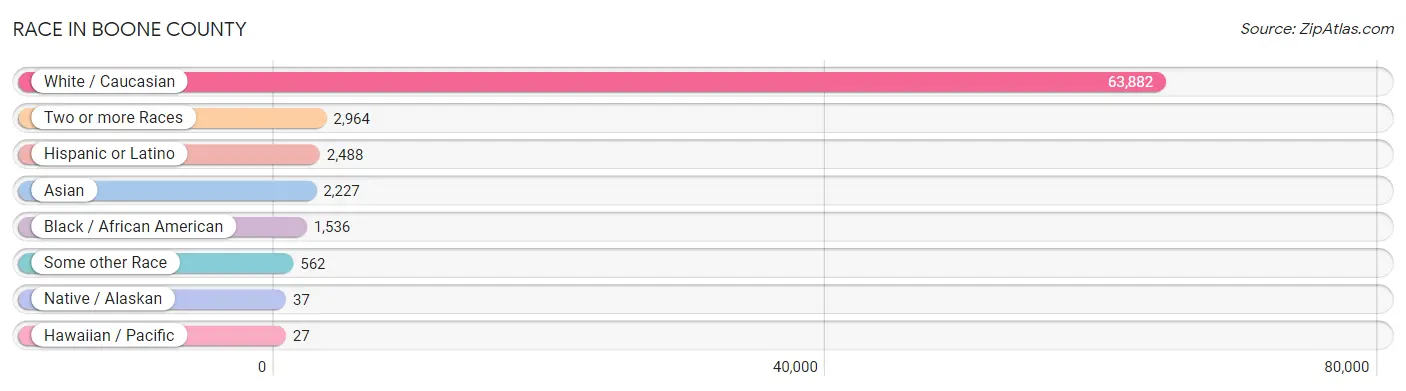
Race in Boone County
The most populous races in Boone County are White / Caucasian (63,882 | 89.7%), Two or more Races (2,964 | 4.2%), and Hispanic or Latino (2,488 | 3.5%).
| Race | # Population | % Population |
| Asian | 2,227 | 3.1% |
| Black / African American | 1,536 | 2.2% |
| Hawaiian / Pacific | 27 | 0.0% |
| Hispanic or Latino | 2,488 | 3.5% |
| Native / Alaskan | 37 | 0.1% |
| White / Caucasian | 63,882 | 89.7% |
| Two or more Races | 2,964 | 4.2% |
| Some other Race | 562 | 0.8% |
| Total | 71,235 | 100.0% |
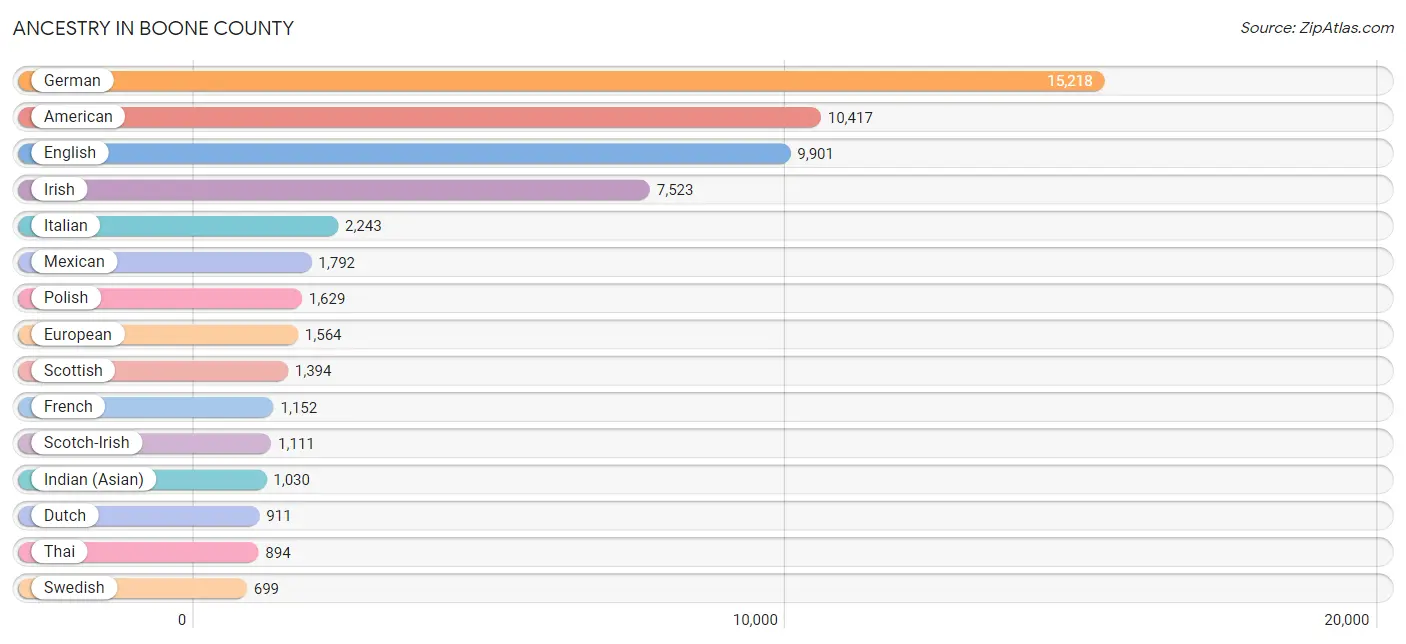
Ancestry in Boone County
The most populous ancestries reported in Boone County are German (15,218 | 21.4%), American (10,417 | 14.6%), English (9,901 | 13.9%), Irish (7,523 | 10.6%), and Italian (2,243 | 3.2%), together accounting for 63.6% of all Boone County residents.
| Ancestry | # Population | % Population |
| African | 75 | 0.1% |
| Albanian | 69 | 0.1% |
| American | 10,417 | 14.6% |
| Arab | 114 | 0.2% |
| Argentinean | 16 | 0.0% |
| Austrian | 57 | 0.1% |
| Barbadian | 13 | 0.0% |
| Belgian | 166 | 0.2% |
| Bhutanese | 205 | 0.3% |
| Brazilian | 103 | 0.1% |
| British | 476 | 0.7% |
| Bulgarian | 17 | 0.0% |
| Burmese | 67 | 0.1% |
| Cajun | 20 | 0.0% |
| Canadian | 163 | 0.2% |
| Cape Verdean | 48 | 0.1% |
| Celtic | 40 | 0.1% |
| Central American | 171 | 0.2% |
| Central American Indian | 4 | 0.0% |
| Cherokee | 66 | 0.1% |
| Chippewa | 18 | 0.0% |
| Choctaw | 6 | 0.0% |
| Colombian | 112 | 0.2% |
| Costa Rican | 16 | 0.0% |
| Croatian | 58 | 0.1% |
| Cuban | 27 | 0.0% |
| Czech | 177 | 0.3% |
| Czechoslovakian | 50 | 0.1% |
| Danish | 132 | 0.2% |
| Dominican | 18 | 0.0% |
| Dutch | 911 | 1.3% |
| Dutch West Indian | 23 | 0.0% |
| Eastern European | 66 | 0.1% |
| English | 9,901 | 13.9% |
| European | 1,564 | 2.2% |
| Finnish | 160 | 0.2% |
| French | 1,152 | 1.6% |
| French Canadian | 319 | 0.4% |
| German | 15,218 | 21.4% |
| Greek | 334 | 0.5% |
| Guatemalan | 43 | 0.1% |
| Honduran | 31 | 0.0% |
| Hungarian | 150 | 0.2% |
| Icelander | 31 | 0.0% |
| Indian (Asian) | 1,030 | 1.5% |
| Indonesian | 42 | 0.1% |
| Iranian | 27 | 0.0% |
| Irish | 7,523 | 10.6% |
| Iroquois | 3 | 0.0% |
| Italian | 2,243 | 3.2% |
| Korean | 106 | 0.2% |
| Laotian | 62 | 0.1% |
| Latvian | 29 | 0.0% |
| Lebanese | 114 | 0.2% |
| Lithuanian | 37 | 0.1% |
| Macedonian | 8 | 0.0% |
| Mexican | 1,792 | 2.5% |
| Native Hawaiian | 27 | 0.0% |
| Nicaraguan | 81 | 0.1% |
| Nigerian | 59 | 0.1% |
| Northern European | 71 | 0.1% |
| Norwegian | 581 | 0.8% |
| Pakistani | 9 | 0.0% |
| Pennsylvania German | 3 | 0.0% |
| Polish | 1,629 | 2.3% |
| Portuguese | 58 | 0.1% |
| Puerto Rican | 119 | 0.2% |
| Romanian | 61 | 0.1% |
| Russian | 126 | 0.2% |
| Scandinavian | 570 | 0.8% |
| Scotch-Irish | 1,111 | 1.6% |
| Scottish | 1,394 | 2.0% |
| Serbian | 16 | 0.0% |
| Slavic | 141 | 0.2% |
| Slovak | 203 | 0.3% |
| Slovene | 75 | 0.1% |
| South American | 226 | 0.3% |
| Spaniard | 88 | 0.1% |
| Spanish | 10 | 0.0% |
| Sri Lankan | 121 | 0.2% |
| Subsaharan African | 212 | 0.3% |
| Swedish | 699 | 1.0% |
| Swiss | 409 | 0.6% |
| Thai | 894 | 1.3% |
| Ukrainian | 109 | 0.2% |
| Venezuelan | 98 | 0.1% |
| Welsh | 236 | 0.3% |
| West Indian | 18 | 0.0% |
| Yugoslavian | 97 | 0.1% |
| Zimbabwean | 23 | 0.0% | View All 90 Rows |
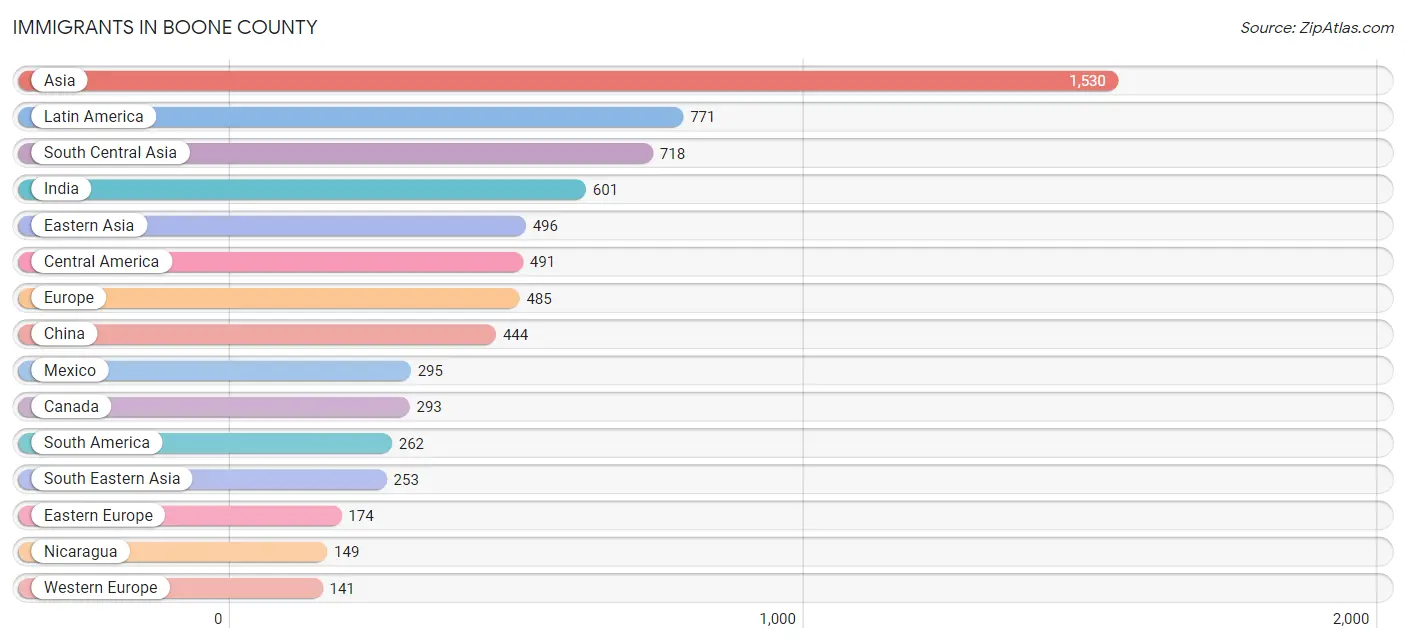
Immigrants in Boone County
The most numerous immigrant groups reported in Boone County came from Asia (1,530 | 2.1%), Latin America (771 | 1.1%), South Central Asia (718 | 1.0%), India (601 | 0.8%), and Eastern Asia (496 | 0.7%), together accounting for 5.8% of all Boone County residents.
| Immigration Origin | # Population | % Population |
| Africa | 136 | 0.2% |
| Argentina | 16 | 0.0% |
| Asia | 1,530 | 2.1% |
| Austria | 12 | 0.0% |
| Bosnia and Herzegovina | 66 | 0.1% |
| Brazil | 34 | 0.1% |
| Bulgaria | 17 | 0.0% |
| Cabo Verde | 42 | 0.1% |
| Canada | 293 | 0.4% |
| Caribbean | 18 | 0.0% |
| Central America | 491 | 0.7% |
| China | 444 | 0.6% |
| Colombia | 84 | 0.1% |
| Costa Rica | 5 | 0.0% |
| Dominican Republic | 18 | 0.0% |
| Eastern Africa | 38 | 0.1% |
| Eastern Asia | 496 | 0.7% |
| Eastern Europe | 174 | 0.2% |
| England | 74 | 0.1% |
| Europe | 485 | 0.7% |
| France | 33 | 0.1% |
| Germany | 78 | 0.1% |
| Ghana | 4 | 0.0% |
| Guatemala | 11 | 0.0% |
| Honduras | 31 | 0.0% |
| India | 601 | 0.8% |
| Indonesia | 53 | 0.1% |
| Iran | 27 | 0.0% |
| Japan | 12 | 0.0% |
| Korea | 40 | 0.1% |
| Latin America | 771 | 1.1% |
| Mexico | 295 | 0.4% |
| Nepal | 42 | 0.1% |
| Netherlands | 18 | 0.0% |
| Nicaragua | 149 | 0.2% |
| Nigeria | 15 | 0.0% |
| Northern Europe | 134 | 0.2% |
| Oceania | 59 | 0.1% |
| Pakistan | 19 | 0.0% |
| Poland | 21 | 0.0% |
| Russia | 46 | 0.1% |
| Saudi Arabia | 63 | 0.1% |
| South Africa | 37 | 0.1% |
| South America | 262 | 0.4% |
| South Central Asia | 718 | 1.0% |
| South Eastern Asia | 253 | 0.4% |
| Southern Europe | 36 | 0.1% |
| Spain | 27 | 0.0% |
| Sri Lanka | 29 | 0.0% |
| Thailand | 61 | 0.1% |
| Ukraine | 9 | 0.0% |
| Venezuela | 128 | 0.2% |
| Vietnam | 97 | 0.1% |
| Western Africa | 61 | 0.1% |
| Western Asia | 63 | 0.1% |
| Western Europe | 141 | 0.2% |
| Zimbabwe | 38 | 0.1% | View All 57 Rows |
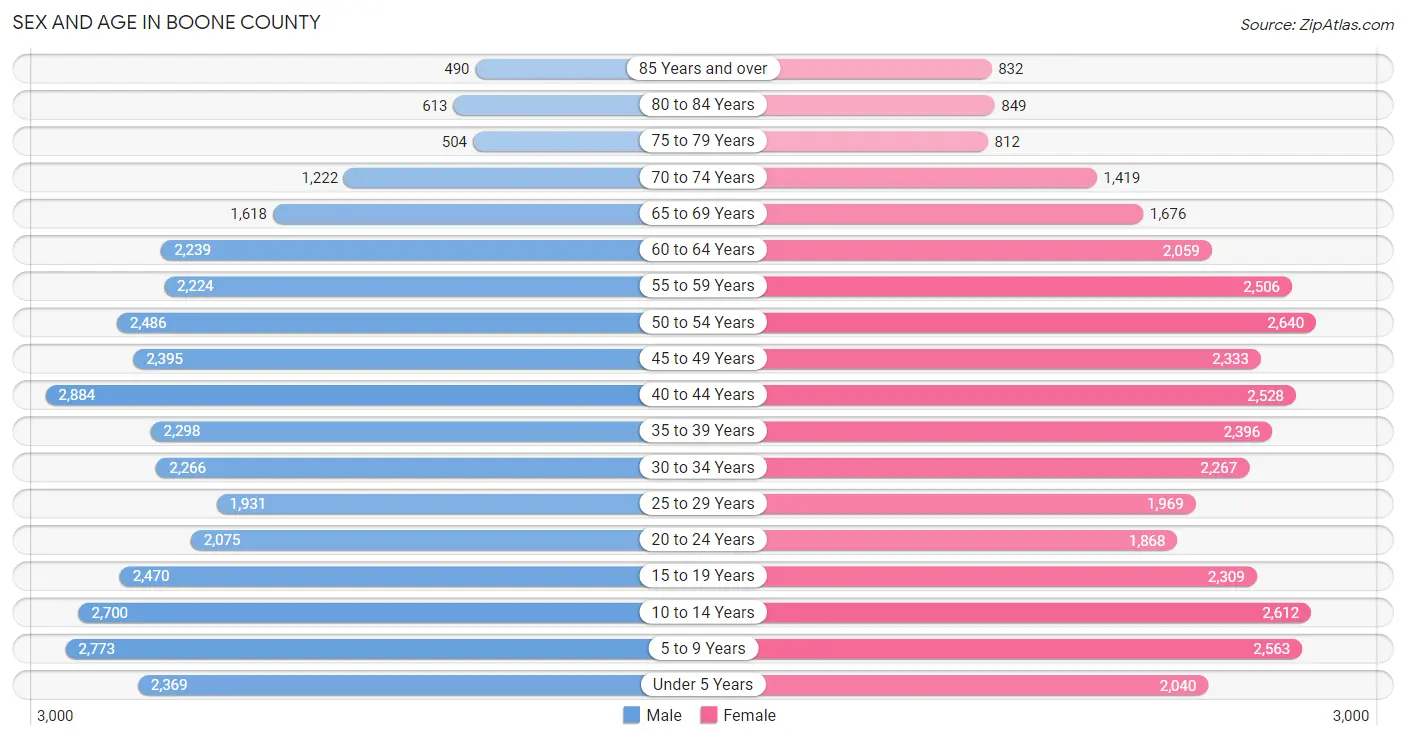
Sex and Age in Boone County
Sex and Age in Boone County
The most populous age groups in Boone County are 40 to 44 Years (2,884 | 8.1%) for men and 50 to 54 Years (2,640 | 7.4%) for women.
| Age Bracket | Male | Female |
| Under 5 Years | 2,369 (6.7%) | 2,040 (5.7%) |
| 5 to 9 Years | 2,773 (7.8%) | 2,563 (7.2%) |
| 10 to 14 Years | 2,700 (7.6%) | 2,612 (7.3%) |
| 15 to 19 Years | 2,470 (7.0%) | 2,309 (6.5%) |
| 20 to 24 Years | 2,075 (5.8%) | 1,868 (5.2%) |
| 25 to 29 Years | 1,931 (5.4%) | 1,969 (5.5%) |
| 30 to 34 Years | 2,266 (6.4%) | 2,267 (6.4%) |
| 35 to 39 Years | 2,298 (6.5%) | 2,396 (6.7%) |
| 40 to 44 Years | 2,884 (8.1%) | 2,528 (7.1%) |
| 45 to 49 Years | 2,395 (6.7%) | 2,333 (6.5%) |
| 50 to 54 Years | 2,486 (7.0%) | 2,640 (7.4%) |
| 55 to 59 Years | 2,224 (6.2%) | 2,506 (7.0%) |
| 60 to 64 Years | 2,239 (6.3%) | 2,059 (5.8%) |
| 65 to 69 Years | 1,618 (4.5%) | 1,676 (4.7%) |
| 70 to 74 Years | 1,222 (3.4%) | 1,419 (4.0%) |
| 75 to 79 Years | 504 (1.4%) | 812 (2.3%) |
| 80 to 84 Years | 613 (1.7%) | 849 (2.4%) |
| 85 Years and over | 490 (1.4%) | 832 (2.3%) |
| Total | 35,557 (100.0%) | 35,678 (100.0%) |
Families and Households in Boone County
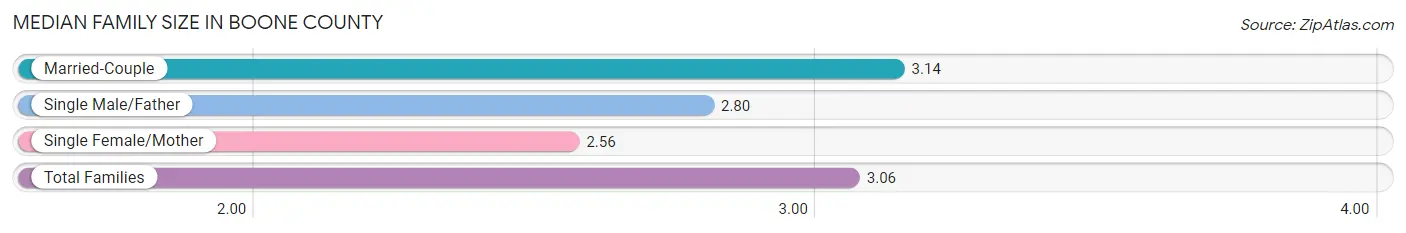
Median Family Size in Boone County
The median family size in Boone County is 3.06 persons per family, with married-couple families (16,798 | 85.1%) accounting for the largest median family size of 3.14 persons per family. On the other hand, single female/mother families (2,276 | 11.5%) represent the smallest median family size with 2.56 persons per family.
| Family Type | # Families | Family Size |
| Married-Couple | 16,798 (85.1%) | 3.14 |
| Single Male/Father | 675 (3.4%) | 2.80 |
| Single Female/Mother | 2,276 (11.5%) | 2.56 |
| Total Families | 19,749 (100.0%) | 3.06 |
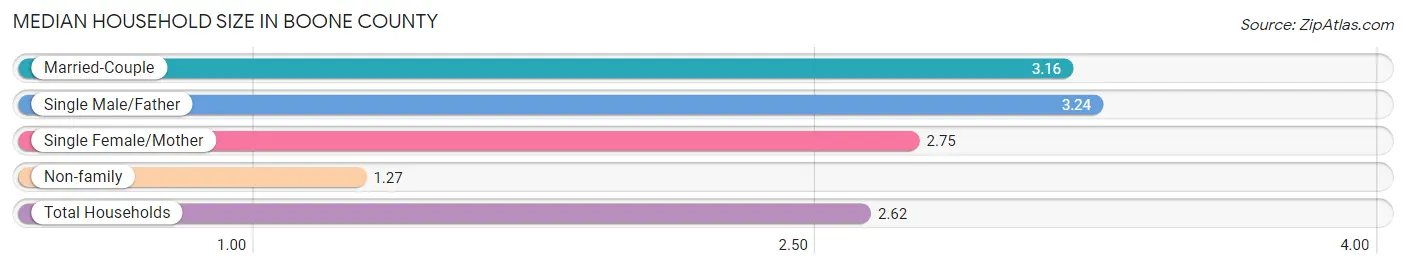
Median Household Size in Boone County
The median household size in Boone County is 2.62 persons per household, with single male/father households (675 | 2.5%) accounting for the largest median household size of 3.24 persons per household. non-family households (7,210 | 26.7%) represent the smallest median household size with 1.27 persons per household.
| Household Type | # Households | Household Size |
| Married-Couple | 16,798 (62.3%) | 3.16 |
| Single Male/Father | 675 (2.5%) | 3.24 |
| Single Female/Mother | 2,276 (8.4%) | 2.75 |
| Non-family | 7,210 (26.7%) | 1.27 |
| Total Households | 26,959 (100.0%) | 2.62 |
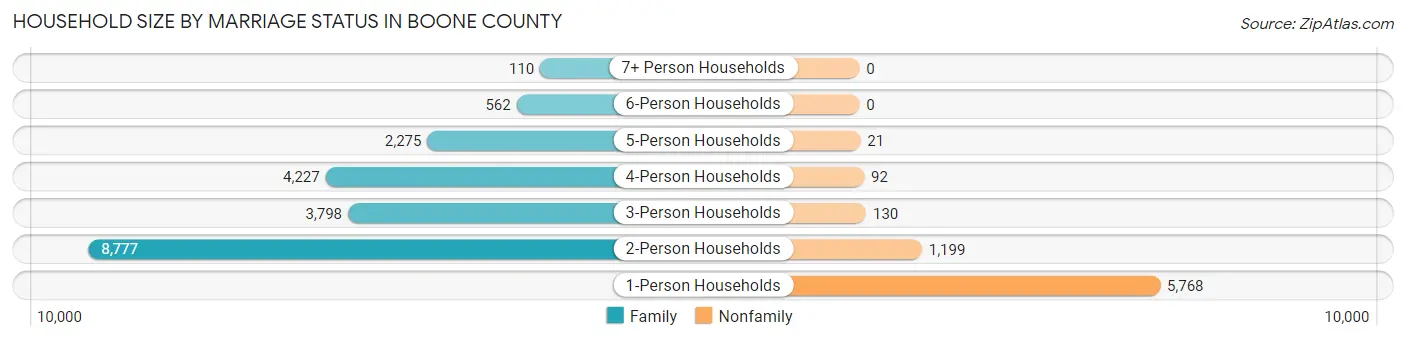
Household Size by Marriage Status in Boone County
Out of a total of 26,959 households in Boone County, 19,749 (73.3%) are family households, while 7,210 (26.7%) are nonfamily households. The most numerous type of family households are 2-person households, comprising 8,777, and the most common type of nonfamily households are 1-person households, comprising 5,768.
| Household Size | Family Households | Nonfamily Households |
| 1-Person Households | - | 5,768 (21.4%) |
| 2-Person Households | 8,777 (32.6%) | 1,199 (4.4%) |
| 3-Person Households | 3,798 (14.1%) | 130 (0.5%) |
| 4-Person Households | 4,227 (15.7%) | 92 (0.3%) |
| 5-Person Households | 2,275 (8.4%) | 21 (0.1%) |
| 6-Person Households | 562 (2.1%) | 0 (0.0%) |
| 7+ Person Households | 110 (0.4%) | 0 (0.0%) |
| Total | 19,749 (73.3%) | 7,210 (26.7%) |
Female Fertility in Boone County
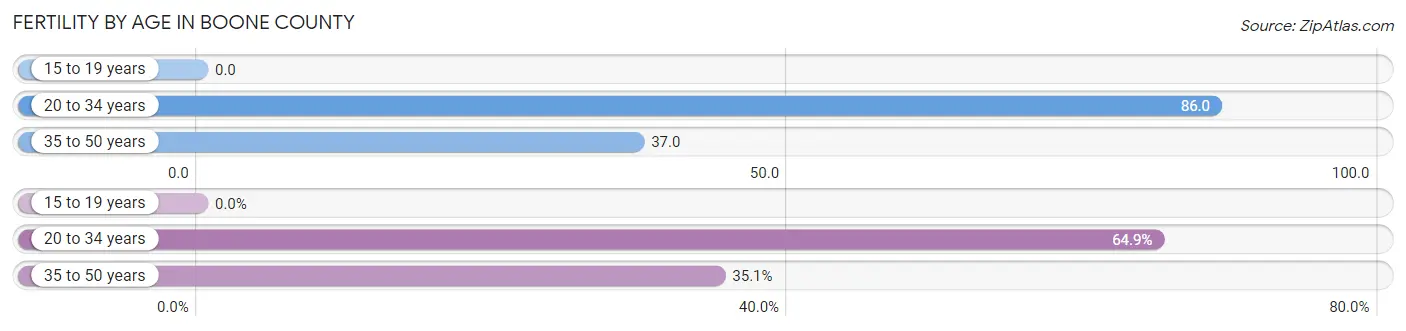
Fertility by Age in Boone County
Average fertility rate in Boone County is 50.0 births per 1,000 women. Women in the age bracket of 20 to 34 years have the highest fertility rate with 86.0 births per 1,000 women. Women in the age bracket of 20 to 34 years acount for 64.9% of all women with births.
| Age Bracket | Women with Births | Births / 1,000 Women |
| 15 to 19 years | 0 (0.0%) | 0.0 |
| 20 to 34 years | 523 (64.9%) | 86.0 |
| 35 to 50 years | 283 (35.1%) | 37.0 |
| Total | 806 (100.0%) | 50.0 |
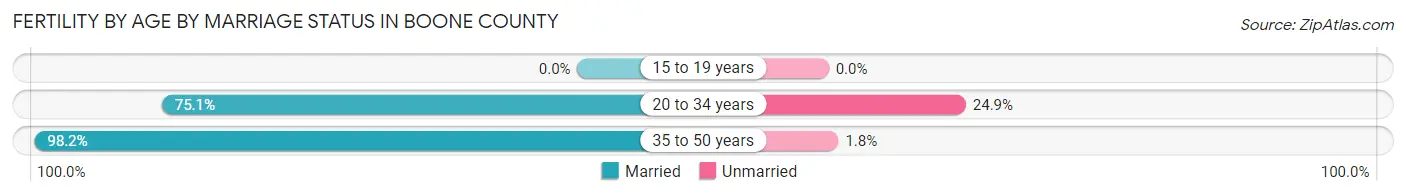
Fertility by Age by Marriage Status in Boone County
83.3% of women with births (806) in Boone County are married. The highest percentage of unmarried women with births falls into 20 to 34 years age bracket with 24.9% of them unmarried at the time of birth, while the lowest percentage of unmarried women with births belong to 35 to 50 years age bracket with 1.8% of them unmarried.
| Age Bracket | Married | Unmarried |
| 15 to 19 years | 0 (0.0%) | 0 (0.0%) |
| 20 to 34 years | 393 (75.1%) | 130 (24.9%) |
| 35 to 50 years | 278 (98.2%) | 5 (1.8%) |
| Total | 671 (83.3%) | 135 (16.8%) |
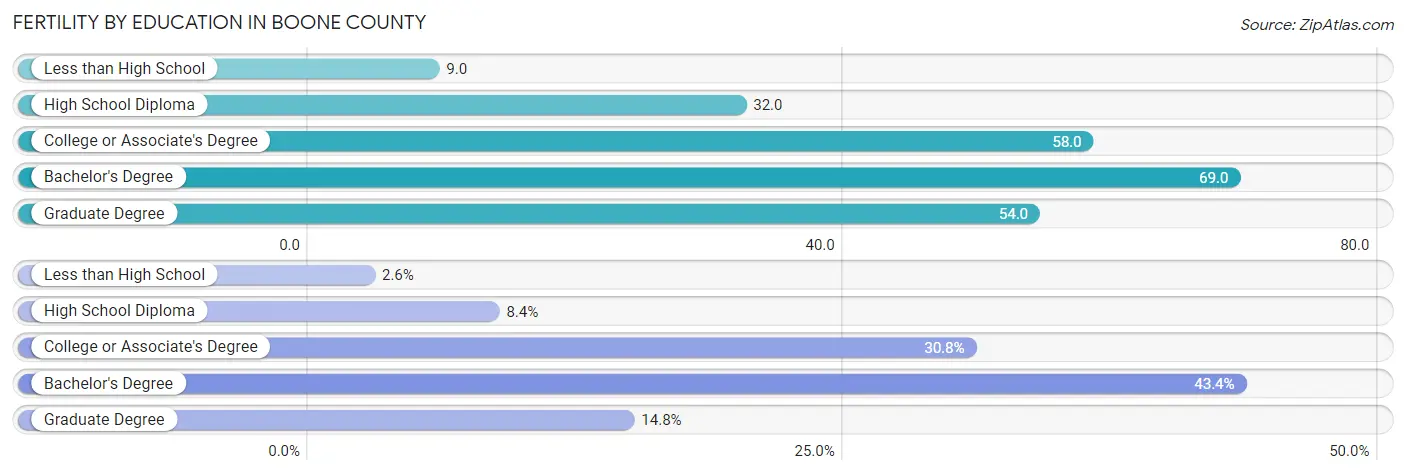
Fertility by Education in Boone County
Average fertility rate in Boone County is 50.0 births per 1,000 women. Women with the education attainment of bachelor's degree have the highest fertility rate of 69.0 births per 1,000 women, while women with the education attainment of less than high school have the lowest fertility at 9.0 births per 1,000 women. Women with the education attainment of bachelor's degree represent 43.4% of all women with births.
| Educational Attainment | Women with Births | Births / 1,000 Women |
| Less than High School | 21 (2.6%) | 9.0 |
| High School Diploma | 68 (8.4%) | 32.0 |
| College or Associate's Degree | 248 (30.8%) | 58.0 |
| Bachelor's Degree | 350 (43.4%) | 69.0 |
| Graduate Degree | 119 (14.8%) | 54.0 |
| Total | 806 (100.0%) | 50.0 |
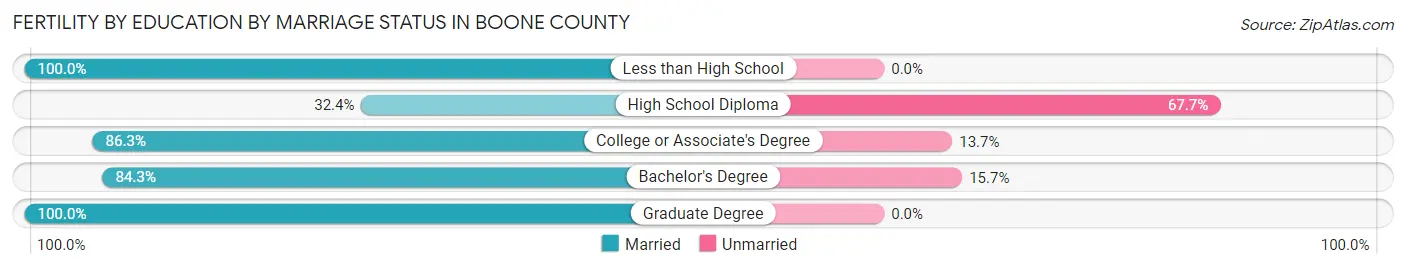
Fertility by Education by Marriage Status in Boone County
16.8% of women with births in Boone County are unmarried. Women with the educational attainment of less than high school are most likely to be married with 100.0% of them married at childbirth, while women with the educational attainment of high school diploma are least likely to be married with 67.6% of them unmarried at childbirth.
| Educational Attainment | Married | Unmarried |
| Less than High School | 21 (100.0%) | 0 (0.0%) |
| High School Diploma | 22 (32.4%) | 46 (67.6%) |
| College or Associate's Degree | 214 (86.3%) | 34 (13.7%) |
| Bachelor's Degree | 295 (84.3%) | 55 (15.7%) |
| Graduate Degree | 119 (100.0%) | 0 (0.0%) |
| Total | 671 (83.3%) | 135 (16.8%) |
Income in Boone County
Income Overview in Boone County
Per Capita Income in Boone County is $54,866, while median incomes of families and households are $121,097 and $103,038 respectively.
| Characteristic | Number | Measure |
| Per Capita Income | 71,235 | $54,866 |
| Median Family Income | 19,749 | $121,097 |
| Mean Family Income | 19,749 | $168,404 |
| Median Household Income | 26,959 | $103,038 |
| Mean Household Income | 26,959 | $144,562 |
| Income Deficit | 19,749 | $11,047 |
| Wage / Income Gap (%) | 71,235 | 34.40% |
| Wage / Income Gap ($) | 71,235 | 65.60¢ per $1 |
| Gini / Inequality Index | 71,235 | 0.48 |
Earnings by Sex in Boone County
Average Earnings in Boone County are $55,293, $68,348 for men and $44,839 for women, a difference of 34.4%.
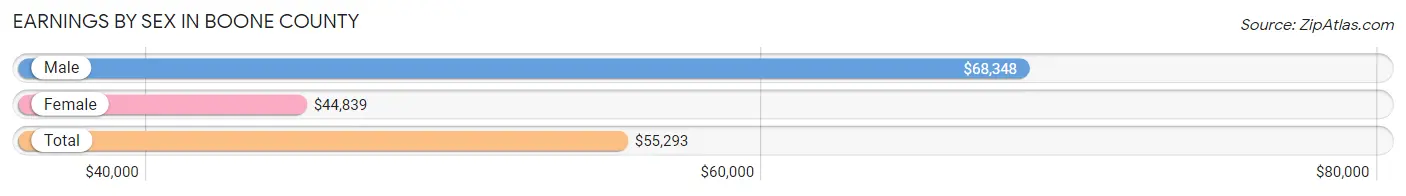
| Sex | Number | Average Earnings |
| Male | 21,631 (54.0%) | $68,348 |
| Female | 18,395 (46.0%) | $44,839 |
| Total | 40,026 (100.0%) | $55,293 |
Earnings by Sex by Income Bracket in Boone County
The most common earnings brackets in Boone County are $100,000+ for men (6,927 | 32.0%) and $100,000+ for women (3,059 | 16.6%).
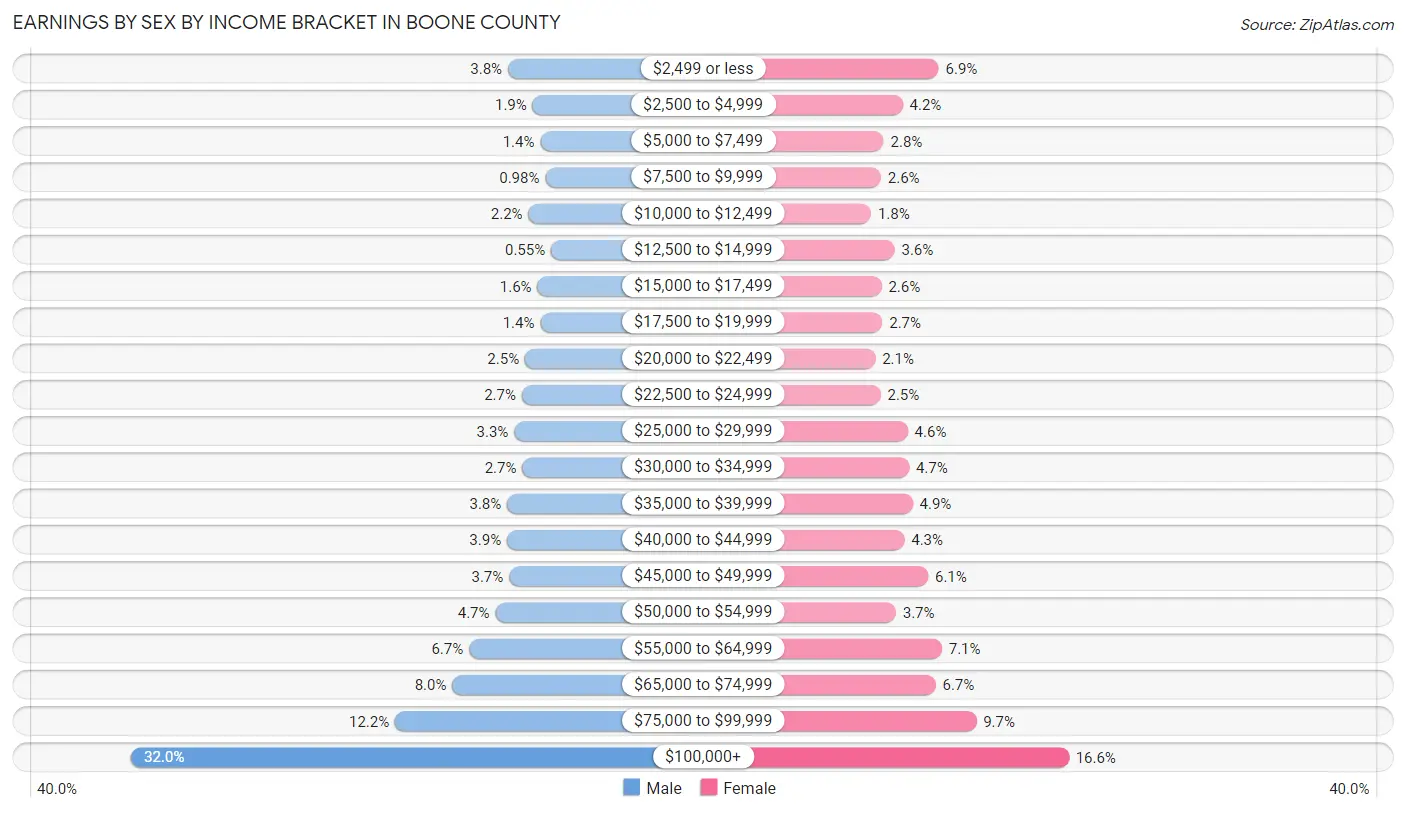
| Income | Male | Female |
| $2,499 or less | 818 (3.8%) | 1,266 (6.9%) |
| $2,500 to $4,999 | 417 (1.9%) | 769 (4.2%) |
| $5,000 to $7,499 | 291 (1.3%) | 507 (2.8%) |
| $7,500 to $9,999 | 211 (1.0%) | 469 (2.5%) |
| $10,000 to $12,499 | 485 (2.2%) | 333 (1.8%) |
| $12,500 to $14,999 | 119 (0.5%) | 658 (3.6%) |
| $15,000 to $17,499 | 340 (1.6%) | 479 (2.6%) |
| $17,500 to $19,999 | 293 (1.3%) | 490 (2.7%) |
| $20,000 to $22,499 | 541 (2.5%) | 391 (2.1%) |
| $22,500 to $24,999 | 593 (2.7%) | 465 (2.5%) |
| $25,000 to $29,999 | 717 (3.3%) | 838 (4.6%) |
| $30,000 to $34,999 | 584 (2.7%) | 858 (4.7%) |
| $35,000 to $39,999 | 830 (3.8%) | 907 (4.9%) |
| $40,000 to $44,999 | 833 (3.8%) | 792 (4.3%) |
| $45,000 to $49,999 | 798 (3.7%) | 1,121 (6.1%) |
| $50,000 to $54,999 | 1,021 (4.7%) | 676 (3.7%) |
| $55,000 to $64,999 | 1,447 (6.7%) | 1,309 (7.1%) |
| $65,000 to $74,999 | 1,719 (8.0%) | 1,223 (6.7%) |
| $75,000 to $99,999 | 2,647 (12.2%) | 1,785 (9.7%) |
| $100,000+ | 6,927 (32.0%) | 3,059 (16.6%) |
| Total | 21,631 (100.0%) | 18,395 (100.0%) |
Earnings by Sex by Educational Attainment in Boone County
Average earnings in Boone County are $75,826 for men and $49,882 for women, a difference of 34.2%. Men with an educational attainment of graduate degree enjoy the highest average annual earnings of $141,181, while those with less than high school education earn the least with $40,781. Women with an educational attainment of graduate degree earn the most with the average annual earnings of $93,842, while those with less than high school education have the smallest earnings of $19,803.
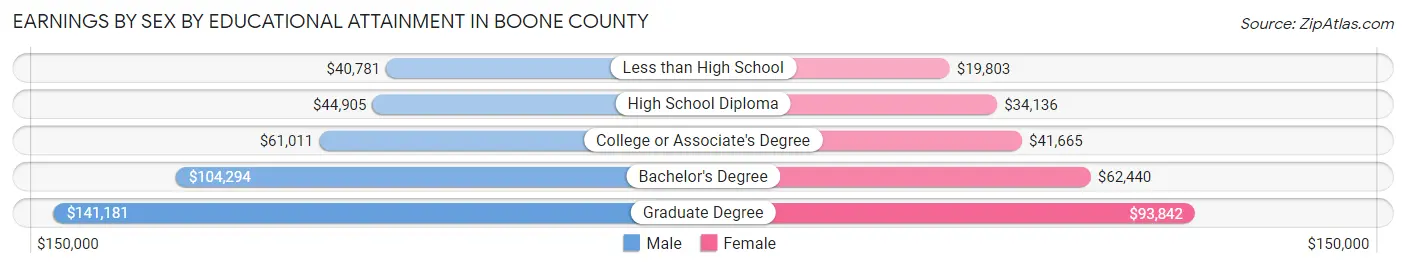
| Educational Attainment | Male Income | Female Income |
| Less than High School | $40,781 | $19,803 |
| High School Diploma | $44,905 | $34,136 |
| College or Associate's Degree | $61,011 | $41,665 |
| Bachelor's Degree | $104,294 | $62,440 |
| Graduate Degree | $141,181 | $93,842 |
| Total | $75,826 | $49,882 |
Family Income in Boone County
Family Income Brackets in Boone County
According to the Boone County family income data, there are 5,135 families falling into the $200,000+ income range, which is the most common income bracket and makes up 26.0% of all families. Conversely, the $10,000 to $14,999 income bracket is the least frequent group with only 158 families (0.8%) belonging to this category.
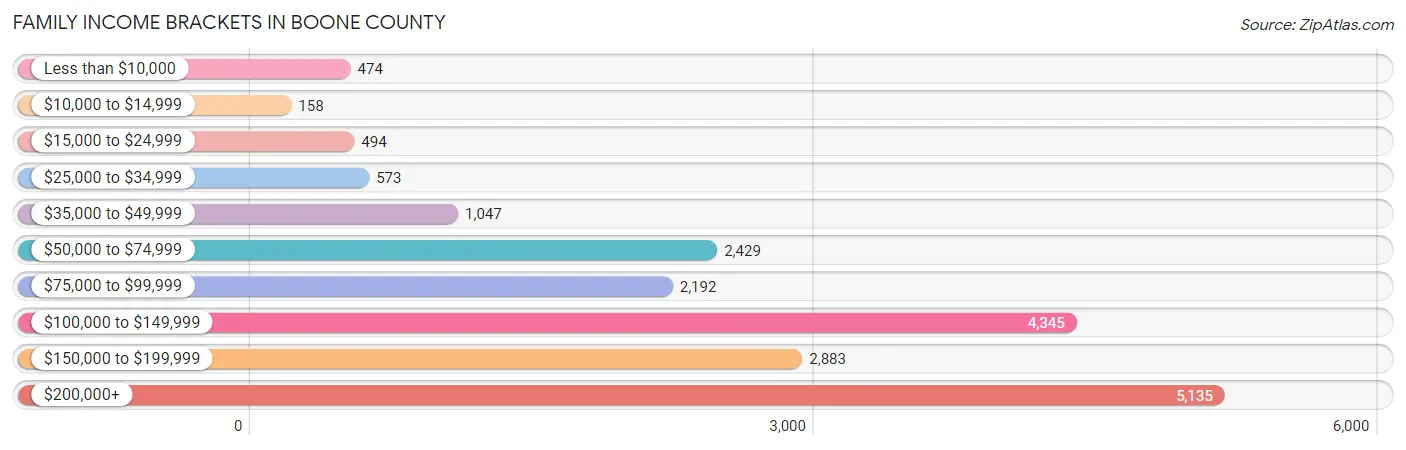
| Income Bracket | # Families | % Families |
| Less than $10,000 | 474 | 2.4% |
| $10,000 to $14,999 | 158 | 0.8% |
| $15,000 to $24,999 | 494 | 2.5% |
| $25,000 to $34,999 | 573 | 2.9% |
| $35,000 to $49,999 | 1,047 | 5.3% |
| $50,000 to $74,999 | 2,429 | 12.3% |
| $75,000 to $99,999 | 2,192 | 11.1% |
| $100,000 to $149,999 | 4,345 | 22.0% |
| $150,000 to $199,999 | 2,883 | 14.6% |
| $200,000+ | 5,135 | 26.0% |
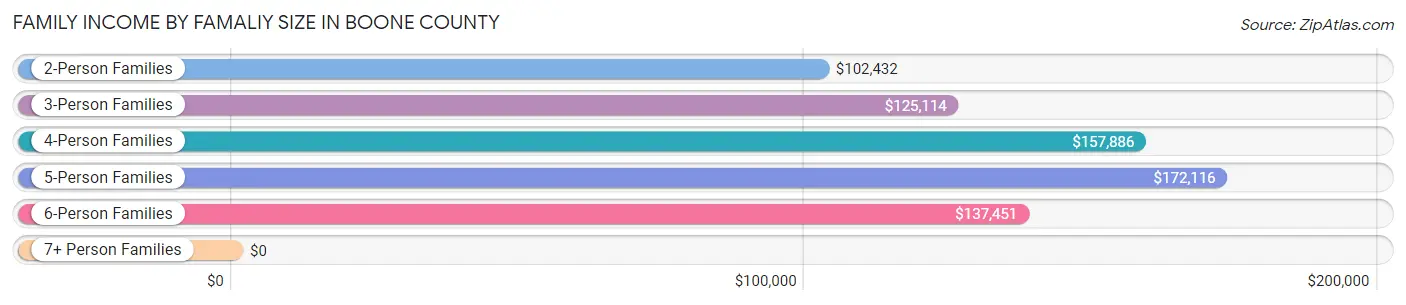
Family Income by Famaliy Size in Boone County
5-person families (2,247 | 11.4%) account for the highest median family income in Boone County with $172,116 per family, while 2-person families (9,055 | 45.9%) have the highest median income of $51,216 per family member.
| Income Bracket | # Families | Median Income |
| 2-Person Families | 9,055 (45.9%) | $102,432 |
| 3-Person Families | 3,823 (19.4%) | $125,114 |
| 4-Person Families | 4,074 (20.6%) | $157,886 |
| 5-Person Families | 2,247 (11.4%) | $172,116 |
| 6-Person Families | 456 (2.3%) | $137,451 |
| 7+ Person Families | 94 (0.5%) | $0 |
| Total | 19,749 (100.0%) | $121,097 |
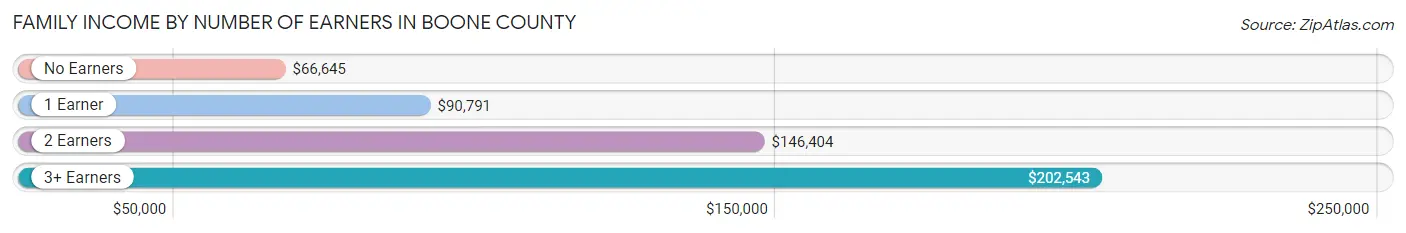
Family Income by Number of Earners in Boone County
The median family income in Boone County is $121,097, with families comprising 3+ earners (1,999) having the highest median family income of $202,543, while families with no earners (1,891) have the lowest median family income of $66,645, accounting for 10.1% and 9.6% of families, respectively.
| Number of Earners | # Families | Median Income |
| No Earners | 1,891 (9.6%) | $66,645 |
| 1 Earner | 5,927 (30.0%) | $90,791 |
| 2 Earners | 9,932 (50.3%) | $146,404 |
| 3+ Earners | 1,999 (10.1%) | $202,543 |
| Total | 19,749 (100.0%) | $121,097 |
Household Income in Boone County
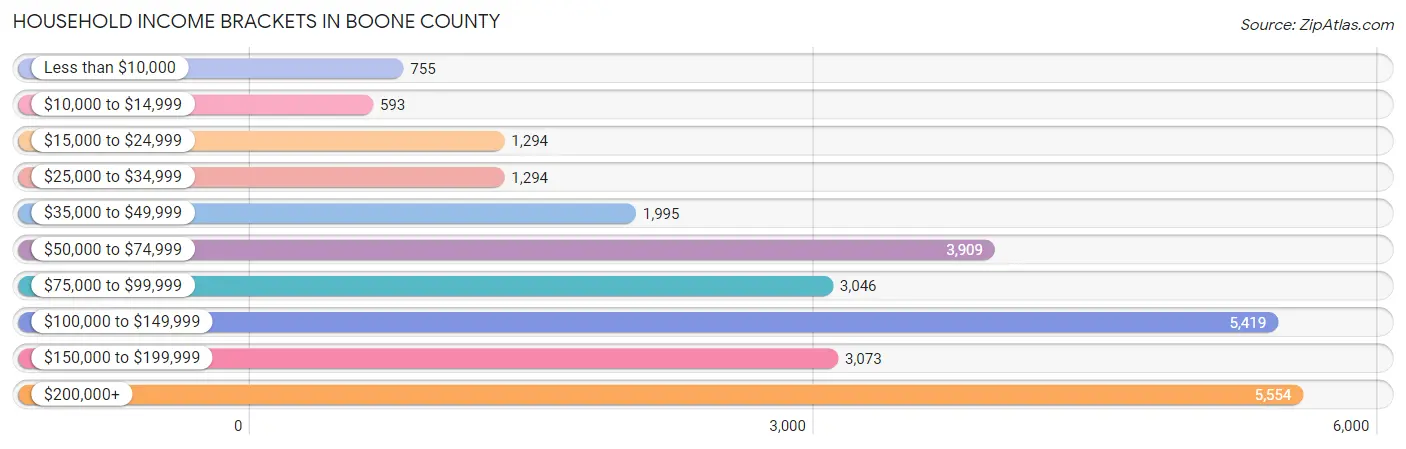
Household Income Brackets in Boone County
With 5,554 households falling in the category, the $200,000+ income range is the most frequent in Boone County, accounting for 20.6% of all households. In contrast, only 593 households (2.2%) fall into the $10,000 to $14,999 income bracket, making it the least populous group.
| Income Bracket | # Households | % Households |
| Less than $10,000 | 755 | 2.8% |
| $10,000 to $14,999 | 593 | 2.2% |
| $15,000 to $24,999 | 1,294 | 4.8% |
| $25,000 to $34,999 | 1,294 | 4.8% |
| $35,000 to $49,999 | 1,995 | 7.4% |
| $50,000 to $74,999 | 3,909 | 14.5% |
| $75,000 to $99,999 | 3,046 | 11.3% |
| $100,000 to $149,999 | 5,419 | 20.1% |
| $150,000 to $199,999 | 3,073 | 11.4% |
| $200,000+ | 5,554 | 20.6% |
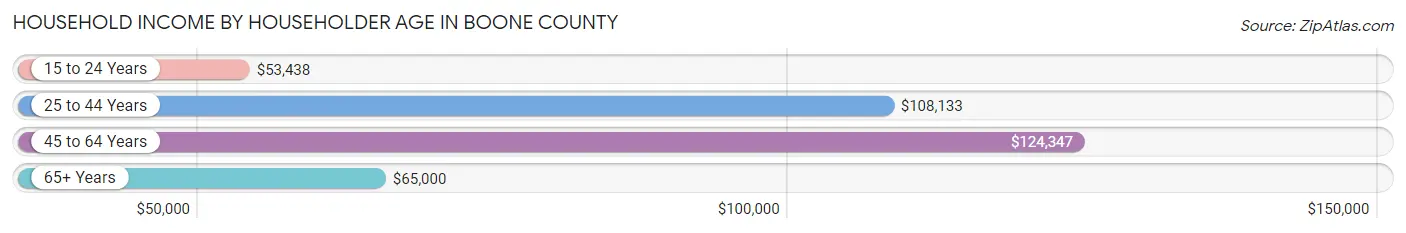
Household Income by Householder Age in Boone County
The median household income in Boone County is $103,038, with the highest median household income of $124,347 found in the 45 to 64 years age bracket for the primary householder. A total of 10,212 households (37.9%) fall into this category. Meanwhile, the 15 to 24 years age bracket for the primary householder has the lowest median household income of $53,438, with 1,147 households (4.3%) in this group.
| Income Bracket | # Households | Median Income |
| 15 to 24 Years | 1,147 (4.3%) | $53,438 |
| 25 to 44 Years | 9,690 (35.9%) | $108,133 |
| 45 to 64 Years | 10,212 (37.9%) | $124,347 |
| 65+ Years | 5,910 (21.9%) | $65,000 |
| Total | 26,959 (100.0%) | $103,038 |
Poverty in Boone County
Income Below Poverty by Sex and Age in Boone County
With 5.1% poverty level for males and 6.5% for females among the residents of Boone County, 18 to 24 year old males and 75 year old and over females are the most vulnerable to poverty, with 377 males (13.0%) and 326 females (14.1%) in their respective age groups living below the poverty level.
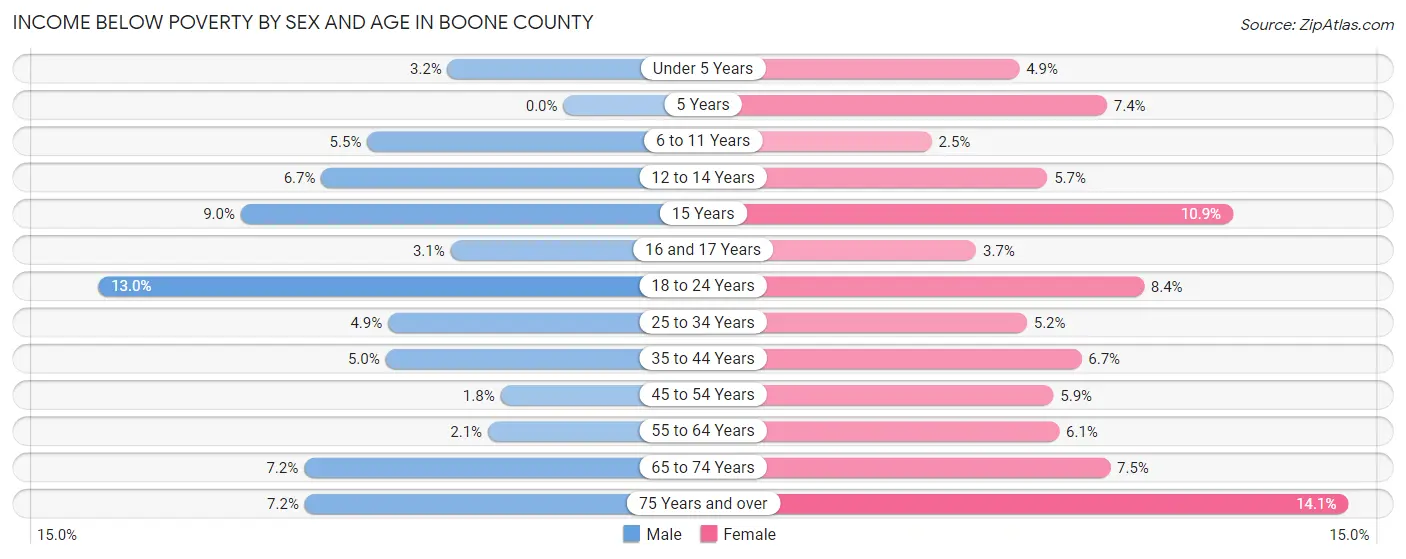
| Age Bracket | Male | Female |
| Under 5 Years | 76 (3.2%) | 98 (4.9%) |
| 5 Years | 0 (0.0%) | 45 (7.4%) |
| 6 to 11 Years | 190 (5.5%) | 77 (2.5%) |
| 12 to 14 Years | 89 (6.7%) | 74 (5.7%) |
| 15 Years | 69 (9.0%) | 59 (10.9%) |
| 16 and 17 Years | 26 (3.1%) | 39 (3.7%) |
| 18 to 24 Years | 377 (13.0%) | 218 (8.4%) |
| 25 to 34 Years | 201 (4.9%) | 218 (5.1%) |
| 35 to 44 Years | 255 (5.0%) | 328 (6.7%) |
| 45 to 54 Years | 85 (1.8%) | 292 (5.9%) |
| 55 to 64 Years | 93 (2.1%) | 275 (6.0%) |
| 65 to 74 Years | 203 (7.2%) | 226 (7.5%) |
| 75 Years and over | 111 (7.2%) | 326 (14.1%) |
| Total | 1,775 (5.1%) | 2,275 (6.5%) |
Income Above Poverty by Sex and Age in Boone County
According to the poverty statistics in Boone County, males aged 5 years and females aged 6 to 11 years are the age groups that are most secure financially, with 100.0% of males and 97.5% of females in these age groups living above the poverty line.
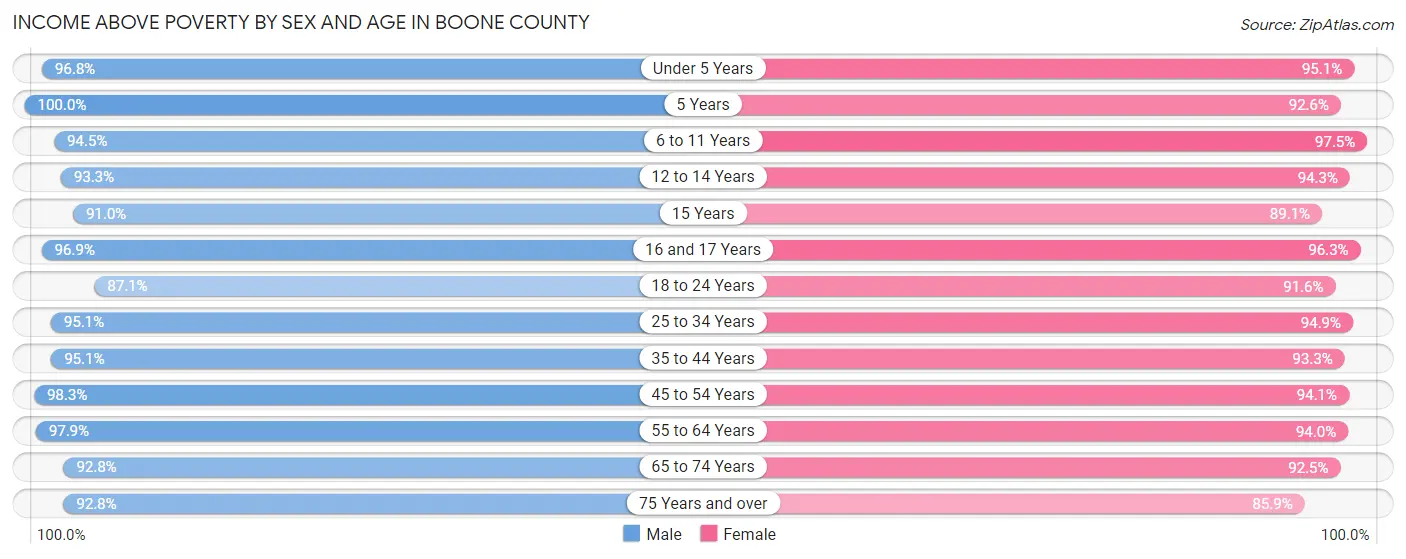
| Age Bracket | Male | Female |
| Under 5 Years | 2,283 (96.8%) | 1,887 (95.1%) |
| 5 Years | 533 (100.0%) | 565 (92.6%) |
| 6 to 11 Years | 3,290 (94.5%) | 3,001 (97.5%) |
| 12 to 14 Years | 1,231 (93.3%) | 1,220 (94.3%) |
| 15 Years | 699 (91.0%) | 483 (89.1%) |
| 16 and 17 Years | 803 (96.9%) | 1,005 (96.3%) |
| 18 to 24 Years | 2,535 (87.1%) | 2,373 (91.6%) |
| 25 to 34 Years | 3,917 (95.1%) | 4,011 (94.9%) |
| 35 to 44 Years | 4,895 (95.1%) | 4,587 (93.3%) |
| 45 to 54 Years | 4,785 (98.3%) | 4,667 (94.1%) |
| 55 to 64 Years | 4,346 (97.9%) | 4,269 (94.0%) |
| 65 to 74 Years | 2,607 (92.8%) | 2,801 (92.5%) |
| 75 Years and over | 1,431 (92.8%) | 1,986 (85.9%) |
| Total | 33,355 (95.0%) | 32,855 (93.5%) |
Income Below Poverty Among Married-Couple Families in Boone County
The poverty statistics for married-couple families in Boone County show that 2.7% or 449 of the total 16,798 families live below the poverty line. Families with no children have the highest poverty rate of 3.2%, comprising of 284 families. On the other hand, families with 5 or more children have the lowest poverty rate of 0.0%, which includes 0 families.
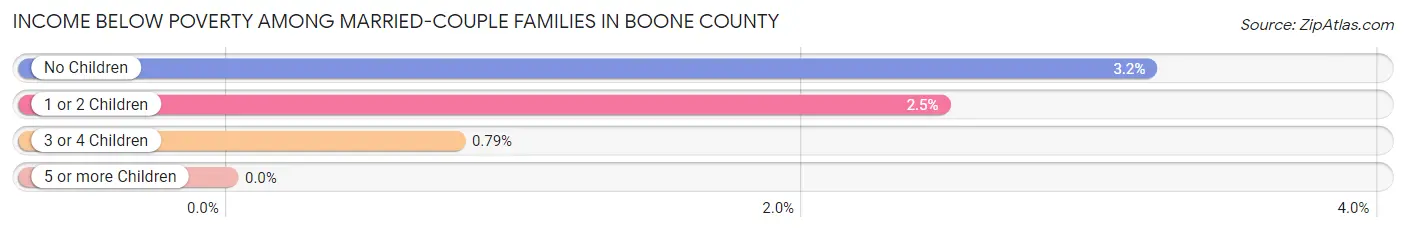
| Children | Above Poverty | Below Poverty |
| No Children | 8,579 (96.8%) | 284 (3.2%) |
| 1 or 2 Children | 5,948 (97.5%) | 151 (2.5%) |
| 3 or 4 Children | 1,752 (99.2%) | 14 (0.8%) |
| 5 or more Children | 70 (100.0%) | 0 (0.0%) |
| Total | 16,349 (97.3%) | 449 (2.7%) |
Income Below Poverty Among Single-Parent Households in Boone County
According to the poverty data in Boone County, 16.7% or 113 single-father households and 19.4% or 442 single-mother households are living below the poverty line. Among single-father households, those with no children have the highest poverty rate, with 51 households (23.0%) experiencing poverty. Likewise, among single-mother households, those with 3 or 4 children have the highest poverty rate, with 36 households (43.9%) falling below the poverty line.
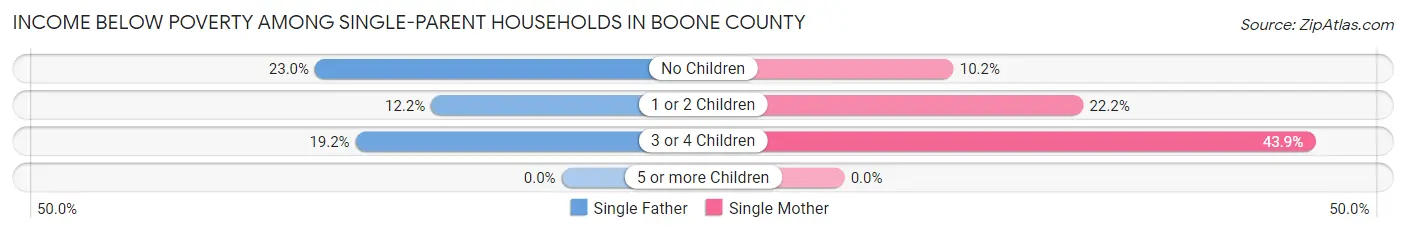
| Children | Single Father | Single Mother |
| No Children | 51 (23.0%) | 69 (10.2%) |
| 1 or 2 Children | 43 (12.1%) | 337 (22.2%) |
| 3 or 4 Children | 19 (19.2%) | 36 (43.9%) |
| 5 or more Children | 0 (0.0%) | 0 (0.0%) |
| Total | 113 (16.7%) | 442 (19.4%) |
Income Below Poverty Among Married-Couple vs Single-Parent Households in Boone County
The poverty data for Boone County shows that 449 of the married-couple family households (2.7%) and 555 of the single-parent households (18.8%) are living below the poverty level. Within the married-couple family households, those with no children have the highest poverty rate, with 284 households (3.2%) falling below the poverty line. Among the single-parent households, those with 3 or 4 children have the highest poverty rate, with 55 household (30.4%) living below poverty.
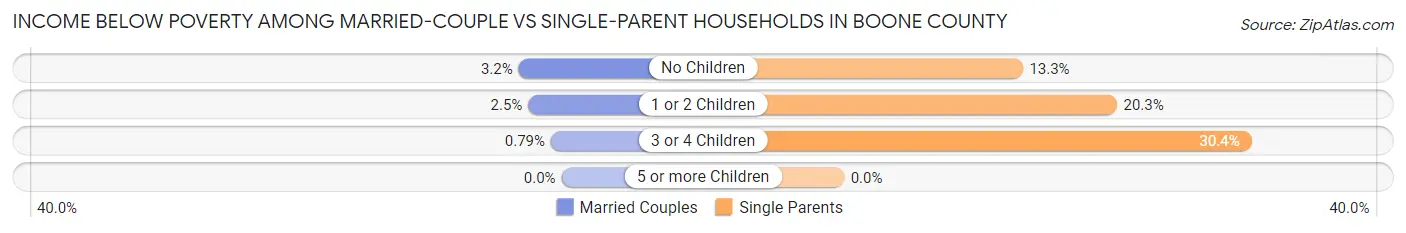
| Children | Married-Couple Families | Single-Parent Households |
| No Children | 284 (3.2%) | 120 (13.3%) |
| 1 or 2 Children | 151 (2.5%) | 380 (20.3%) |
| 3 or 4 Children | 14 (0.8%) | 55 (30.4%) |
| 5 or more Children | 0 (0.0%) | 0 (0.0%) |
| Total | 449 (2.7%) | 555 (18.8%) |
Employment Characteristics in Boone County
Employment by Class of Employer in Boone County
Among the 36,583 employed individuals in Boone County, private company employees (24,946 | 68.2%), not-for-profit organizations (4,212 | 11.5%), and local government employees (2,079 | 5.7%) make up the most common classes of employment.
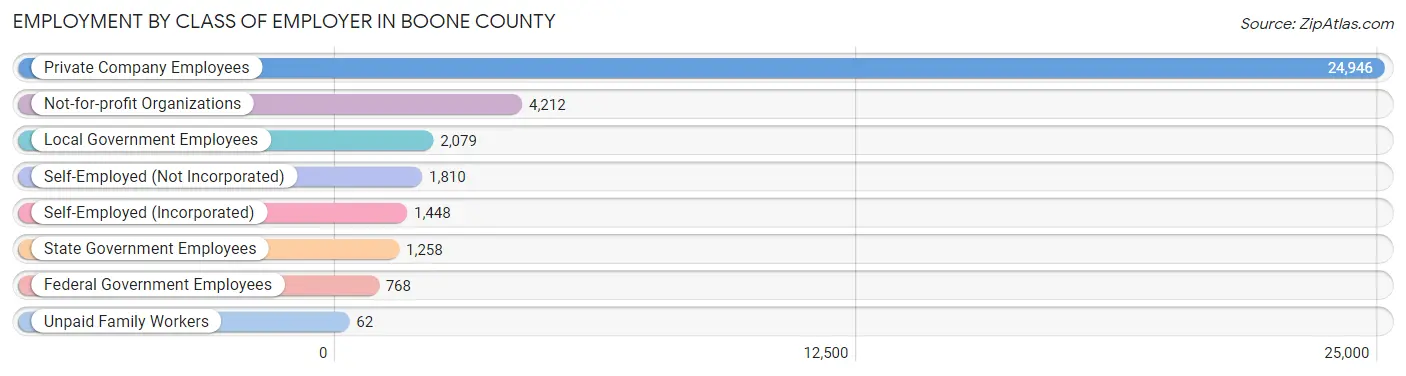
| Employer Class | # Employees | % Employees |
| Private Company Employees | 24,946 | 68.2% |
| Self-Employed (Incorporated) | 1,448 | 4.0% |
| Self-Employed (Not Incorporated) | 1,810 | 5.0% |
| Not-for-profit Organizations | 4,212 | 11.5% |
| Local Government Employees | 2,079 | 5.7% |
| State Government Employees | 1,258 | 3.4% |
| Federal Government Employees | 768 | 2.1% |
| Unpaid Family Workers | 62 | 0.2% |
| Total | 36,583 | 100.0% |
Employment Status by Age in Boone County
According to the labor force statistics for Boone County, out of the total population over 16 years of age (54,868), 69.6% or 38,188 individuals are in the labor force, with 3.1% or 1,184 of them unemployed. The age group with the highest labor force participation rate is 30 to 34 years, with 90.4% or 4,098 individuals in the labor force. Within the labor force, the 20 to 24 years age range has the highest percentage of unemployed individuals, with 6.4% or 216 of them being unemployed.
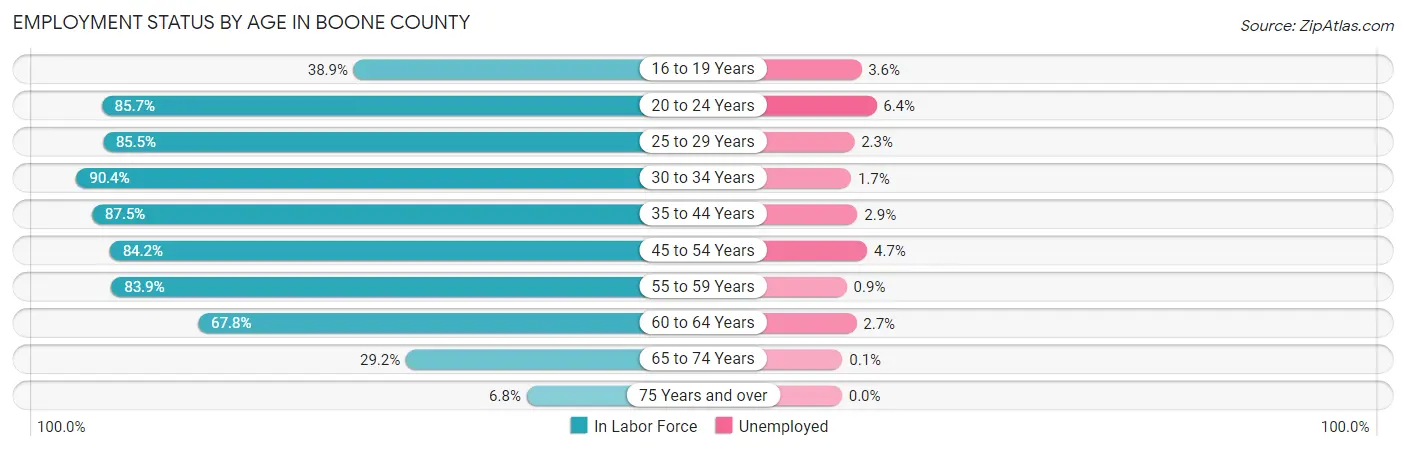
| Age Bracket | In Labor Force | Unemployed |
| 16 to 19 Years | 1,349 (38.9%) | 49 (3.6%) |
| 20 to 24 Years | 3,379 (85.7%) | 216 (6.4%) |
| 25 to 29 Years | 3,334 (85.5%) | 77 (2.3%) |
| 30 to 34 Years | 4,098 (90.4%) | 70 (1.7%) |
| 35 to 44 Years | 8,843 (87.5%) | 256 (2.9%) |
| 45 to 54 Years | 8,297 (84.2%) | 390 (4.7%) |
| 55 to 59 Years | 3,968 (83.9%) | 36 (0.9%) |
| 60 to 64 Years | 2,914 (67.8%) | 79 (2.7%) |
| 65 to 74 Years | 1,733 (29.2%) | 2 (0.1%) |
| 75 Years and over | 279 (6.8%) | 0 (0.0%) |
| Total | 38,188 (69.6%) | 1,184 (3.1%) |
Employment Status by Educational Attainment in Boone County
According to labor force statistics for Boone County, 84.1% of individuals (31,471) out of the total population between 25 and 64 years of age (37,421) are in the labor force, with 2.9% or 913 of them being unemployed. The group with the highest labor force participation rate are those with the educational attainment of bachelor's degree or higher, with 88.5% or 17,543 individuals in the labor force. Within the labor force, individuals with less than high school education have the highest percentage of unemployment, with 19.7% or 231 of them being unemployed.
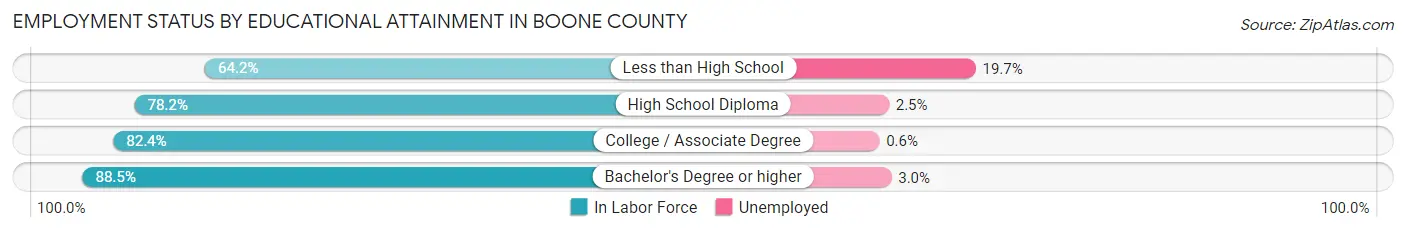
| Educational Attainment | In Labor Force | Unemployed |
| Less than High School | 1,172 (64.2%) | 360 (19.7%) |
| High School Diploma | 4,792 (78.2%) | 153 (2.5%) |
| College / Associate Degree | 7,947 (82.4%) | 58 (0.6%) |
| Bachelor's Degree or higher | 17,543 (88.5%) | 595 (3.0%) |
| Total | 31,471 (84.1%) | 1,085 (2.9%) |
Employment Occupations by Sex in Boone County
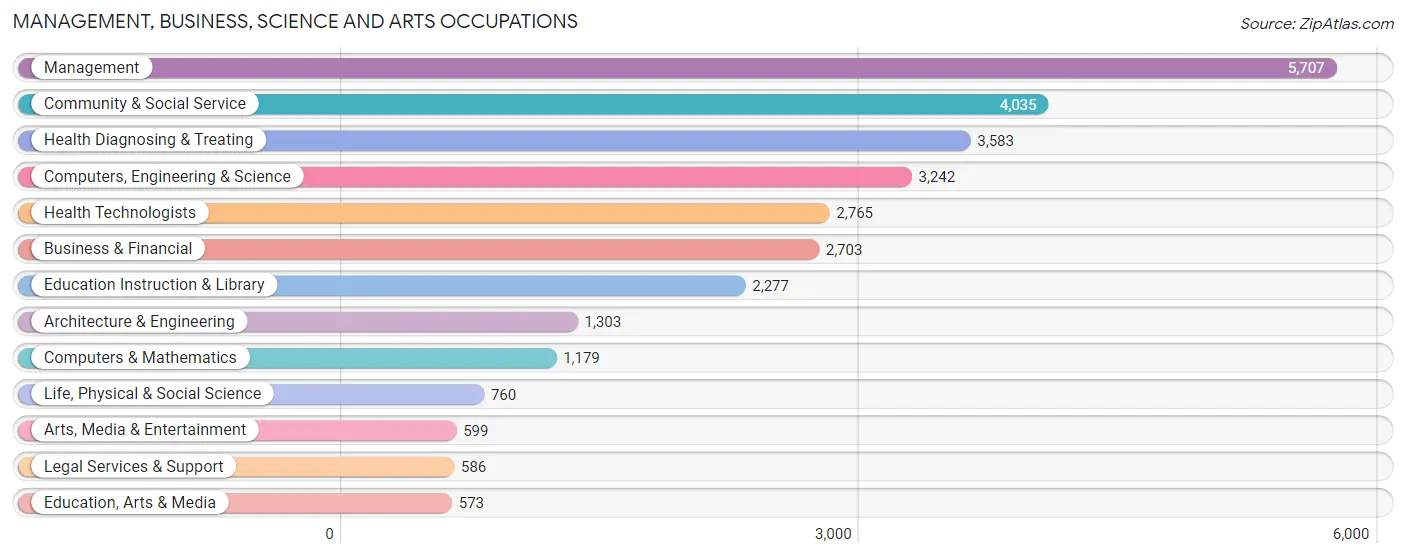
Management, Business, Science and Arts Occupations
The most common Management, Business, Science and Arts occupations in Boone County are Management (5,707 | 15.4%), Community & Social Service (4,035 | 10.9%), Health Diagnosing & Treating (3,583 | 9.7%), Computers, Engineering & Science (3,242 | 8.8%), and Health Technologists (2,765 | 7.5%).
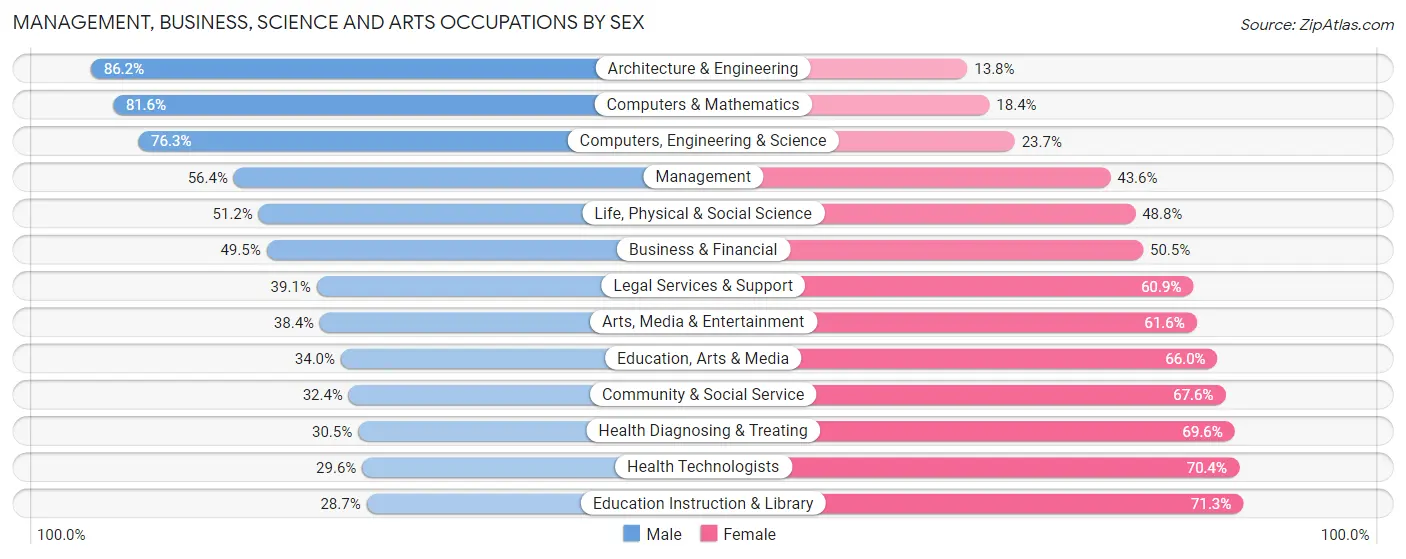
Management, Business, Science and Arts Occupations by Sex
Within the Management, Business, Science and Arts occupations in Boone County, the most male-oriented occupations are Architecture & Engineering (86.2%), Computers & Mathematics (81.6%), and Computers, Engineering & Science (76.3%), while the most female-oriented occupations are Education Instruction & Library (71.3%), Health Technologists (70.4%), and Health Diagnosing & Treating (69.6%).
| Occupation | Male | Female |
| Management | 3,217 (56.4%) | 2,490 (43.6%) |
| Business & Financial | 1,339 (49.5%) | 1,364 (50.5%) |
| Computers, Engineering & Science | 2,474 (76.3%) | 768 (23.7%) |
| Computers & Mathematics | 962 (81.6%) | 217 (18.4%) |
| Architecture & Engineering | 1,123 (86.2%) | 180 (13.8%) |
| Life, Physical & Social Science | 389 (51.2%) | 371 (48.8%) |
| Community & Social Service | 1,307 (32.4%) | 2,728 (67.6%) |
| Education, Arts & Media | 195 (34.0%) | 378 (66.0%) |
| Legal Services & Support | 229 (39.1%) | 357 (60.9%) |
| Education Instruction & Library | 653 (28.7%) | 1,624 (71.3%) |
| Arts, Media & Entertainment | 230 (38.4%) | 369 (61.6%) |
| Health Diagnosing & Treating | 1,091 (30.4%) | 2,492 (69.6%) |
| Health Technologists | 818 (29.6%) | 1,947 (70.4%) |
| Total (Category) | 9,428 (48.9%) | 9,842 (51.1%) |
| Total (Overall) | 20,147 (54.5%) | 16,805 (45.5%) |
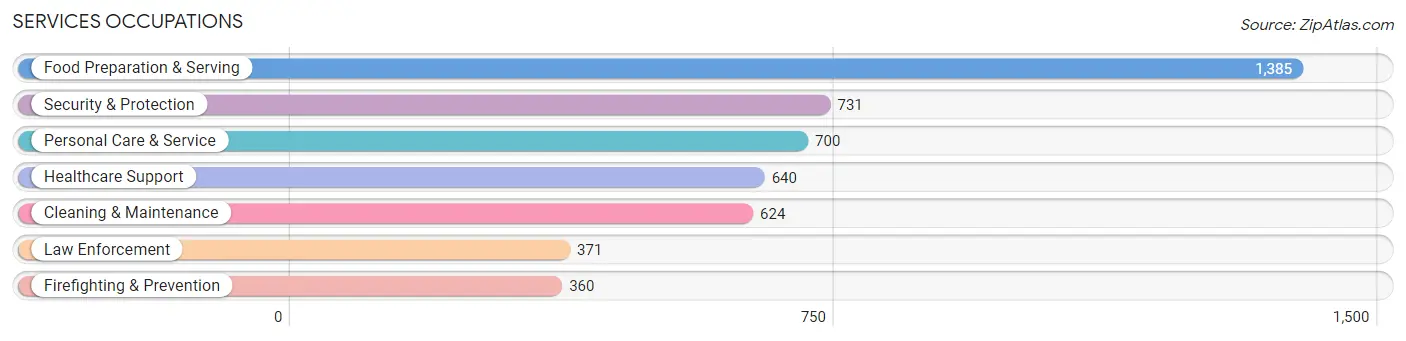
Services Occupations
The most common Services occupations in Boone County are Food Preparation & Serving (1,385 | 3.7%), Security & Protection (731 | 2.0%), Personal Care & Service (700 | 1.9%), Healthcare Support (640 | 1.7%), and Cleaning & Maintenance (624 | 1.7%).
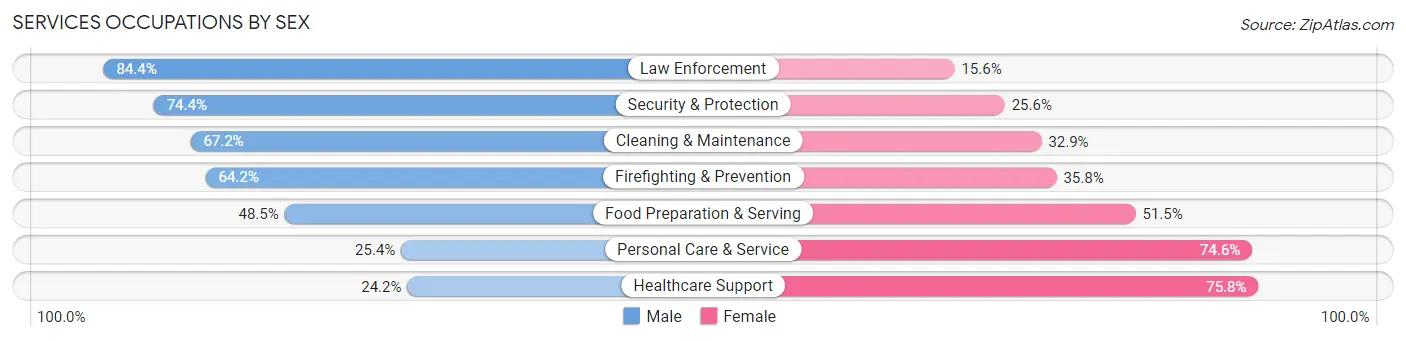
Services Occupations by Sex
Within the Services occupations in Boone County, the most male-oriented occupations are Law Enforcement (84.4%), Security & Protection (74.4%), and Cleaning & Maintenance (67.1%), while the most female-oriented occupations are Healthcare Support (75.8%), Personal Care & Service (74.6%), and Food Preparation & Serving (51.5%).
| Occupation | Male | Female |
| Healthcare Support | 155 (24.2%) | 485 (75.8%) |
| Security & Protection | 544 (74.4%) | 187 (25.6%) |
| Firefighting & Prevention | 231 (64.2%) | 129 (35.8%) |
| Law Enforcement | 313 (84.4%) | 58 (15.6%) |
| Food Preparation & Serving | 672 (48.5%) | 713 (51.5%) |
| Cleaning & Maintenance | 419 (67.1%) | 205 (32.9%) |
| Personal Care & Service | 178 (25.4%) | 522 (74.6%) |
| Total (Category) | 1,968 (48.2%) | 2,112 (51.8%) |
| Total (Overall) | 20,147 (54.5%) | 16,805 (45.5%) |
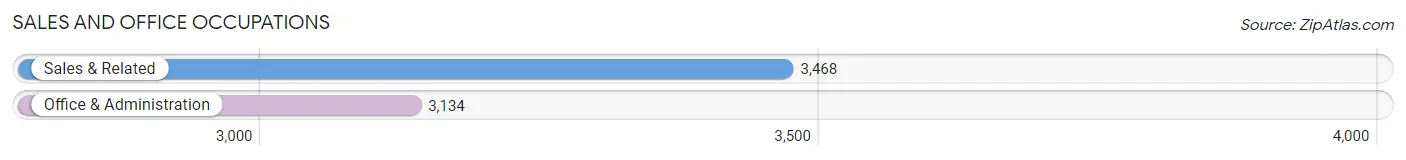
Sales and Office Occupations
The most common Sales and Office occupations in Boone County are Sales & Related (3,468 | 9.4%), and Office & Administration (3,134 | 8.5%).
Sales and Office Occupations by Sex
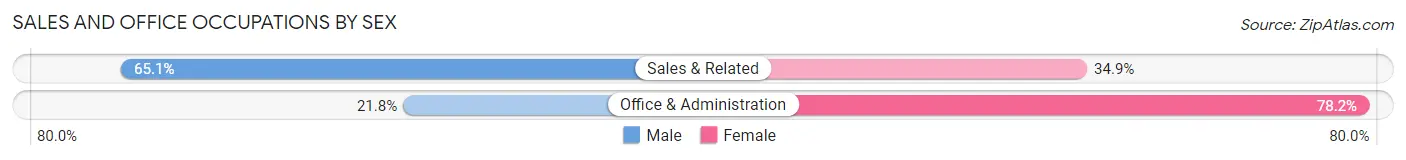
| Occupation | Male | Female |
| Sales & Related | 2,259 (65.1%) | 1,209 (34.9%) |
| Office & Administration | 683 (21.8%) | 2,451 (78.2%) |
| Total (Category) | 2,942 (44.6%) | 3,660 (55.4%) |
| Total (Overall) | 20,147 (54.5%) | 16,805 (45.5%) |
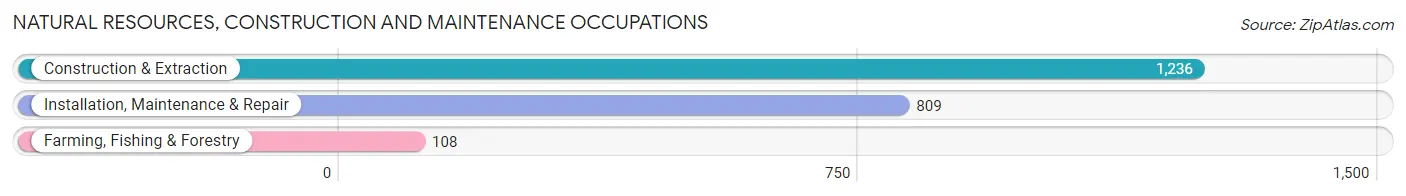
Natural Resources, Construction and Maintenance Occupations
The most common Natural Resources, Construction and Maintenance occupations in Boone County are Construction & Extraction (1,236 | 3.3%), Installation, Maintenance & Repair (809 | 2.2%), and Farming, Fishing & Forestry (108 | 0.3%).
Natural Resources, Construction and Maintenance Occupations by Sex
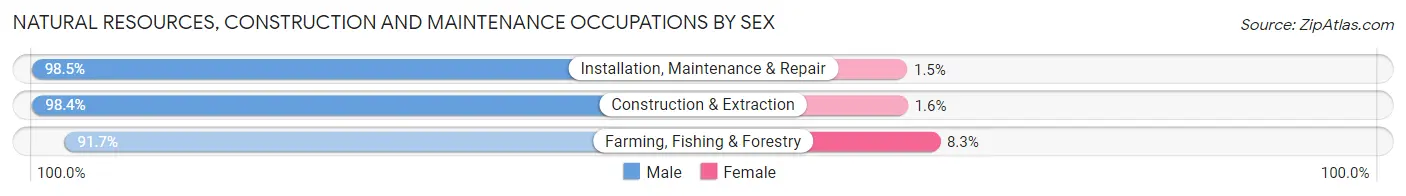
| Occupation | Male | Female |
| Farming, Fishing & Forestry | 99 (91.7%) | 9 (8.3%) |
| Construction & Extraction | 1,216 (98.4%) | 20 (1.6%) |
| Installation, Maintenance & Repair | 797 (98.5%) | 12 (1.5%) |
| Total (Category) | 2,112 (98.1%) | 41 (1.9%) |
| Total (Overall) | 20,147 (54.5%) | 16,805 (45.5%) |
Production, Transportation and Moving Occupations
The most common Production, Transportation and Moving occupations in Boone County are Production (1,751 | 4.7%), Material Moving (1,567 | 4.2%), and Transportation (1,529 | 4.1%).
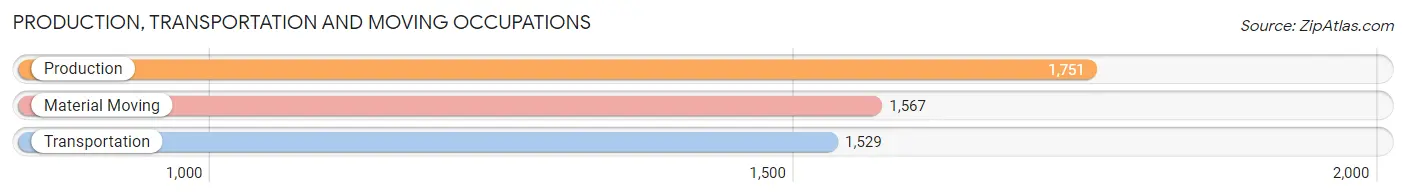
Production, Transportation and Moving Occupations by Sex

| Occupation | Male | Female |
| Production | 1,349 (77.0%) | 402 (23.0%) |
| Transportation | 1,201 (78.5%) | 328 (21.4%) |
| Material Moving | 1,147 (73.2%) | 420 (26.8%) |
| Total (Category) | 3,697 (76.3%) | 1,150 (23.7%) |
| Total (Overall) | 20,147 (54.5%) | 16,805 (45.5%) |
Employment Industries by Sex in Boone County
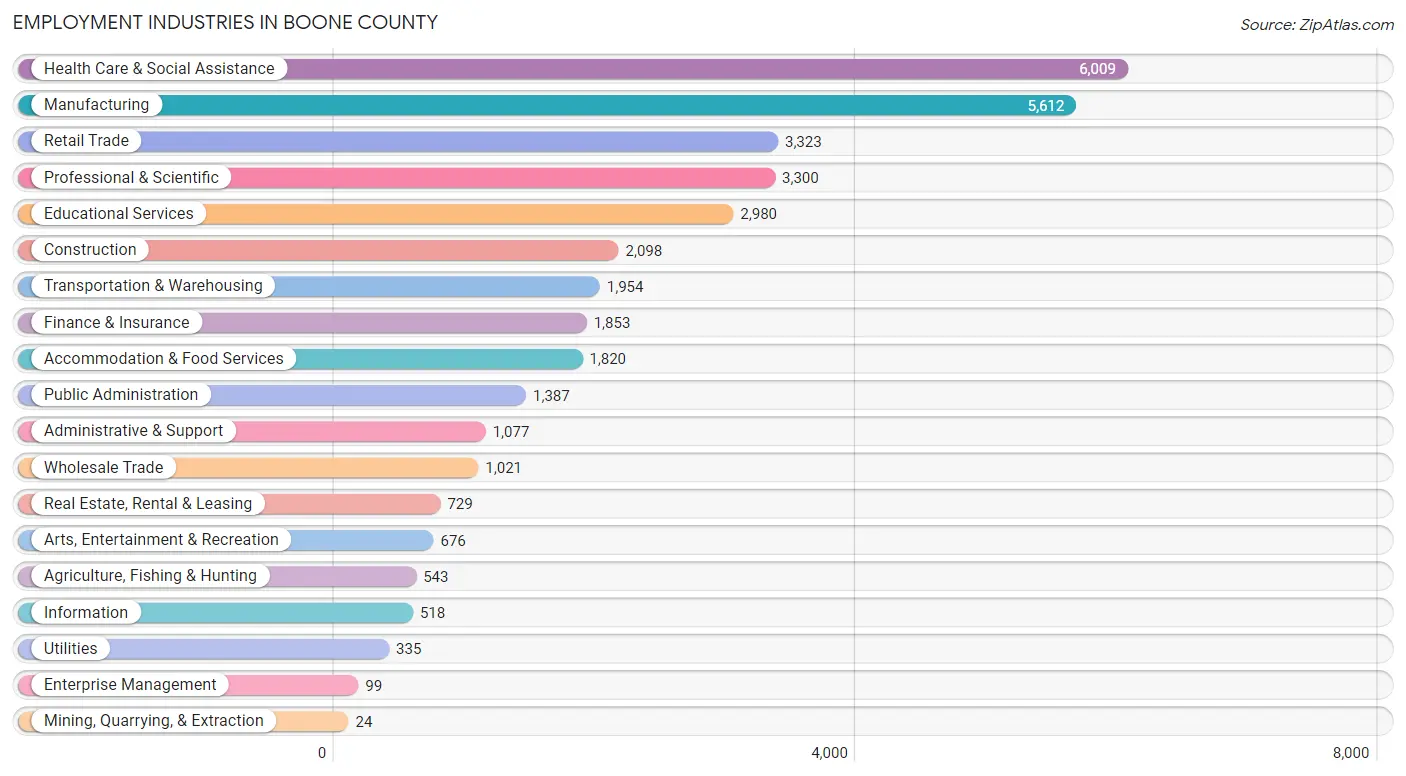
Employment Industries in Boone County
The major employment industries in Boone County include Health Care & Social Assistance (6,009 | 16.3%), Manufacturing (5,612 | 15.2%), Retail Trade (3,323 | 9.0%), Professional & Scientific (3,300 | 8.9%), and Educational Services (2,980 | 8.1%).
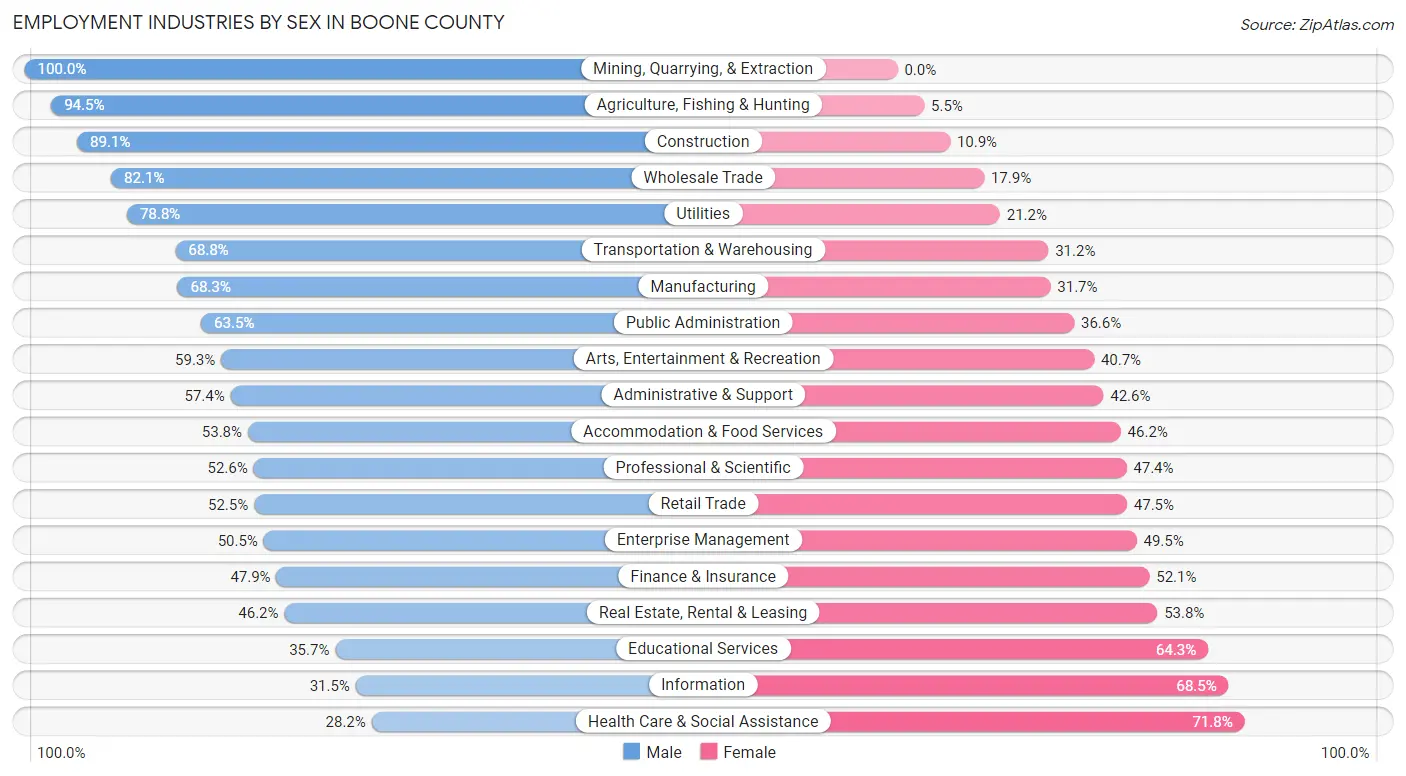
Employment Industries by Sex in Boone County
The Boone County industries that see more men than women are Mining, Quarrying, & Extraction (100.0%), Agriculture, Fishing & Hunting (94.5%), and Construction (89.1%), whereas the industries that tend to have a higher number of women are Health Care & Social Assistance (71.8%), Information (68.5%), and Educational Services (64.3%).
| Industry | Male | Female |
| Agriculture, Fishing & Hunting | 513 (94.5%) | 30 (5.5%) |
| Mining, Quarrying, & Extraction | 24 (100.0%) | 0 (0.0%) |
| Construction | 1,870 (89.1%) | 228 (10.9%) |
| Manufacturing | 3,835 (68.3%) | 1,777 (31.7%) |
| Wholesale Trade | 838 (82.1%) | 183 (17.9%) |
| Retail Trade | 1,745 (52.5%) | 1,578 (47.5%) |
| Transportation & Warehousing | 1,344 (68.8%) | 610 (31.2%) |
| Utilities | 264 (78.8%) | 71 (21.2%) |
| Information | 163 (31.5%) | 355 (68.5%) |
| Finance & Insurance | 887 (47.9%) | 966 (52.1%) |
| Real Estate, Rental & Leasing | 337 (46.2%) | 392 (53.8%) |
| Professional & Scientific | 1,736 (52.6%) | 1,564 (47.4%) |
| Enterprise Management | 50 (50.5%) | 49 (49.5%) |
| Administrative & Support | 618 (57.4%) | 459 (42.6%) |
| Educational Services | 1,064 (35.7%) | 1,916 (64.3%) |
| Health Care & Social Assistance | 1,693 (28.2%) | 4,316 (71.8%) |
| Arts, Entertainment & Recreation | 401 (59.3%) | 275 (40.7%) |
| Accommodation & Food Services | 979 (53.8%) | 841 (46.2%) |
| Public Administration | 880 (63.4%) | 507 (36.5%) |
| Total | 20,147 (54.5%) | 16,805 (45.5%) |
Education in Boone County
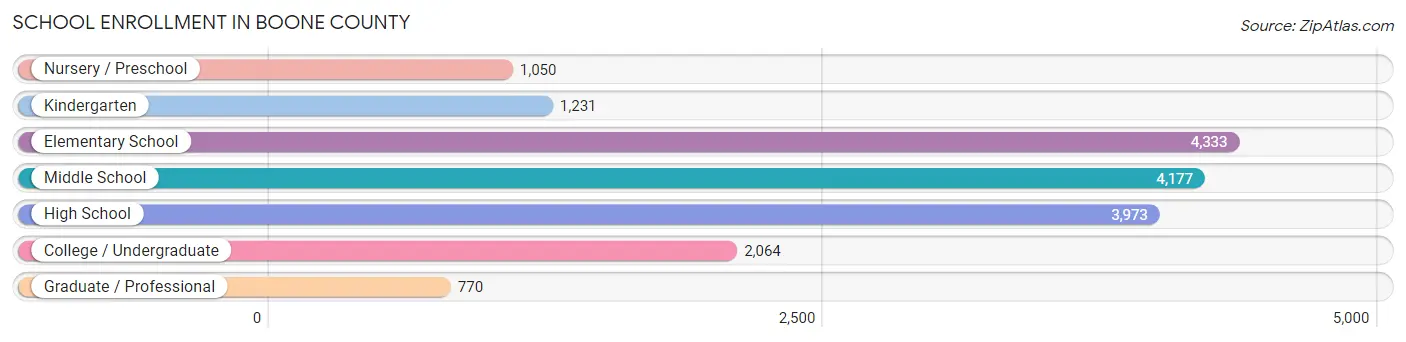
School Enrollment in Boone County
The most common levels of schooling among the 17,598 students in Boone County are elementary school (4,333 | 24.6%), middle school (4,177 | 23.7%), and high school (3,973 | 22.6%).
| School Level | # Students | % Students |
| Nursery / Preschool | 1,050 | 6.0% |
| Kindergarten | 1,231 | 7.0% |
| Elementary School | 4,333 | 24.6% |
| Middle School | 4,177 | 23.7% |
| High School | 3,973 | 22.6% |
| College / Undergraduate | 2,064 | 11.7% |
| Graduate / Professional | 770 | 4.4% |
| Total | 17,598 | 100.0% |
School Enrollment by Age by Funding Source in Boone County
Out of a total of 17,598 students who are enrolled in schools in Boone County, 2,253 (12.8%) attend a private institution, while the remaining 15,345 (87.2%) are enrolled in public schools. The age group of 3 to 4 year olds has the highest likelihood of being enrolled in private schools, with 296 (46.7% in the age bracket) enrolled. Conversely, the age group of 15 to 17 year olds has the lowest likelihood of being enrolled in a private school, with 2,934 (92.0% in the age bracket) attending a public institution.
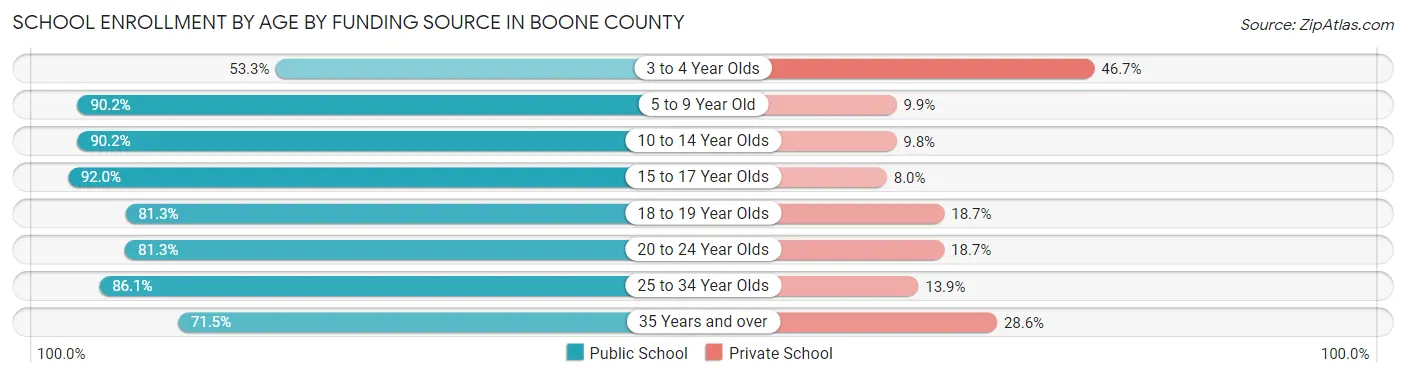
| Age Bracket | Public School | Private School |
| 3 to 4 Year Olds | 338 (53.3%) | 296 (46.7%) |
| 5 to 9 Year Old | 4,603 (90.1%) | 503 (9.9%) |
| 10 to 14 Year Olds | 4,746 (90.2%) | 516 (9.8%) |
| 15 to 17 Year Olds | 2,934 (92.0%) | 256 (8.0%) |
| 18 to 19 Year Olds | 867 (81.3%) | 200 (18.7%) |
| 20 to 24 Year Olds | 769 (81.3%) | 177 (18.7%) |
| 25 to 34 Year Olds | 545 (86.1%) | 88 (13.9%) |
| 35 Years and over | 543 (71.5%) | 217 (28.5%) |
| Total | 15,345 (87.2%) | 2,253 (12.8%) |
Educational Attainment by Field of Study in Boone County
Business (6,344 | 25.3%), science & technology (3,787 | 15.1%), bio, nature & agricultural (2,571 | 10.2%), education (2,544 | 10.1%), and engineering (1,981 | 7.9%) are the most common fields of study among 25,108 individuals in Boone County who have obtained a bachelor's degree or higher.
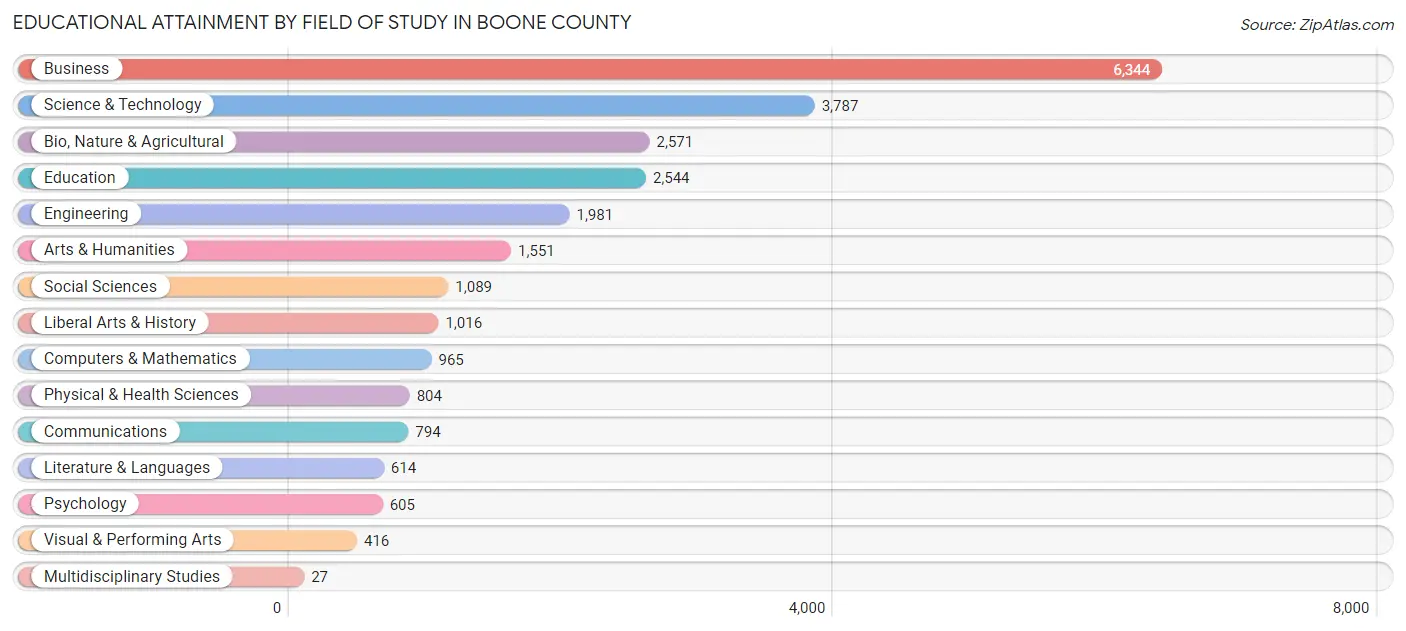
| Field of Study | # Graduates | % Graduates |
| Computers & Mathematics | 965 | 3.8% |
| Bio, Nature & Agricultural | 2,571 | 10.2% |
| Physical & Health Sciences | 804 | 3.2% |
| Psychology | 605 | 2.4% |
| Social Sciences | 1,089 | 4.3% |
| Engineering | 1,981 | 7.9% |
| Multidisciplinary Studies | 27 | 0.1% |
| Science & Technology | 3,787 | 15.1% |
| Business | 6,344 | 25.3% |
| Education | 2,544 | 10.1% |
| Literature & Languages | 614 | 2.5% |
| Liberal Arts & History | 1,016 | 4.1% |
| Visual & Performing Arts | 416 | 1.7% |
| Communications | 794 | 3.2% |
| Arts & Humanities | 1,551 | 6.2% |
| Total | 25,108 | 100.0% |
Transportation & Commute in Boone County
Vehicle Availability by Sex in Boone County
The most prevalent vehicle ownership categories in Boone County are males with 2 vehicles (9,532, accounting for 47.4%) and females with 2 vehicles (7,778, making up 57.9%).
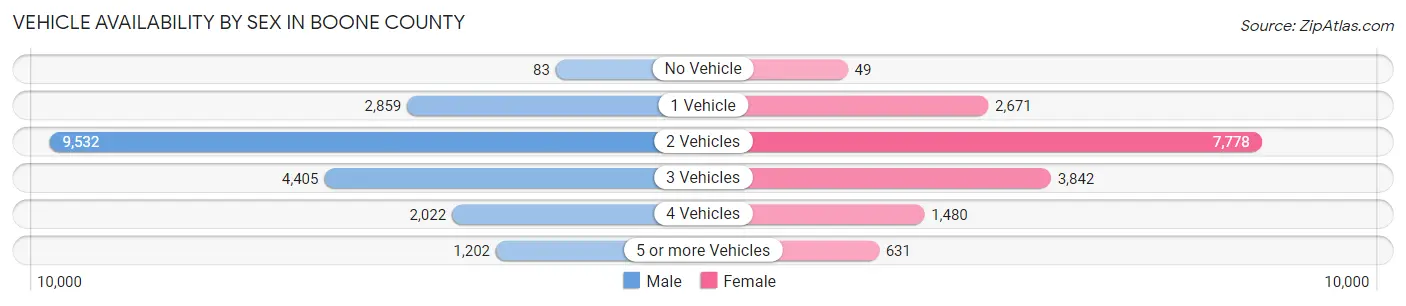
| Vehicles Available | Male | Female |
| No Vehicle | 83 (0.4%) | 49 (0.3%) |
| 1 Vehicle | 2,859 (14.2%) | 2,671 (16.2%) |
| 2 Vehicles | 9,532 (47.4%) | 7,778 (47.3%) |
| 3 Vehicles | 4,405 (21.9%) | 3,842 (23.4%) |
| 4 Vehicles | 2,022 (10.1%) | 1,480 (9.0%) |
| 5 or more Vehicles | 1,202 (6.0%) | 631 (3.8%) |
| Total | 20,103 (100.0%) | 16,451 (100.0%) |
Commute Time in Boone County
The most frequently occuring commute durations in Boone County are 30 to 34 minutes (4,866 commuters, 16.1%), 20 to 24 minutes (4,008 commuters, 13.2%), and 5 to 9 minutes (3,909 commuters, 12.9%).
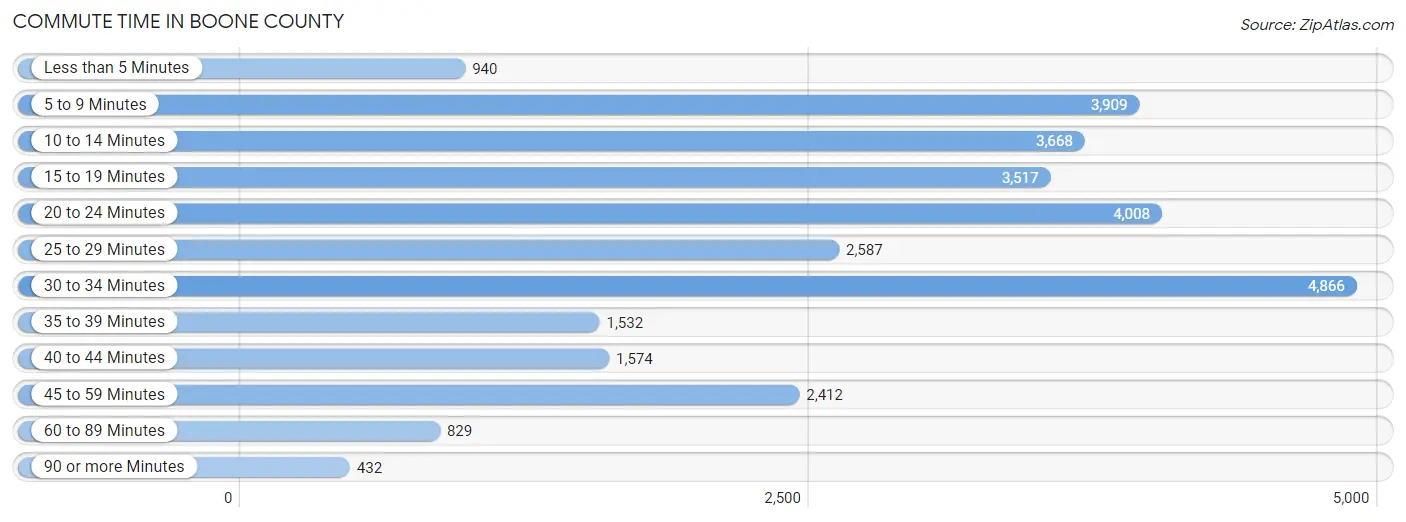
| Commute Time | # Commuters | % Commuters |
| Less than 5 Minutes | 940 | 3.1% |
| 5 to 9 Minutes | 3,909 | 12.9% |
| 10 to 14 Minutes | 3,668 | 12.1% |
| 15 to 19 Minutes | 3,517 | 11.6% |
| 20 to 24 Minutes | 4,008 | 13.2% |
| 25 to 29 Minutes | 2,587 | 8.6% |
| 30 to 34 Minutes | 4,866 | 16.1% |
| 35 to 39 Minutes | 1,532 | 5.1% |
| 40 to 44 Minutes | 1,574 | 5.2% |
| 45 to 59 Minutes | 2,412 | 8.0% |
| 60 to 89 Minutes | 829 | 2.7% |
| 90 or more Minutes | 432 | 1.4% |
Commute Time by Sex in Boone County
The most common commute times in Boone County are 30 to 34 minutes (2,571 commuters, 15.1%) for males and 30 to 34 minutes (2,295 commuters, 17.3%) for females.
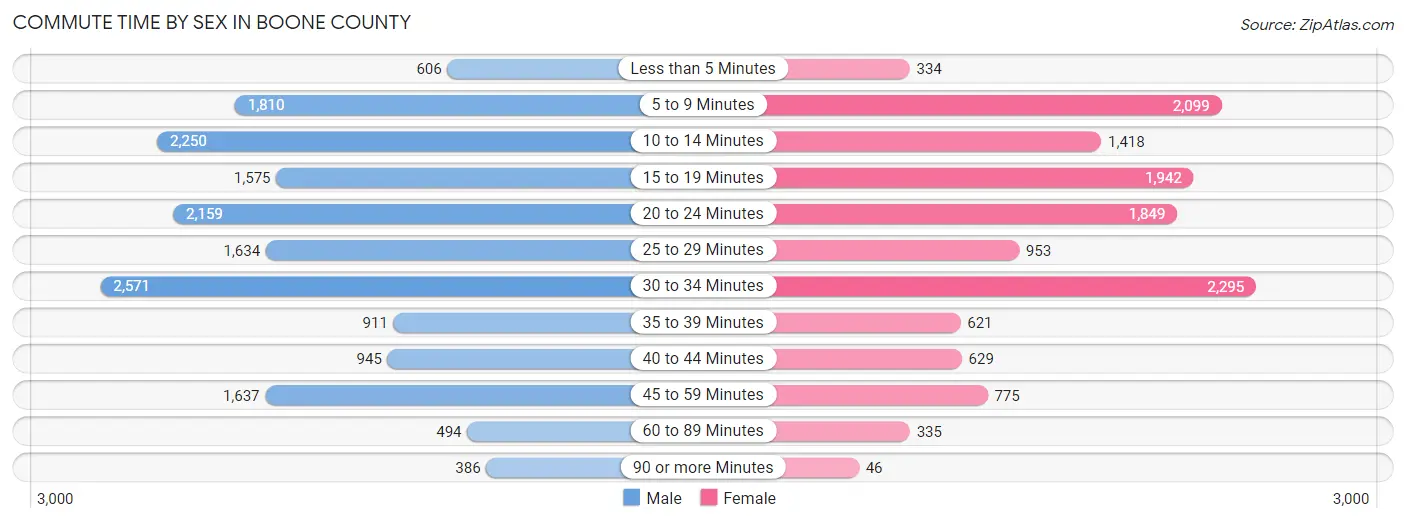
| Commute Time | Male | Female |
| Less than 5 Minutes | 606 (3.6%) | 334 (2.5%) |
| 5 to 9 Minutes | 1,810 (10.7%) | 2,099 (15.8%) |
| 10 to 14 Minutes | 2,250 (13.3%) | 1,418 (10.7%) |
| 15 to 19 Minutes | 1,575 (9.3%) | 1,942 (14.6%) |
| 20 to 24 Minutes | 2,159 (12.7%) | 1,849 (13.9%) |
| 25 to 29 Minutes | 1,634 (9.6%) | 953 (7.2%) |
| 30 to 34 Minutes | 2,571 (15.1%) | 2,295 (17.3%) |
| 35 to 39 Minutes | 911 (5.4%) | 621 (4.7%) |
| 40 to 44 Minutes | 945 (5.6%) | 629 (4.7%) |
| 45 to 59 Minutes | 1,637 (9.6%) | 775 (5.8%) |
| 60 to 89 Minutes | 494 (2.9%) | 335 (2.5%) |
| 90 or more Minutes | 386 (2.3%) | 46 (0.4%) |
Time of Departure to Work by Sex in Boone County
The most frequent times of departure to work in Boone County are 7:00 AM to 7:29 AM (2,977, 17.5%) for males and 7:00 AM to 7:29 AM (2,001, 15.0%) for females.
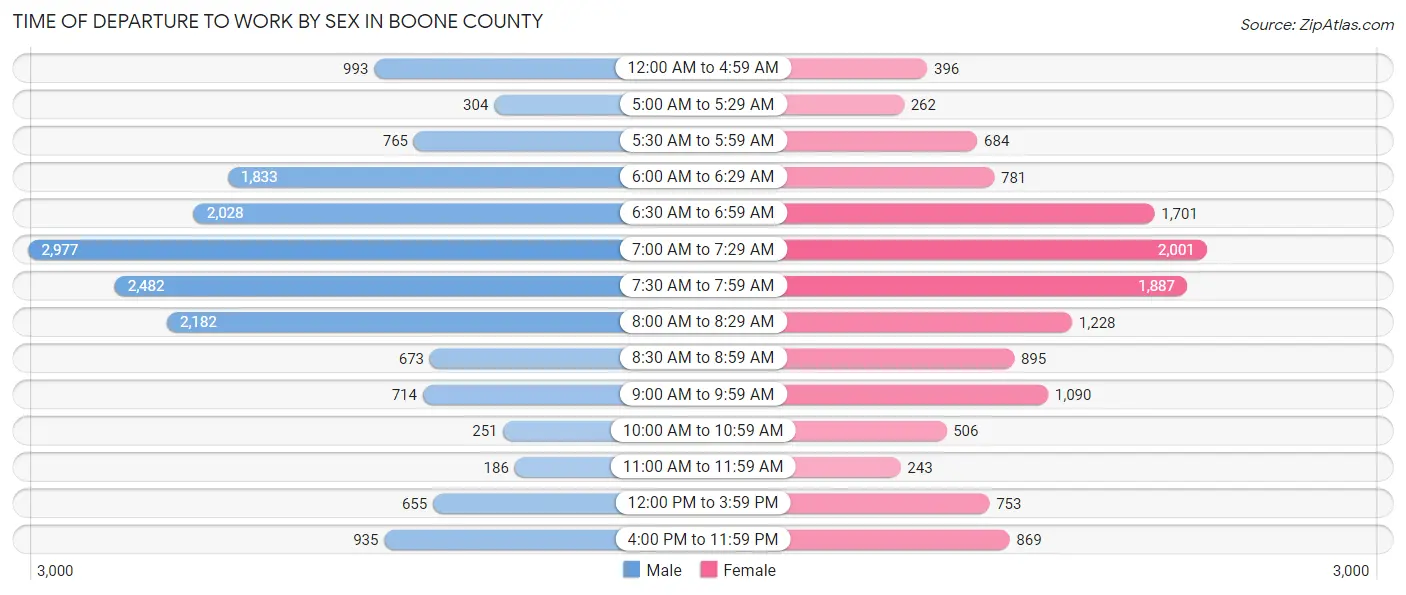
| Time of Departure | Male | Female |
| 12:00 AM to 4:59 AM | 993 (5.9%) | 396 (3.0%) |
| 5:00 AM to 5:29 AM | 304 (1.8%) | 262 (2.0%) |
| 5:30 AM to 5:59 AM | 765 (4.5%) | 684 (5.1%) |
| 6:00 AM to 6:29 AM | 1,833 (10.8%) | 781 (5.9%) |
| 6:30 AM to 6:59 AM | 2,028 (11.9%) | 1,701 (12.8%) |
| 7:00 AM to 7:29 AM | 2,977 (17.5%) | 2,001 (15.0%) |
| 7:30 AM to 7:59 AM | 2,482 (14.6%) | 1,887 (14.2%) |
| 8:00 AM to 8:29 AM | 2,182 (12.9%) | 1,228 (9.2%) |
| 8:30 AM to 8:59 AM | 673 (4.0%) | 895 (6.7%) |
| 9:00 AM to 9:59 AM | 714 (4.2%) | 1,090 (8.2%) |
| 10:00 AM to 10:59 AM | 251 (1.5%) | 506 (3.8%) |
| 11:00 AM to 11:59 AM | 186 (1.1%) | 243 (1.8%) |
| 12:00 PM to 3:59 PM | 655 (3.9%) | 753 (5.7%) |
| 4:00 PM to 11:59 PM | 935 (5.5%) | 869 (6.5%) |
| Total | 16,978 (100.0%) | 13,296 (100.0%) |
Housing Occupancy in Boone County
Occupancy by Ownership in Boone County
Of the total 26,959 dwellings in Boone County, owner-occupied units account for 21,549 (79.9%), while renter-occupied units make up 5,410 (20.1%).
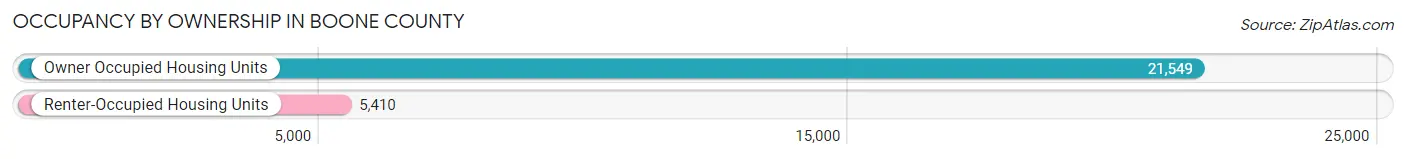
| Occupancy | # Housing Units | % Housing Units |
| Owner Occupied Housing Units | 21,549 | 79.9% |
| Renter-Occupied Housing Units | 5,410 | 20.1% |
| Total Occupied Housing Units | 26,959 | 100.0% |
Occupancy by Household Size in Boone County
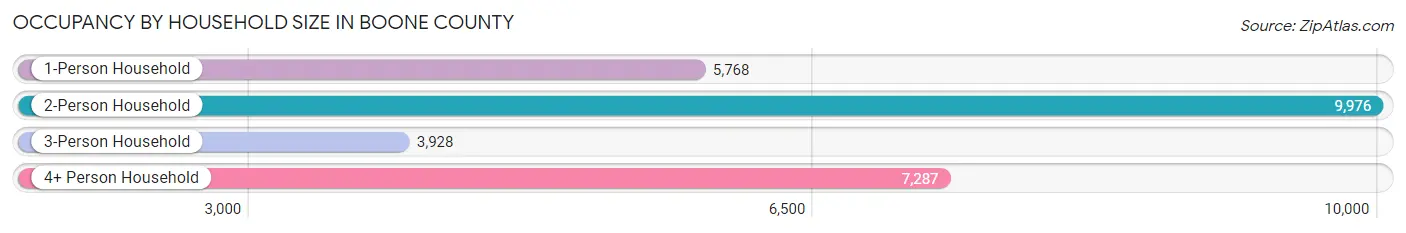
| Household Size | # Housing Units | % Housing Units |
| 1-Person Household | 5,768 | 21.4% |
| 2-Person Household | 9,976 | 37.0% |
| 3-Person Household | 3,928 | 14.6% |
| 4+ Person Household | 7,287 | 27.0% |
| Total Housing Units | 26,959 | 100.0% |
Occupancy by Ownership by Household Size in Boone County
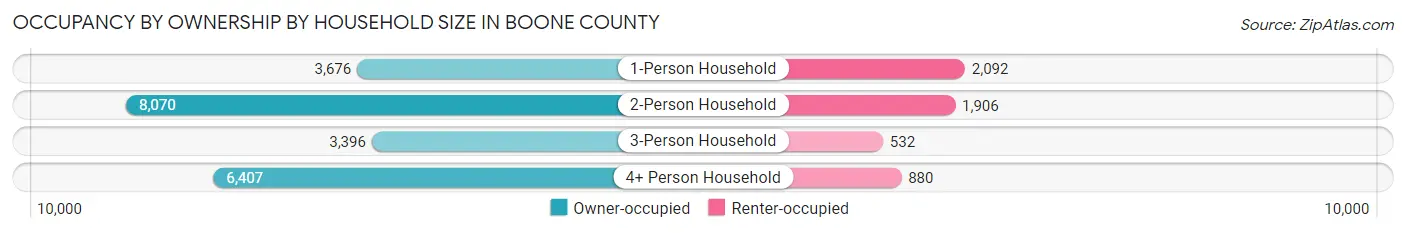
| Household Size | Owner-occupied | Renter-occupied |
| 1-Person Household | 3,676 (63.7%) | 2,092 (36.3%) |
| 2-Person Household | 8,070 (80.9%) | 1,906 (19.1%) |
| 3-Person Household | 3,396 (86.5%) | 532 (13.5%) |
| 4+ Person Household | 6,407 (87.9%) | 880 (12.1%) |
| Total Housing Units | 21,549 (79.9%) | 5,410 (20.1%) |
Occupancy by Educational Attainment in Boone County
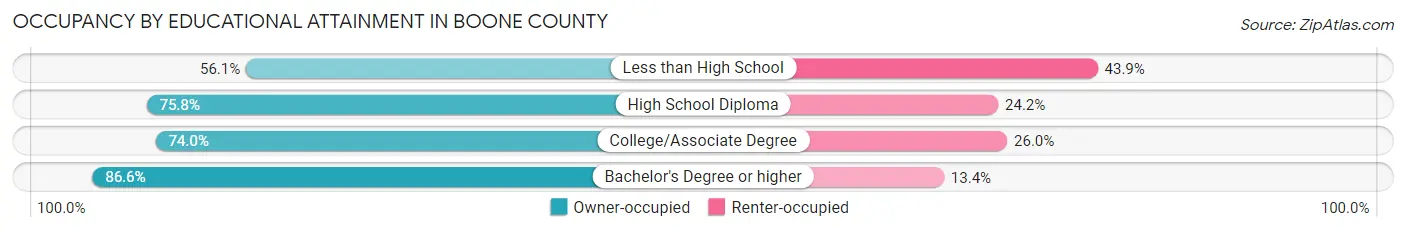
| Household Size | Owner-occupied | Renter-occupied |
| Less than High School | 690 (56.1%) | 540 (43.9%) |
| High School Diploma | 3,602 (75.8%) | 1,149 (24.2%) |
| College/Associate Degree | 5,336 (74.0%) | 1,871 (26.0%) |
| Bachelor's Degree or higher | 11,921 (86.6%) | 1,850 (13.4%) |
Occupancy by Age of Householder in Boone County
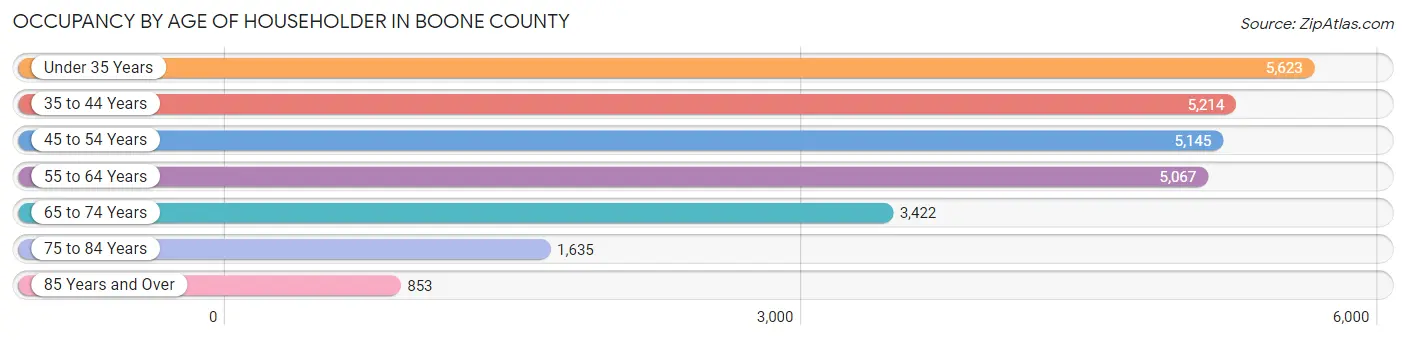
| Age Bracket | # Households | % Households |
| Under 35 Years | 5,623 | 20.9% |
| 35 to 44 Years | 5,214 | 19.3% |
| 45 to 54 Years | 5,145 | 19.1% |
| 55 to 64 Years | 5,067 | 18.8% |
| 65 to 74 Years | 3,422 | 12.7% |
| 75 to 84 Years | 1,635 | 6.1% |
| 85 Years and Over | 853 | 3.2% |
| Total | 26,959 | 100.0% |
Housing Finances in Boone County
Median Income by Occupancy in Boone County
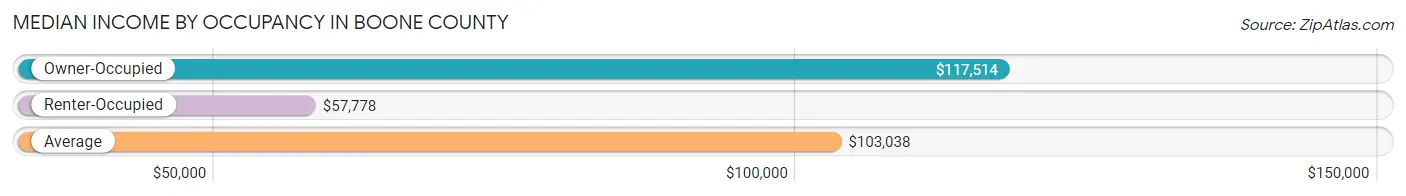
| Occupancy Type | # Households | Median Income |
| Owner-Occupied | 21,549 (79.9%) | $117,514 |
| Renter-Occupied | 5,410 (20.1%) | $57,778 |
| Average | 26,959 (100.0%) | $103,038 |
Occupancy by Householder Income Bracket in Boone County
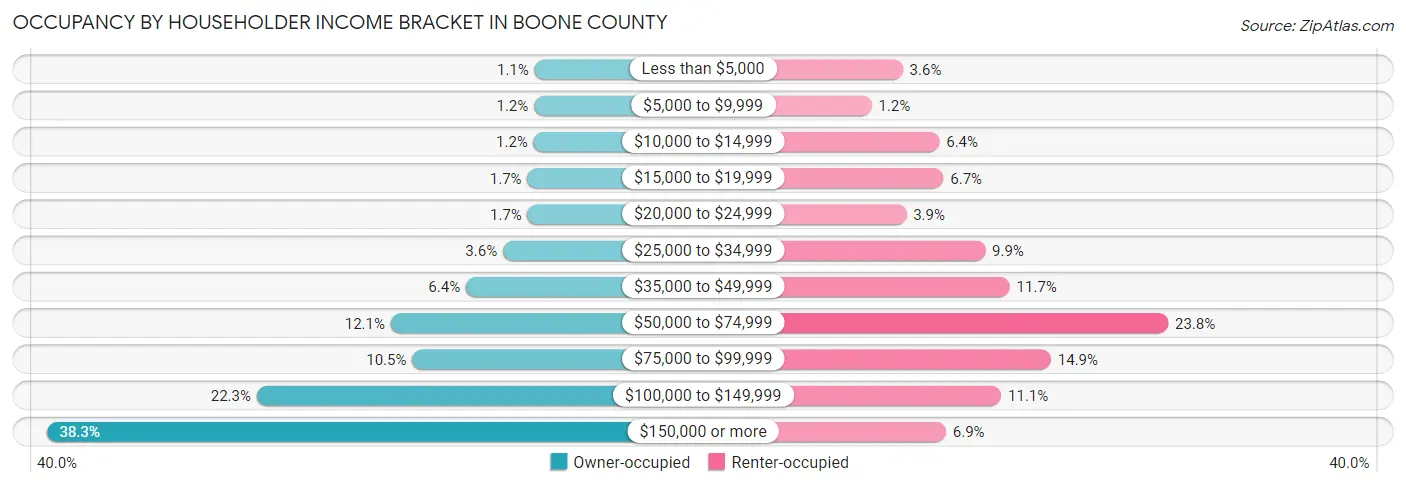
| Income Bracket | Owner-occupied | Renter-occupied |
| Less than $5,000 | 245 (1.1%) | 194 (3.6%) |
| $5,000 to $9,999 | 255 (1.2%) | 66 (1.2%) |
| $10,000 to $14,999 | 261 (1.2%) | 345 (6.4%) |
| $15,000 to $19,999 | 365 (1.7%) | 362 (6.7%) |
| $20,000 to $24,999 | 360 (1.7%) | 209 (3.9%) |
| $25,000 to $34,999 | 764 (3.5%) | 534 (9.9%) |
| $35,000 to $49,999 | 1,372 (6.4%) | 635 (11.7%) |
| $50,000 to $74,999 | 2,608 (12.1%) | 1,288 (23.8%) |
| $75,000 to $99,999 | 2,253 (10.5%) | 805 (14.9%) |
| $100,000 to $149,999 | 4,807 (22.3%) | 600 (11.1%) |
| $150,000 or more | 8,259 (38.3%) | 372 (6.9%) |
| Total | 21,549 (100.0%) | 5,410 (100.0%) |
Monthly Housing Cost Tiers in Boone County
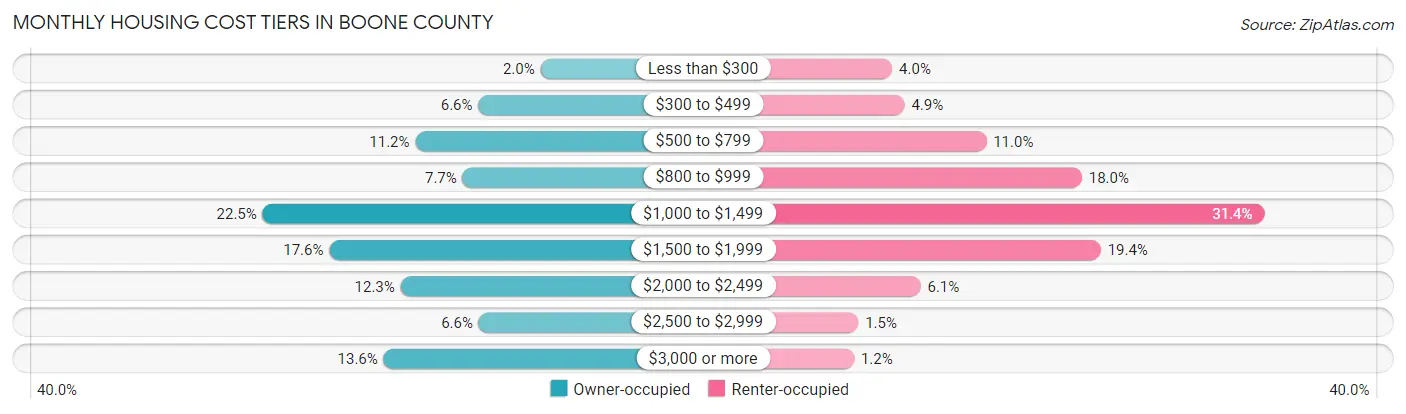
| Monthly Cost | Owner-occupied | Renter-occupied |
| Less than $300 | 432 (2.0%) | 218 (4.0%) |
| $300 to $499 | 1,419 (6.6%) | 267 (4.9%) |
| $500 to $799 | 2,417 (11.2%) | 593 (11.0%) |
| $800 to $999 | 1,668 (7.7%) | 974 (18.0%) |
| $1,000 to $1,499 | 4,842 (22.5%) | 1,701 (31.4%) |
| $1,500 to $1,999 | 3,785 (17.6%) | 1,049 (19.4%) |
| $2,000 to $2,499 | 2,652 (12.3%) | 331 (6.1%) |
| $2,500 to $2,999 | 1,412 (6.6%) | 83 (1.5%) |
| $3,000 or more | 2,922 (13.6%) | 66 (1.2%) |
| Total | 21,549 (100.0%) | 5,410 (100.0%) |
Physical Housing Characteristics in Boone County
Housing Structures in Boone County
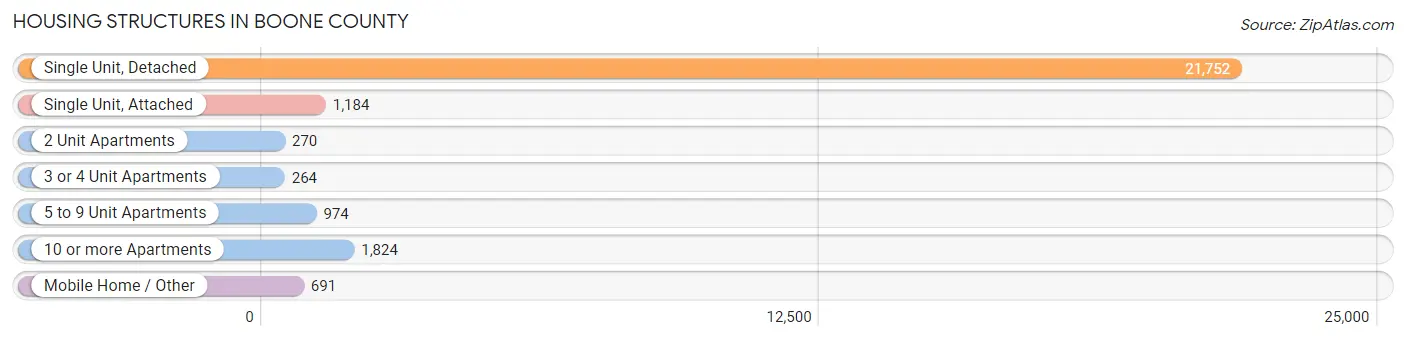
| Structure Type | # Housing Units | % Housing Units |
| Single Unit, Detached | 21,752 | 80.7% |
| Single Unit, Attached | 1,184 | 4.4% |
| 2 Unit Apartments | 270 | 1.0% |
| 3 or 4 Unit Apartments | 264 | 1.0% |
| 5 to 9 Unit Apartments | 974 | 3.6% |
| 10 or more Apartments | 1,824 | 6.8% |
| Mobile Home / Other | 691 | 2.6% |
| Total | 26,959 | 100.0% |
Housing Structures by Occupancy in Boone County
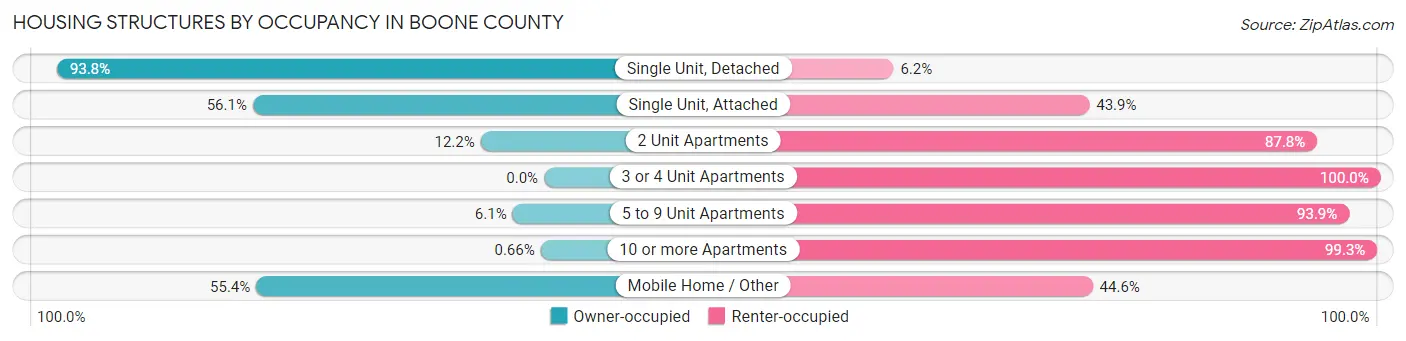
| Structure Type | Owner-occupied | Renter-occupied |
| Single Unit, Detached | 20,398 (93.8%) | 1,354 (6.2%) |
| Single Unit, Attached | 664 (56.1%) | 520 (43.9%) |
| 2 Unit Apartments | 33 (12.2%) | 237 (87.8%) |
| 3 or 4 Unit Apartments | 0 (0.0%) | 264 (100.0%) |
| 5 to 9 Unit Apartments | 59 (6.1%) | 915 (93.9%) |
| 10 or more Apartments | 12 (0.7%) | 1,812 (99.3%) |
| Mobile Home / Other | 383 (55.4%) | 308 (44.6%) |
| Total | 21,549 (79.9%) | 5,410 (20.1%) |
Housing Structures by Number of Rooms in Boone County
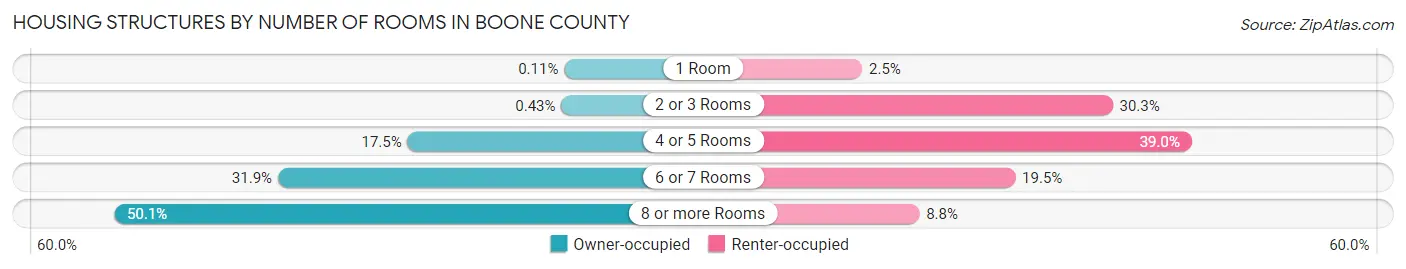
| Number of Rooms | Owner-occupied | Renter-occupied |
| 1 Room | 24 (0.1%) | 133 (2.5%) |
| 2 or 3 Rooms | 93 (0.4%) | 1,637 (30.3%) |
| 4 or 5 Rooms | 3,770 (17.5%) | 2,112 (39.0%) |
| 6 or 7 Rooms | 6,871 (31.9%) | 1,052 (19.5%) |
| 8 or more Rooms | 10,791 (50.1%) | 476 (8.8%) |
| Total | 21,549 (100.0%) | 5,410 (100.0%) |
Housing Structure by Heating Type in Boone County
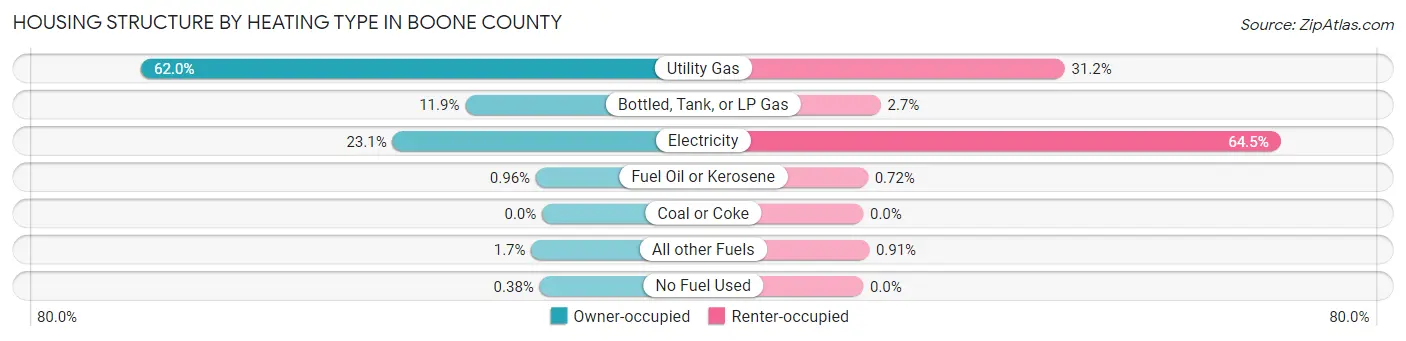
| Heating Type | Owner-occupied | Renter-occupied |
| Utility Gas | 13,359 (62.0%) | 1,685 (31.1%) |
| Bottled, Tank, or LP Gas | 2,560 (11.9%) | 146 (2.7%) |
| Electricity | 4,984 (23.1%) | 3,491 (64.5%) |
| Fuel Oil or Kerosene | 206 (1.0%) | 39 (0.7%) |
| Coal or Coke | 0 (0.0%) | 0 (0.0%) |
| All other Fuels | 358 (1.7%) | 49 (0.9%) |
| No Fuel Used | 82 (0.4%) | 0 (0.0%) |
| Total | 21,549 (100.0%) | 5,410 (100.0%) |
Household Vehicle Usage in Boone County
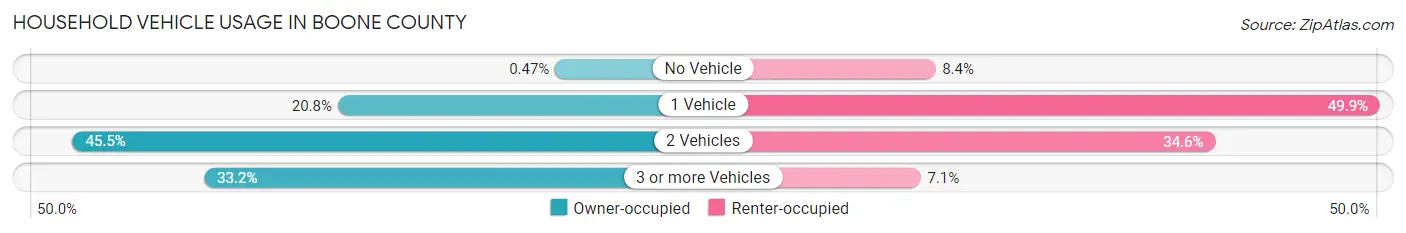
| Vehicles per Household | Owner-occupied | Renter-occupied |
| No Vehicle | 101 (0.5%) | 456 (8.4%) |
| 1 Vehicle | 4,473 (20.8%) | 2,702 (49.9%) |
| 2 Vehicles | 9,812 (45.5%) | 1,870 (34.6%) |
| 3 or more Vehicles | 7,163 (33.2%) | 382 (7.1%) |
| Total | 21,549 (100.0%) | 5,410 (100.0%) |
Real Estate & Mortgages in Boone County
Real Estate and Mortgage Overview in Boone County
| Characteristic | Without Mortgage | With Mortgage |
| Housing Units | 5,360 | 16,189 |
| Median Property Value | $260,500 | $331,000 |
| Median Household Income | $83,485 | $6,852 |
| Monthly Housing Costs | $626 | $2,877 |
| Real Estate Taxes | $2,211 | $155 |
Property Value by Mortgage Status in Boone County
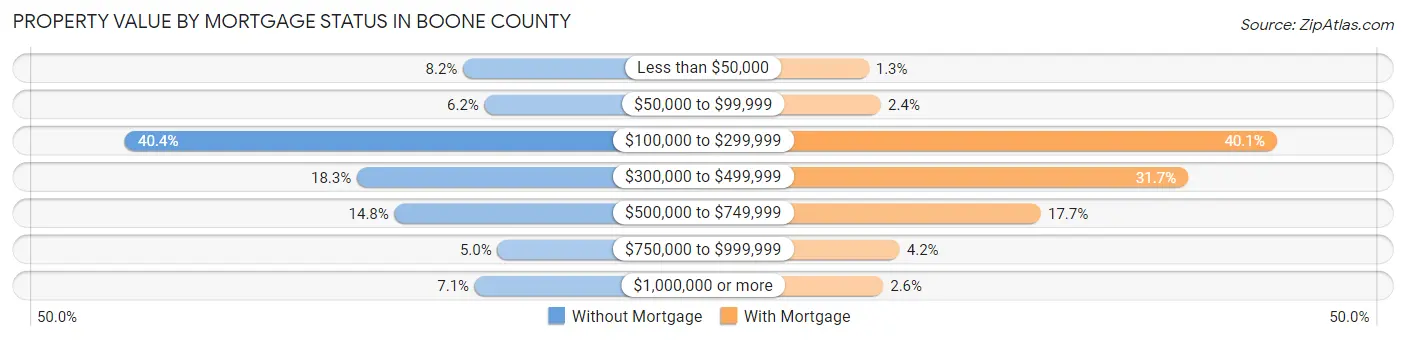
| Property Value | Without Mortgage | With Mortgage |
| Less than $50,000 | 441 (8.2%) | 204 (1.3%) |
| $50,000 to $99,999 | 331 (6.2%) | 395 (2.4%) |
| $100,000 to $299,999 | 2,167 (40.4%) | 6,493 (40.1%) |
| $300,000 to $499,999 | 983 (18.3%) | 5,126 (31.7%) |
| $500,000 to $749,999 | 791 (14.8%) | 2,860 (17.7%) |
| $750,000 to $999,999 | 266 (5.0%) | 683 (4.2%) |
| $1,000,000 or more | 381 (7.1%) | 428 (2.6%) |
| Total | 5,360 (100.0%) | 16,189 (100.0%) |
Household Income by Mortgage Status in Boone County
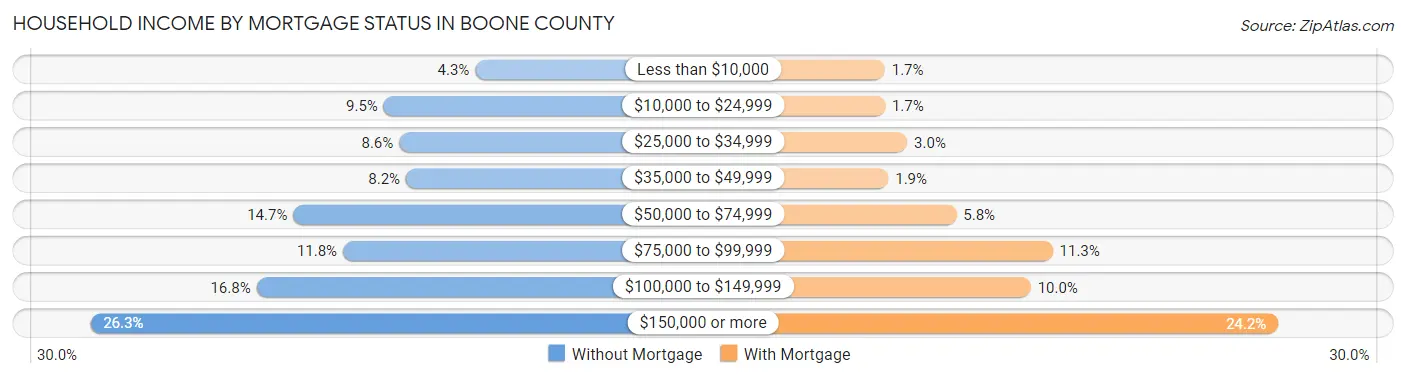
| Household Income | Without Mortgage | With Mortgage |
| Less than $10,000 | 228 (4.3%) | 270 (1.7%) |
| $10,000 to $24,999 | 508 (9.5%) | 272 (1.7%) |
| $25,000 to $34,999 | 461 (8.6%) | 478 (2.9%) |
| $35,000 to $49,999 | 440 (8.2%) | 303 (1.9%) |
| $50,000 to $74,999 | 785 (14.6%) | 932 (5.8%) |
| $75,000 to $99,999 | 633 (11.8%) | 1,823 (11.3%) |
| $100,000 to $149,999 | 898 (16.8%) | 1,620 (10.0%) |
| $150,000 or more | 1,407 (26.3%) | 3,909 (24.1%) |
| Total | 5,360 (100.0%) | 16,189 (100.0%) |
Property Value to Household Income Ratio in Boone County
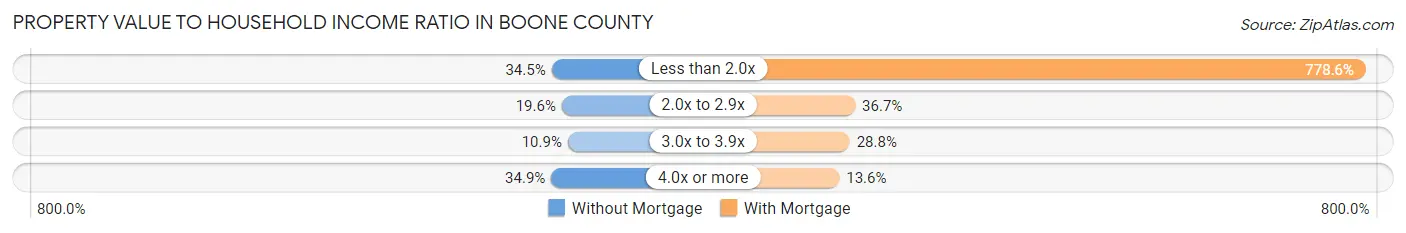
| Value-to-Income Ratio | Without Mortgage | With Mortgage |
| Less than 2.0x | 1,850 (34.5%) | 126,047 (778.6%) |
| 2.0x to 2.9x | 1,051 (19.6%) | 5,934 (36.6%) |
| 3.0x to 3.9x | 582 (10.9%) | 4,663 (28.8%) |
| 4.0x or more | 1,873 (34.9%) | 2,202 (13.6%) |
| Total | 5,360 (100.0%) | 16,189 (100.0%) |
Real Estate Taxes by Mortgage Status in Boone County
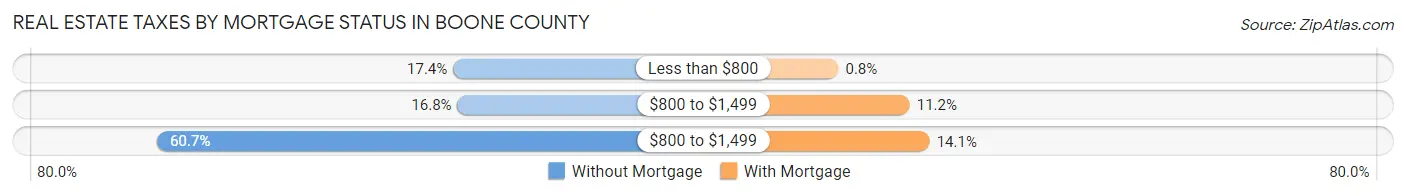
| Property Taxes | Without Mortgage | With Mortgage |
| Less than $800 | 932 (17.4%) | 130 (0.8%) |
| $800 to $1,499 | 898 (16.8%) | 1,817 (11.2%) |
| $800 to $1,499 | 3,251 (60.7%) | 2,287 (14.1%) |
| Total | 5,360 (100.0%) | 16,189 (100.0%) |
Health & Disability in Boone County
Health Insurance Coverage by Age in Boone County
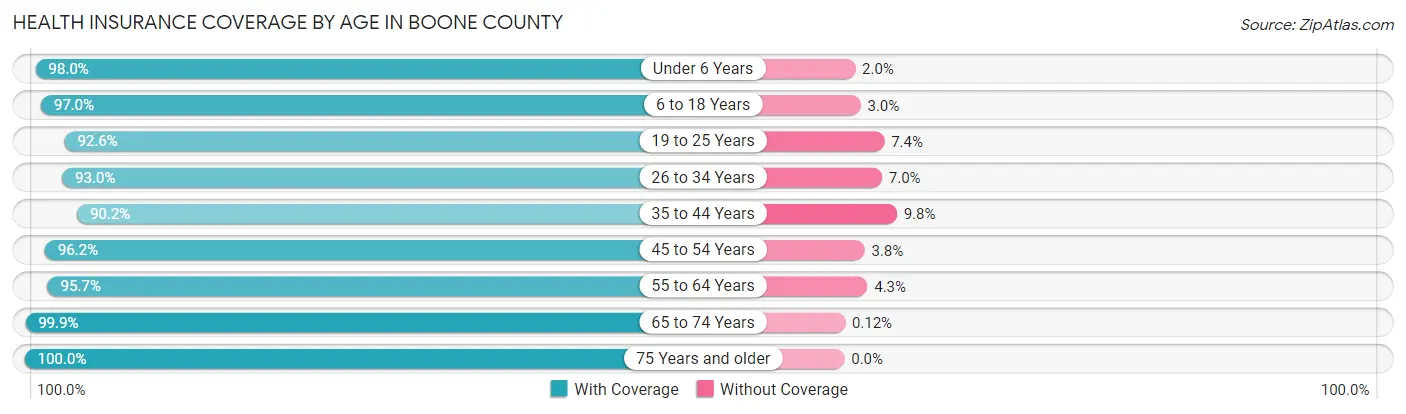
| Age Bracket | With Coverage | Without Coverage |
| Under 6 Years | 5,440 (98.0%) | 112 (2.0%) |
| 6 to 18 Years | 13,275 (97.0%) | 415 (3.0%) |
| 19 to 25 Years | 4,779 (92.6%) | 384 (7.4%) |
| 26 to 34 Years | 7,138 (93.0%) | 537 (7.0%) |
| 35 to 44 Years | 9,024 (90.2%) | 977 (9.8%) |
| 45 to 54 Years | 9,457 (96.2%) | 372 (3.8%) |
| 55 to 64 Years | 8,598 (95.7%) | 385 (4.3%) |
| 65 to 74 Years | 5,830 (99.9%) | 7 (0.1%) |
| 75 Years and older | 3,854 (100.0%) | 0 (0.0%) |
| Total | 67,395 (95.5%) | 3,189 (4.5%) |
Health Insurance Coverage by Citizenship Status in Boone County
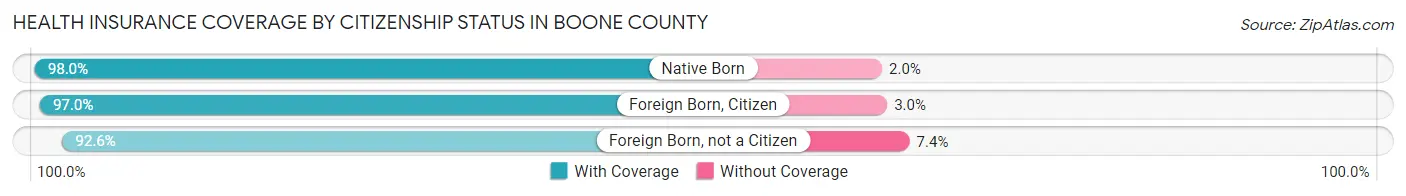
| Citizenship Status | With Coverage | Without Coverage |
| Native Born | 5,440 (98.0%) | 112 (2.0%) |
| Foreign Born, Citizen | 13,275 (97.0%) | 415 (3.0%) |
| Foreign Born, not a Citizen | 4,779 (92.6%) | 384 (7.4%) |
Health Insurance Coverage by Household Income in Boone County
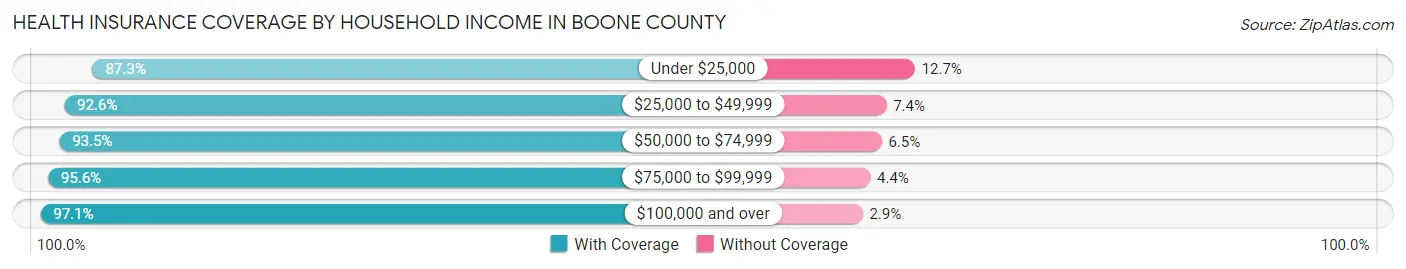
| Household Income | With Coverage | Without Coverage |
| Under $25,000 | 3,876 (87.3%) | 565 (12.7%) |
| $25,000 to $49,999 | 5,455 (92.6%) | 435 (7.4%) |
| $50,000 to $74,999 | 8,131 (93.5%) | 564 (6.5%) |
| $75,000 to $99,999 | 7,466 (95.6%) | 341 (4.4%) |
| $100,000 and over | 42,417 (97.1%) | 1,284 (2.9%) |
Public vs Private Health Insurance Coverage by Age in Boone County
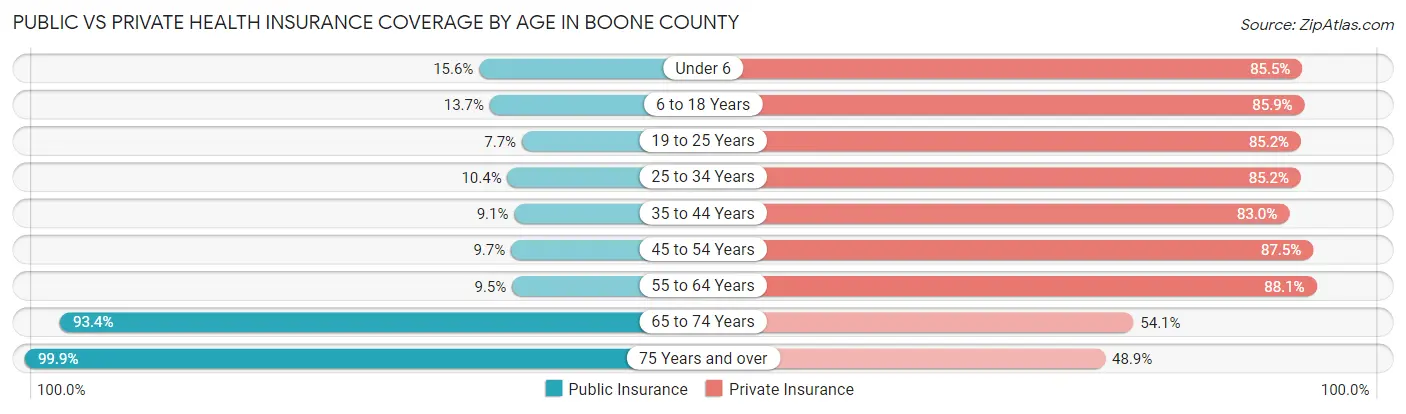
| Age Bracket | Public Insurance | Private Insurance |
| Under 6 | 867 (15.6%) | 4,744 (85.5%) |
| 6 to 18 Years | 1,869 (13.7%) | 11,754 (85.9%) |
| 19 to 25 Years | 397 (7.7%) | 4,400 (85.2%) |
| 25 to 34 Years | 796 (10.4%) | 6,538 (85.2%) |
| 35 to 44 Years | 911 (9.1%) | 8,303 (83.0%) |
| 45 to 54 Years | 954 (9.7%) | 8,596 (87.5%) |
| 55 to 64 Years | 854 (9.5%) | 7,913 (88.1%) |
| 65 to 74 Years | 5,452 (93.4%) | 3,159 (54.1%) |
| 75 Years and over | 3,851 (99.9%) | 1,883 (48.9%) |
| Total | 15,951 (22.6%) | 57,290 (81.2%) |
Disability Status by Sex by Age in Boone County
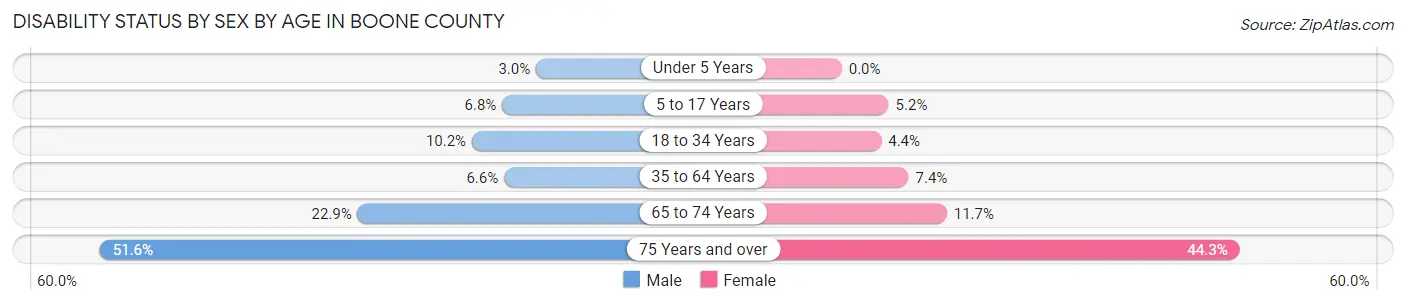
| Age Bracket | Male | Female |
| Under 5 Years | 72 (3.0%) | 0 (0.0%) |
| 5 to 17 Years | 481 (6.8%) | 353 (5.2%) |
| 18 to 34 Years | 716 (10.2%) | 300 (4.4%) |
| 35 to 64 Years | 950 (6.6%) | 1,073 (7.4%) |
| 65 to 74 Years | 644 (22.9%) | 354 (11.7%) |
| 75 Years and over | 796 (51.6%) | 1,024 (44.3%) |
Disability Class by Sex by Age in Boone County
Disability Class: Hearing Difficulty
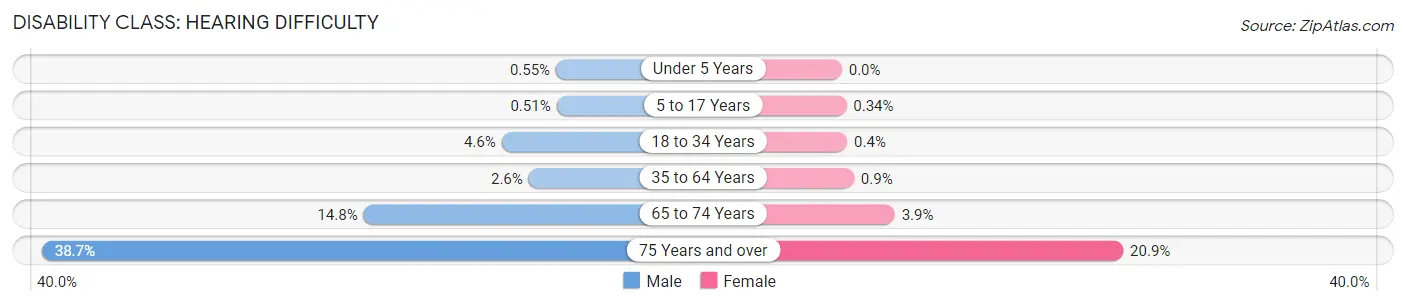
| Age Bracket | Male | Female |
| Under 5 Years | 13 (0.5%) | 0 (0.0%) |
| 5 to 17 Years | 36 (0.5%) | 23 (0.3%) |
| 18 to 34 Years | 323 (4.6%) | 27 (0.4%) |
| 35 to 64 Years | 371 (2.6%) | 130 (0.9%) |
| 65 to 74 Years | 417 (14.8%) | 119 (3.9%) |
| 75 Years and over | 597 (38.7%) | 483 (20.9%) |
Disability Class: Vision Difficulty
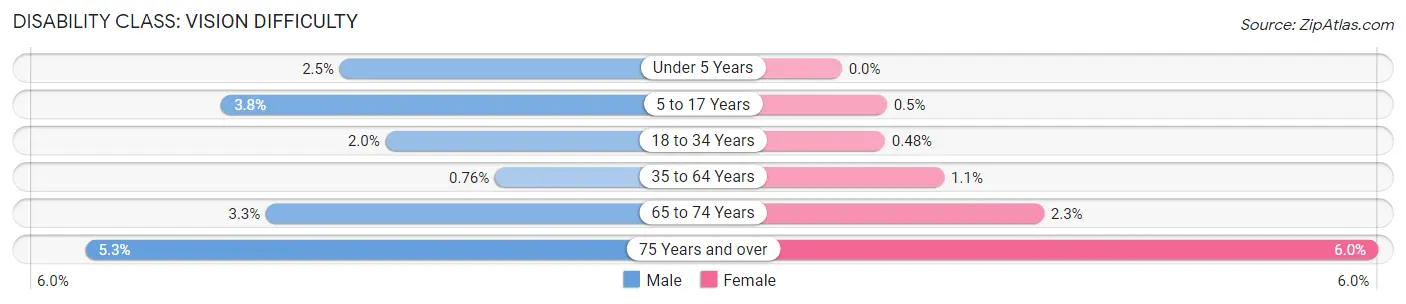
| Age Bracket | Male | Female |
| Under 5 Years | 59 (2.5%) | 0 (0.0%) |
| 5 to 17 Years | 269 (3.8%) | 34 (0.5%) |
| 18 to 34 Years | 139 (2.0%) | 33 (0.5%) |
| 35 to 64 Years | 110 (0.8%) | 164 (1.1%) |
| 65 to 74 Years | 93 (3.3%) | 68 (2.2%) |
| 75 Years and over | 82 (5.3%) | 138 (6.0%) |
Disability Class: Cognitive Difficulty
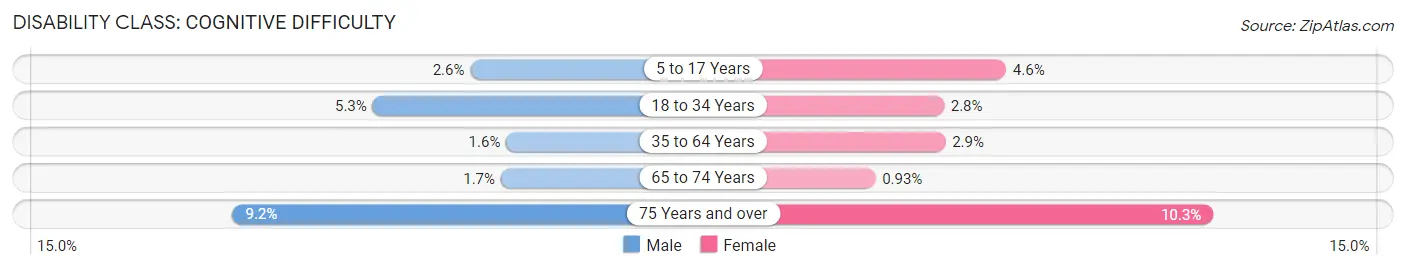
| Age Bracket | Male | Female |
| 5 to 17 Years | 183 (2.6%) | 309 (4.6%) |
| 18 to 34 Years | 373 (5.3%) | 194 (2.8%) |
| 35 to 64 Years | 229 (1.6%) | 415 (2.9%) |
| 65 to 74 Years | 49 (1.7%) | 28 (0.9%) |
| 75 Years and over | 142 (9.2%) | 239 (10.3%) |
Disability Class: Ambulatory Difficulty
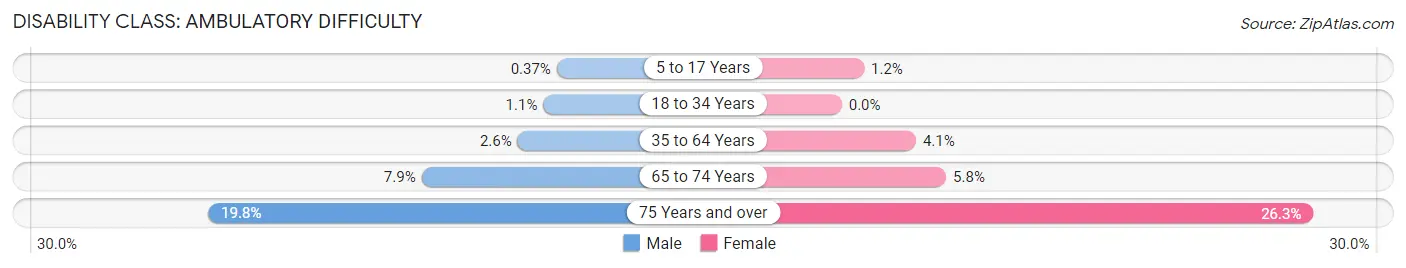
| Age Bracket | Male | Female |
| 5 to 17 Years | 26 (0.4%) | 84 (1.2%) |
| 18 to 34 Years | 79 (1.1%) | 0 (0.0%) |
| 35 to 64 Years | 367 (2.5%) | 596 (4.1%) |
| 65 to 74 Years | 222 (7.9%) | 176 (5.8%) |
| 75 Years and over | 305 (19.8%) | 607 (26.3%) |
Disability Class: Self-Care Difficulty
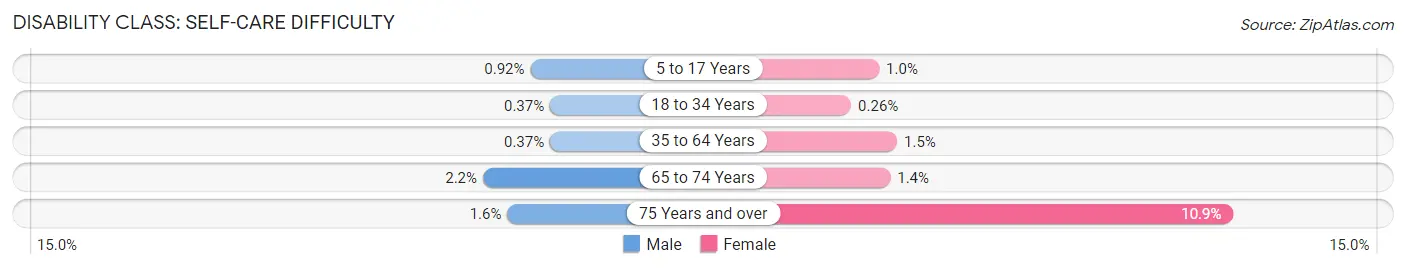
| Age Bracket | Male | Female |
| 5 to 17 Years | 65 (0.9%) | 70 (1.0%) |
| 18 to 34 Years | 26 (0.4%) | 18 (0.3%) |
| 35 to 64 Years | 53 (0.4%) | 222 (1.5%) |
| 65 to 74 Years | 63 (2.2%) | 41 (1.3%) |
| 75 Years and over | 24 (1.6%) | 252 (10.9%) |
Technology Access in Boone County
Computing Device Access in Boone County
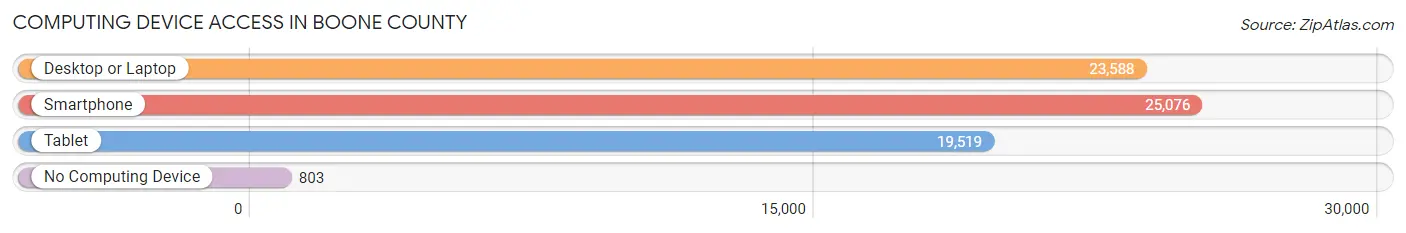
| Device Type | # Households | % Households |
| Desktop or Laptop | 23,588 | 87.5% |
| Smartphone | 25,076 | 93.0% |
| Tablet | 19,519 | 72.4% |
| No Computing Device | 803 | 3.0% |
| Total | 26,959 | 100.0% |
Internet Access in Boone County
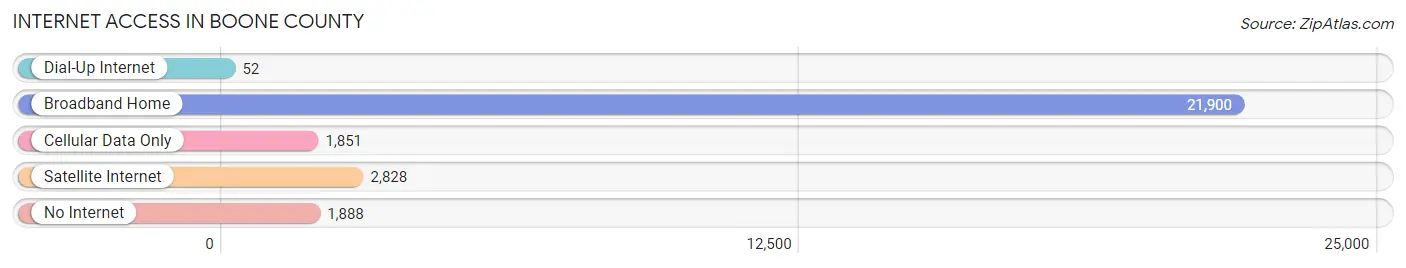
| Internet Type | # Households | % Households |
| Dial-Up Internet | 52 | 0.2% |
| Broadband Home | 21,900 | 81.2% |
| Cellular Data Only | 1,851 | 6.9% |
| Satellite Internet | 2,828 | 10.5% |
| No Internet | 1,888 | 7.0% |
| Total | 26,959 | 100.0% |
Boone County Summary
Boone County, Indiana is located in the central part of the state, just north of Indianapolis. It is bordered by Hamilton, Hendricks, Marion, Montgomery, and Tipton counties. The county seat is Lebanon, and the county was named after Daniel Boone, the famous frontiersman. Boone County has a population of approximately 70,000 people, and is part of the Indianapolis Metropolitan Statistical Area.
Geography
Boone County is located in the Central Till Plains region of Indiana. The county is mostly flat, with some rolling hills in the northern and western parts. The county is drained by the White River, which flows through the county from north to south. The county is also home to several small lakes, including Lake Lemon, Lake Freeman, and Lake Shafer. The county is mostly rural, with some small towns and villages scattered throughout. The largest city in the county is Lebanon, with a population of around 15,000.
Economy
Boone County has a diverse economy, with a mix of manufacturing, agriculture, and services. The county is home to several large employers, including the Lebanon Community School Corporation, the Boone County Sheriff's Office, and the Indiana Department of Transportation. The county is also home to several small businesses, including restaurants, retail stores, and professional services.
Agriculture is an important part of the county's economy. The county is home to several large farms, and the county produces a variety of crops, including corn, soybeans, wheat, and hay. The county is also home to several wineries and breweries, which produce a variety of wines and beers.
Demographics
As of the 2010 census, Boone County had a population of 56,640. The population is predominantly white (90.2%), with small percentages of African American (3.7%), Hispanic (2.3%), and Asian (1.2%) residents. The median household income in the county is $54,945, and the median home value is $150,000.
Boone County is home to several colleges and universities, including Indiana University-Kokomo, Ivy Tech Community College, and Purdue University-West Lafayette. The county is also home to several public and private schools, including Lebanon Community Schools, Zionsville Community Schools, and Western Boone Community Schools.
Boone County is a great place to live, work, and play. The county has a diverse economy, a variety of educational opportunities, and a great quality of life. The county is a great place to raise a family, and is a great place to call home.
Common Questions
What is the Total Population of Boone County?
Total Population of Boone County is 71,235.
What is the Total Male Population of Boone County?
Total Male Population of Boone County is 35,557.
What is the Total Female Population of Boone County?
Total Female Population of Boone County is 35,678.
What is the Ratio of Males per 100 Females in Boone County?
There are 99.66 Males per 100 Females in Boone County.
What is the Ratio of Females per 100 Males in Boone County?
There are 100.34 Females per 100 Males in Boone County.
What is the Median Population Age in Boone County?
Median Population Age in Boone County is 38.3 Years.
What is the Average Family Size in Boone County
Average Family Size in Boone County is 3.1 People.
What is the Average Household Size in Boone County
Average Household Size in Boone County is 2.6 People.
What is Per Capita Income in Boone County?
Per Capita income in Boone County is $54,866.
What is the Median Family Income in Boone County?
Median Family Income in Boone County is $121,097.
What is the Median Household income in Boone County?
Median Household Income in Boone County is $103,038.
What is Income or Wage Gap in Boone County?
Income or Wage Gap in Boone County is 34.4%.
Women in Boone County earn 65.6 cents for every dollar earned by a man.
What is Family Income Deficit in Boone County?
Family Income Deficit in Boone County is $11,047.
Families that are below poverty line in Boone County earn $11,047 less on average than the poverty threshold level.
What is Inequality or Gini Index in Boone County?
Inequality or Gini Index in Boone County is 0.48.
How Large is the Labor Force in Boone County?
There are 38,188 People in the Labor Forcein in Boone County.
What is the Percentage of People in the Labor Force in Boone County?
69.6% of People are in the Labor Force in Boone County.
What is the Unemployment Rate in Boone County?
Unemployment Rate in Boone County is 3.1%.