Blackford County, IN
Blackford County Overview
12,074
TOTAL POPULATION
5,892
MALE POPULATION
6,182
FEMALE POPULATION
95.31
MALES / 100 FEMALES
104.92
FEMALES / 100 MALES
44.0
MEDIAN AGE
3.0
AVG FAMILY SIZE
2.4
AVG HOUSEHOLD SIZE
$29,751
PER CAPITA INCOME
$63,652
AVG FAMILY INCOME
$51,108
AVG HOUSEHOLD INCOME
26.2%
WAGE / INCOME GAP [ % ]
73.8¢/ $1
WAGE / INCOME GAP [ $ ]
0.48
INEQUALITY / GINI INDEX
5,452
LABOR FORCE [ PEOPLE ]
56.1%
PERCENT IN LABOR FORCE
5.5%
UNEMPLOYMENT RATE
Blackford County Area Codes
Race in Blackford County
The most populous races in Blackford County are White / Caucasian (11,503 | 95.3%), Two or more Races (397 | 3.3%), and Hispanic or Latino (141 | 1.2%).

| Race | # Population | % Population |
| Asian | 17 | 0.1% |
| Black / African American | 124 | 1.0% |
| Hawaiian / Pacific | 0 | 0.0% |
| Hispanic or Latino | 141 | 1.2% |
| Native / Alaskan | 13 | 0.1% |
| White / Caucasian | 11,503 | 95.3% |
| Two or more Races | 397 | 3.3% |
| Some other Race | 20 | 0.2% |
| Total | 12,074 | 100.0% |
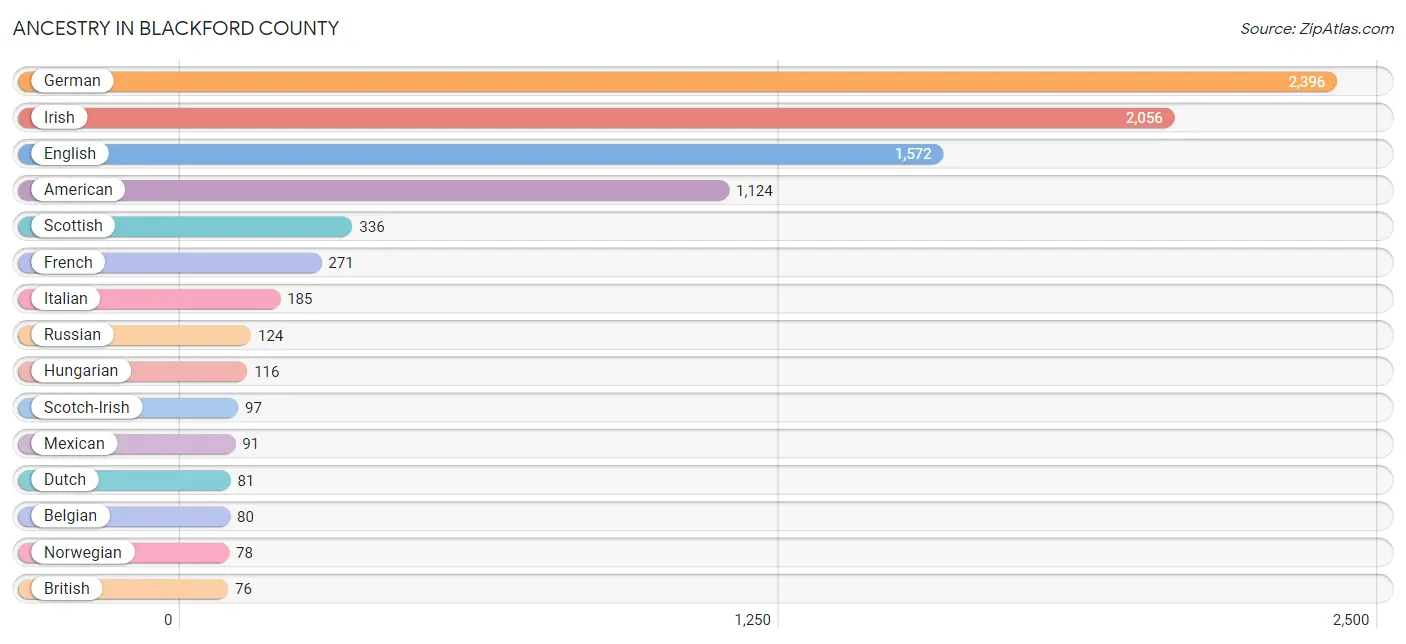
Ancestry in Blackford County
The most populous ancestries reported in Blackford County are German (2,396 | 19.8%), Irish (2,056 | 17.0%), English (1,572 | 13.0%), American (1,124 | 9.3%), and Scottish (336 | 2.8%), together accounting for 62.0% of all Blackford County residents.
| Ancestry | # Population | % Population |
| American | 1,124 | 9.3% |
| Austrian | 51 | 0.4% |
| Belgian | 80 | 0.7% |
| Blackfeet | 16 | 0.1% |
| British | 76 | 0.6% |
| Cherokee | 33 | 0.3% |
| Choctaw | 10 | 0.1% |
| Czech | 13 | 0.1% |
| Danish | 9 | 0.1% |
| Delaware | 16 | 0.1% |
| Dutch | 81 | 0.7% |
| Eastern European | 59 | 0.5% |
| English | 1,572 | 13.0% |
| European | 40 | 0.3% |
| French | 271 | 2.2% |
| German | 2,396 | 19.8% |
| Hungarian | 116 | 1.0% |
| Indian (Asian) | 7 | 0.1% |
| Irish | 2,056 | 17.0% |
| Italian | 185 | 1.5% |
| Mexican | 91 | 0.7% |
| Norwegian | 78 | 0.6% |
| Polish | 35 | 0.3% |
| Portuguese | 6 | 0.1% |
| Puerto Rican | 50 | 0.4% |
| Russian | 124 | 1.0% |
| Scotch-Irish | 97 | 0.8% |
| Scottish | 336 | 2.8% |
| South African | 6 | 0.1% |
| Subsaharan African | 6 | 0.1% |
| Swedish | 42 | 0.4% |
| Swiss | 24 | 0.2% |
| Thai | 17 | 0.1% |
| Welsh | 20 | 0.2% | View All 34 Rows |
Immigrants in Blackford County
The most numerous immigrant groups reported in Blackford County came from Canada (32 | 0.3%), Central America (25 | 0.2%), Latin America (25 | 0.2%), Mexico (25 | 0.2%), and Asia (14 | 0.1%), together accounting for 1.0% of all Blackford County residents.

| Immigration Origin | # Population | % Population |
| Africa | 6 | 0.1% |
| Asia | 14 | 0.1% |
| Canada | 32 | 0.3% |
| Central America | 25 | 0.2% |
| Europe | 13 | 0.1% |
| Germany | 13 | 0.1% |
| India | 3 | 0.0% |
| Latin America | 25 | 0.2% |
| Mexico | 25 | 0.2% |
| Philippines | 11 | 0.1% |
| South Africa | 6 | 0.1% |
| South Central Asia | 3 | 0.0% |
| South Eastern Asia | 11 | 0.1% |
| Western Europe | 13 | 0.1% | View All 14 Rows |
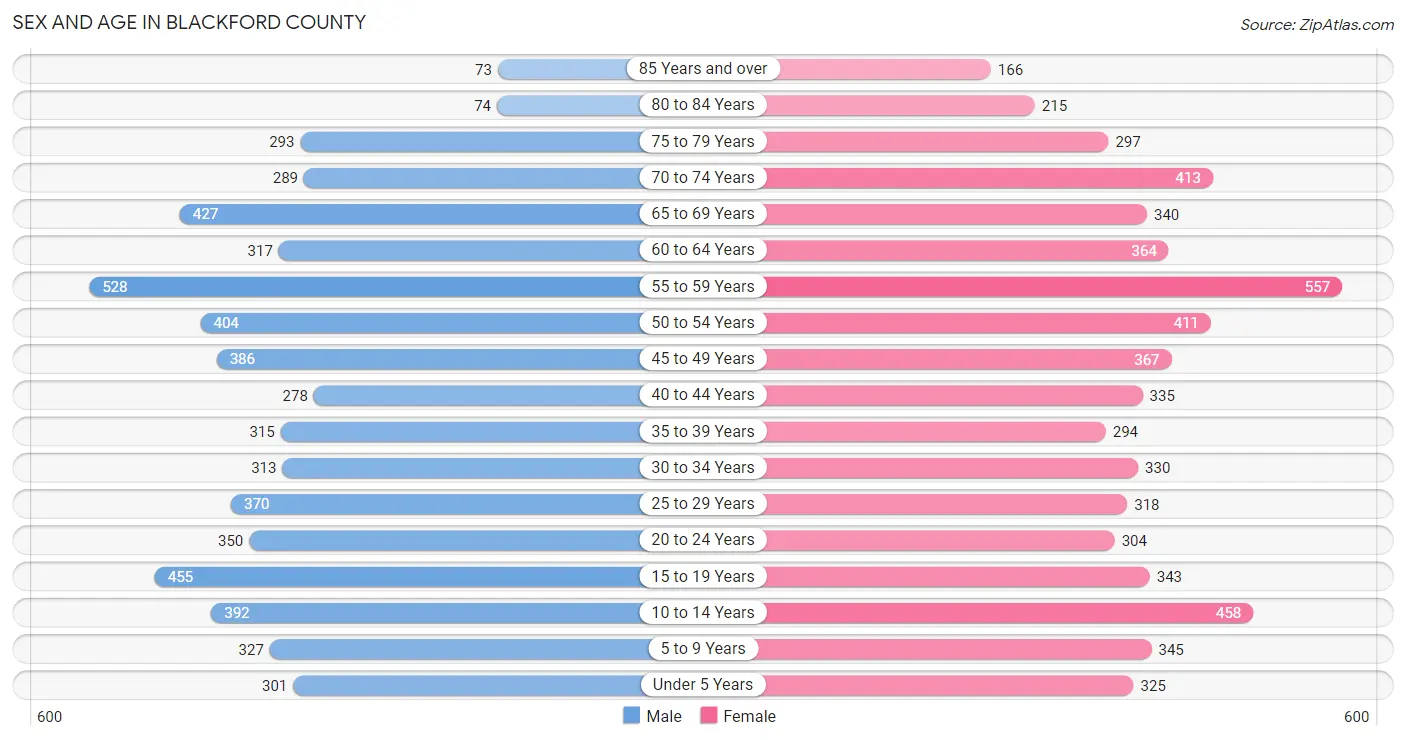
Sex and Age in Blackford County
Sex and Age in Blackford County
The most populous age groups in Blackford County are 55 to 59 Years (528 | 9.0%) for men and 55 to 59 Years (557 | 9.0%) for women.
| Age Bracket | Male | Female |
| Under 5 Years | 301 (5.1%) | 325 (5.3%) |
| 5 to 9 Years | 327 (5.6%) | 345 (5.6%) |
| 10 to 14 Years | 392 (6.7%) | 458 (7.4%) |
| 15 to 19 Years | 455 (7.7%) | 343 (5.6%) |
| 20 to 24 Years | 350 (5.9%) | 304 (4.9%) |
| 25 to 29 Years | 370 (6.3%) | 318 (5.1%) |
| 30 to 34 Years | 313 (5.3%) | 330 (5.3%) |
| 35 to 39 Years | 315 (5.3%) | 294 (4.8%) |
| 40 to 44 Years | 278 (4.7%) | 335 (5.4%) |
| 45 to 49 Years | 386 (6.6%) | 367 (5.9%) |
| 50 to 54 Years | 404 (6.9%) | 411 (6.7%) |
| 55 to 59 Years | 528 (9.0%) | 557 (9.0%) |
| 60 to 64 Years | 317 (5.4%) | 364 (5.9%) |
| 65 to 69 Years | 427 (7.2%) | 340 (5.5%) |
| 70 to 74 Years | 289 (4.9%) | 413 (6.7%) |
| 75 to 79 Years | 293 (5.0%) | 297 (4.8%) |
| 80 to 84 Years | 74 (1.3%) | 215 (3.5%) |
| 85 Years and over | 73 (1.2%) | 166 (2.7%) |
| Total | 5,892 (100.0%) | 6,182 (100.0%) |
Families and Households in Blackford County
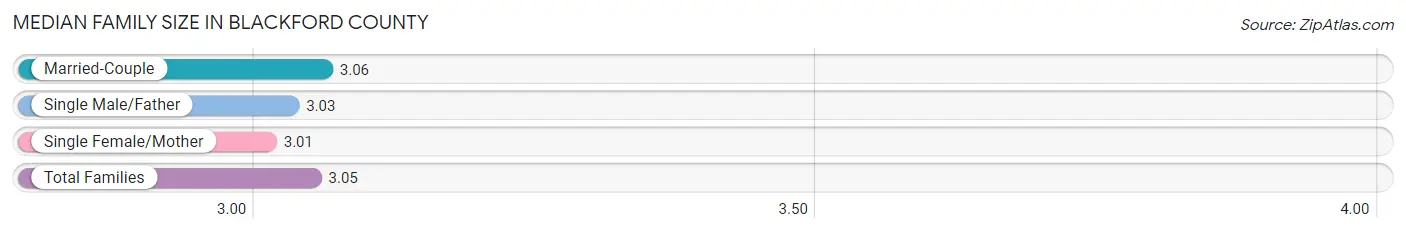
Median Family Size in Blackford County
The median family size in Blackford County is 3.05 persons per family, with married-couple families (2,498 | 79.8%) accounting for the largest median family size of 3.06 persons per family. On the other hand, single female/mother families (469 | 15.0%) represent the smallest median family size with 3.01 persons per family.
| Family Type | # Families | Family Size |
| Married-Couple | 2,498 (79.8%) | 3.06 |
| Single Male/Father | 162 (5.2%) | 3.03 |
| Single Female/Mother | 469 (15.0%) | 3.01 |
| Total Families | 3,129 (100.0%) | 3.05 |
Median Household Size in Blackford County
The median household size in Blackford County is 2.40 persons per household, with single male/father households (162 | 3.3%) accounting for the largest median household size of 3.5 persons per household. non-family households (1,851 | 37.2%) represent the smallest median household size with 1.18 persons per household.

| Household Type | # Households | Household Size |
| Married-Couple | 2,498 (50.2%) | 3.08 |
| Single Male/Father | 162 (3.3%) | 3.50 |
| Single Female/Mother | 469 (9.4%) | 3.17 |
| Non-family | 1,851 (37.2%) | 1.18 |
| Total Households | 4,980 (100.0%) | 2.40 |
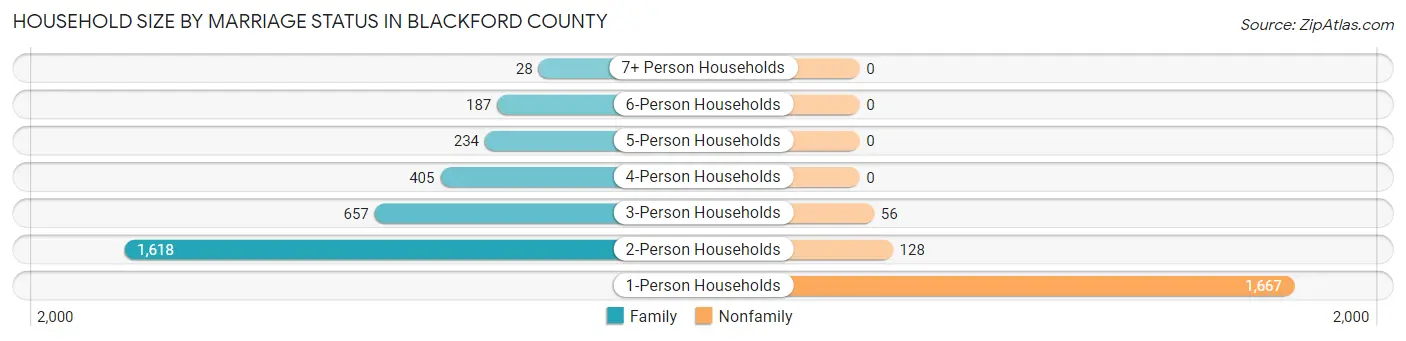
Household Size by Marriage Status in Blackford County
Out of a total of 4,980 households in Blackford County, 3,129 (62.8%) are family households, while 1,851 (37.2%) are nonfamily households. The most numerous type of family households are 2-person households, comprising 1,618, and the most common type of nonfamily households are 1-person households, comprising 1,667.
| Household Size | Family Households | Nonfamily Households |
| 1-Person Households | - | 1,667 (33.5%) |
| 2-Person Households | 1,618 (32.5%) | 128 (2.6%) |
| 3-Person Households | 657 (13.2%) | 56 (1.1%) |
| 4-Person Households | 405 (8.1%) | 0 (0.0%) |
| 5-Person Households | 234 (4.7%) | 0 (0.0%) |
| 6-Person Households | 187 (3.8%) | 0 (0.0%) |
| 7+ Person Households | 28 (0.6%) | 0 (0.0%) |
| Total | 3,129 (62.8%) | 1,851 (37.2%) |
Female Fertility in Blackford County
Fertility by Age in Blackford County
Average fertility rate in Blackford County is 38.0 births per 1,000 women. Women in the age bracket of 20 to 34 years have the highest fertility rate with 88.0 births per 1,000 women. Women in the age bracket of 20 to 34 years acount for 91.3% of all women with births.
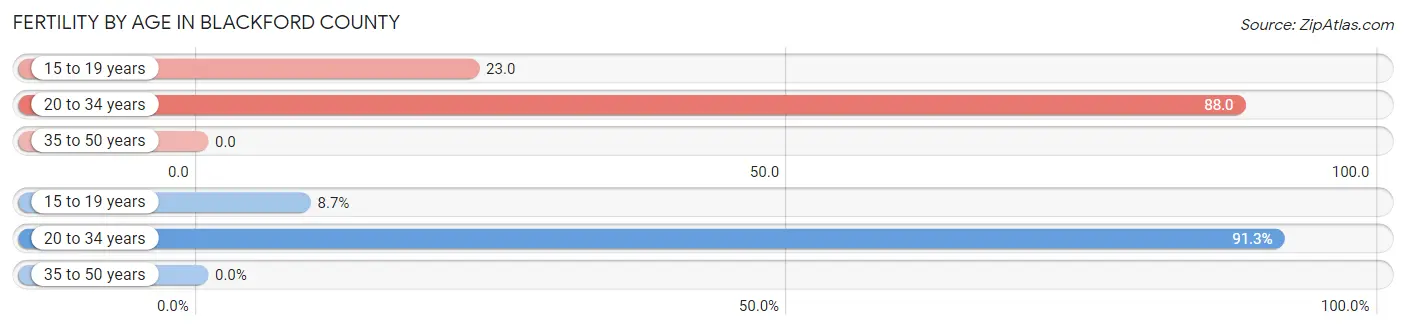
| Age Bracket | Women with Births | Births / 1,000 Women |
| 15 to 19 years | 8 (8.7%) | 23.0 |
| 20 to 34 years | 84 (91.3%) | 88.0 |
| 35 to 50 years | 0 (0.0%) | 0.0 |
| Total | 92 (100.0%) | 38.0 |
Fertility by Age by Marriage Status in Blackford County
51.1% of women with births (92) in Blackford County are married. The highest percentage of unmarried women with births falls into 15 to 19 years age bracket with 100.0% of them unmarried at the time of birth, while the lowest percentage of unmarried women with births belong to 20 to 34 years age bracket with 44.1% of them unmarried.

| Age Bracket | Married | Unmarried |
| 15 to 19 years | 0 (0.0%) | 8 (100.0%) |
| 20 to 34 years | 47 (55.9%) | 37 (44.1%) |
| 35 to 50 years | 0 (0.0%) | 0 (0.0%) |
| Total | 47 (51.1%) | 45 (48.9%) |
Fertility by Education in Blackford County
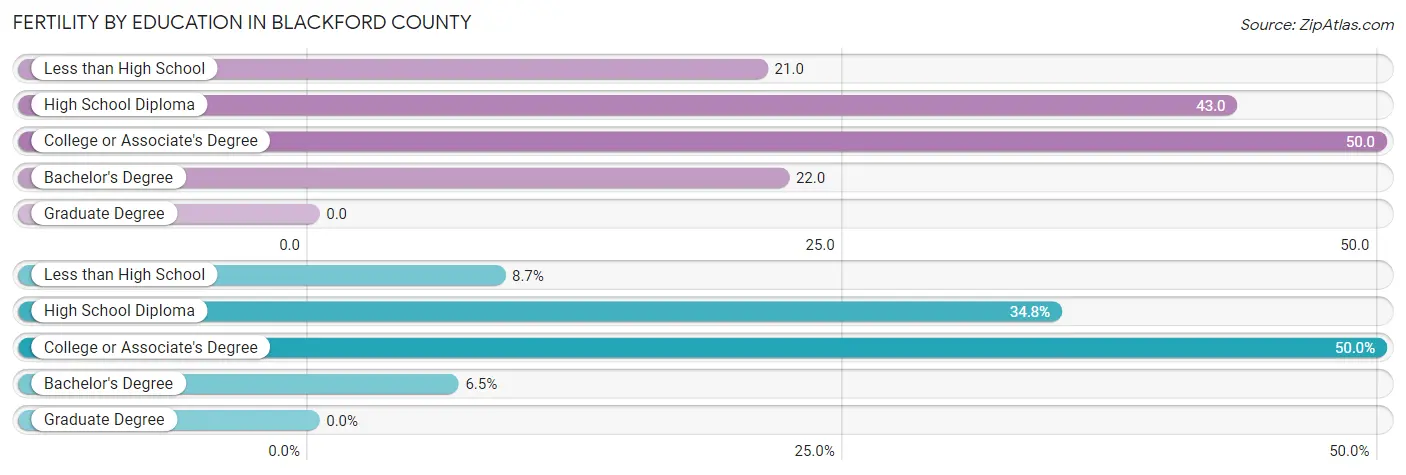
| Educational Attainment | Women with Births | Births / 1,000 Women |
| Less than High School | 8 (8.7%) | 21.0 |
| High School Diploma | 32 (34.8%) | 43.0 |
| College or Associate's Degree | 46 (50.0%) | 50.0 |
| Bachelor's Degree | 6 (6.5%) | 22.0 |
| Graduate Degree | 0 (0.0%) | 0.0 |
| Total | 92 (100.0%) | 38.0 |
Fertility by Education by Marriage Status in Blackford County
48.9% of women with births in Blackford County are unmarried. Women with the educational attainment of bachelor's degree are most likely to be married with 100.0% of them married at childbirth, while women with the educational attainment of less than high school are least likely to be married with 100.0% of them unmarried at childbirth.

| Educational Attainment | Married | Unmarried |
| Less than High School | 0 (0.0%) | 8 (100.0%) |
| High School Diploma | 27 (84.4%) | 5 (15.6%) |
| College or Associate's Degree | 14 (30.4%) | 32 (69.6%) |
| Bachelor's Degree | 6 (100.0%) | 0 (0.0%) |
| Graduate Degree | 0 (0.0%) | 0 (0.0%) |
| Total | 47 (51.1%) | 45 (48.9%) |
Income in Blackford County
Income Overview in Blackford County
Per Capita Income in Blackford County is $29,751, while median incomes of families and households are $63,652 and $51,108 respectively.
| Characteristic | Number | Measure |
| Per Capita Income | 12,074 | $29,751 |
| Median Family Income | 3,129 | $63,652 |
| Mean Family Income | 3,129 | $83,495 |
| Median Household Income | 4,980 | $51,108 |
| Mean Household Income | 4,980 | $68,100 |
| Income Deficit | 3,129 | $0 |
| Wage / Income Gap (%) | 12,074 | 26.24% |
| Wage / Income Gap ($) | 12,074 | 73.76¢ per $1 |
| Gini / Inequality Index | 12,074 | 0.48 |
Earnings by Sex in Blackford County
Average Earnings in Blackford County are $33,719, $39,481 for men and $29,123 for women, a difference of 26.2%.
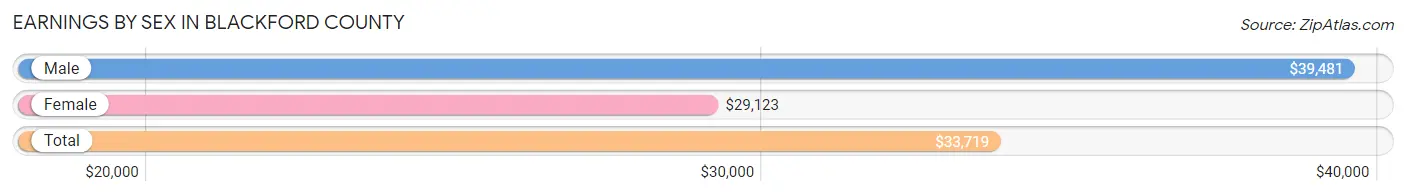
| Sex | Number | Average Earnings |
| Male | 2,908 (52.0%) | $39,481 |
| Female | 2,685 (48.0%) | $29,123 |
| Total | 5,593 (100.0%) | $33,719 |
Earnings by Sex by Income Bracket in Blackford County
The most common earnings brackets in Blackford County are $55,000 to $64,999 for men (338 | 11.6%) and $30,000 to $34,999 for women (248 | 9.2%).
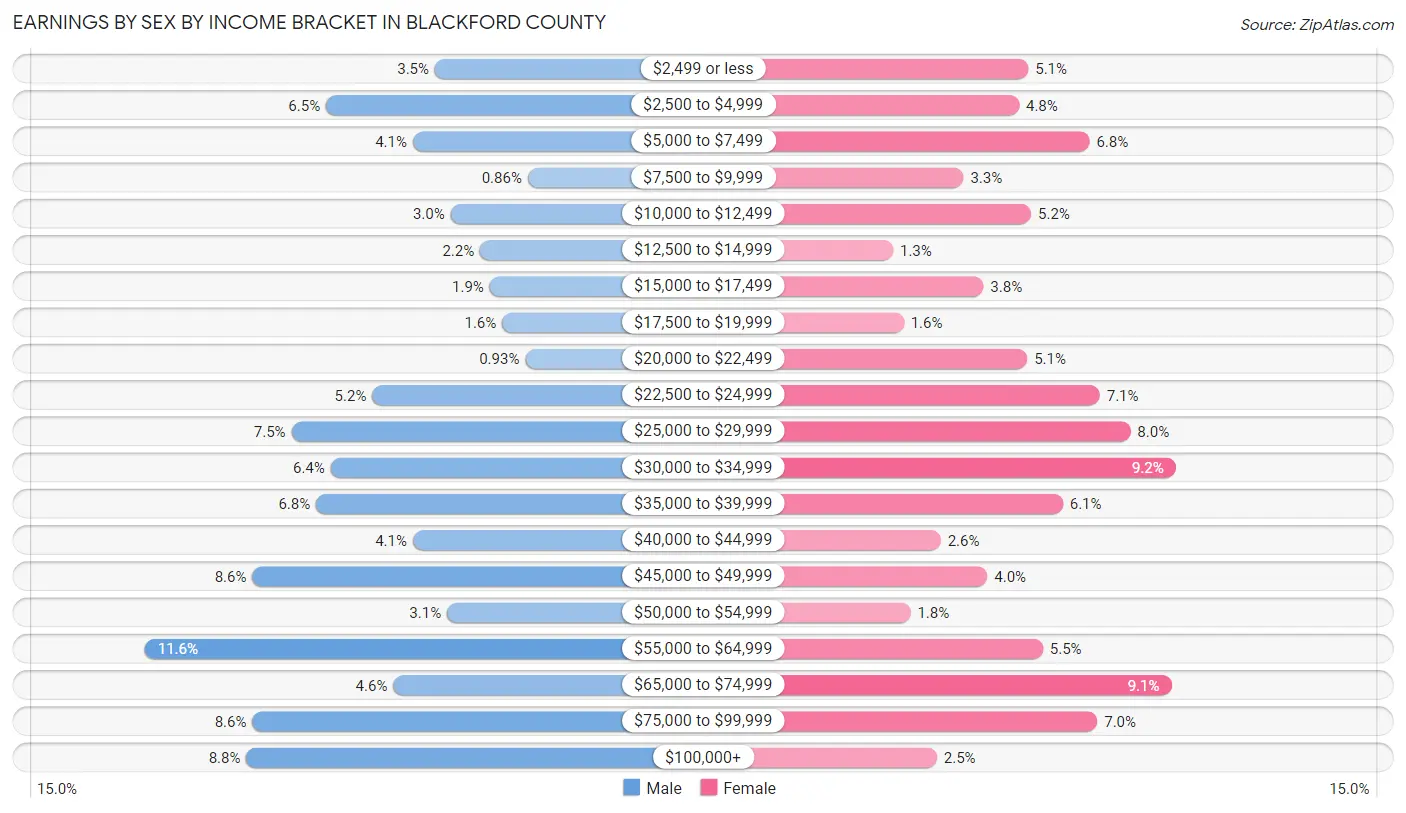
| Income | Male | Female |
| $2,499 or less | 101 (3.5%) | 137 (5.1%) |
| $2,500 to $4,999 | 190 (6.5%) | 130 (4.8%) |
| $5,000 to $7,499 | 119 (4.1%) | 183 (6.8%) |
| $7,500 to $9,999 | 25 (0.9%) | 88 (3.3%) |
| $10,000 to $12,499 | 88 (3.0%) | 139 (5.2%) |
| $12,500 to $14,999 | 64 (2.2%) | 35 (1.3%) |
| $15,000 to $17,499 | 56 (1.9%) | 103 (3.8%) |
| $17,500 to $19,999 | 46 (1.6%) | 43 (1.6%) |
| $20,000 to $22,499 | 27 (0.9%) | 136 (5.1%) |
| $22,500 to $24,999 | 152 (5.2%) | 191 (7.1%) |
| $25,000 to $29,999 | 218 (7.5%) | 214 (8.0%) |
| $30,000 to $34,999 | 186 (6.4%) | 248 (9.2%) |
| $35,000 to $39,999 | 198 (6.8%) | 163 (6.1%) |
| $40,000 to $44,999 | 119 (4.1%) | 71 (2.6%) |
| $45,000 to $49,999 | 250 (8.6%) | 106 (4.0%) |
| $50,000 to $54,999 | 91 (3.1%) | 48 (1.8%) |
| $55,000 to $64,999 | 338 (11.6%) | 148 (5.5%) |
| $65,000 to $74,999 | 135 (4.6%) | 245 (9.1%) |
| $75,000 to $99,999 | 250 (8.6%) | 189 (7.0%) |
| $100,000+ | 255 (8.8%) | 68 (2.5%) |
| Total | 2,908 (100.0%) | 2,685 (100.0%) |
Earnings by Sex by Educational Attainment in Blackford County
Average earnings in Blackford County are $43,049 for men and $33,182 for women, a difference of 22.9%. Men with an educational attainment of graduate degree enjoy the highest average annual earnings of $64,688, while those with high school diploma education earn the least with $37,155. Women with an educational attainment of graduate degree earn the most with the average annual earnings of $72,050, while those with less than high school education have the smallest earnings of $28,149.
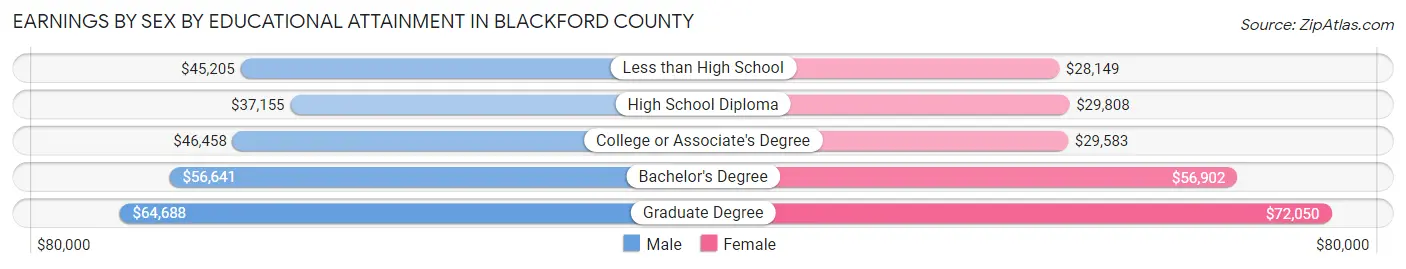
| Educational Attainment | Male Income | Female Income |
| Less than High School | $45,205 | $28,149 |
| High School Diploma | $37,155 | $29,808 |
| College or Associate's Degree | $46,458 | $29,583 |
| Bachelor's Degree | $56,641 | $56,902 |
| Graduate Degree | $64,688 | $72,050 |
| Total | $43,049 | $33,182 |
Family Income in Blackford County
Family Income Brackets in Blackford County
According to the Blackford County family income data, there are 817 families falling into the $50,000 to $74,999 income range, which is the most common income bracket and makes up 26.1% of all families. Conversely, the $10,000 to $14,999 income bracket is the least frequent group with only 34 families (1.1%) belonging to this category.

| Income Bracket | # Families | % Families |
| Less than $10,000 | 238 | 7.6% |
| $10,000 to $14,999 | 34 | 1.1% |
| $15,000 to $24,999 | 113 | 3.6% |
| $25,000 to $34,999 | 332 | 10.6% |
| $35,000 to $49,999 | 357 | 11.4% |
| $50,000 to $74,999 | 817 | 26.1% |
| $75,000 to $99,999 | 438 | 14.0% |
| $100,000 to $149,999 | 432 | 13.8% |
| $150,000 to $199,999 | 241 | 7.7% |
| $200,000+ | 125 | 4.0% |
Family Income by Famaliy Size in Blackford County
4-person families (353 | 11.3%) account for the highest median family income in Blackford County with $79,688 per family, while 2-person families (1,651 | 52.8%) have the highest median income of $32,950 per family member.
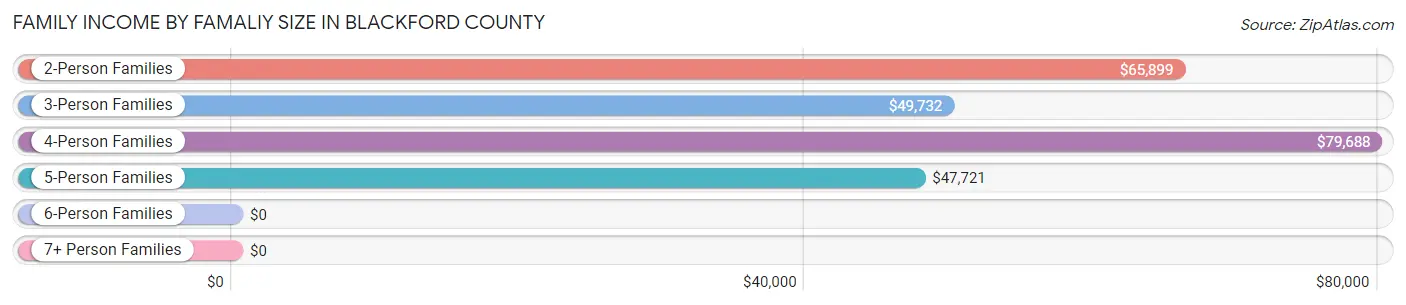
| Income Bracket | # Families | Median Income |
| 2-Person Families | 1,651 (52.8%) | $65,899 |
| 3-Person Families | 713 (22.8%) | $49,732 |
| 4-Person Families | 353 (11.3%) | $79,688 |
| 5-Person Families | 199 (6.4%) | $47,721 |
| 6-Person Families | 199 (6.4%) | $0 |
| 7+ Person Families | 14 (0.4%) | $0 |
| Total | 3,129 (100.0%) | $63,652 |
Family Income by Number of Earners in Blackford County
The median family income in Blackford County is $63,652, with families comprising 3+ earners (221) having the highest median family income of $133,920, while families with no earners (608) have the lowest median family income of $44,500, accounting for 7.1% and 19.4% of families, respectively.
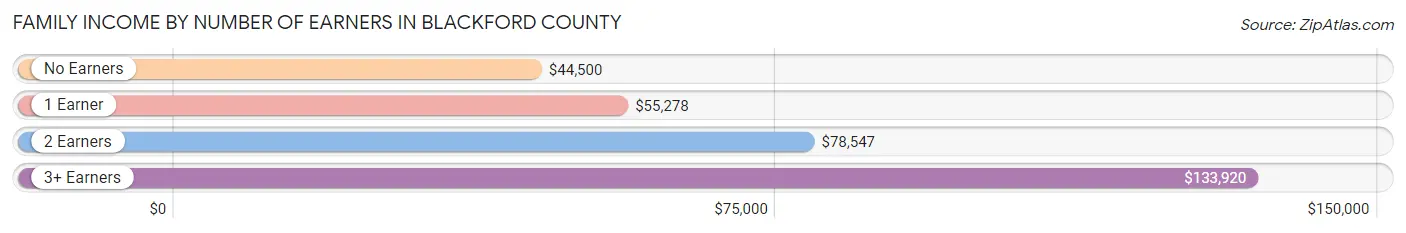
| Number of Earners | # Families | Median Income |
| No Earners | 608 (19.4%) | $44,500 |
| 1 Earner | 1,060 (33.9%) | $55,278 |
| 2 Earners | 1,240 (39.6%) | $78,547 |
| 3+ Earners | 221 (7.1%) | $133,920 |
| Total | 3,129 (100.0%) | $63,652 |
Household Income in Blackford County
Household Income Brackets in Blackford County
With 1,031 households falling in the category, the $50,000 to $74,999 income range is the most frequent in Blackford County, accounting for 20.7% of all households. In contrast, only 134 households (2.7%) fall into the $200,000+ income bracket, making it the least populous group.

| Income Bracket | # Households | % Households |
| Less than $10,000 | 598 | 12.0% |
| $10,000 to $14,999 | 219 | 4.4% |
| $15,000 to $24,999 | 418 | 8.4% |
| $25,000 to $34,999 | 578 | 11.6% |
| $35,000 to $49,999 | 642 | 12.9% |
| $50,000 to $74,999 | 1,031 | 20.7% |
| $75,000 to $99,999 | 603 | 12.1% |
| $100,000 to $149,999 | 488 | 9.8% |
| $150,000 to $199,999 | 274 | 5.5% |
| $200,000+ | 134 | 2.7% |
Household Income by Householder Age in Blackford County
The median household income in Blackford County is $51,108, with the highest median household income of $65,284 found in the 45 to 64 years age bracket for the primary householder. A total of 1,876 households (37.7%) fall into this category. Meanwhile, the 15 to 24 years age bracket for the primary householder has the lowest median household income of $34,412, with 206 households (4.1%) in this group.
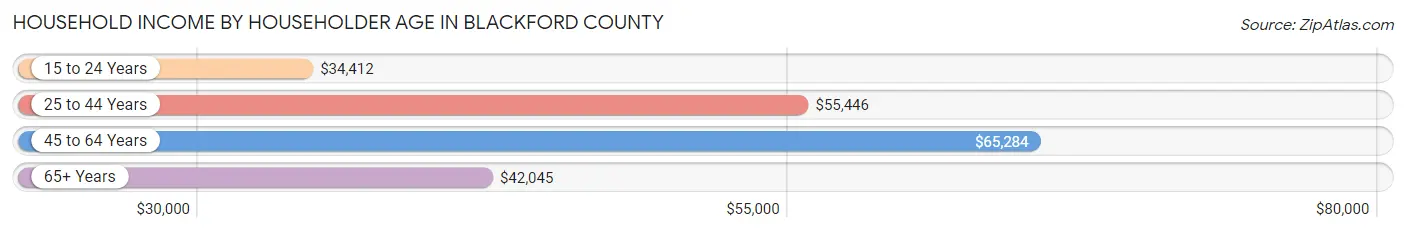
| Income Bracket | # Households | Median Income |
| 15 to 24 Years | 206 (4.1%) | $34,412 |
| 25 to 44 Years | 1,208 (24.3%) | $55,446 |
| 45 to 64 Years | 1,876 (37.7%) | $65,284 |
| 65+ Years | 1,690 (33.9%) | $42,045 |
| Total | 4,980 (100.0%) | $51,108 |
Poverty in Blackford County
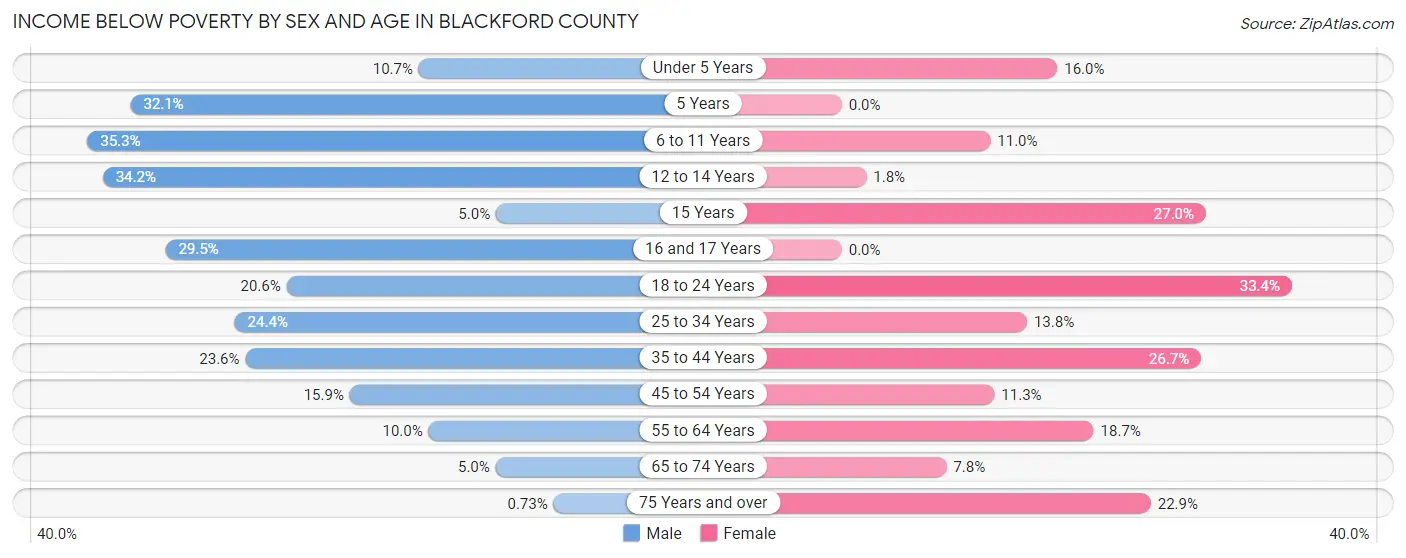
Income Below Poverty by Sex and Age in Blackford County
With 17.4% poverty level for males and 16.7% for females among the residents of Blackford County, 6 to 11 year old males and 18 to 24 year old females are the most vulnerable to poverty, with 176 males (35.3%) and 146 females (33.4%) in their respective age groups living below the poverty level.
| Age Bracket | Male | Female |
| Under 5 Years | 25 (10.7%) | 52 (16.0%) |
| 5 Years | 9 (32.1%) | 0 (0.0%) |
| 6 to 11 Years | 176 (35.3%) | 60 (11.0%) |
| 12 to 14 Years | 66 (34.2%) | 3 (1.8%) |
| 15 Years | 3 (5.0%) | 40 (27.0%) |
| 16 and 17 Years | 70 (29.5%) | 0 (0.0%) |
| 18 to 24 Years | 104 (20.5%) | 146 (33.4%) |
| 25 to 34 Years | 164 (24.4%) | 88 (13.8%) |
| 35 to 44 Years | 136 (23.6%) | 167 (26.7%) |
| 45 to 54 Years | 124 (15.9%) | 88 (11.3%) |
| 55 to 64 Years | 84 (10.0%) | 172 (18.7%) |
| 65 to 74 Years | 36 (5.0%) | 58 (7.8%) |
| 75 Years and over | 3 (0.7%) | 145 (22.9%) |
| Total | 1,000 (17.4%) | 1,019 (16.7%) |
Income Above Poverty by Sex and Age in Blackford County
According to the poverty statistics in Blackford County, males aged 75 years and over and females aged 5 years are the age groups that are most secure financially, with 99.3% of males and 100.0% of females in these age groups living above the poverty line.

| Age Bracket | Male | Female |
| Under 5 Years | 208 (89.3%) | 273 (84.0%) |
| 5 Years | 19 (67.9%) | 94 (100.0%) |
| 6 to 11 Years | 322 (64.7%) | 484 (89.0%) |
| 12 to 14 Years | 127 (65.8%) | 162 (98.2%) |
| 15 Years | 57 (95.0%) | 108 (73.0%) |
| 16 and 17 Years | 167 (70.5%) | 62 (100.0%) |
| 18 to 24 Years | 402 (79.4%) | 291 (66.6%) |
| 25 to 34 Years | 508 (75.6%) | 552 (86.3%) |
| 35 to 44 Years | 440 (76.4%) | 459 (73.3%) |
| 45 to 54 Years | 658 (84.1%) | 689 (88.7%) |
| 55 to 64 Years | 755 (90.0%) | 748 (81.3%) |
| 65 to 74 Years | 679 (95.0%) | 688 (92.2%) |
| 75 Years and over | 406 (99.3%) | 487 (77.1%) |
| Total | 4,748 (82.6%) | 5,097 (83.3%) |
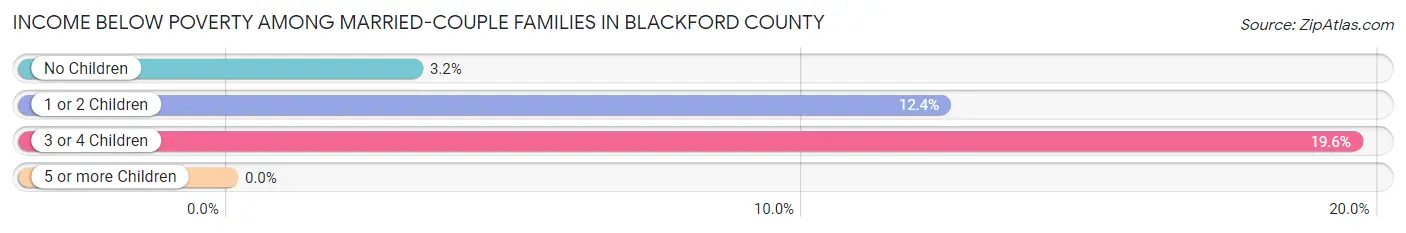
Income Below Poverty Among Married-Couple Families in Blackford County
The poverty statistics for married-couple families in Blackford County show that 7.2% or 179 of the total 2,498 families live below the poverty line. Families with 3 or 4 children have the highest poverty rate of 19.6%, comprising of 56 families. On the other hand, families with no children have the lowest poverty rate of 3.2%, which includes 53 families.
| Children | Above Poverty | Below Poverty |
| No Children | 1,595 (96.8%) | 53 (3.2%) |
| 1 or 2 Children | 494 (87.6%) | 70 (12.4%) |
| 3 or 4 Children | 230 (80.4%) | 56 (19.6%) |
| 5 or more Children | 0 (0.0%) | 0 (0.0%) |
| Total | 2,319 (92.8%) | 179 (7.2%) |
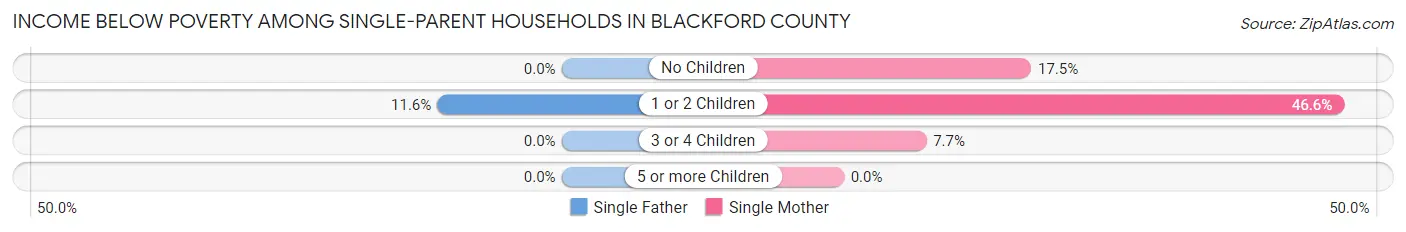
Income Below Poverty Among Single-Parent Households in Blackford County
According to the poverty data in Blackford County, 6.8% or 11 single-father households and 35.2% or 165 single-mother households are living below the poverty line. Among single-father households, those with 1 or 2 children have the highest poverty rate, with 11 households (11.6%) experiencing poverty. Likewise, among single-mother households, those with 1 or 2 children have the highest poverty rate, with 137 households (46.6%) falling below the poverty line.
| Children | Single Father | Single Mother |
| No Children | 0 (0.0%) | 26 (17.4%) |
| 1 or 2 Children | 11 (11.6%) | 137 (46.6%) |
| 3 or 4 Children | 0 (0.0%) | 2 (7.7%) |
| 5 or more Children | 0 (0.0%) | 0 (0.0%) |
| Total | 11 (6.8%) | 165 (35.2%) |
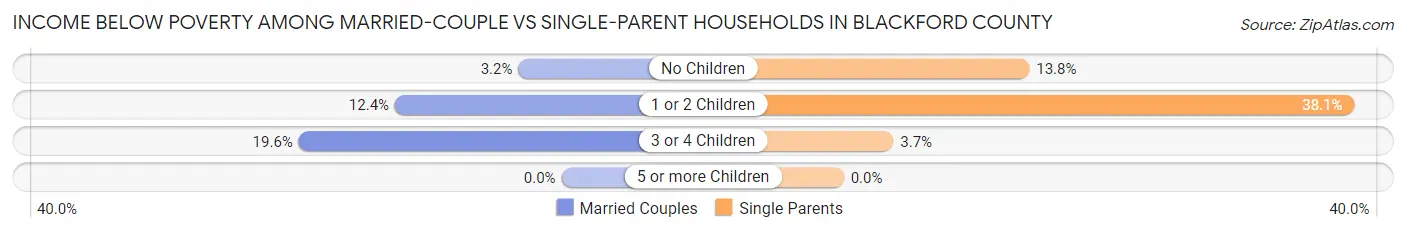
Income Below Poverty Among Married-Couple vs Single-Parent Households in Blackford County
The poverty data for Blackford County shows that 179 of the married-couple family households (7.2%) and 176 of the single-parent households (27.9%) are living below the poverty level. Within the married-couple family households, those with 3 or 4 children have the highest poverty rate, with 56 households (19.6%) falling below the poverty line. Among the single-parent households, those with 1 or 2 children have the highest poverty rate, with 148 household (38.1%) living below poverty.
| Children | Married-Couple Families | Single-Parent Households |
| No Children | 53 (3.2%) | 26 (13.8%) |
| 1 or 2 Children | 70 (12.4%) | 148 (38.1%) |
| 3 or 4 Children | 56 (19.6%) | 2 (3.7%) |
| 5 or more Children | 0 (0.0%) | 0 (0.0%) |
| Total | 179 (7.2%) | 176 (27.9%) |
Employment Characteristics in Blackford County
Employment by Class of Employer in Blackford County
Among the 4,852 employed individuals in Blackford County, private company employees (3,355 | 69.2%), self-employed (not incorporated) (443 | 9.1%), and not-for-profit organizations (377 | 7.8%) make up the most common classes of employment.
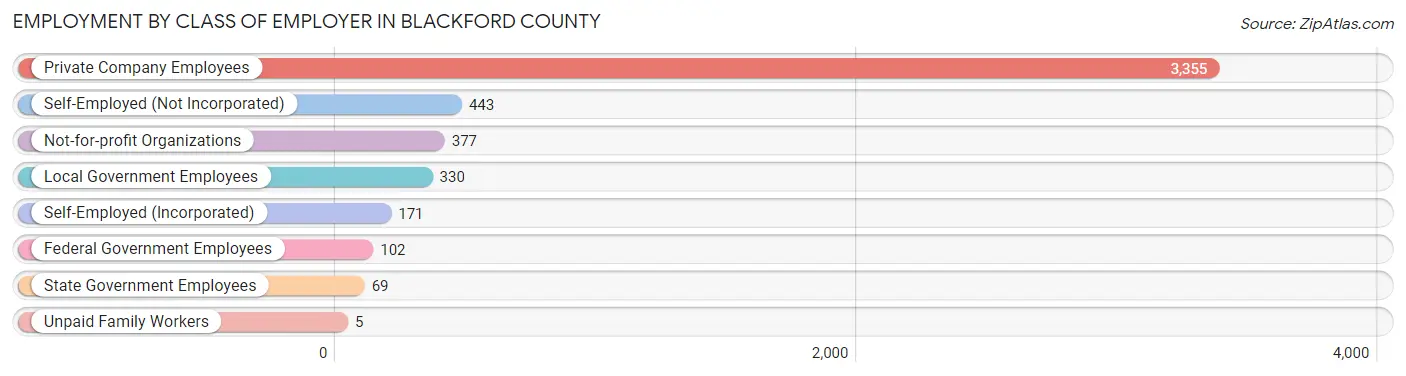
| Employer Class | # Employees | % Employees |
| Private Company Employees | 3,355 | 69.2% |
| Self-Employed (Incorporated) | 171 | 3.5% |
| Self-Employed (Not Incorporated) | 443 | 9.1% |
| Not-for-profit Organizations | 377 | 7.8% |
| Local Government Employees | 330 | 6.8% |
| State Government Employees | 69 | 1.4% |
| Federal Government Employees | 102 | 2.1% |
| Unpaid Family Workers | 5 | 0.1% |
| Total | 4,852 | 100.0% |
Employment Status by Age in Blackford County
According to the labor force statistics for Blackford County, out of the total population over 16 years of age (9,718), 56.1% or 5,452 individuals are in the labor force, with 5.5% or 300 of them unemployed. The age group with the highest labor force participation rate is 45 to 54 years, with 79.5% or 1,247 individuals in the labor force. Within the labor force, the 16 to 19 years age range has the highest percentage of unemployed individuals, with 18.8% or 68 of them being unemployed.
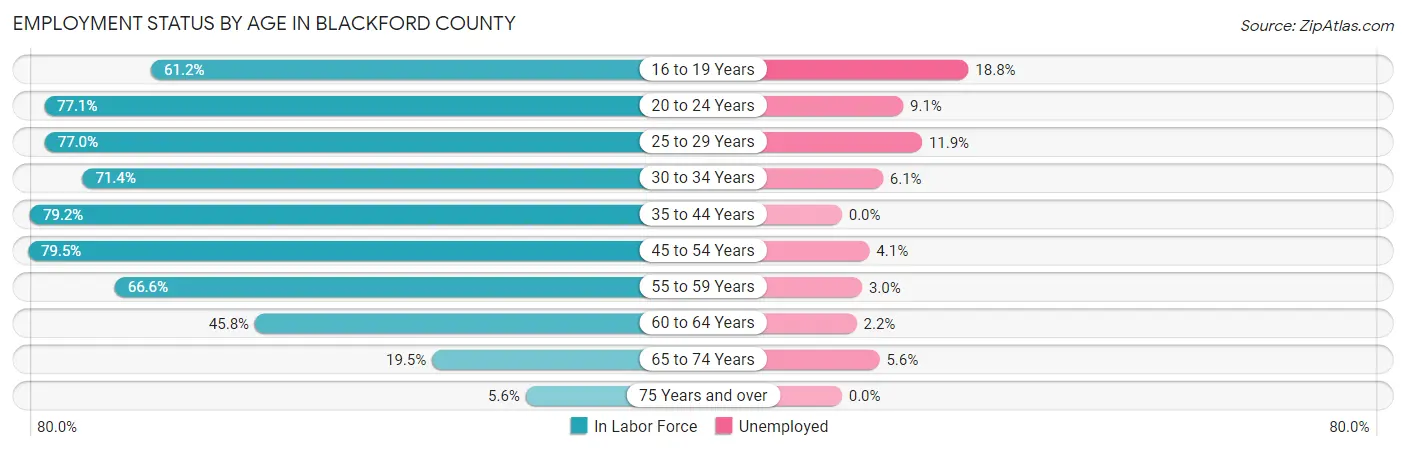
| Age Bracket | In Labor Force | Unemployed |
| 16 to 19 Years | 361 (61.2%) | 68 (18.8%) |
| 20 to 24 Years | 504 (77.1%) | 46 (9.1%) |
| 25 to 29 Years | 530 (77.0%) | 63 (11.9%) |
| 30 to 34 Years | 459 (71.4%) | 28 (6.1%) |
| 35 to 44 Years | 968 (79.2%) | 0 (0.0%) |
| 45 to 54 Years | 1,247 (79.5%) | 51 (4.1%) |
| 55 to 59 Years | 723 (66.6%) | 22 (3.0%) |
| 60 to 64 Years | 312 (45.8%) | 7 (2.2%) |
| 65 to 74 Years | 286 (19.5%) | 16 (5.6%) |
| 75 Years and over | 63 (5.6%) | 0 (0.0%) |
| Total | 5,452 (56.1%) | 300 (5.5%) |
Employment Status by Educational Attainment in Blackford County
According to labor force statistics for Blackford County, 72.0% of individuals (4,239) out of the total population between 25 and 64 years of age (5,887) are in the labor force, with 4.0% or 170 of them being unemployed. The group with the highest labor force participation rate are those with the educational attainment of bachelor's degree or higher, with 85.7% or 847 individuals in the labor force. Within the labor force, individuals with high school diploma education have the highest percentage of unemployment, with 7.7% or 138 of them being unemployed.

| Educational Attainment | In Labor Force | Unemployed |
| Less than High School | 278 (46.9%) | 0 (0.0%) |
| High School Diploma | 1,786 (68.6%) | 200 (7.7%) |
| College / Associate Degree | 1,328 (78.0%) | 0 (0.0%) |
| Bachelor's Degree or higher | 847 (85.7%) | 40 (4.0%) |
| Total | 4,239 (72.0%) | 235 (4.0%) |
Employment Occupations by Sex in Blackford County
Management, Business, Science and Arts Occupations
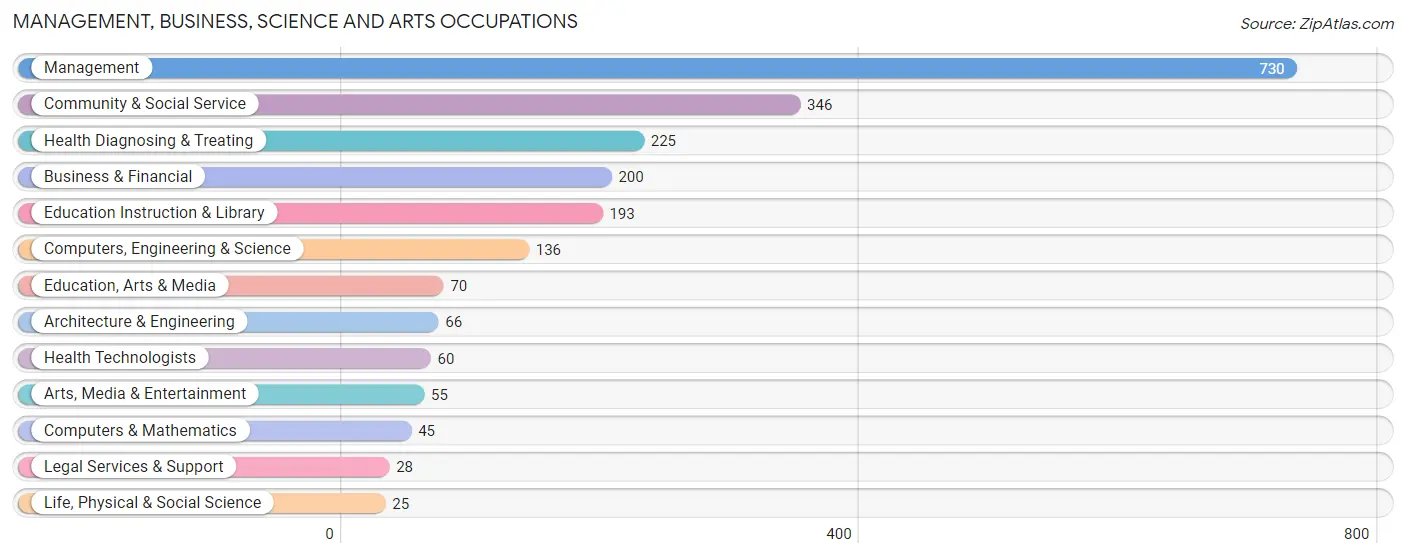
The most common Management, Business, Science and Arts occupations in Blackford County are Management (730 | 14.2%), Community & Social Service (346 | 6.7%), Health Diagnosing & Treating (225 | 4.4%), Business & Financial (200 | 3.9%), and Education Instruction & Library (193 | 3.7%).
Management, Business, Science and Arts Occupations by Sex
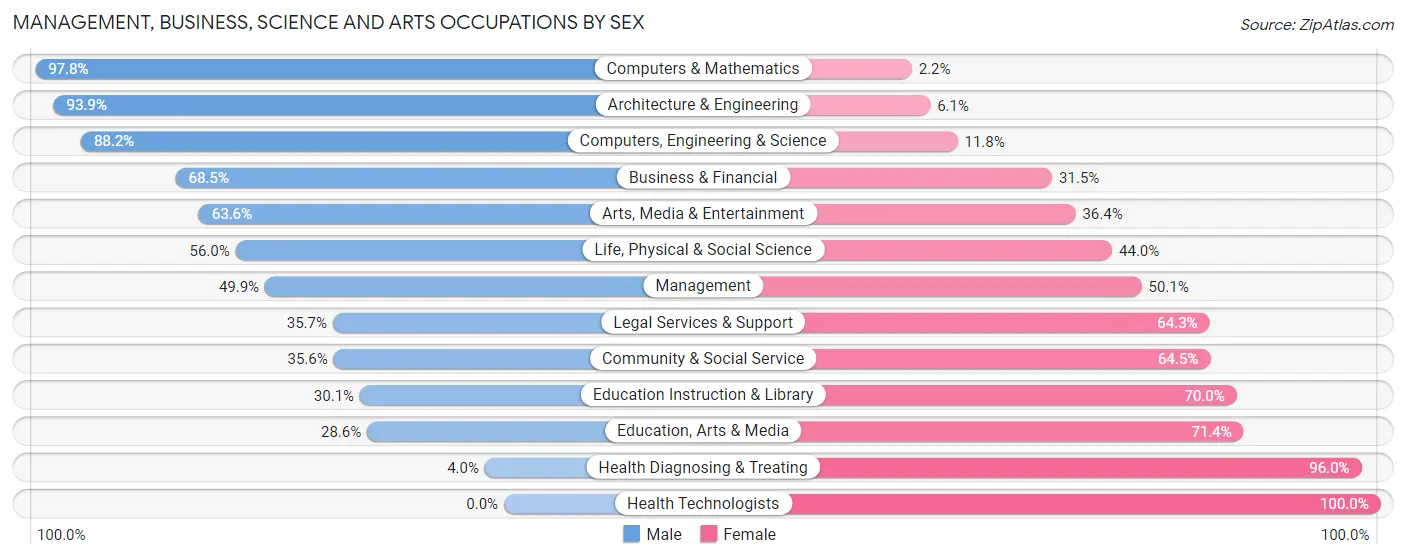
Within the Management, Business, Science and Arts occupations in Blackford County, the most male-oriented occupations are Computers & Mathematics (97.8%), Architecture & Engineering (93.9%), and Computers, Engineering & Science (88.2%), while the most female-oriented occupations are Health Technologists (100.0%), Health Diagnosing & Treating (96.0%), and Education, Arts & Media (71.4%).
| Occupation | Male | Female |
| Management | 364 (49.9%) | 366 (50.1%) |
| Business & Financial | 137 (68.5%) | 63 (31.5%) |
| Computers, Engineering & Science | 120 (88.2%) | 16 (11.8%) |
| Computers & Mathematics | 44 (97.8%) | 1 (2.2%) |
| Architecture & Engineering | 62 (93.9%) | 4 (6.1%) |
| Life, Physical & Social Science | 14 (56.0%) | 11 (44.0%) |
| Community & Social Service | 123 (35.5%) | 223 (64.4%) |
| Education, Arts & Media | 20 (28.6%) | 50 (71.4%) |
| Legal Services & Support | 10 (35.7%) | 18 (64.3%) |
| Education Instruction & Library | 58 (30.0%) | 135 (70.0%) |
| Arts, Media & Entertainment | 35 (63.6%) | 20 (36.4%) |
| Health Diagnosing & Treating | 9 (4.0%) | 216 (96.0%) |
| Health Technologists | 0 (0.0%) | 60 (100.0%) |
| Total (Category) | 753 (46.0%) | 884 (54.0%) |
| Total (Overall) | 2,671 (51.8%) | 2,480 (48.1%) |
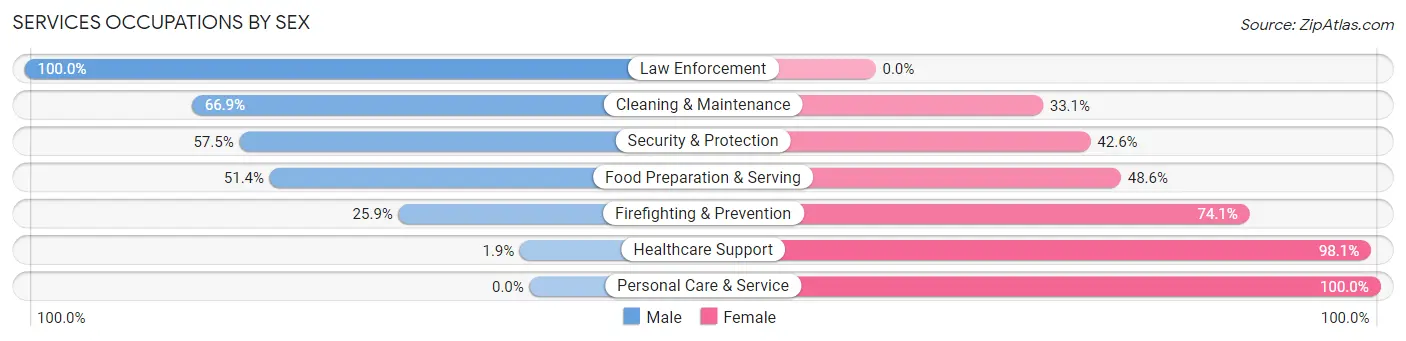
Services Occupations
The most common Services occupations in Blackford County are Food Preparation & Serving (315 | 6.1%), Healthcare Support (213 | 4.1%), Cleaning & Maintenance (154 | 3.0%), Security & Protection (94 | 1.8%), and Personal Care & Service (81 | 1.6%).

Services Occupations by Sex
Within the Services occupations in Blackford County, the most male-oriented occupations are Law Enforcement (100.0%), Cleaning & Maintenance (66.9%), and Security & Protection (57.5%), while the most female-oriented occupations are Personal Care & Service (100.0%), Healthcare Support (98.1%), and Firefighting & Prevention (74.1%).
| Occupation | Male | Female |
| Healthcare Support | 4 (1.9%) | 209 (98.1%) |
| Security & Protection | 54 (57.5%) | 40 (42.5%) |
| Firefighting & Prevention | 14 (25.9%) | 40 (74.1%) |
| Law Enforcement | 40 (100.0%) | 0 (0.0%) |
| Food Preparation & Serving | 162 (51.4%) | 153 (48.6%) |
| Cleaning & Maintenance | 103 (66.9%) | 51 (33.1%) |
| Personal Care & Service | 0 (0.0%) | 81 (100.0%) |
| Total (Category) | 323 (37.7%) | 534 (62.3%) |
| Total (Overall) | 2,671 (51.8%) | 2,480 (48.1%) |
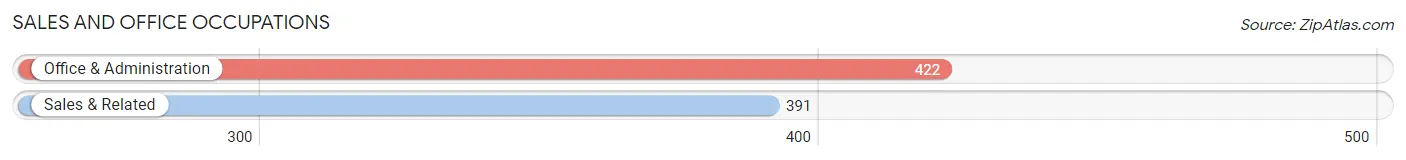
Sales and Office Occupations
The most common Sales and Office occupations in Blackford County are Office & Administration (422 | 8.2%), and Sales & Related (391 | 7.6%).
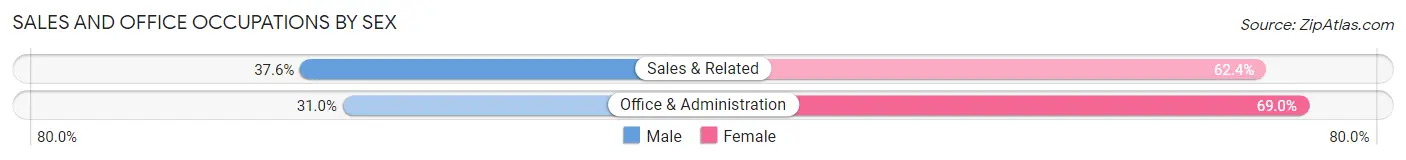
Sales and Office Occupations by Sex
| Occupation | Male | Female |
| Sales & Related | 147 (37.6%) | 244 (62.4%) |
| Office & Administration | 131 (31.0%) | 291 (69.0%) |
| Total (Category) | 278 (34.2%) | 535 (65.8%) |
| Total (Overall) | 2,671 (51.8%) | 2,480 (48.1%) |
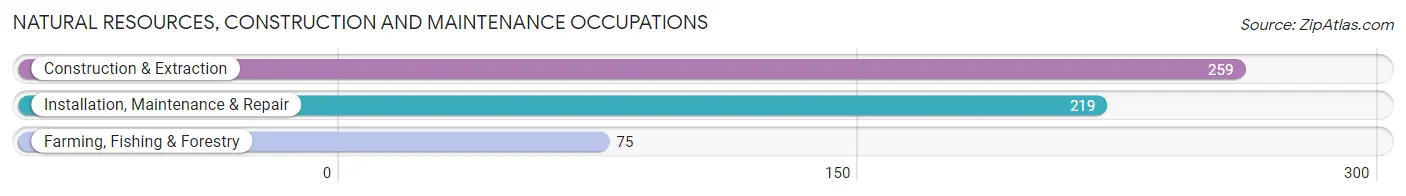
Natural Resources, Construction and Maintenance Occupations
The most common Natural Resources, Construction and Maintenance occupations in Blackford County are Construction & Extraction (259 | 5.0%), Installation, Maintenance & Repair (219 | 4.3%), and Farming, Fishing & Forestry (75 | 1.5%).
Natural Resources, Construction and Maintenance Occupations by Sex
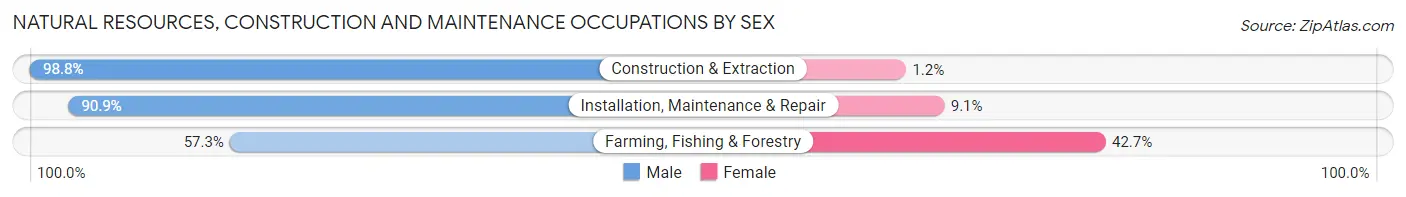
| Occupation | Male | Female |
| Farming, Fishing & Forestry | 43 (57.3%) | 32 (42.7%) |
| Construction & Extraction | 256 (98.8%) | 3 (1.2%) |
| Installation, Maintenance & Repair | 199 (90.9%) | 20 (9.1%) |
| Total (Category) | 498 (90.0%) | 55 (10.0%) |
| Total (Overall) | 2,671 (51.8%) | 2,480 (48.1%) |
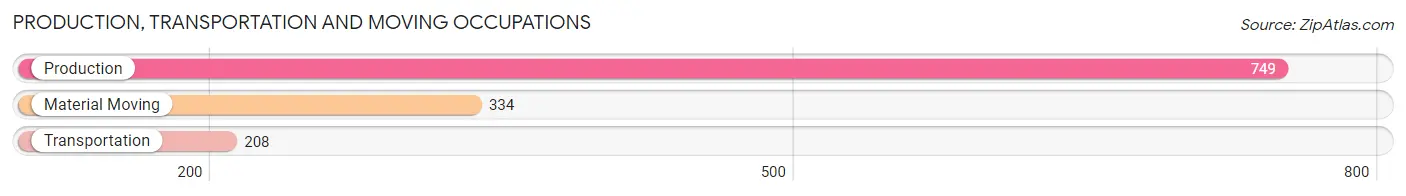
Production, Transportation and Moving Occupations
The most common Production, Transportation and Moving occupations in Blackford County are Production (749 | 14.5%), Material Moving (334 | 6.5%), and Transportation (208 | 4.0%).
Production, Transportation and Moving Occupations by Sex
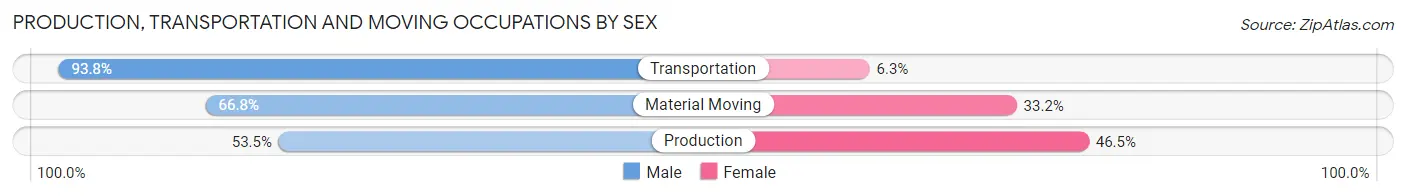
| Occupation | Male | Female |
| Production | 401 (53.5%) | 348 (46.5%) |
| Transportation | 195 (93.8%) | 13 (6.2%) |
| Material Moving | 223 (66.8%) | 111 (33.2%) |
| Total (Category) | 819 (63.4%) | 472 (36.6%) |
| Total (Overall) | 2,671 (51.8%) | 2,480 (48.1%) |
Employment Industries by Sex in Blackford County
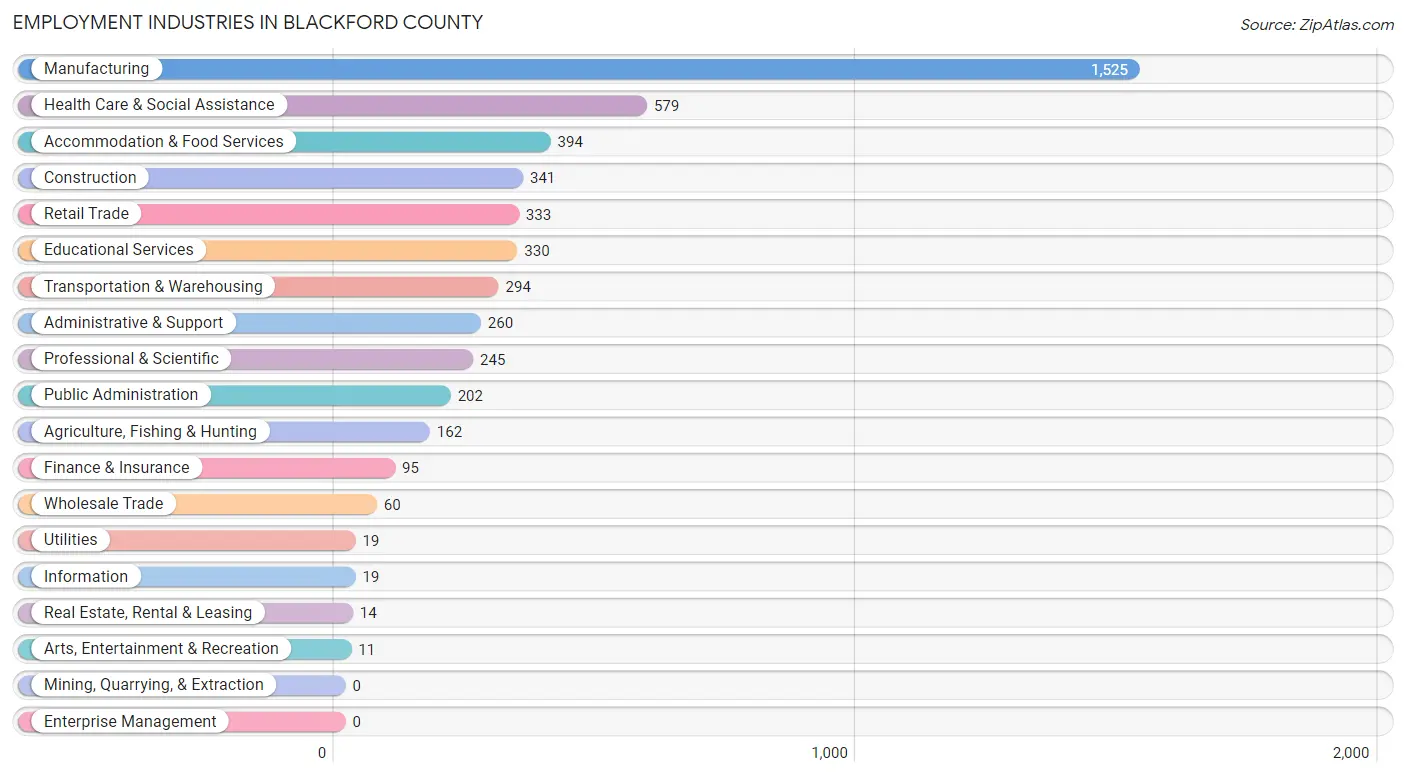
Employment Industries in Blackford County
The major employment industries in Blackford County include Manufacturing (1,525 | 29.6%), Health Care & Social Assistance (579 | 11.2%), Accommodation & Food Services (394 | 7.6%), Construction (341 | 6.6%), and Retail Trade (333 | 6.5%).
Employment Industries by Sex in Blackford County
The Blackford County industries that see more men than women are Utilities (100.0%), Arts, Entertainment & Recreation (100.0%), and Construction (93.5%), whereas the industries that tend to have a higher number of women are Health Care & Social Assistance (96.0%), Real Estate, Rental & Leasing (78.6%), and Professional & Scientific (73.9%).
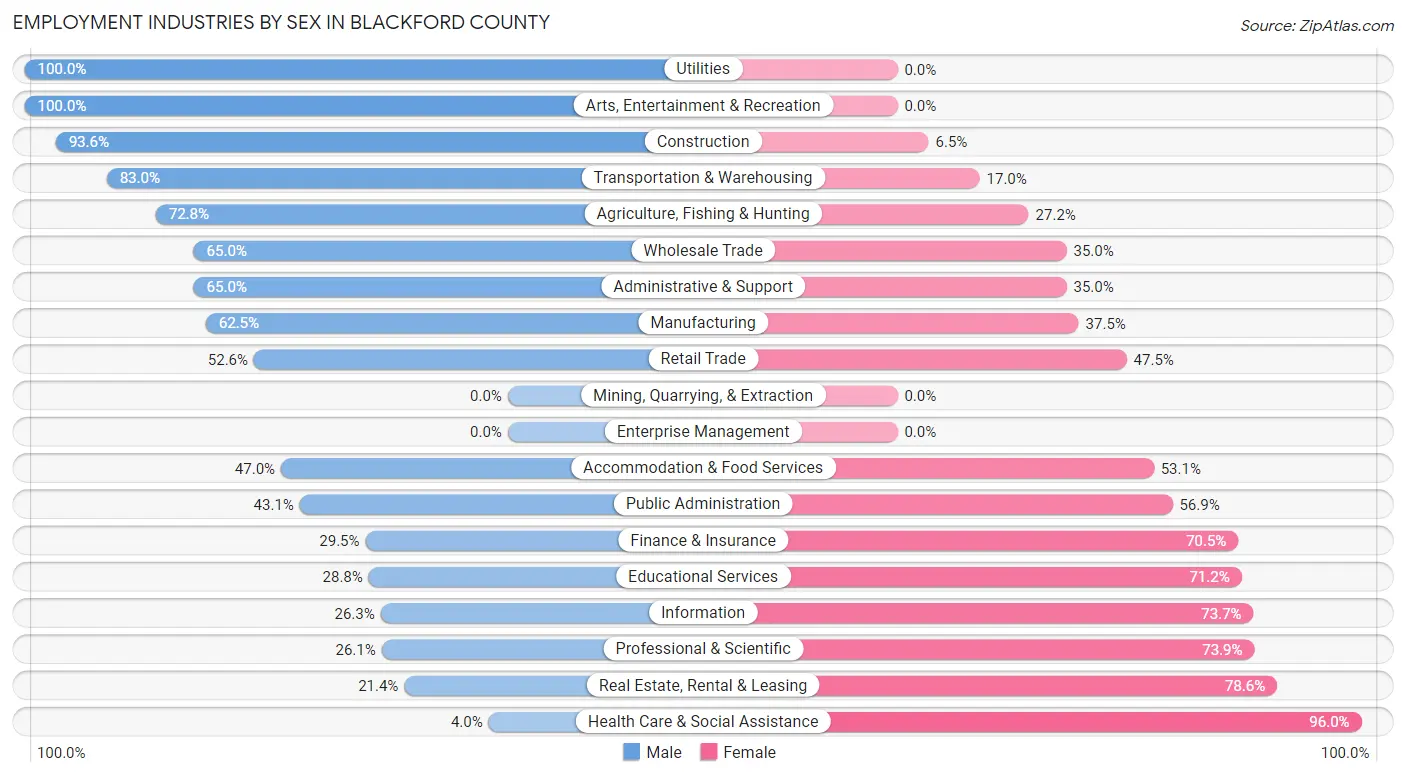
| Industry | Male | Female |
| Agriculture, Fishing & Hunting | 118 (72.8%) | 44 (27.2%) |
| Mining, Quarrying, & Extraction | 0 (0.0%) | 0 (0.0%) |
| Construction | 319 (93.5%) | 22 (6.5%) |
| Manufacturing | 953 (62.5%) | 572 (37.5%) |
| Wholesale Trade | 39 (65.0%) | 21 (35.0%) |
| Retail Trade | 175 (52.5%) | 158 (47.4%) |
| Transportation & Warehousing | 244 (83.0%) | 50 (17.0%) |
| Utilities | 19 (100.0%) | 0 (0.0%) |
| Information | 5 (26.3%) | 14 (73.7%) |
| Finance & Insurance | 28 (29.5%) | 67 (70.5%) |
| Real Estate, Rental & Leasing | 3 (21.4%) | 11 (78.6%) |
| Professional & Scientific | 64 (26.1%) | 181 (73.9%) |
| Enterprise Management | 0 (0.0%) | 0 (0.0%) |
| Administrative & Support | 169 (65.0%) | 91 (35.0%) |
| Educational Services | 95 (28.8%) | 235 (71.2%) |
| Health Care & Social Assistance | 23 (4.0%) | 556 (96.0%) |
| Arts, Entertainment & Recreation | 11 (100.0%) | 0 (0.0%) |
| Accommodation & Food Services | 185 (46.9%) | 209 (53.0%) |
| Public Administration | 87 (43.1%) | 115 (56.9%) |
| Total | 2,671 (51.8%) | 2,480 (48.1%) |
Education in Blackford County
School Enrollment in Blackford County
The most common levels of schooling among the 2,536 students in Blackford County are elementary school (843 | 33.2%), high school (532 | 21.0%), and middle school (474 | 18.7%).
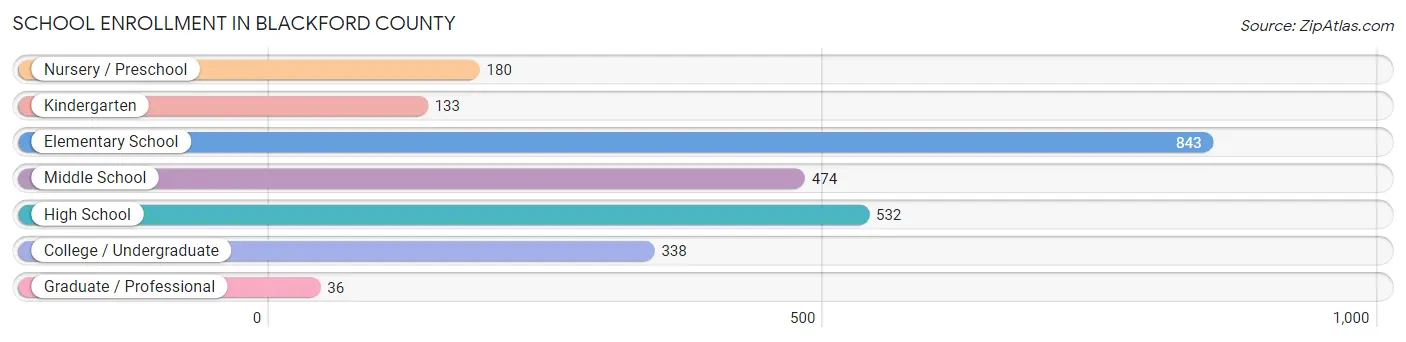
| School Level | # Students | % Students |
| Nursery / Preschool | 180 | 7.1% |
| Kindergarten | 133 | 5.2% |
| Elementary School | 843 | 33.2% |
| Middle School | 474 | 18.7% |
| High School | 532 | 21.0% |
| College / Undergraduate | 338 | 13.3% |
| Graduate / Professional | 36 | 1.4% |
| Total | 2,536 | 100.0% |
School Enrollment by Age by Funding Source in Blackford County
Out of a total of 2,536 students who are enrolled in schools in Blackford County, 269 (10.6%) attend a private institution, while the remaining 2,267 (89.4%) are enrolled in public schools. The age group of 20 to 24 year olds has the highest likelihood of being enrolled in private schools, with 52 (43.0% in the age bracket) enrolled. Conversely, the age group of 25 to 34 year olds has the lowest likelihood of being enrolled in a private school, with 60 (100.0% in the age bracket) attending a public institution.
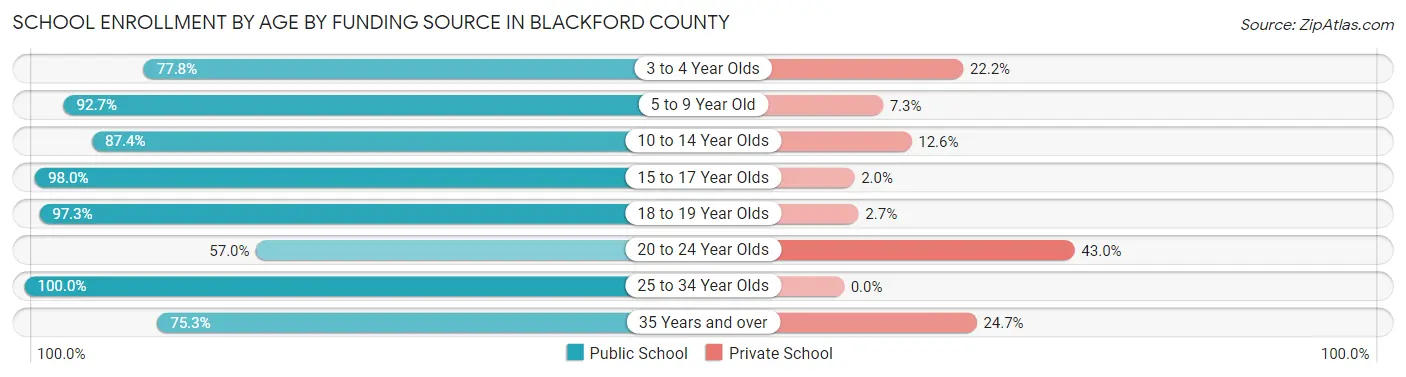
| Age Bracket | Public School | Private School |
| 3 to 4 Year Olds | 98 (77.8%) | 28 (22.2%) |
| 5 to 9 Year Old | 587 (92.7%) | 46 (7.3%) |
| 10 to 14 Year Olds | 743 (87.4%) | 107 (12.6%) |
| 15 to 17 Year Olds | 497 (98.0%) | 10 (2.0%) |
| 18 to 19 Year Olds | 142 (97.3%) | 4 (2.7%) |
| 20 to 24 Year Olds | 69 (57.0%) | 52 (43.0%) |
| 25 to 34 Year Olds | 60 (100.0%) | 0 (0.0%) |
| 35 Years and over | 70 (75.3%) | 23 (24.7%) |
| Total | 2,267 (89.4%) | 269 (10.6%) |
Educational Attainment by Field of Study in Blackford County
Education (353 | 25.9%), business (178 | 13.0%), bio, nature & agricultural (164 | 12.0%), liberal arts & history (124 | 9.1%), and social sciences (90 | 6.6%) are the most common fields of study among 1,365 individuals in Blackford County who have obtained a bachelor's degree or higher.
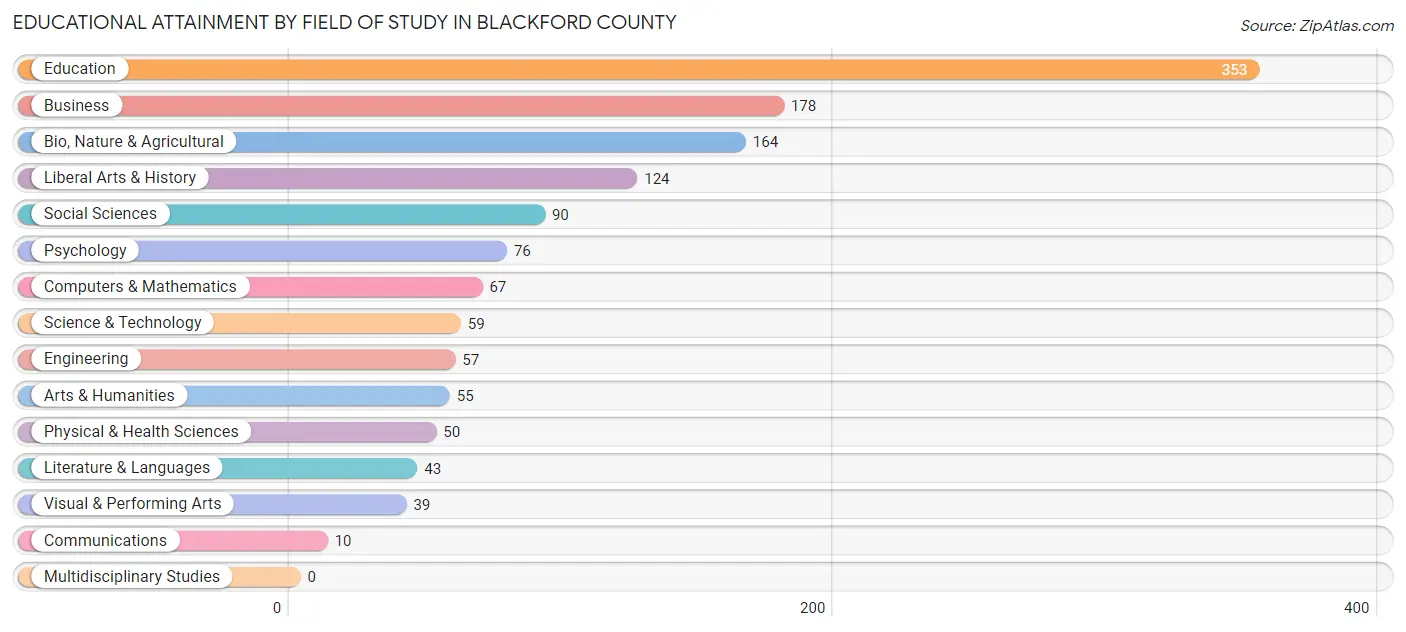
| Field of Study | # Graduates | % Graduates |
| Computers & Mathematics | 67 | 4.9% |
| Bio, Nature & Agricultural | 164 | 12.0% |
| Physical & Health Sciences | 50 | 3.7% |
| Psychology | 76 | 5.6% |
| Social Sciences | 90 | 6.6% |
| Engineering | 57 | 4.2% |
| Multidisciplinary Studies | 0 | 0.0% |
| Science & Technology | 59 | 4.3% |
| Business | 178 | 13.0% |
| Education | 353 | 25.9% |
| Literature & Languages | 43 | 3.2% |
| Liberal Arts & History | 124 | 9.1% |
| Visual & Performing Arts | 39 | 2.9% |
| Communications | 10 | 0.7% |
| Arts & Humanities | 55 | 4.0% |
| Total | 1,365 | 100.0% |
Transportation & Commute in Blackford County
Vehicle Availability by Sex in Blackford County
The most prevalent vehicle ownership categories in Blackford County are males with 2 vehicles (1,229, accounting for 48.3%) and females with 2 vehicles (1,008, making up 53.2%).
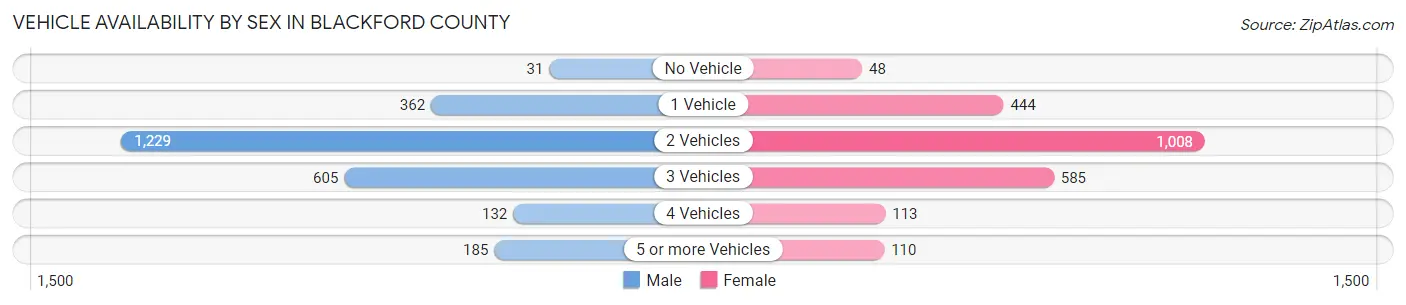
| Vehicles Available | Male | Female |
| No Vehicle | 31 (1.2%) | 48 (2.1%) |
| 1 Vehicle | 362 (14.2%) | 444 (19.2%) |
| 2 Vehicles | 1,229 (48.3%) | 1,008 (43.7%) |
| 3 Vehicles | 605 (23.8%) | 585 (25.4%) |
| 4 Vehicles | 132 (5.2%) | 113 (4.9%) |
| 5 or more Vehicles | 185 (7.3%) | 110 (4.8%) |
| Total | 2,544 (100.0%) | 2,308 (100.0%) |
Commute Time in Blackford County
The most frequently occuring commute durations in Blackford County are 5 to 9 minutes (787 commuters, 17.7%), 30 to 34 minutes (682 commuters, 15.3%), and 25 to 29 minutes (525 commuters, 11.8%).
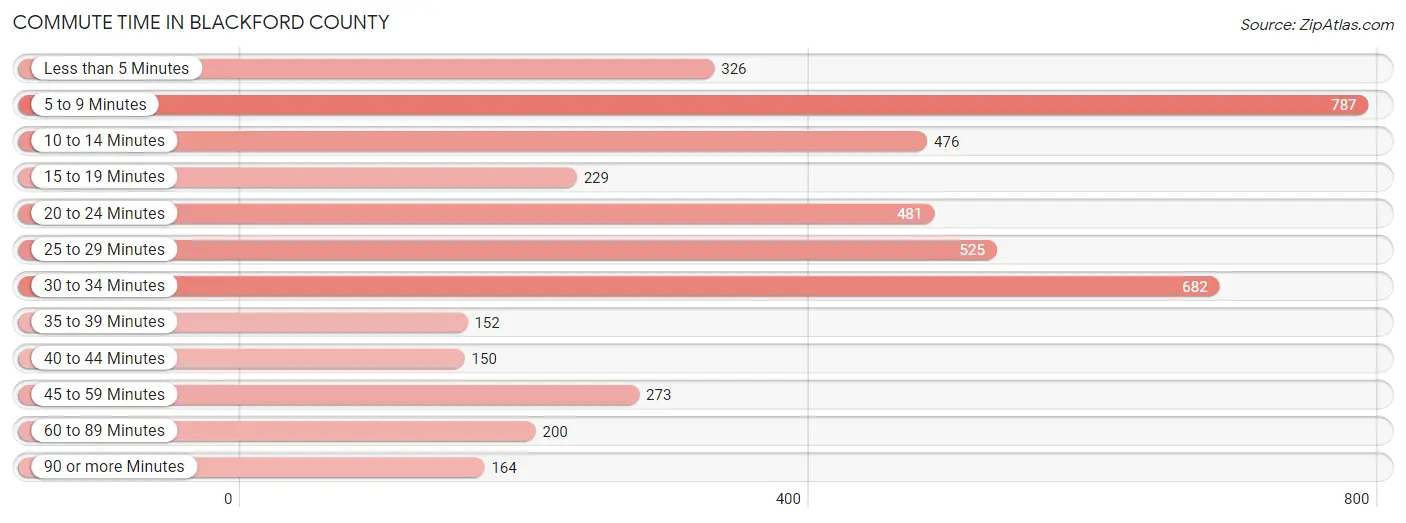
| Commute Time | # Commuters | % Commuters |
| Less than 5 Minutes | 326 | 7.3% |
| 5 to 9 Minutes | 787 | 17.7% |
| 10 to 14 Minutes | 476 | 10.7% |
| 15 to 19 Minutes | 229 | 5.1% |
| 20 to 24 Minutes | 481 | 10.8% |
| 25 to 29 Minutes | 525 | 11.8% |
| 30 to 34 Minutes | 682 | 15.3% |
| 35 to 39 Minutes | 152 | 3.4% |
| 40 to 44 Minutes | 150 | 3.4% |
| 45 to 59 Minutes | 273 | 6.1% |
| 60 to 89 Minutes | 200 | 4.5% |
| 90 or more Minutes | 164 | 3.7% |
Commute Time by Sex in Blackford County
The most common commute times in Blackford County are 5 to 9 minutes (360 commuters, 15.5%) for males and 5 to 9 minutes (427 commuters, 20.1%) for females.
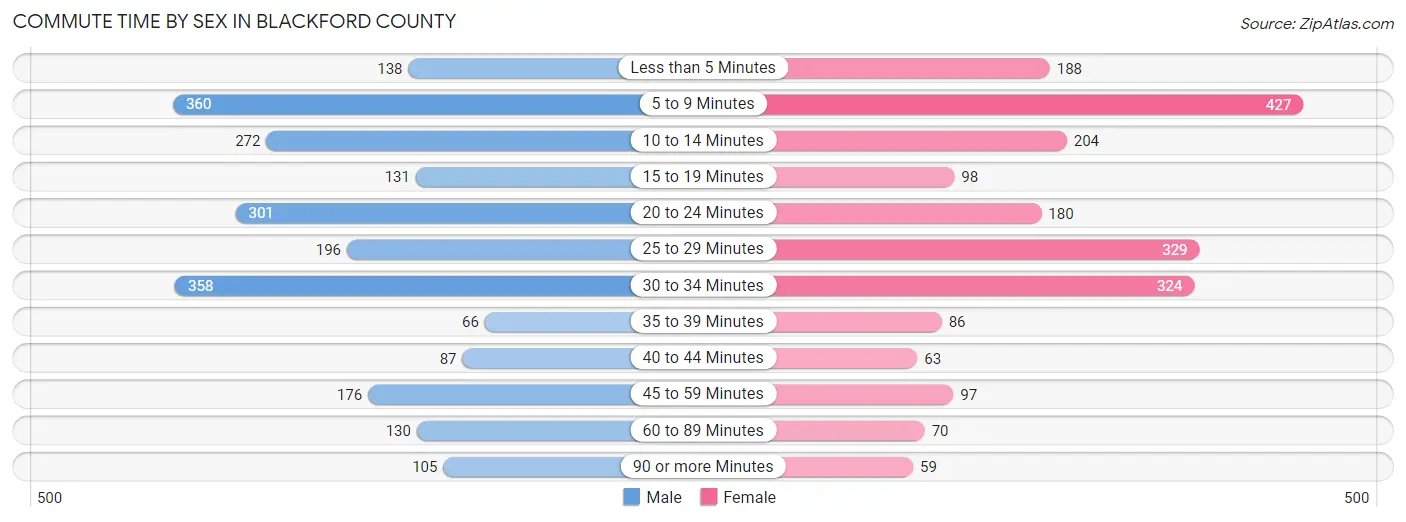
| Commute Time | Male | Female |
| Less than 5 Minutes | 138 (5.9%) | 188 (8.8%) |
| 5 to 9 Minutes | 360 (15.5%) | 427 (20.1%) |
| 10 to 14 Minutes | 272 (11.7%) | 204 (9.6%) |
| 15 to 19 Minutes | 131 (5.7%) | 98 (4.6%) |
| 20 to 24 Minutes | 301 (13.0%) | 180 (8.5%) |
| 25 to 29 Minutes | 196 (8.5%) | 329 (15.5%) |
| 30 to 34 Minutes | 358 (15.4%) | 324 (15.2%) |
| 35 to 39 Minutes | 66 (2.8%) | 86 (4.1%) |
| 40 to 44 Minutes | 87 (3.7%) | 63 (3.0%) |
| 45 to 59 Minutes | 176 (7.6%) | 97 (4.6%) |
| 60 to 89 Minutes | 130 (5.6%) | 70 (3.3%) |
| 90 or more Minutes | 105 (4.5%) | 59 (2.8%) |
Time of Departure to Work by Sex in Blackford County
The most frequent times of departure to work in Blackford County are 12:00 PM to 3:59 PM (288, 12.4%) for males and 7:30 AM to 7:59 AM (452, 21.3%) for females.
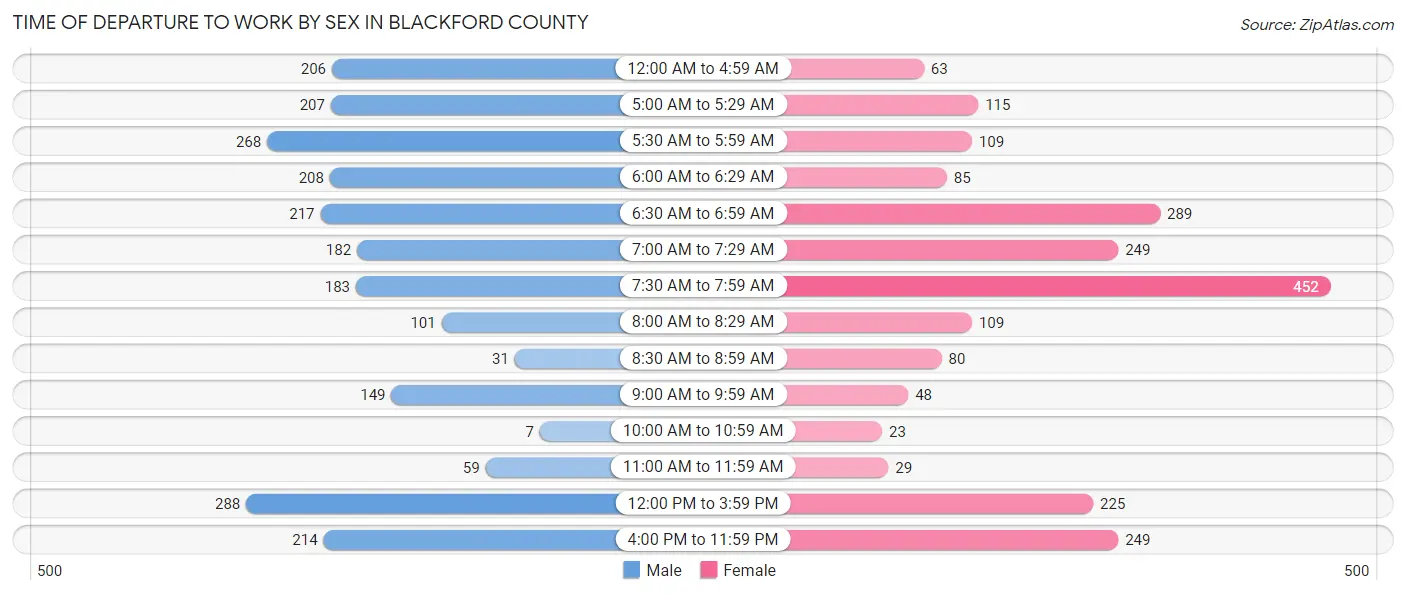
| Time of Departure | Male | Female |
| 12:00 AM to 4:59 AM | 206 (8.9%) | 63 (3.0%) |
| 5:00 AM to 5:29 AM | 207 (8.9%) | 115 (5.4%) |
| 5:30 AM to 5:59 AM | 268 (11.6%) | 109 (5.1%) |
| 6:00 AM to 6:29 AM | 208 (9.0%) | 85 (4.0%) |
| 6:30 AM to 6:59 AM | 217 (9.3%) | 289 (13.6%) |
| 7:00 AM to 7:29 AM | 182 (7.8%) | 249 (11.7%) |
| 7:30 AM to 7:59 AM | 183 (7.9%) | 452 (21.3%) |
| 8:00 AM to 8:29 AM | 101 (4.3%) | 109 (5.1%) |
| 8:30 AM to 8:59 AM | 31 (1.3%) | 80 (3.8%) |
| 9:00 AM to 9:59 AM | 149 (6.4%) | 48 (2.3%) |
| 10:00 AM to 10:59 AM | 7 (0.3%) | 23 (1.1%) |
| 11:00 AM to 11:59 AM | 59 (2.5%) | 29 (1.4%) |
| 12:00 PM to 3:59 PM | 288 (12.4%) | 225 (10.6%) |
| 4:00 PM to 11:59 PM | 214 (9.2%) | 249 (11.7%) |
| Total | 2,320 (100.0%) | 2,125 (100.0%) |
Housing Occupancy in Blackford County
Occupancy by Ownership in Blackford County
Of the total 4,980 dwellings in Blackford County, owner-occupied units account for 3,768 (75.7%), while renter-occupied units make up 1,212 (24.3%).
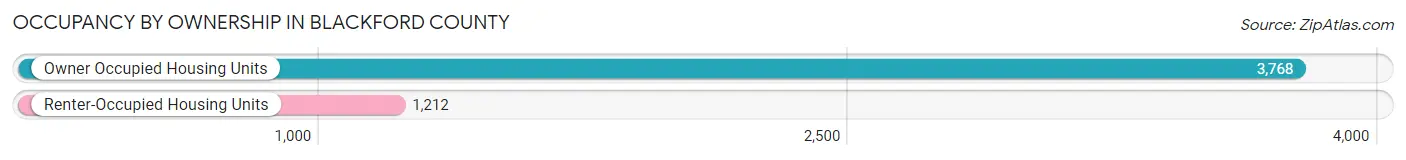
| Occupancy | # Housing Units | % Housing Units |
| Owner Occupied Housing Units | 3,768 | 75.7% |
| Renter-Occupied Housing Units | 1,212 | 24.3% |
| Total Occupied Housing Units | 4,980 | 100.0% |
Occupancy by Household Size in Blackford County
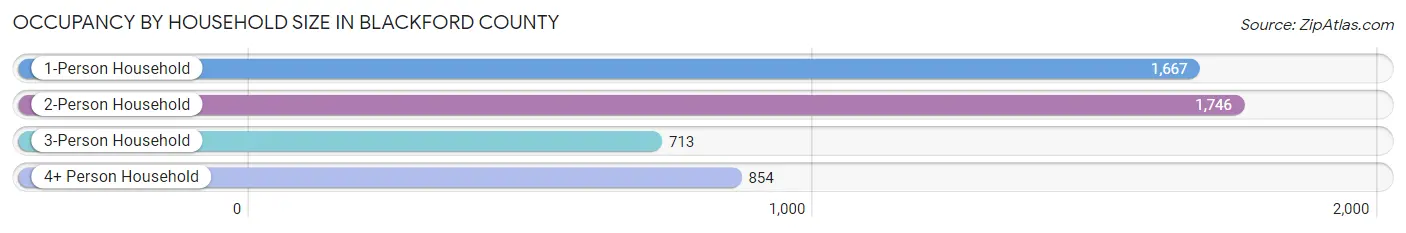
| Household Size | # Housing Units | % Housing Units |
| 1-Person Household | 1,667 | 33.5% |
| 2-Person Household | 1,746 | 35.1% |
| 3-Person Household | 713 | 14.3% |
| 4+ Person Household | 854 | 17.2% |
| Total Housing Units | 4,980 | 100.0% |
Occupancy by Ownership by Household Size in Blackford County
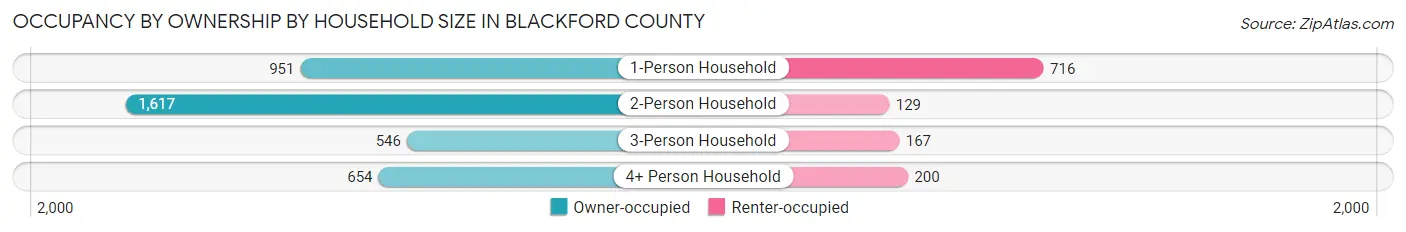
| Household Size | Owner-occupied | Renter-occupied |
| 1-Person Household | 951 (57.1%) | 716 (42.9%) |
| 2-Person Household | 1,617 (92.6%) | 129 (7.4%) |
| 3-Person Household | 546 (76.6%) | 167 (23.4%) |
| 4+ Person Household | 654 (76.6%) | 200 (23.4%) |
| Total Housing Units | 3,768 (75.7%) | 1,212 (24.3%) |
Occupancy by Educational Attainment in Blackford County
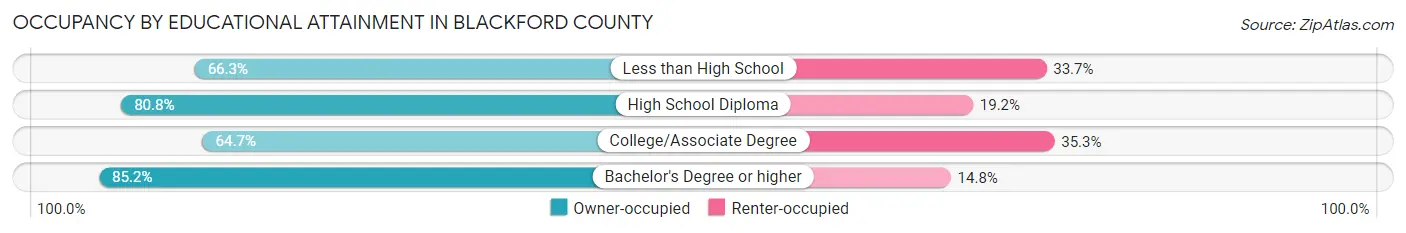
| Household Size | Owner-occupied | Renter-occupied |
| Less than High School | 279 (66.3%) | 142 (33.7%) |
| High School Diploma | 1,999 (80.8%) | 474 (19.2%) |
| College/Associate Degree | 907 (64.7%) | 495 (35.3%) |
| Bachelor's Degree or higher | 583 (85.2%) | 101 (14.8%) |
Occupancy by Age of Householder in Blackford County
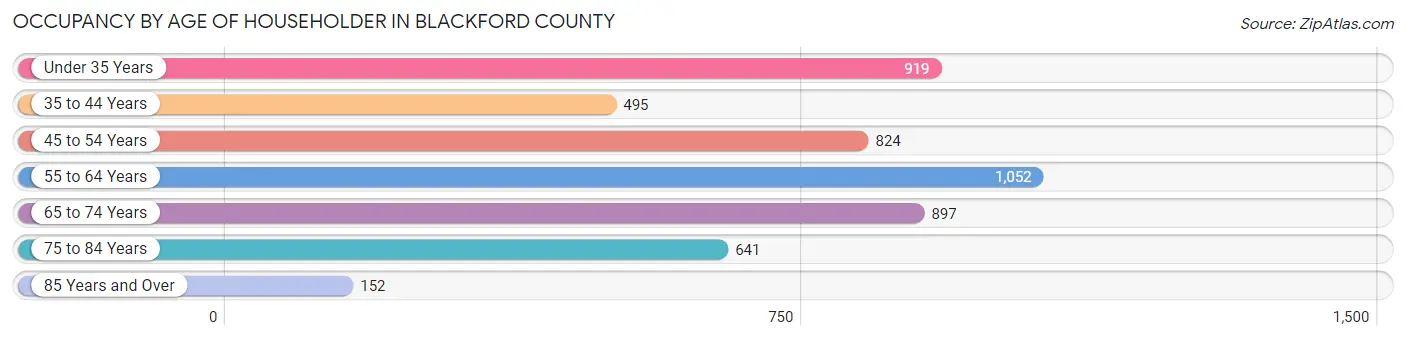
| Age Bracket | # Households | % Households |
| Under 35 Years | 919 | 18.4% |
| 35 to 44 Years | 495 | 9.9% |
| 45 to 54 Years | 824 | 16.6% |
| 55 to 64 Years | 1,052 | 21.1% |
| 65 to 74 Years | 897 | 18.0% |
| 75 to 84 Years | 641 | 12.9% |
| 85 Years and Over | 152 | 3.0% |
| Total | 4,980 | 100.0% |
Housing Finances in Blackford County
Median Income by Occupancy in Blackford County
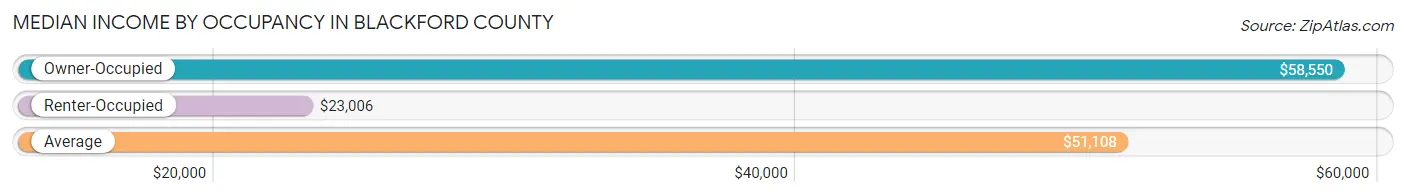
| Occupancy Type | # Households | Median Income |
| Owner-Occupied | 3,768 (75.7%) | $58,550 |
| Renter-Occupied | 1,212 (24.3%) | $23,006 |
| Average | 4,980 (100.0%) | $51,108 |
Occupancy by Householder Income Bracket in Blackford County
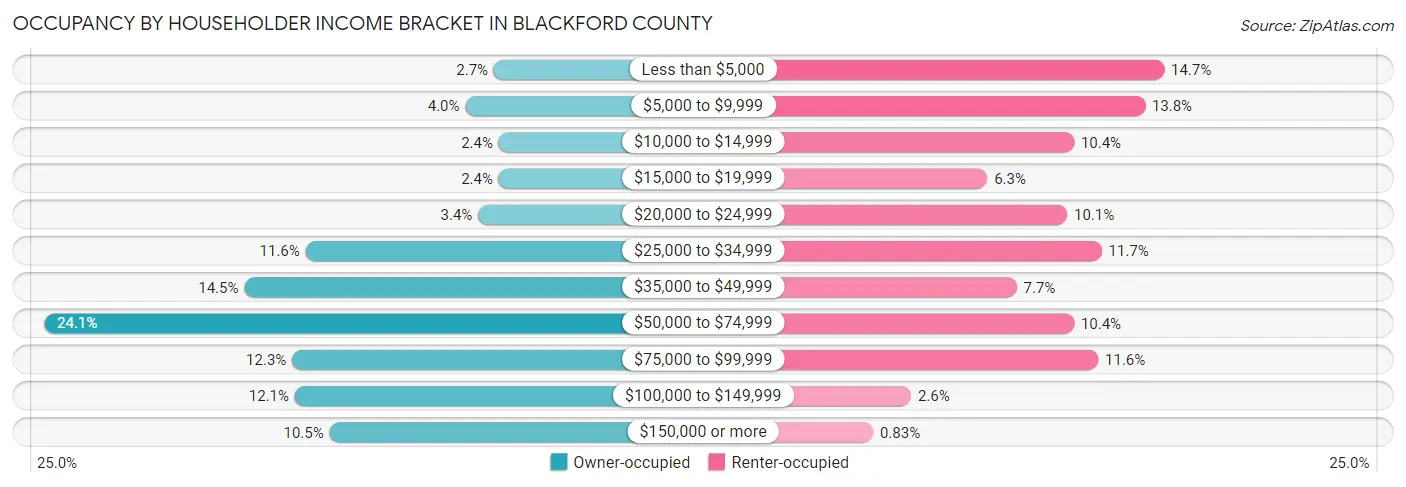
| Income Bracket | Owner-occupied | Renter-occupied |
| Less than $5,000 | 100 (2.6%) | 178 (14.7%) |
| $5,000 to $9,999 | 151 (4.0%) | 167 (13.8%) |
| $10,000 to $14,999 | 91 (2.4%) | 126 (10.4%) |
| $15,000 to $19,999 | 91 (2.4%) | 76 (6.3%) |
| $20,000 to $24,999 | 128 (3.4%) | 122 (10.1%) |
| $25,000 to $34,999 | 438 (11.6%) | 142 (11.7%) |
| $35,000 to $49,999 | 548 (14.5%) | 93 (7.7%) |
| $50,000 to $74,999 | 907 (24.1%) | 126 (10.4%) |
| $75,000 to $99,999 | 462 (12.3%) | 140 (11.6%) |
| $100,000 to $149,999 | 457 (12.1%) | 32 (2.6%) |
| $150,000 or more | 395 (10.5%) | 10 (0.8%) |
| Total | 3,768 (100.0%) | 1,212 (100.0%) |
Monthly Housing Cost Tiers in Blackford County
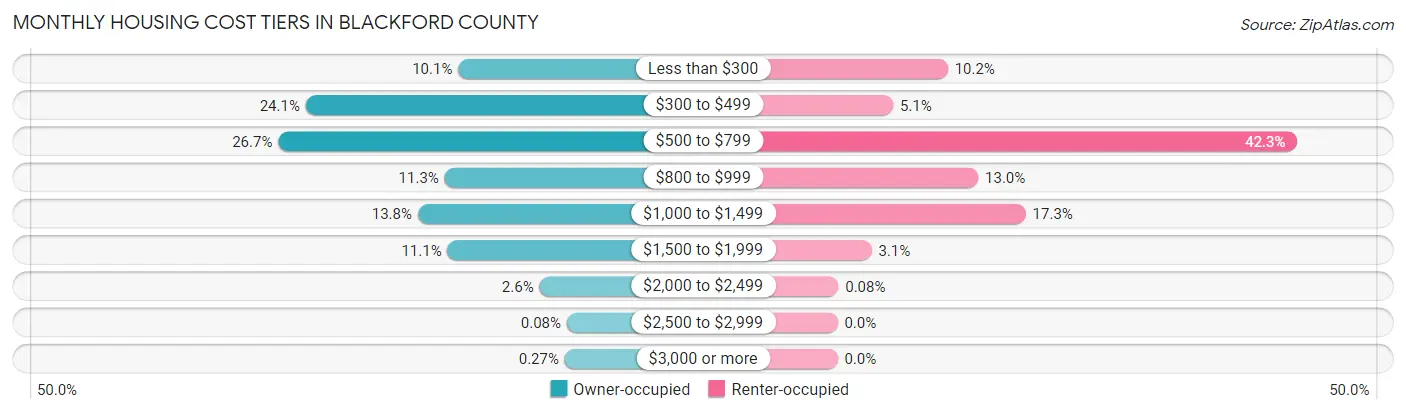
| Monthly Cost | Owner-occupied | Renter-occupied |
| Less than $300 | 380 (10.1%) | 123 (10.2%) |
| $300 to $499 | 909 (24.1%) | 62 (5.1%) |
| $500 to $799 | 1,004 (26.7%) | 513 (42.3%) |
| $800 to $999 | 427 (11.3%) | 157 (13.0%) |
| $1,000 to $1,499 | 520 (13.8%) | 210 (17.3%) |
| $1,500 to $1,999 | 417 (11.1%) | 38 (3.1%) |
| $2,000 to $2,499 | 98 (2.6%) | 1 (0.1%) |
| $2,500 to $2,999 | 3 (0.1%) | 0 (0.0%) |
| $3,000 or more | 10 (0.3%) | 0 (0.0%) |
| Total | 3,768 (100.0%) | 1,212 (100.0%) |
Physical Housing Characteristics in Blackford County
Housing Structures in Blackford County
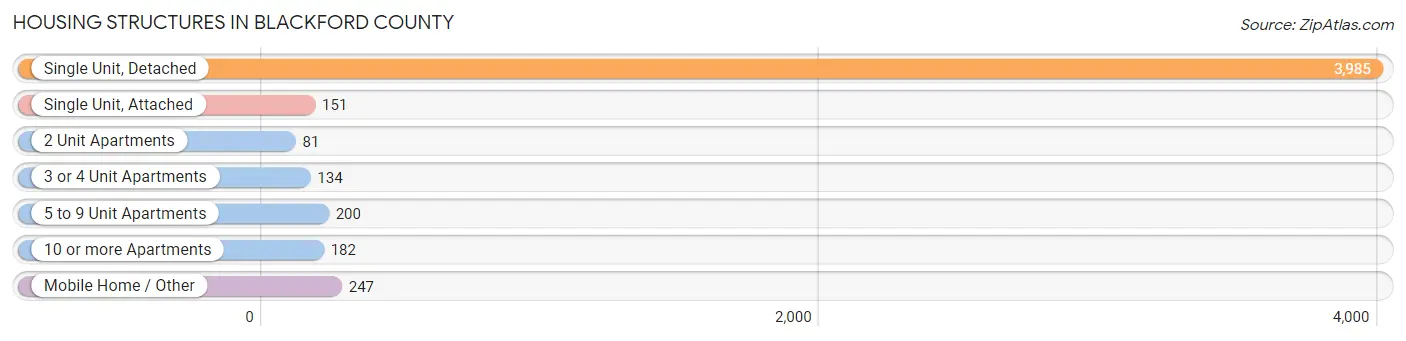
| Structure Type | # Housing Units | % Housing Units |
| Single Unit, Detached | 3,985 | 80.0% |
| Single Unit, Attached | 151 | 3.0% |
| 2 Unit Apartments | 81 | 1.6% |
| 3 or 4 Unit Apartments | 134 | 2.7% |
| 5 to 9 Unit Apartments | 200 | 4.0% |
| 10 or more Apartments | 182 | 3.6% |
| Mobile Home / Other | 247 | 5.0% |
| Total | 4,980 | 100.0% |
Housing Structures by Occupancy in Blackford County
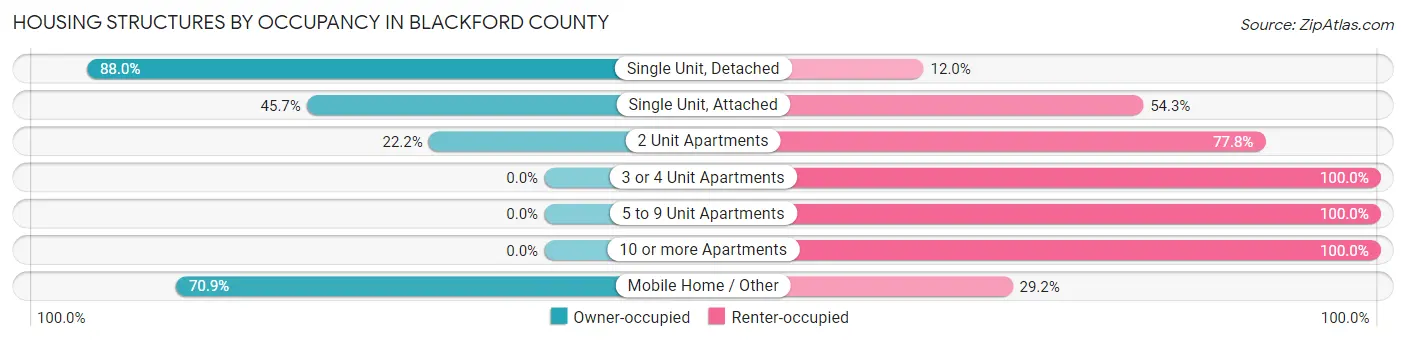
| Structure Type | Owner-occupied | Renter-occupied |
| Single Unit, Detached | 3,506 (88.0%) | 479 (12.0%) |
| Single Unit, Attached | 69 (45.7%) | 82 (54.3%) |
| 2 Unit Apartments | 18 (22.2%) | 63 (77.8%) |
| 3 or 4 Unit Apartments | 0 (0.0%) | 134 (100.0%) |
| 5 to 9 Unit Apartments | 0 (0.0%) | 200 (100.0%) |
| 10 or more Apartments | 0 (0.0%) | 182 (100.0%) |
| Mobile Home / Other | 175 (70.9%) | 72 (29.1%) |
| Total | 3,768 (75.7%) | 1,212 (24.3%) |
Housing Structures by Number of Rooms in Blackford County
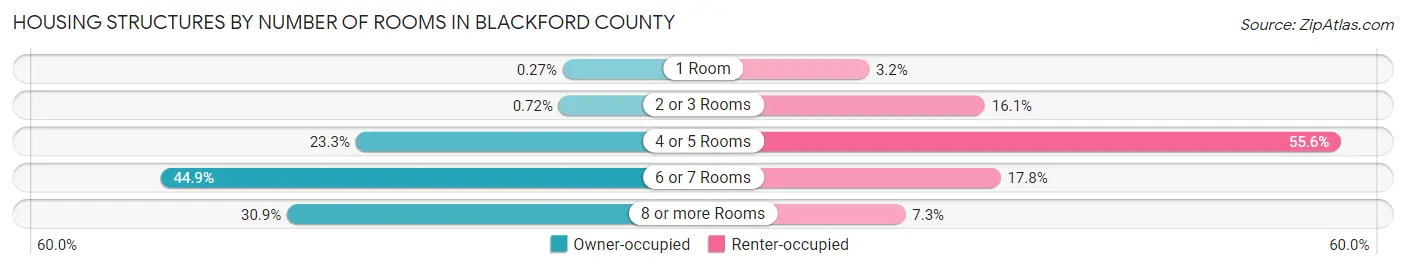
| Number of Rooms | Owner-occupied | Renter-occupied |
| 1 Room | 10 (0.3%) | 39 (3.2%) |
| 2 or 3 Rooms | 27 (0.7%) | 195 (16.1%) |
| 4 or 5 Rooms | 876 (23.3%) | 674 (55.6%) |
| 6 or 7 Rooms | 1,692 (44.9%) | 216 (17.8%) |
| 8 or more Rooms | 1,163 (30.9%) | 88 (7.3%) |
| Total | 3,768 (100.0%) | 1,212 (100.0%) |
Housing Structure by Heating Type in Blackford County
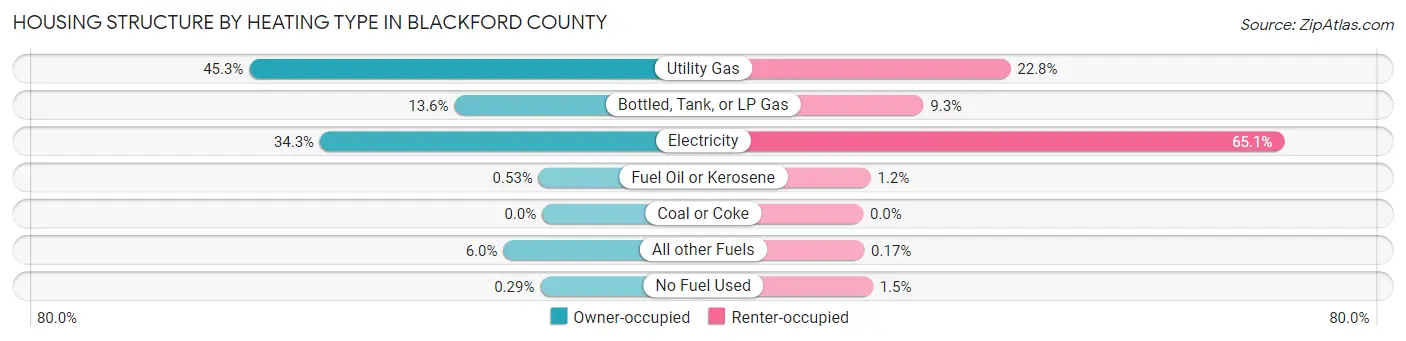
| Heating Type | Owner-occupied | Renter-occupied |
| Utility Gas | 1,706 (45.3%) | 276 (22.8%) |
| Bottled, Tank, or LP Gas | 511 (13.6%) | 113 (9.3%) |
| Electricity | 1,294 (34.3%) | 789 (65.1%) |
| Fuel Oil or Kerosene | 20 (0.5%) | 14 (1.2%) |
| Coal or Coke | 0 (0.0%) | 0 (0.0%) |
| All other Fuels | 226 (6.0%) | 2 (0.2%) |
| No Fuel Used | 11 (0.3%) | 18 (1.5%) |
| Total | 3,768 (100.0%) | 1,212 (100.0%) |
Household Vehicle Usage in Blackford County
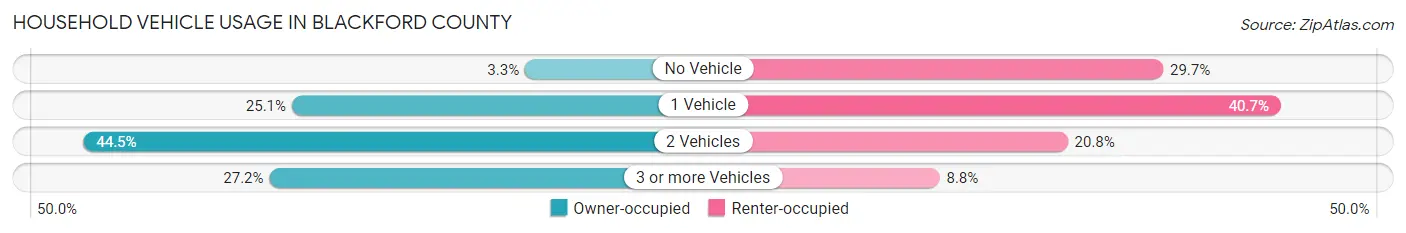
| Vehicles per Household | Owner-occupied | Renter-occupied |
| No Vehicle | 124 (3.3%) | 360 (29.7%) |
| 1 Vehicle | 944 (25.1%) | 493 (40.7%) |
| 2 Vehicles | 1,677 (44.5%) | 252 (20.8%) |
| 3 or more Vehicles | 1,023 (27.2%) | 107 (8.8%) |
| Total | 3,768 (100.0%) | 1,212 (100.0%) |
Real Estate & Mortgages in Blackford County
Real Estate and Mortgage Overview in Blackford County
| Characteristic | Without Mortgage | With Mortgage |
| Housing Units | 1,825 | 1,943 |
| Median Property Value | $67,100 | $116,400 |
| Median Household Income | $39,767 | $306 |
| Monthly Housing Costs | $417 | $10 |
| Real Estate Taxes | $666 | $91 |
Property Value by Mortgage Status in Blackford County
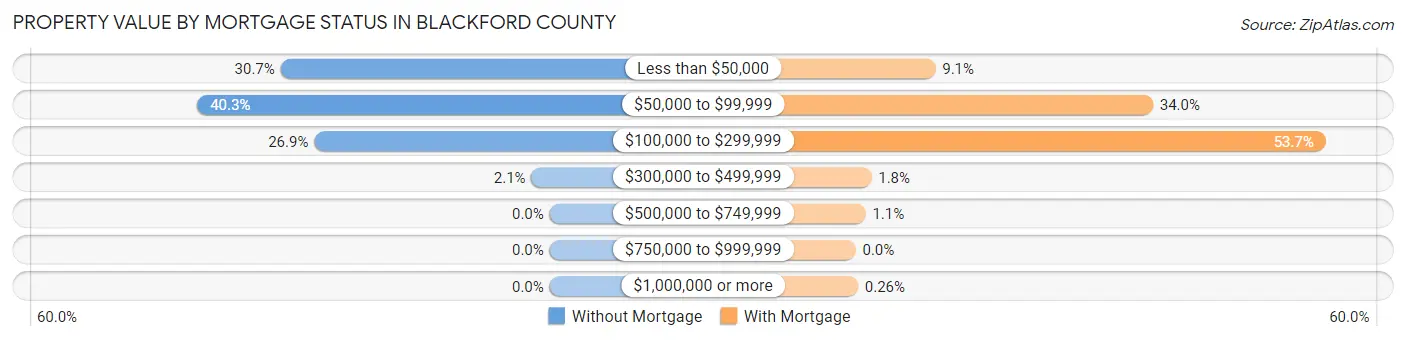
| Property Value | Without Mortgage | With Mortgage |
| Less than $50,000 | 561 (30.7%) | 177 (9.1%) |
| $50,000 to $99,999 | 735 (40.3%) | 660 (34.0%) |
| $100,000 to $299,999 | 491 (26.9%) | 1,044 (53.7%) |
| $300,000 to $499,999 | 38 (2.1%) | 35 (1.8%) |
| $500,000 to $749,999 | 0 (0.0%) | 22 (1.1%) |
| $750,000 to $999,999 | 0 (0.0%) | 0 (0.0%) |
| $1,000,000 or more | 0 (0.0%) | 5 (0.3%) |
| Total | 1,825 (100.0%) | 1,943 (100.0%) |
Household Income by Mortgage Status in Blackford County

| Household Income | Without Mortgage | With Mortgage |
| Less than $10,000 | 196 (10.7%) | 93 (4.8%) |
| $10,000 to $24,999 | 214 (11.7%) | 55 (2.8%) |
| $25,000 to $34,999 | 335 (18.4%) | 96 (4.9%) |
| $35,000 to $49,999 | 350 (19.2%) | 103 (5.3%) |
| $50,000 to $74,999 | 301 (16.5%) | 198 (10.2%) |
| $75,000 to $99,999 | 161 (8.8%) | 606 (31.2%) |
| $100,000 to $149,999 | 179 (9.8%) | 301 (15.5%) |
| $150,000 or more | 89 (4.9%) | 278 (14.3%) |
| Total | 1,825 (100.0%) | 1,943 (100.0%) |
Property Value to Household Income Ratio in Blackford County
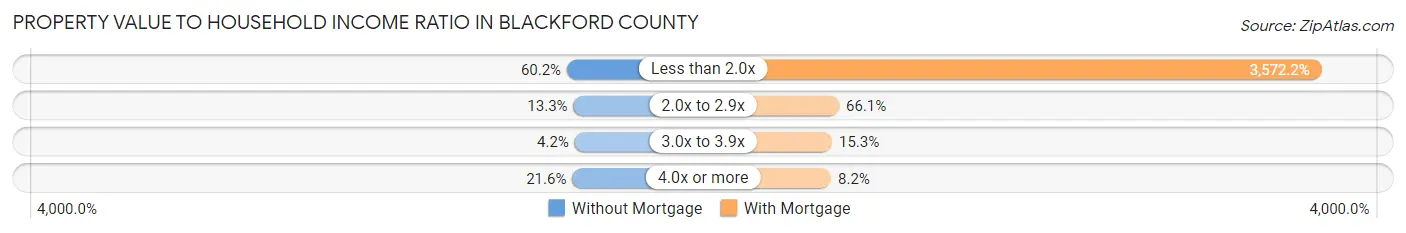
| Value-to-Income Ratio | Without Mortgage | With Mortgage |
| Less than 2.0x | 1,099 (60.2%) | 69,408 (3,572.2%) |
| 2.0x to 2.9x | 242 (13.3%) | 1,285 (66.1%) |
| 3.0x to 3.9x | 77 (4.2%) | 297 (15.3%) |
| 4.0x or more | 394 (21.6%) | 160 (8.2%) |
| Total | 1,825 (100.0%) | 1,943 (100.0%) |
Real Estate Taxes by Mortgage Status in Blackford County
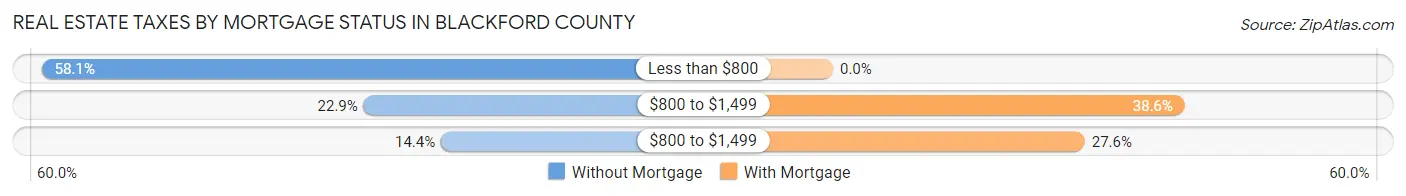
| Property Taxes | Without Mortgage | With Mortgage |
| Less than $800 | 1,061 (58.1%) | 0 (0.0%) |
| $800 to $1,499 | 417 (22.9%) | 749 (38.6%) |
| $800 to $1,499 | 262 (14.4%) | 536 (27.6%) |
| Total | 1,825 (100.0%) | 1,943 (100.0%) |
Health & Disability in Blackford County
Health Insurance Coverage by Age in Blackford County
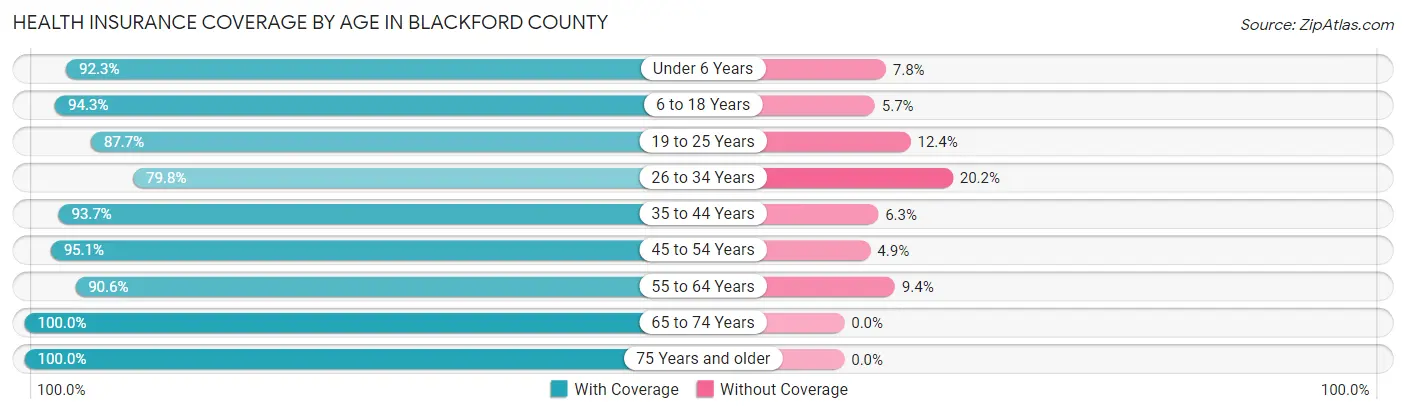
| Age Bracket | With Coverage | Without Coverage |
| Under 6 Years | 690 (92.2%) | 58 (7.7%) |
| 6 to 18 Years | 1,902 (94.3%) | 115 (5.7%) |
| 19 to 25 Years | 901 (87.6%) | 127 (12.3%) |
| 26 to 34 Years | 891 (79.8%) | 226 (20.2%) |
| 35 to 44 Years | 1,126 (93.7%) | 76 (6.3%) |
| 45 to 54 Years | 1,483 (95.1%) | 76 (4.9%) |
| 55 to 64 Years | 1,593 (90.6%) | 166 (9.4%) |
| 65 to 74 Years | 1,461 (100.0%) | 0 (0.0%) |
| 75 Years and older | 1,041 (100.0%) | 0 (0.0%) |
| Total | 11,088 (92.9%) | 844 (7.1%) |
Health Insurance Coverage by Citizenship Status in Blackford County
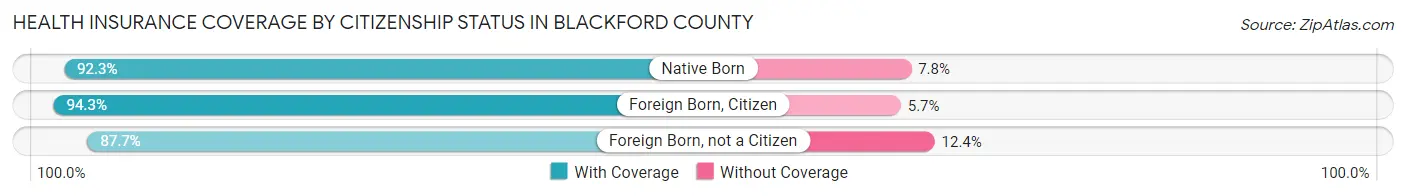
| Citizenship Status | With Coverage | Without Coverage |
| Native Born | 690 (92.2%) | 58 (7.7%) |
| Foreign Born, Citizen | 1,902 (94.3%) | 115 (5.7%) |
| Foreign Born, not a Citizen | 901 (87.6%) | 127 (12.3%) |
Health Insurance Coverage by Household Income in Blackford County
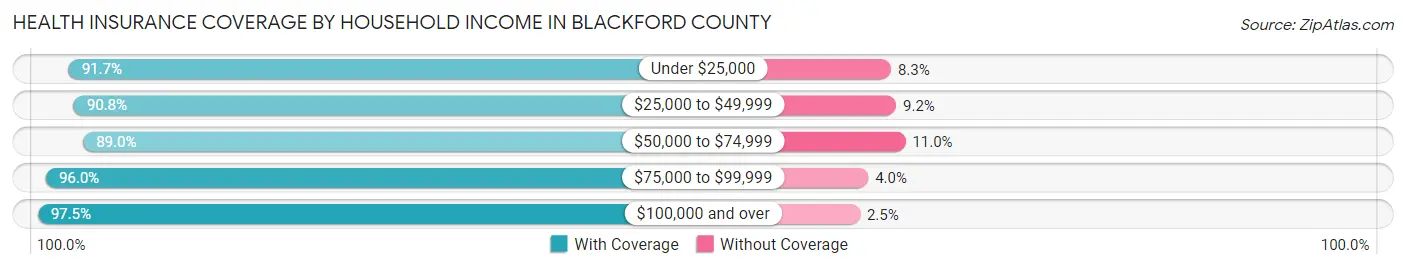
| Household Income | With Coverage | Without Coverage |
| Under $25,000 | 1,950 (91.7%) | 176 (8.3%) |
| $25,000 to $49,999 | 2,173 (90.8%) | 221 (9.2%) |
| $50,000 to $74,999 | 2,502 (89.0%) | 309 (11.0%) |
| $75,000 to $99,999 | 1,507 (96.0%) | 63 (4.0%) |
| $100,000 and over | 2,956 (97.5%) | 75 (2.5%) |
Public vs Private Health Insurance Coverage by Age in Blackford County
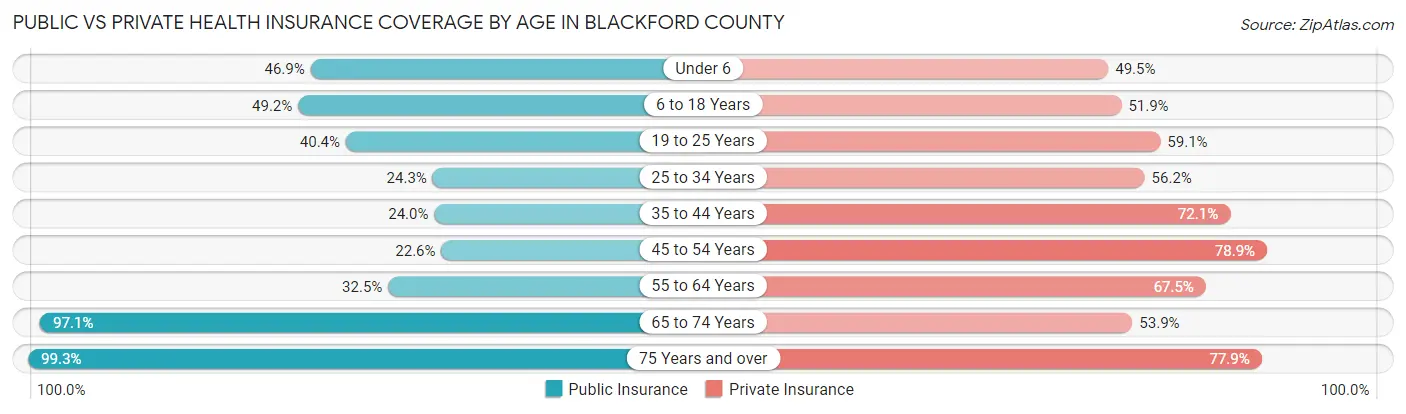
| Age Bracket | Public Insurance | Private Insurance |
| Under 6 | 351 (46.9%) | 370 (49.5%) |
| 6 to 18 Years | 993 (49.2%) | 1,047 (51.9%) |
| 19 to 25 Years | 415 (40.4%) | 608 (59.1%) |
| 25 to 34 Years | 271 (24.3%) | 628 (56.2%) |
| 35 to 44 Years | 288 (24.0%) | 866 (72.1%) |
| 45 to 54 Years | 353 (22.6%) | 1,230 (78.9%) |
| 55 to 64 Years | 572 (32.5%) | 1,188 (67.5%) |
| 65 to 74 Years | 1,419 (97.1%) | 788 (53.9%) |
| 75 Years and over | 1,034 (99.3%) | 811 (77.9%) |
| Total | 5,696 (47.7%) | 7,536 (63.2%) |
Disability Status by Sex by Age in Blackford County
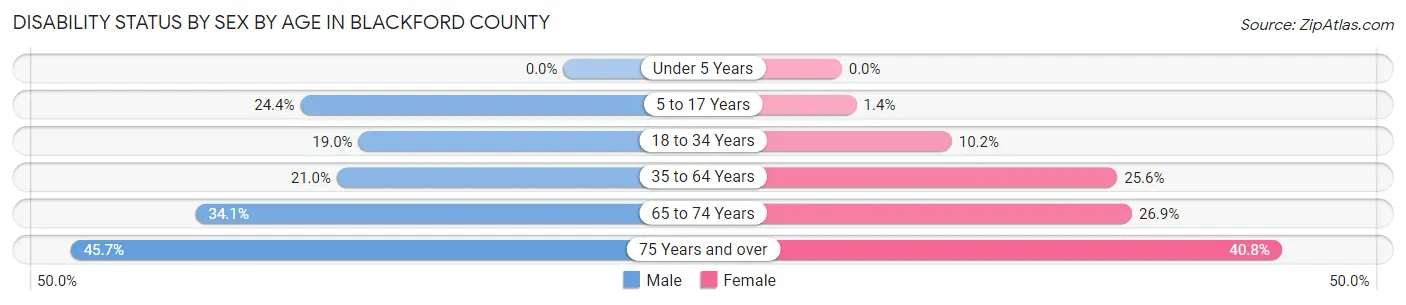
| Age Bracket | Male | Female |
| Under 5 Years | 0 (0.0%) | 0 (0.0%) |
| 5 to 17 Years | 248 (24.4%) | 14 (1.4%) |
| 18 to 34 Years | 224 (19.0%) | 110 (10.2%) |
| 35 to 64 Years | 462 (21.0%) | 594 (25.6%) |
| 65 to 74 Years | 244 (34.1%) | 201 (26.9%) |
| 75 Years and over | 187 (45.7%) | 258 (40.8%) |
Disability Class by Sex by Age in Blackford County
Disability Class: Hearing Difficulty
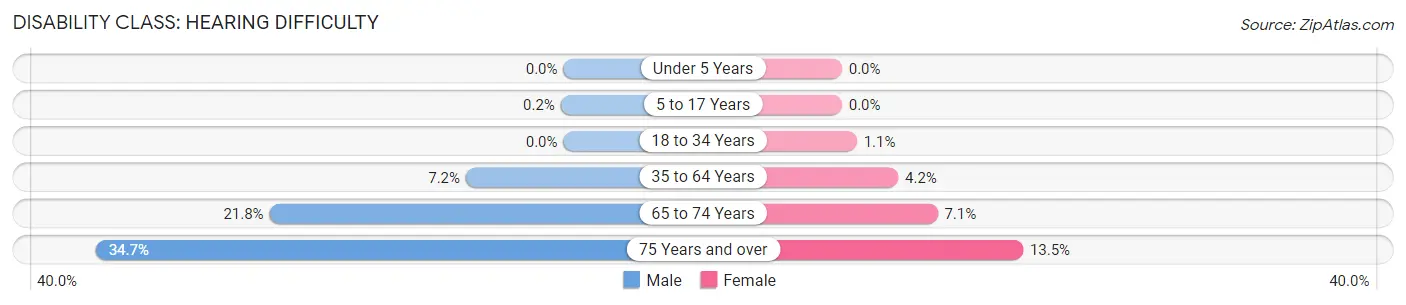
| Age Bracket | Male | Female |
| Under 5 Years | 0 (0.0%) | 0 (0.0%) |
| 5 to 17 Years | 2 (0.2%) | 0 (0.0%) |
| 18 to 34 Years | 0 (0.0%) | 12 (1.1%) |
| 35 to 64 Years | 159 (7.2%) | 97 (4.2%) |
| 65 to 74 Years | 156 (21.8%) | 53 (7.1%) |
| 75 Years and over | 142 (34.7%) | 85 (13.5%) |
Disability Class: Vision Difficulty
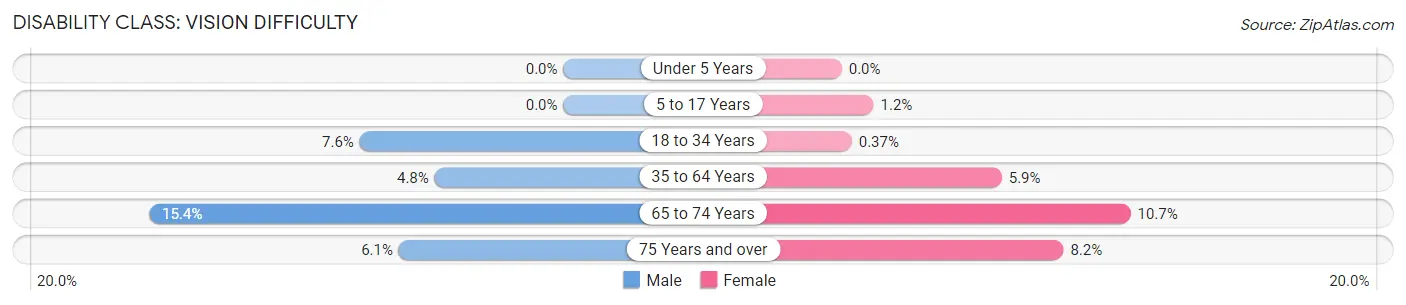
| Age Bracket | Male | Female |
| Under 5 Years | 0 (0.0%) | 0 (0.0%) |
| 5 to 17 Years | 0 (0.0%) | 12 (1.2%) |
| 18 to 34 Years | 89 (7.6%) | 4 (0.4%) |
| 35 to 64 Years | 105 (4.8%) | 138 (5.9%) |
| 65 to 74 Years | 110 (15.4%) | 80 (10.7%) |
| 75 Years and over | 25 (6.1%) | 52 (8.2%) |
Disability Class: Cognitive Difficulty
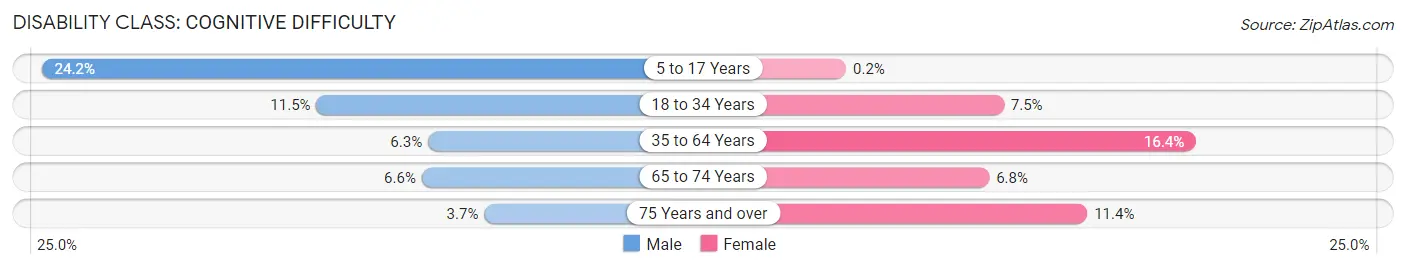
| Age Bracket | Male | Female |
| 5 to 17 Years | 246 (24.2%) | 2 (0.2%) |
| 18 to 34 Years | 135 (11.5%) | 81 (7.5%) |
| 35 to 64 Years | 138 (6.3%) | 382 (16.4%) |
| 65 to 74 Years | 47 (6.6%) | 51 (6.8%) |
| 75 Years and over | 15 (3.7%) | 72 (11.4%) |
Disability Class: Ambulatory Difficulty

| Age Bracket | Male | Female |
| 5 to 17 Years | 0 (0.0%) | 0 (0.0%) |
| 18 to 34 Years | 116 (9.9%) | 9 (0.8%) |
| 35 to 64 Years | 260 (11.8%) | 359 (15.4%) |
| 65 to 74 Years | 159 (22.2%) | 179 (24.0%) |
| 75 Years and over | 107 (26.2%) | 189 (29.9%) |
Disability Class: Self-Care Difficulty
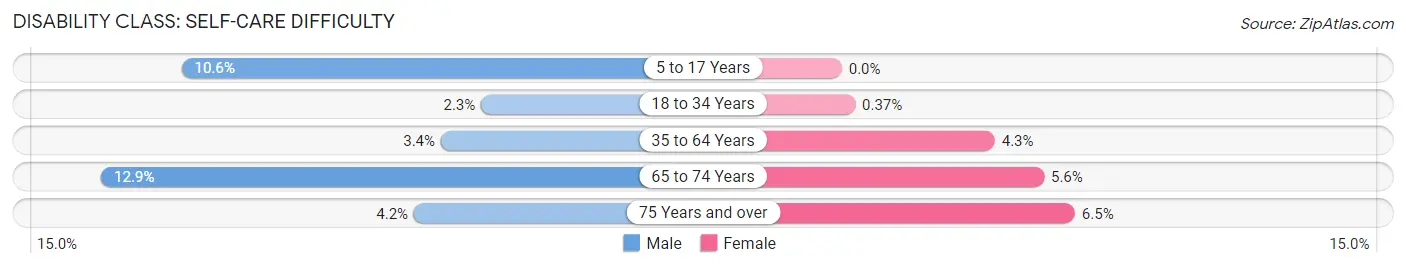
| Age Bracket | Male | Female |
| 5 to 17 Years | 108 (10.6%) | 0 (0.0%) |
| 18 to 34 Years | 27 (2.3%) | 4 (0.4%) |
| 35 to 64 Years | 75 (3.4%) | 99 (4.3%) |
| 65 to 74 Years | 92 (12.9%) | 42 (5.6%) |
| 75 Years and over | 17 (4.2%) | 41 (6.5%) |
Technology Access in Blackford County
Computing Device Access in Blackford County
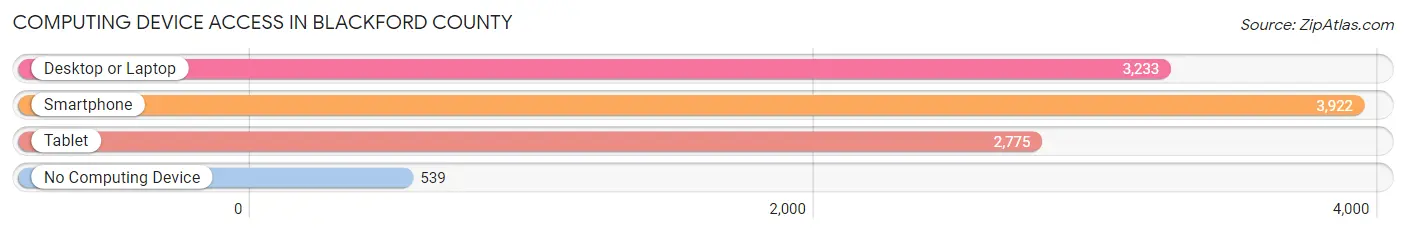
| Device Type | # Households | % Households |
| Desktop or Laptop | 3,233 | 64.9% |
| Smartphone | 3,922 | 78.8% |
| Tablet | 2,775 | 55.7% |
| No Computing Device | 539 | 10.8% |
| Total | 4,980 | 100.0% |
Internet Access in Blackford County

| Internet Type | # Households | % Households |
| Dial-Up Internet | 13 | 0.3% |
| Broadband Home | 2,802 | 56.3% |
| Cellular Data Only | 736 | 14.8% |
| Satellite Internet | 779 | 15.6% |
| No Internet | 787 | 15.8% |
| Total | 4,980 | 100.0% |
Blackford County Summary
Blackford County is located in the east-central part of the state of Indiana, in the United States. It is bordered by Jay County to the north, Wells County to the east, Randolph County to the south, and Grant County to the west. The county seat is Hartford City, and the largest city is Montpelier. The county was established in 1838 and named for Judge Isaac Blackford, who served as a justice on the Indiana Supreme Court from 1817 to 1853.
History
The area that is now Blackford County was originally inhabited by the Miami and Potawatomi Native American tribes. The first European settlers arrived in the area in the early 1800s, and the county was officially established in 1838. The county was named for Judge Isaac Blackford, who served as a justice on the Indiana Supreme Court from 1817 to 1853.
During the Civil War, Blackford County was a major supplier of food and other supplies to the Union Army. The county also provided many soldiers to the Union cause. After the war, the county experienced a period of growth and prosperity, with the development of railroads, factories, and other businesses.
Geography
Blackford County is located in the east-central part of the state of Indiana. It is bordered by Jay County to the north, Wells County to the east, Randolph County to the south, and Grant County to the west. The county has a total area of 246 square miles, of which 244 square miles is land and 2 square miles is water.
The county is mostly flat, with some rolling hills in the northern and western parts. The county is drained by the Mississinewa River, which flows through the county from north to south. The county also contains several small lakes, including Lake James, Lake Gage, and Lake Wawasee.
Economy
The economy of Blackford County is largely based on agriculture and manufacturing. The county is home to several large farms, which produce corn, soybeans, wheat, and other crops. The county is also home to several manufacturing companies, including a steel mill, a paper mill, and a plastics factory.
The county also has a growing tourism industry, with several attractions, including the Blackford County Historical Museum, the Blackford County Courthouse, and the Blackford County Fairgrounds.
Demographics
As of the 2010 census, the population of Blackford County was 12,766. The racial makeup of the county was 95.3% White, 0.7% African American, 0.3% Native American, 0.3% Asian, 0.1% Pacific Islander, 1.7% from other races, and 1.6% from two or more races. Hispanic or Latino of any race were 3.3% of the population.
The median income for a household in the county was $41,945, and the median income for a family was $50,945. The per capita income for the county was $20,845. About 11.2% of families and 14.2% of the population were below the poverty line, including 19.2% of those under age 18 and 8.2% of those age 65 or over.
Common Questions
What is the Total Population of Blackford County?
Total Population of Blackford County is 12,074.
What is the Total Male Population of Blackford County?
Total Male Population of Blackford County is 5,892.
What is the Total Female Population of Blackford County?
Total Female Population of Blackford County is 6,182.
What is the Ratio of Males per 100 Females in Blackford County?
There are 95.31 Males per 100 Females in Blackford County.
What is the Ratio of Females per 100 Males in Blackford County?
There are 104.92 Females per 100 Males in Blackford County.
What is the Median Population Age in Blackford County?
Median Population Age in Blackford County is 44.0 Years.
What is the Average Family Size in Blackford County
Average Family Size in Blackford County is 3.0 People.
What is the Average Household Size in Blackford County
Average Household Size in Blackford County is 2.4 People.
What is Per Capita Income in Blackford County?
Per Capita income in Blackford County is $29,751.
What is the Median Family Income in Blackford County?
Median Family Income in Blackford County is $63,652.
What is the Median Household income in Blackford County?
Median Household Income in Blackford County is $51,108.
What is Income or Wage Gap in Blackford County?
Income or Wage Gap in Blackford County is 26.2%.
Women in Blackford County earn 73.8 cents for every dollar earned by a man.
What is Inequality or Gini Index in Blackford County?
Inequality or Gini Index in Blackford County is 0.48.
How Large is the Labor Force in Blackford County?
There are 5,452 People in the Labor Forcein in Blackford County.
What is the Percentage of People in the Labor Force in Blackford County?
56.1% of People are in the Labor Force in Blackford County.
What is the Unemployment Rate in Blackford County?
Unemployment Rate in Blackford County is 5.5%.