Bartholomew County, IN
Bartholomew County Map
Bartholomew County Overview
82,371
TOTAL POPULATION
41,670
MALE POPULATION
40,701
FEMALE POPULATION
102.38
MALES / 100 FEMALES
97.67
FEMALES / 100 MALES
38.0
MEDIAN AGE
3.1
AVG FAMILY SIZE
2.5
AVG HOUSEHOLD SIZE
$38,950
PER CAPITA INCOME
$90,657
AVG FAMILY INCOME
$76,912
AVG HOUSEHOLD INCOME
39.6%
WAGE / INCOME GAP [ % ]
60.4¢/ $1
WAGE / INCOME GAP [ $ ]
$10,642
FAMILY INCOME DEFICIT
0.44
INEQUALITY / GINI INDEX
42,475
LABOR FORCE [ PEOPLE ]
65.2%
PERCENT IN LABOR FORCE
3.6%
UNEMPLOYMENT RATE
Bartholomew County Area Codes
Race in Bartholomew County
The most populous races in Bartholomew County are White / Caucasian (67,612 | 82.1%), Asian (6,647 | 8.1%), and Hispanic or Latino (6,513 | 7.9%).
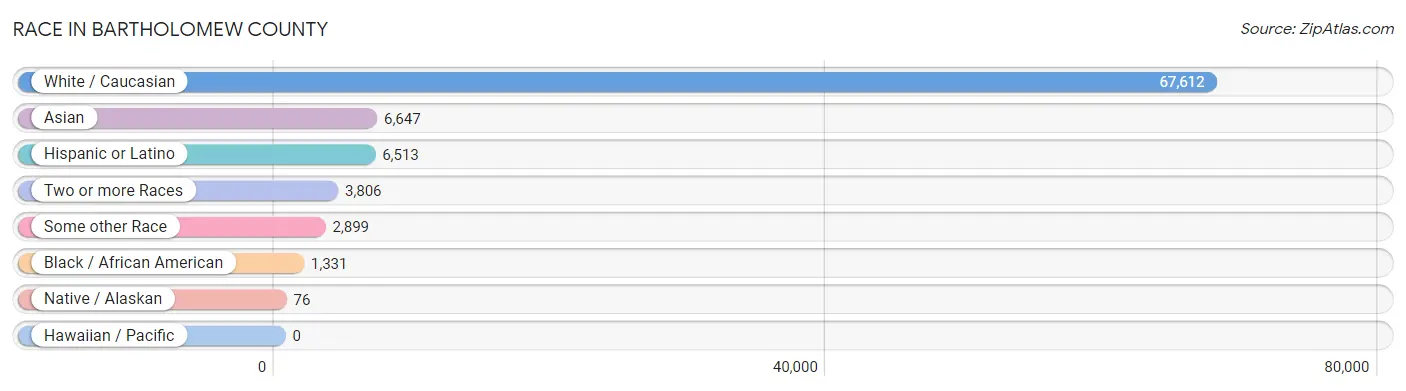
| Race | # Population | % Population |
| Asian | 6,647 | 8.1% |
| Black / African American | 1,331 | 1.6% |
| Hawaiian / Pacific | 0 | 0.0% |
| Hispanic or Latino | 6,513 | 7.9% |
| Native / Alaskan | 76 | 0.1% |
| White / Caucasian | 67,612 | 82.1% |
| Two or more Races | 3,806 | 4.6% |
| Some other Race | 2,899 | 3.5% |
| Total | 82,371 | 100.0% |
Ancestry in Bartholomew County
The most populous ancestries reported in Bartholomew County are German (14,248 | 17.3%), English (10,002 | 12.1%), American (7,219 | 8.8%), Irish (7,039 | 8.6%), and Thai (4,673 | 5.7%), together accounting for 52.4% of all Bartholomew County residents.
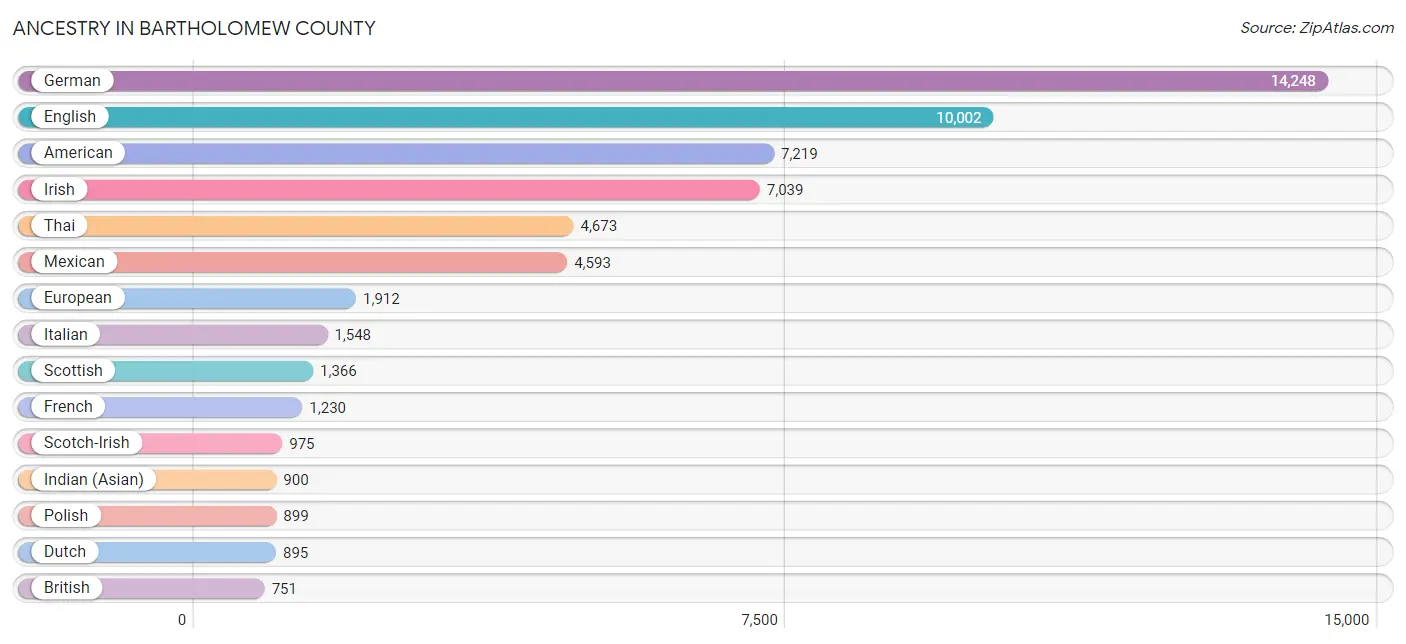
| Ancestry | # Population | % Population |
| African | 33 | 0.0% |
| Alaska Native | 7 | 0.0% |
| American | 7,219 | 8.8% |
| Apache | 1 | 0.0% |
| Arab | 191 | 0.2% |
| Argentinean | 19 | 0.0% |
| Austrian | 111 | 0.1% |
| Belgian | 83 | 0.1% |
| Bhutanese | 521 | 0.6% |
| Blackfeet | 20 | 0.0% |
| British | 751 | 0.9% |
| British West Indian | 33 | 0.0% |
| Burmese | 387 | 0.5% |
| Cajun | 71 | 0.1% |
| Canadian | 22 | 0.0% |
| Central American | 326 | 0.4% |
| Central American Indian | 6 | 0.0% |
| Cherokee | 177 | 0.2% |
| Costa Rican | 15 | 0.0% |
| Croatian | 33 | 0.0% |
| Cuban | 36 | 0.0% |
| Czech | 62 | 0.1% |
| Czechoslovakian | 14 | 0.0% |
| Danish | 176 | 0.2% |
| Delaware | 13 | 0.0% |
| Dominican | 154 | 0.2% |
| Dutch | 895 | 1.1% |
| Dutch West Indian | 34 | 0.0% |
| Eastern European | 174 | 0.2% |
| Ecuadorian | 287 | 0.4% |
| Egyptian | 67 | 0.1% |
| English | 10,002 | 12.1% |
| Ethiopian | 83 | 0.1% |
| European | 1,912 | 2.3% |
| Finnish | 20 | 0.0% |
| French | 1,230 | 1.5% |
| French American Indian | 9 | 0.0% |
| French Canadian | 154 | 0.2% |
| German | 14,248 | 17.3% |
| Greek | 191 | 0.2% |
| Guatemalan | 194 | 0.2% |
| Haitian | 10 | 0.0% |
| Hmong | 55 | 0.1% |
| Honduran | 68 | 0.1% |
| Hungarian | 76 | 0.1% |
| Indian (Asian) | 900 | 1.1% |
| Indonesian | 43 | 0.1% |
| Irish | 7,039 | 8.6% |
| Italian | 1,548 | 1.9% |
| Jamaican | 45 | 0.1% |
| Korean | 203 | 0.3% |
| Laotian | 57 | 0.1% |
| Lebanese | 10 | 0.0% |
| Lithuanian | 27 | 0.0% |
| Mexican | 4,593 | 5.6% |
| Mongolian | 11 | 0.0% |
| Native Hawaiian | 50 | 0.1% |
| Nicaraguan | 21 | 0.0% |
| Nigerian | 133 | 0.2% |
| Northern European | 200 | 0.2% |
| Norwegian | 413 | 0.5% |
| Palestinian | 12 | 0.0% |
| Polish | 899 | 1.1% |
| Portuguese | 95 | 0.1% |
| Puerto Rican | 696 | 0.8% |
| Romanian | 16 | 0.0% |
| Russian | 244 | 0.3% |
| Salvadoran | 28 | 0.0% |
| Scandinavian | 222 | 0.3% |
| Scotch-Irish | 975 | 1.2% |
| Scottish | 1,366 | 1.7% |
| Serbian | 33 | 0.0% |
| Sioux | 20 | 0.0% |
| Slavic | 15 | 0.0% |
| Slovak | 15 | 0.0% |
| Slovene | 29 | 0.0% |
| South African | 145 | 0.2% |
| South American | 351 | 0.4% |
| Spaniard | 155 | 0.2% |
| Spanish | 187 | 0.2% |
| Sri Lankan | 167 | 0.2% |
| Subsaharan African | 424 | 0.5% |
| Swedish | 408 | 0.5% |
| Swiss | 306 | 0.4% |
| Syrian | 14 | 0.0% |
| Thai | 4,673 | 5.7% |
| Turkish | 111 | 0.1% |
| Ukrainian | 117 | 0.1% |
| Venezuelan | 45 | 0.1% |
| Welsh | 395 | 0.5% |
| West Indian | 24 | 0.0% |
| Zimbabwean | 30 | 0.0% | View All 92 Rows |
Immigrants in Bartholomew County
The most numerous immigrant groups reported in Bartholomew County came from Asia (5,295 | 6.4%), South Central Asia (3,373 | 4.1%), India (3,232 | 3.9%), Latin America (2,057 | 2.5%), and Central America (1,809 | 2.2%), together accounting for 19.1% of all Bartholomew County residents.
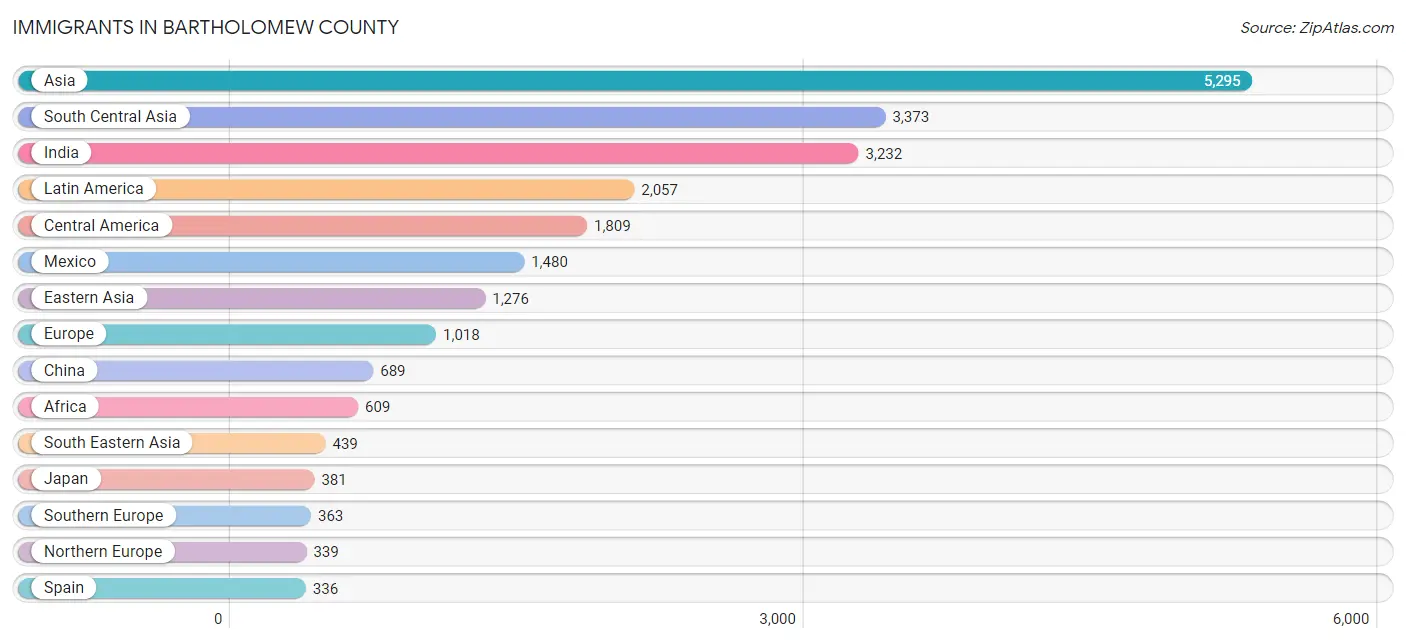
| Immigration Origin | # Population | % Population |
| Africa | 609 | 0.7% |
| Argentina | 19 | 0.0% |
| Asia | 5,295 | 6.4% |
| Austria | 15 | 0.0% |
| Bangladesh | 55 | 0.1% |
| Belgium | 24 | 0.0% |
| Brazil | 105 | 0.1% |
| Canada | 86 | 0.1% |
| Caribbean | 80 | 0.1% |
| Central America | 1,809 | 2.2% |
| China | 689 | 0.8% |
| Costa Rica | 7 | 0.0% |
| Cuba | 8 | 0.0% |
| Eastern Africa | 152 | 0.2% |
| Eastern Asia | 1,276 | 1.5% |
| Eastern Europe | 46 | 0.1% |
| Ecuador | 9 | 0.0% |
| Egypt | 67 | 0.1% |
| El Salvador | 44 | 0.1% |
| England | 102 | 0.1% |
| Ethiopia | 42 | 0.1% |
| Europe | 1,018 | 1.2% |
| France | 118 | 0.1% |
| Germany | 74 | 0.1% |
| Ghana | 47 | 0.1% |
| Greece | 27 | 0.0% |
| Grenada | 33 | 0.0% |
| Guatemala | 204 | 0.3% |
| Honduras | 26 | 0.0% |
| India | 3,232 | 3.9% |
| Indonesia | 13 | 0.0% |
| Ireland | 12 | 0.0% |
| Jamaica | 19 | 0.0% |
| Japan | 381 | 0.5% |
| Korea | 206 | 0.3% |
| Latin America | 2,057 | 2.5% |
| Mexico | 1,480 | 1.8% |
| Nepal | 59 | 0.1% |
| Nicaragua | 48 | 0.1% |
| Nigeria | 133 | 0.2% |
| Northern Africa | 67 | 0.1% |
| Northern Europe | 339 | 0.4% |
| Pakistan | 27 | 0.0% |
| Philippines | 160 | 0.2% |
| Russia | 26 | 0.0% |
| Saudi Arabia | 35 | 0.0% |
| Scotland | 16 | 0.0% |
| South Africa | 175 | 0.2% |
| South America | 168 | 0.2% |
| South Central Asia | 3,373 | 4.1% |
| South Eastern Asia | 439 | 0.5% |
| Southern Europe | 363 | 0.4% |
| Spain | 336 | 0.4% |
| Switzerland | 39 | 0.1% |
| Taiwan | 95 | 0.1% |
| Turkey | 111 | 0.1% |
| Ukraine | 9 | 0.0% |
| Venezuela | 35 | 0.0% |
| Vietnam | 223 | 0.3% |
| Western Africa | 215 | 0.3% |
| Western Asia | 207 | 0.3% |
| Western Europe | 270 | 0.3% |
| Zimbabwe | 54 | 0.1% | View All 63 Rows |
Sex and Age in Bartholomew County
Sex and Age in Bartholomew County
The most populous age groups in Bartholomew County are 25 to 29 Years (3,212 | 7.7%) for men and 5 to 9 Years (2,906 | 7.1%) for women.
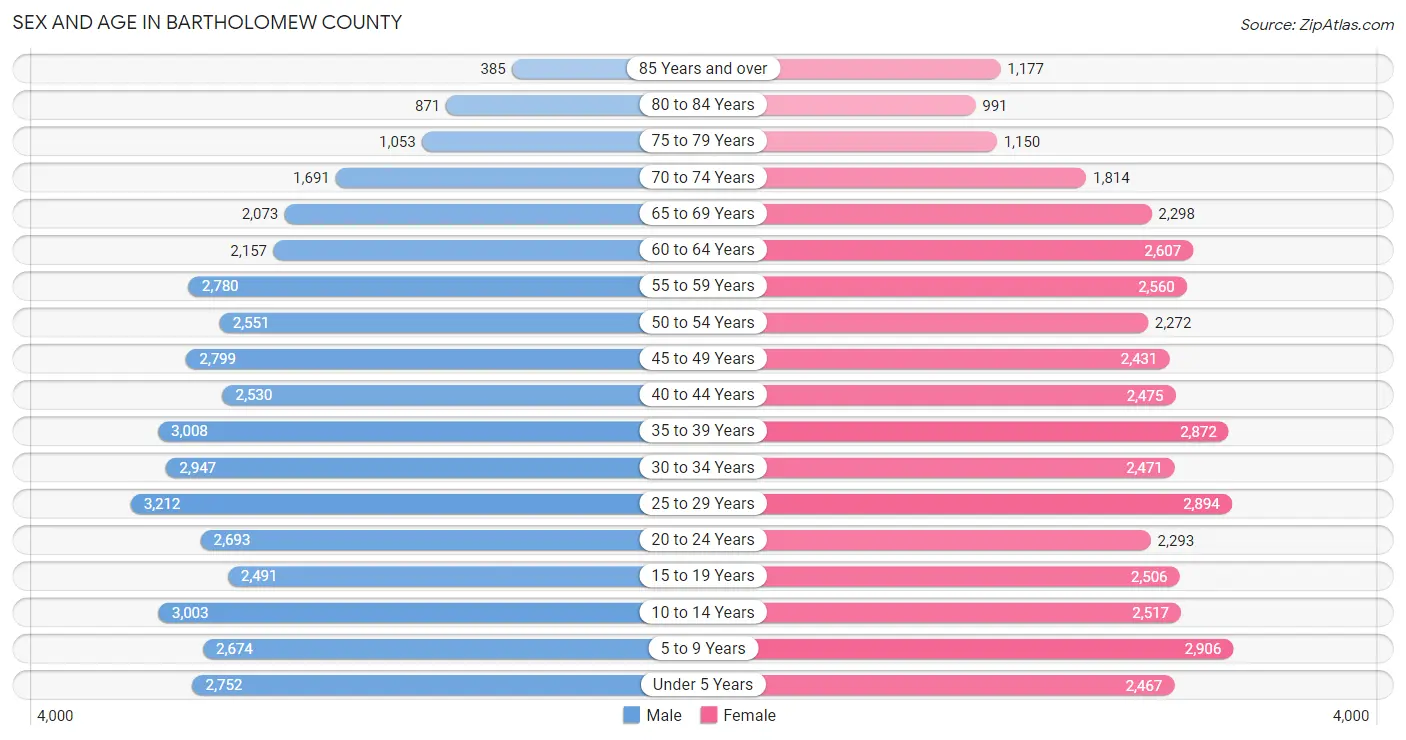
| Age Bracket | Male | Female |
| Under 5 Years | 2,752 (6.6%) | 2,467 (6.1%) |
| 5 to 9 Years | 2,674 (6.4%) | 2,906 (7.1%) |
| 10 to 14 Years | 3,003 (7.2%) | 2,517 (6.2%) |
| 15 to 19 Years | 2,491 (6.0%) | 2,506 (6.2%) |
| 20 to 24 Years | 2,693 (6.5%) | 2,293 (5.6%) |
| 25 to 29 Years | 3,212 (7.7%) | 2,894 (7.1%) |
| 30 to 34 Years | 2,947 (7.1%) | 2,471 (6.1%) |
| 35 to 39 Years | 3,008 (7.2%) | 2,872 (7.1%) |
| 40 to 44 Years | 2,530 (6.1%) | 2,475 (6.1%) |
| 45 to 49 Years | 2,799 (6.7%) | 2,431 (6.0%) |
| 50 to 54 Years | 2,551 (6.1%) | 2,272 (5.6%) |
| 55 to 59 Years | 2,780 (6.7%) | 2,560 (6.3%) |
| 60 to 64 Years | 2,157 (5.2%) | 2,607 (6.4%) |
| 65 to 69 Years | 2,073 (5.0%) | 2,298 (5.7%) |
| 70 to 74 Years | 1,691 (4.1%) | 1,814 (4.5%) |
| 75 to 79 Years | 1,053 (2.5%) | 1,150 (2.8%) |
| 80 to 84 Years | 871 (2.1%) | 991 (2.4%) |
| 85 Years and over | 385 (0.9%) | 1,177 (2.9%) |
| Total | 41,670 (100.0%) | 40,701 (100.0%) |
Families and Households in Bartholomew County
Median Family Size in Bartholomew County
The median family size in Bartholomew County is 3.07 persons per family, with married-couple families (16,256 | 77.0%) accounting for the largest median family size of 3.14 persons per family. On the other hand, single male/father families (1,608 | 7.6%) represent the smallest median family size with 2.62 persons per family.
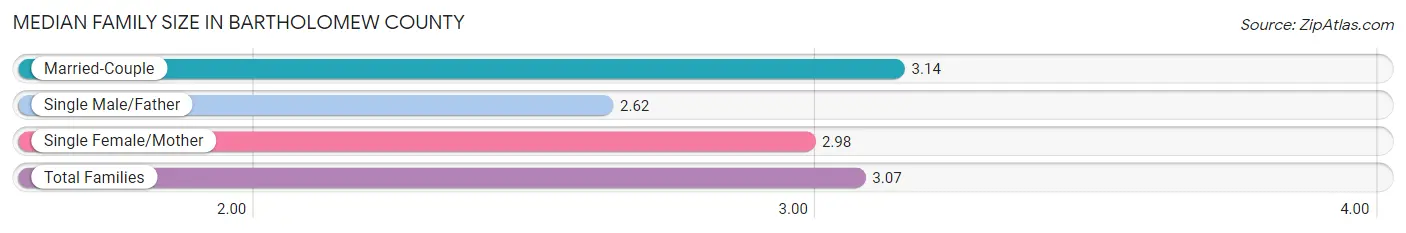
| Family Type | # Families | Family Size |
| Married-Couple | 16,256 (77.0%) | 3.14 |
| Single Male/Father | 1,608 (7.6%) | 2.62 |
| Single Female/Mother | 3,244 (15.4%) | 2.98 |
| Total Families | 21,108 (100.0%) | 3.07 |
Median Household Size in Bartholomew County
The median household size in Bartholomew County is 2.48 persons per household, with single female/mother households (3,244 | 9.9%) accounting for the largest median household size of 3.26 persons per household. non-family households (11,665 | 35.6%) represent the smallest median household size with 1.24 persons per household.
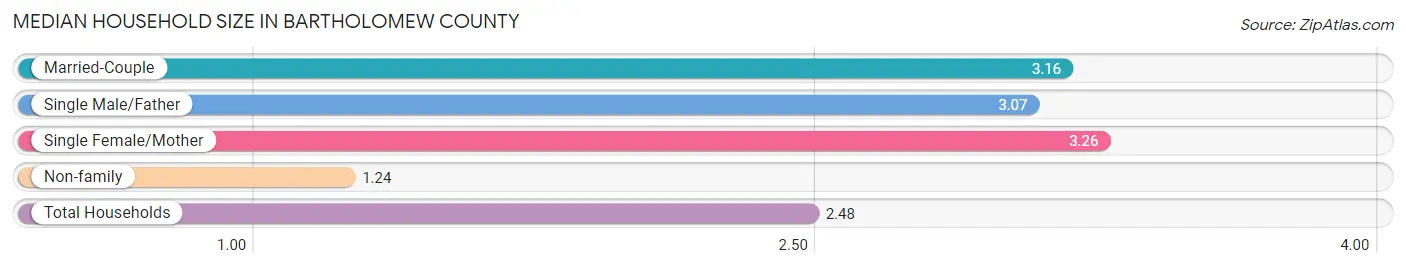
| Household Type | # Households | Household Size |
| Married-Couple | 16,256 (49.6%) | 3.16 |
| Single Male/Father | 1,608 (4.9%) | 3.07 |
| Single Female/Mother | 3,244 (9.9%) | 3.26 |
| Non-family | 11,665 (35.6%) | 1.24 |
| Total Households | 32,773 (100.0%) | 2.48 |
Household Size by Marriage Status in Bartholomew County
Out of a total of 32,773 households in Bartholomew County, 21,108 (64.4%) are family households, while 11,665 (35.6%) are nonfamily households. The most numerous type of family households are 2-person households, comprising 9,599, and the most common type of nonfamily households are 1-person households, comprising 9,587.
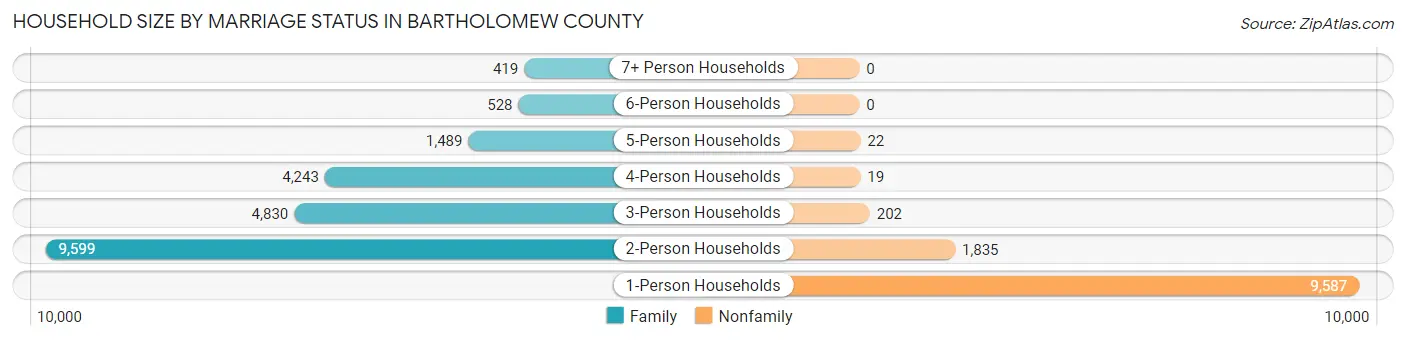
| Household Size | Family Households | Nonfamily Households |
| 1-Person Households | - | 9,587 (29.2%) |
| 2-Person Households | 9,599 (29.3%) | 1,835 (5.6%) |
| 3-Person Households | 4,830 (14.7%) | 202 (0.6%) |
| 4-Person Households | 4,243 (13.0%) | 19 (0.1%) |
| 5-Person Households | 1,489 (4.5%) | 22 (0.1%) |
| 6-Person Households | 528 (1.6%) | 0 (0.0%) |
| 7+ Person Households | 419 (1.3%) | 0 (0.0%) |
| Total | 21,108 (64.4%) | 11,665 (35.6%) |
Female Fertility in Bartholomew County
Fertility by Age in Bartholomew County
Average fertility rate in Bartholomew County is 55.0 births per 1,000 women. Women in the age bracket of 20 to 34 years have the highest fertility rate with 112.0 births per 1,000 women. Women in the age bracket of 20 to 34 years acount for 85.7% of all women with births.
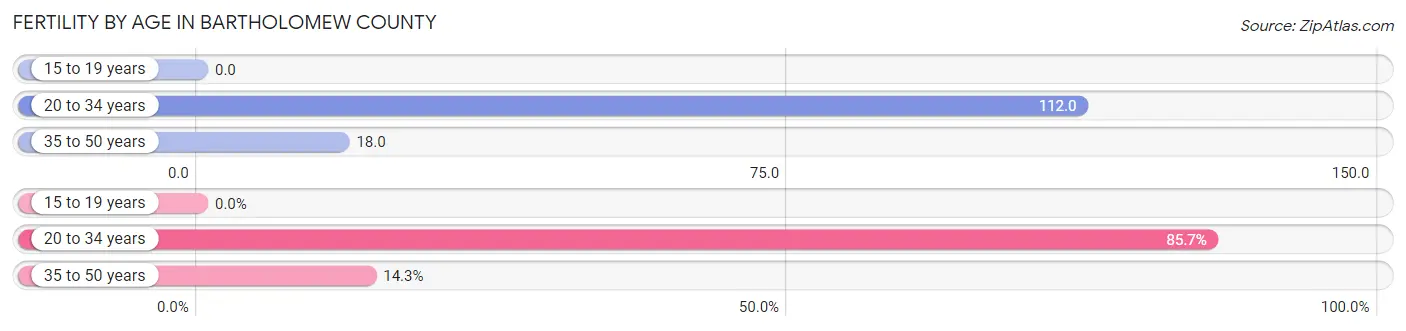
| Age Bracket | Women with Births | Births / 1,000 Women |
| 15 to 19 years | 0 (0.0%) | 0.0 |
| 20 to 34 years | 859 (85.7%) | 112.0 |
| 35 to 50 years | 143 (14.3%) | 18.0 |
| Total | 1,002 (100.0%) | 55.0 |
Fertility by Age by Marriage Status in Bartholomew County
71.3% of women with births (1,002) in Bartholomew County are married. The highest percentage of unmarried women with births falls into 20 to 34 years age bracket with 32.1% of them unmarried at the time of birth, while the lowest percentage of unmarried women with births belong to 35 to 50 years age bracket with 8.4% of them unmarried.
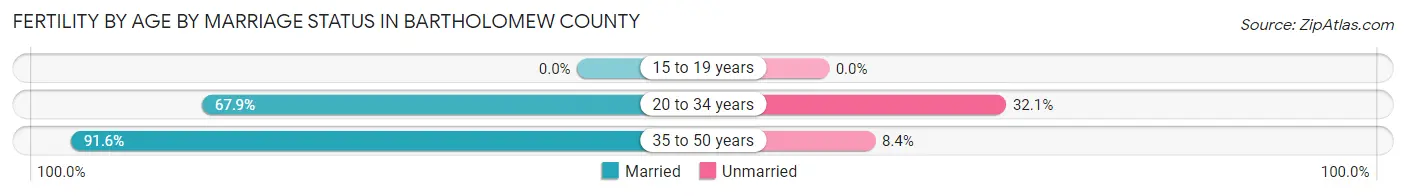
| Age Bracket | Married | Unmarried |
| 15 to 19 years | 0 (0.0%) | 0 (0.0%) |
| 20 to 34 years | 583 (67.9%) | 276 (32.1%) |
| 35 to 50 years | 131 (91.6%) | 12 (8.4%) |
| Total | 714 (71.3%) | 288 (28.7%) |
Fertility by Education in Bartholomew County
Average fertility rate in Bartholomew County is 55.0 births per 1,000 women. Women with the education attainment of bachelor's degree have the highest fertility rate of 68.0 births per 1,000 women, while women with the education attainment of graduate degree have the lowest fertility at 36.0 births per 1,000 women. Women with the education attainment of bachelor's degree represent 28.4% of all women with births.
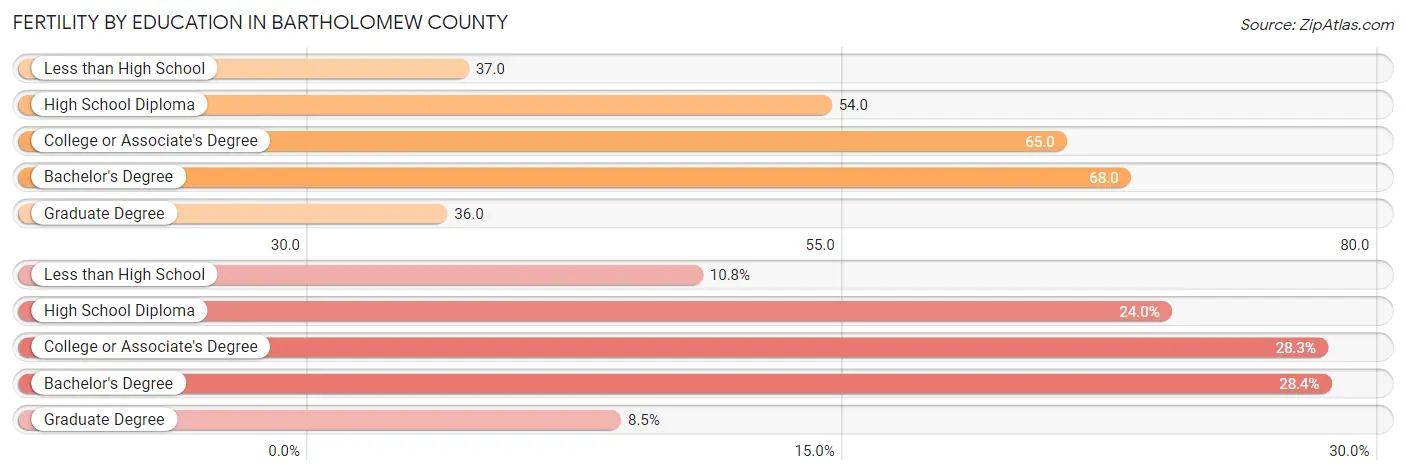
| Educational Attainment | Women with Births | Births / 1,000 Women |
| Less than High School | 108 (10.8%) | 37.0 |
| High School Diploma | 240 (23.9%) | 54.0 |
| College or Associate's Degree | 284 (28.3%) | 65.0 |
| Bachelor's Degree | 285 (28.4%) | 68.0 |
| Graduate Degree | 85 (8.5%) | 36.0 |
| Total | 1,002 (100.0%) | 55.0 |
Fertility by Education by Marriage Status in Bartholomew County
28.7% of women with births in Bartholomew County are unmarried. Women with the educational attainment of graduate degree are most likely to be married with 100.0% of them married at childbirth, while women with the educational attainment of college or associate's degree are least likely to be married with 53.2% of them unmarried at childbirth.
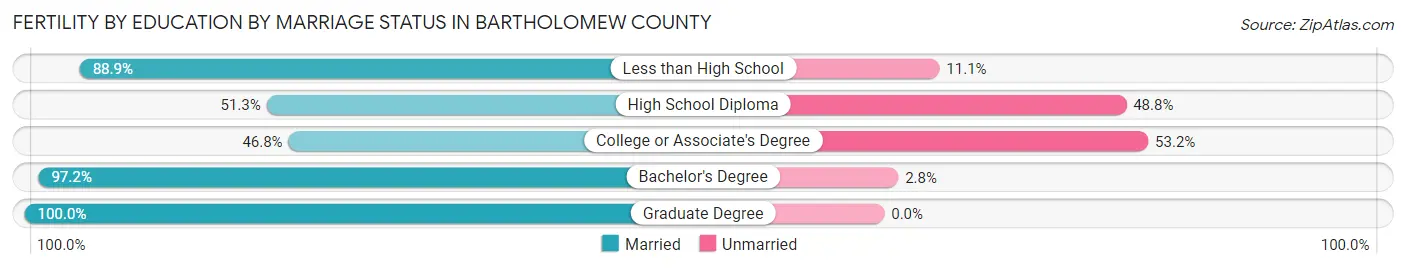
| Educational Attainment | Married | Unmarried |
| Less than High School | 96 (88.9%) | 12 (11.1%) |
| High School Diploma | 123 (51.2%) | 117 (48.7%) |
| College or Associate's Degree | 133 (46.8%) | 151 (53.2%) |
| Bachelor's Degree | 277 (97.2%) | 8 (2.8%) |
| Graduate Degree | 85 (100.0%) | 0 (0.0%) |
| Total | 714 (71.3%) | 288 (28.7%) |
Income in Bartholomew County
Income Overview in Bartholomew County
Per Capita Income in Bartholomew County is $38,950, while median incomes of families and households are $90,657 and $76,912 respectively.
| Characteristic | Number | Measure |
| Per Capita Income | 82,371 | $38,950 |
| Median Family Income | 21,108 | $90,657 |
| Mean Family Income | 21,108 | $113,302 |
| Median Household Income | 32,773 | $76,912 |
| Mean Household Income | 32,773 | $95,616 |
| Income Deficit | 21,108 | $10,642 |
| Wage / Income Gap (%) | 82,371 | 39.58% |
| Wage / Income Gap ($) | 82,371 | 60.42¢ per $1 |
| Gini / Inequality Index | 82,371 | 0.44 |
Earnings by Sex in Bartholomew County
Average Earnings in Bartholomew County are $43,250, $54,548 for men and $32,956 for women, a difference of 39.6%.
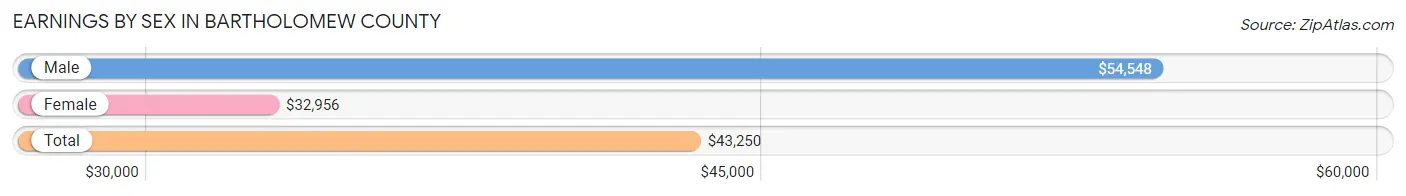
| Sex | Number | Average Earnings |
| Male | 24,783 (55.2%) | $54,548 |
| Female | 20,120 (44.8%) | $32,956 |
| Total | 44,903 (100.0%) | $43,250 |
Earnings by Sex by Income Bracket in Bartholomew County
The most common earnings brackets in Bartholomew County are $100,000+ for men (4,996 | 20.2%) and $100,000+ for women (1,548 | 7.7%).
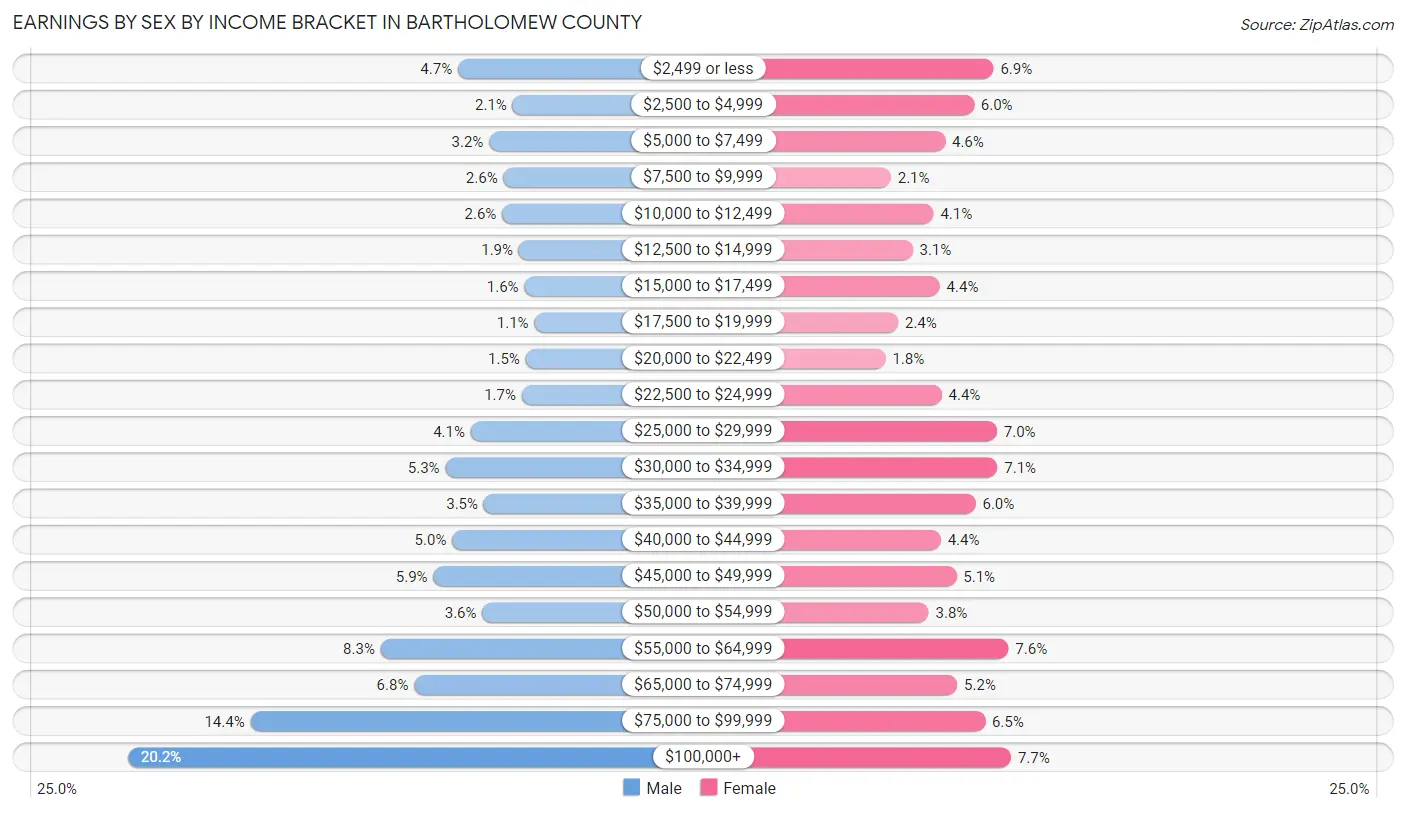
| Income | Male | Female |
| $2,499 or less | 1,164 (4.7%) | 1,383 (6.9%) |
| $2,500 to $4,999 | 531 (2.1%) | 1,197 (5.9%) |
| $5,000 to $7,499 | 804 (3.2%) | 925 (4.6%) |
| $7,500 to $9,999 | 636 (2.6%) | 415 (2.1%) |
| $10,000 to $12,499 | 652 (2.6%) | 817 (4.1%) |
| $12,500 to $14,999 | 459 (1.8%) | 619 (3.1%) |
| $15,000 to $17,499 | 395 (1.6%) | 875 (4.3%) |
| $17,500 to $19,999 | 277 (1.1%) | 482 (2.4%) |
| $20,000 to $22,499 | 379 (1.5%) | 364 (1.8%) |
| $22,500 to $24,999 | 425 (1.7%) | 894 (4.4%) |
| $25,000 to $29,999 | 1,017 (4.1%) | 1,415 (7.0%) |
| $30,000 to $34,999 | 1,312 (5.3%) | 1,419 (7.0%) |
| $35,000 to $39,999 | 866 (3.5%) | 1,213 (6.0%) |
| $40,000 to $44,999 | 1,231 (5.0%) | 886 (4.4%) |
| $45,000 to $49,999 | 1,449 (5.9%) | 1,032 (5.1%) |
| $50,000 to $54,999 | 883 (3.6%) | 771 (3.8%) |
| $55,000 to $64,999 | 2,061 (8.3%) | 1,523 (7.6%) |
| $65,000 to $74,999 | 1,672 (6.8%) | 1,040 (5.2%) |
| $75,000 to $99,999 | 3,574 (14.4%) | 1,302 (6.5%) |
| $100,000+ | 4,996 (20.2%) | 1,548 (7.7%) |
| Total | 24,783 (100.0%) | 20,120 (100.0%) |
Earnings by Sex by Educational Attainment in Bartholomew County
Average earnings in Bartholomew County are $60,968 for men and $36,577 for women, a difference of 40.0%. Men with an educational attainment of graduate degree enjoy the highest average annual earnings of $104,630, while those with less than high school education earn the least with $34,669. Women with an educational attainment of graduate degree earn the most with the average annual earnings of $68,750, while those with high school diploma education have the smallest earnings of $23,038.
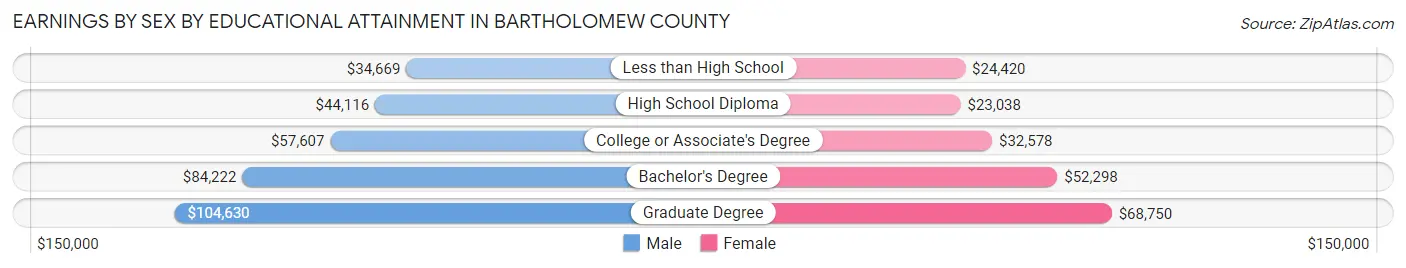
| Educational Attainment | Male Income | Female Income |
| Less than High School | $34,669 | $24,420 |
| High School Diploma | $44,116 | $23,038 |
| College or Associate's Degree | $57,607 | $32,578 |
| Bachelor's Degree | $84,222 | $52,298 |
| Graduate Degree | $104,630 | $68,750 |
| Total | $60,968 | $36,577 |
Family Income in Bartholomew County
Family Income Brackets in Bartholomew County
According to the Bartholomew County family income data, there are 4,433 families falling into the $100,000 to $149,999 income range, which is the most common income bracket and makes up 21.0% of all families. Conversely, the $10,000 to $14,999 income bracket is the least frequent group with only 317 families (1.5%) belonging to this category.
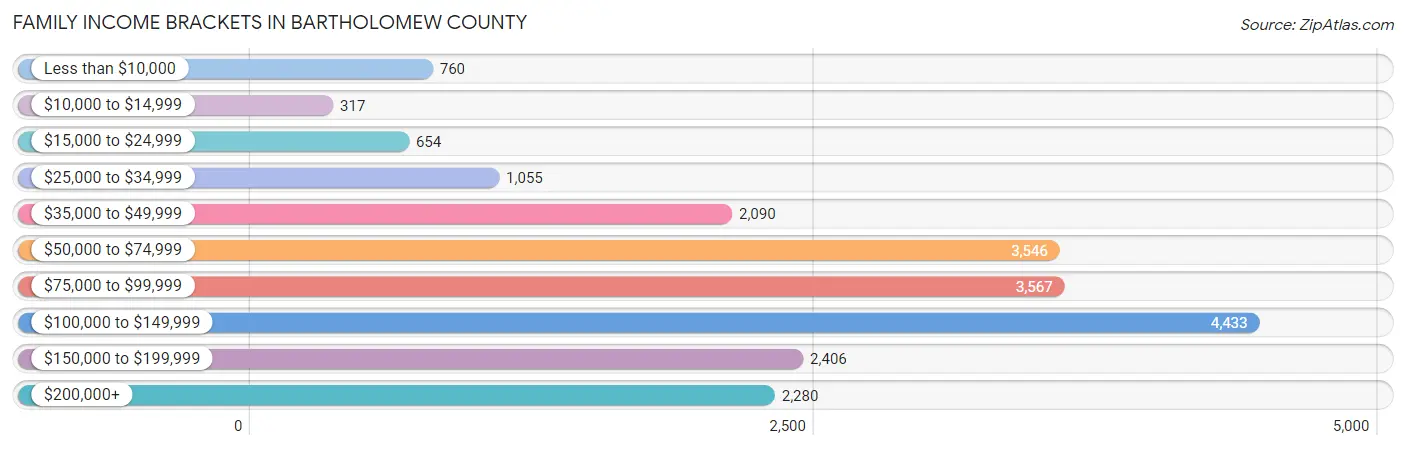
| Income Bracket | # Families | % Families |
| Less than $10,000 | 760 | 3.6% |
| $10,000 to $14,999 | 317 | 1.5% |
| $15,000 to $24,999 | 654 | 3.1% |
| $25,000 to $34,999 | 1,055 | 5.0% |
| $35,000 to $49,999 | 2,090 | 9.9% |
| $50,000 to $74,999 | 3,546 | 16.8% |
| $75,000 to $99,999 | 3,567 | 16.9% |
| $100,000 to $149,999 | 4,433 | 21.0% |
| $150,000 to $199,999 | 2,406 | 11.4% |
| $200,000+ | 2,280 | 10.8% |
Family Income by Famaliy Size in Bartholomew County
5-person families (1,319 | 6.2%) account for the highest median family income in Bartholomew County with $101,738 per family, while 2-person families (10,449 | 49.5%) have the highest median income of $41,974 per family member.
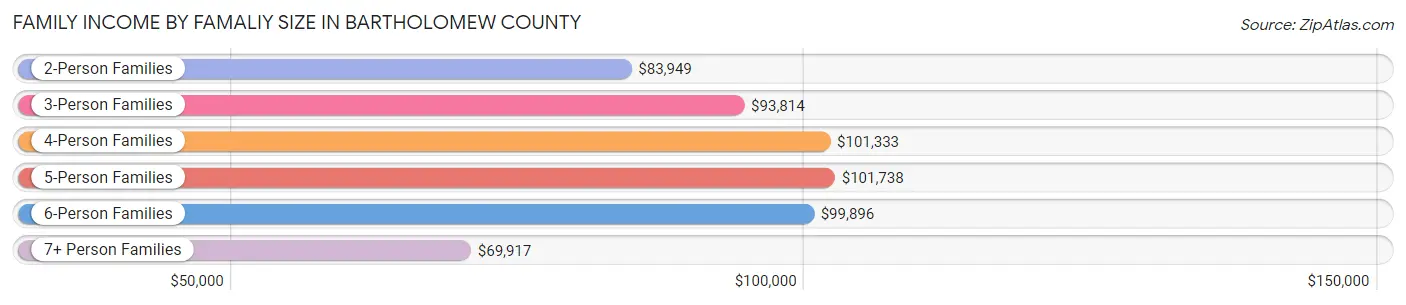
| Income Bracket | # Families | Median Income |
| 2-Person Families | 10,449 (49.5%) | $83,949 |
| 3-Person Families | 4,568 (21.6%) | $93,814 |
| 4-Person Families | 3,940 (18.7%) | $101,333 |
| 5-Person Families | 1,319 (6.2%) | $101,738 |
| 6-Person Families | 455 (2.2%) | $99,896 |
| 7+ Person Families | 377 (1.8%) | $69,917 |
| Total | 21,108 (100.0%) | $90,657 |
Family Income by Number of Earners in Bartholomew County
The median family income in Bartholomew County is $90,657, with families comprising 3+ earners (2,141) having the highest median family income of $136,172, while families with no earners (2,733) have the lowest median family income of $44,974, accounting for 10.1% and 13.0% of families, respectively.
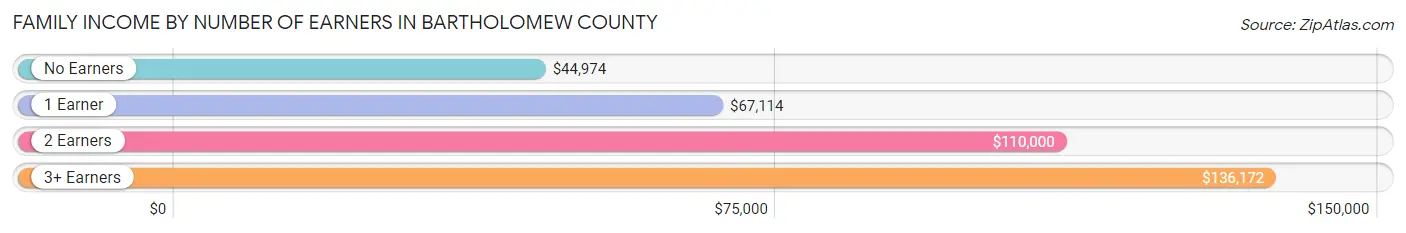
| Number of Earners | # Families | Median Income |
| No Earners | 2,733 (13.0%) | $44,974 |
| 1 Earner | 7,090 (33.6%) | $67,114 |
| 2 Earners | 9,144 (43.3%) | $110,000 |
| 3+ Earners | 2,141 (10.1%) | $136,172 |
| Total | 21,108 (100.0%) | $90,657 |
Household Income in Bartholomew County
Household Income Brackets in Bartholomew County
With 6,063 households falling in the category, the $100,000 to $149,999 income range is the most frequent in Bartholomew County, accounting for 18.5% of all households. In contrast, only 885 households (2.7%) fall into the $10,000 to $14,999 income bracket, making it the least populous group.
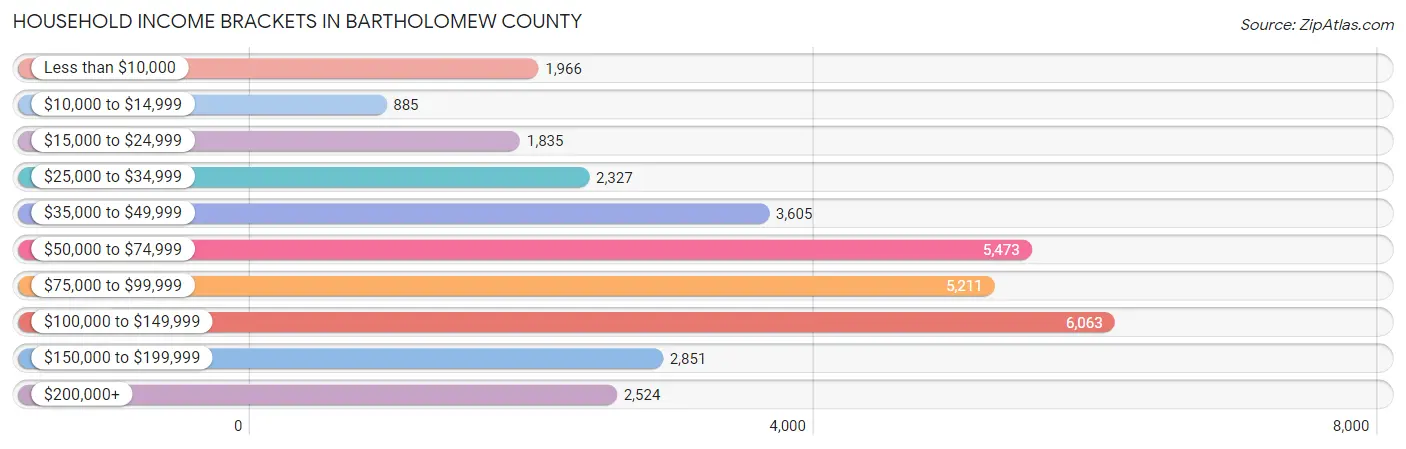
| Income Bracket | # Households | % Households |
| Less than $10,000 | 1,966 | 6.0% |
| $10,000 to $14,999 | 885 | 2.7% |
| $15,000 to $24,999 | 1,835 | 5.6% |
| $25,000 to $34,999 | 2,327 | 7.1% |
| $35,000 to $49,999 | 3,605 | 11.0% |
| $50,000 to $74,999 | 5,473 | 16.7% |
| $75,000 to $99,999 | 5,211 | 15.9% |
| $100,000 to $149,999 | 6,063 | 18.5% |
| $150,000 to $199,999 | 2,851 | 8.7% |
| $200,000+ | 2,524 | 7.7% |
Household Income by Householder Age in Bartholomew County
The median household income in Bartholomew County is $76,912, with the highest median household income of $93,294 found in the 45 to 64 years age bracket for the primary householder. A total of 11,183 households (34.1%) fall into this category. Meanwhile, the 15 to 24 years age bracket for the primary householder has the lowest median household income of $49,356, with 1,663 households (5.1%) in this group.
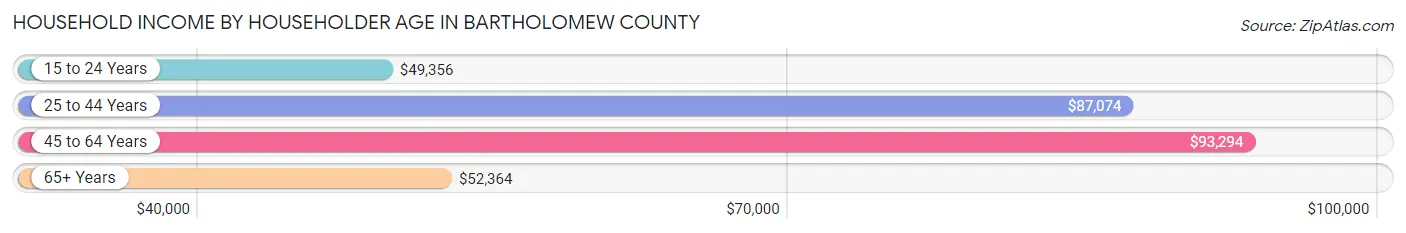
| Income Bracket | # Households | Median Income |
| 15 to 24 Years | 1,663 (5.1%) | $49,356 |
| 25 to 44 Years | 11,341 (34.6%) | $87,074 |
| 45 to 64 Years | 11,183 (34.1%) | $93,294 |
| 65+ Years | 8,586 (26.2%) | $52,364 |
| Total | 32,773 (100.0%) | $76,912 |
Poverty in Bartholomew County
Income Below Poverty by Sex and Age in Bartholomew County
With 10.9% poverty level for males and 12.1% for females among the residents of Bartholomew County, 16 and 17 year old males and 15 year old females are the most vulnerable to poverty, with 337 males (28.0%) and 160 females (32.2%) in their respective age groups living below the poverty level.
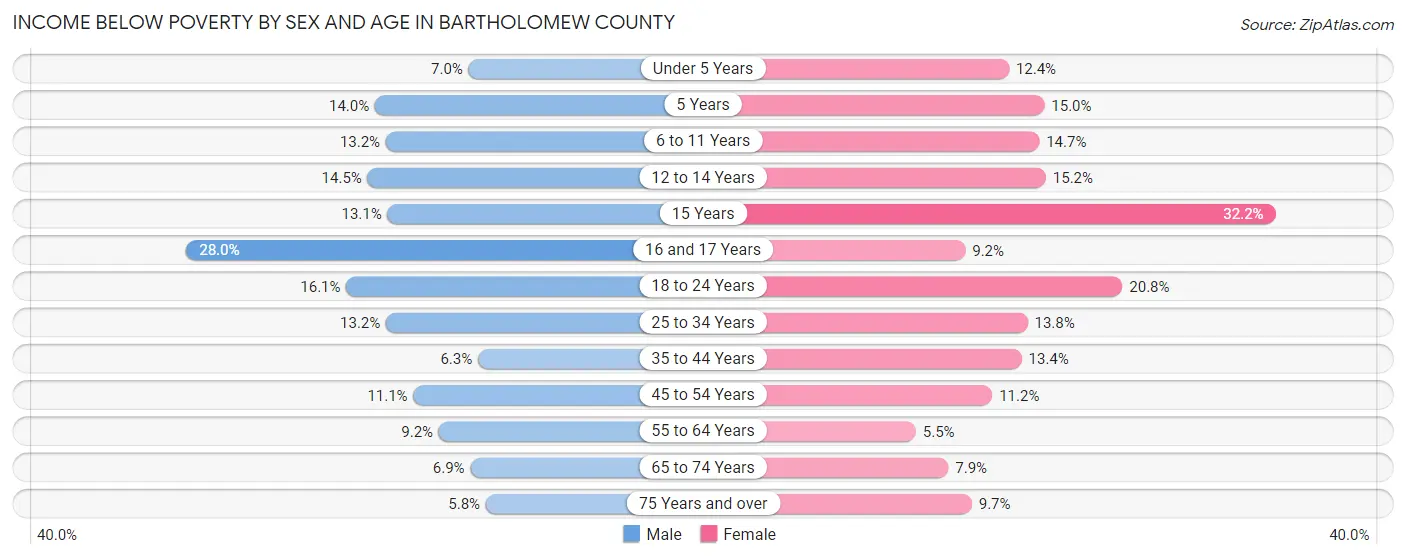
| Age Bracket | Male | Female |
| Under 5 Years | 191 (7.0%) | 305 (12.4%) |
| 5 Years | 72 (14.0%) | 80 (15.0%) |
| 6 to 11 Years | 429 (13.2%) | 528 (14.7%) |
| 12 to 14 Years | 257 (14.5%) | 191 (15.1%) |
| 15 Years | 53 (13.1%) | 160 (32.2%) |
| 16 and 17 Years | 337 (28.0%) | 114 (9.2%) |
| 18 to 24 Years | 565 (16.1%) | 634 (20.8%) |
| 25 to 34 Years | 796 (13.2%) | 733 (13.8%) |
| 35 to 44 Years | 346 (6.3%) | 713 (13.4%) |
| 45 to 54 Years | 594 (11.1%) | 525 (11.2%) |
| 55 to 64 Years | 455 (9.2%) | 283 (5.5%) |
| 65 to 74 Years | 257 (6.9%) | 319 (7.9%) |
| 75 Years and over | 127 (5.8%) | 293 (9.7%) |
| Total | 4,479 (10.9%) | 4,878 (12.1%) |
Income Above Poverty by Sex and Age in Bartholomew County
According to the poverty statistics in Bartholomew County, males aged 75 years and over and females aged 55 to 64 years are the age groups that are most secure financially, with 94.3% of males and 94.5% of females in these age groups living above the poverty line.
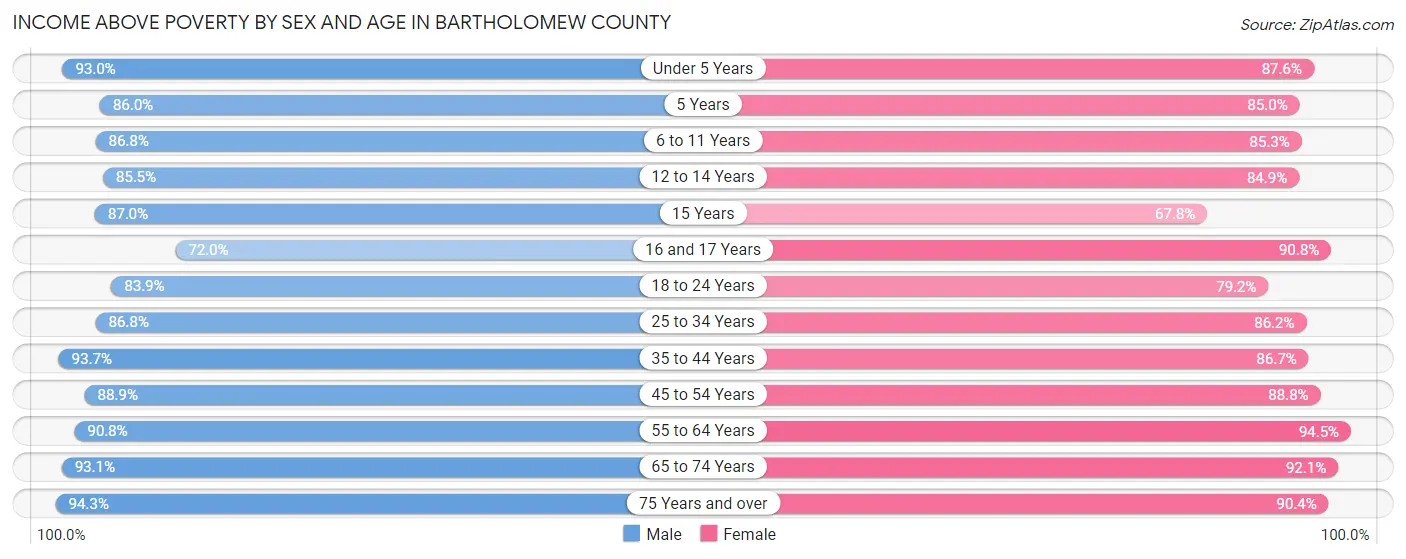
| Age Bracket | Male | Female |
| Under 5 Years | 2,525 (93.0%) | 2,153 (87.6%) |
| 5 Years | 443 (86.0%) | 452 (85.0%) |
| 6 to 11 Years | 2,829 (86.8%) | 3,074 (85.3%) |
| 12 to 14 Years | 1,512 (85.5%) | 1,070 (84.9%) |
| 15 Years | 353 (87.0%) | 337 (67.8%) |
| 16 and 17 Years | 867 (72.0%) | 1,129 (90.8%) |
| 18 to 24 Years | 2,942 (83.9%) | 2,410 (79.2%) |
| 25 to 34 Years | 5,253 (86.8%) | 4,584 (86.2%) |
| 35 to 44 Years | 5,118 (93.7%) | 4,629 (86.7%) |
| 45 to 54 Years | 4,744 (88.9%) | 4,175 (88.8%) |
| 55 to 64 Years | 4,467 (90.8%) | 4,860 (94.5%) |
| 65 to 74 Years | 3,468 (93.1%) | 3,713 (92.1%) |
| 75 Years and over | 2,080 (94.3%) | 2,744 (90.3%) |
| Total | 36,601 (89.1%) | 35,330 (87.9%) |
Income Below Poverty Among Married-Couple Families in Bartholomew County
The poverty statistics for married-couple families in Bartholomew County show that 3.9% or 633 of the total 16,256 families live below the poverty line. Families with 5 or more children have the highest poverty rate of 7.9%, comprising of 14 families. On the other hand, families with no children have the lowest poverty rate of 3.2%, which includes 307 families.
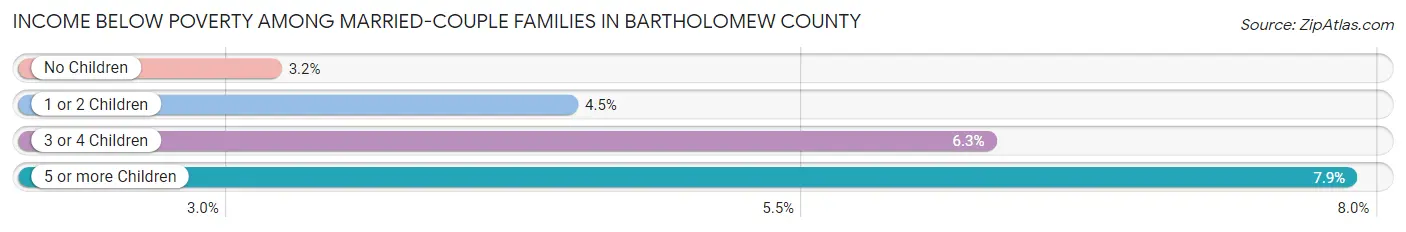
| Children | Above Poverty | Below Poverty |
| No Children | 9,311 (96.8%) | 307 (3.2%) |
| 1 or 2 Children | 4,988 (95.5%) | 234 (4.5%) |
| 3 or 4 Children | 1,160 (93.7%) | 78 (6.3%) |
| 5 or more Children | 164 (92.1%) | 14 (7.9%) |
| Total | 15,623 (96.1%) | 633 (3.9%) |
Income Below Poverty Among Single-Parent Households in Bartholomew County
According to the poverty data in Bartholomew County, 12.7% or 204 single-father households and 28.0% or 907 single-mother households are living below the poverty line. Among single-father households, those with 3 or 4 children have the highest poverty rate, with 83 households (82.2%) experiencing poverty. Likewise, among single-mother households, those with 3 or 4 children have the highest poverty rate, with 176 households (41.0%) falling below the poverty line.
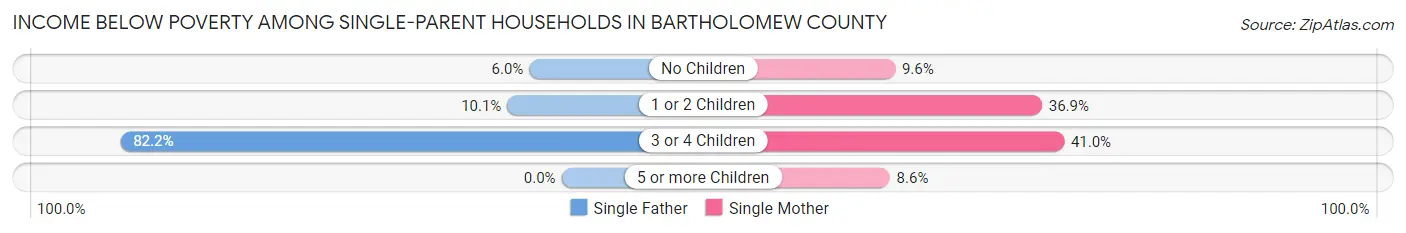
| Children | Single Father | Single Mother |
| No Children | 46 (6.0%) | 104 (9.6%) |
| 1 or 2 Children | 75 (10.1%) | 624 (36.9%) |
| 3 or 4 Children | 83 (82.2%) | 176 (41.0%) |
| 5 or more Children | 0 (0.0%) | 3 (8.6%) |
| Total | 204 (12.7%) | 907 (28.0%) |
Income Below Poverty Among Married-Couple vs Single-Parent Households in Bartholomew County
The poverty data for Bartholomew County shows that 633 of the married-couple family households (3.9%) and 1,111 of the single-parent households (22.9%) are living below the poverty level. Within the married-couple family households, those with 5 or more children have the highest poverty rate, with 14 households (7.9%) falling below the poverty line. Among the single-parent households, those with 3 or 4 children have the highest poverty rate, with 259 household (48.9%) living below poverty.
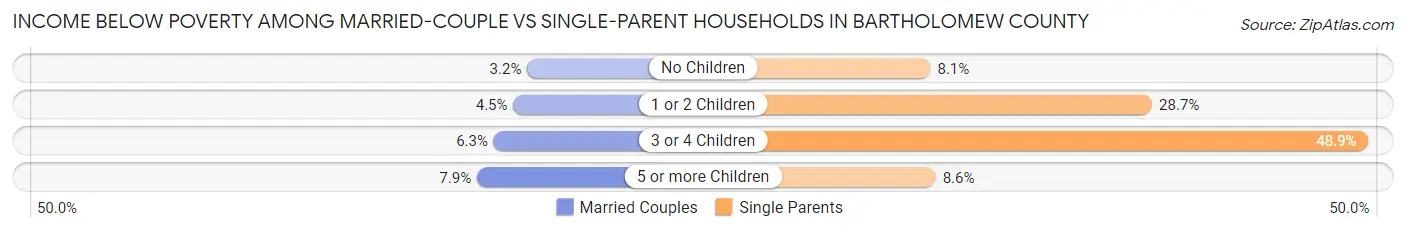
| Children | Married-Couple Families | Single-Parent Households |
| No Children | 307 (3.2%) | 150 (8.1%) |
| 1 or 2 Children | 234 (4.5%) | 699 (28.7%) |
| 3 or 4 Children | 78 (6.3%) | 259 (48.9%) |
| 5 or more Children | 14 (7.9%) | 3 (8.6%) |
| Total | 633 (3.9%) | 1,111 (22.9%) |
Employment Characteristics in Bartholomew County
Employment by Class of Employer in Bartholomew County
Among the 40,397 employed individuals in Bartholomew County, private company employees (30,440 | 75.3%), not-for-profit organizations (3,551 | 8.8%), and local government employees (2,157 | 5.3%) make up the most common classes of employment.
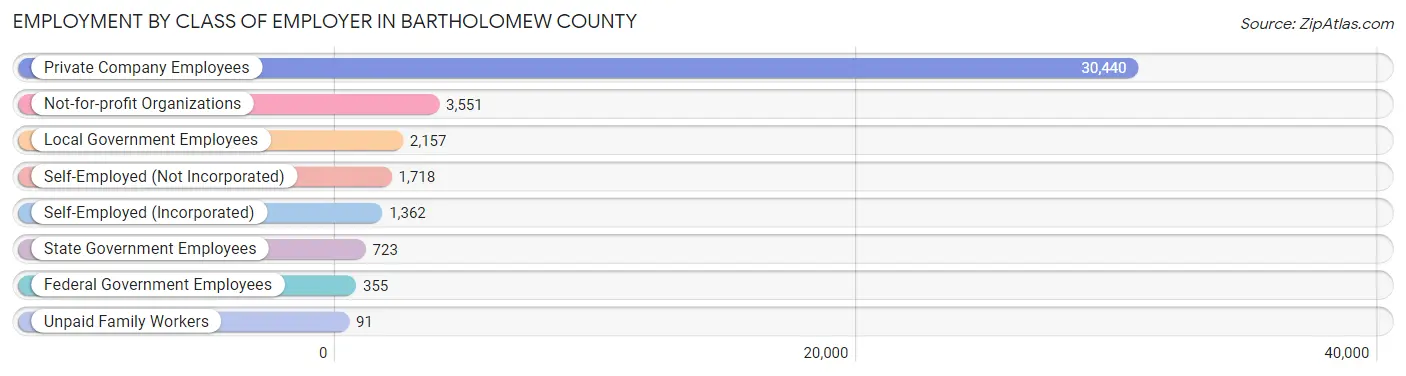
| Employer Class | # Employees | % Employees |
| Private Company Employees | 30,440 | 75.3% |
| Self-Employed (Incorporated) | 1,362 | 3.4% |
| Self-Employed (Not Incorporated) | 1,718 | 4.3% |
| Not-for-profit Organizations | 3,551 | 8.8% |
| Local Government Employees | 2,157 | 5.3% |
| State Government Employees | 723 | 1.8% |
| Federal Government Employees | 355 | 0.9% |
| Unpaid Family Workers | 91 | 0.2% |
| Total | 40,397 | 100.0% |
Employment Status by Age in Bartholomew County
According to the labor force statistics for Bartholomew County, out of the total population over 16 years of age (65,146), 65.2% or 42,475 individuals are in the labor force, with 3.6% or 1,529 of them unemployed. The age group with the highest labor force participation rate is 20 to 24 years, with 83.9% or 4,183 individuals in the labor force. Within the labor force, the 16 to 19 years age range has the highest percentage of unemployed individuals, with 9.7% or 182 of them being unemployed.
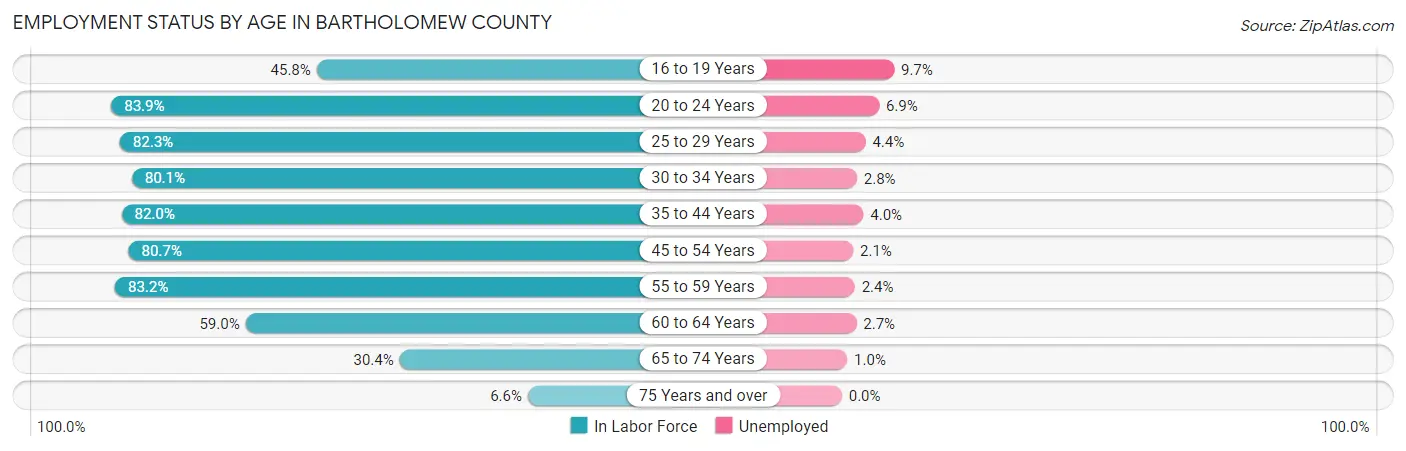
| Age Bracket | In Labor Force | Unemployed |
| 16 to 19 Years | 1,874 (45.8%) | 182 (9.7%) |
| 20 to 24 Years | 4,183 (83.9%) | 289 (6.9%) |
| 25 to 29 Years | 5,025 (82.3%) | 221 (4.4%) |
| 30 to 34 Years | 4,340 (80.1%) | 122 (2.8%) |
| 35 to 44 Years | 8,926 (82.0%) | 357 (4.0%) |
| 45 to 54 Years | 8,113 (80.7%) | 170 (2.1%) |
| 55 to 59 Years | 4,443 (83.2%) | 107 (2.4%) |
| 60 to 64 Years | 2,811 (59.0%) | 76 (2.7%) |
| 65 to 74 Years | 2,394 (30.4%) | 24 (1.0%) |
| 75 Years and over | 371 (6.6%) | 0 (0.0%) |
| Total | 42,475 (65.2%) | 1,529 (3.6%) |
Employment Status by Educational Attainment in Bartholomew County
According to labor force statistics for Bartholomew County, 79.1% of individuals (33,670) out of the total population between 25 and 64 years of age (42,566) are in the labor force, with 3.1% or 1,044 of them being unemployed. The group with the highest labor force participation rate are those with the educational attainment of bachelor's degree or higher, with 84.8% or 13,975 individuals in the labor force. Within the labor force, individuals with high school diploma education have the highest percentage of unemployment, with 5.4% or 482 of them being unemployed.
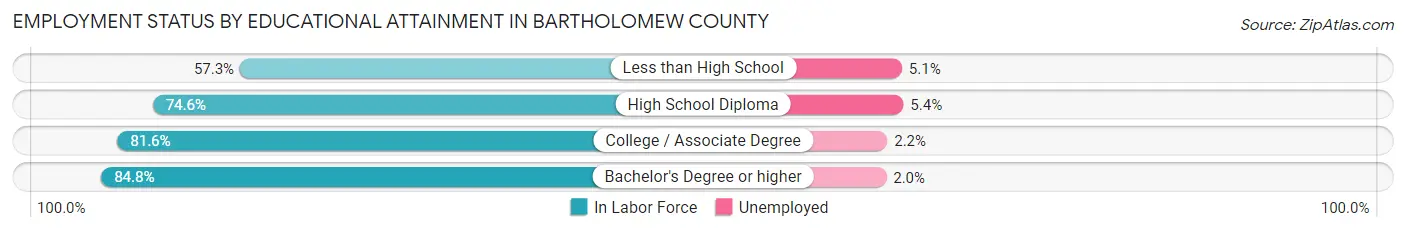
| Educational Attainment | In Labor Force | Unemployed |
| Less than High School | 1,777 (57.3%) | 158 (5.1%) |
| High School Diploma | 8,929 (74.6%) | 646 (5.4%) |
| College / Associate Degree | 8,989 (81.6%) | 242 (2.2%) |
| Bachelor's Degree or higher | 13,975 (84.8%) | 330 (2.0%) |
| Total | 33,670 (79.1%) | 1,320 (3.1%) |
Employment Occupations by Sex in Bartholomew County
Management, Business, Science and Arts Occupations
The most common Management, Business, Science and Arts occupations in Bartholomew County are Computers, Engineering & Science (5,819 | 14.3%), Management (4,075 | 10.0%), Architecture & Engineering (4,003 | 9.8%), Community & Social Service (3,490 | 8.6%), and Business & Financial (2,278 | 5.6%).
Management, Business, Science and Arts Occupations by Sex
Within the Management, Business, Science and Arts occupations in Bartholomew County, the most male-oriented occupations are Architecture & Engineering (78.9%), Computers, Engineering & Science (77.1%), and Computers & Mathematics (73.7%), while the most female-oriented occupations are Legal Services & Support (84.5%), Health Diagnosing & Treating (81.5%), and Health Technologists (80.4%).
| Occupation | Male | Female |
| Management | 2,663 (65.3%) | 1,412 (34.6%) |
| Business & Financial | 1,181 (51.8%) | 1,097 (48.2%) |
| Computers, Engineering & Science | 4,484 (77.1%) | 1,335 (22.9%) |
| Computers & Mathematics | 1,164 (73.7%) | 416 (26.3%) |
| Architecture & Engineering | 3,158 (78.9%) | 845 (21.1%) |
| Life, Physical & Social Science | 162 (68.6%) | 74 (31.4%) |
| Community & Social Service | 1,086 (31.1%) | 2,404 (68.9%) |
| Education, Arts & Media | 205 (34.5%) | 389 (65.5%) |
| Legal Services & Support | 28 (15.5%) | 153 (84.5%) |
| Education Instruction & Library | 530 (25.6%) | 1,538 (74.4%) |
| Arts, Media & Entertainment | 323 (49.9%) | 324 (50.1%) |
| Health Diagnosing & Treating | 411 (18.5%) | 1,807 (81.5%) |
| Health Technologists | 290 (19.6%) | 1,189 (80.4%) |
| Total (Category) | 9,825 (54.9%) | 8,055 (45.1%) |
| Total (Overall) | 22,776 (55.8%) | 18,022 (44.2%) |
Services Occupations
The most common Services occupations in Bartholomew County are Food Preparation & Serving (2,290 | 5.6%), Healthcare Support (1,321 | 3.2%), Cleaning & Maintenance (1,138 | 2.8%), Security & Protection (700 | 1.7%), and Personal Care & Service (694 | 1.7%).
Services Occupations by Sex
Within the Services occupations in Bartholomew County, the most male-oriented occupations are Firefighting & Prevention (79.5%), Security & Protection (71.9%), and Cleaning & Maintenance (62.4%), while the most female-oriented occupations are Healthcare Support (85.2%), Personal Care & Service (82.3%), and Food Preparation & Serving (58.8%).
| Occupation | Male | Female |
| Healthcare Support | 195 (14.8%) | 1,126 (85.2%) |
| Security & Protection | 503 (71.9%) | 197 (28.1%) |
| Firefighting & Prevention | 346 (79.5%) | 89 (20.5%) |
| Law Enforcement | 157 (59.3%) | 108 (40.7%) |
| Food Preparation & Serving | 944 (41.2%) | 1,346 (58.8%) |
| Cleaning & Maintenance | 710 (62.4%) | 428 (37.6%) |
| Personal Care & Service | 123 (17.7%) | 571 (82.3%) |
| Total (Category) | 2,475 (40.3%) | 3,668 (59.7%) |
| Total (Overall) | 22,776 (55.8%) | 18,022 (44.2%) |
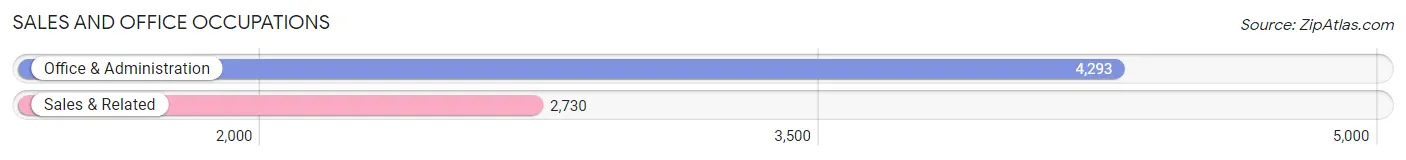
Sales and Office Occupations
The most common Sales and Office occupations in Bartholomew County are Office & Administration (4,293 | 10.5%), and Sales & Related (2,730 | 6.7%).
Sales and Office Occupations by Sex
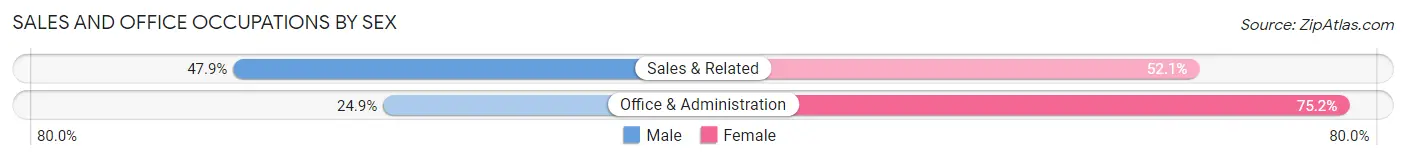
| Occupation | Male | Female |
| Sales & Related | 1,308 (47.9%) | 1,422 (52.1%) |
| Office & Administration | 1,067 (24.8%) | 3,226 (75.1%) |
| Total (Category) | 2,375 (33.8%) | 4,648 (66.2%) |
| Total (Overall) | 22,776 (55.8%) | 18,022 (44.2%) |
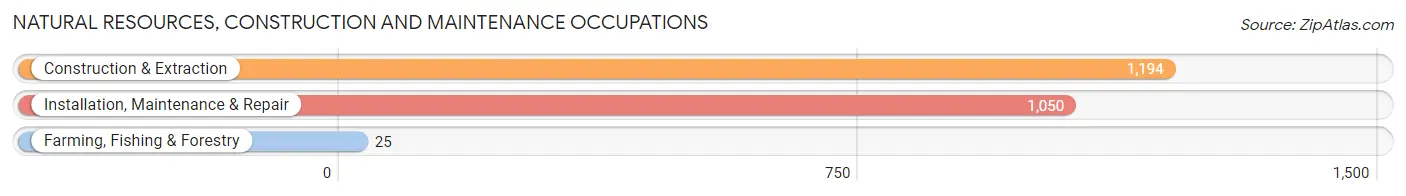
Natural Resources, Construction and Maintenance Occupations
The most common Natural Resources, Construction and Maintenance occupations in Bartholomew County are Construction & Extraction (1,194 | 2.9%), Installation, Maintenance & Repair (1,050 | 2.6%), and Farming, Fishing & Forestry (25 | 0.1%).
Natural Resources, Construction and Maintenance Occupations by Sex
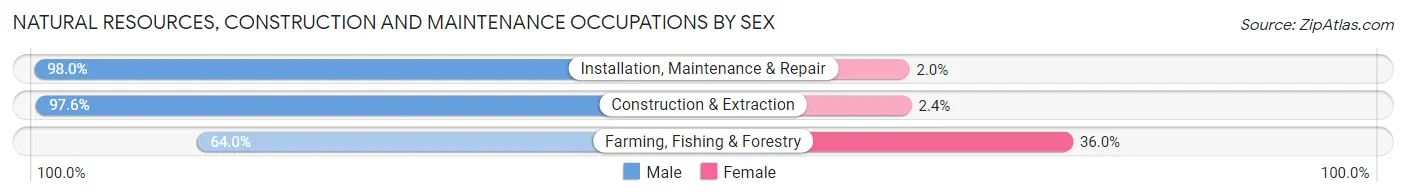
| Occupation | Male | Female |
| Farming, Fishing & Forestry | 16 (64.0%) | 9 (36.0%) |
| Construction & Extraction | 1,165 (97.6%) | 29 (2.4%) |
| Installation, Maintenance & Repair | 1,029 (98.0%) | 21 (2.0%) |
| Total (Category) | 2,210 (97.4%) | 59 (2.6%) |
| Total (Overall) | 22,776 (55.8%) | 18,022 (44.2%) |
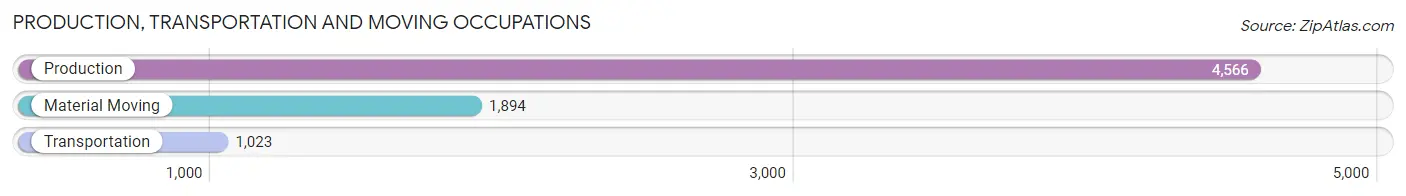
Production, Transportation and Moving Occupations
The most common Production, Transportation and Moving occupations in Bartholomew County are Production (4,566 | 11.2%), Material Moving (1,894 | 4.6%), and Transportation (1,023 | 2.5%).
Production, Transportation and Moving Occupations by Sex
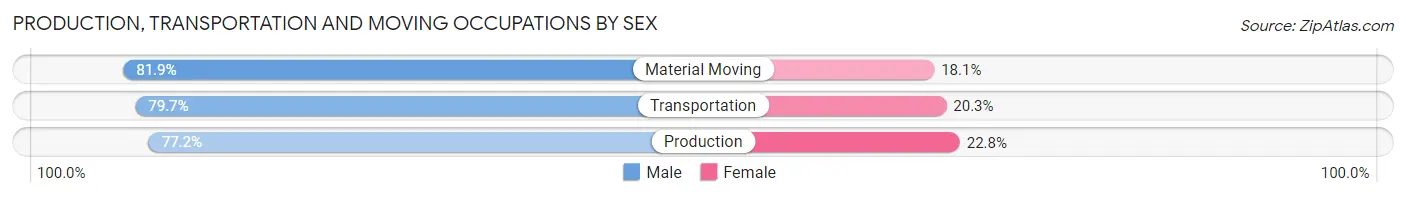
| Occupation | Male | Female |
| Production | 3,525 (77.2%) | 1,041 (22.8%) |
| Transportation | 815 (79.7%) | 208 (20.3%) |
| Material Moving | 1,551 (81.9%) | 343 (18.1%) |
| Total (Category) | 5,891 (78.7%) | 1,592 (21.3%) |
| Total (Overall) | 22,776 (55.8%) | 18,022 (44.2%) |
Employment Industries by Sex in Bartholomew County
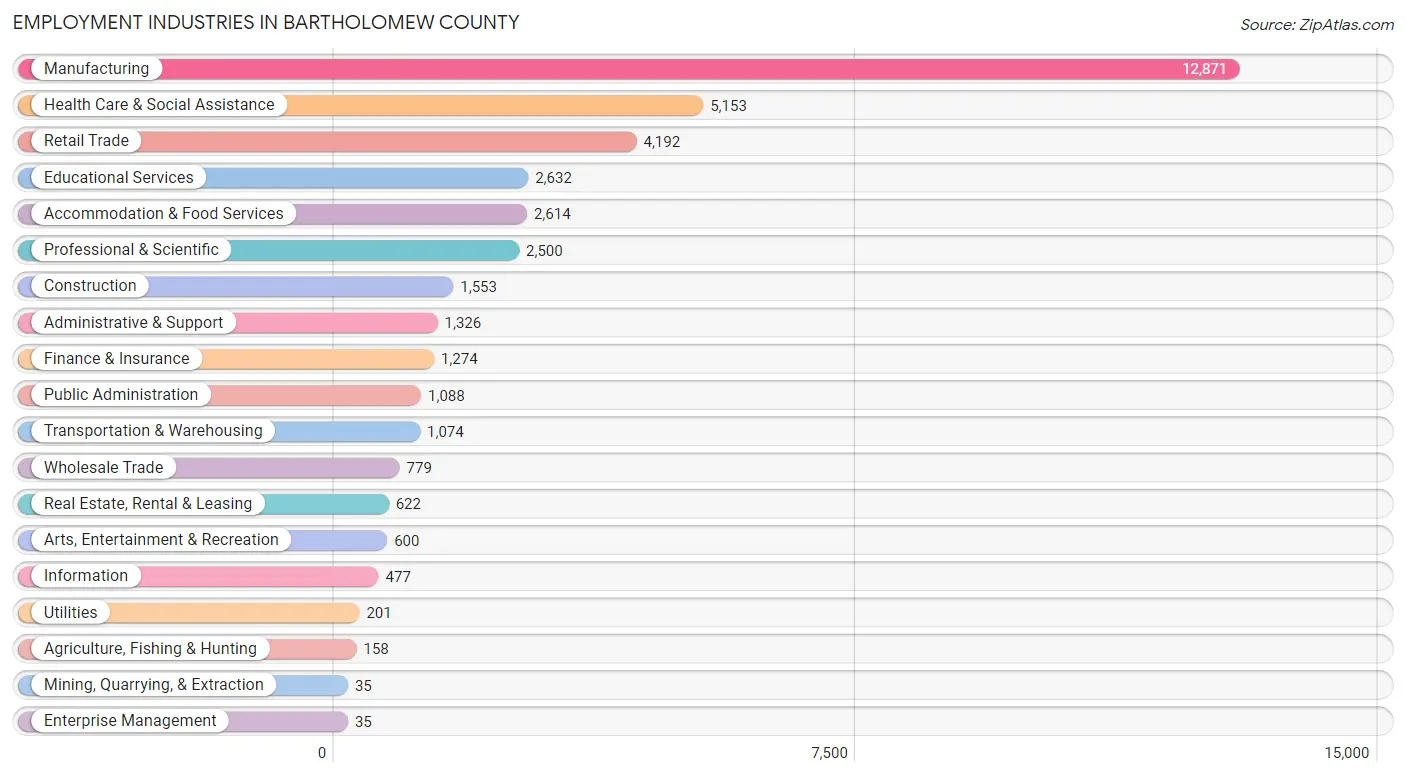
Employment Industries in Bartholomew County
The major employment industries in Bartholomew County include Manufacturing (12,871 | 31.6%), Health Care & Social Assistance (5,153 | 12.6%), Retail Trade (4,192 | 10.3%), Educational Services (2,632 | 6.5%), and Accommodation & Food Services (2,614 | 6.4%).
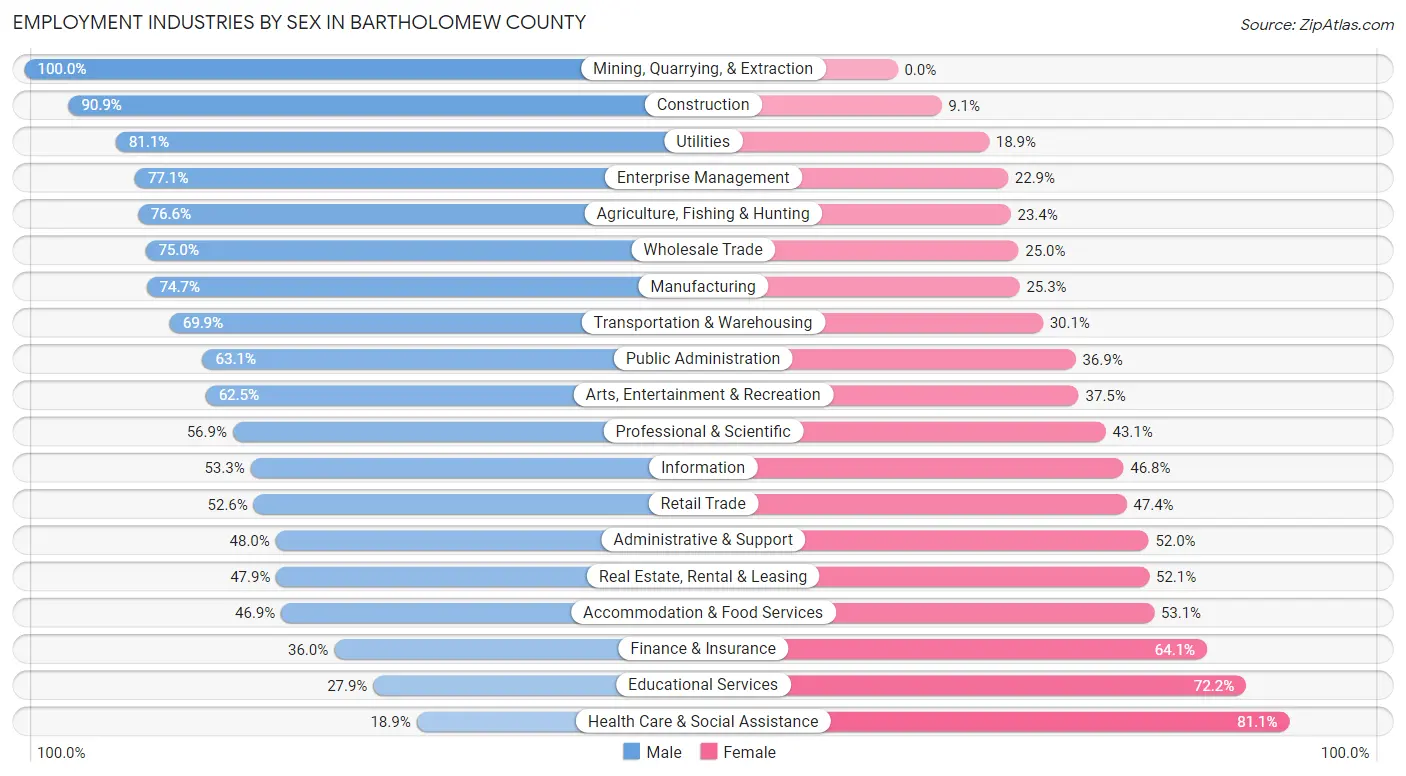
Employment Industries by Sex in Bartholomew County
The Bartholomew County industries that see more men than women are Mining, Quarrying, & Extraction (100.0%), Construction (90.9%), and Utilities (81.1%), whereas the industries that tend to have a higher number of women are Health Care & Social Assistance (81.1%), Educational Services (72.2%), and Finance & Insurance (64.0%).
| Industry | Male | Female |
| Agriculture, Fishing & Hunting | 121 (76.6%) | 37 (23.4%) |
| Mining, Quarrying, & Extraction | 35 (100.0%) | 0 (0.0%) |
| Construction | 1,412 (90.9%) | 141 (9.1%) |
| Manufacturing | 9,620 (74.7%) | 3,251 (25.3%) |
| Wholesale Trade | 584 (75.0%) | 195 (25.0%) |
| Retail Trade | 2,205 (52.6%) | 1,987 (47.4%) |
| Transportation & Warehousing | 751 (69.9%) | 323 (30.1%) |
| Utilities | 163 (81.1%) | 38 (18.9%) |
| Information | 254 (53.2%) | 223 (46.8%) |
| Finance & Insurance | 458 (35.9%) | 816 (64.0%) |
| Real Estate, Rental & Leasing | 298 (47.9%) | 324 (52.1%) |
| Professional & Scientific | 1,423 (56.9%) | 1,077 (43.1%) |
| Enterprise Management | 27 (77.1%) | 8 (22.9%) |
| Administrative & Support | 637 (48.0%) | 689 (52.0%) |
| Educational Services | 733 (27.9%) | 1,899 (72.2%) |
| Health Care & Social Assistance | 973 (18.9%) | 4,180 (81.1%) |
| Arts, Entertainment & Recreation | 375 (62.5%) | 225 (37.5%) |
| Accommodation & Food Services | 1,226 (46.9%) | 1,388 (53.1%) |
| Public Administration | 687 (63.1%) | 401 (36.9%) |
| Total | 22,776 (55.8%) | 18,022 (44.2%) |
Education in Bartholomew County
School Enrollment in Bartholomew County
The most common levels of schooling among the 19,039 students in Bartholomew County are elementary school (4,817 | 25.3%), high school (4,335 | 22.8%), and middle school (4,306 | 22.6%).
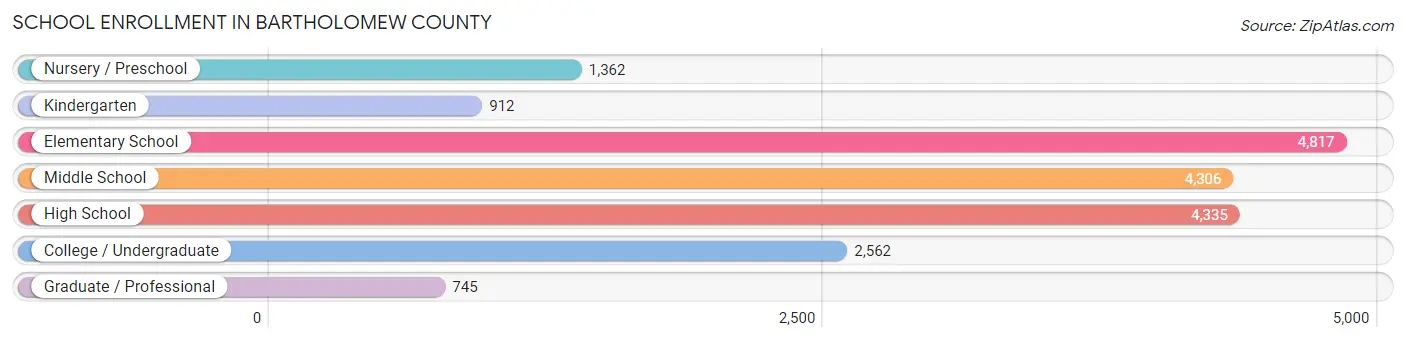
| School Level | # Students | % Students |
| Nursery / Preschool | 1,362 | 7.1% |
| Kindergarten | 912 | 4.8% |
| Elementary School | 4,817 | 25.3% |
| Middle School | 4,306 | 22.6% |
| High School | 4,335 | 22.8% |
| College / Undergraduate | 2,562 | 13.5% |
| Graduate / Professional | 745 | 3.9% |
| Total | 19,039 | 100.0% |
School Enrollment by Age by Funding Source in Bartholomew County
Out of a total of 19,039 students who are enrolled in schools in Bartholomew County, 3,732 (19.6%) attend a private institution, while the remaining 15,307 (80.4%) are enrolled in public schools. The age group of 3 to 4 year olds has the highest likelihood of being enrolled in private schools, with 479 (46.7% in the age bracket) enrolled. Conversely, the age group of 15 to 17 year olds has the lowest likelihood of being enrolled in a private school, with 2,921 (91.6% in the age bracket) attending a public institution.
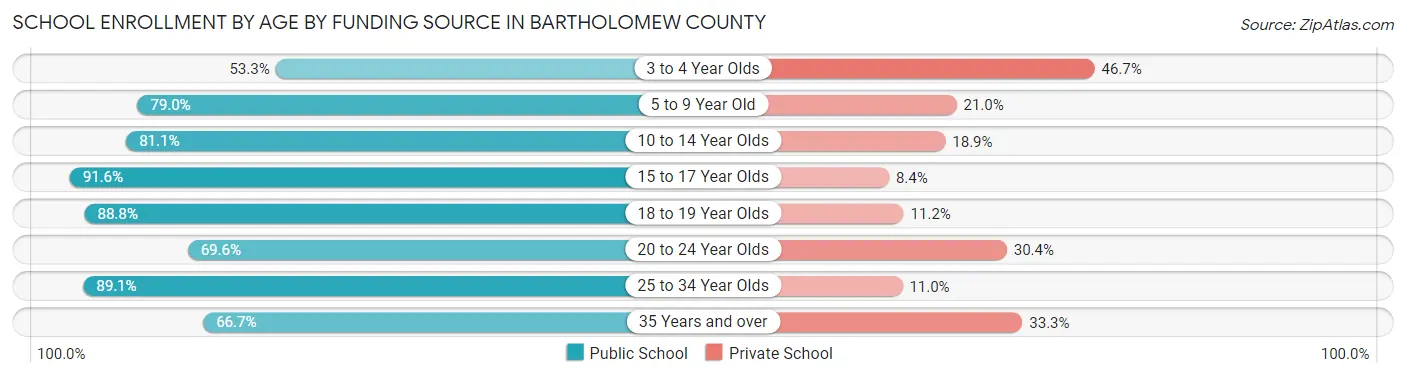
| Age Bracket | Public School | Private School |
| 3 to 4 Year Olds | 546 (53.3%) | 479 (46.7%) |
| 5 to 9 Year Old | 4,217 (79.0%) | 1,122 (21.0%) |
| 10 to 14 Year Olds | 4,461 (81.1%) | 1,042 (18.9%) |
| 15 to 17 Year Olds | 2,921 (91.6%) | 269 (8.4%) |
| 18 to 19 Year Olds | 867 (88.8%) | 109 (11.2%) |
| 20 to 24 Year Olds | 804 (69.6%) | 351 (30.4%) |
| 25 to 34 Year Olds | 1,041 (89.0%) | 128 (11.0%) |
| 35 Years and over | 455 (66.7%) | 227 (33.3%) |
| Total | 15,307 (80.4%) | 3,732 (19.6%) |
Educational Attainment by Field of Study in Bartholomew County
Engineering (4,749 | 23.0%), business (3,180 | 15.4%), science & technology (2,749 | 13.3%), education (2,525 | 12.2%), and computers & mathematics (1,328 | 6.4%) are the most common fields of study among 20,620 individuals in Bartholomew County who have obtained a bachelor's degree or higher.
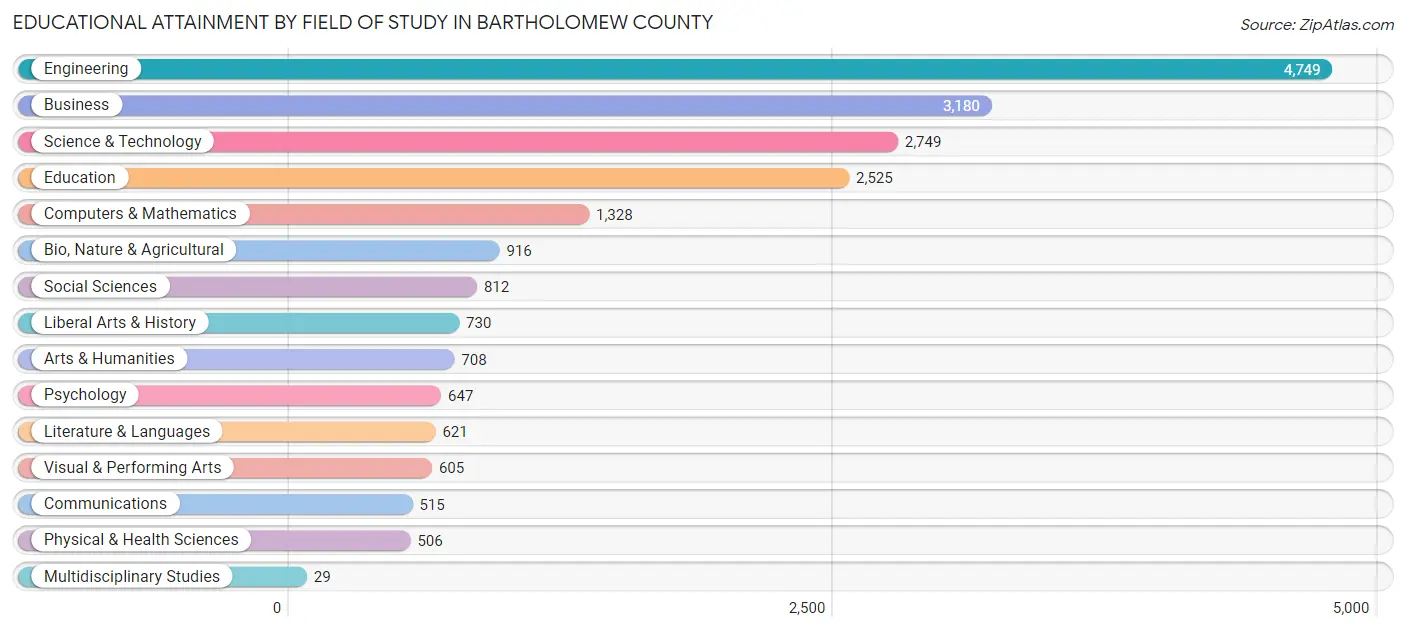
| Field of Study | # Graduates | % Graduates |
| Computers & Mathematics | 1,328 | 6.4% |
| Bio, Nature & Agricultural | 916 | 4.4% |
| Physical & Health Sciences | 506 | 2.5% |
| Psychology | 647 | 3.1% |
| Social Sciences | 812 | 3.9% |
| Engineering | 4,749 | 23.0% |
| Multidisciplinary Studies | 29 | 0.1% |
| Science & Technology | 2,749 | 13.3% |
| Business | 3,180 | 15.4% |
| Education | 2,525 | 12.2% |
| Literature & Languages | 621 | 3.0% |
| Liberal Arts & History | 730 | 3.5% |
| Visual & Performing Arts | 605 | 2.9% |
| Communications | 515 | 2.5% |
| Arts & Humanities | 708 | 3.4% |
| Total | 20,620 | 100.0% |
Transportation & Commute in Bartholomew County
Vehicle Availability by Sex in Bartholomew County
The most prevalent vehicle ownership categories in Bartholomew County are males with 2 vehicles (9,044, accounting for 40.1%) and females with 2 vehicles (6,648, making up 50.9%).
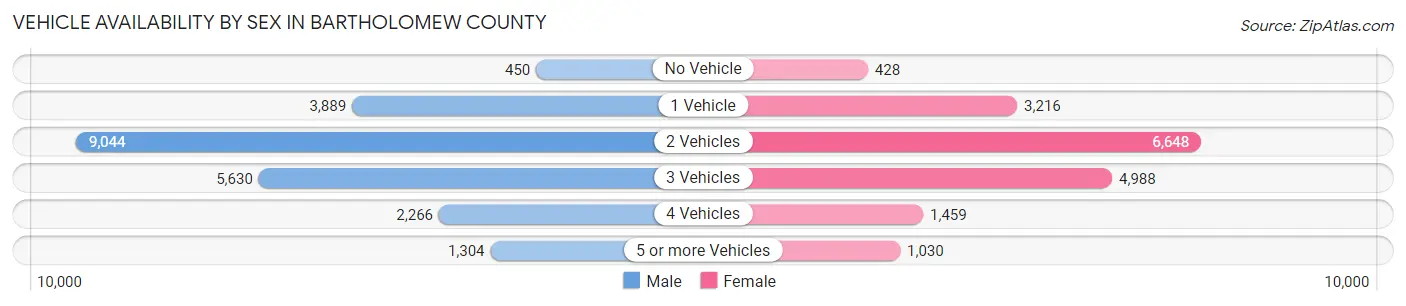
| Vehicles Available | Male | Female |
| No Vehicle | 450 (2.0%) | 428 (2.4%) |
| 1 Vehicle | 3,889 (17.2%) | 3,216 (18.1%) |
| 2 Vehicles | 9,044 (40.1%) | 6,648 (37.4%) |
| 3 Vehicles | 5,630 (24.9%) | 4,988 (28.1%) |
| 4 Vehicles | 2,266 (10.0%) | 1,459 (8.2%) |
| 5 or more Vehicles | 1,304 (5.8%) | 1,030 (5.8%) |
| Total | 22,583 (100.0%) | 17,769 (100.0%) |
Commute Time in Bartholomew County
The most frequently occuring commute durations in Bartholomew County are 10 to 14 minutes (7,132 commuters, 19.8%), 15 to 19 minutes (6,798 commuters, 18.9%), and 5 to 9 minutes (5,906 commuters, 16.4%).
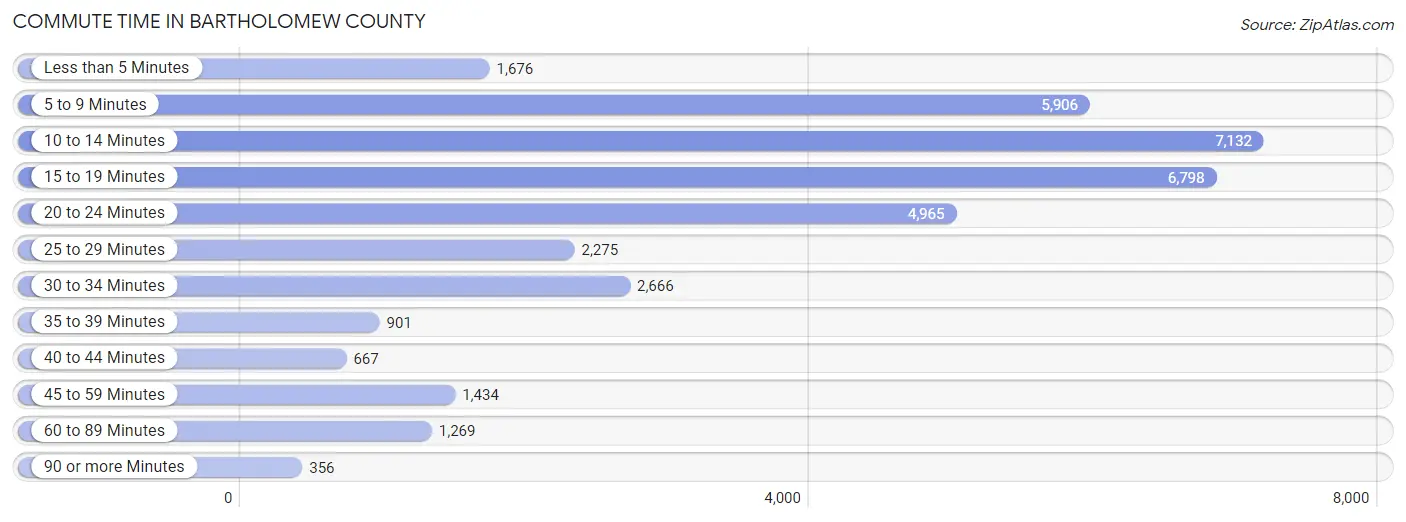
| Commute Time | # Commuters | % Commuters |
| Less than 5 Minutes | 1,676 | 4.6% |
| 5 to 9 Minutes | 5,906 | 16.4% |
| 10 to 14 Minutes | 7,132 | 19.8% |
| 15 to 19 Minutes | 6,798 | 18.9% |
| 20 to 24 Minutes | 4,965 | 13.8% |
| 25 to 29 Minutes | 2,275 | 6.3% |
| 30 to 34 Minutes | 2,666 | 7.4% |
| 35 to 39 Minutes | 901 | 2.5% |
| 40 to 44 Minutes | 667 | 1.8% |
| 45 to 59 Minutes | 1,434 | 4.0% |
| 60 to 89 Minutes | 1,269 | 3.5% |
| 90 or more Minutes | 356 | 1.0% |
Commute Time by Sex in Bartholomew County
The most common commute times in Bartholomew County are 10 to 14 minutes (3,915 commuters, 19.1%) for males and 10 to 14 minutes (3,217 commuters, 20.7%) for females.
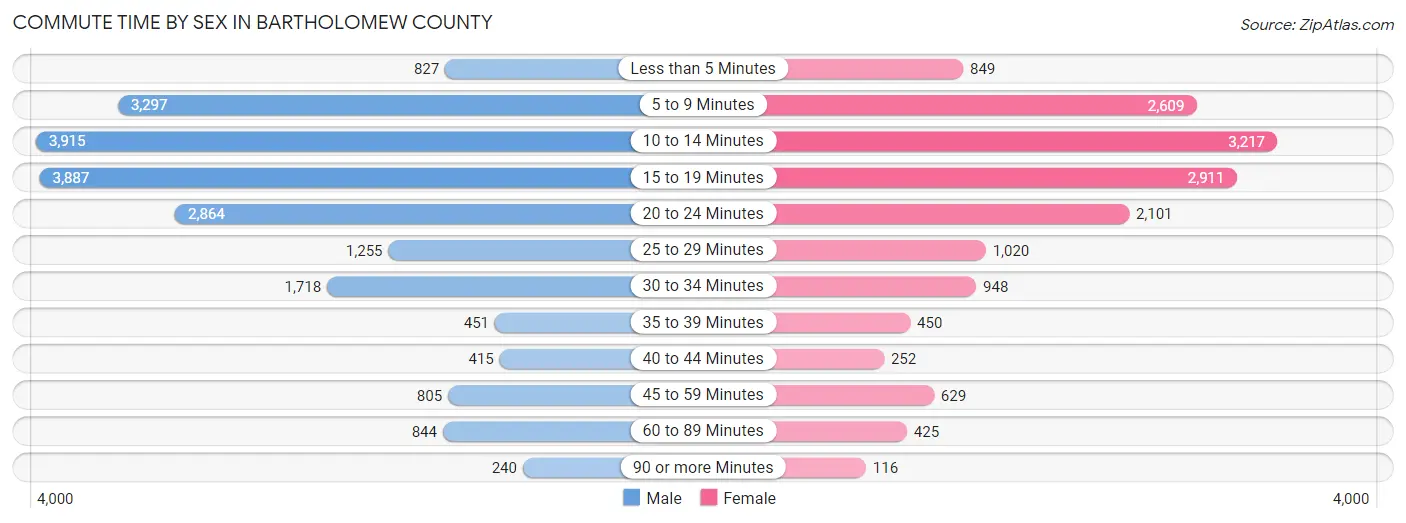
| Commute Time | Male | Female |
| Less than 5 Minutes | 827 (4.0%) | 849 (5.5%) |
| 5 to 9 Minutes | 3,297 (16.1%) | 2,609 (16.8%) |
| 10 to 14 Minutes | 3,915 (19.1%) | 3,217 (20.7%) |
| 15 to 19 Minutes | 3,887 (18.9%) | 2,911 (18.8%) |
| 20 to 24 Minutes | 2,864 (14.0%) | 2,101 (13.5%) |
| 25 to 29 Minutes | 1,255 (6.1%) | 1,020 (6.6%) |
| 30 to 34 Minutes | 1,718 (8.4%) | 948 (6.1%) |
| 35 to 39 Minutes | 451 (2.2%) | 450 (2.9%) |
| 40 to 44 Minutes | 415 (2.0%) | 252 (1.6%) |
| 45 to 59 Minutes | 805 (3.9%) | 629 (4.1%) |
| 60 to 89 Minutes | 844 (4.1%) | 425 (2.7%) |
| 90 or more Minutes | 240 (1.2%) | 116 (0.7%) |
Time of Departure to Work by Sex in Bartholomew County
The most frequent times of departure to work in Bartholomew County are 7:30 AM to 7:59 AM (3,068, 14.9%) for males and 7:30 AM to 7:59 AM (2,777, 17.9%) for females.
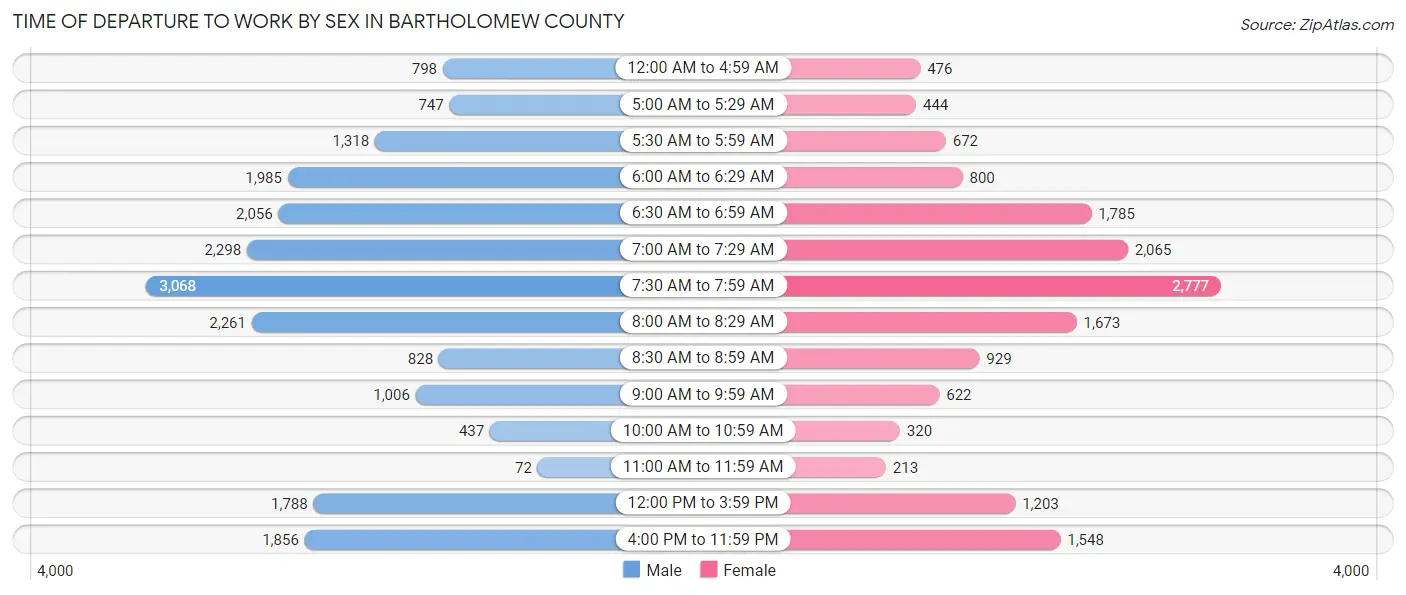
| Time of Departure | Male | Female |
| 12:00 AM to 4:59 AM | 798 (3.9%) | 476 (3.1%) |
| 5:00 AM to 5:29 AM | 747 (3.6%) | 444 (2.9%) |
| 5:30 AM to 5:59 AM | 1,318 (6.4%) | 672 (4.3%) |
| 6:00 AM to 6:29 AM | 1,985 (9.7%) | 800 (5.1%) |
| 6:30 AM to 6:59 AM | 2,056 (10.0%) | 1,785 (11.5%) |
| 7:00 AM to 7:29 AM | 2,298 (11.2%) | 2,065 (13.3%) |
| 7:30 AM to 7:59 AM | 3,068 (14.9%) | 2,777 (17.9%) |
| 8:00 AM to 8:29 AM | 2,261 (11.0%) | 1,673 (10.8%) |
| 8:30 AM to 8:59 AM | 828 (4.0%) | 929 (6.0%) |
| 9:00 AM to 9:59 AM | 1,006 (4.9%) | 622 (4.0%) |
| 10:00 AM to 10:59 AM | 437 (2.1%) | 320 (2.1%) |
| 11:00 AM to 11:59 AM | 72 (0.4%) | 213 (1.4%) |
| 12:00 PM to 3:59 PM | 1,788 (8.7%) | 1,203 (7.7%) |
| 4:00 PM to 11:59 PM | 1,856 (9.0%) | 1,548 (10.0%) |
| Total | 20,518 (100.0%) | 15,527 (100.0%) |
Housing Occupancy in Bartholomew County
Occupancy by Ownership in Bartholomew County
Of the total 32,773 dwellings in Bartholomew County, owner-occupied units account for 22,991 (70.2%), while renter-occupied units make up 9,782 (29.8%).
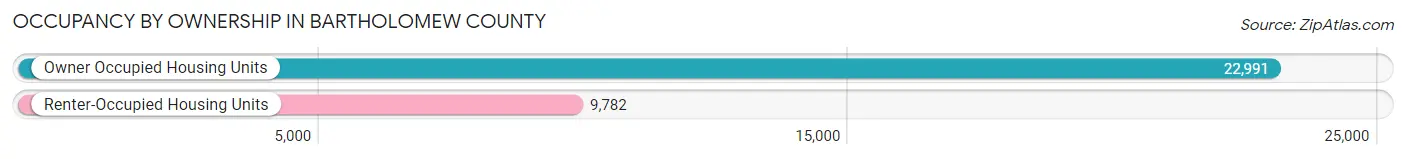
| Occupancy | # Housing Units | % Housing Units |
| Owner Occupied Housing Units | 22,991 | 70.2% |
| Renter-Occupied Housing Units | 9,782 | 29.8% |
| Total Occupied Housing Units | 32,773 | 100.0% |
Occupancy by Household Size in Bartholomew County
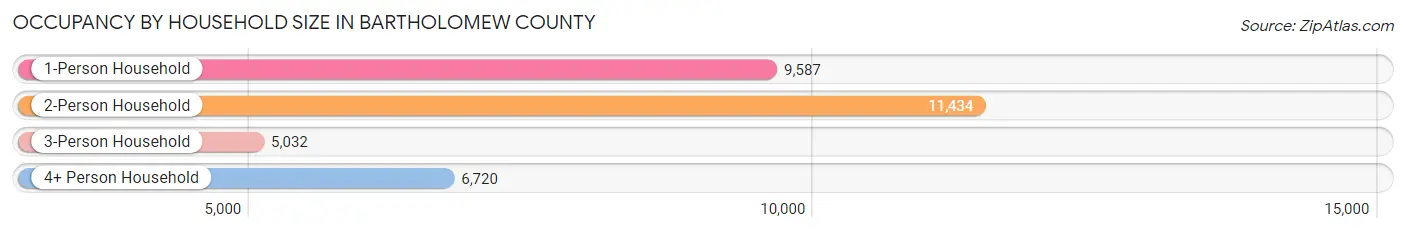
| Household Size | # Housing Units | % Housing Units |
| 1-Person Household | 9,587 | 29.2% |
| 2-Person Household | 11,434 | 34.9% |
| 3-Person Household | 5,032 | 15.3% |
| 4+ Person Household | 6,720 | 20.5% |
| Total Housing Units | 32,773 | 100.0% |
Occupancy by Ownership by Household Size in Bartholomew County
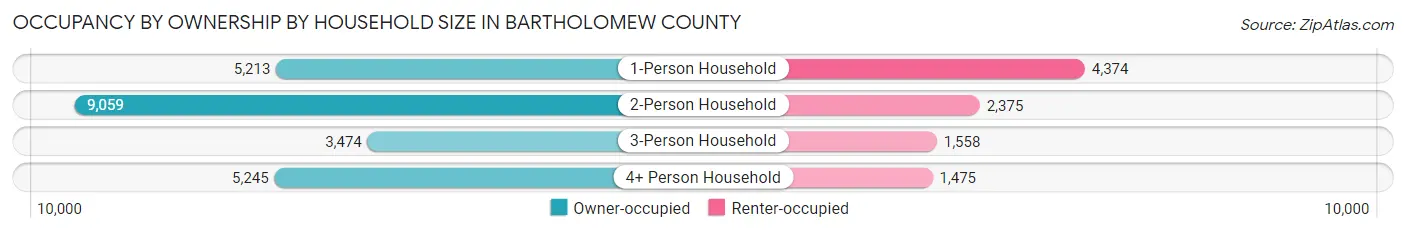
| Household Size | Owner-occupied | Renter-occupied |
| 1-Person Household | 5,213 (54.4%) | 4,374 (45.6%) |
| 2-Person Household | 9,059 (79.2%) | 2,375 (20.8%) |
| 3-Person Household | 3,474 (69.0%) | 1,558 (31.0%) |
| 4+ Person Household | 5,245 (78.0%) | 1,475 (22.0%) |
| Total Housing Units | 22,991 (70.2%) | 9,782 (29.8%) |
Occupancy by Educational Attainment in Bartholomew County
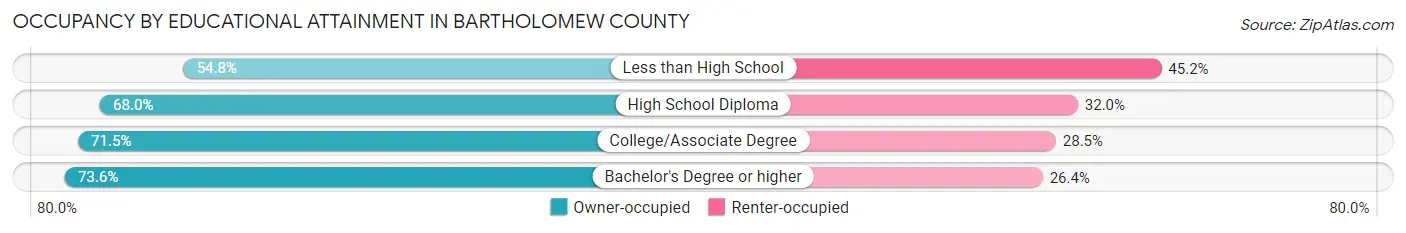
| Household Size | Owner-occupied | Renter-occupied |
| Less than High School | 1,266 (54.8%) | 1,046 (45.2%) |
| High School Diploma | 6,201 (68.0%) | 2,917 (32.0%) |
| College/Associate Degree | 6,268 (71.5%) | 2,498 (28.5%) |
| Bachelor's Degree or higher | 9,256 (73.6%) | 3,321 (26.4%) |
Occupancy by Age of Householder in Bartholomew County
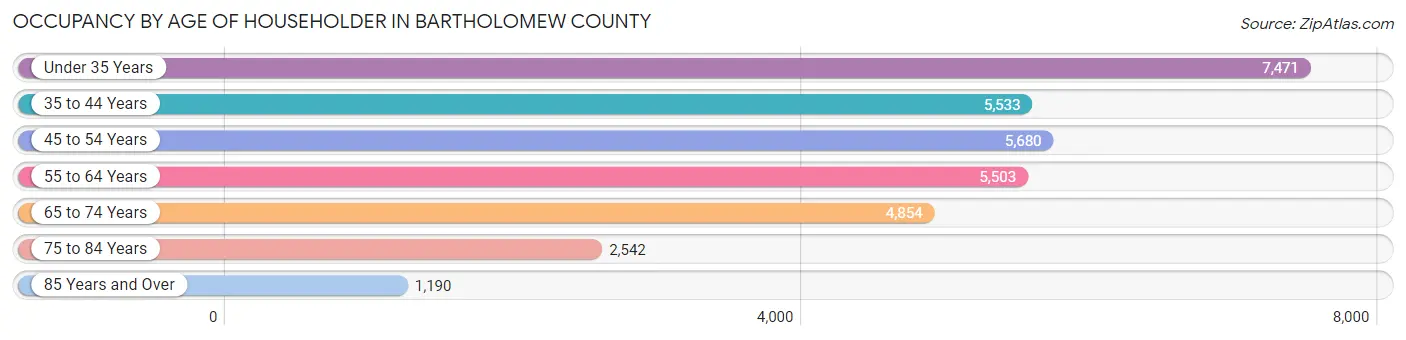
| Age Bracket | # Households | % Households |
| Under 35 Years | 7,471 | 22.8% |
| 35 to 44 Years | 5,533 | 16.9% |
| 45 to 54 Years | 5,680 | 17.3% |
| 55 to 64 Years | 5,503 | 16.8% |
| 65 to 74 Years | 4,854 | 14.8% |
| 75 to 84 Years | 2,542 | 7.8% |
| 85 Years and Over | 1,190 | 3.6% |
| Total | 32,773 | 100.0% |
Housing Finances in Bartholomew County
Median Income by Occupancy in Bartholomew County
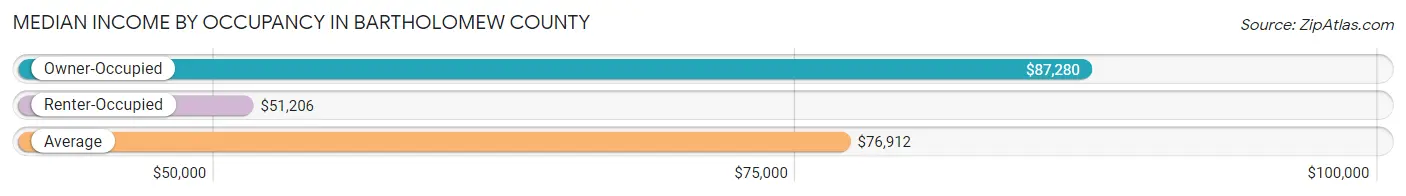
| Occupancy Type | # Households | Median Income |
| Owner-Occupied | 22,991 (70.2%) | $87,280 |
| Renter-Occupied | 9,782 (29.8%) | $51,206 |
| Average | 32,773 (100.0%) | $76,912 |
Occupancy by Householder Income Bracket in Bartholomew County
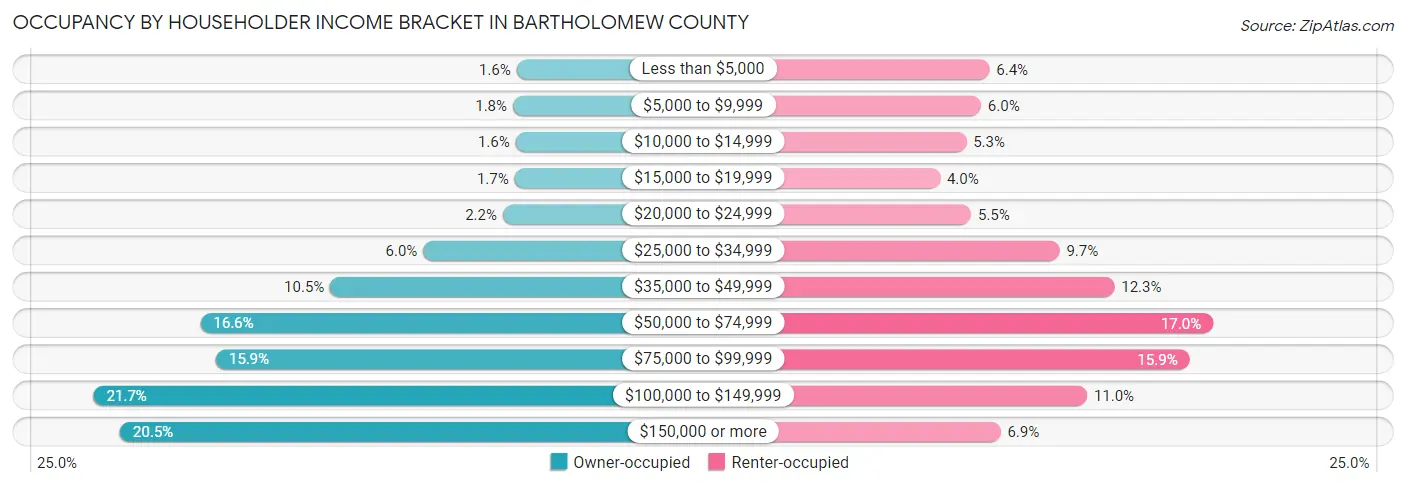
| Income Bracket | Owner-occupied | Renter-occupied |
| Less than $5,000 | 362 (1.6%) | 623 (6.4%) |
| $5,000 to $9,999 | 402 (1.8%) | 584 (6.0%) |
| $10,000 to $14,999 | 372 (1.6%) | 516 (5.3%) |
| $15,000 to $19,999 | 384 (1.7%) | 393 (4.0%) |
| $20,000 to $24,999 | 512 (2.2%) | 538 (5.5%) |
| $25,000 to $34,999 | 1,384 (6.0%) | 950 (9.7%) |
| $35,000 to $49,999 | 2,402 (10.4%) | 1,205 (12.3%) |
| $50,000 to $74,999 | 3,823 (16.6%) | 1,665 (17.0%) |
| $75,000 to $99,999 | 3,653 (15.9%) | 1,555 (15.9%) |
| $100,000 to $149,999 | 4,994 (21.7%) | 1,078 (11.0%) |
| $150,000 or more | 4,703 (20.5%) | 675 (6.9%) |
| Total | 22,991 (100.0%) | 9,782 (100.0%) |
Monthly Housing Cost Tiers in Bartholomew County
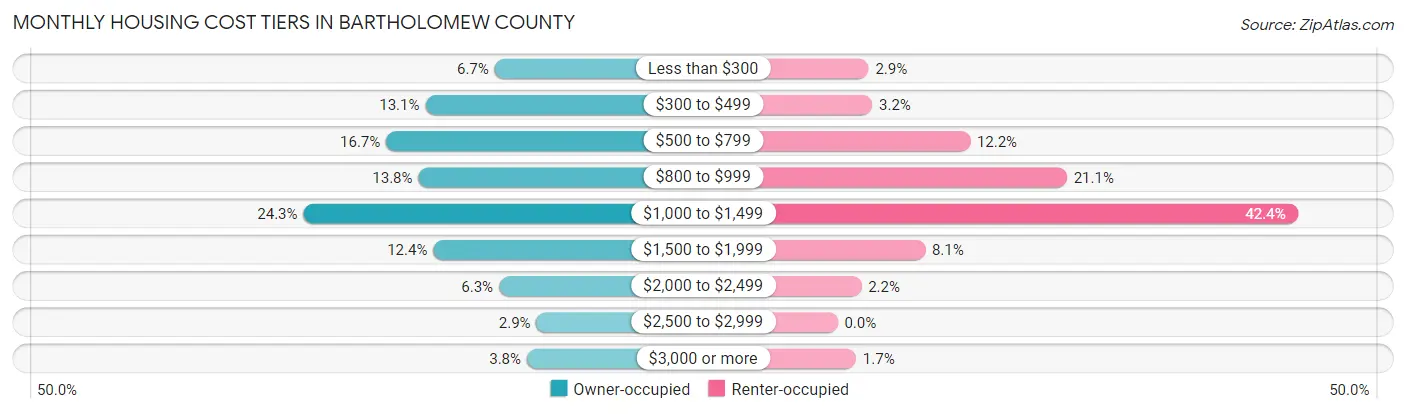
| Monthly Cost | Owner-occupied | Renter-occupied |
| Less than $300 | 1,548 (6.7%) | 280 (2.9%) |
| $300 to $499 | 3,014 (13.1%) | 312 (3.2%) |
| $500 to $799 | 3,845 (16.7%) | 1,193 (12.2%) |
| $800 to $999 | 3,161 (13.8%) | 2,065 (21.1%) |
| $1,000 to $1,499 | 5,595 (24.3%) | 4,143 (42.3%) |
| $1,500 to $1,999 | 2,847 (12.4%) | 788 (8.1%) |
| $2,000 to $2,499 | 1,455 (6.3%) | 214 (2.2%) |
| $2,500 to $2,999 | 661 (2.9%) | 0 (0.0%) |
| $3,000 or more | 865 (3.8%) | 166 (1.7%) |
| Total | 22,991 (100.0%) | 9,782 (100.0%) |
Physical Housing Characteristics in Bartholomew County
Housing Structures in Bartholomew County
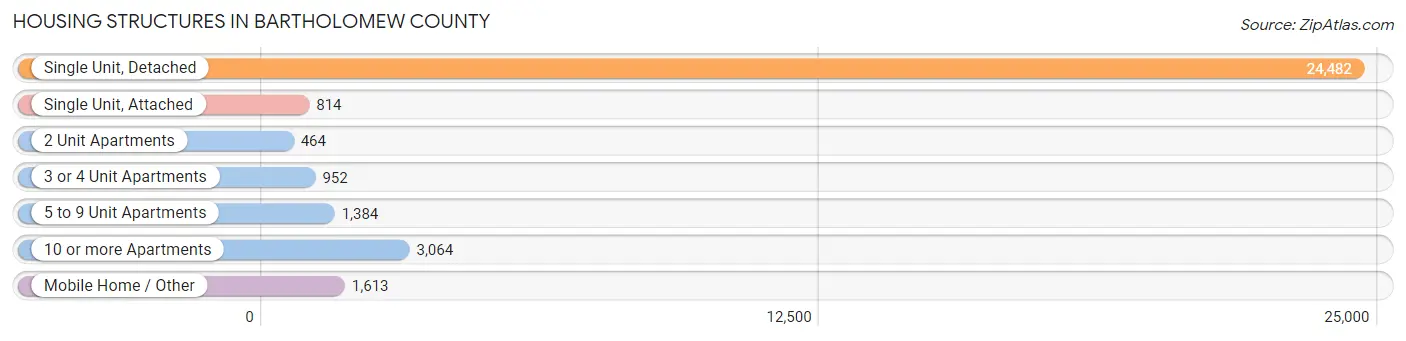
| Structure Type | # Housing Units | % Housing Units |
| Single Unit, Detached | 24,482 | 74.7% |
| Single Unit, Attached | 814 | 2.5% |
| 2 Unit Apartments | 464 | 1.4% |
| 3 or 4 Unit Apartments | 952 | 2.9% |
| 5 to 9 Unit Apartments | 1,384 | 4.2% |
| 10 or more Apartments | 3,064 | 9.3% |
| Mobile Home / Other | 1,613 | 4.9% |
| Total | 32,773 | 100.0% |
Housing Structures by Occupancy in Bartholomew County
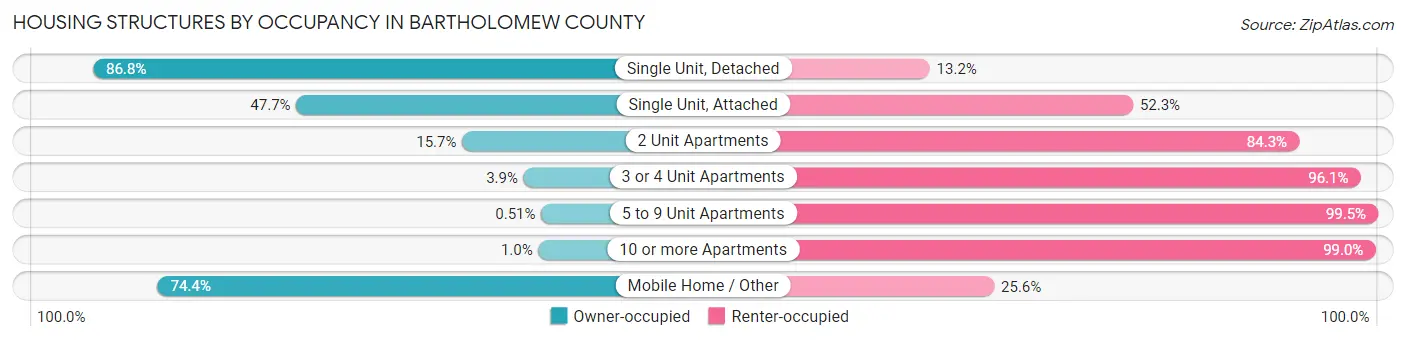
| Structure Type | Owner-occupied | Renter-occupied |
| Single Unit, Detached | 21,254 (86.8%) | 3,228 (13.2%) |
| Single Unit, Attached | 388 (47.7%) | 426 (52.3%) |
| 2 Unit Apartments | 73 (15.7%) | 391 (84.3%) |
| 3 or 4 Unit Apartments | 37 (3.9%) | 915 (96.1%) |
| 5 to 9 Unit Apartments | 7 (0.5%) | 1,377 (99.5%) |
| 10 or more Apartments | 32 (1.0%) | 3,032 (99.0%) |
| Mobile Home / Other | 1,200 (74.4%) | 413 (25.6%) |
| Total | 22,991 (70.2%) | 9,782 (29.8%) |
Housing Structures by Number of Rooms in Bartholomew County
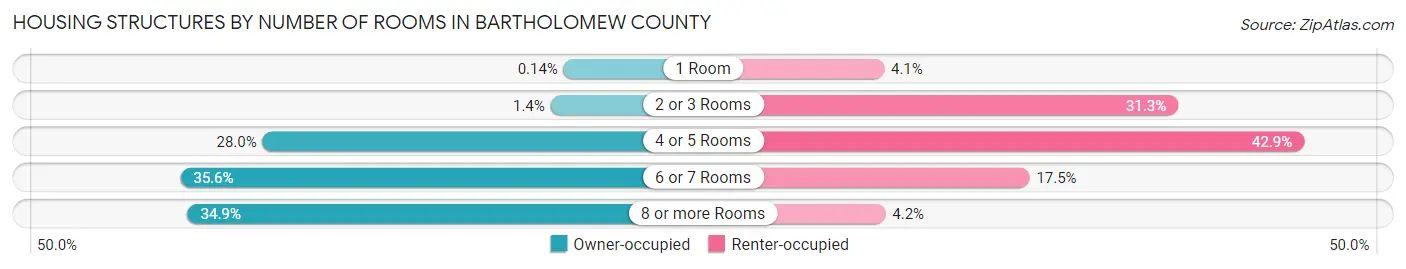
| Number of Rooms | Owner-occupied | Renter-occupied |
| 1 Room | 32 (0.1%) | 399 (4.1%) |
| 2 or 3 Rooms | 311 (1.3%) | 3,059 (31.3%) |
| 4 or 5 Rooms | 6,435 (28.0%) | 4,198 (42.9%) |
| 6 or 7 Rooms | 8,185 (35.6%) | 1,715 (17.5%) |
| 8 or more Rooms | 8,028 (34.9%) | 411 (4.2%) |
| Total | 22,991 (100.0%) | 9,782 (100.0%) |
Housing Structure by Heating Type in Bartholomew County
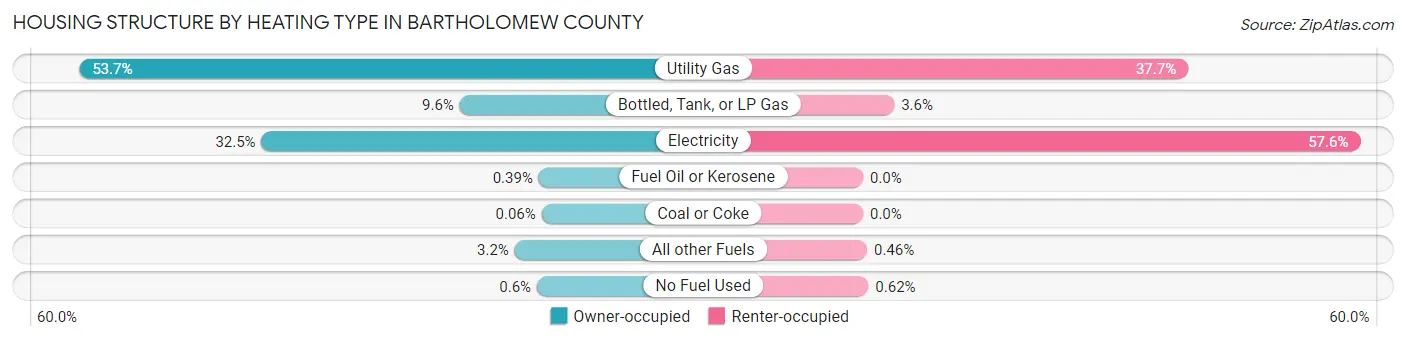
| Heating Type | Owner-occupied | Renter-occupied |
| Utility Gas | 12,338 (53.7%) | 3,685 (37.7%) |
| Bottled, Tank, or LP Gas | 2,198 (9.6%) | 353 (3.6%) |
| Electricity | 7,482 (32.5%) | 5,638 (57.6%) |
| Fuel Oil or Kerosene | 90 (0.4%) | 0 (0.0%) |
| Coal or Coke | 14 (0.1%) | 0 (0.0%) |
| All other Fuels | 730 (3.2%) | 45 (0.5%) |
| No Fuel Used | 139 (0.6%) | 61 (0.6%) |
| Total | 22,991 (100.0%) | 9,782 (100.0%) |
Household Vehicle Usage in Bartholomew County
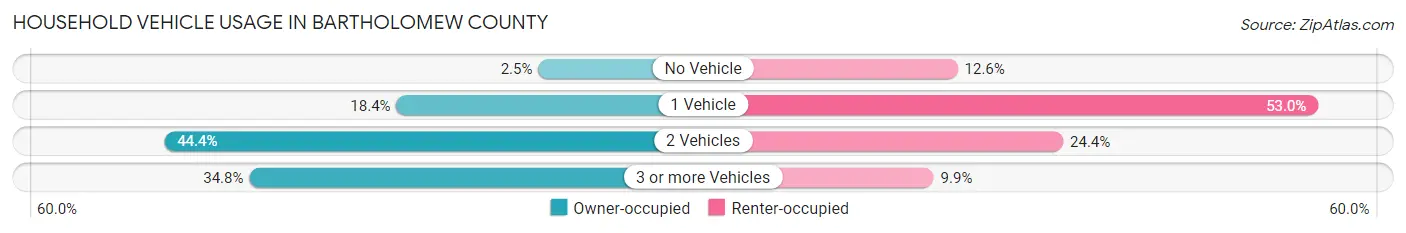
| Vehicles per Household | Owner-occupied | Renter-occupied |
| No Vehicle | 565 (2.5%) | 1,234 (12.6%) |
| 1 Vehicle | 4,219 (18.3%) | 5,185 (53.0%) |
| 2 Vehicles | 10,199 (44.4%) | 2,391 (24.4%) |
| 3 or more Vehicles | 8,008 (34.8%) | 972 (9.9%) |
| Total | 22,991 (100.0%) | 9,782 (100.0%) |
Real Estate & Mortgages in Bartholomew County
Real Estate and Mortgage Overview in Bartholomew County
| Characteristic | Without Mortgage | With Mortgage |
| Housing Units | 8,035 | 14,956 |
| Median Property Value | $179,900 | $208,600 |
| Median Household Income | $59,448 | $3,668 |
| Monthly Housing Costs | $485 | $865 |
| Real Estate Taxes | $1,286 | $307 |
Property Value by Mortgage Status in Bartholomew County
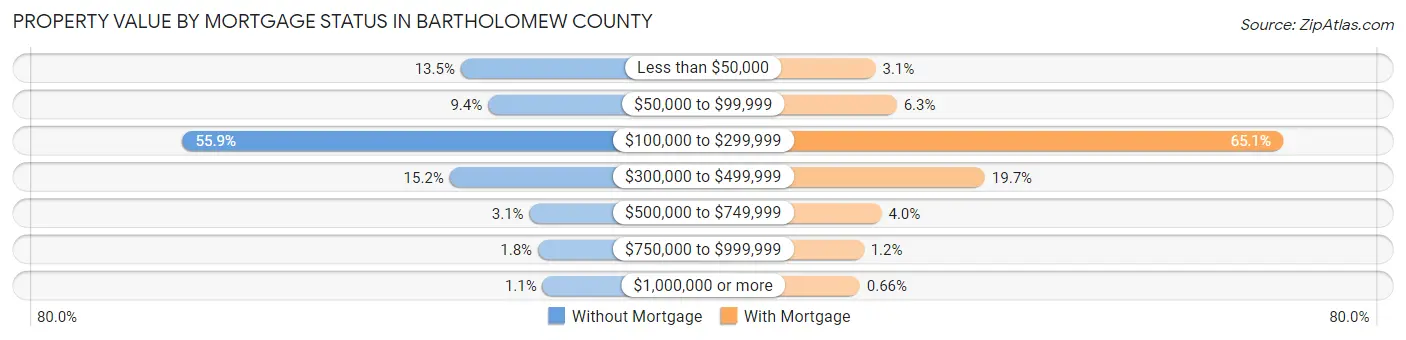
| Property Value | Without Mortgage | With Mortgage |
| Less than $50,000 | 1,088 (13.5%) | 456 (3.0%) |
| $50,000 to $99,999 | 754 (9.4%) | 938 (6.3%) |
| $100,000 to $299,999 | 4,492 (55.9%) | 9,737 (65.1%) |
| $300,000 to $499,999 | 1,224 (15.2%) | 2,948 (19.7%) |
| $500,000 to $749,999 | 247 (3.1%) | 592 (4.0%) |
| $750,000 to $999,999 | 143 (1.8%) | 186 (1.2%) |
| $1,000,000 or more | 87 (1.1%) | 99 (0.7%) |
| Total | 8,035 (100.0%) | 14,956 (100.0%) |
Household Income by Mortgage Status in Bartholomew County
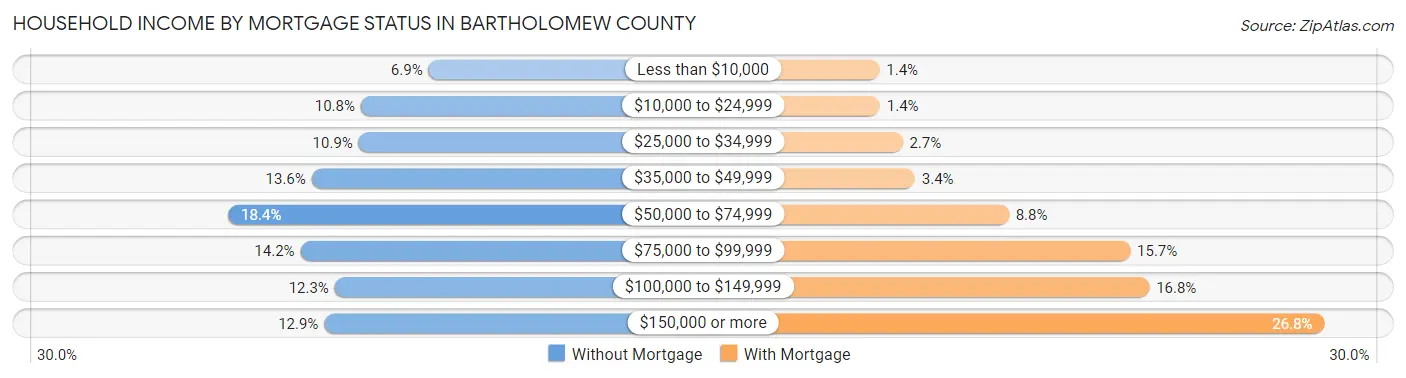
| Household Income | Without Mortgage | With Mortgage |
| Less than $10,000 | 556 (6.9%) | 204 (1.4%) |
| $10,000 to $24,999 | 867 (10.8%) | 208 (1.4%) |
| $25,000 to $34,999 | 877 (10.9%) | 401 (2.7%) |
| $35,000 to $49,999 | 1,093 (13.6%) | 507 (3.4%) |
| $50,000 to $74,999 | 1,476 (18.4%) | 1,309 (8.7%) |
| $75,000 to $99,999 | 1,144 (14.2%) | 2,347 (15.7%) |
| $100,000 to $149,999 | 987 (12.3%) | 2,509 (16.8%) |
| $150,000 or more | 1,035 (12.9%) | 4,007 (26.8%) |
| Total | 8,035 (100.0%) | 14,956 (100.0%) |
Property Value to Household Income Ratio in Bartholomew County
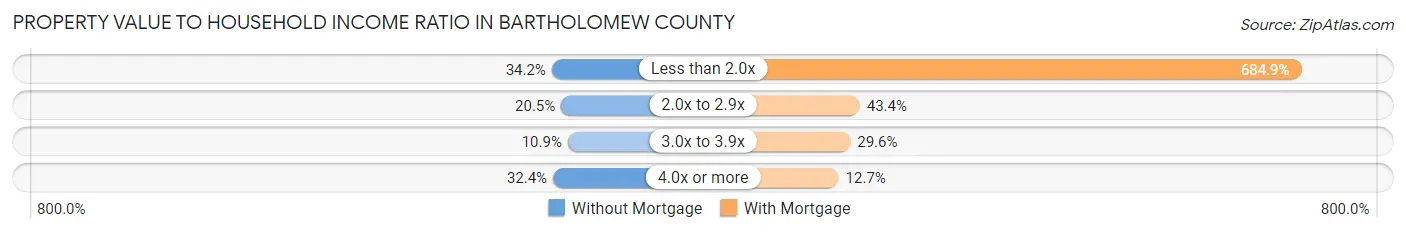
| Value-to-Income Ratio | Without Mortgage | With Mortgage |
| Less than 2.0x | 2,746 (34.2%) | 102,438 (684.9%) |
| 2.0x to 2.9x | 1,644 (20.5%) | 6,485 (43.4%) |
| 3.0x to 3.9x | 872 (10.8%) | 4,422 (29.6%) |
| 4.0x or more | 2,600 (32.4%) | 1,893 (12.7%) |
| Total | 8,035 (100.0%) | 14,956 (100.0%) |
Real Estate Taxes by Mortgage Status in Bartholomew County
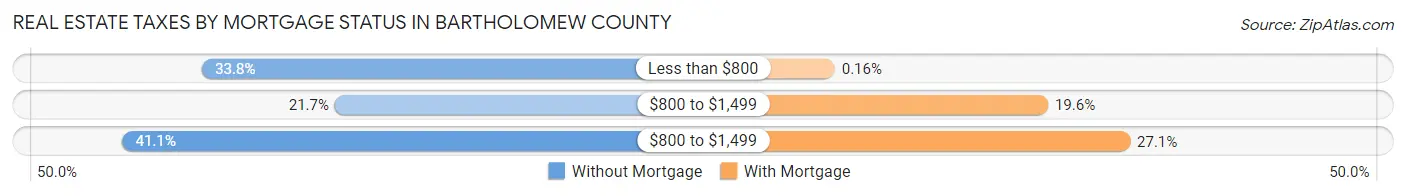
| Property Taxes | Without Mortgage | With Mortgage |
| Less than $800 | 2,715 (33.8%) | 24 (0.2%) |
| $800 to $1,499 | 1,741 (21.7%) | 2,936 (19.6%) |
| $800 to $1,499 | 3,298 (41.0%) | 4,058 (27.1%) |
| Total | 8,035 (100.0%) | 14,956 (100.0%) |
Health & Disability in Bartholomew County
Health Insurance Coverage by Age in Bartholomew County
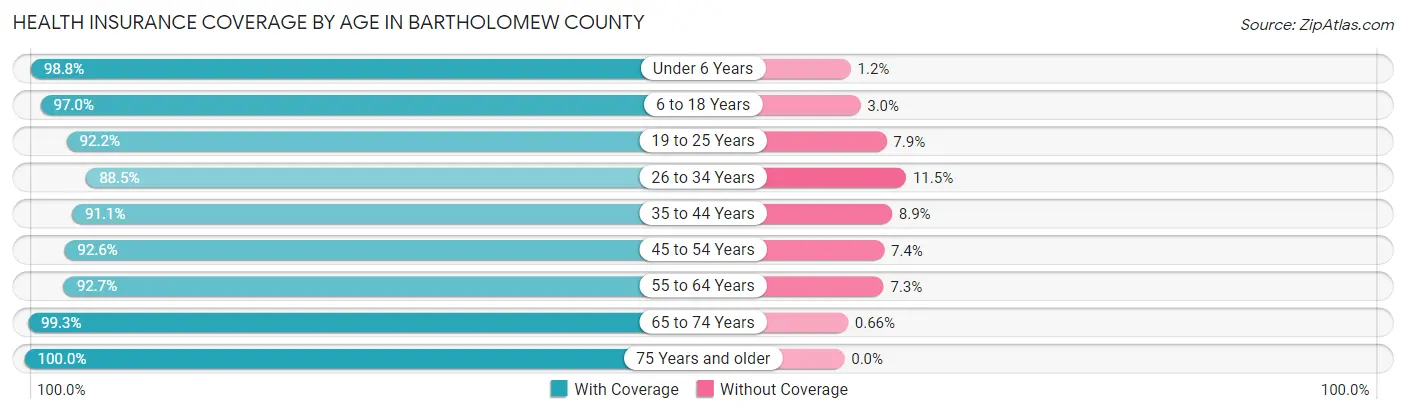
| Age Bracket | With Coverage | Without Coverage |
| Under 6 Years | 6,193 (98.8%) | 73 (1.2%) |
| 6 to 18 Years | 13,824 (97.0%) | 425 (3.0%) |
| 19 to 25 Years | 6,031 (92.1%) | 514 (7.9%) |
| 26 to 34 Years | 9,315 (88.5%) | 1,211 (11.5%) |
| 35 to 44 Years | 9,719 (91.1%) | 946 (8.9%) |
| 45 to 54 Years | 9,292 (92.6%) | 746 (7.4%) |
| 55 to 64 Years | 9,328 (92.7%) | 737 (7.3%) |
| 65 to 74 Years | 7,706 (99.3%) | 51 (0.7%) |
| 75 Years and older | 5,244 (100.0%) | 0 (0.0%) |
| Total | 76,652 (94.2%) | 4,703 (5.8%) |
Health Insurance Coverage by Citizenship Status in Bartholomew County
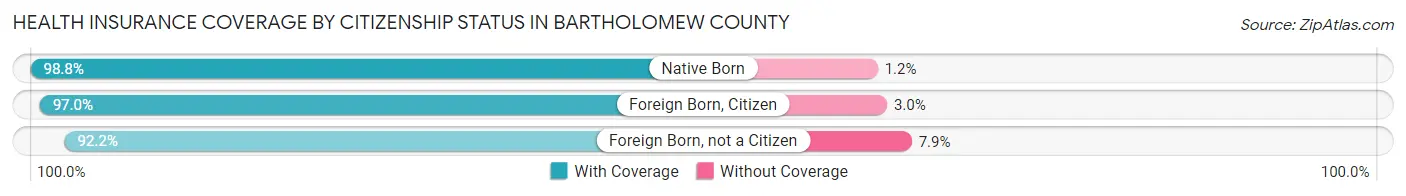
| Citizenship Status | With Coverage | Without Coverage |
| Native Born | 6,193 (98.8%) | 73 (1.2%) |
| Foreign Born, Citizen | 13,824 (97.0%) | 425 (3.0%) |
| Foreign Born, not a Citizen | 6,031 (92.1%) | 514 (7.9%) |
Health Insurance Coverage by Household Income in Bartholomew County
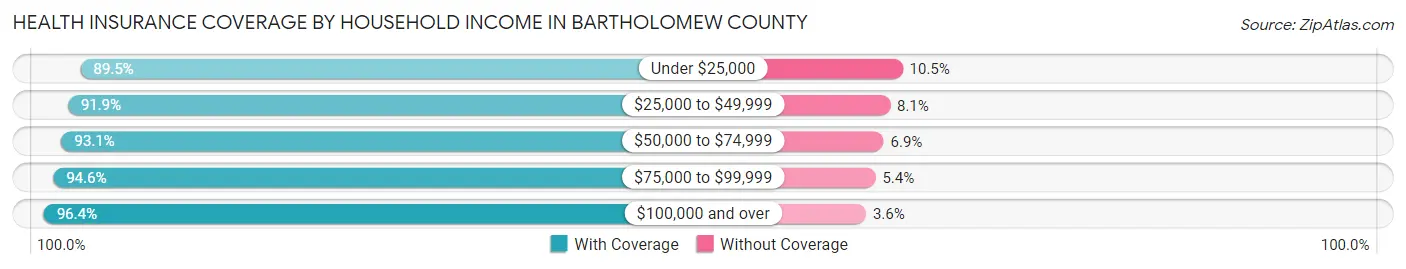
| Household Income | With Coverage | Without Coverage |
| Under $25,000 | 6,885 (89.5%) | 804 (10.5%) |
| $25,000 to $49,999 | 11,282 (91.9%) | 995 (8.1%) |
| $50,000 to $74,999 | 12,092 (93.1%) | 896 (6.9%) |
| $75,000 to $99,999 | 14,250 (94.6%) | 809 (5.4%) |
| $100,000 and over | 32,021 (96.4%) | 1,193 (3.6%) |
Public vs Private Health Insurance Coverage by Age in Bartholomew County
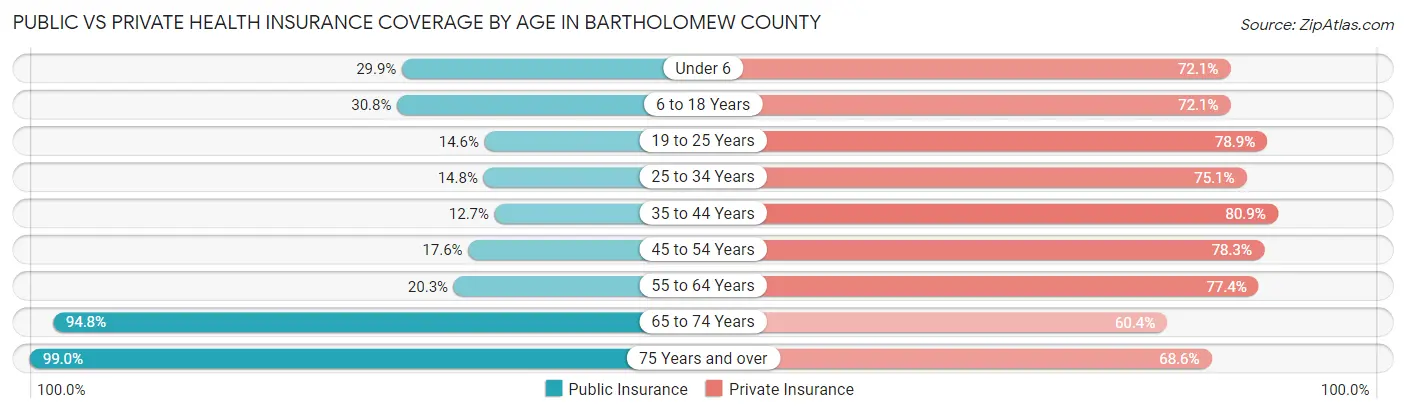
| Age Bracket | Public Insurance | Private Insurance |
| Under 6 | 1,874 (29.9%) | 4,516 (72.1%) |
| 6 to 18 Years | 4,392 (30.8%) | 10,276 (72.1%) |
| 19 to 25 Years | 954 (14.6%) | 5,166 (78.9%) |
| 25 to 34 Years | 1,556 (14.8%) | 7,904 (75.1%) |
| 35 to 44 Years | 1,355 (12.7%) | 8,626 (80.9%) |
| 45 to 54 Years | 1,769 (17.6%) | 7,861 (78.3%) |
| 55 to 64 Years | 2,044 (20.3%) | 7,787 (77.4%) |
| 65 to 74 Years | 7,350 (94.8%) | 4,684 (60.4%) |
| 75 Years and over | 5,193 (99.0%) | 3,597 (68.6%) |
| Total | 26,487 (32.6%) | 60,417 (74.3%) |
Disability Status by Sex by Age in Bartholomew County
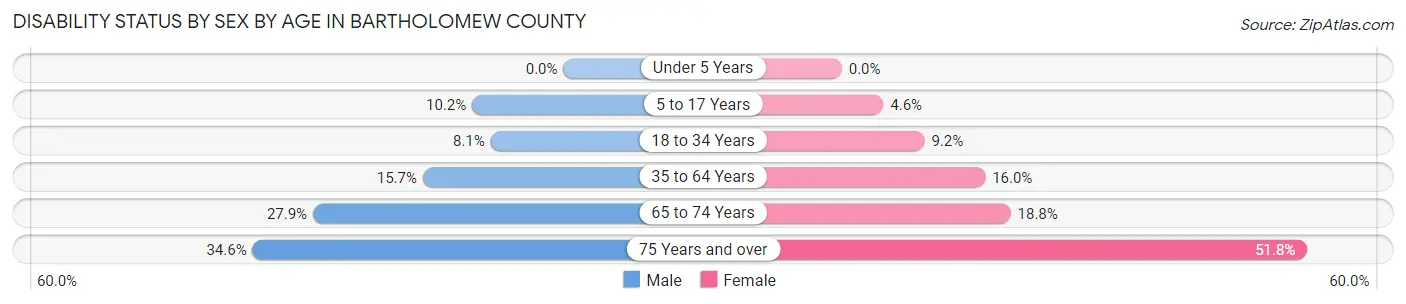
| Age Bracket | Male | Female |
| Under 5 Years | 0 (0.0%) | 0 (0.0%) |
| 5 to 17 Years | 740 (10.2%) | 331 (4.6%) |
| 18 to 34 Years | 776 (8.1%) | 771 (9.2%) |
| 35 to 64 Years | 2,448 (15.7%) | 2,416 (16.0%) |
| 65 to 74 Years | 1,039 (27.9%) | 758 (18.8%) |
| 75 Years and over | 764 (34.6%) | 1,574 (51.8%) |
Disability Class by Sex by Age in Bartholomew County
Disability Class: Hearing Difficulty
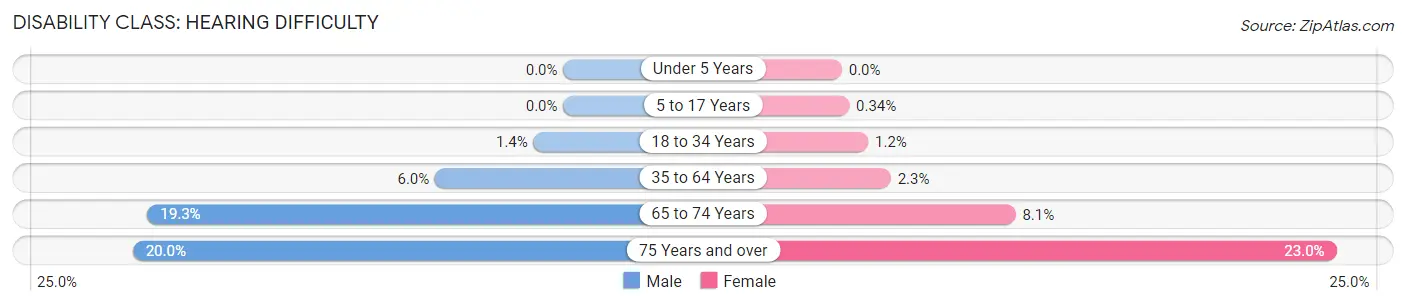
| Age Bracket | Male | Female |
| Under 5 Years | 0 (0.0%) | 0 (0.0%) |
| 5 to 17 Years | 0 (0.0%) | 24 (0.3%) |
| 18 to 34 Years | 132 (1.4%) | 102 (1.2%) |
| 35 to 64 Years | 930 (5.9%) | 344 (2.3%) |
| 65 to 74 Years | 719 (19.3%) | 325 (8.1%) |
| 75 Years and over | 441 (20.0%) | 697 (23.0%) |
Disability Class: Vision Difficulty
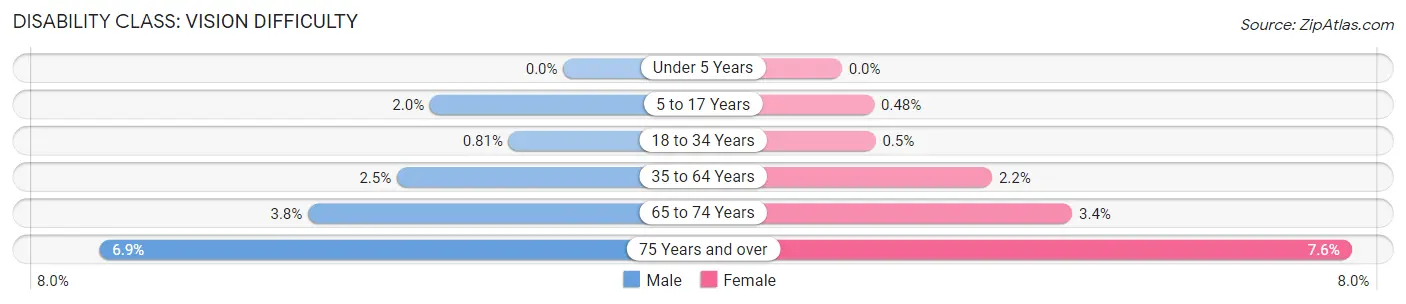
| Age Bracket | Male | Female |
| Under 5 Years | 0 (0.0%) | 0 (0.0%) |
| 5 to 17 Years | 144 (2.0%) | 34 (0.5%) |
| 18 to 34 Years | 78 (0.8%) | 42 (0.5%) |
| 35 to 64 Years | 386 (2.5%) | 337 (2.2%) |
| 65 to 74 Years | 141 (3.8%) | 138 (3.4%) |
| 75 Years and over | 152 (6.9%) | 230 (7.6%) |
Disability Class: Cognitive Difficulty
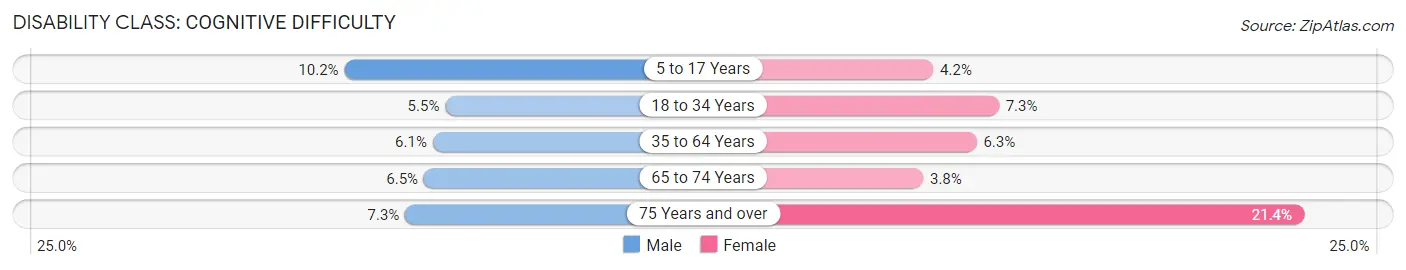
| Age Bracket | Male | Female |
| 5 to 17 Years | 739 (10.2%) | 303 (4.2%) |
| 18 to 34 Years | 525 (5.5%) | 609 (7.3%) |
| 35 to 64 Years | 948 (6.1%) | 946 (6.2%) |
| 65 to 74 Years | 241 (6.5%) | 152 (3.8%) |
| 75 Years and over | 162 (7.3%) | 651 (21.4%) |
Disability Class: Ambulatory Difficulty
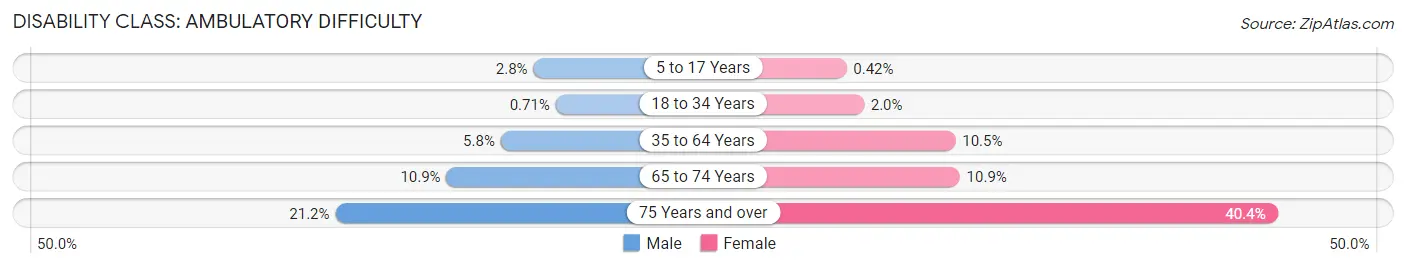
| Age Bracket | Male | Female |
| 5 to 17 Years | 202 (2.8%) | 30 (0.4%) |
| 18 to 34 Years | 68 (0.7%) | 171 (2.0%) |
| 35 to 64 Years | 909 (5.8%) | 1,593 (10.5%) |
| 65 to 74 Years | 404 (10.8%) | 441 (10.9%) |
| 75 Years and over | 467 (21.2%) | 1,228 (40.4%) |
Disability Class: Self-Care Difficulty
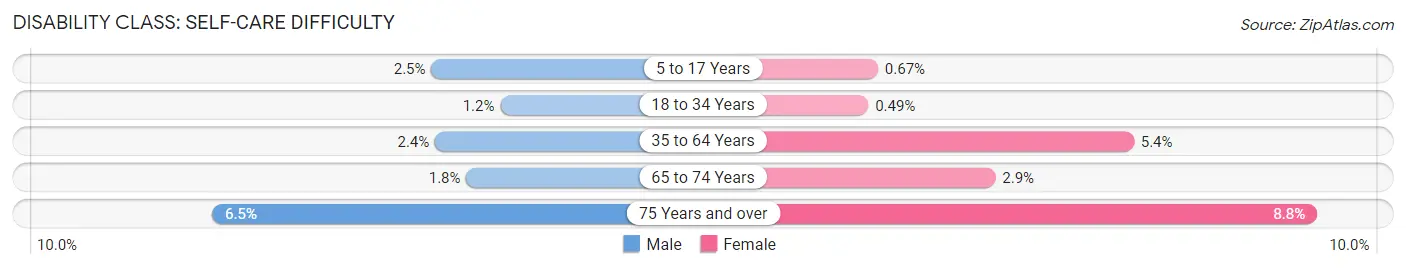
| Age Bracket | Male | Female |
| 5 to 17 Years | 178 (2.5%) | 48 (0.7%) |
| 18 to 34 Years | 112 (1.2%) | 41 (0.5%) |
| 35 to 64 Years | 372 (2.4%) | 820 (5.4%) |
| 65 to 74 Years | 67 (1.8%) | 115 (2.9%) |
| 75 Years and over | 144 (6.5%) | 268 (8.8%) |
Technology Access in Bartholomew County
Computing Device Access in Bartholomew County
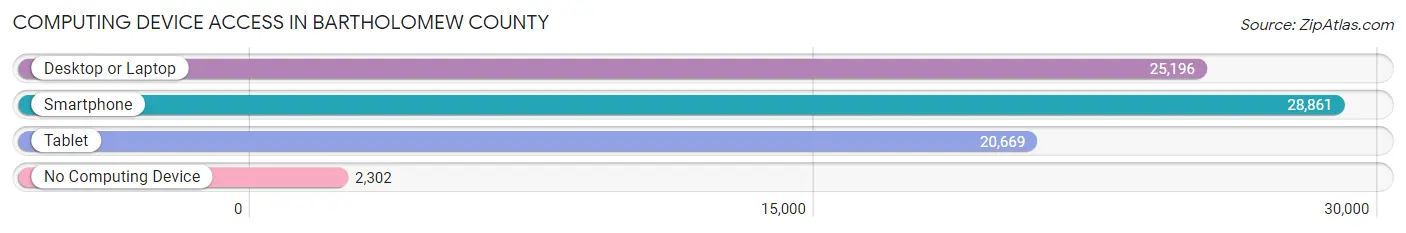
| Device Type | # Households | % Households |
| Desktop or Laptop | 25,196 | 76.9% |
| Smartphone | 28,861 | 88.1% |
| Tablet | 20,669 | 63.1% |
| No Computing Device | 2,302 | 7.0% |
| Total | 32,773 | 100.0% |
Internet Access in Bartholomew County
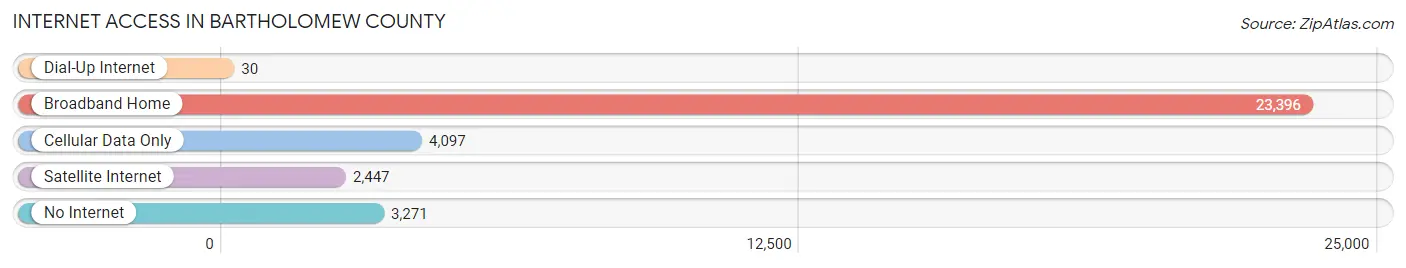
| Internet Type | # Households | % Households |
| Dial-Up Internet | 30 | 0.1% |
| Broadband Home | 23,396 | 71.4% |
| Cellular Data Only | 4,097 | 12.5% |
| Satellite Internet | 2,447 | 7.5% |
| No Internet | 3,271 | 10.0% |
| Total | 32,773 | 100.0% |
Bartholomew County Summary
Bartholomew County, Indiana is located in the south-central part of the state, and is part of the Columbus, Indiana metropolitan area. The county was established in 1821 and named after Lt. Col. Joseph Bartholomew, a Revolutionary War veteran. The county seat is Columbus, which is also the largest city in the county.
Geography
Bartholomew County is located in the south-central part of Indiana, and is bordered by Brown, Decatur, Jackson, Jennings, Johnson, and Shelby counties. The county has a total area of 409 square miles, of which 405 square miles is land and 4 square miles is water. The county is mostly flat, with some rolling hills in the northern part. The highest point in the county is located in the northern part, at an elevation of 890 feet. The county is drained by the Flatrock and Driftwood rivers.
Economy
Bartholomew County has a diverse economy, with a mix of manufacturing, agriculture, and services. The county is home to several large employers, including Cummins, Inc., Arvin Sango, and NTN Driveshaft. The county is also home to several smaller businesses, including a number of farms and small manufacturing companies.
Agriculture is an important part of the county's economy, with corn, soybeans, and wheat being the main crops. Livestock production is also important, with cattle, hogs, and poultry being the main animals raised.
Demographics
As of the 2010 census, there were 79,291 people, 30,845 households, and 21,845 families living in the county. The population density was 195.3 people per square mile. The racial makeup of the county was 94.2% White, 2.2% African American, 0.4% Native American, 0.9% Asian, 0.1% Pacific Islander, 0.9% from other races, and 1.3% from two or more races. Hispanic or Latino of any race were 2.3% of the population.
The median income for a household in the county was $45,945, and the median income for a family was $54,945. The per capita income for the county was $22,945. About 8.2% of families and 10.7% of the population were below the poverty line, including 14.2% of those under age 18 and 6.7% of those age 65 or over.
Conclusion
Bartholomew County, Indiana is a diverse county with a mix of manufacturing, agriculture, and services. The county has a population of 79,291, with a median household income of $45,945. The county is mostly flat, with some rolling hills in the northern part. Agriculture is an important part of the county's economy, with corn, soybeans, and wheat being the main crops. The county is also home to several large employers, including Cummins, Inc., Arvin Sango, and NTN Driveshaft.
Common Questions
What is the Total Population of Bartholomew County?
Total Population of Bartholomew County is 82,371.
What is the Total Male Population of Bartholomew County?
Total Male Population of Bartholomew County is 41,670.
What is the Total Female Population of Bartholomew County?
Total Female Population of Bartholomew County is 40,701.
What is the Ratio of Males per 100 Females in Bartholomew County?
There are 102.38 Males per 100 Females in Bartholomew County.
What is the Ratio of Females per 100 Males in Bartholomew County?
There are 97.67 Females per 100 Males in Bartholomew County.
What is the Median Population Age in Bartholomew County?
Median Population Age in Bartholomew County is 38.0 Years.
What is the Average Family Size in Bartholomew County
Average Family Size in Bartholomew County is 3.1 People.
What is the Average Household Size in Bartholomew County
Average Household Size in Bartholomew County is 2.5 People.
What is Per Capita Income in Bartholomew County?
Per Capita income in Bartholomew County is $38,950.
What is the Median Family Income in Bartholomew County?
Median Family Income in Bartholomew County is $90,657.
What is the Median Household income in Bartholomew County?
Median Household Income in Bartholomew County is $76,912.
What is Income or Wage Gap in Bartholomew County?
Income or Wage Gap in Bartholomew County is 39.6%.
Women in Bartholomew County earn 60.4 cents for every dollar earned by a man.
What is Family Income Deficit in Bartholomew County?
Family Income Deficit in Bartholomew County is $10,642.
Families that are below poverty line in Bartholomew County earn $10,642 less on average than the poverty threshold level.
What is Inequality or Gini Index in Bartholomew County?
Inequality or Gini Index in Bartholomew County is 0.44.
How Large is the Labor Force in Bartholomew County?
There are 42,475 People in the Labor Forcein in Bartholomew County.
What is the Percentage of People in the Labor Force in Bartholomew County?
65.2% of People are in the Labor Force in Bartholomew County.
What is the Unemployment Rate in Bartholomew County?
Unemployment Rate in Bartholomew County is 3.6%.