Allen County, IN
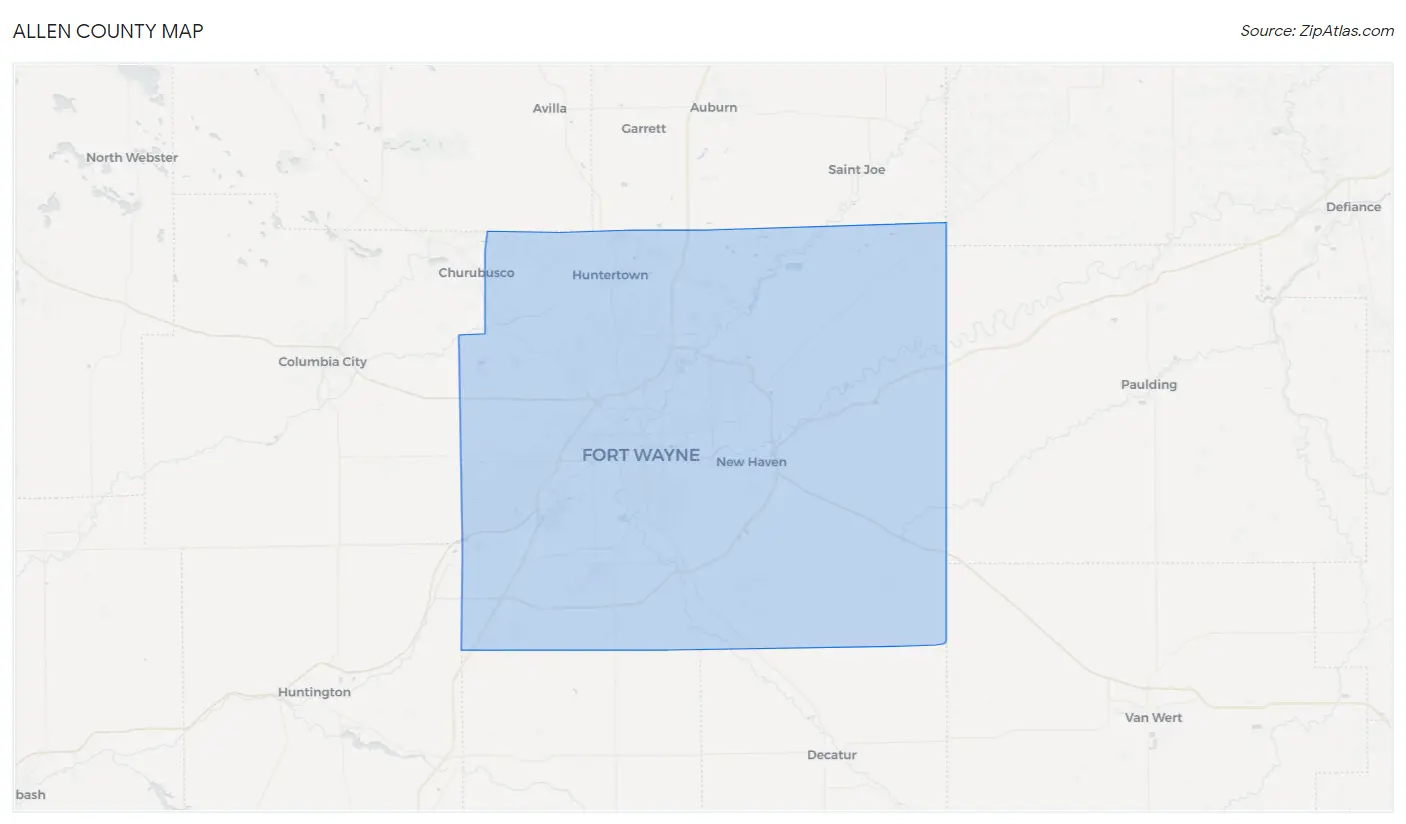
Allen County Map
Allen County Overview
385,456
TOTAL POPULATION
189,922
MALE POPULATION
195,534
FEMALE POPULATION
97.13
MALES / 100 FEMALES
102.95
FEMALES / 100 MALES
36.1
MEDIAN AGE
3.1
AVG FAMILY SIZE
2.5
AVG HOUSEHOLD SIZE
$35,389
PER CAPITA INCOME
$83,250
AVG FAMILY INCOME
$66,222
AVG HOUSEHOLD INCOME
32.9%
WAGE / INCOME GAP [ % ]
67.1¢/ $1
WAGE / INCOME GAP [ $ ]
$10,748
FAMILY INCOME DEFICIT
0.45
INEQUALITY / GINI INDEX
199,694
LABOR FORCE [ PEOPLE ]
66.8%
PERCENT IN LABOR FORCE
4.8%
UNEMPLOYMENT RATE
Allen County Area Codes
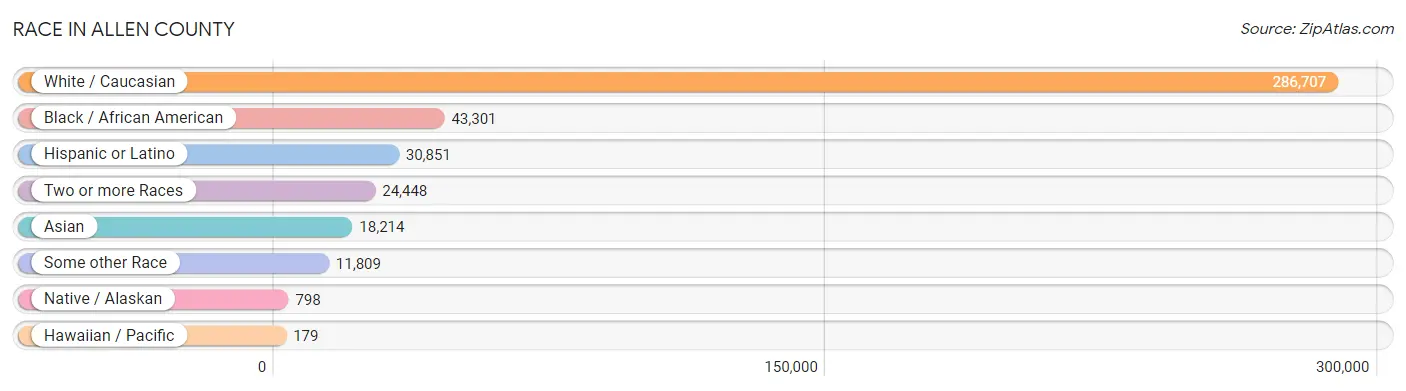
Race in Allen County
The most populous races in Allen County are White / Caucasian (286,707 | 74.4%), Black / African American (43,301 | 11.2%), and Hispanic or Latino (30,851 | 8.0%).
| Race | # Population | % Population |
| Asian | 18,214 | 4.7% |
| Black / African American | 43,301 | 11.2% |
| Hawaiian / Pacific | 179 | 0.1% |
| Hispanic or Latino | 30,851 | 8.0% |
| Native / Alaskan | 798 | 0.2% |
| White / Caucasian | 286,707 | 74.4% |
| Two or more Races | 24,448 | 6.3% |
| Some other Race | 11,809 | 3.1% |
| Total | 385,456 | 100.0% |
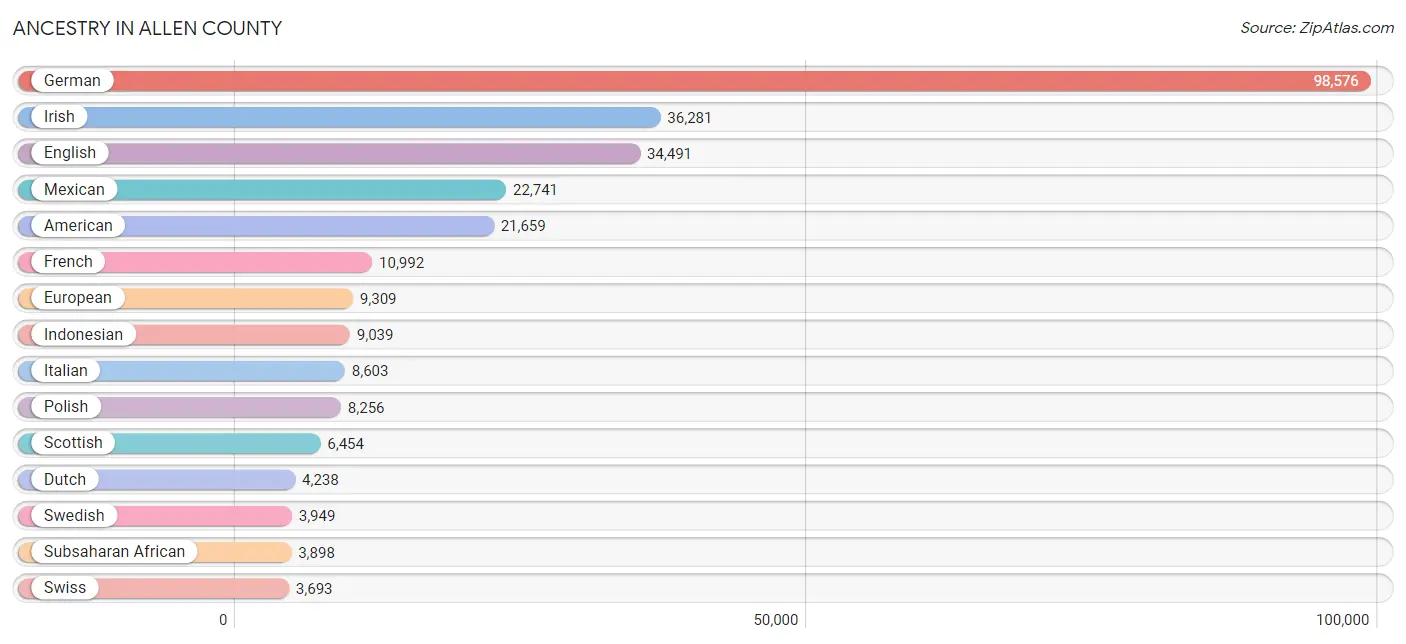
Ancestry in Allen County
The most populous ancestries reported in Allen County are German (98,576 | 25.6%), Irish (36,281 | 9.4%), English (34,491 | 8.9%), Mexican (22,741 | 5.9%), and American (21,659 | 5.6%), together accounting for 55.4% of all Allen County residents.
| Ancestry | # Population | % Population |
| Afghan | 15 | 0.0% |
| African | 1,639 | 0.4% |
| Alaska Native | 6 | 0.0% |
| Albanian | 56 | 0.0% |
| Alsatian | 8 | 0.0% |
| American | 21,659 | 5.6% |
| Apache | 94 | 0.0% |
| Arab | 1,376 | 0.4% |
| Argentinean | 89 | 0.0% |
| Armenian | 23 | 0.0% |
| Assyrian / Chaldean / Syriac | 15 | 0.0% |
| Australian | 91 | 0.0% |
| Austrian | 435 | 0.1% |
| Bahamian | 13 | 0.0% |
| Bangladeshi | 17 | 0.0% |
| Barbadian | 9 | 0.0% |
| Basque | 17 | 0.0% |
| Belgian | 477 | 0.1% |
| Belizean | 27 | 0.0% |
| Bhutanese | 407 | 0.1% |
| Blackfeet | 177 | 0.1% |
| Bolivian | 29 | 0.0% |
| Brazilian | 66 | 0.0% |
| British | 1,765 | 0.5% |
| British West Indian | 32 | 0.0% |
| Bulgarian | 147 | 0.0% |
| Burmese | 1,526 | 0.4% |
| Cajun | 12 | 0.0% |
| Canadian | 405 | 0.1% |
| Carpatho Rusyn | 66 | 0.0% |
| Celtic | 50 | 0.0% |
| Central American | 3,426 | 0.9% |
| Central American Indian | 167 | 0.0% |
| Cherokee | 966 | 0.3% |
| Cheyenne | 4 | 0.0% |
| Chickasaw | 26 | 0.0% |
| Chippewa | 68 | 0.0% |
| Choctaw | 133 | 0.0% |
| Colombian | 402 | 0.1% |
| Comanche | 40 | 0.0% |
| Costa Rican | 13 | 0.0% |
| Croatian | 547 | 0.1% |
| Cuban | 182 | 0.1% |
| Czech | 694 | 0.2% |
| Czechoslovakian | 93 | 0.0% |
| Danish | 574 | 0.2% |
| Dominican | 67 | 0.0% |
| Dutch | 4,238 | 1.1% |
| Dutch West Indian | 17 | 0.0% |
| Eastern European | 675 | 0.2% |
| Ecuadorian | 93 | 0.0% |
| English | 34,491 | 8.9% |
| Ethiopian | 477 | 0.1% |
| European | 9,309 | 2.4% |
| Filipino | 104 | 0.0% |
| Finnish | 606 | 0.2% |
| French | 10,992 | 2.9% |
| French American Indian | 23 | 0.0% |
| French Canadian | 754 | 0.2% |
| German | 98,576 | 25.6% |
| German Russian | 214 | 0.1% |
| Ghanaian | 202 | 0.1% |
| Greek | 1,247 | 0.3% |
| Guamanian / Chamorro | 56 | 0.0% |
| Guatemalan | 1,973 | 0.5% |
| Haitian | 109 | 0.0% |
| Honduran | 260 | 0.1% |
| Hungarian | 1,797 | 0.5% |
| Icelander | 9 | 0.0% |
| Indian (Asian) | 1,475 | 0.4% |
| Indonesian | 9,039 | 2.4% |
| Iranian | 308 | 0.1% |
| Iraqi | 57 | 0.0% |
| Irish | 36,281 | 9.4% |
| Iroquois | 33 | 0.0% |
| Israeli | 45 | 0.0% |
| Italian | 8,603 | 2.2% |
| Jamaican | 185 | 0.1% |
| Japanese | 49 | 0.0% |
| Jordanian | 40 | 0.0% |
| Kenyan | 386 | 0.1% |
| Korean | 2,139 | 0.5% |
| Laotian | 17 | 0.0% |
| Latvian | 66 | 0.0% |
| Lebanese | 321 | 0.1% |
| Liberian | 40 | 0.0% |
| Lithuanian | 236 | 0.1% |
| Lumbee | 10 | 0.0% |
| Luxembourger | 24 | 0.0% |
| Macedonian | 699 | 0.2% |
| Malaysian | 328 | 0.1% |
| Maltese | 7 | 0.0% |
| Mexican | 22,741 | 5.9% |
| Mexican American Indian | 253 | 0.1% |
| Mongolian | 303 | 0.1% |
| Moroccan | 162 | 0.0% |
| Native Hawaiian | 138 | 0.0% |
| Navajo | 20 | 0.0% |
| Nicaraguan | 73 | 0.0% |
| Nigerian | 323 | 0.1% |
| Northern European | 682 | 0.2% |
| Norwegian | 2,130 | 0.5% |
| Okinawan | 5 | 0.0% |
| Osage | 2 | 0.0% |
| Ottawa | 43 | 0.0% |
| Pakistani | 366 | 0.1% |
| Palestinian | 100 | 0.0% |
| Panamanian | 333 | 0.1% |
| Pennsylvania German | 524 | 0.1% |
| Peruvian | 104 | 0.0% |
| Pima | 10 | 0.0% |
| Polish | 8,256 | 2.1% |
| Portuguese | 286 | 0.1% |
| Puerto Rican | 1,970 | 0.5% |
| Puget Sound Salish | 9 | 0.0% |
| Romanian | 504 | 0.1% |
| Russian | 712 | 0.2% |
| Salvadoran | 774 | 0.2% |
| Samoan | 22 | 0.0% |
| Scandinavian | 865 | 0.2% |
| Scotch-Irish | 2,286 | 0.6% |
| Scottish | 6,454 | 1.7% |
| Serbian | 260 | 0.1% |
| Sioux | 93 | 0.0% |
| Slavic | 41 | 0.0% |
| Slovak | 468 | 0.1% |
| Slovene | 168 | 0.0% |
| Somali | 134 | 0.0% |
| South African | 57 | 0.0% |
| South American | 791 | 0.2% |
| South American Indian | 28 | 0.0% |
| Spaniard | 174 | 0.1% |
| Spanish | 238 | 0.1% |
| Sri Lankan | 1,603 | 0.4% |
| Subsaharan African | 3,898 | 1.0% |
| Sudanese | 412 | 0.1% |
| Swedish | 3,949 | 1.0% |
| Swiss | 3,693 | 1.0% |
| Syrian | 351 | 0.1% |
| Thai | 2,264 | 0.6% |
| Trinidadian and Tobagonian | 54 | 0.0% |
| Turkish | 15 | 0.0% |
| Ukrainian | 560 | 0.2% |
| Venezuelan | 74 | 0.0% |
| Vietnamese | 113 | 0.0% |
| Welsh | 2,535 | 0.7% |
| West Indian | 120 | 0.0% |
| Yaqui | 6 | 0.0% |
| Yugoslavian | 602 | 0.2% |
| Zimbabwean | 10 | 0.0% | View All 150 Rows |
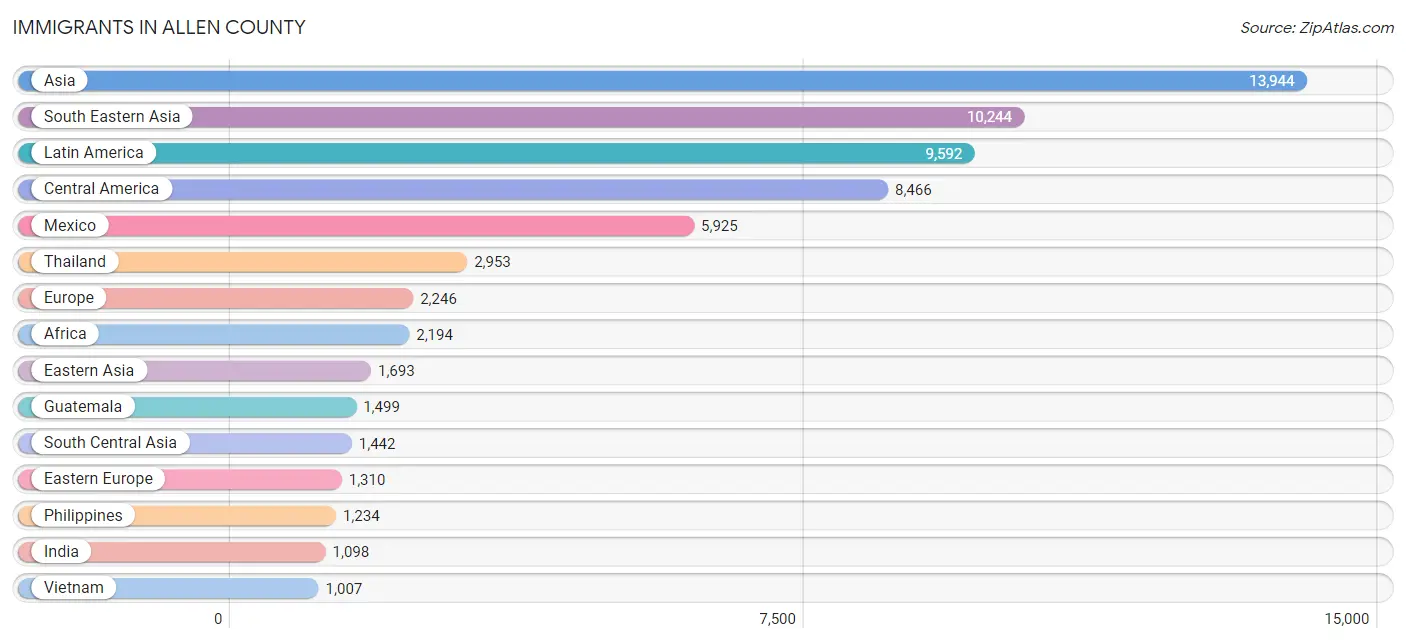
Immigrants in Allen County
The most numerous immigrant groups reported in Allen County came from Asia (13,944 | 3.6%), South Eastern Asia (10,244 | 2.7%), Latin America (9,592 | 2.5%), Central America (8,466 | 2.2%), and Mexico (5,925 | 1.5%), together accounting for 12.5% of all Allen County residents.
| Immigration Origin | # Population | % Population |
| Africa | 2,194 | 0.6% |
| Albania | 43 | 0.0% |
| Argentina | 62 | 0.0% |
| Asia | 13,944 | 3.6% |
| Australia | 94 | 0.0% |
| Bahamas | 34 | 0.0% |
| Bangladesh | 35 | 0.0% |
| Barbados | 119 | 0.0% |
| Belarus | 20 | 0.0% |
| Belgium | 11 | 0.0% |
| Bolivia | 37 | 0.0% |
| Bosnia and Herzegovina | 400 | 0.1% |
| Brazil | 110 | 0.0% |
| Bulgaria | 58 | 0.0% |
| Cameroon | 5 | 0.0% |
| Canada | 782 | 0.2% |
| Caribbean | 483 | 0.1% |
| Central America | 8,466 | 2.2% |
| China | 843 | 0.2% |
| Colombia | 265 | 0.1% |
| Congo | 140 | 0.0% |
| Croatia | 21 | 0.0% |
| Cuba | 53 | 0.0% |
| Czechoslovakia | 26 | 0.0% |
| Denmark | 6 | 0.0% |
| Dominican Republic | 18 | 0.0% |
| Eastern Africa | 962 | 0.3% |
| Eastern Asia | 1,693 | 0.4% |
| Eastern Europe | 1,310 | 0.3% |
| Ecuador | 96 | 0.0% |
| El Salvador | 769 | 0.2% |
| England | 93 | 0.0% |
| Ethiopia | 246 | 0.1% |
| Europe | 2,246 | 0.6% |
| France | 44 | 0.0% |
| Germany | 343 | 0.1% |
| Ghana | 199 | 0.1% |
| Greece | 106 | 0.0% |
| Grenada | 32 | 0.0% |
| Guatemala | 1,499 | 0.4% |
| Guyana | 15 | 0.0% |
| Haiti | 115 | 0.0% |
| Honduras | 183 | 0.1% |
| Hong Kong | 16 | 0.0% |
| Hungary | 81 | 0.0% |
| India | 1,098 | 0.3% |
| Indonesia | 49 | 0.0% |
| Iran | 7 | 0.0% |
| Iraq | 42 | 0.0% |
| Ireland | 58 | 0.0% |
| Israel | 11 | 0.0% |
| Italy | 96 | 0.0% |
| Jamaica | 41 | 0.0% |
| Japan | 154 | 0.0% |
| Jordan | 15 | 0.0% |
| Kazakhstan | 2 | 0.0% |
| Kenya | 359 | 0.1% |
| Korea | 696 | 0.2% |
| Kuwait | 29 | 0.0% |
| Laos | 132 | 0.0% |
| Latin America | 9,592 | 2.5% |
| Latvia | 37 | 0.0% |
| Lebanon | 49 | 0.0% |
| Liberia | 59 | 0.0% |
| Malaysia | 415 | 0.1% |
| Mexico | 5,925 | 1.5% |
| Middle Africa | 299 | 0.1% |
| Morocco | 96 | 0.0% |
| Nepal | 136 | 0.0% |
| Nicaragua | 61 | 0.0% |
| Nigeria | 207 | 0.1% |
| Northern Africa | 316 | 0.1% |
| Northern Europe | 278 | 0.1% |
| Norway | 10 | 0.0% |
| Oceania | 94 | 0.0% |
| Pakistan | 162 | 0.0% |
| Panama | 29 | 0.0% |
| Peru | 30 | 0.0% |
| Philippines | 1,234 | 0.3% |
| Poland | 42 | 0.0% |
| Romania | 61 | 0.0% |
| Russia | 183 | 0.1% |
| Saudi Arabia | 106 | 0.0% |
| Scotland | 70 | 0.0% |
| Serbia | 114 | 0.0% |
| Somalia | 134 | 0.0% |
| South Africa | 137 | 0.0% |
| South America | 643 | 0.2% |
| South Central Asia | 1,442 | 0.4% |
| South Eastern Asia | 10,244 | 2.7% |
| Southern Europe | 244 | 0.1% |
| Spain | 42 | 0.0% |
| Sri Lanka | 2 | 0.0% |
| Sudan | 195 | 0.1% |
| Switzerland | 16 | 0.0% |
| Syria | 107 | 0.0% |
| Taiwan | 207 | 0.1% |
| Thailand | 2,953 | 0.8% |
| Trinidad and Tobago | 71 | 0.0% |
| Uganda | 13 | 0.0% |
| Ukraine | 170 | 0.0% |
| Venezuela | 28 | 0.0% |
| Vietnam | 1,007 | 0.3% |
| Western Africa | 480 | 0.1% |
| Western Asia | 458 | 0.1% |
| Western Europe | 414 | 0.1% |
| Yemen | 80 | 0.0% |
| Zaire | 82 | 0.0% |
| Zimbabwe | 10 | 0.0% | View All 109 Rows |
Sex and Age in Allen County
Sex and Age in Allen County
The most populous age groups in Allen County are 10 to 14 Years (14,861 | 7.8%) for men and 25 to 29 Years (13,951 | 7.1%) for women.
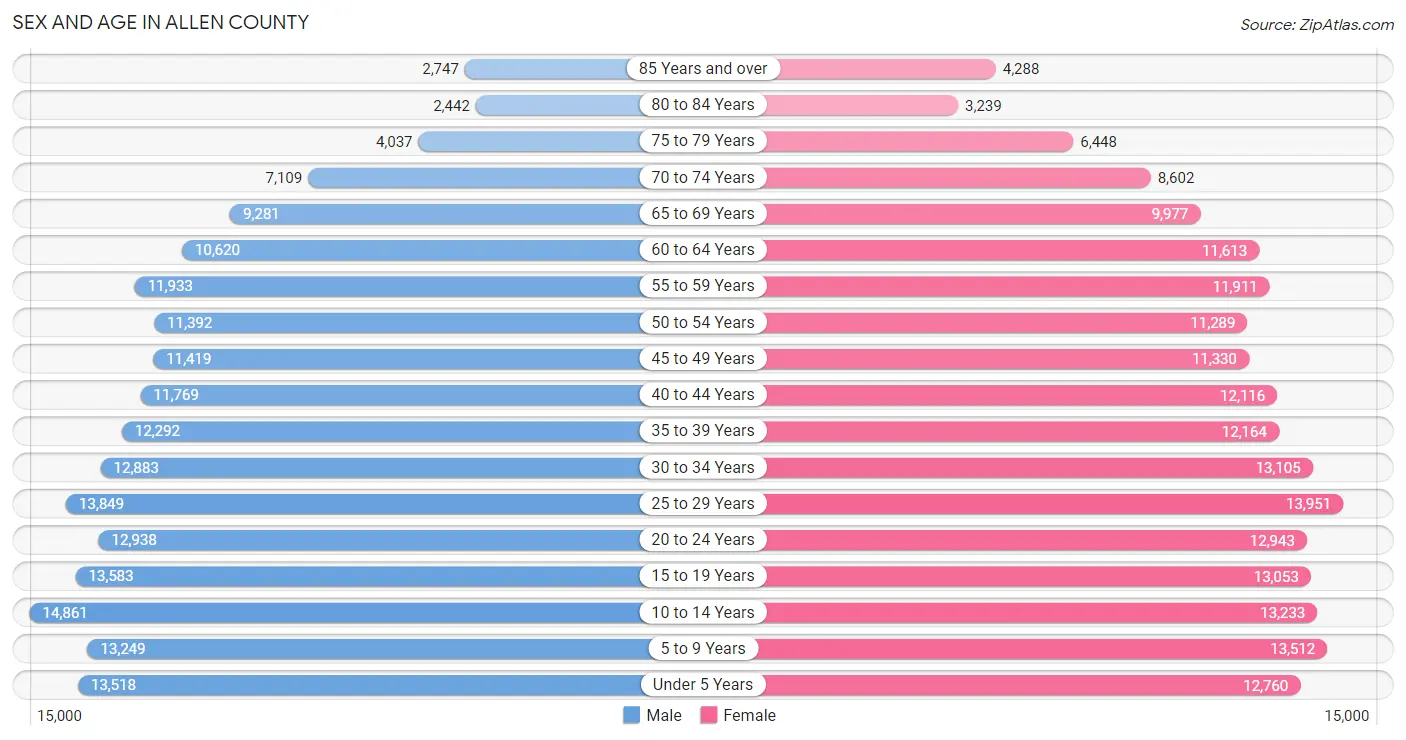
| Age Bracket | Male | Female |
| Under 5 Years | 13,518 (7.1%) | 12,760 (6.5%) |
| 5 to 9 Years | 13,249 (7.0%) | 13,512 (6.9%) |
| 10 to 14 Years | 14,861 (7.8%) | 13,233 (6.8%) |
| 15 to 19 Years | 13,583 (7.1%) | 13,053 (6.7%) |
| 20 to 24 Years | 12,938 (6.8%) | 12,943 (6.6%) |
| 25 to 29 Years | 13,849 (7.3%) | 13,951 (7.1%) |
| 30 to 34 Years | 12,883 (6.8%) | 13,105 (6.7%) |
| 35 to 39 Years | 12,292 (6.5%) | 12,164 (6.2%) |
| 40 to 44 Years | 11,769 (6.2%) | 12,116 (6.2%) |
| 45 to 49 Years | 11,419 (6.0%) | 11,330 (5.8%) |
| 50 to 54 Years | 11,392 (6.0%) | 11,289 (5.8%) |
| 55 to 59 Years | 11,933 (6.3%) | 11,911 (6.1%) |
| 60 to 64 Years | 10,620 (5.6%) | 11,613 (5.9%) |
| 65 to 69 Years | 9,281 (4.9%) | 9,977 (5.1%) |
| 70 to 74 Years | 7,109 (3.7%) | 8,602 (4.4%) |
| 75 to 79 Years | 4,037 (2.1%) | 6,448 (3.3%) |
| 80 to 84 Years | 2,442 (1.3%) | 3,239 (1.7%) |
| 85 Years and over | 2,747 (1.5%) | 4,288 (2.2%) |
| Total | 189,922 (100.0%) | 195,534 (100.0%) |
Families and Households in Allen County
Median Family Size in Allen County
The median family size in Allen County is 3.15 persons per family, with married-couple families (70,795 | 73.6%) accounting for the largest median family size of 3.19 persons per family. On the other hand, single male/father families (7,356 | 7.6%) represent the smallest median family size with 2.70 persons per family.
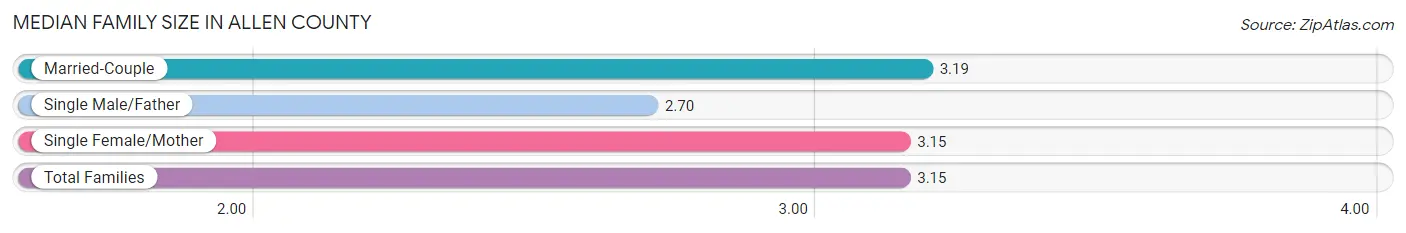
| Family Type | # Families | Family Size |
| Married-Couple | 70,795 (73.6%) | 3.19 |
| Single Male/Father | 7,356 (7.6%) | 2.70 |
| Single Female/Mother | 18,029 (18.8%) | 3.15 |
| Total Families | 96,180 (100.0%) | 3.15 |
Median Household Size in Allen County
The median household size in Allen County is 2.50 persons per household, with single female/mother households (18,029 | 11.9%) accounting for the largest median household size of 3.37 persons per household. non-family households (55,697 | 36.7%) represent the smallest median household size with 1.23 persons per household.
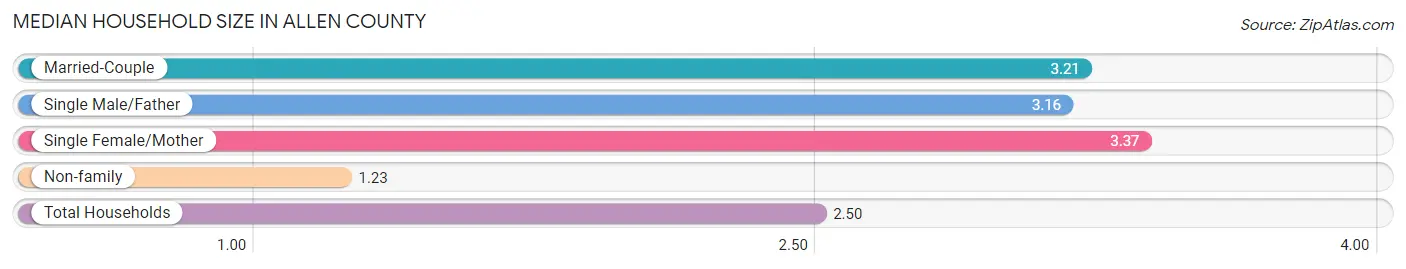
| Household Type | # Households | Household Size |
| Married-Couple | 70,795 (46.6%) | 3.21 |
| Single Male/Father | 7,356 (4.8%) | 3.16 |
| Single Female/Mother | 18,029 (11.9%) | 3.37 |
| Non-family | 55,697 (36.7%) | 1.23 |
| Total Households | 151,877 (100.0%) | 2.50 |
Household Size by Marriage Status in Allen County
Out of a total of 151,877 households in Allen County, 96,180 (63.3%) are family households, while 55,697 (36.7%) are nonfamily households. The most numerous type of family households are 2-person households, comprising 42,058, and the most common type of nonfamily households are 1-person households, comprising 45,167.
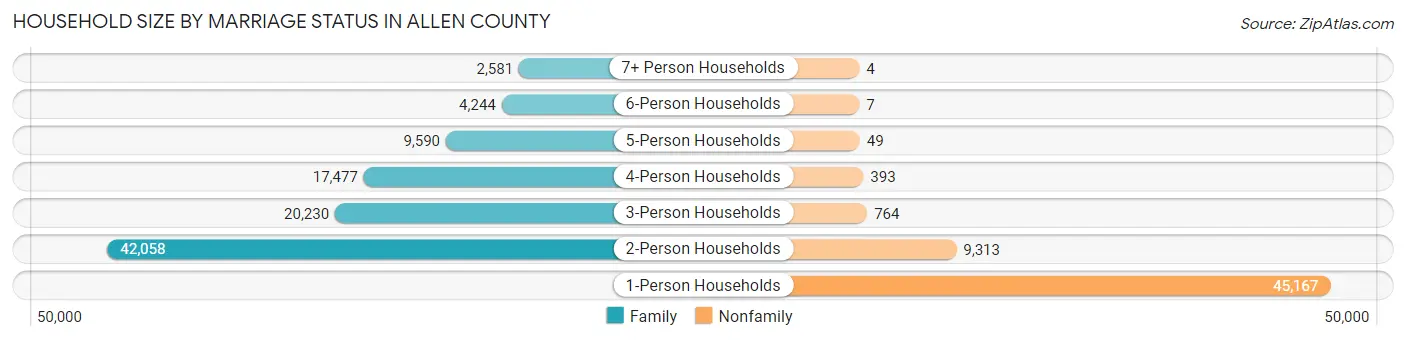
| Household Size | Family Households | Nonfamily Households |
| 1-Person Households | - | 45,167 (29.7%) |
| 2-Person Households | 42,058 (27.7%) | 9,313 (6.1%) |
| 3-Person Households | 20,230 (13.3%) | 764 (0.5%) |
| 4-Person Households | 17,477 (11.5%) | 393 (0.3%) |
| 5-Person Households | 9,590 (6.3%) | 49 (0.0%) |
| 6-Person Households | 4,244 (2.8%) | 7 (0.0%) |
| 7+ Person Households | 2,581 (1.7%) | 4 (0.0%) |
| Total | 96,180 (63.3%) | 55,697 (36.7%) |
Female Fertility in Allen County
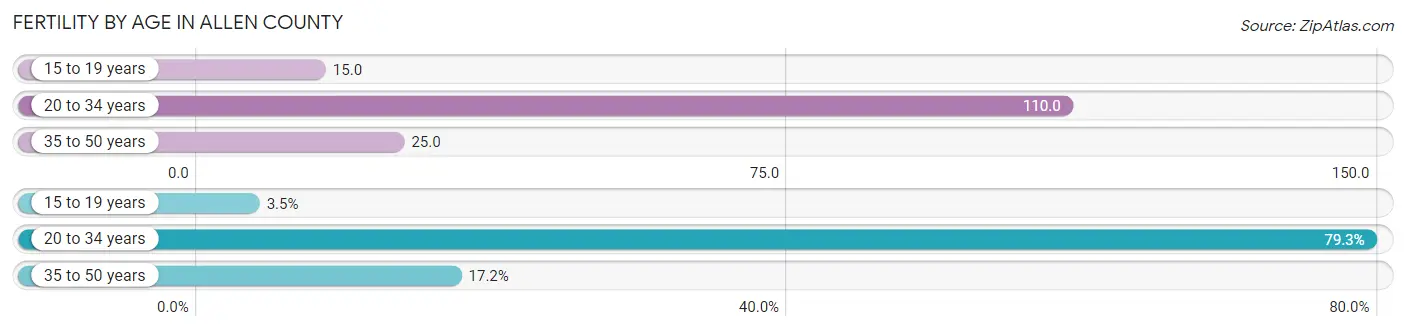
Fertility by Age in Allen County
Average fertility rate in Allen County is 61.0 births per 1,000 women. Women in the age bracket of 20 to 34 years have the highest fertility rate with 110.0 births per 1,000 women. Women in the age bracket of 20 to 34 years acount for 79.3% of all women with births.
| Age Bracket | Women with Births | Births / 1,000 Women |
| 15 to 19 years | 195 (3.5%) | 15.0 |
| 20 to 34 years | 4,410 (79.3%) | 110.0 |
| 35 to 50 years | 957 (17.2%) | 25.0 |
| Total | 5,562 (100.0%) | 61.0 |
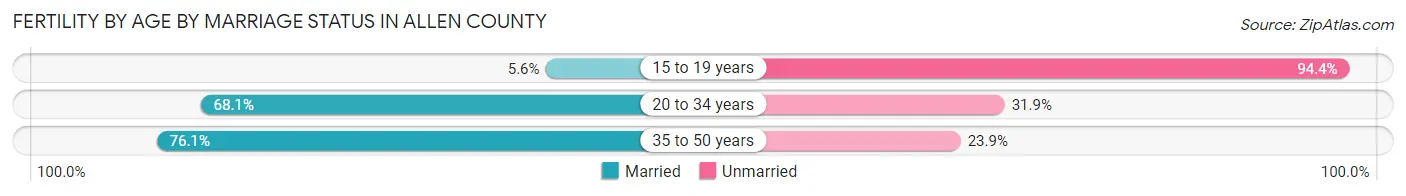
Fertility by Age by Marriage Status in Allen County
67.3% of women with births (5,562) in Allen County are married. The highest percentage of unmarried women with births falls into 15 to 19 years age bracket with 94.4% of them unmarried at the time of birth, while the lowest percentage of unmarried women with births belong to 35 to 50 years age bracket with 23.9% of them unmarried.
| Age Bracket | Married | Unmarried |
| 15 to 19 years | 11 (5.6%) | 184 (94.4%) |
| 20 to 34 years | 3,003 (68.1%) | 1,407 (31.9%) |
| 35 to 50 years | 728 (76.1%) | 229 (23.9%) |
| Total | 3,743 (67.3%) | 1,819 (32.7%) |
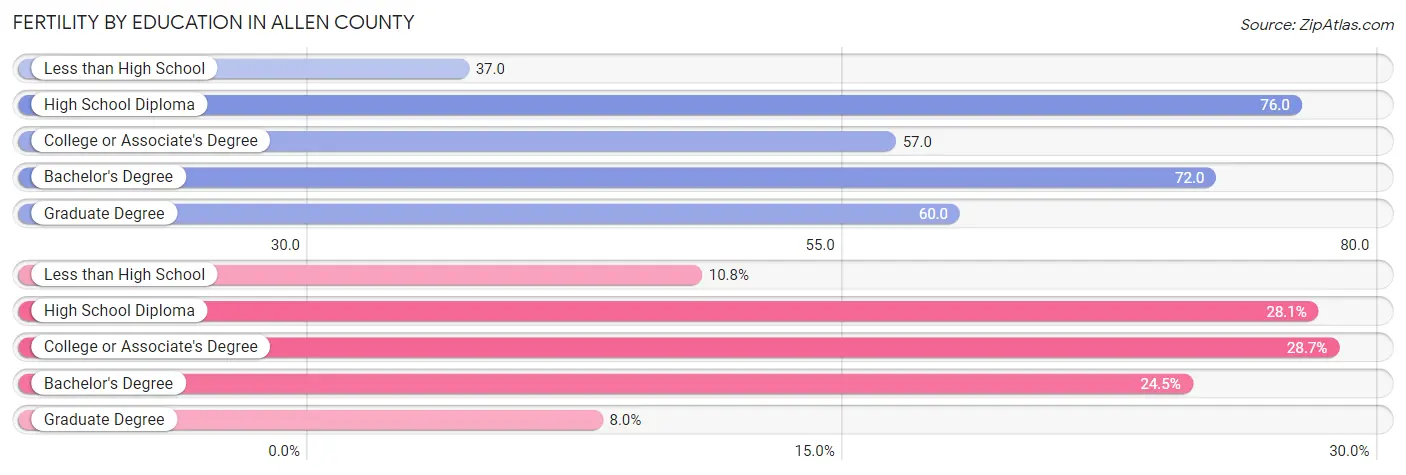
Fertility by Education in Allen County
Average fertility rate in Allen County is 61.0 births per 1,000 women. Women with the education attainment of high school diploma have the highest fertility rate of 76.0 births per 1,000 women, while women with the education attainment of less than high school have the lowest fertility at 37.0 births per 1,000 women. Women with the education attainment of college or associate's degree represent 28.7% of all women with births.
| Educational Attainment | Women with Births | Births / 1,000 Women |
| Less than High School | 598 (10.7%) | 37.0 |
| High School Diploma | 1,562 (28.1%) | 76.0 |
| College or Associate's Degree | 1,594 (28.7%) | 57.0 |
| Bachelor's Degree | 1,365 (24.5%) | 72.0 |
| Graduate Degree | 443 (8.0%) | 60.0 |
| Total | 5,562 (100.0%) | 61.0 |
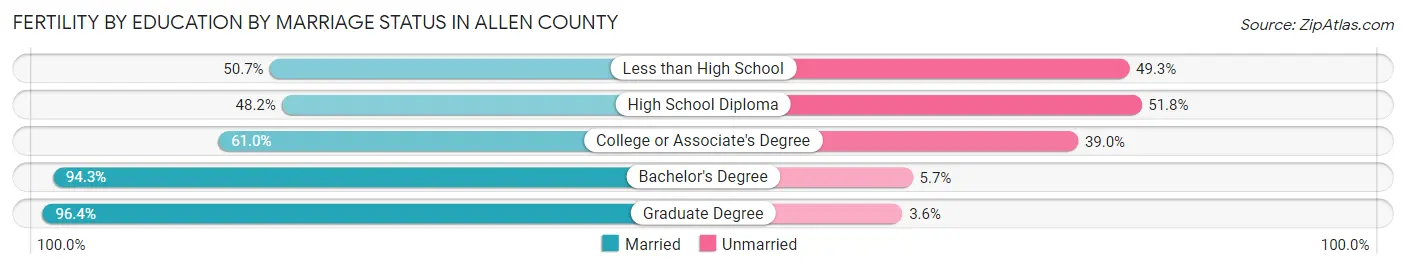
Fertility by Education by Marriage Status in Allen County
32.7% of women with births in Allen County are unmarried. Women with the educational attainment of graduate degree are most likely to be married with 96.4% of them married at childbirth, while women with the educational attainment of high school diploma are least likely to be married with 51.8% of them unmarried at childbirth.
| Educational Attainment | Married | Unmarried |
| Less than High School | 303 (50.7%) | 295 (49.3%) |
| High School Diploma | 753 (48.2%) | 809 (51.8%) |
| College or Associate's Degree | 972 (61.0%) | 622 (39.0%) |
| Bachelor's Degree | 1,287 (94.3%) | 78 (5.7%) |
| Graduate Degree | 427 (96.4%) | 16 (3.6%) |
| Total | 3,743 (67.3%) | 1,819 (32.7%) |
Income in Allen County
Income Overview in Allen County
Per Capita Income in Allen County is $35,389, while median incomes of families and households are $83,250 and $66,222 respectively.
| Characteristic | Number | Measure |
| Per Capita Income | 385,456 | $35,389 |
| Median Family Income | 96,180 | $83,250 |
| Mean Family Income | 96,180 | $104,673 |
| Median Household Income | 151,877 | $66,222 |
| Mean Household Income | 151,877 | $88,623 |
| Income Deficit | 96,180 | $10,748 |
| Wage / Income Gap (%) | 385,456 | 32.92% |
| Wage / Income Gap ($) | 385,456 | 67.08¢ per $1 |
| Gini / Inequality Index | 385,456 | 0.45 |
Earnings by Sex in Allen County
Average Earnings in Allen County are $39,174, $47,496 for men and $31,858 for women, a difference of 32.9%.
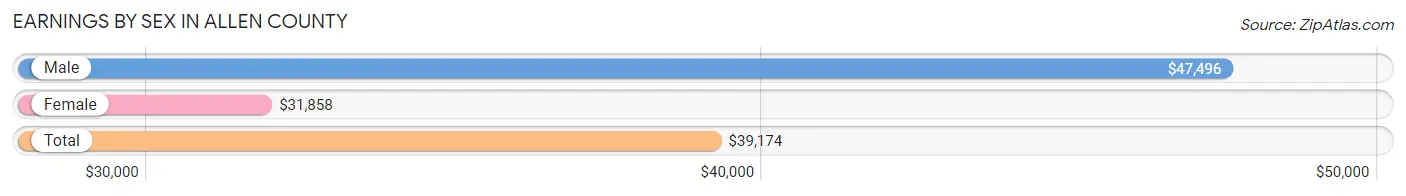
| Sex | Number | Average Earnings |
| Male | 109,803 (52.6%) | $47,496 |
| Female | 98,937 (47.4%) | $31,858 |
| Total | 208,740 (100.0%) | $39,174 |
Earnings by Sex by Income Bracket in Allen County
The most common earnings brackets in Allen County are $100,000+ for men (16,126 | 14.7%) and $30,000 to $34,999 for women (7,553 | 7.6%).
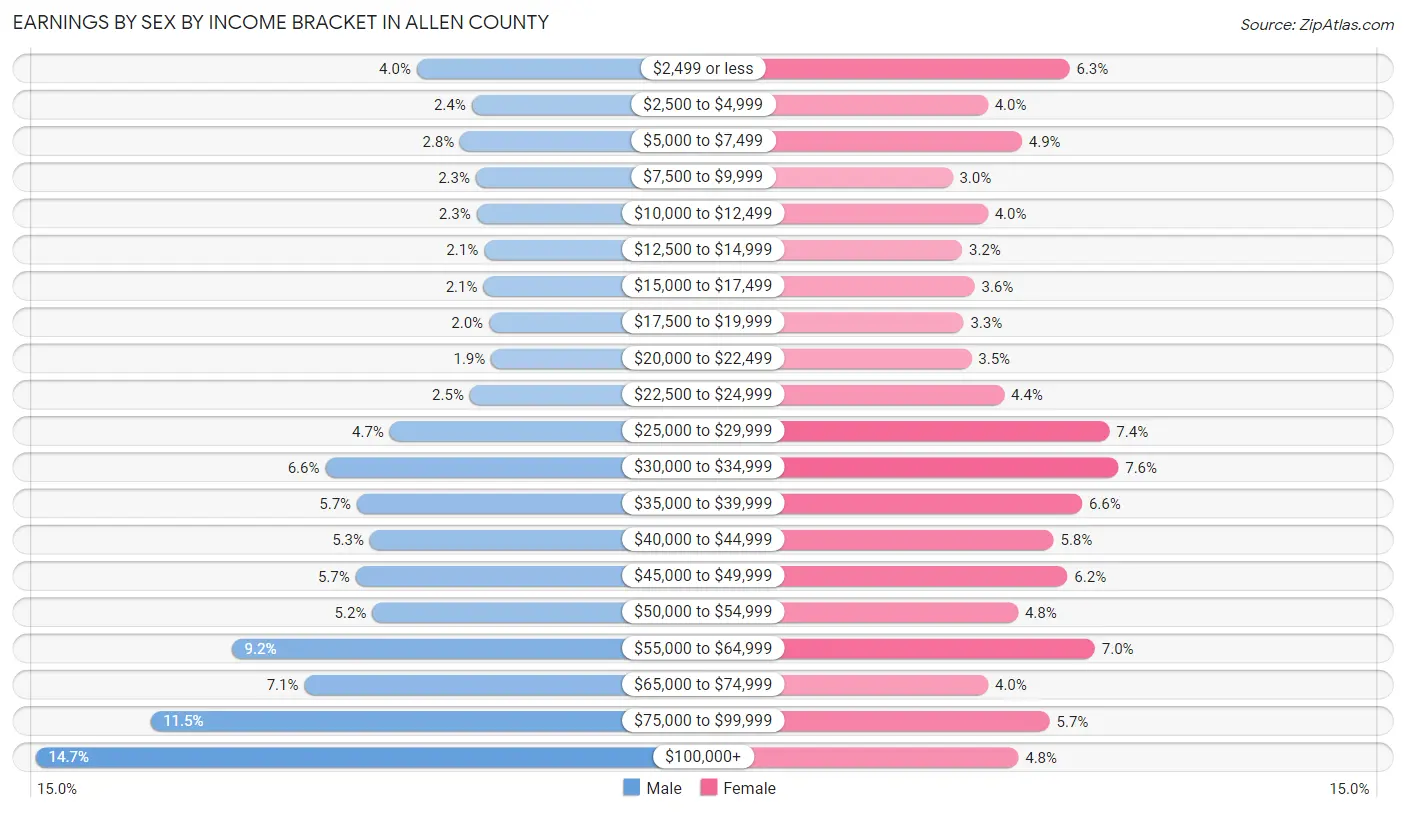
| Income | Male | Female |
| $2,499 or less | 4,369 (4.0%) | 6,193 (6.3%) |
| $2,500 to $4,999 | 2,683 (2.4%) | 3,920 (4.0%) |
| $5,000 to $7,499 | 3,032 (2.8%) | 4,863 (4.9%) |
| $7,500 to $9,999 | 2,552 (2.3%) | 2,936 (3.0%) |
| $10,000 to $12,499 | 2,520 (2.3%) | 3,914 (4.0%) |
| $12,500 to $14,999 | 2,298 (2.1%) | 3,203 (3.2%) |
| $15,000 to $17,499 | 2,318 (2.1%) | 3,554 (3.6%) |
| $17,500 to $19,999 | 2,138 (1.9%) | 3,247 (3.3%) |
| $20,000 to $22,499 | 2,072 (1.9%) | 3,465 (3.5%) |
| $22,500 to $24,999 | 2,738 (2.5%) | 4,373 (4.4%) |
| $25,000 to $29,999 | 5,205 (4.7%) | 7,303 (7.4%) |
| $30,000 to $34,999 | 7,196 (6.6%) | 7,553 (7.6%) |
| $35,000 to $39,999 | 6,211 (5.7%) | 6,535 (6.6%) |
| $40,000 to $44,999 | 5,823 (5.3%) | 5,751 (5.8%) |
| $45,000 to $49,999 | 6,254 (5.7%) | 6,137 (6.2%) |
| $50,000 to $54,999 | 5,748 (5.2%) | 4,763 (4.8%) |
| $55,000 to $64,999 | 10,078 (9.2%) | 6,899 (7.0%) |
| $65,000 to $74,999 | 7,844 (7.1%) | 3,923 (4.0%) |
| $75,000 to $99,999 | 12,598 (11.5%) | 5,636 (5.7%) |
| $100,000+ | 16,126 (14.7%) | 4,769 (4.8%) |
| Total | 109,803 (100.0%) | 98,937 (100.0%) |
Earnings by Sex by Educational Attainment in Allen County
Average earnings in Allen County are $54,436 for men and $36,933 for women, a difference of 32.2%. Men with an educational attainment of graduate degree enjoy the highest average annual earnings of $94,741, while those with less than high school education earn the least with $36,611. Women with an educational attainment of graduate degree earn the most with the average annual earnings of $60,991, while those with less than high school education have the smallest earnings of $23,438.
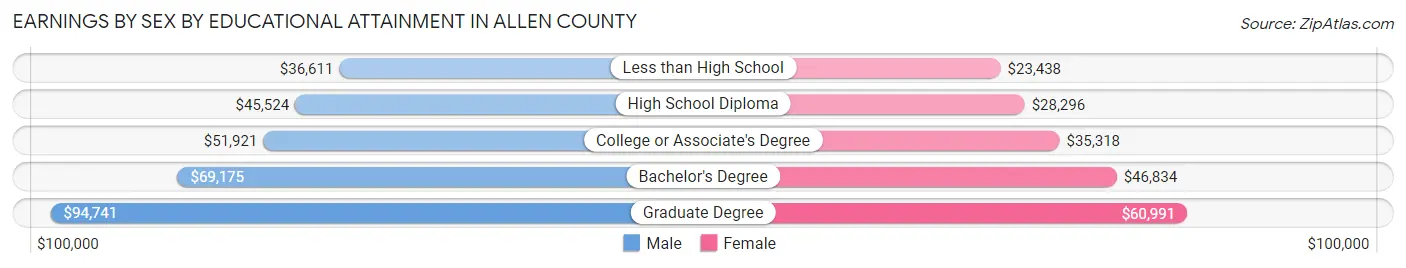
| Educational Attainment | Male Income | Female Income |
| Less than High School | $36,611 | $23,438 |
| High School Diploma | $45,524 | $28,296 |
| College or Associate's Degree | $51,921 | $35,318 |
| Bachelor's Degree | $69,175 | $46,834 |
| Graduate Degree | $94,741 | $60,991 |
| Total | $54,436 | $36,933 |
Family Income in Allen County
Family Income Brackets in Allen County
According to the Allen County family income data, there are 20,390 families falling into the $100,000 to $149,999 income range, which is the most common income bracket and makes up 21.2% of all families. Conversely, the $10,000 to $14,999 income bracket is the least frequent group with only 1,827 families (1.9%) belonging to this category.
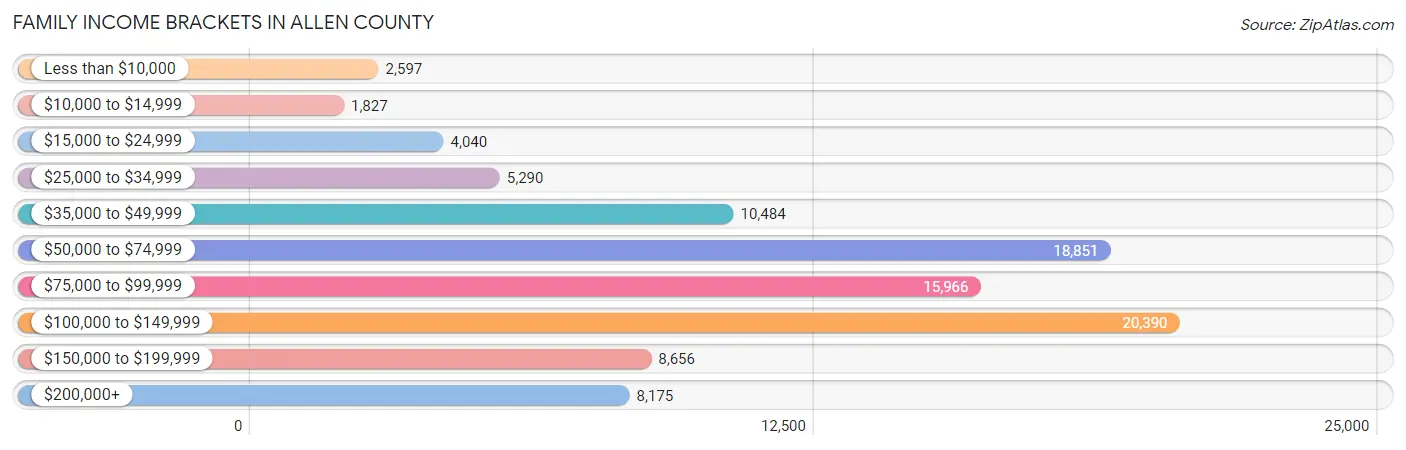
| Income Bracket | # Families | % Families |
| Less than $10,000 | 2,597 | 2.7% |
| $10,000 to $14,999 | 1,827 | 1.9% |
| $15,000 to $24,999 | 4,040 | 4.2% |
| $25,000 to $34,999 | 5,290 | 5.5% |
| $35,000 to $49,999 | 10,484 | 10.9% |
| $50,000 to $74,999 | 18,851 | 19.6% |
| $75,000 to $99,999 | 15,966 | 16.6% |
| $100,000 to $149,999 | 20,390 | 21.2% |
| $150,000 to $199,999 | 8,656 | 9.0% |
| $200,000+ | 8,175 | 8.5% |
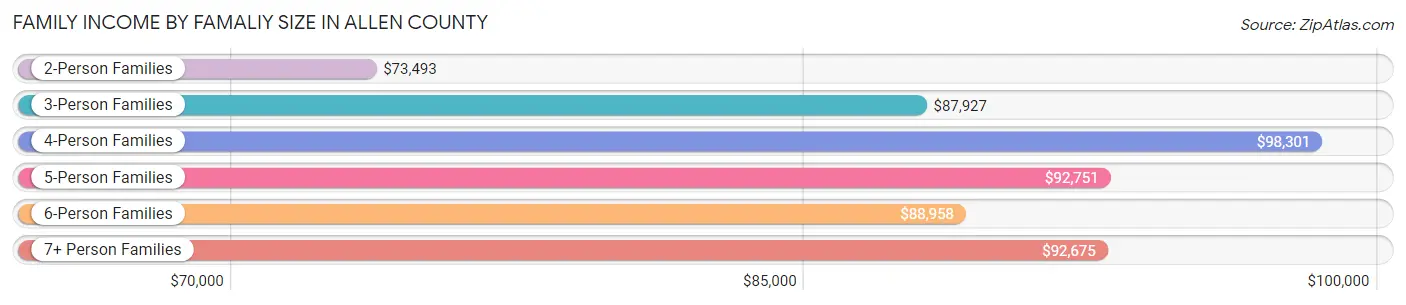
Family Income by Famaliy Size in Allen County
4-person families (16,887 | 17.6%) account for the highest median family income in Allen County with $98,301 per family, while 2-person families (45,175 | 47.0%) have the highest median income of $36,746 per family member.
| Income Bracket | # Families | Median Income |
| 2-Person Families | 45,175 (47.0%) | $73,493 |
| 3-Person Families | 19,391 (20.2%) | $87,927 |
| 4-Person Families | 16,887 (17.6%) | $98,301 |
| 5-Person Families | 8,876 (9.2%) | $92,751 |
| 6-Person Families | 3,706 (3.8%) | $88,958 |
| 7+ Person Families | 2,145 (2.2%) | $92,675 |
| Total | 96,180 (100.0%) | $83,250 |
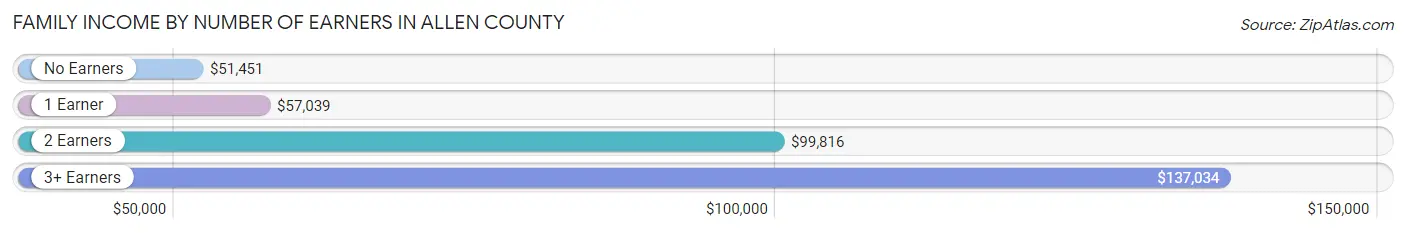
Family Income by Number of Earners in Allen County
The median family income in Allen County is $83,250, with families comprising 3+ earners (11,622) having the highest median family income of $137,034, while families with no earners (12,083) have the lowest median family income of $51,451, accounting for 12.1% and 12.6% of families, respectively.
| Number of Earners | # Families | Median Income |
| No Earners | 12,083 (12.6%) | $51,451 |
| 1 Earner | 30,882 (32.1%) | $57,039 |
| 2 Earners | 41,593 (43.2%) | $99,816 |
| 3+ Earners | 11,622 (12.1%) | $137,034 |
| Total | 96,180 (100.0%) | $83,250 |
Household Income in Allen County
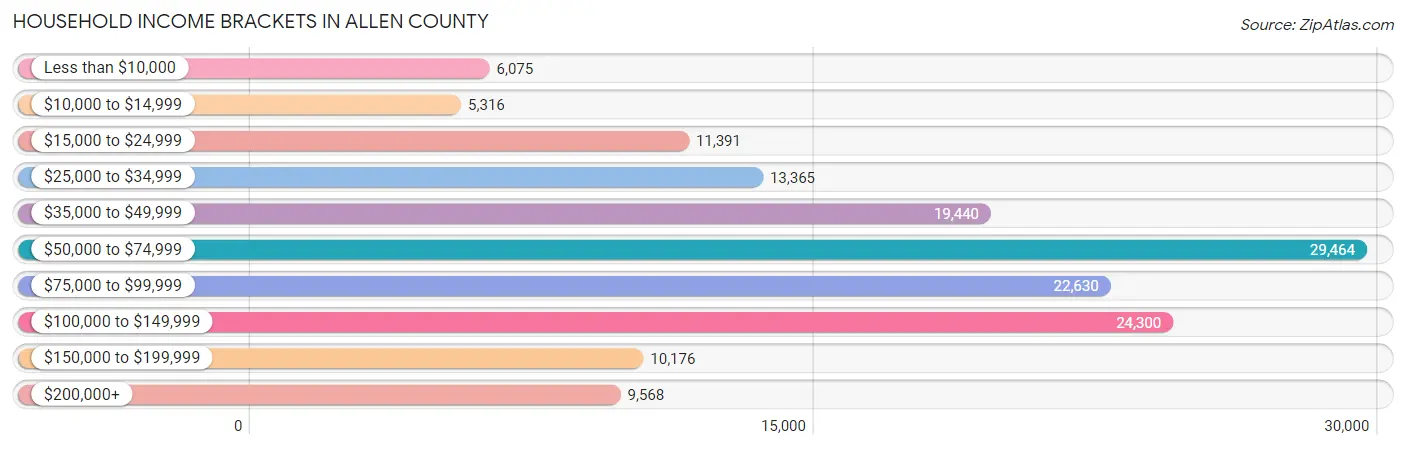
Household Income Brackets in Allen County
With 29,464 households falling in the category, the $50,000 to $74,999 income range is the most frequent in Allen County, accounting for 19.4% of all households. In contrast, only 5,316 households (3.5%) fall into the $10,000 to $14,999 income bracket, making it the least populous group.
| Income Bracket | # Households | % Households |
| Less than $10,000 | 6,075 | 4.0% |
| $10,000 to $14,999 | 5,316 | 3.5% |
| $15,000 to $24,999 | 11,391 | 7.5% |
| $25,000 to $34,999 | 13,365 | 8.8% |
| $35,000 to $49,999 | 19,440 | 12.8% |
| $50,000 to $74,999 | 29,464 | 19.4% |
| $75,000 to $99,999 | 22,630 | 14.9% |
| $100,000 to $149,999 | 24,300 | 16.0% |
| $150,000 to $199,999 | 10,176 | 6.7% |
| $200,000+ | 9,568 | 6.3% |
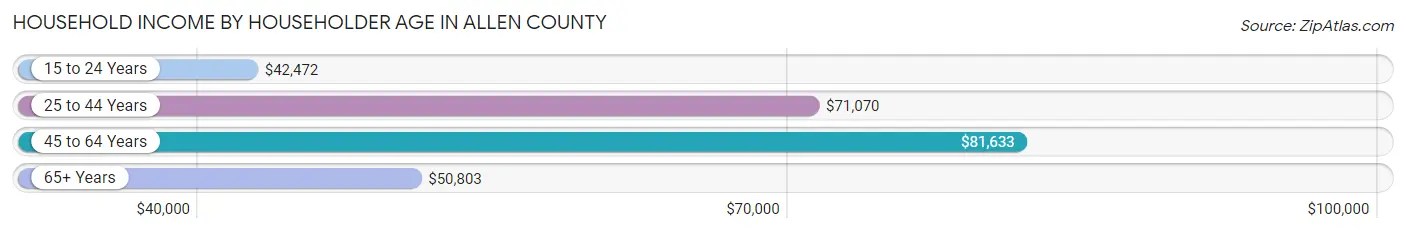
Household Income by Householder Age in Allen County
The median household income in Allen County is $66,222, with the highest median household income of $81,633 found in the 45 to 64 years age bracket for the primary householder. A total of 53,047 households (34.9%) fall into this category. Meanwhile, the 15 to 24 years age bracket for the primary householder has the lowest median household income of $42,472, with 8,356 households (5.5%) in this group.
| Income Bracket | # Households | Median Income |
| 15 to 24 Years | 8,356 (5.5%) | $42,472 |
| 25 to 44 Years | 53,690 (35.3%) | $71,070 |
| 45 to 64 Years | 53,047 (34.9%) | $81,633 |
| 65+ Years | 36,784 (24.2%) | $50,803 |
| Total | 151,877 (100.0%) | $66,222 |
Poverty in Allen County
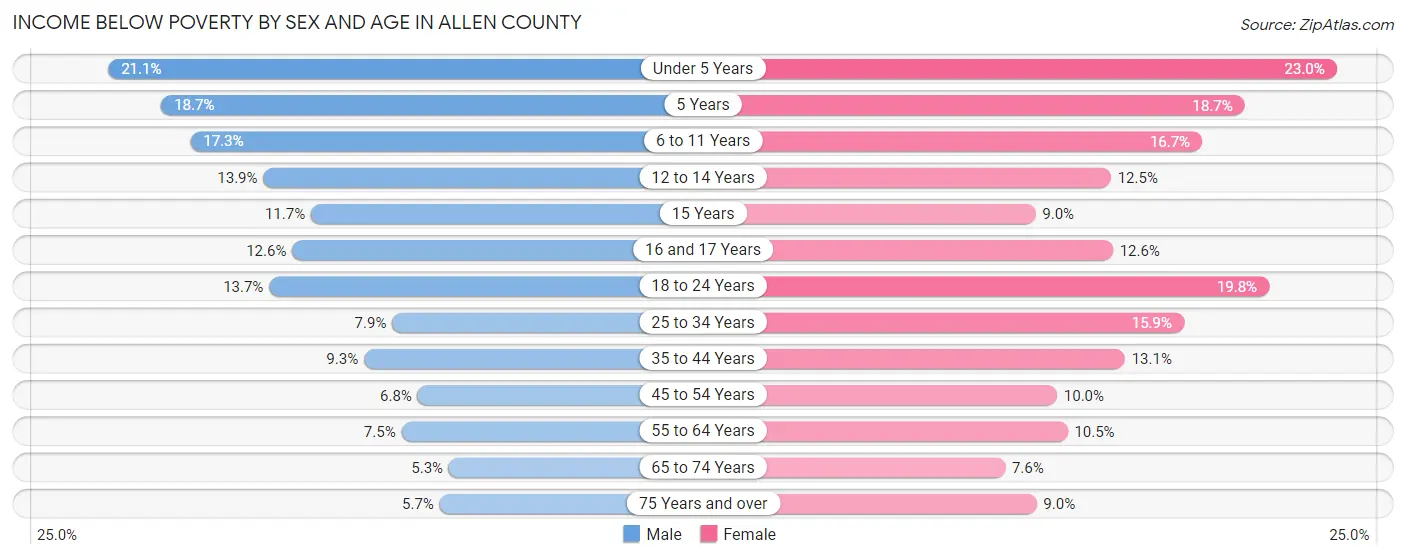
Income Below Poverty by Sex and Age in Allen County
With 10.5% poverty level for males and 13.5% for females among the residents of Allen County, under 5 year old males and under 5 year old females are the most vulnerable to poverty, with 2,796 males (21.1%) and 2,857 females (23.0%) in their respective age groups living below the poverty level.
| Age Bracket | Male | Female |
| Under 5 Years | 2,796 (21.1%) | 2,857 (23.0%) |
| 5 Years | 485 (18.7%) | 476 (18.7%) |
| 6 to 11 Years | 2,741 (17.3%) | 2,624 (16.7%) |
| 12 to 14 Years | 1,246 (13.9%) | 998 (12.5%) |
| 15 Years | 347 (11.7%) | 215 (9.0%) |
| 16 and 17 Years | 685 (12.6%) | 730 (12.6%) |
| 18 to 24 Years | 2,354 (13.7%) | 3,426 (19.8%) |
| 25 to 34 Years | 2,091 (7.9%) | 4,288 (15.9%) |
| 35 to 44 Years | 2,210 (9.2%) | 3,177 (13.1%) |
| 45 to 54 Years | 1,532 (6.8%) | 2,247 (10.0%) |
| 55 to 64 Years | 1,680 (7.5%) | 2,450 (10.5%) |
| 65 to 74 Years | 856 (5.3%) | 1,377 (7.6%) |
| 75 Years and over | 504 (5.7%) | 1,170 (9.0%) |
| Total | 19,527 (10.5%) | 26,035 (13.5%) |
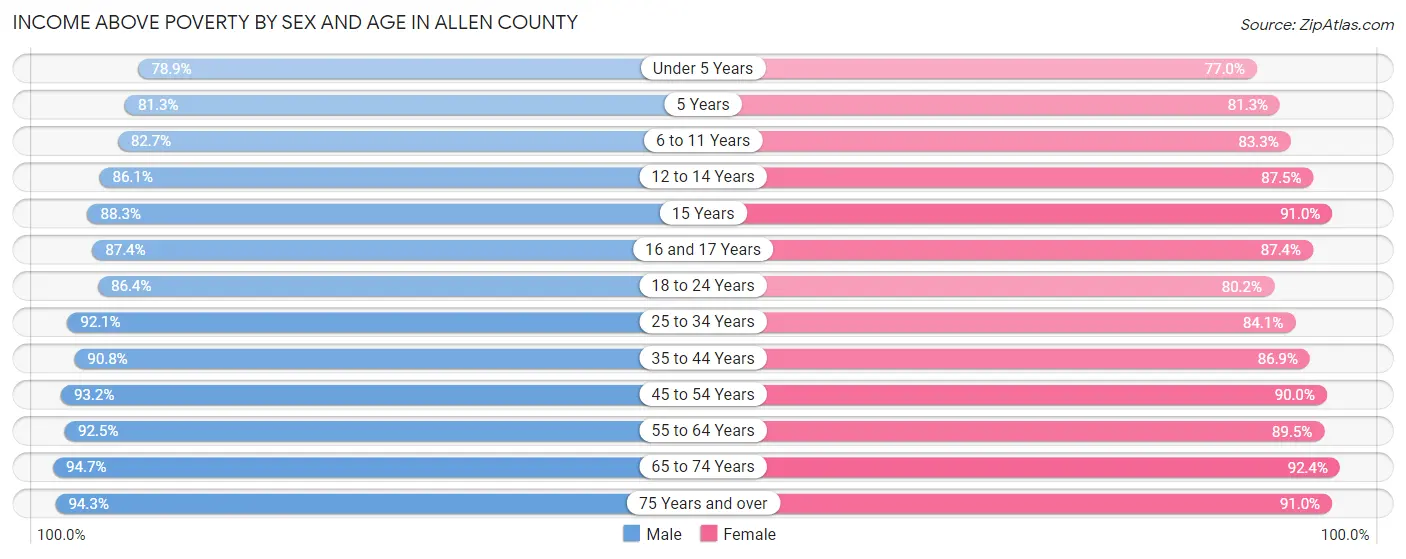
Income Above Poverty by Sex and Age in Allen County
According to the poverty statistics in Allen County, males aged 65 to 74 years and females aged 65 to 74 years are the age groups that are most secure financially, with 94.7% of males and 92.4% of females in these age groups living above the poverty line.
| Age Bracket | Male | Female |
| Under 5 Years | 10,444 (78.9%) | 9,589 (77.0%) |
| 5 Years | 2,114 (81.3%) | 2,071 (81.3%) |
| 6 to 11 Years | 13,092 (82.7%) | 13,081 (83.3%) |
| 12 to 14 Years | 7,703 (86.1%) | 6,999 (87.5%) |
| 15 Years | 2,616 (88.3%) | 2,179 (91.0%) |
| 16 and 17 Years | 4,758 (87.4%) | 5,077 (87.4%) |
| 18 to 24 Years | 14,893 (86.4%) | 13,857 (80.2%) |
| 25 to 34 Years | 24,242 (92.1%) | 22,731 (84.1%) |
| 35 to 44 Years | 21,670 (90.7%) | 21,016 (86.9%) |
| 45 to 54 Years | 21,127 (93.2%) | 20,267 (90.0%) |
| 55 to 64 Years | 20,697 (92.5%) | 20,944 (89.5%) |
| 65 to 74 Years | 15,279 (94.7%) | 16,816 (92.4%) |
| 75 Years and over | 8,272 (94.3%) | 11,784 (91.0%) |
| Total | 166,907 (89.5%) | 166,411 (86.5%) |
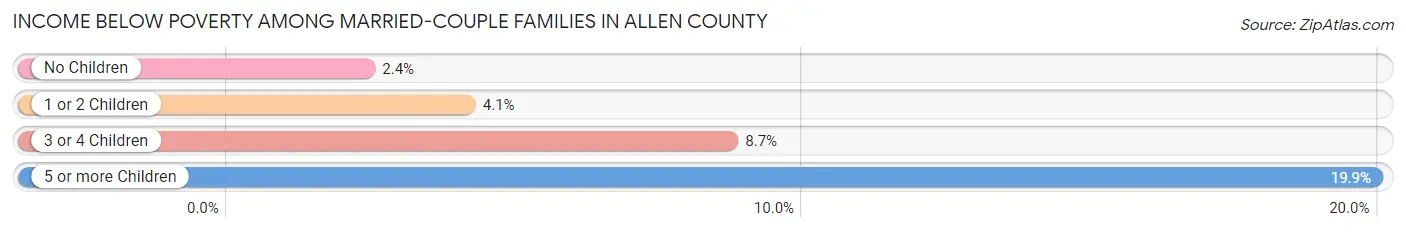
Income Below Poverty Among Married-Couple Families in Allen County
The poverty statistics for married-couple families in Allen County show that 3.9% or 2,766 of the total 70,795 families live below the poverty line. Families with 5 or more children have the highest poverty rate of 19.9%, comprising of 229 families. On the other hand, families with no children have the lowest poverty rate of 2.4%, which includes 957 families.
| Children | Above Poverty | Below Poverty |
| No Children | 39,114 (97.6%) | 957 (2.4%) |
| 1 or 2 Children | 20,874 (95.9%) | 901 (4.1%) |
| 3 or 4 Children | 7,121 (91.3%) | 679 (8.7%) |
| 5 or more Children | 920 (80.1%) | 229 (19.9%) |
| Total | 68,029 (96.1%) | 2,766 (3.9%) |
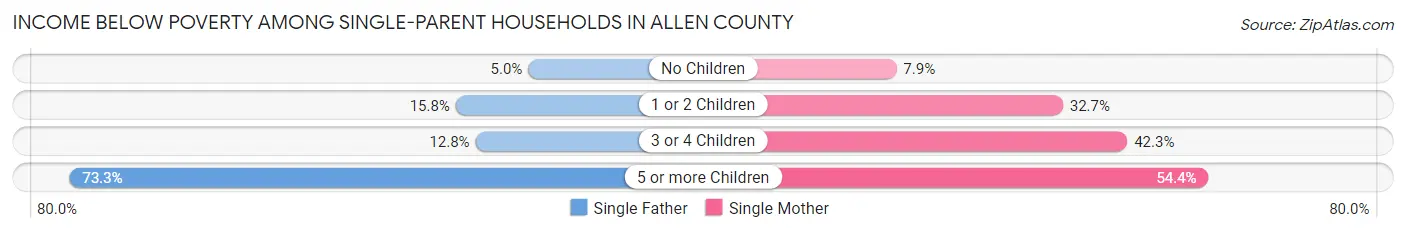
Income Below Poverty Among Single-Parent Households in Allen County
According to the poverty data in Allen County, 11.1% or 817 single-father households and 27.2% or 4,899 single-mother households are living below the poverty line. Among single-father households, those with 5 or more children have the highest poverty rate, with 22 households (73.3%) experiencing poverty. Likewise, among single-mother households, those with 5 or more children have the highest poverty rate, with 150 households (54.3%) falling below the poverty line.
| Children | Single Father | Single Mother |
| No Children | 156 (5.0%) | 424 (7.9%) |
| 1 or 2 Children | 550 (15.8%) | 3,047 (32.7%) |
| 3 or 4 Children | 89 (12.8%) | 1,278 (42.2%) |
| 5 or more Children | 22 (73.3%) | 150 (54.3%) |
| Total | 817 (11.1%) | 4,899 (27.2%) |
Income Below Poverty Among Married-Couple vs Single-Parent Households in Allen County
The poverty data for Allen County shows that 2,766 of the married-couple family households (3.9%) and 5,716 of the single-parent households (22.5%) are living below the poverty level. Within the married-couple family households, those with 5 or more children have the highest poverty rate, with 229 households (19.9%) falling below the poverty line. Among the single-parent households, those with 5 or more children have the highest poverty rate, with 172 household (56.2%) living below poverty.
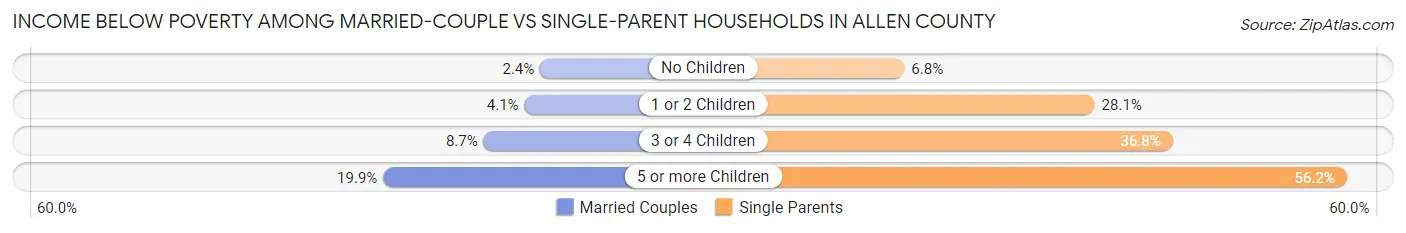
| Children | Married-Couple Families | Single-Parent Households |
| No Children | 957 (2.4%) | 580 (6.8%) |
| 1 or 2 Children | 901 (4.1%) | 3,597 (28.1%) |
| 3 or 4 Children | 679 (8.7%) | 1,367 (36.8%) |
| 5 or more Children | 229 (19.9%) | 172 (56.2%) |
| Total | 2,766 (3.9%) | 5,716 (22.5%) |
Employment Characteristics in Allen County
Employment by Class of Employer in Allen County
Among the 186,470 employed individuals in Allen County, private company employees (133,686 | 71.7%), not-for-profit organizations (22,160 | 11.9%), and local government employees (10,681 | 5.7%) make up the most common classes of employment.
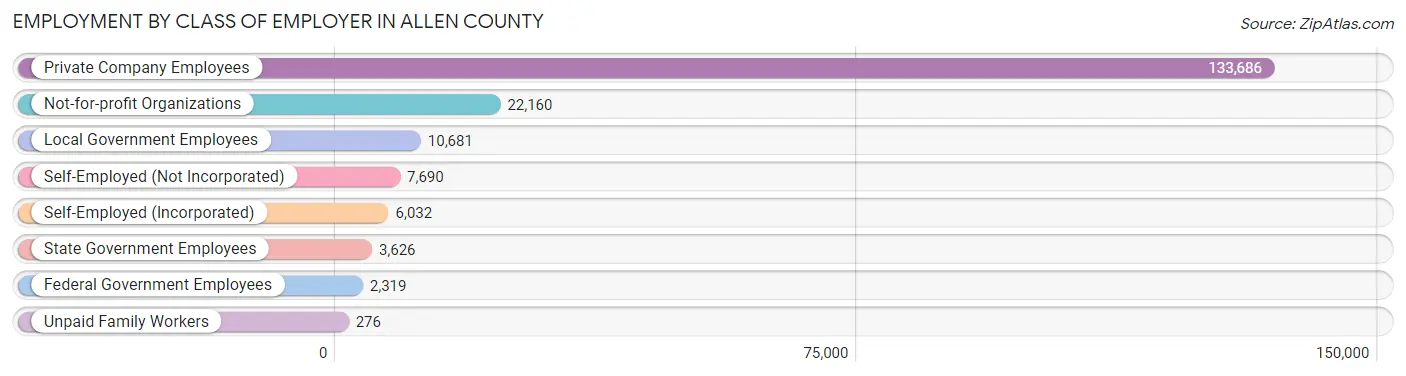
| Employer Class | # Employees | % Employees |
| Private Company Employees | 133,686 | 71.7% |
| Self-Employed (Incorporated) | 6,032 | 3.2% |
| Self-Employed (Not Incorporated) | 7,690 | 4.1% |
| Not-for-profit Organizations | 22,160 | 11.9% |
| Local Government Employees | 10,681 | 5.7% |
| State Government Employees | 3,626 | 1.9% |
| Federal Government Employees | 2,319 | 1.2% |
| Unpaid Family Workers | 276 | 0.2% |
| Total | 186,470 | 100.0% |
Employment Status by Age in Allen County
According to the labor force statistics for Allen County, out of the total population over 16 years of age (298,943), 66.8% or 199,694 individuals are in the labor force, with 4.8% or 9,585 of them unemployed. The age group with the highest labor force participation rate is 30 to 34 years, with 86.1% or 22,376 individuals in the labor force. Within the labor force, the 16 to 19 years age range has the highest percentage of unemployed individuals, with 12.6% or 1,387 of them being unemployed.
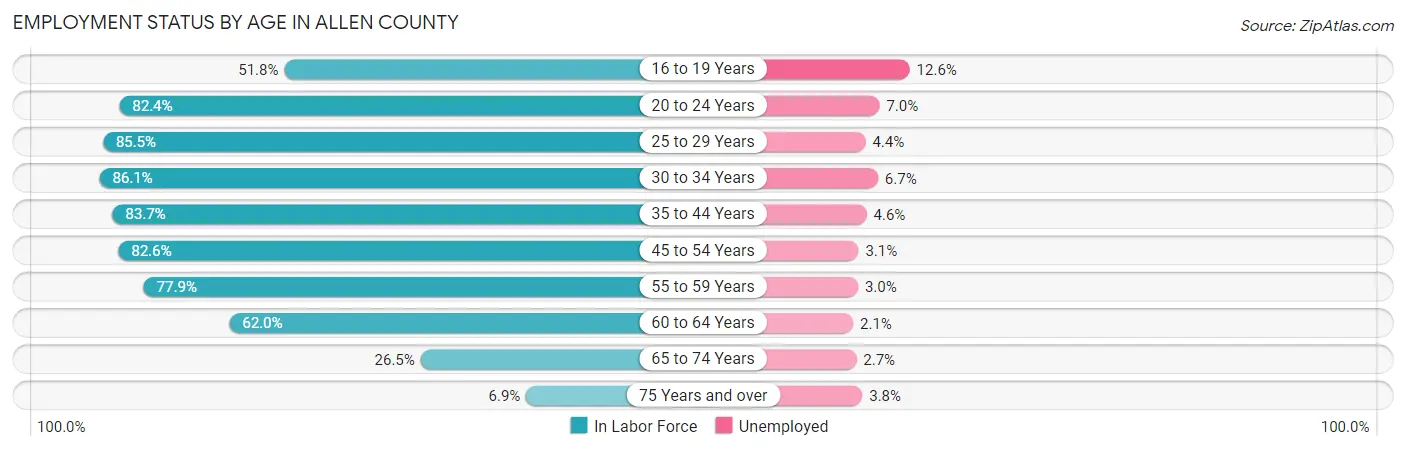
| Age Bracket | In Labor Force | Unemployed |
| 16 to 19 Years | 11,011 (51.8%) | 1,387 (12.6%) |
| 20 to 24 Years | 21,326 (82.4%) | 1,493 (7.0%) |
| 25 to 29 Years | 23,769 (85.5%) | 1,046 (4.4%) |
| 30 to 34 Years | 22,376 (86.1%) | 1,499 (6.7%) |
| 35 to 44 Years | 40,461 (83.7%) | 1,861 (4.6%) |
| 45 to 54 Years | 37,525 (82.6%) | 1,163 (3.1%) |
| 55 to 59 Years | 18,574 (77.9%) | 557 (3.0%) |
| 60 to 64 Years | 13,784 (62.0%) | 289 (2.1%) |
| 65 to 74 Years | 9,267 (26.5%) | 250 (2.7%) |
| 75 Years and over | 1,601 (6.9%) | 61 (3.8%) |
| Total | 199,694 (66.8%) | 9,585 (4.8%) |
Employment Status by Educational Attainment in Allen County
According to labor force statistics for Allen County, 80.8% of individuals (156,458) out of the total population between 25 and 64 years of age (193,636) are in the labor force, with 4.1% or 6,415 of them being unemployed. The group with the highest labor force participation rate are those with the educational attainment of bachelor's degree or higher, with 88.2% or 55,238 individuals in the labor force. Within the labor force, individuals with less than high school education have the highest percentage of unemployment, with 9.1% or 1,070 of them being unemployed.
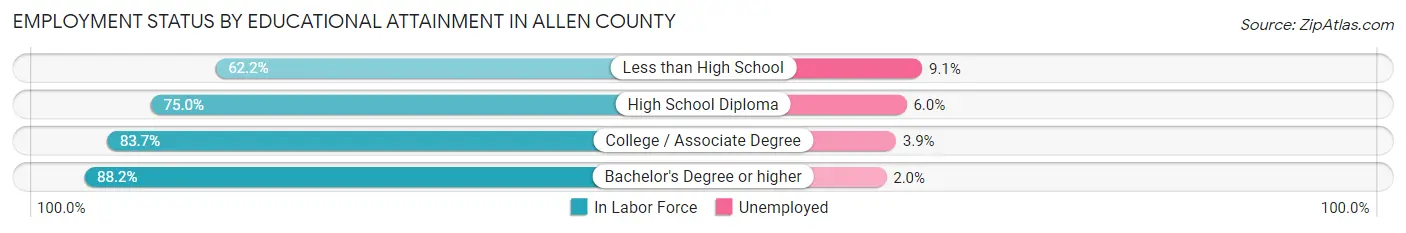
| Educational Attainment | In Labor Force | Unemployed |
| Less than High School | 11,762 (62.2%) | 1,721 (9.1%) |
| High School Diploma | 37,516 (75.0%) | 3,001 (6.0%) |
| College / Associate Degree | 51,958 (83.7%) | 2,421 (3.9%) |
| Bachelor's Degree or higher | 55,238 (88.2%) | 1,253 (2.0%) |
| Total | 156,458 (80.8%) | 7,939 (4.1%) |
Employment Occupations by Sex in Allen County
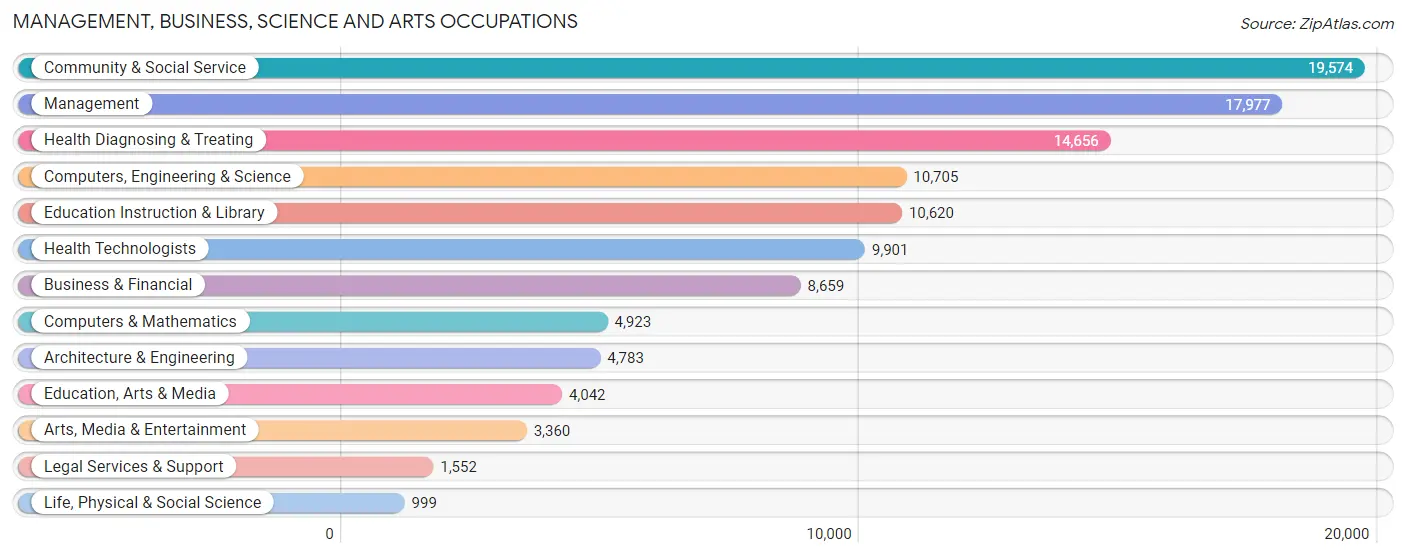
Management, Business, Science and Arts Occupations
The most common Management, Business, Science and Arts occupations in Allen County are Community & Social Service (19,574 | 10.3%), Management (17,977 | 9.5%), Health Diagnosing & Treating (14,656 | 7.7%), Computers, Engineering & Science (10,705 | 5.6%), and Education Instruction & Library (10,620 | 5.6%).
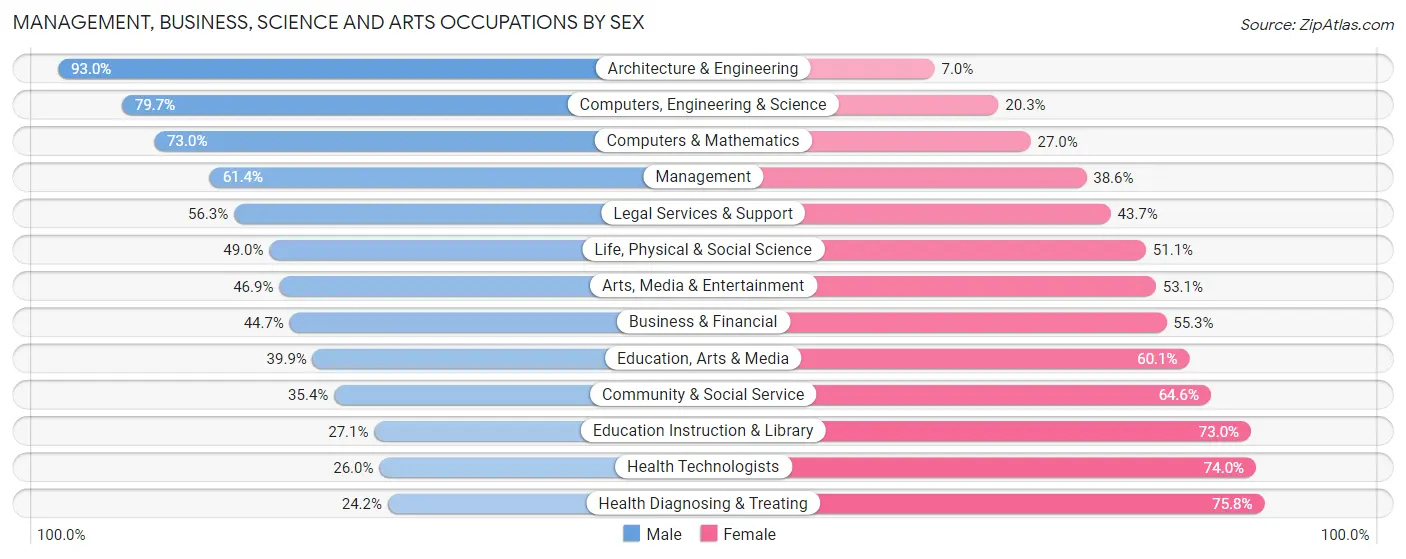
Management, Business, Science and Arts Occupations by Sex
Within the Management, Business, Science and Arts occupations in Allen County, the most male-oriented occupations are Architecture & Engineering (93.0%), Computers, Engineering & Science (79.7%), and Computers & Mathematics (73.0%), while the most female-oriented occupations are Health Diagnosing & Treating (75.8%), Health Technologists (74.0%), and Education Instruction & Library (73.0%).
| Occupation | Male | Female |
| Management | 11,035 (61.4%) | 6,942 (38.6%) |
| Business & Financial | 3,871 (44.7%) | 4,788 (55.3%) |
| Computers, Engineering & Science | 8,533 (79.7%) | 2,172 (20.3%) |
| Computers & Mathematics | 3,594 (73.0%) | 1,329 (27.0%) |
| Architecture & Engineering | 4,450 (93.0%) | 333 (7.0%) |
| Life, Physical & Social Science | 489 (48.9%) | 510 (51.0%) |
| Community & Social Service | 6,935 (35.4%) | 12,639 (64.6%) |
| Education, Arts & Media | 1,613 (39.9%) | 2,429 (60.1%) |
| Legal Services & Support | 874 (56.3%) | 678 (43.7%) |
| Education Instruction & Library | 2,873 (27.1%) | 7,747 (73.0%) |
| Arts, Media & Entertainment | 1,575 (46.9%) | 1,785 (53.1%) |
| Health Diagnosing & Treating | 3,552 (24.2%) | 11,104 (75.8%) |
| Health Technologists | 2,575 (26.0%) | 7,326 (74.0%) |
| Total (Category) | 33,926 (47.4%) | 37,645 (52.6%) |
| Total (Overall) | 100,515 (52.9%) | 89,319 (47.0%) |
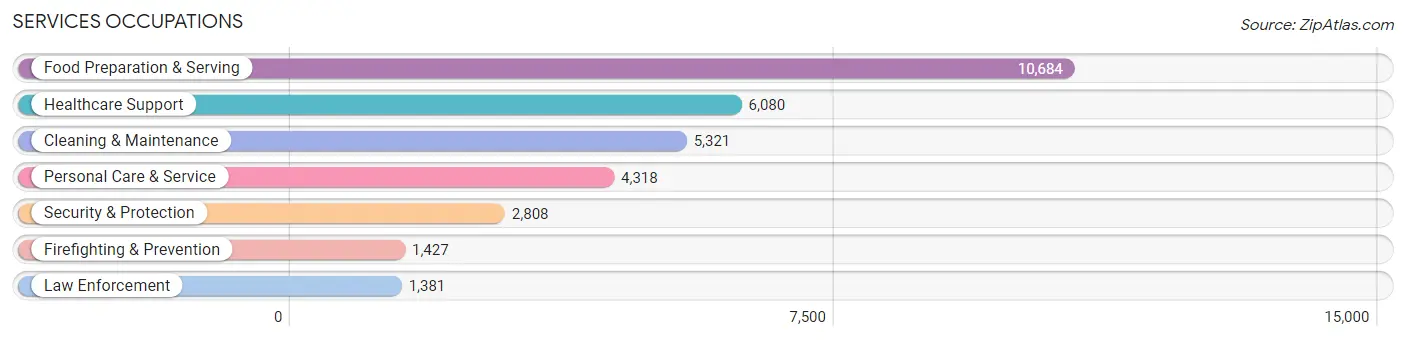
Services Occupations
The most common Services occupations in Allen County are Food Preparation & Serving (10,684 | 5.6%), Healthcare Support (6,080 | 3.2%), Cleaning & Maintenance (5,321 | 2.8%), Personal Care & Service (4,318 | 2.3%), and Security & Protection (2,808 | 1.5%).
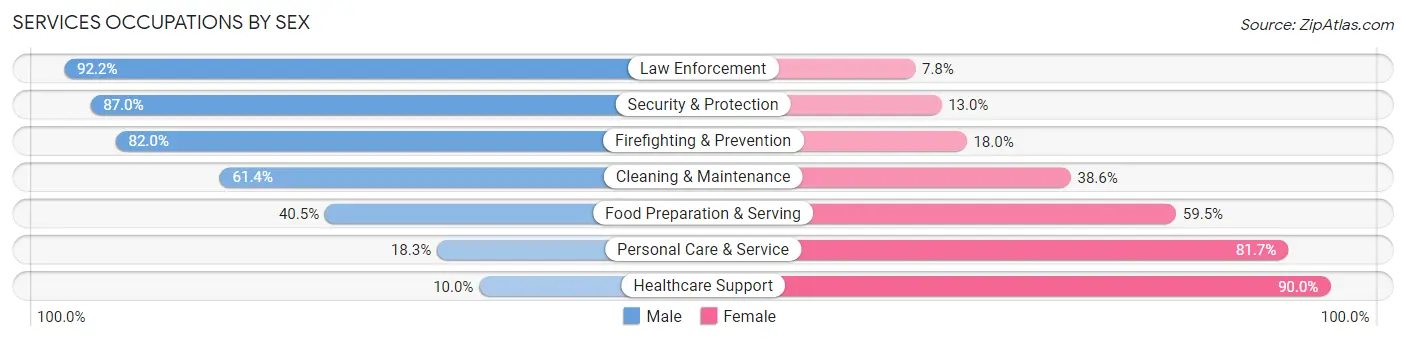
Services Occupations by Sex
Within the Services occupations in Allen County, the most male-oriented occupations are Law Enforcement (92.2%), Security & Protection (87.0%), and Firefighting & Prevention (82.0%), while the most female-oriented occupations are Healthcare Support (90.0%), Personal Care & Service (81.7%), and Food Preparation & Serving (59.5%).
| Occupation | Male | Female |
| Healthcare Support | 607 (10.0%) | 5,473 (90.0%) |
| Security & Protection | 2,443 (87.0%) | 365 (13.0%) |
| Firefighting & Prevention | 1,170 (82.0%) | 257 (18.0%) |
| Law Enforcement | 1,273 (92.2%) | 108 (7.8%) |
| Food Preparation & Serving | 4,329 (40.5%) | 6,355 (59.5%) |
| Cleaning & Maintenance | 3,266 (61.4%) | 2,055 (38.6%) |
| Personal Care & Service | 792 (18.3%) | 3,526 (81.7%) |
| Total (Category) | 11,437 (39.2%) | 17,774 (60.9%) |
| Total (Overall) | 100,515 (52.9%) | 89,319 (47.0%) |
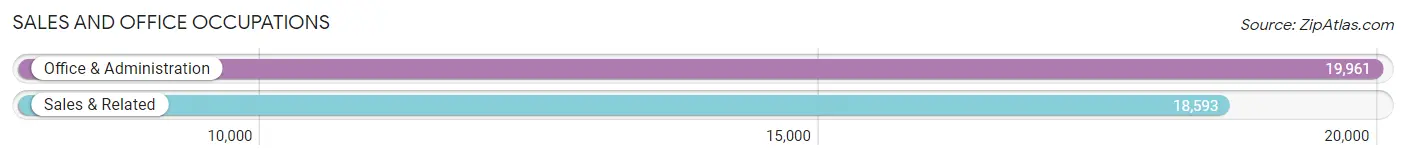
Sales and Office Occupations
The most common Sales and Office occupations in Allen County are Office & Administration (19,961 | 10.5%), and Sales & Related (18,593 | 9.8%).
Sales and Office Occupations by Sex
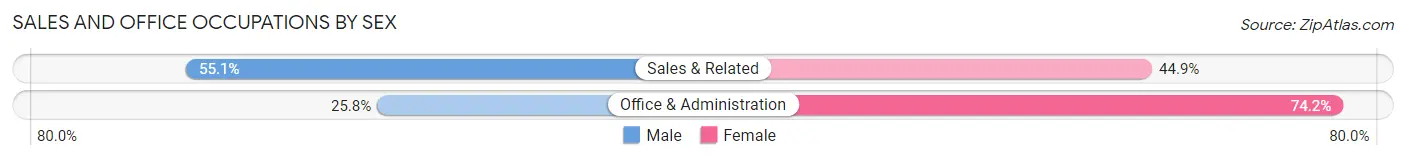
| Occupation | Male | Female |
| Sales & Related | 10,253 (55.1%) | 8,340 (44.9%) |
| Office & Administration | 5,146 (25.8%) | 14,815 (74.2%) |
| Total (Category) | 15,399 (39.9%) | 23,155 (60.1%) |
| Total (Overall) | 100,515 (52.9%) | 89,319 (47.0%) |
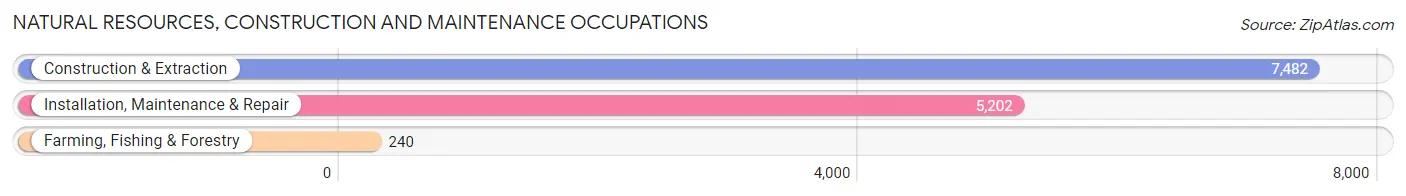
Natural Resources, Construction and Maintenance Occupations
The most common Natural Resources, Construction and Maintenance occupations in Allen County are Construction & Extraction (7,482 | 3.9%), Installation, Maintenance & Repair (5,202 | 2.7%), and Farming, Fishing & Forestry (240 | 0.1%).
Natural Resources, Construction and Maintenance Occupations by Sex
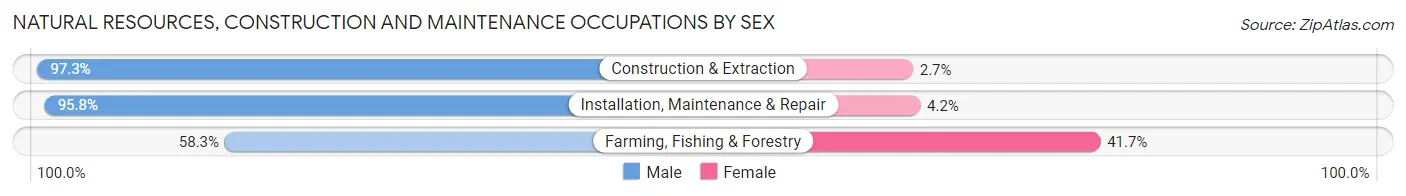
| Occupation | Male | Female |
| Farming, Fishing & Forestry | 140 (58.3%) | 100 (41.7%) |
| Construction & Extraction | 7,282 (97.3%) | 200 (2.7%) |
| Installation, Maintenance & Repair | 4,984 (95.8%) | 218 (4.2%) |
| Total (Category) | 12,406 (96.0%) | 518 (4.0%) |
| Total (Overall) | 100,515 (52.9%) | 89,319 (47.0%) |
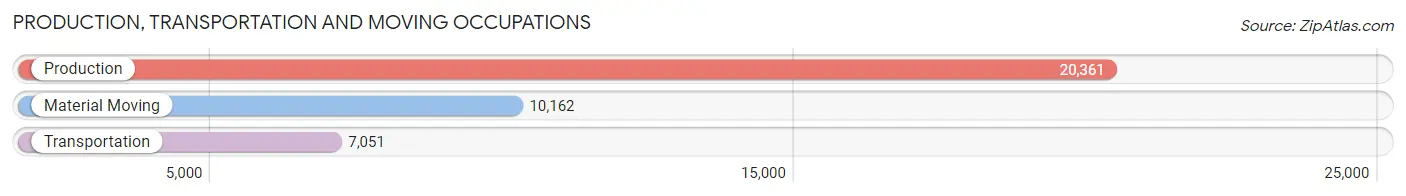
Production, Transportation and Moving Occupations
The most common Production, Transportation and Moving occupations in Allen County are Production (20,361 | 10.7%), Material Moving (10,162 | 5.3%), and Transportation (7,051 | 3.7%).
Production, Transportation and Moving Occupations by Sex
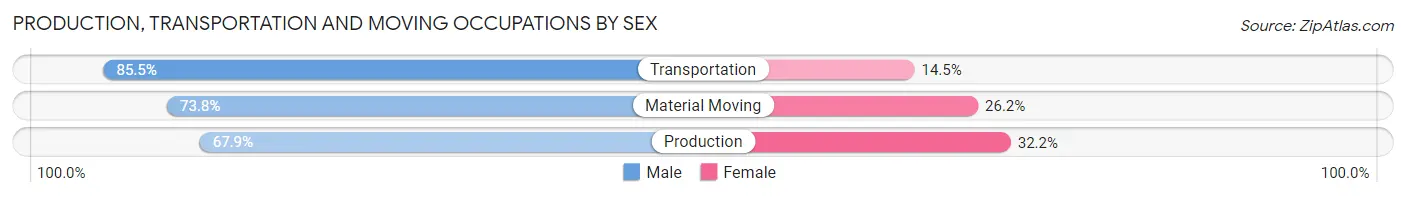
| Occupation | Male | Female |
| Production | 13,814 (67.8%) | 6,547 (32.2%) |
| Transportation | 6,029 (85.5%) | 1,022 (14.5%) |
| Material Moving | 7,504 (73.8%) | 2,658 (26.2%) |
| Total (Category) | 27,347 (72.8%) | 10,227 (27.2%) |
| Total (Overall) | 100,515 (52.9%) | 89,319 (47.0%) |
Employment Industries by Sex in Allen County
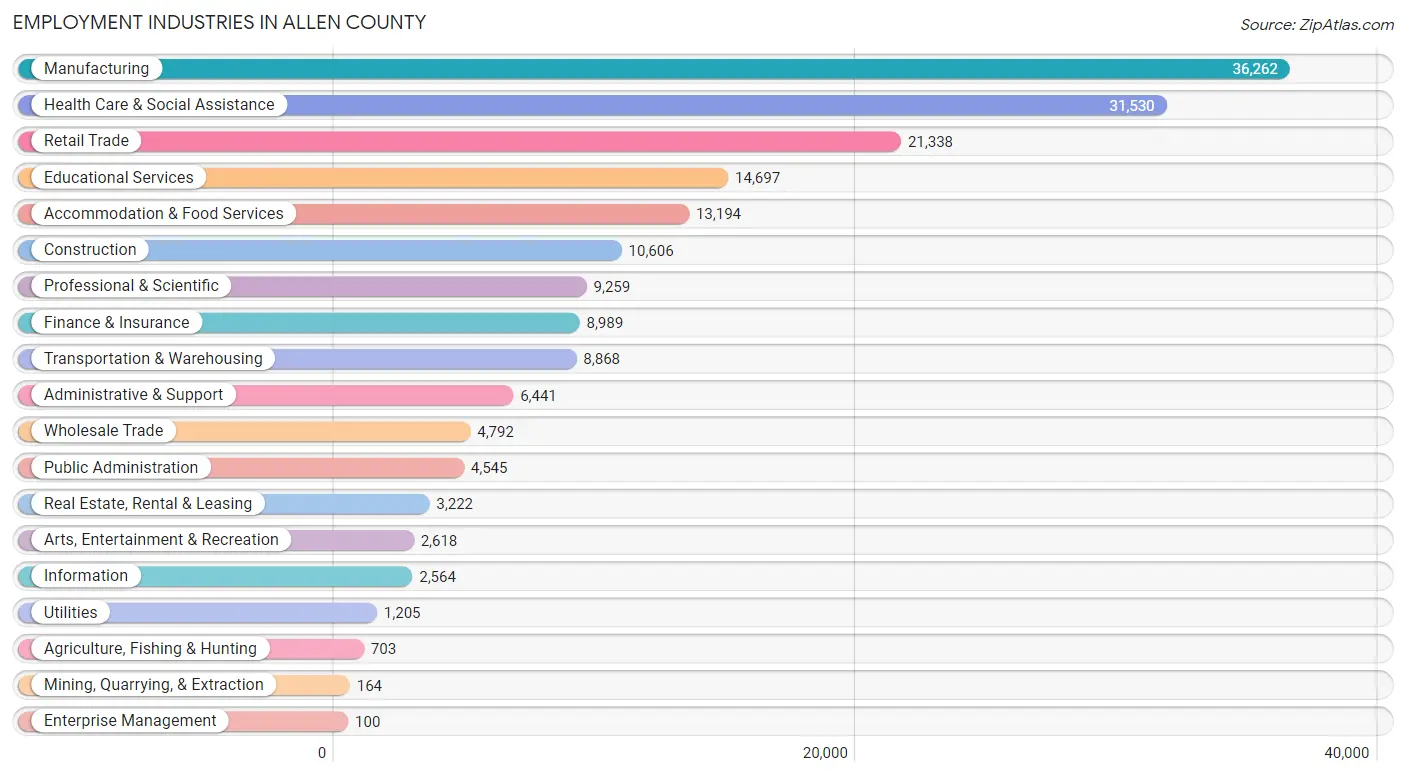
Employment Industries in Allen County
The major employment industries in Allen County include Manufacturing (36,262 | 19.1%), Health Care & Social Assistance (31,530 | 16.6%), Retail Trade (21,338 | 11.2%), Educational Services (14,697 | 7.7%), and Accommodation & Food Services (13,194 | 7.0%).
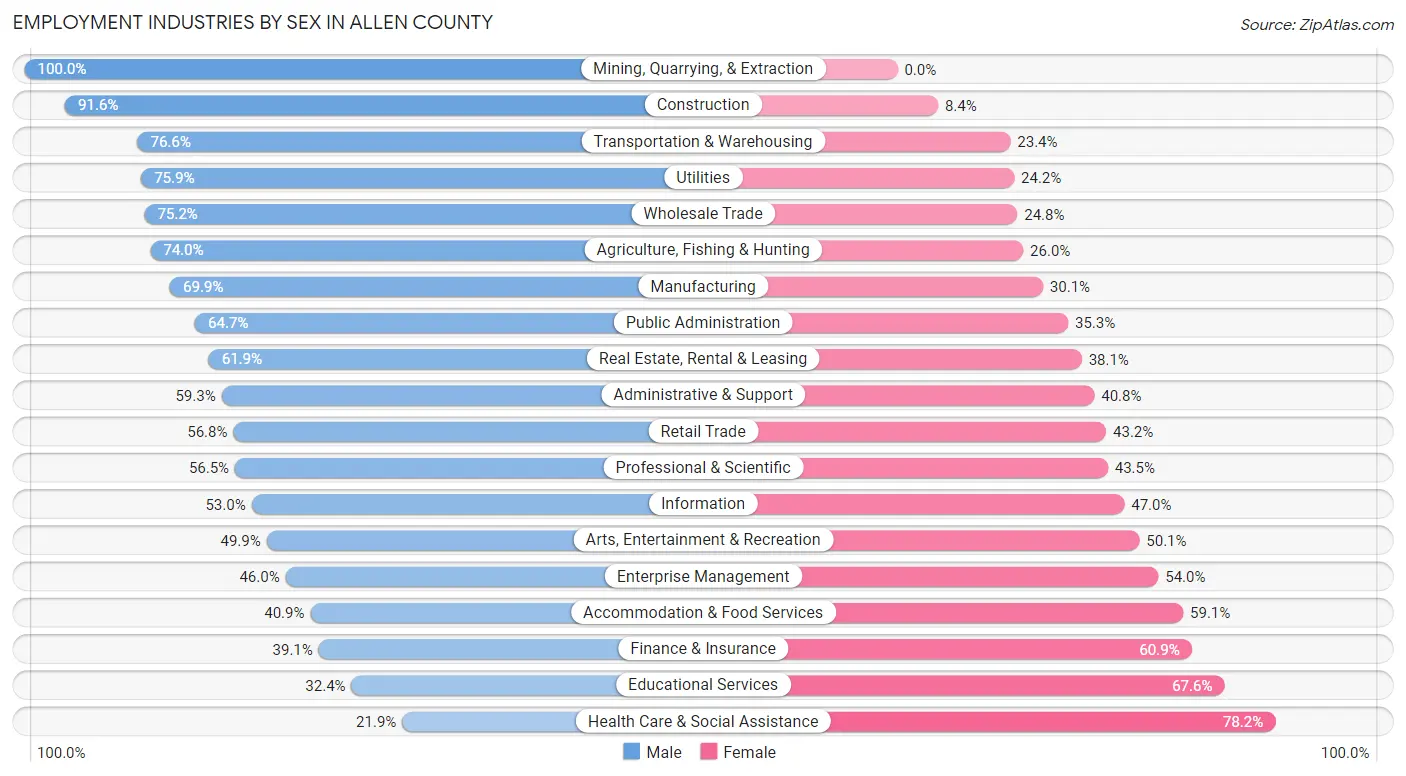
Employment Industries by Sex in Allen County
The Allen County industries that see more men than women are Mining, Quarrying, & Extraction (100.0%), Construction (91.6%), and Transportation & Warehousing (76.6%), whereas the industries that tend to have a higher number of women are Health Care & Social Assistance (78.1%), Educational Services (67.6%), and Finance & Insurance (60.9%).
| Industry | Male | Female |
| Agriculture, Fishing & Hunting | 520 (74.0%) | 183 (26.0%) |
| Mining, Quarrying, & Extraction | 164 (100.0%) | 0 (0.0%) |
| Construction | 9,716 (91.6%) | 890 (8.4%) |
| Manufacturing | 25,342 (69.9%) | 10,920 (30.1%) |
| Wholesale Trade | 3,603 (75.2%) | 1,189 (24.8%) |
| Retail Trade | 12,121 (56.8%) | 9,217 (43.2%) |
| Transportation & Warehousing | 6,795 (76.6%) | 2,073 (23.4%) |
| Utilities | 914 (75.8%) | 291 (24.1%) |
| Information | 1,360 (53.0%) | 1,204 (47.0%) |
| Finance & Insurance | 3,518 (39.1%) | 5,471 (60.9%) |
| Real Estate, Rental & Leasing | 1,993 (61.9%) | 1,229 (38.1%) |
| Professional & Scientific | 5,228 (56.5%) | 4,031 (43.5%) |
| Enterprise Management | 46 (46.0%) | 54 (54.0%) |
| Administrative & Support | 3,816 (59.3%) | 2,625 (40.7%) |
| Educational Services | 4,756 (32.4%) | 9,941 (67.6%) |
| Health Care & Social Assistance | 6,890 (21.8%) | 24,640 (78.1%) |
| Arts, Entertainment & Recreation | 1,307 (49.9%) | 1,311 (50.1%) |
| Accommodation & Food Services | 5,392 (40.9%) | 7,802 (59.1%) |
| Public Administration | 2,940 (64.7%) | 1,605 (35.3%) |
| Total | 100,515 (52.9%) | 89,319 (47.0%) |
Education in Allen County
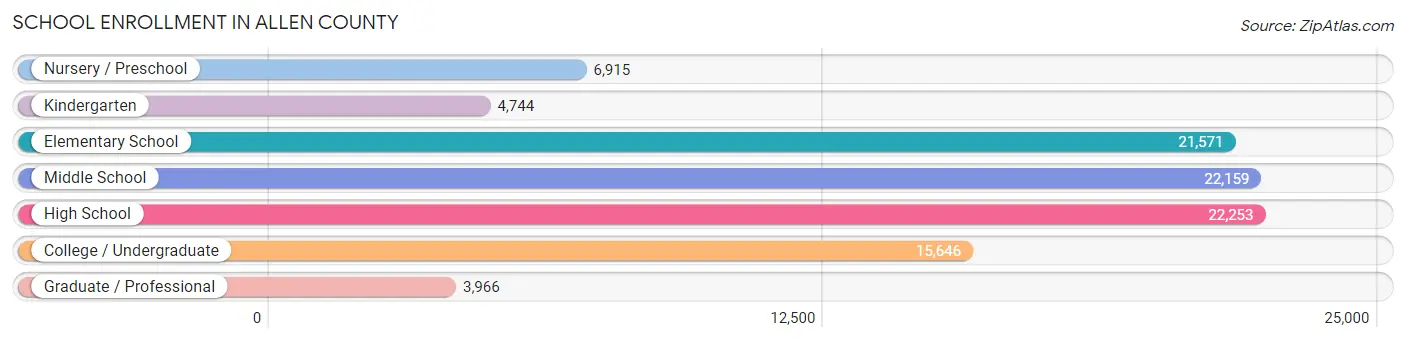
School Enrollment in Allen County
The most common levels of schooling among the 97,254 students in Allen County are high school (22,253 | 22.9%), middle school (22,159 | 22.8%), and elementary school (21,571 | 22.2%).
| School Level | # Students | % Students |
| Nursery / Preschool | 6,915 | 7.1% |
| Kindergarten | 4,744 | 4.9% |
| Elementary School | 21,571 | 22.2% |
| Middle School | 22,159 | 22.8% |
| High School | 22,253 | 22.9% |
| College / Undergraduate | 15,646 | 16.1% |
| Graduate / Professional | 3,966 | 4.1% |
| Total | 97,254 | 100.0% |
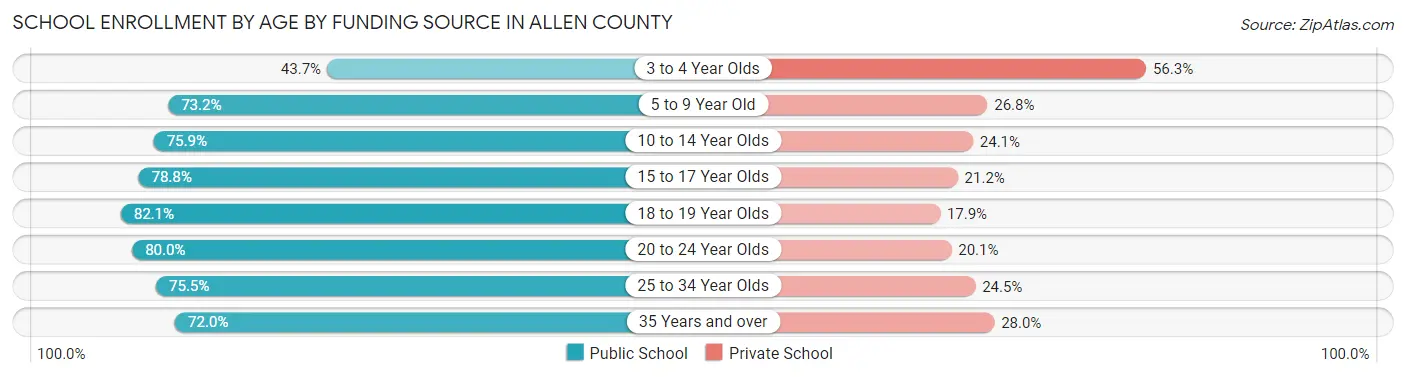
School Enrollment by Age by Funding Source in Allen County
Out of a total of 97,254 students who are enrolled in schools in Allen County, 24,508 (25.2%) attend a private institution, while the remaining 72,746 (74.8%) are enrolled in public schools. The age group of 3 to 4 year olds has the highest likelihood of being enrolled in private schools, with 2,592 (56.3% in the age bracket) enrolled. Conversely, the age group of 18 to 19 year olds has the lowest likelihood of being enrolled in a private school, with 5,544 (82.1% in the age bracket) attending a public institution.
| Age Bracket | Public School | Private School |
| 3 to 4 Year Olds | 2,011 (43.7%) | 2,592 (56.3%) |
| 5 to 9 Year Old | 18,229 (73.2%) | 6,662 (26.8%) |
| 10 to 14 Year Olds | 20,887 (75.9%) | 6,616 (24.1%) |
| 15 to 17 Year Olds | 12,857 (78.8%) | 3,466 (21.2%) |
| 18 to 19 Year Olds | 5,544 (82.1%) | 1,211 (17.9%) |
| 20 to 24 Year Olds | 6,408 (79.9%) | 1,607 (20.1%) |
| 25 to 34 Year Olds | 3,833 (75.5%) | 1,244 (24.5%) |
| 35 Years and over | 2,941 (72.0%) | 1,146 (28.0%) |
| Total | 72,746 (74.8%) | 24,508 (25.2%) |
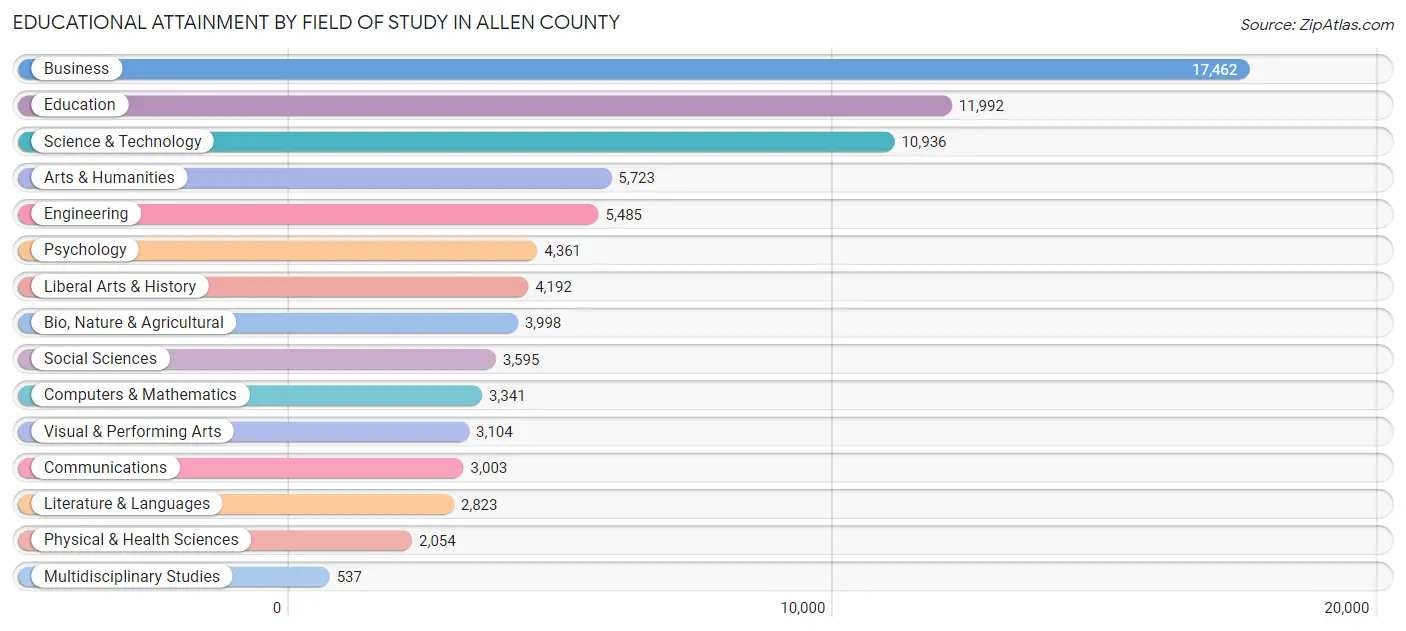
Educational Attainment by Field of Study in Allen County
Business (17,462 | 21.1%), education (11,992 | 14.5%), science & technology (10,936 | 13.2%), arts & humanities (5,723 | 6.9%), and engineering (5,485 | 6.6%) are the most common fields of study among 82,606 individuals in Allen County who have obtained a bachelor's degree or higher.
| Field of Study | # Graduates | % Graduates |
| Computers & Mathematics | 3,341 | 4.0% |
| Bio, Nature & Agricultural | 3,998 | 4.8% |
| Physical & Health Sciences | 2,054 | 2.5% |
| Psychology | 4,361 | 5.3% |
| Social Sciences | 3,595 | 4.3% |
| Engineering | 5,485 | 6.6% |
| Multidisciplinary Studies | 537 | 0.6% |
| Science & Technology | 10,936 | 13.2% |
| Business | 17,462 | 21.1% |
| Education | 11,992 | 14.5% |
| Literature & Languages | 2,823 | 3.4% |
| Liberal Arts & History | 4,192 | 5.1% |
| Visual & Performing Arts | 3,104 | 3.8% |
| Communications | 3,003 | 3.6% |
| Arts & Humanities | 5,723 | 6.9% |
| Total | 82,606 | 100.0% |
Transportation & Commute in Allen County
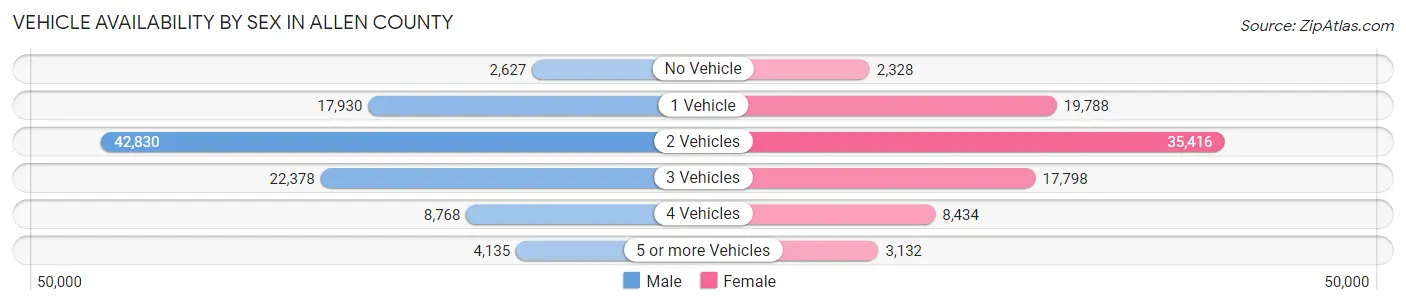
Vehicle Availability by Sex in Allen County
The most prevalent vehicle ownership categories in Allen County are males with 2 vehicles (42,830, accounting for 43.4%) and females with 2 vehicles (35,416, making up 49.3%).
| Vehicles Available | Male | Female |
| No Vehicle | 2,627 (2.7%) | 2,328 (2.7%) |
| 1 Vehicle | 17,930 (18.2%) | 19,788 (22.8%) |
| 2 Vehicles | 42,830 (43.4%) | 35,416 (40.8%) |
| 3 Vehicles | 22,378 (22.7%) | 17,798 (20.5%) |
| 4 Vehicles | 8,768 (8.9%) | 8,434 (9.7%) |
| 5 or more Vehicles | 4,135 (4.2%) | 3,132 (3.6%) |
| Total | 98,668 (100.0%) | 86,896 (100.0%) |
Commute Time in Allen County
The most frequently occuring commute durations in Allen County are 20 to 24 minutes (35,397 commuters, 20.5%), 15 to 19 minutes (35,103 commuters, 20.3%), and 10 to 14 minutes (28,365 commuters, 16.4%).
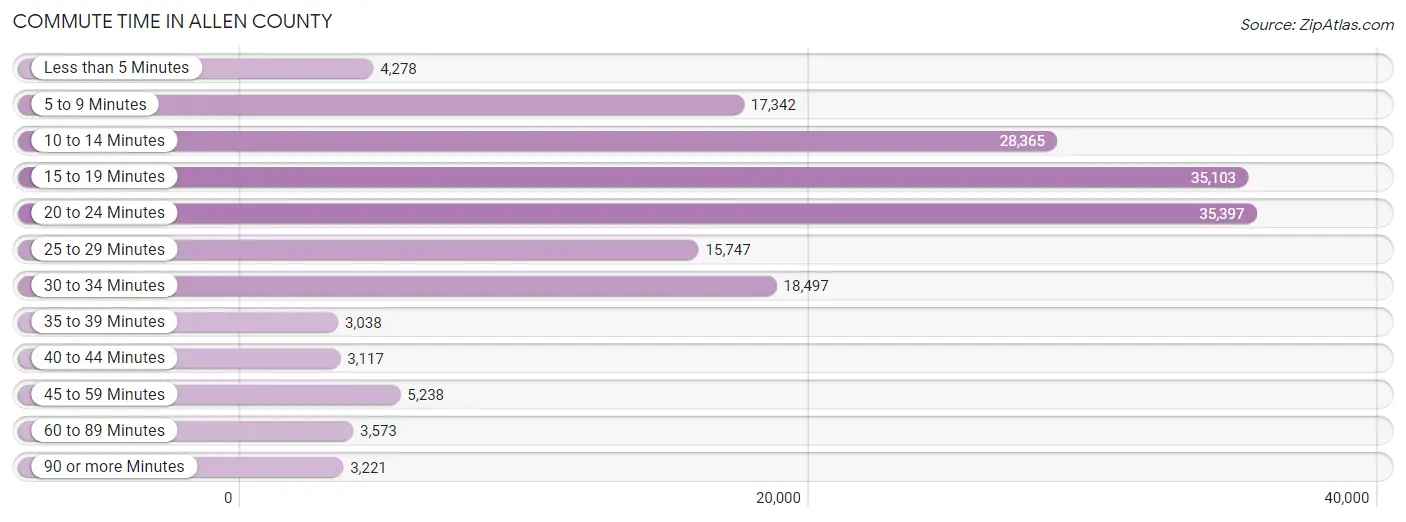
| Commute Time | # Commuters | % Commuters |
| Less than 5 Minutes | 4,278 | 2.5% |
| 5 to 9 Minutes | 17,342 | 10.0% |
| 10 to 14 Minutes | 28,365 | 16.4% |
| 15 to 19 Minutes | 35,103 | 20.3% |
| 20 to 24 Minutes | 35,397 | 20.5% |
| 25 to 29 Minutes | 15,747 | 9.1% |
| 30 to 34 Minutes | 18,497 | 10.7% |
| 35 to 39 Minutes | 3,038 | 1.8% |
| 40 to 44 Minutes | 3,117 | 1.8% |
| 45 to 59 Minutes | 5,238 | 3.0% |
| 60 to 89 Minutes | 3,573 | 2.1% |
| 90 or more Minutes | 3,221 | 1.9% |
Commute Time by Sex in Allen County
The most common commute times in Allen County are 20 to 24 minutes (18,879 commuters, 20.3%) for males and 15 to 19 minutes (17,001 commuters, 21.2%) for females.
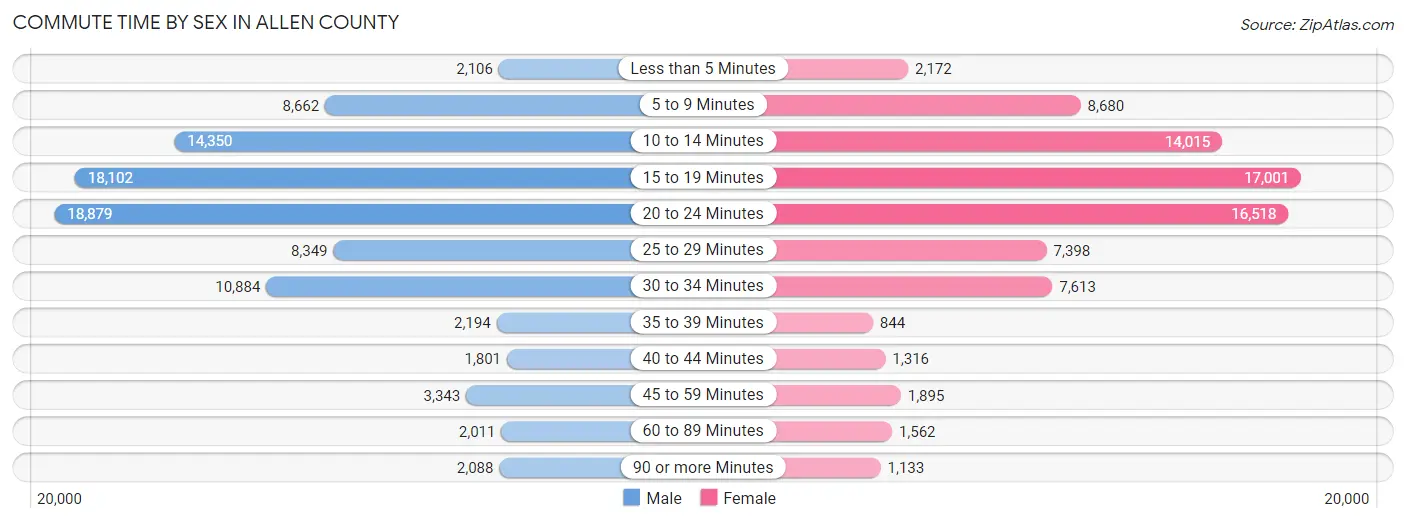
| Commute Time | Male | Female |
| Less than 5 Minutes | 2,106 (2.3%) | 2,172 (2.7%) |
| 5 to 9 Minutes | 8,662 (9.3%) | 8,680 (10.8%) |
| 10 to 14 Minutes | 14,350 (15.5%) | 14,015 (17.5%) |
| 15 to 19 Minutes | 18,102 (19.5%) | 17,001 (21.2%) |
| 20 to 24 Minutes | 18,879 (20.3%) | 16,518 (20.6%) |
| 25 to 29 Minutes | 8,349 (9.0%) | 7,398 (9.2%) |
| 30 to 34 Minutes | 10,884 (11.7%) | 7,613 (9.5%) |
| 35 to 39 Minutes | 2,194 (2.4%) | 844 (1.1%) |
| 40 to 44 Minutes | 1,801 (1.9%) | 1,316 (1.6%) |
| 45 to 59 Minutes | 3,343 (3.6%) | 1,895 (2.4%) |
| 60 to 89 Minutes | 2,011 (2.2%) | 1,562 (1.9%) |
| 90 or more Minutes | 2,088 (2.2%) | 1,133 (1.4%) |
Time of Departure to Work by Sex in Allen County
The most frequent times of departure to work in Allen County are 7:00 AM to 7:29 AM (12,902, 13.9%) for males and 7:00 AM to 7:29 AM (11,382, 14.2%) for females.
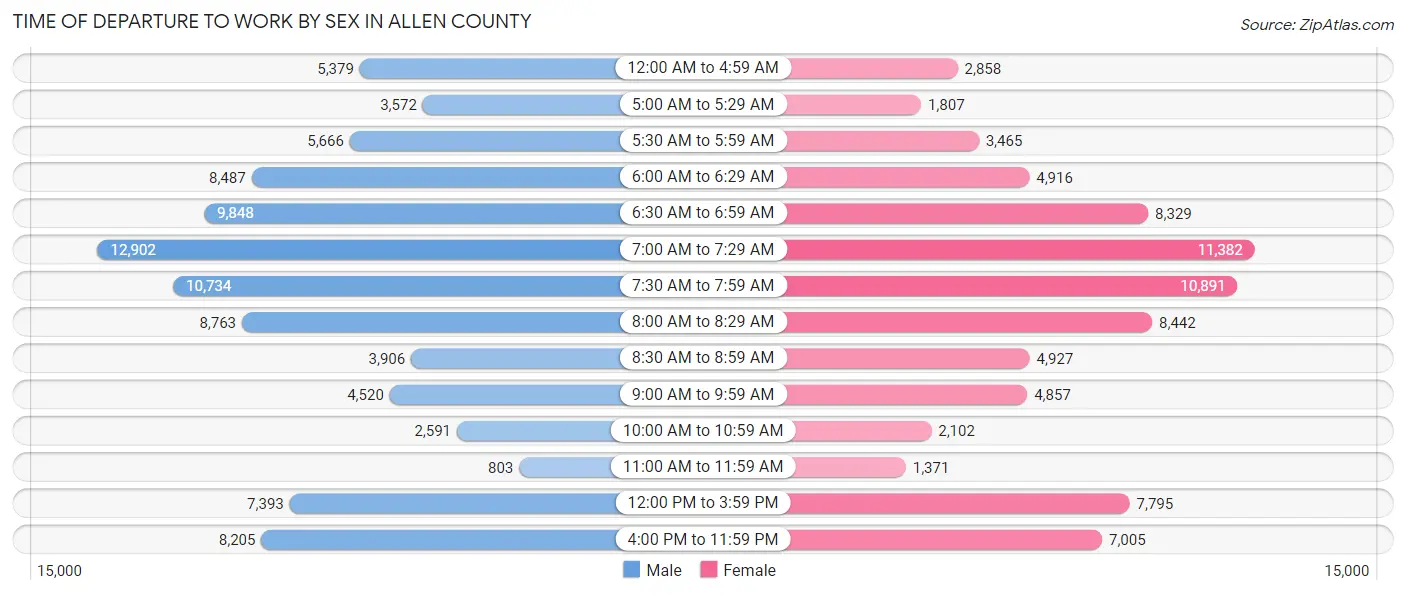
| Time of Departure | Male | Female |
| 12:00 AM to 4:59 AM | 5,379 (5.8%) | 2,858 (3.6%) |
| 5:00 AM to 5:29 AM | 3,572 (3.8%) | 1,807 (2.2%) |
| 5:30 AM to 5:59 AM | 5,666 (6.1%) | 3,465 (4.3%) |
| 6:00 AM to 6:29 AM | 8,487 (9.1%) | 4,916 (6.1%) |
| 6:30 AM to 6:59 AM | 9,848 (10.6%) | 8,329 (10.4%) |
| 7:00 AM to 7:29 AM | 12,902 (13.9%) | 11,382 (14.2%) |
| 7:30 AM to 7:59 AM | 10,734 (11.6%) | 10,891 (13.6%) |
| 8:00 AM to 8:29 AM | 8,763 (9.5%) | 8,442 (10.5%) |
| 8:30 AM to 8:59 AM | 3,906 (4.2%) | 4,927 (6.1%) |
| 9:00 AM to 9:59 AM | 4,520 (4.9%) | 4,857 (6.1%) |
| 10:00 AM to 10:59 AM | 2,591 (2.8%) | 2,102 (2.6%) |
| 11:00 AM to 11:59 AM | 803 (0.9%) | 1,371 (1.7%) |
| 12:00 PM to 3:59 PM | 7,393 (8.0%) | 7,795 (9.7%) |
| 4:00 PM to 11:59 PM | 8,205 (8.8%) | 7,005 (8.7%) |
| Total | 92,769 (100.0%) | 80,147 (100.0%) |
Housing Occupancy in Allen County
Occupancy by Ownership in Allen County
Of the total 151,877 dwellings in Allen County, owner-occupied units account for 105,530 (69.5%), while renter-occupied units make up 46,347 (30.5%).
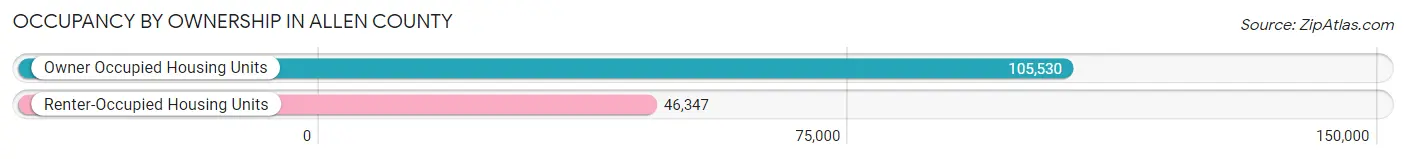
| Occupancy | # Housing Units | % Housing Units |
| Owner Occupied Housing Units | 105,530 | 69.5% |
| Renter-Occupied Housing Units | 46,347 | 30.5% |
| Total Occupied Housing Units | 151,877 | 100.0% |
Occupancy by Household Size in Allen County
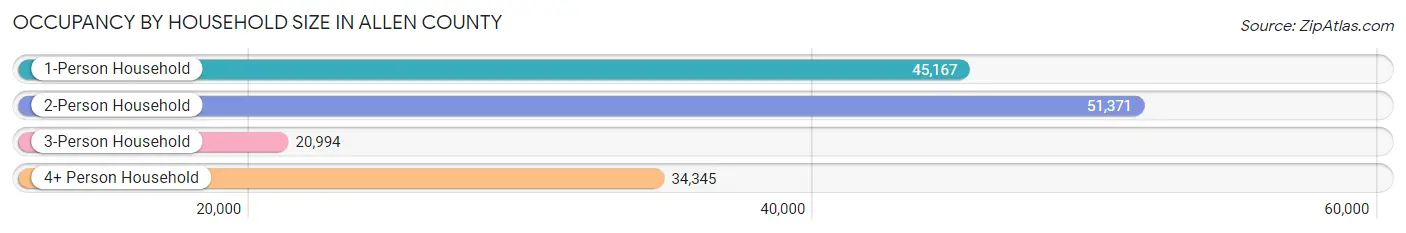
| Household Size | # Housing Units | % Housing Units |
| 1-Person Household | 45,167 | 29.7% |
| 2-Person Household | 51,371 | 33.8% |
| 3-Person Household | 20,994 | 13.8% |
| 4+ Person Household | 34,345 | 22.6% |
| Total Housing Units | 151,877 | 100.0% |
Occupancy by Ownership by Household Size in Allen County
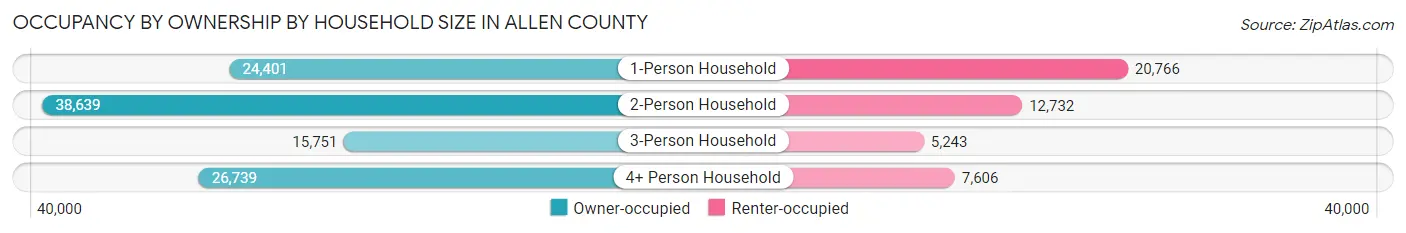
| Household Size | Owner-occupied | Renter-occupied |
| 1-Person Household | 24,401 (54.0%) | 20,766 (46.0%) |
| 2-Person Household | 38,639 (75.2%) | 12,732 (24.8%) |
| 3-Person Household | 15,751 (75.0%) | 5,243 (25.0%) |
| 4+ Person Household | 26,739 (77.8%) | 7,606 (22.2%) |
| Total Housing Units | 105,530 (69.5%) | 46,347 (30.5%) |
Occupancy by Educational Attainment in Allen County
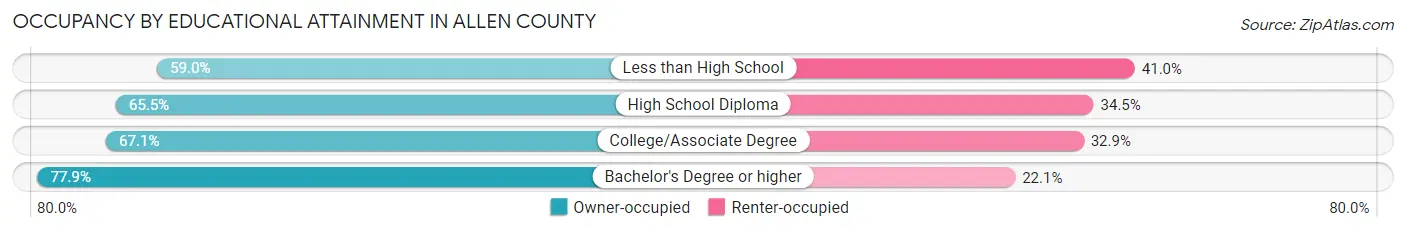
| Household Size | Owner-occupied | Renter-occupied |
| Less than High School | 7,625 (59.0%) | 5,306 (41.0%) |
| High School Diploma | 25,833 (65.5%) | 13,603 (34.5%) |
| College/Associate Degree | 33,865 (67.1%) | 16,622 (32.9%) |
| Bachelor's Degree or higher | 38,207 (77.9%) | 10,816 (22.1%) |
Occupancy by Age of Householder in Allen County
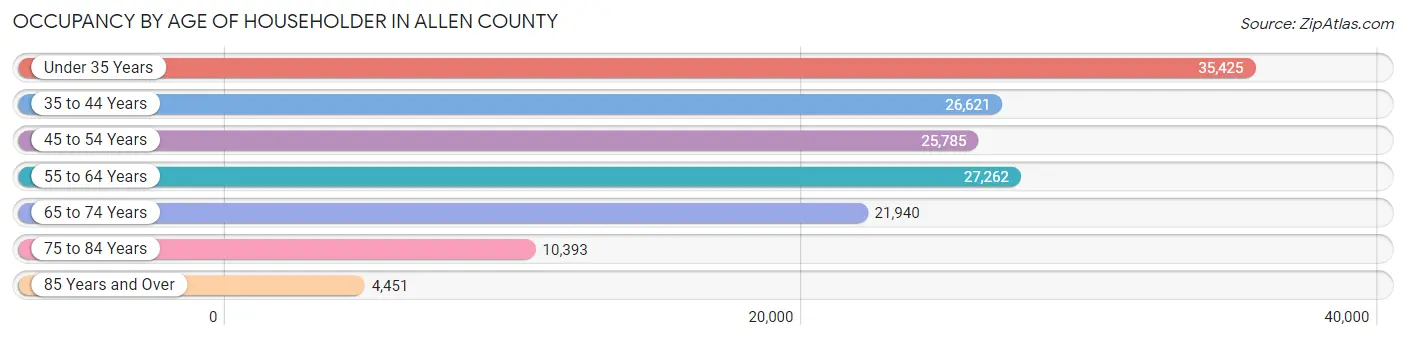
| Age Bracket | # Households | % Households |
| Under 35 Years | 35,425 | 23.3% |
| 35 to 44 Years | 26,621 | 17.5% |
| 45 to 54 Years | 25,785 | 17.0% |
| 55 to 64 Years | 27,262 | 17.9% |
| 65 to 74 Years | 21,940 | 14.4% |
| 75 to 84 Years | 10,393 | 6.8% |
| 85 Years and Over | 4,451 | 2.9% |
| Total | 151,877 | 100.0% |
Housing Finances in Allen County
Median Income by Occupancy in Allen County
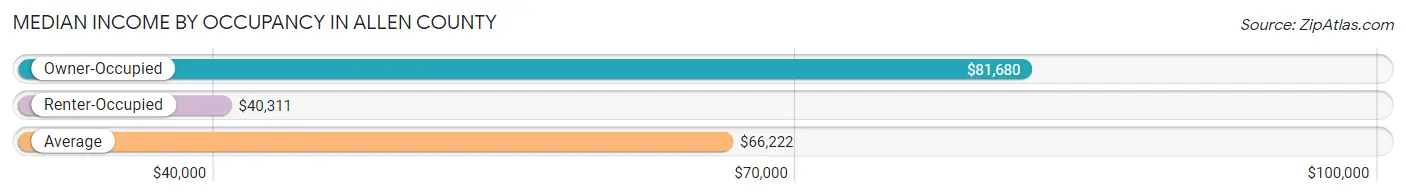
| Occupancy Type | # Households | Median Income |
| Owner-Occupied | 105,530 (69.5%) | $81,680 |
| Renter-Occupied | 46,347 (30.5%) | $40,311 |
| Average | 151,877 (100.0%) | $66,222 |
Occupancy by Householder Income Bracket in Allen County
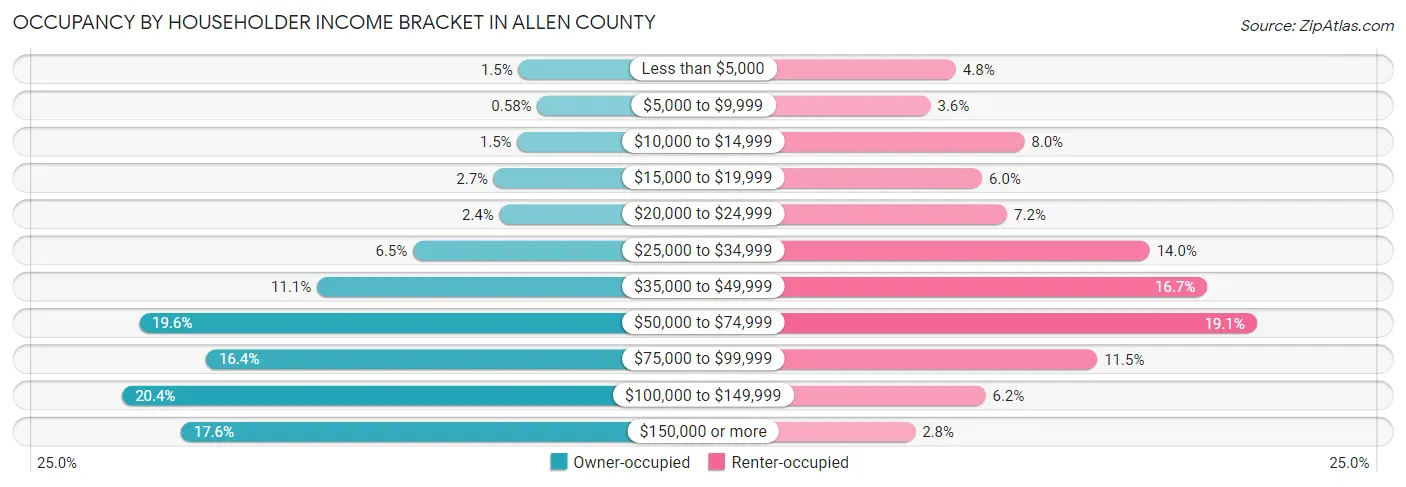
| Income Bracket | Owner-occupied | Renter-occupied |
| Less than $5,000 | 1,557 (1.5%) | 2,214 (4.8%) |
| $5,000 to $9,999 | 615 (0.6%) | 1,654 (3.6%) |
| $10,000 to $14,999 | 1,611 (1.5%) | 3,724 (8.0%) |
| $15,000 to $19,999 | 2,792 (2.6%) | 2,795 (6.0%) |
| $20,000 to $24,999 | 2,507 (2.4%) | 3,344 (7.2%) |
| $25,000 to $34,999 | 6,864 (6.5%) | 6,491 (14.0%) |
| $35,000 to $49,999 | 11,686 (11.1%) | 7,758 (16.7%) |
| $50,000 to $74,999 | 20,627 (19.6%) | 8,851 (19.1%) |
| $75,000 to $99,999 | 17,265 (16.4%) | 5,333 (11.5%) |
| $100,000 to $149,999 | 21,472 (20.3%) | 2,867 (6.2%) |
| $150,000 or more | 18,534 (17.6%) | 1,316 (2.8%) |
| Total | 105,530 (100.0%) | 46,347 (100.0%) |
Monthly Housing Cost Tiers in Allen County
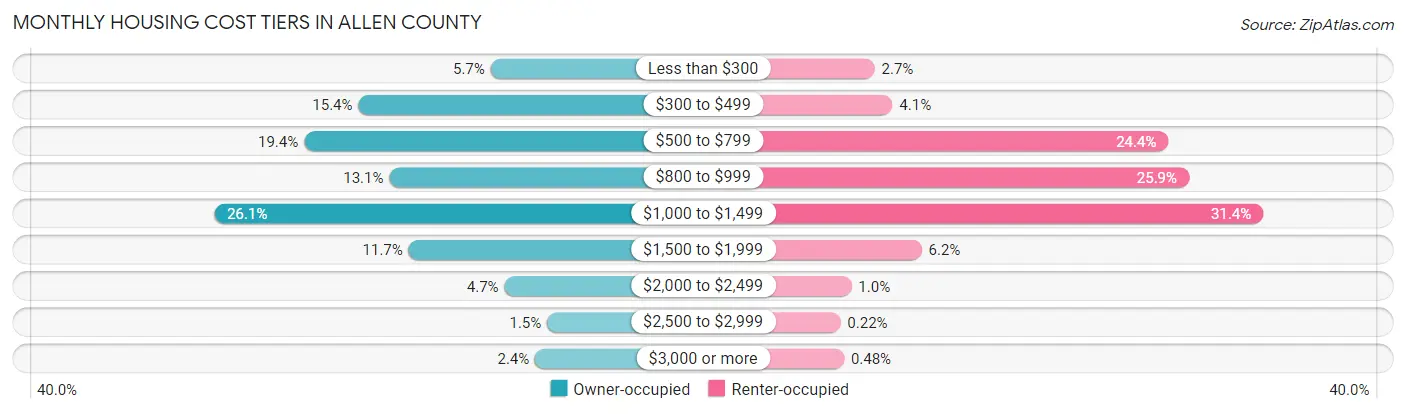
| Monthly Cost | Owner-occupied | Renter-occupied |
| Less than $300 | 5,991 (5.7%) | 1,272 (2.7%) |
| $300 to $499 | 16,275 (15.4%) | 1,876 (4.1%) |
| $500 to $799 | 20,495 (19.4%) | 11,290 (24.4%) |
| $800 to $999 | 13,862 (13.1%) | 11,996 (25.9%) |
| $1,000 to $1,499 | 27,491 (26.1%) | 14,530 (31.4%) |
| $1,500 to $1,999 | 12,372 (11.7%) | 2,873 (6.2%) |
| $2,000 to $2,499 | 4,913 (4.7%) | 477 (1.0%) |
| $2,500 to $2,999 | 1,601 (1.5%) | 102 (0.2%) |
| $3,000 or more | 2,530 (2.4%) | 223 (0.5%) |
| Total | 105,530 (100.0%) | 46,347 (100.0%) |
Physical Housing Characteristics in Allen County
Housing Structures in Allen County
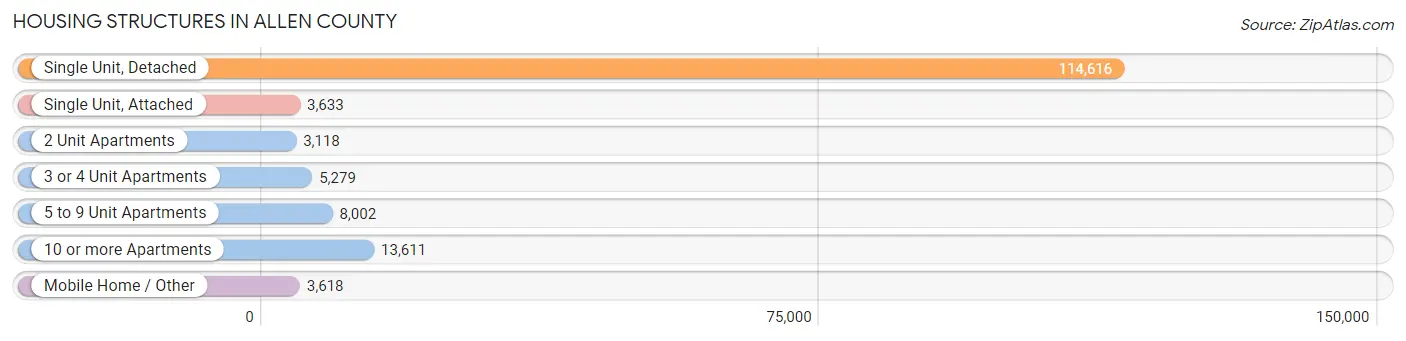
| Structure Type | # Housing Units | % Housing Units |
| Single Unit, Detached | 114,616 | 75.5% |
| Single Unit, Attached | 3,633 | 2.4% |
| 2 Unit Apartments | 3,118 | 2.1% |
| 3 or 4 Unit Apartments | 5,279 | 3.5% |
| 5 to 9 Unit Apartments | 8,002 | 5.3% |
| 10 or more Apartments | 13,611 | 9.0% |
| Mobile Home / Other | 3,618 | 2.4% |
| Total | 151,877 | 100.0% |
Housing Structures by Occupancy in Allen County
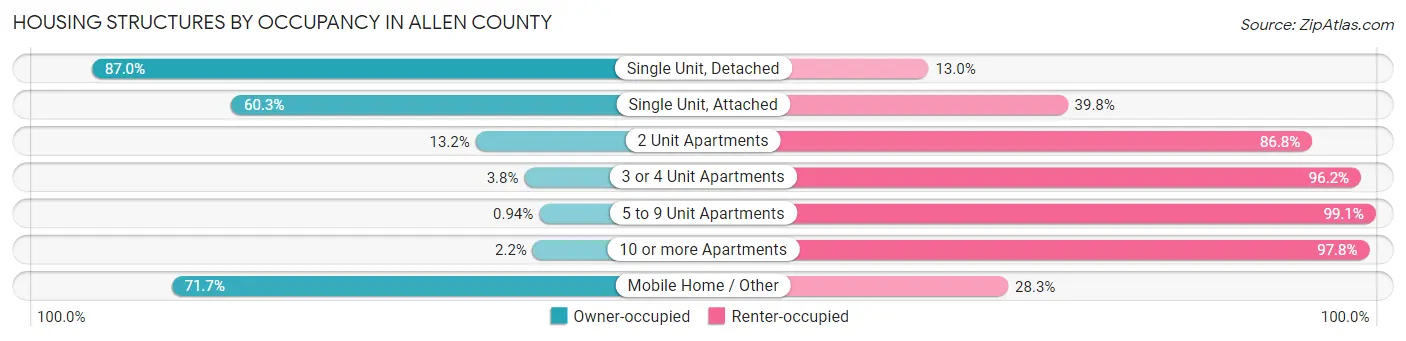
| Structure Type | Owner-occupied | Renter-occupied |
| Single Unit, Detached | 99,764 (87.0%) | 14,852 (13.0%) |
| Single Unit, Attached | 2,189 (60.3%) | 1,444 (39.8%) |
| 2 Unit Apartments | 411 (13.2%) | 2,707 (86.8%) |
| 3 or 4 Unit Apartments | 200 (3.8%) | 5,079 (96.2%) |
| 5 to 9 Unit Apartments | 75 (0.9%) | 7,927 (99.1%) |
| 10 or more Apartments | 297 (2.2%) | 13,314 (97.8%) |
| Mobile Home / Other | 2,594 (71.7%) | 1,024 (28.3%) |
| Total | 105,530 (69.5%) | 46,347 (30.5%) |
Housing Structures by Number of Rooms in Allen County
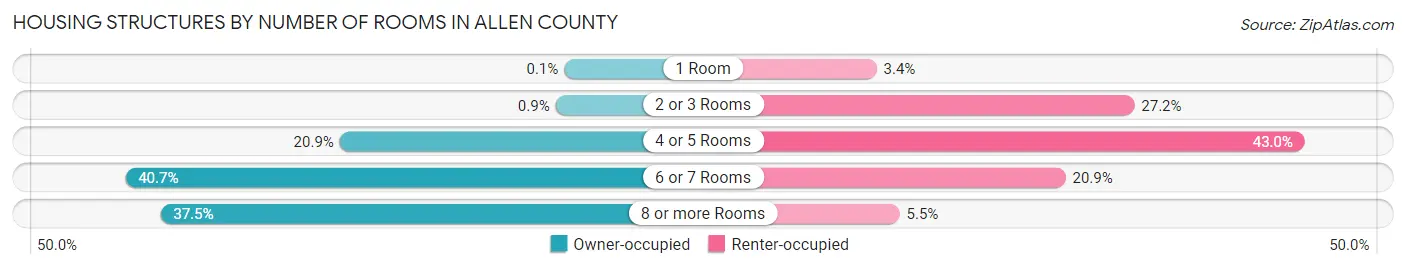
| Number of Rooms | Owner-occupied | Renter-occupied |
| 1 Room | 103 (0.1%) | 1,570 (3.4%) |
| 2 or 3 Rooms | 955 (0.9%) | 12,622 (27.2%) |
| 4 or 5 Rooms | 22,017 (20.9%) | 19,924 (43.0%) |
| 6 or 7 Rooms | 42,938 (40.7%) | 9,672 (20.9%) |
| 8 or more Rooms | 39,517 (37.4%) | 2,559 (5.5%) |
| Total | 105,530 (100.0%) | 46,347 (100.0%) |
Housing Structure by Heating Type in Allen County
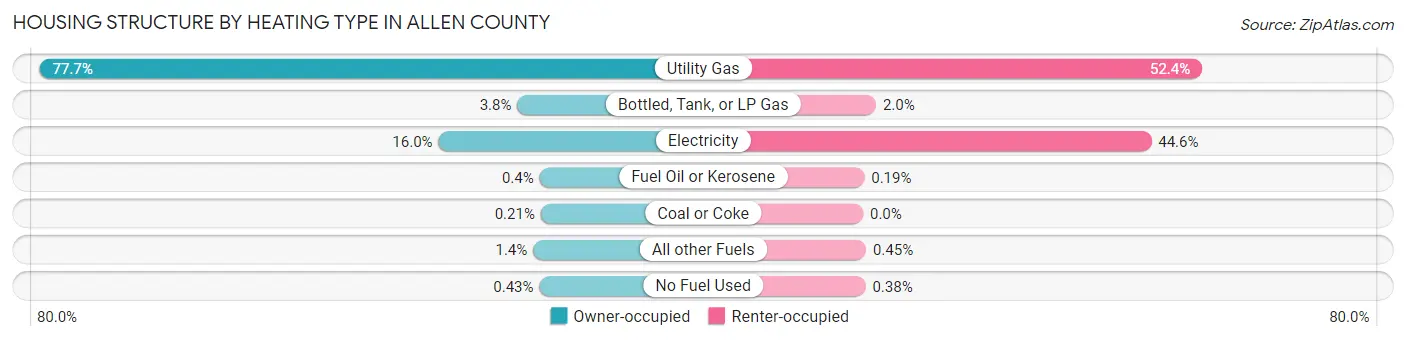
| Heating Type | Owner-occupied | Renter-occupied |
| Utility Gas | 81,983 (77.7%) | 24,288 (52.4%) |
| Bottled, Tank, or LP Gas | 4,057 (3.8%) | 929 (2.0%) |
| Electricity | 16,920 (16.0%) | 20,653 (44.6%) |
| Fuel Oil or Kerosene | 426 (0.4%) | 90 (0.2%) |
| Coal or Coke | 222 (0.2%) | 0 (0.0%) |
| All other Fuels | 1,466 (1.4%) | 210 (0.4%) |
| No Fuel Used | 456 (0.4%) | 177 (0.4%) |
| Total | 105,530 (100.0%) | 46,347 (100.0%) |
Household Vehicle Usage in Allen County
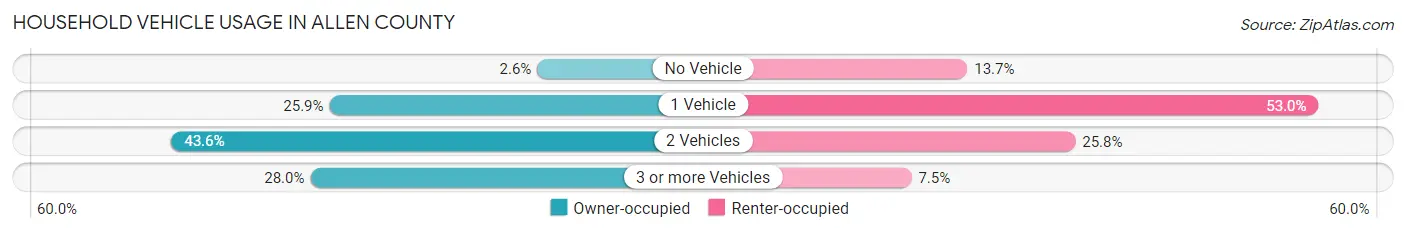
| Vehicles per Household | Owner-occupied | Renter-occupied |
| No Vehicle | 2,723 (2.6%) | 6,352 (13.7%) |
| 1 Vehicle | 27,289 (25.9%) | 24,579 (53.0%) |
| 2 Vehicles | 45,971 (43.6%) | 11,962 (25.8%) |
| 3 or more Vehicles | 29,547 (28.0%) | 3,454 (7.4%) |
| Total | 105,530 (100.0%) | 46,347 (100.0%) |
Real Estate & Mortgages in Allen County
Real Estate and Mortgage Overview in Allen County
| Characteristic | Without Mortgage | With Mortgage |
| Housing Units | 36,707 | 68,823 |
| Median Property Value | $161,000 | $179,500 |
| Median Household Income | $63,324 | $13,647 |
| Monthly Housing Costs | $461 | $2,436 |
| Real Estate Taxes | $1,359 | $2,034 |
Property Value by Mortgage Status in Allen County
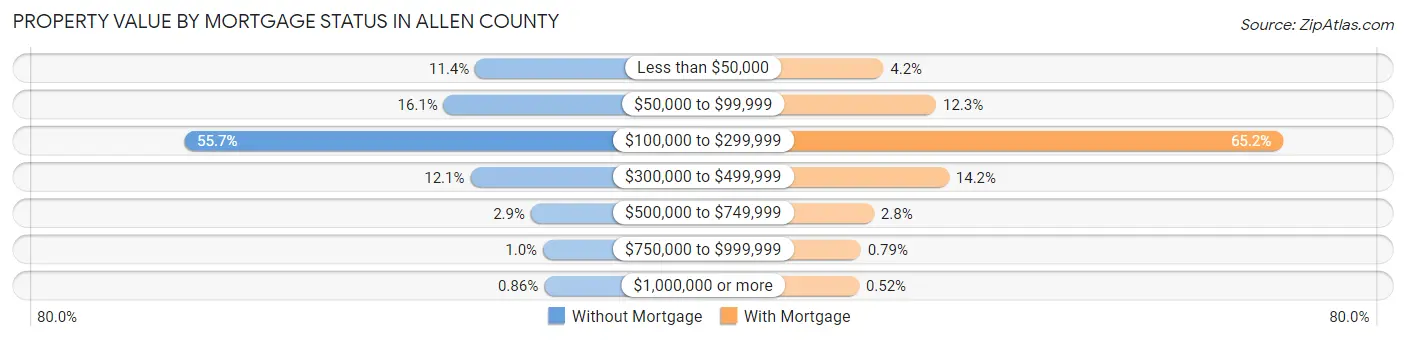
| Property Value | Without Mortgage | With Mortgage |
| Less than $50,000 | 4,168 (11.4%) | 2,918 (4.2%) |
| $50,000 to $99,999 | 5,923 (16.1%) | 8,442 (12.3%) |
| $100,000 to $299,999 | 20,438 (55.7%) | 44,846 (65.2%) |
| $300,000 to $499,999 | 4,433 (12.1%) | 9,788 (14.2%) |
| $500,000 to $749,999 | 1,053 (2.9%) | 1,929 (2.8%) |
| $750,000 to $999,999 | 376 (1.0%) | 544 (0.8%) |
| $1,000,000 or more | 316 (0.9%) | 356 (0.5%) |
| Total | 36,707 (100.0%) | 68,823 (100.0%) |
Household Income by Mortgage Status in Allen County
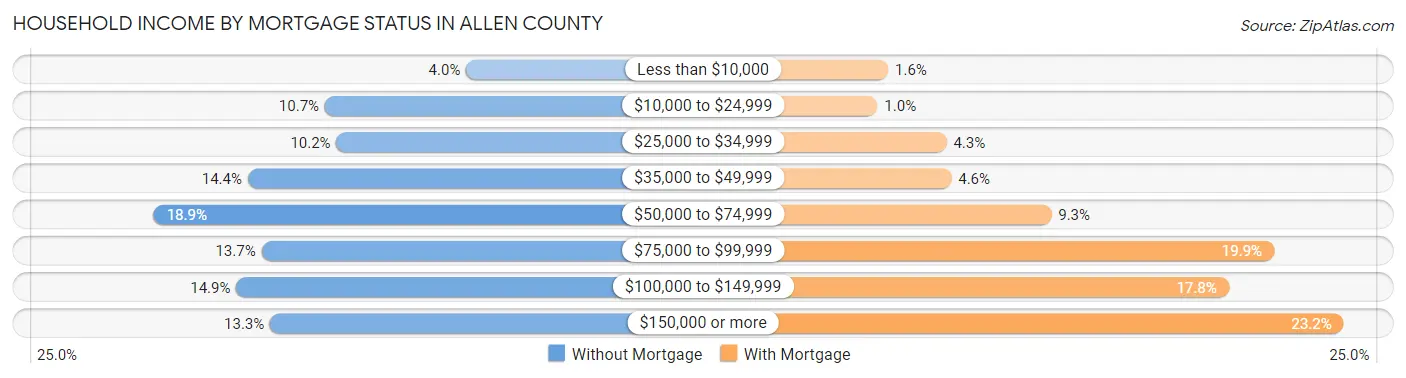
| Household Income | Without Mortgage | With Mortgage |
| Less than $10,000 | 1,459 (4.0%) | 1,068 (1.5%) |
| $10,000 to $24,999 | 3,927 (10.7%) | 713 (1.0%) |
| $25,000 to $34,999 | 3,727 (10.2%) | 2,983 (4.3%) |
| $35,000 to $49,999 | 5,273 (14.4%) | 3,137 (4.6%) |
| $50,000 to $74,999 | 6,919 (18.9%) | 6,413 (9.3%) |
| $75,000 to $99,999 | 5,037 (13.7%) | 13,708 (19.9%) |
| $100,000 to $149,999 | 5,478 (14.9%) | 12,228 (17.8%) |
| $150,000 or more | 4,887 (13.3%) | 15,994 (23.2%) |
| Total | 36,707 (100.0%) | 68,823 (100.0%) |
Property Value to Household Income Ratio in Allen County
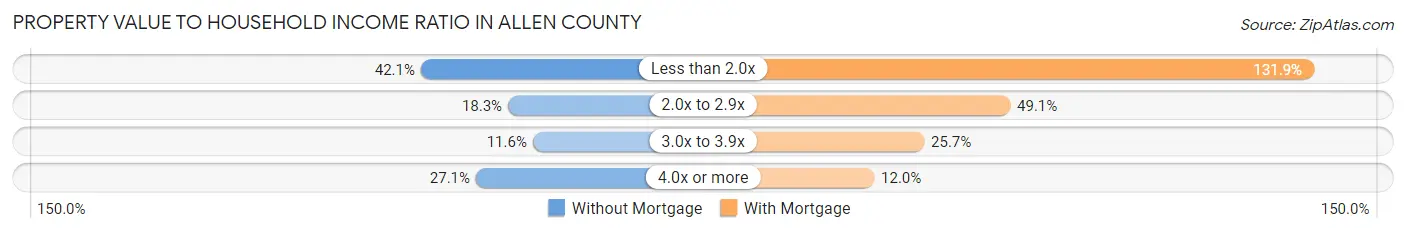
| Value-to-Income Ratio | Without Mortgage | With Mortgage |
| Less than 2.0x | 15,447 (42.1%) | 90,745 (131.9%) |
| 2.0x to 2.9x | 6,730 (18.3%) | 33,787 (49.1%) |
| 3.0x to 3.9x | 4,251 (11.6%) | 17,660 (25.7%) |
| 4.0x or more | 9,935 (27.1%) | 8,288 (12.0%) |
| Total | 36,707 (100.0%) | 68,823 (100.0%) |
Real Estate Taxes by Mortgage Status in Allen County
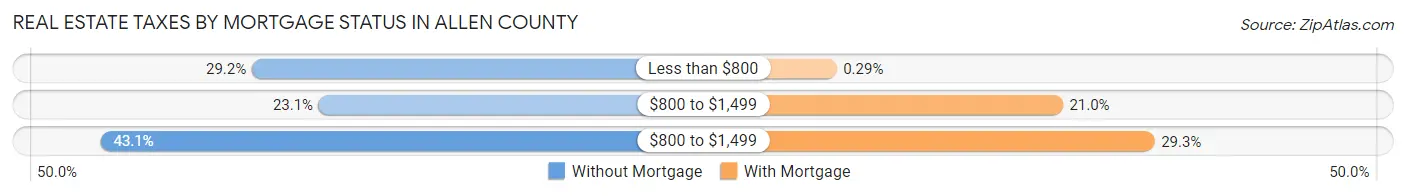
| Property Taxes | Without Mortgage | With Mortgage |
| Less than $800 | 10,728 (29.2%) | 197 (0.3%) |
| $800 to $1,499 | 8,488 (23.1%) | 14,420 (20.9%) |
| $800 to $1,499 | 15,808 (43.1%) | 20,189 (29.3%) |
| Total | 36,707 (100.0%) | 68,823 (100.0%) |
Health & Disability in Allen County
Health Insurance Coverage by Age in Allen County
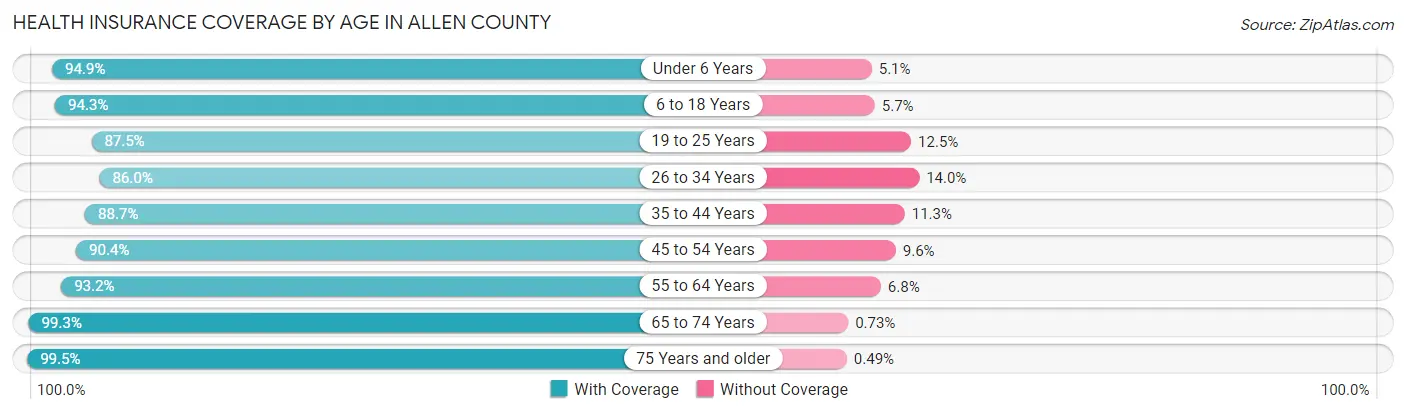
| Age Bracket | With Coverage | Without Coverage |
| Under 6 Years | 30,016 (94.9%) | 1,623 (5.1%) |
| 6 to 18 Years | 67,107 (94.3%) | 4,048 (5.7%) |
| 19 to 25 Years | 31,453 (87.5%) | 4,480 (12.5%) |
| 26 to 34 Years | 41,278 (86.0%) | 6,703 (14.0%) |
| 35 to 44 Years | 42,597 (88.7%) | 5,419 (11.3%) |
| 45 to 54 Years | 40,857 (90.4%) | 4,346 (9.6%) |
| 55 to 64 Years | 42,650 (93.2%) | 3,127 (6.8%) |
| 65 to 74 Years | 34,079 (99.3%) | 249 (0.7%) |
| 75 Years and older | 21,623 (99.5%) | 107 (0.5%) |
| Total | 351,660 (92.1%) | 30,102 (7.9%) |
Health Insurance Coverage by Citizenship Status in Allen County
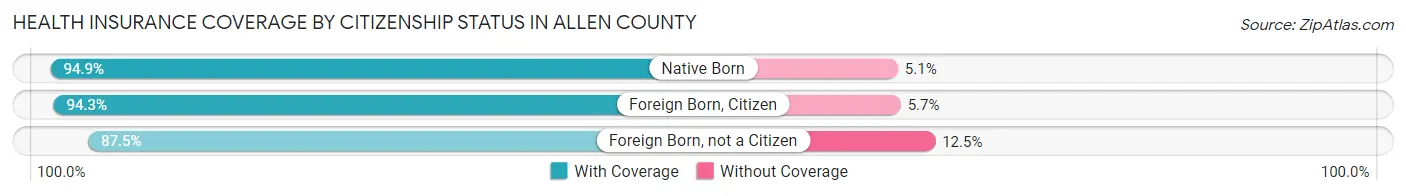
| Citizenship Status | With Coverage | Without Coverage |
| Native Born | 30,016 (94.9%) | 1,623 (5.1%) |
| Foreign Born, Citizen | 67,107 (94.3%) | 4,048 (5.7%) |
| Foreign Born, not a Citizen | 31,453 (87.5%) | 4,480 (12.5%) |
Health Insurance Coverage by Household Income in Allen County
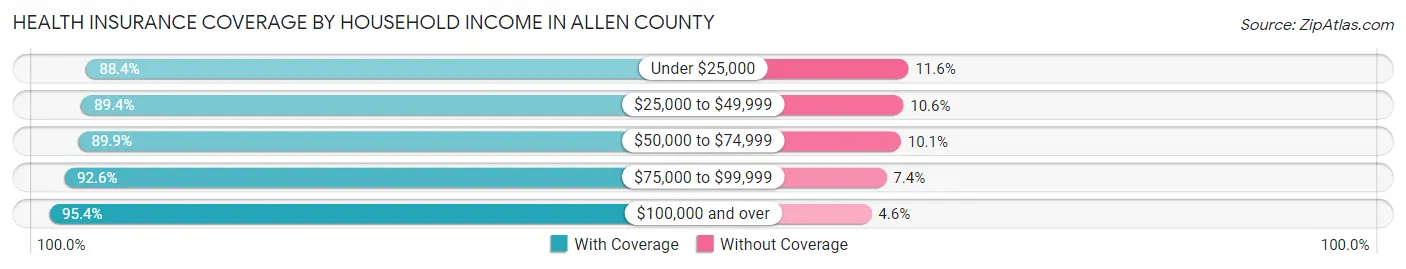
| Household Income | With Coverage | Without Coverage |
| Under $25,000 | 34,806 (88.4%) | 4,548 (11.6%) |
| $25,000 to $49,999 | 59,728 (89.4%) | 7,070 (10.6%) |
| $50,000 to $74,999 | 65,382 (89.9%) | 7,361 (10.1%) |
| $75,000 to $99,999 | 57,163 (92.6%) | 4,583 (7.4%) |
| $100,000 and over | 132,588 (95.4%) | 6,411 (4.6%) |
Public vs Private Health Insurance Coverage by Age in Allen County
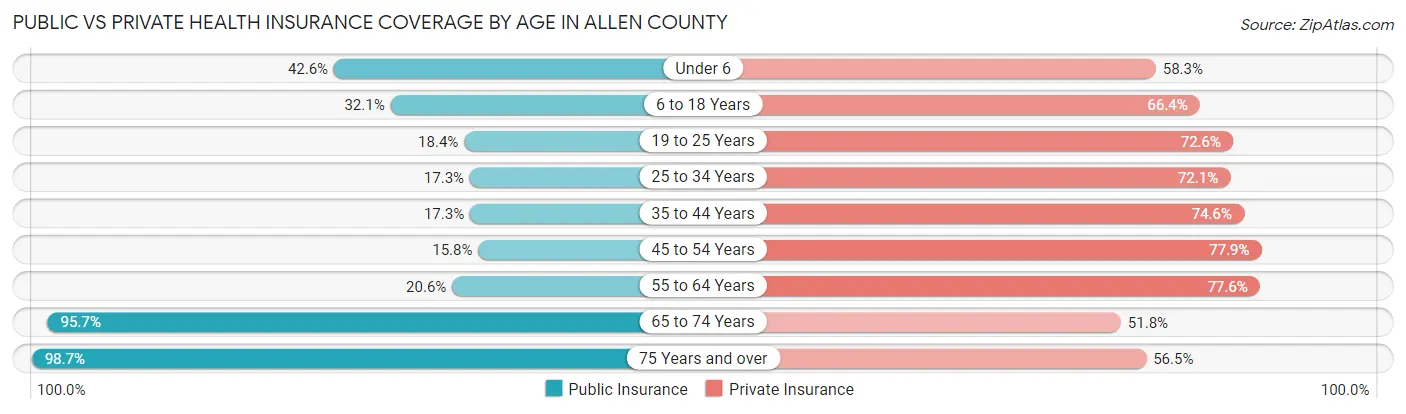
| Age Bracket | Public Insurance | Private Insurance |
| Under 6 | 13,473 (42.6%) | 18,440 (58.3%) |
| 6 to 18 Years | 22,837 (32.1%) | 47,257 (66.4%) |
| 19 to 25 Years | 6,615 (18.4%) | 26,077 (72.6%) |
| 25 to 34 Years | 8,321 (17.3%) | 34,572 (72.1%) |
| 35 to 44 Years | 8,321 (17.3%) | 35,827 (74.6%) |
| 45 to 54 Years | 7,139 (15.8%) | 35,198 (77.9%) |
| 55 to 64 Years | 9,448 (20.6%) | 35,503 (77.6%) |
| 65 to 74 Years | 32,864 (95.7%) | 17,785 (51.8%) |
| 75 Years and over | 21,443 (98.7%) | 12,279 (56.5%) |
| Total | 130,461 (34.2%) | 262,938 (68.9%) |
Disability Status by Sex by Age in Allen County
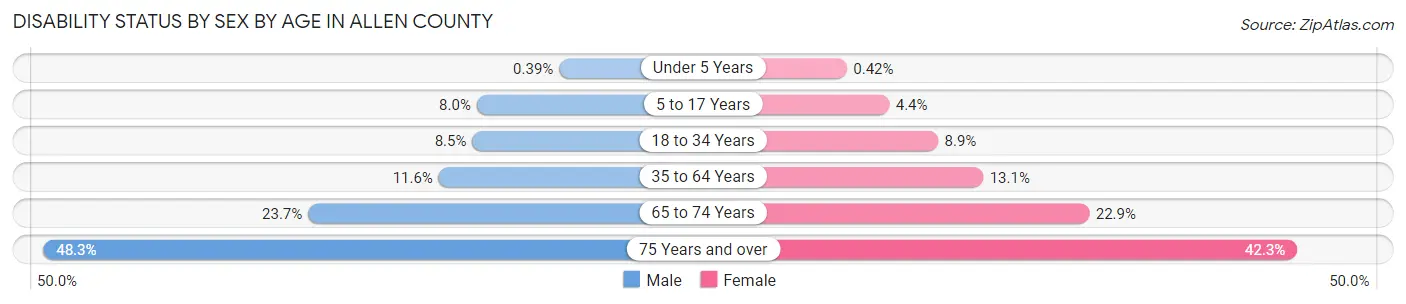
| Age Bracket | Male | Female |
| Under 5 Years | 53 (0.4%) | 54 (0.4%) |
| 5 to 17 Years | 2,934 (8.0%) | 1,524 (4.4%) |
| 18 to 34 Years | 3,734 (8.5%) | 3,983 (8.9%) |
| 35 to 64 Years | 7,966 (11.6%) | 9,177 (13.1%) |
| 65 to 74 Years | 3,822 (23.7%) | 4,170 (22.9%) |
| 75 Years and over | 4,235 (48.3%) | 5,474 (42.3%) |
Disability Class by Sex by Age in Allen County
Disability Class: Hearing Difficulty
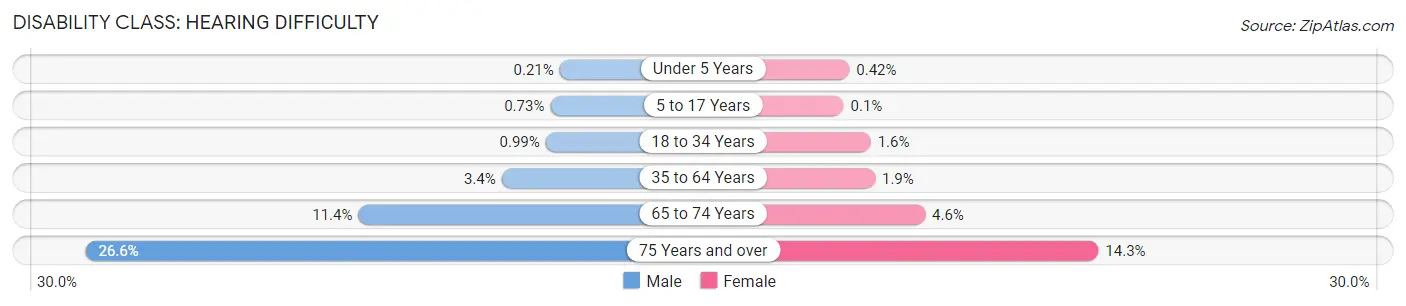
| Age Bracket | Male | Female |
| Under 5 Years | 29 (0.2%) | 54 (0.4%) |
| 5 to 17 Years | 265 (0.7%) | 35 (0.1%) |
| 18 to 34 Years | 439 (1.0%) | 720 (1.6%) |
| 35 to 64 Years | 2,371 (3.4%) | 1,297 (1.8%) |
| 65 to 74 Years | 1,842 (11.4%) | 844 (4.6%) |
| 75 Years and over | 2,335 (26.6%) | 1,851 (14.3%) |
Disability Class: Vision Difficulty
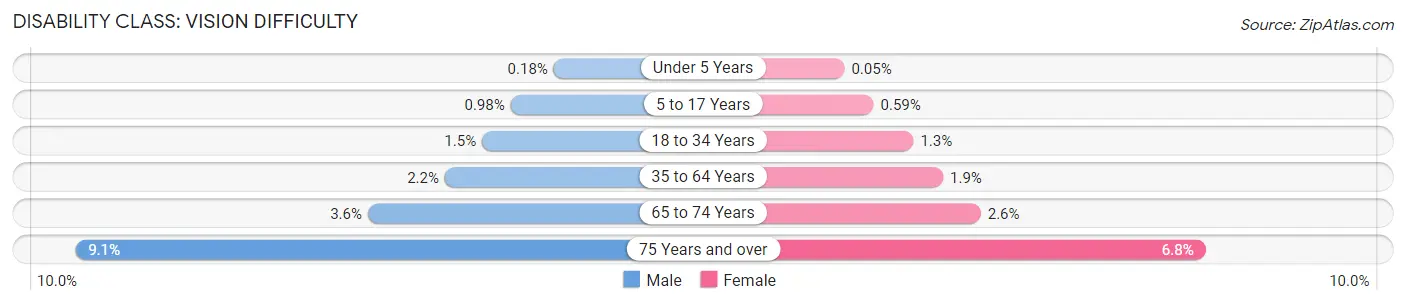
| Age Bracket | Male | Female |
| Under 5 Years | 24 (0.2%) | 6 (0.1%) |
| 5 to 17 Years | 358 (1.0%) | 206 (0.6%) |
| 18 to 34 Years | 667 (1.5%) | 597 (1.3%) |
| 35 to 64 Years | 1,517 (2.2%) | 1,320 (1.9%) |
| 65 to 74 Years | 585 (3.6%) | 469 (2.6%) |
| 75 Years and over | 795 (9.1%) | 874 (6.8%) |
Disability Class: Cognitive Difficulty
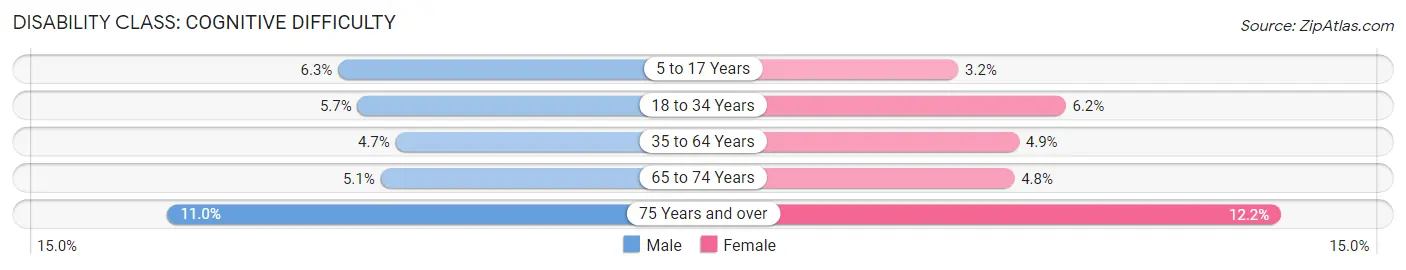
| Age Bracket | Male | Female |
| 5 to 17 Years | 2,291 (6.3%) | 1,134 (3.2%) |
| 18 to 34 Years | 2,531 (5.7%) | 2,789 (6.2%) |
| 35 to 64 Years | 3,217 (4.7%) | 3,460 (4.9%) |
| 65 to 74 Years | 822 (5.1%) | 874 (4.8%) |
| 75 Years and over | 967 (11.0%) | 1,584 (12.2%) |
Disability Class: Ambulatory Difficulty
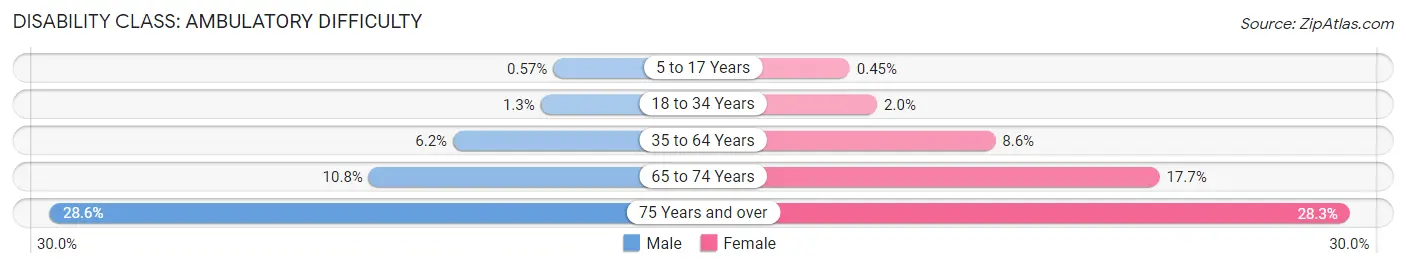
| Age Bracket | Male | Female |
| 5 to 17 Years | 209 (0.6%) | 156 (0.4%) |
| 18 to 34 Years | 559 (1.3%) | 882 (2.0%) |
| 35 to 64 Years | 4,235 (6.1%) | 6,000 (8.6%) |
| 65 to 74 Years | 1,749 (10.8%) | 3,219 (17.7%) |
| 75 Years and over | 2,508 (28.6%) | 3,664 (28.3%) |
Disability Class: Self-Care Difficulty
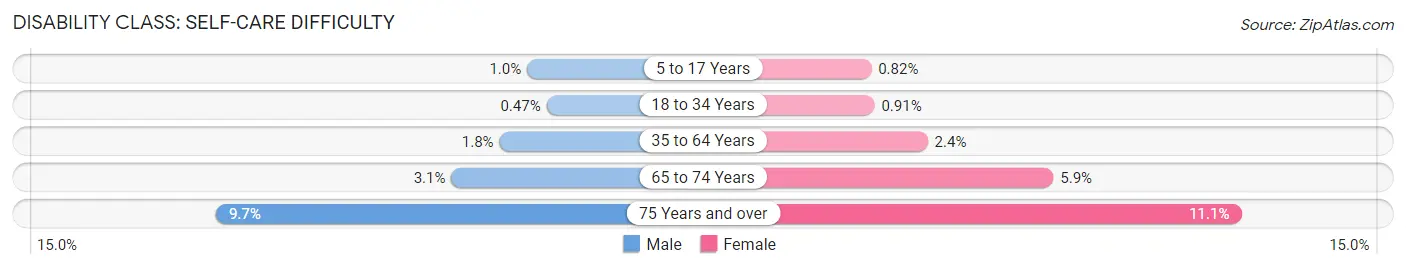
| Age Bracket | Male | Female |
| 5 to 17 Years | 367 (1.0%) | 287 (0.8%) |
| 18 to 34 Years | 206 (0.5%) | 406 (0.9%) |
| 35 to 64 Years | 1,229 (1.8%) | 1,678 (2.4%) |
| 65 to 74 Years | 503 (3.1%) | 1,071 (5.9%) |
| 75 Years and over | 849 (9.7%) | 1,441 (11.1%) |
Technology Access in Allen County
Computing Device Access in Allen County
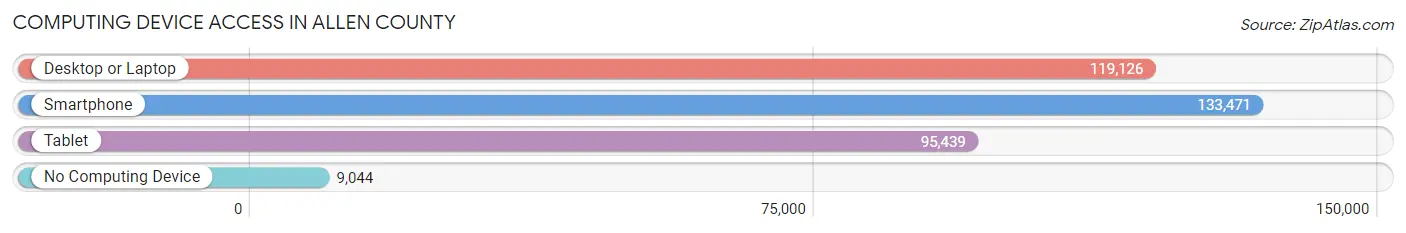
| Device Type | # Households | % Households |
| Desktop or Laptop | 119,126 | 78.4% |
| Smartphone | 133,471 | 87.9% |
| Tablet | 95,439 | 62.8% |
| No Computing Device | 9,044 | 5.9% |
| Total | 151,877 | 100.0% |
Internet Access in Allen County
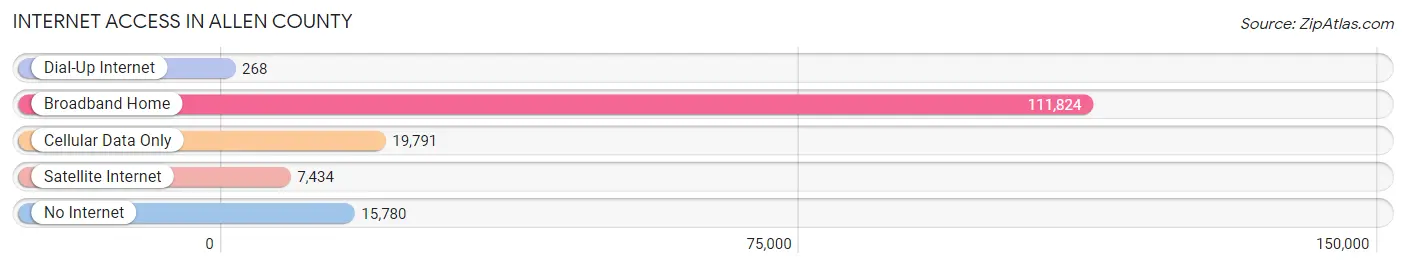
| Internet Type | # Households | % Households |
| Dial-Up Internet | 268 | 0.2% |
| Broadband Home | 111,824 | 73.6% |
| Cellular Data Only | 19,791 | 13.0% |
| Satellite Internet | 7,434 | 4.9% |
| No Internet | 15,780 | 10.4% |
| Total | 151,877 | 100.0% |
Allen County Summary
Allen County, Indiana is located in the northeastern corner of the state and is part of the Fort Wayne metropolitan area. It is bordered by Adams, Wells, and Whitley counties to the north, DeKalb County to the east, Huntington and Whitley counties to the south, and Adams and Van Wert counties to the west. The county seat is Fort Wayne, the second largest city in Indiana.
History
Allen County was established in 1823 and named after Colonel John Allen, a Revolutionary War hero. The county was originally part of the Northwest Territory and was part of the Indiana Territory when it was formed in 1800. The first settlers arrived in the area in 1815 and the county was officially organized in 1823.
The county was home to several Native American tribes, including the Miami, Potawatomi, and Shawnee. The first non-Native American settlers arrived in the area in 1815 and the county was officially organized in 1823.
The county was an important part of the Underground Railroad, with many of the county's residents helping to hide and transport escaped slaves. The county was also home to several important Civil War battles, including the Battle of Fort Wayne and the Battle of Fort Harrison.
Geography
Allen County covers an area of 576 square miles and is located in the northeastern corner of Indiana. It is bordered by Adams, Wells, and Whitley counties to the north, DeKalb County to the east, Huntington and Whitley counties to the south, and Adams and Van Wert counties to the west. The county seat is Fort Wayne, the second largest city in Indiana.
The county is mostly flat with some rolling hills in the northern and western parts. The St. Joseph River runs through the county and is a major source of recreation. The county is also home to several lakes, including Lake George, Lake Pleasant, and Lake Wawasee.
Economy
Allen County has a diverse economy with a mix of manufacturing, healthcare, education, and service industries. The county is home to several major employers, including General Motors, Parkview Health, and Steel Dynamics.
The county is also home to several universities and colleges, including Indiana University-Purdue University Fort Wayne, Indiana Institute of Technology, and Ivy Tech Community College.
Demographics
As of the 2010 census, Allen County had a population of 355,329. The population was spread out with 24.3% under the age of 18, 10.2% from 18 to 24, 28.2% from 25 to 44, 24.2% from 45 to 64, and 13.1% who were 65 years of age or older. The median age was 36.3 years.
The racial makeup of the county was 79.2% White, 11.7% African American, 0.4% Native American, 2.2% Asian, 0.1% Pacific Islander, 4.2% from other races, and 2.2% from two or more races. Hispanic or Latino of any race were 8.2% of the population.
The median income for a household in the county was $48,927 and the median income for a family was $60,945. The per capita income for the county was $25,945. About 8.7% of families and 11.7% of the population were below the poverty line, including 16.2% of those under age 18 and 6.2% of those age 65 or over.
Common Questions
What is the Total Population of Allen County?
Total Population of Allen County is 385,456.
What is the Total Male Population of Allen County?
Total Male Population of Allen County is 189,922.
What is the Total Female Population of Allen County?
Total Female Population of Allen County is 195,534.
What is the Ratio of Males per 100 Females in Allen County?
There are 97.13 Males per 100 Females in Allen County.
What is the Ratio of Females per 100 Males in Allen County?
There are 102.95 Females per 100 Males in Allen County.
What is the Median Population Age in Allen County?
Median Population Age in Allen County is 36.1 Years.
What is the Average Family Size in Allen County
Average Family Size in Allen County is 3.1 People.
What is the Average Household Size in Allen County
Average Household Size in Allen County is 2.5 People.
What is Per Capita Income in Allen County?
Per Capita income in Allen County is $35,389.
What is the Median Family Income in Allen County?
Median Family Income in Allen County is $83,250.
What is the Median Household income in Allen County?
Median Household Income in Allen County is $66,222.
What is Income or Wage Gap in Allen County?
Income or Wage Gap in Allen County is 32.9%.
Women in Allen County earn 67.1 cents for every dollar earned by a man.
What is Family Income Deficit in Allen County?
Family Income Deficit in Allen County is $10,748.
Families that are below poverty line in Allen County earn $10,748 less on average than the poverty threshold level.
What is Inequality or Gini Index in Allen County?
Inequality or Gini Index in Allen County is 0.45.
How Large is the Labor Force in Allen County?
There are 199,694 People in the Labor Forcein in Allen County.
What is the Percentage of People in the Labor Force in Allen County?
66.8% of People are in the Labor Force in Allen County.
What is the Unemployment Rate in Allen County?
Unemployment Rate in Allen County is 4.8%.