Panthersville, GA
Panthersville Map
Panthersville Overview
9,197
TOTAL POPULATION
4,293
MALE POPULATION
4,904
FEMALE POPULATION
87.54
MALES / 100 FEMALES
114.23
FEMALES / 100 MALES
41.9
MEDIAN AGE
3.0
AVG FAMILY SIZE
2.3
AVG HOUSEHOLD SIZE
$33,152
PER CAPITA INCOME
$64,183
AVG FAMILY INCOME
$48,876
AVG HOUSEHOLD INCOME
2.8%
WAGE / INCOME GAP [ % ]
97.2¢/ $1
WAGE / INCOME GAP [ $ ]
0.51
INEQUALITY / GINI INDEX
4,796
LABOR FORCE [ PEOPLE ]
64.5%
PERCENT IN LABOR FORCE
6.7%
UNEMPLOYMENT RATE
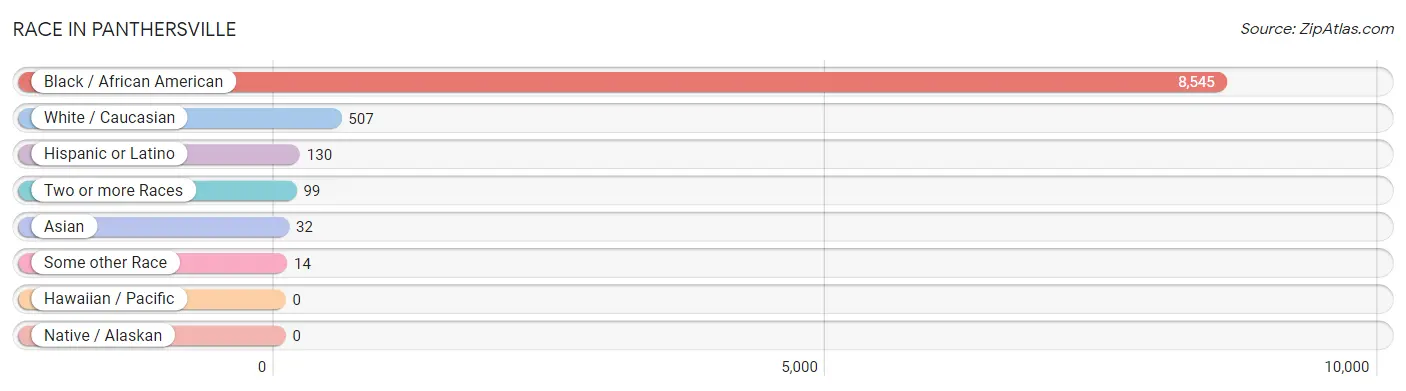
Race in Panthersville
The most populous races in Panthersville are Black / African American (8,545 | 92.9%), White / Caucasian (507 | 5.5%), and Hispanic or Latino (130 | 1.4%).
| Race | # Population | % Population |
| Asian | 32 | 0.4% |
| Black / African American | 8,545 | 92.9% |
| Hawaiian / Pacific | 0 | 0.0% |
| Hispanic or Latino | 130 | 1.4% |
| Native / Alaskan | 0 | 0.0% |
| White / Caucasian | 507 | 5.5% |
| Two or more Races | 99 | 1.1% |
| Some other Race | 14 | 0.2% |
| Total | 9,197 | 100.0% |
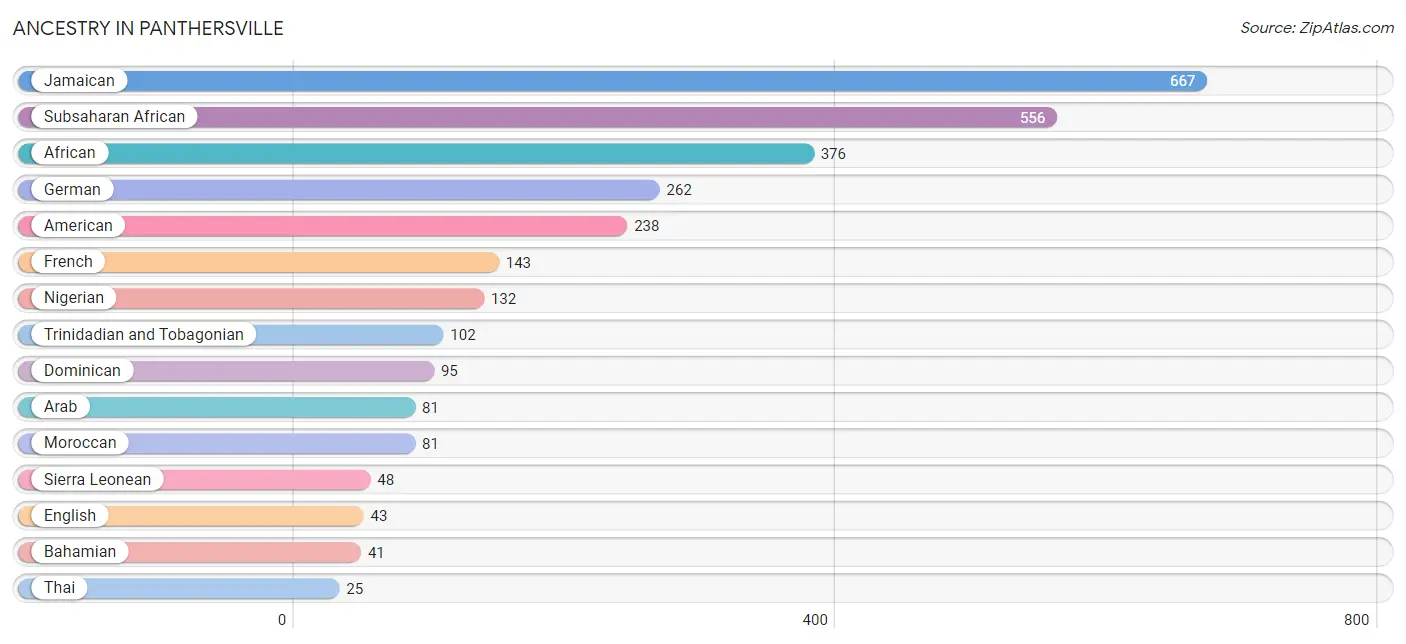
Ancestry in Panthersville
The most populous ancestries reported in Panthersville are Jamaican (667 | 7.2%), Subsaharan African (556 | 6.0%), African (376 | 4.1%), German (262 | 2.9%), and American (238 | 2.6%), together accounting for 22.8% of all Panthersville residents.
| Ancestry | # Population | % Population |
| African | 376 | 4.1% |
| American | 238 | 2.6% |
| Arab | 81 | 0.9% |
| Bahamian | 41 | 0.4% |
| British West Indian | 5 | 0.1% |
| Burmese | 7 | 0.1% |
| Cherokee | 15 | 0.2% |
| Choctaw | 15 | 0.2% |
| Cuban | 2 | 0.0% |
| Dominican | 95 | 1.0% |
| English | 43 | 0.5% |
| French | 143 | 1.5% |
| German | 262 | 2.9% |
| Haitian | 14 | 0.2% |
| Irish | 7 | 0.1% |
| Italian | 22 | 0.2% |
| Jamaican | 667 | 7.2% |
| Mexican | 10 | 0.1% |
| Moroccan | 81 | 0.9% |
| Nigerian | 132 | 1.4% |
| Puerto Rican | 12 | 0.1% |
| Scottish | 21 | 0.2% |
| Sierra Leonean | 48 | 0.5% |
| Spaniard | 11 | 0.1% |
| Subsaharan African | 556 | 6.0% |
| Thai | 25 | 0.3% |
| Trinidadian and Tobagonian | 102 | 1.1% | View All 27 Rows |
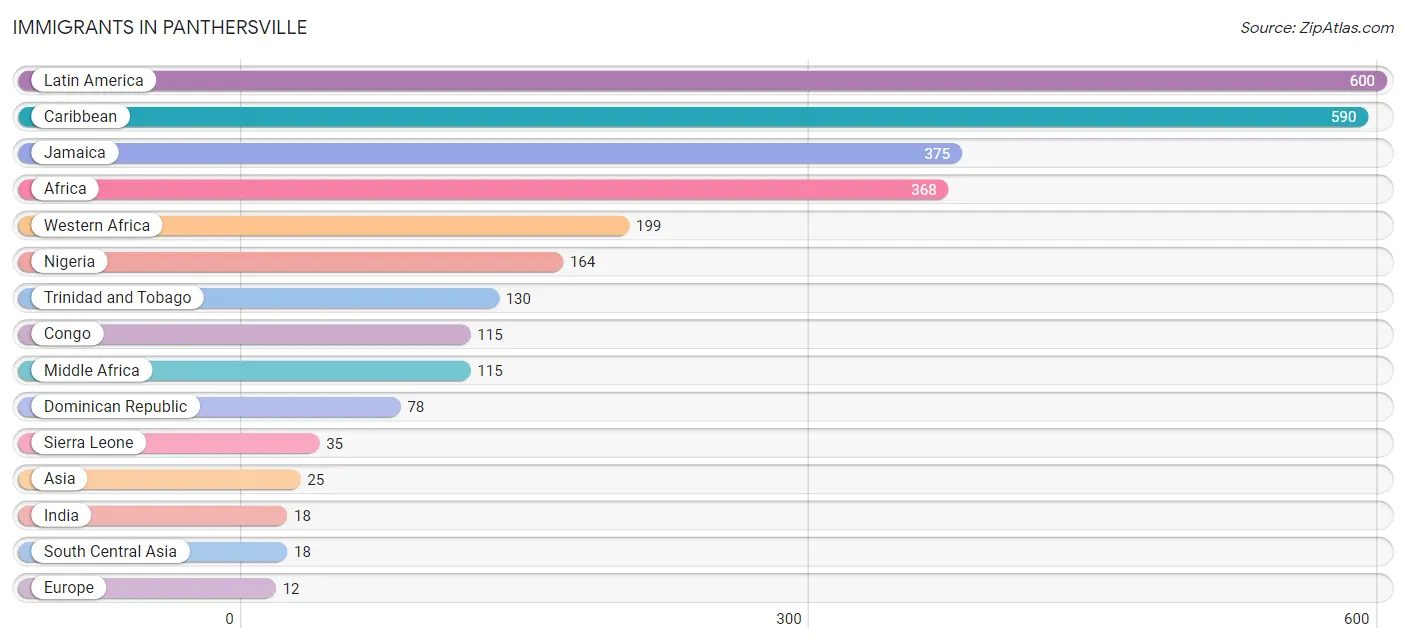
Immigrants in Panthersville
The most numerous immigrant groups reported in Panthersville came from Latin America (600 | 6.5%), Caribbean (590 | 6.4%), Jamaica (375 | 4.1%), Africa (368 | 4.0%), and Western Africa (199 | 2.2%), together accounting for 23.2% of all Panthersville residents.
| Immigration Origin | # Population | % Population |
| Africa | 368 | 4.0% |
| Asia | 25 | 0.3% |
| Caribbean | 590 | 6.4% |
| Central America | 10 | 0.1% |
| China | 7 | 0.1% |
| Congo | 115 | 1.3% |
| Cuba | 2 | 0.0% |
| Dominican Republic | 78 | 0.9% |
| Eastern Asia | 7 | 0.1% |
| Europe | 12 | 0.1% |
| Germany | 12 | 0.1% |
| Grenada | 5 | 0.1% |
| India | 18 | 0.2% |
| Jamaica | 375 | 4.1% |
| Latin America | 600 | 6.5% |
| Mexico | 10 | 0.1% |
| Middle Africa | 115 | 1.3% |
| Nigeria | 164 | 1.8% |
| Sierra Leone | 35 | 0.4% |
| South Central Asia | 18 | 0.2% |
| Taiwan | 7 | 0.1% |
| Trinidad and Tobago | 130 | 1.4% |
| Western Africa | 199 | 2.2% |
| Western Europe | 12 | 0.1% | View All 24 Rows |
Sex and Age in Panthersville
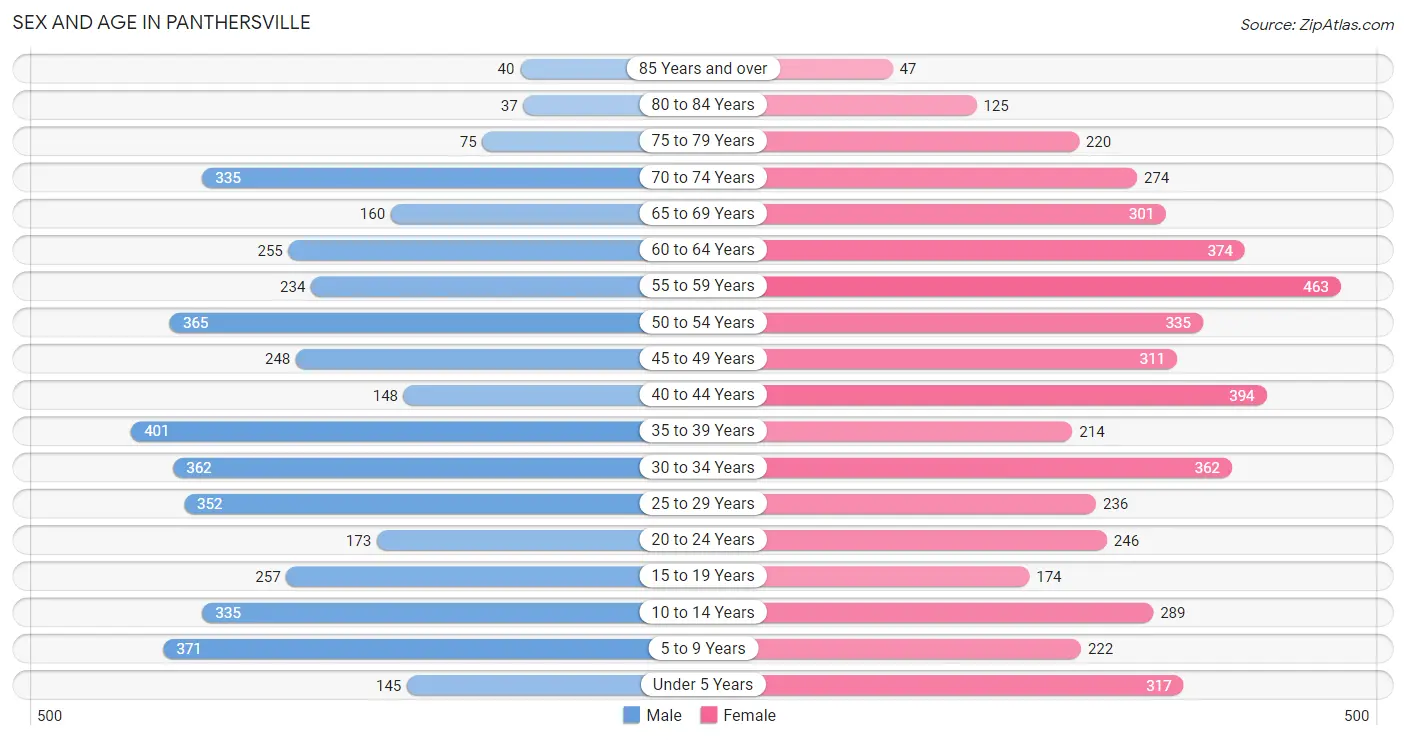
Sex and Age in Panthersville
The most populous age groups in Panthersville are 35 to 39 Years (401 | 9.3%) for men and 55 to 59 Years (463 | 9.4%) for women.
| Age Bracket | Male | Female |
| Under 5 Years | 145 (3.4%) | 317 (6.5%) |
| 5 to 9 Years | 371 (8.6%) | 222 (4.5%) |
| 10 to 14 Years | 335 (7.8%) | 289 (5.9%) |
| 15 to 19 Years | 257 (6.0%) | 174 (3.5%) |
| 20 to 24 Years | 173 (4.0%) | 246 (5.0%) |
| 25 to 29 Years | 352 (8.2%) | 236 (4.8%) |
| 30 to 34 Years | 362 (8.4%) | 362 (7.4%) |
| 35 to 39 Years | 401 (9.3%) | 214 (4.4%) |
| 40 to 44 Years | 148 (3.5%) | 394 (8.0%) |
| 45 to 49 Years | 248 (5.8%) | 311 (6.3%) |
| 50 to 54 Years | 365 (8.5%) | 335 (6.8%) |
| 55 to 59 Years | 234 (5.4%) | 463 (9.4%) |
| 60 to 64 Years | 255 (5.9%) | 374 (7.6%) |
| 65 to 69 Years | 160 (3.7%) | 301 (6.1%) |
| 70 to 74 Years | 335 (7.8%) | 274 (5.6%) |
| 75 to 79 Years | 75 (1.8%) | 220 (4.5%) |
| 80 to 84 Years | 37 (0.9%) | 125 (2.5%) |
| 85 Years and over | 40 (0.9%) | 47 (1.0%) |
| Total | 4,293 (100.0%) | 4,904 (100.0%) |
Families and Households in Panthersville
Median Family Size in Panthersville
The median family size in Panthersville is 3.05 persons per family, with single female/mother families (1,011 | 45.4%) accounting for the largest median family size of 3.56 persons per family. On the other hand, married-couple families (957 | 42.9%) represent the smallest median family size with 2.58 persons per family.

| Family Type | # Families | Family Size |
| Married-Couple | 957 (42.9%) | 2.58 |
| Single Male/Father | 261 (11.7%) | 2.78 |
| Single Female/Mother | 1,011 (45.4%) | 3.56 |
| Total Families | 2,229 (100.0%) | 3.05 |
Median Household Size in Panthersville
The median household size in Panthersville is 2.26 persons per household, with single female/mother households (1,011 | 24.9%) accounting for the largest median household size of 3.59 persons per household. non-family households (1,825 | 45.0%) represent the smallest median household size with 1.22 persons per household.

| Household Type | # Households | Household Size |
| Married-Couple | 957 (23.6%) | 2.60 |
| Single Male/Father | 261 (6.4%) | 3.18 |
| Single Female/Mother | 1,011 (24.9%) | 3.59 |
| Non-family | 1,825 (45.0%) | 1.22 |
| Total Households | 4,054 (100.0%) | 2.26 |
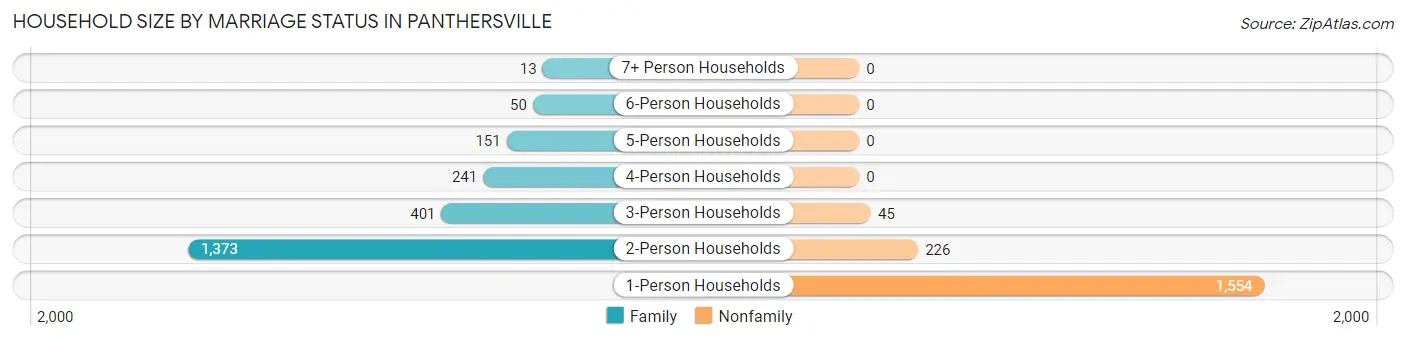
Household Size by Marriage Status in Panthersville
Out of a total of 4,054 households in Panthersville, 2,229 (55.0%) are family households, while 1,825 (45.0%) are nonfamily households. The most numerous type of family households are 2-person households, comprising 1,373, and the most common type of nonfamily households are 1-person households, comprising 1,554.
| Household Size | Family Households | Nonfamily Households |
| 1-Person Households | - | 1,554 (38.3%) |
| 2-Person Households | 1,373 (33.9%) | 226 (5.6%) |
| 3-Person Households | 401 (9.9%) | 45 (1.1%) |
| 4-Person Households | 241 (5.9%) | 0 (0.0%) |
| 5-Person Households | 151 (3.7%) | 0 (0.0%) |
| 6-Person Households | 50 (1.2%) | 0 (0.0%) |
| 7+ Person Households | 13 (0.3%) | 0 (0.0%) |
| Total | 2,229 (55.0%) | 1,825 (45.0%) |
Female Fertility in Panthersville
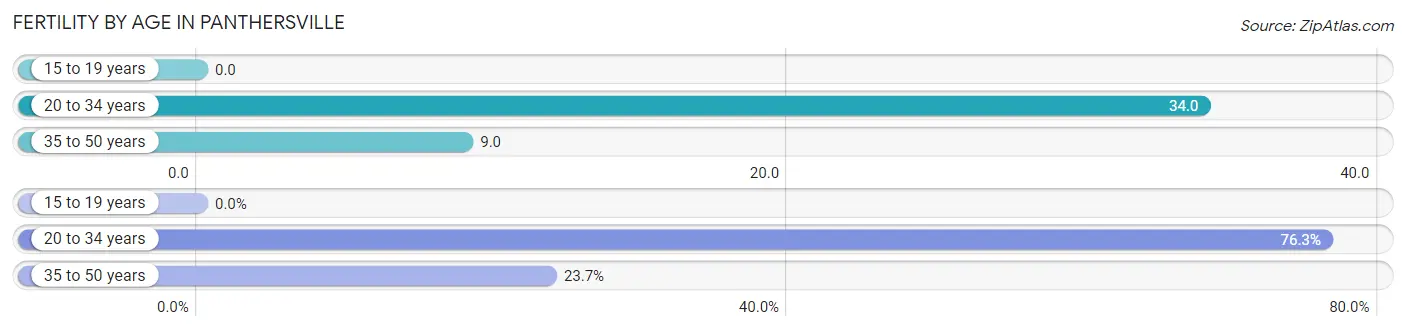
Fertility by Age in Panthersville
Average fertility rate in Panthersville is 19.0 births per 1,000 women. Women in the age bracket of 20 to 34 years have the highest fertility rate with 34.0 births per 1,000 women. Women in the age bracket of 20 to 34 years acount for 76.3% of all women with births.
| Age Bracket | Women with Births | Births / 1,000 Women |
| 15 to 19 years | 0 (0.0%) | 0.0 |
| 20 to 34 years | 29 (76.3%) | 34.0 |
| 35 to 50 years | 9 (23.7%) | 9.0 |
| Total | 38 (100.0%) | 19.0 |
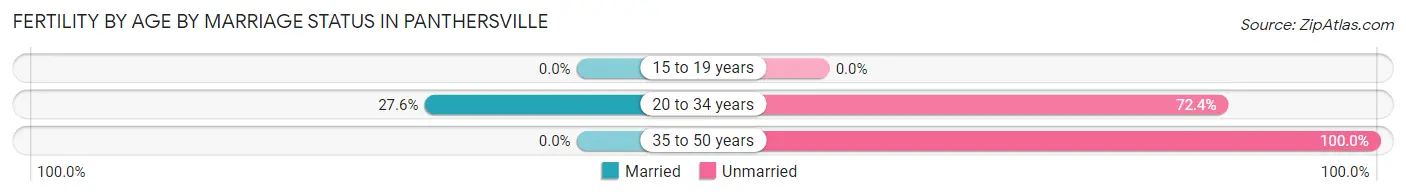
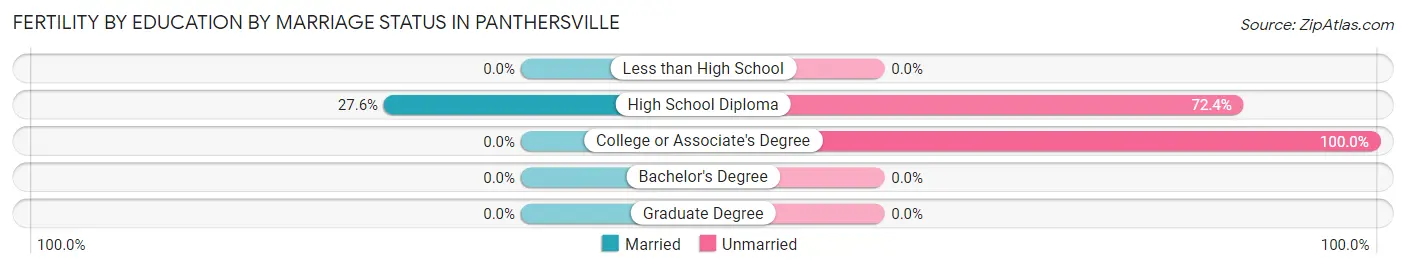
Fertility by Age by Marriage Status in Panthersville
21.1% of women with births (38) in Panthersville are married. The highest percentage of unmarried women with births falls into 35 to 50 years age bracket with 100.0% of them unmarried at the time of birth, while the lowest percentage of unmarried women with births belong to 20 to 34 years age bracket with 72.4% of them unmarried.
| Age Bracket | Married | Unmarried |
| 15 to 19 years | 0 (0.0%) | 0 (0.0%) |
| 20 to 34 years | 8 (27.6%) | 21 (72.4%) |
| 35 to 50 years | 0 (0.0%) | 9 (100.0%) |
| Total | 8 (21.0%) | 30 (78.9%) |
Fertility by Education in Panthersville
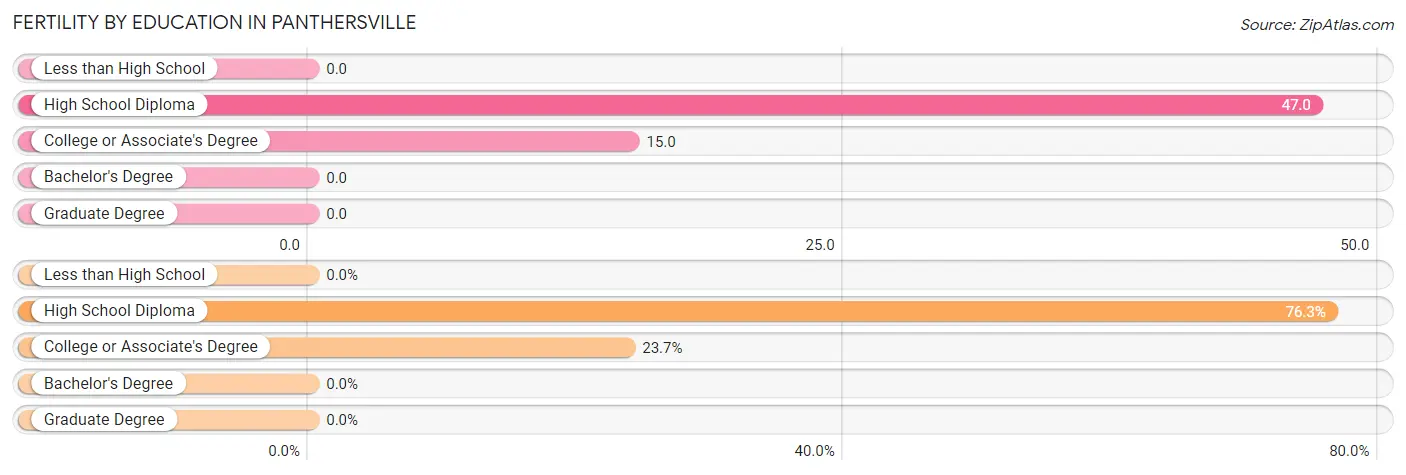
| Educational Attainment | Women with Births | Births / 1,000 Women |
| Less than High School | 0 (0.0%) | 0.0 |
| High School Diploma | 29 (76.3%) | 47.0 |
| College or Associate's Degree | 9 (23.7%) | 15.0 |
| Bachelor's Degree | 0 (0.0%) | 0.0 |
| Graduate Degree | 0 (0.0%) | 0.0 |
| Total | 38 (100.0%) | 19.0 |
Fertility by Education by Marriage Status in Panthersville
78.9% of women with births in Panthersville are unmarried. Women with the educational attainment of high school diploma are most likely to be married with 27.6% of them married at childbirth, while women with the educational attainment of college or associate's degree are least likely to be married with 100.0% of them unmarried at childbirth.
| Educational Attainment | Married | Unmarried |
| Less than High School | 0 (0.0%) | 0 (0.0%) |
| High School Diploma | 8 (27.6%) | 21 (72.4%) |
| College or Associate's Degree | 0 (0.0%) | 9 (100.0%) |
| Bachelor's Degree | 0 (0.0%) | 0 (0.0%) |
| Graduate Degree | 0 (0.0%) | 0 (0.0%) |
| Total | 8 (21.0%) | 30 (78.9%) |
Income in Panthersville
Income Overview in Panthersville
Per Capita Income in Panthersville is $33,152, while median incomes of families and households are $64,183 and $48,876 respectively.
| Characteristic | Number | Measure |
| Per Capita Income | 9,197 | $33,152 |
| Median Family Income | 2,229 | $64,183 |
| Mean Family Income | 2,229 | $104,124 |
| Median Household Income | 4,054 | $48,876 |
| Mean Household Income | 4,054 | $77,568 |
| Income Deficit | 2,229 | $0 |
| Wage / Income Gap (%) | 9,197 | 2.75% |
| Wage / Income Gap ($) | 9,197 | 97.25¢ per $1 |
| Gini / Inequality Index | 9,197 | 0.51 |
Earnings by Sex in Panthersville
Average Earnings in Panthersville are $32,902, $32,359 for men and $33,275 for women, a difference of 2.8%.
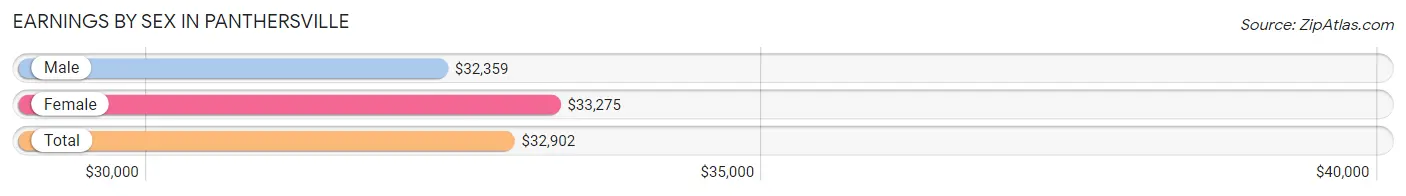
| Sex | Number | Average Earnings |
| Male | 1,994 (41.1%) | $32,359 |
| Female | 2,857 (58.9%) | $33,275 |
| Total | 4,851 (100.0%) | $32,902 |
Earnings by Sex by Income Bracket in Panthersville
The most common earnings brackets in Panthersville are $30,000 to $34,999 for men (274 | 13.7%) and $25,000 to $29,999 for women (311 | 10.9%).
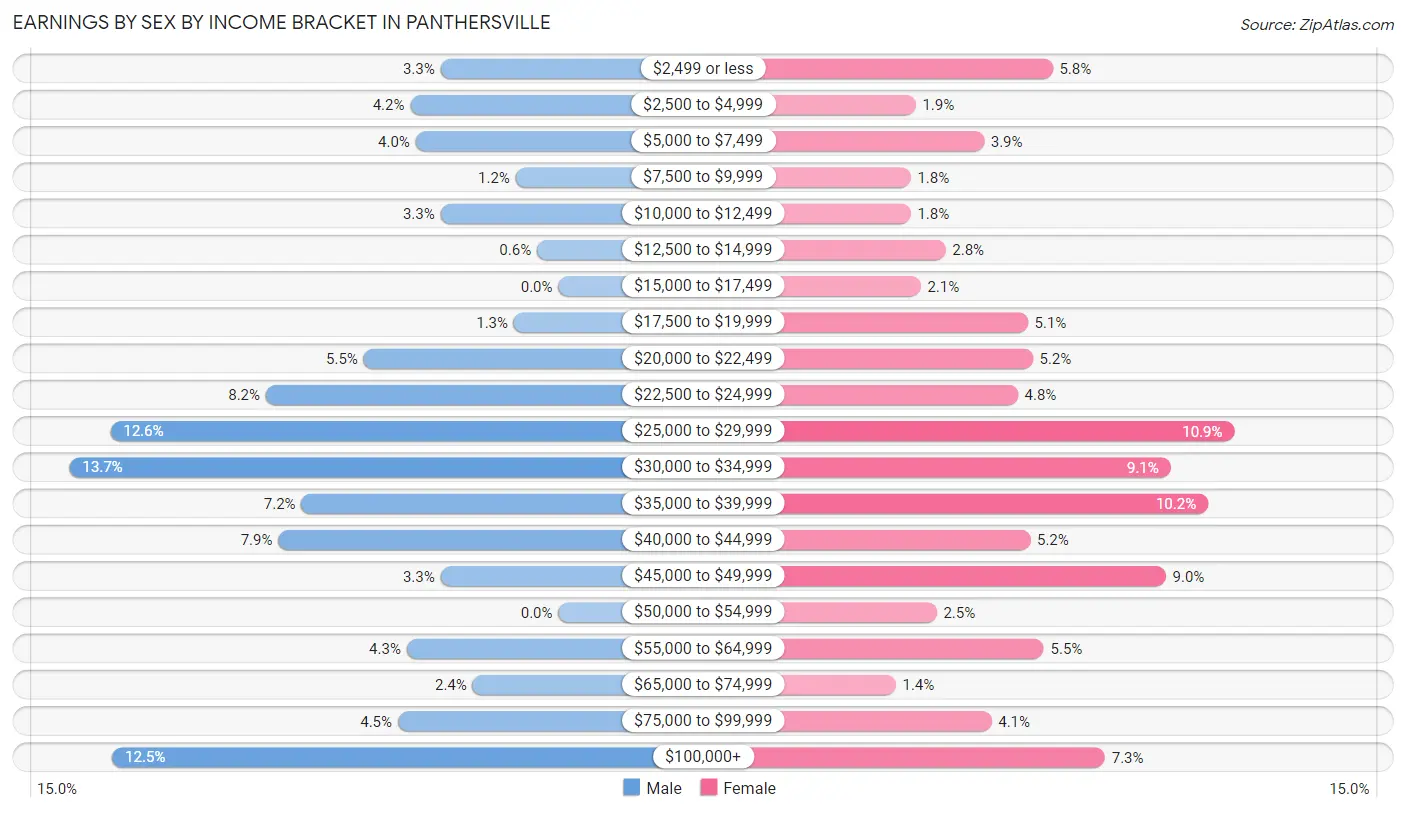
| Income | Male | Female |
| $2,499 or less | 66 (3.3%) | 165 (5.8%) |
| $2,500 to $4,999 | 83 (4.2%) | 55 (1.9%) |
| $5,000 to $7,499 | 80 (4.0%) | 110 (3.8%) |
| $7,500 to $9,999 | 24 (1.2%) | 51 (1.8%) |
| $10,000 to $12,499 | 66 (3.3%) | 51 (1.8%) |
| $12,500 to $14,999 | 12 (0.6%) | 79 (2.8%) |
| $15,000 to $17,499 | 0 (0.0%) | 59 (2.1%) |
| $17,500 to $19,999 | 25 (1.3%) | 145 (5.1%) |
| $20,000 to $22,499 | 109 (5.5%) | 149 (5.2%) |
| $22,500 to $24,999 | 164 (8.2%) | 137 (4.8%) |
| $25,000 to $29,999 | 251 (12.6%) | 311 (10.9%) |
| $30,000 to $34,999 | 274 (13.7%) | 260 (9.1%) |
| $35,000 to $39,999 | 144 (7.2%) | 290 (10.2%) |
| $40,000 to $44,999 | 157 (7.9%) | 147 (5.1%) |
| $45,000 to $49,999 | 66 (3.3%) | 256 (9.0%) |
| $50,000 to $54,999 | 0 (0.0%) | 72 (2.5%) |
| $55,000 to $64,999 | 85 (4.3%) | 158 (5.5%) |
| $65,000 to $74,999 | 48 (2.4%) | 39 (1.4%) |
| $75,000 to $99,999 | 90 (4.5%) | 116 (4.1%) |
| $100,000+ | 250 (12.5%) | 207 (7.2%) |
| Total | 1,994 (100.0%) | 2,857 (100.0%) |
Earnings by Sex by Educational Attainment in Panthersville
Average earnings in Panthersville are $33,932 for men and $34,495 for women, a difference of 1.6%. Men with an educational attainment of less than high school enjoy the highest average annual earnings of $58,900, while those with high school diploma education earn the least with $30,050. Women with an educational attainment of bachelor's degree earn the most with the average annual earnings of $40,606, while those with less than high school education have the smallest earnings of $29,091.
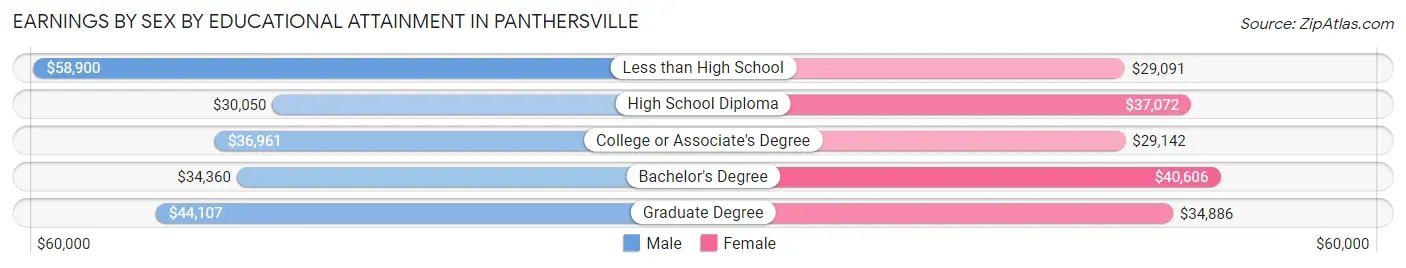
| Educational Attainment | Male Income | Female Income |
| Less than High School | $58,900 | $29,091 |
| High School Diploma | $30,050 | $37,072 |
| College or Associate's Degree | $36,961 | $29,142 |
| Bachelor's Degree | $34,360 | $40,606 |
| Graduate Degree | $44,107 | $34,886 |
| Total | $33,932 | $34,495 |
Family Income in Panthersville
Family Income Brackets in Panthersville
According to the Panthersville family income data, there are 386 families falling into the $35,000 to $49,999 income range, which is the most common income bracket and makes up 17.3% of all families. Conversely, the $10,000 to $14,999 income bracket is the least frequent group with only 80 families (3.6%) belonging to this category.
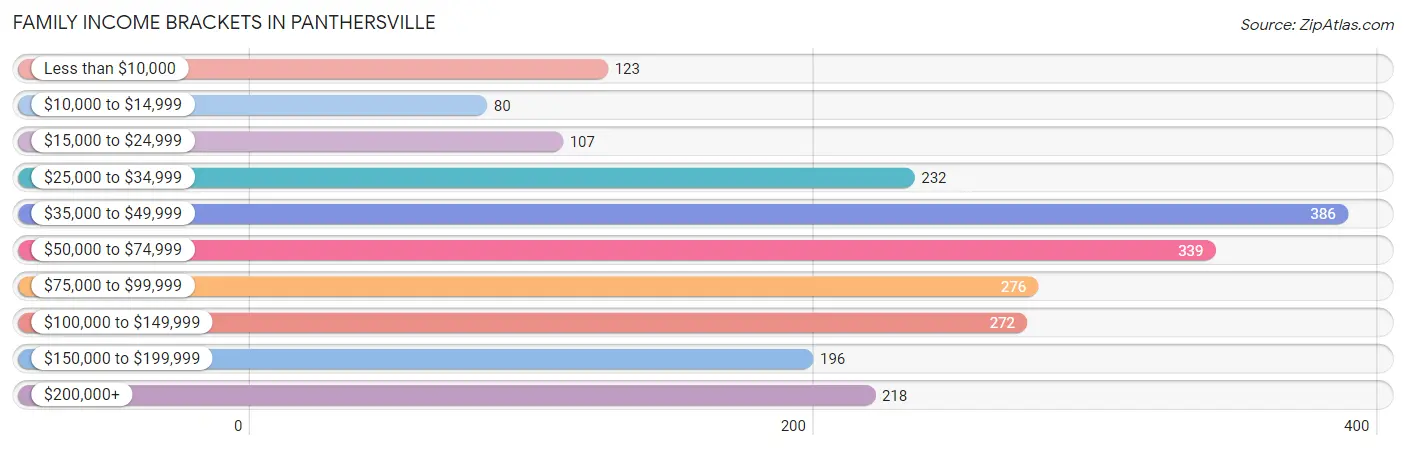
| Income Bracket | # Families | % Families |
| Less than $10,000 | 123 | 5.5% |
| $10,000 to $14,999 | 80 | 3.6% |
| $15,000 to $24,999 | 107 | 4.8% |
| $25,000 to $34,999 | 232 | 10.4% |
| $35,000 to $49,999 | 386 | 17.3% |
| $50,000 to $74,999 | 339 | 15.2% |
| $75,000 to $99,999 | 276 | 12.4% |
| $100,000 to $149,999 | 272 | 12.2% |
| $150,000 to $199,999 | 196 | 8.8% |
| $200,000+ | 218 | 9.8% |
Family Income by Famaliy Size in Panthersville
3-person families (404 | 18.1%) account for the highest median family income in Panthersville with $83,306 per family, while 2-person families (1,426 | 64.0%) have the highest median income of $32,788 per family member.
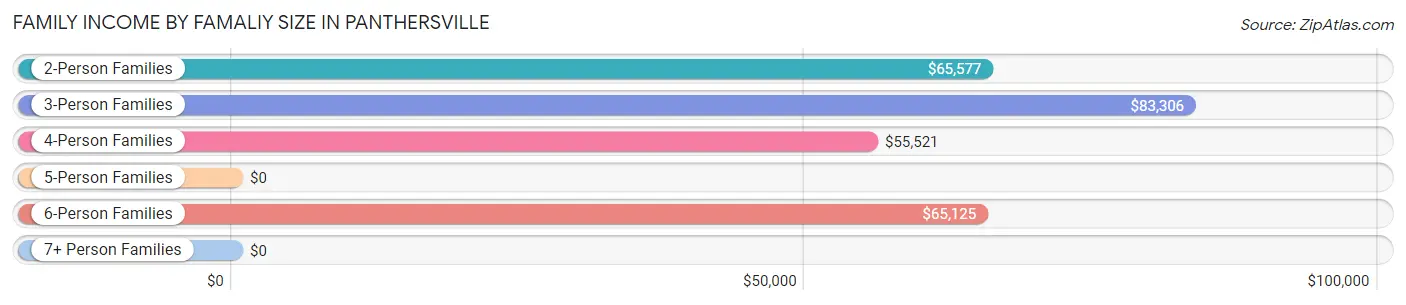
| Income Bracket | # Families | Median Income |
| 2-Person Families | 1,426 (64.0%) | $65,577 |
| 3-Person Families | 404 (18.1%) | $83,306 |
| 4-Person Families | 207 (9.3%) | $55,521 |
| 5-Person Families | 150 (6.7%) | $0 |
| 6-Person Families | 29 (1.3%) | $65,125 |
| 7+ Person Families | 13 (0.6%) | $0 |
| Total | 2,229 (100.0%) | $64,183 |
Family Income by Number of Earners in Panthersville
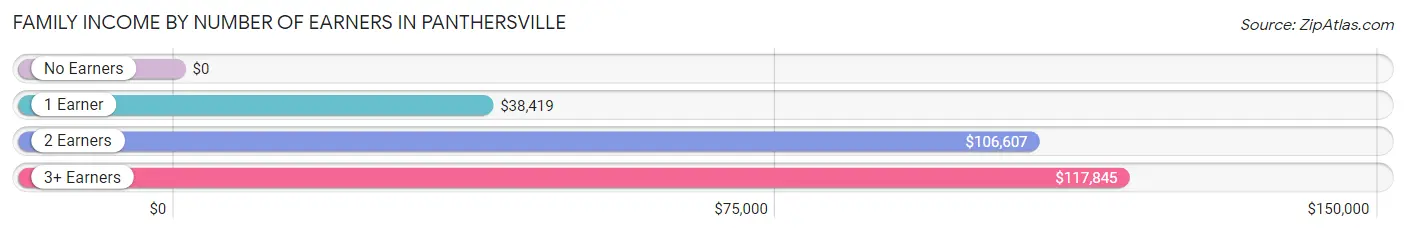
| Number of Earners | # Families | Median Income |
| No Earners | 337 (15.1%) | $0 |
| 1 Earner | 1,002 (45.0%) | $38,419 |
| 2 Earners | 744 (33.4%) | $106,607 |
| 3+ Earners | 146 (6.6%) | $117,845 |
| Total | 2,229 (100.0%) | $64,183 |
Household Income in Panthersville
Household Income Brackets in Panthersville
With 709 households falling in the category, the $35,000 to $49,999 income range is the most frequent in Panthersville, accounting for 17.5% of all households. In contrast, only 215 households (5.3%) fall into the $150,000 to $199,999 income bracket, making it the least populous group.
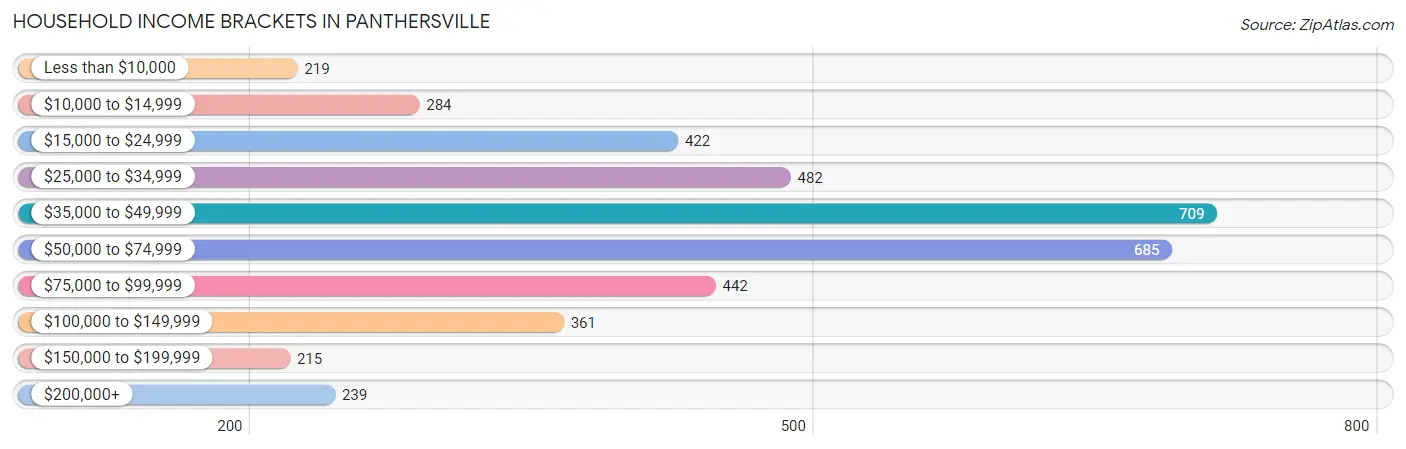
| Income Bracket | # Households | % Households |
| Less than $10,000 | 219 | 5.4% |
| $10,000 to $14,999 | 284 | 7.0% |
| $15,000 to $24,999 | 422 | 10.4% |
| $25,000 to $34,999 | 482 | 11.9% |
| $35,000 to $49,999 | 709 | 17.5% |
| $50,000 to $74,999 | 685 | 16.9% |
| $75,000 to $99,999 | 442 | 10.9% |
| $100,000 to $149,999 | 361 | 8.9% |
| $150,000 to $199,999 | 215 | 5.3% |
| $200,000+ | 239 | 5.9% |
Household Income by Householder Age in Panthersville
The median household income in Panthersville is $48,876, with the highest median household income of $59,792 found in the 25 to 44 years age bracket for the primary householder. A total of 1,154 households (28.5%) fall into this category. Meanwhile, the 15 to 24 years age bracket for the primary householder has the lowest median household income of $32,763, with 116 households (2.9%) in this group.
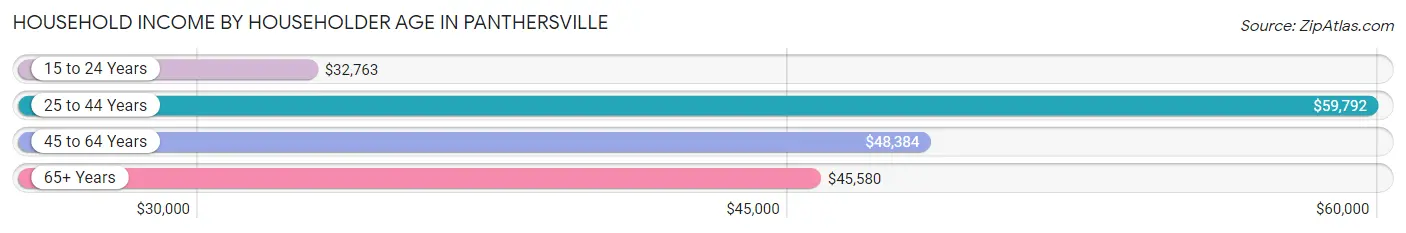
| Income Bracket | # Households | Median Income |
| 15 to 24 Years | 116 (2.9%) | $32,763 |
| 25 to 44 Years | 1,154 (28.5%) | $59,792 |
| 45 to 64 Years | 1,506 (37.1%) | $48,384 |
| 65+ Years | 1,278 (31.5%) | $45,580 |
| Total | 4,054 (100.0%) | $48,876 |
Poverty in Panthersville
Income Below Poverty by Sex and Age in Panthersville
With 13.9% poverty level for males and 19.9% for females among the residents of Panthersville, 5 year old males and under 5 year old females are the most vulnerable to poverty, with 41 males (71.9%) and 172 females (55.7%) in their respective age groups living below the poverty level.
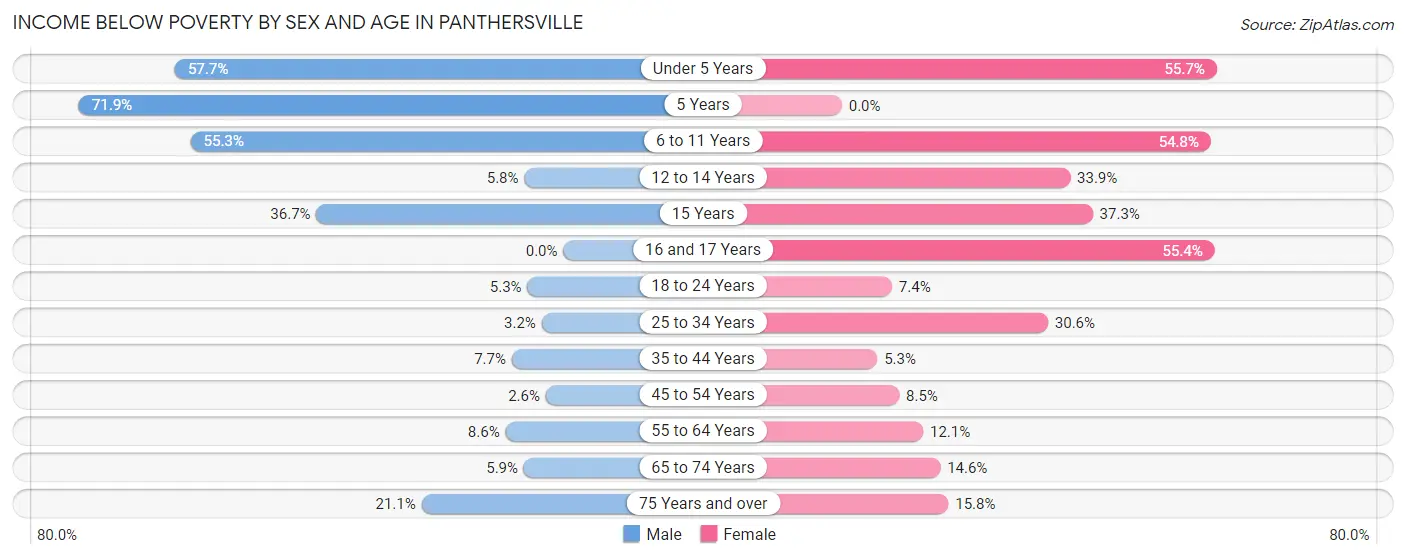
| Age Bracket | Male | Female |
| Under 5 Years | 79 (57.7%) | 172 (55.7%) |
| 5 Years | 41 (71.9%) | 0 (0.0%) |
| 6 to 11 Years | 254 (55.3%) | 143 (54.8%) |
| 12 to 14 Years | 11 (5.8%) | 60 (33.9%) |
| 15 Years | 11 (36.7%) | 19 (37.2%) |
| 16 and 17 Years | 0 (0.0%) | 31 (55.4%) |
| 18 to 24 Years | 16 (5.3%) | 23 (7.4%) |
| 25 to 34 Years | 23 (3.2%) | 183 (30.6%) |
| 35 to 44 Years | 42 (7.6%) | 32 (5.3%) |
| 45 to 54 Years | 16 (2.6%) | 55 (8.5%) |
| 55 to 64 Years | 42 (8.6%) | 101 (12.1%) |
| 65 to 74 Years | 29 (5.9%) | 84 (14.6%) |
| 75 Years and over | 32 (21.0%) | 62 (15.8%) |
| Total | 596 (13.9%) | 965 (19.9%) |
Income Above Poverty by Sex and Age in Panthersville
According to the poverty statistics in Panthersville, males aged 16 and 17 years and females aged 5 years are the age groups that are most secure financially, with 100.0% of males and 100.0% of females in these age groups living above the poverty line.
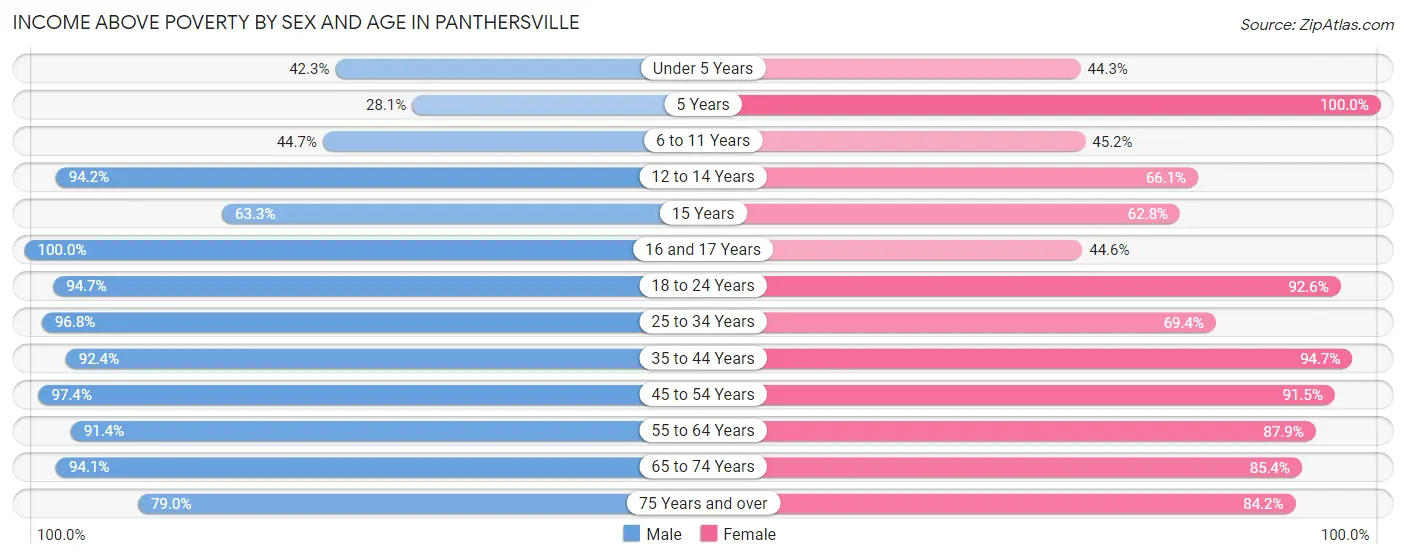
| Age Bracket | Male | Female |
| Under 5 Years | 58 (42.3%) | 137 (44.3%) |
| 5 Years | 16 (28.1%) | 28 (100.0%) |
| 6 to 11 Years | 205 (44.7%) | 118 (45.2%) |
| 12 to 14 Years | 179 (94.2%) | 117 (66.1%) |
| 15 Years | 19 (63.3%) | 32 (62.7%) |
| 16 and 17 Years | 100 (100.0%) | 25 (44.6%) |
| 18 to 24 Years | 284 (94.7%) | 286 (92.6%) |
| 25 to 34 Years | 691 (96.8%) | 415 (69.4%) |
| 35 to 44 Years | 507 (92.3%) | 576 (94.7%) |
| 45 to 54 Years | 597 (97.4%) | 591 (91.5%) |
| 55 to 64 Years | 447 (91.4%) | 736 (87.9%) |
| 65 to 74 Years | 466 (94.1%) | 491 (85.4%) |
| 75 Years and over | 120 (78.9%) | 330 (84.2%) |
| Total | 3,689 (86.1%) | 3,882 (80.1%) |
Income Below Poverty Among Married-Couple Families in Panthersville
The poverty statistics for married-couple families in Panthersville show that 3.1% or 30 of the total 957 families live below the poverty line. Families with 1 or 2 children have the highest poverty rate of 22.7%, comprising of 30 families. On the other hand, families with no children have the lowest poverty rate of 0.0%, which includes 0 families.
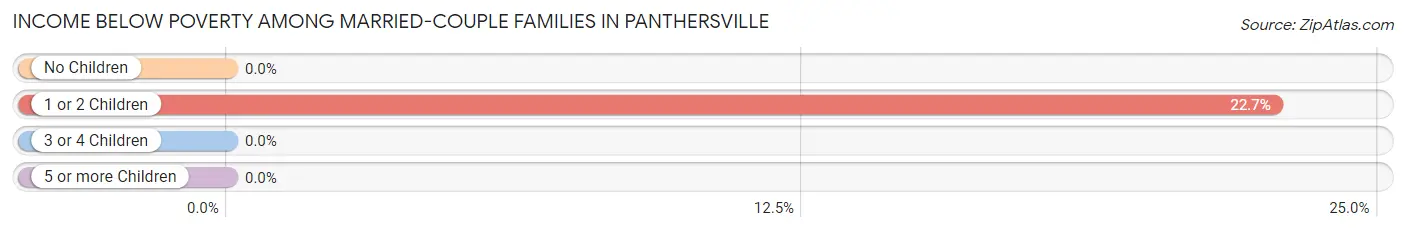
| Children | Above Poverty | Below Poverty |
| No Children | 793 (100.0%) | 0 (0.0%) |
| 1 or 2 Children | 102 (77.3%) | 30 (22.7%) |
| 3 or 4 Children | 32 (100.0%) | 0 (0.0%) |
| 5 or more Children | 0 (0.0%) | 0 (0.0%) |
| Total | 927 (96.9%) | 30 (3.1%) |
Income Below Poverty Among Single-Parent Households in Panthersville
According to the poverty data in Panthersville, 12.6% or 33 single-father households and 23.7% or 240 single-mother households are living below the poverty line. Among single-father households, those with 3 or 4 children have the highest poverty rate, with 21 households (48.8%) experiencing poverty. Likewise, among single-mother households, those with 3 or 4 children have the highest poverty rate, with 86 households (64.2%) falling below the poverty line.
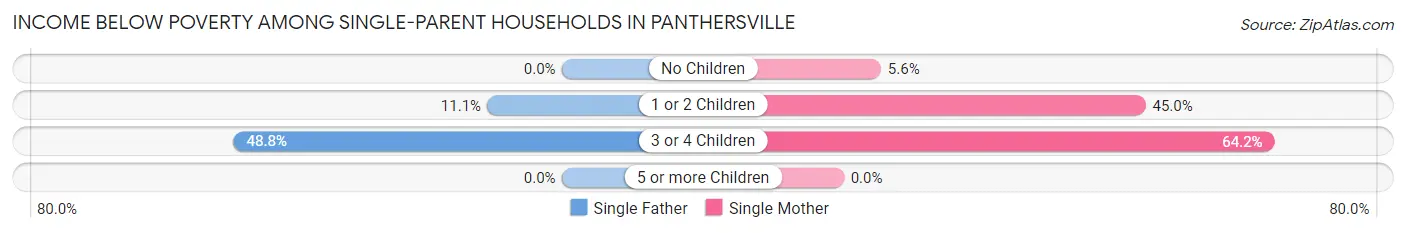
| Children | Single Father | Single Mother |
| No Children | 0 (0.0%) | 33 (5.6%) |
| 1 or 2 Children | 12 (11.1%) | 121 (45.0%) |
| 3 or 4 Children | 21 (48.8%) | 86 (64.2%) |
| 5 or more Children | 0 (0.0%) | 0 (0.0%) |
| Total | 33 (12.6%) | 240 (23.7%) |
Income Below Poverty Among Married-Couple vs Single-Parent Households in Panthersville
The poverty data for Panthersville shows that 30 of the married-couple family households (3.1%) and 273 of the single-parent households (21.5%) are living below the poverty level. Within the married-couple family households, those with 1 or 2 children have the highest poverty rate, with 30 households (22.7%) falling below the poverty line. Among the single-parent households, those with 3 or 4 children have the highest poverty rate, with 107 household (60.5%) living below poverty.
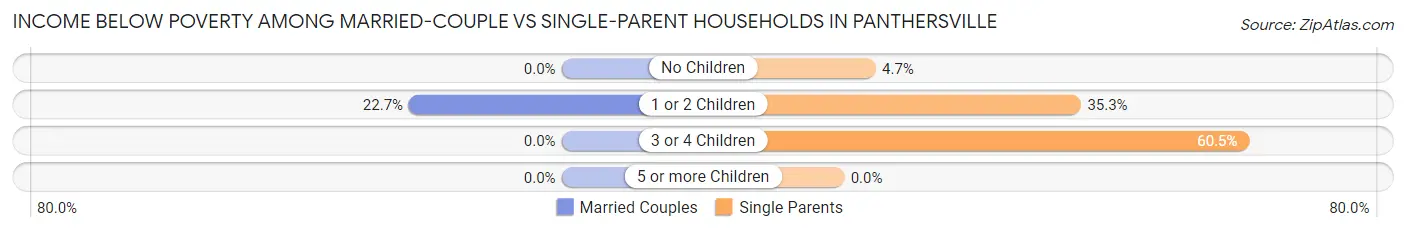
| Children | Married-Couple Families | Single-Parent Households |
| No Children | 0 (0.0%) | 33 (4.7%) |
| 1 or 2 Children | 30 (22.7%) | 133 (35.3%) |
| 3 or 4 Children | 0 (0.0%) | 107 (60.5%) |
| 5 or more Children | 0 (0.0%) | 0 (0.0%) |
| Total | 30 (3.1%) | 273 (21.5%) |
Employment Characteristics in Panthersville
Employment by Class of Employer in Panthersville
Among the 4,433 employed individuals in Panthersville, private company employees (3,004 | 67.8%), not-for-profit organizations (511 | 11.5%), and local government employees (431 | 9.7%) make up the most common classes of employment.
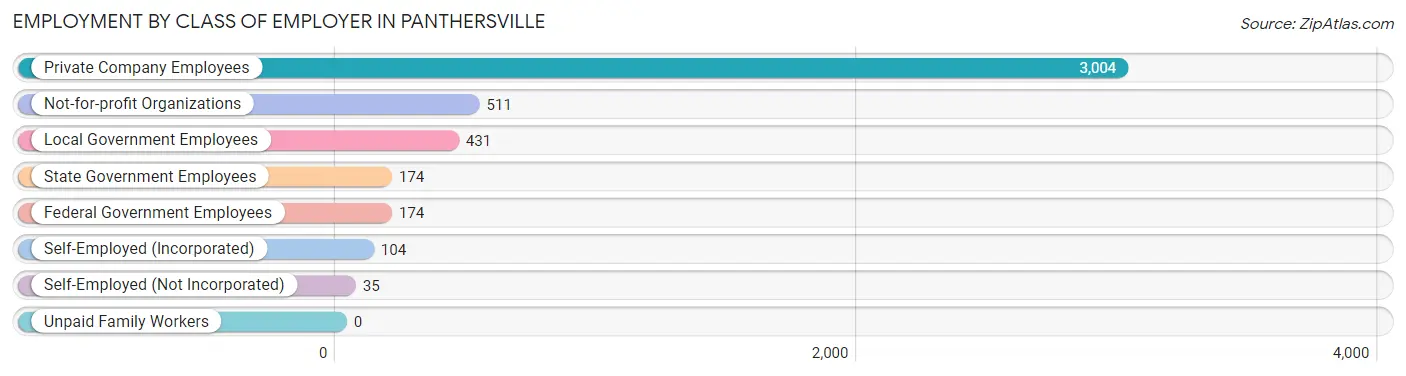
| Employer Class | # Employees | % Employees |
| Private Company Employees | 3,004 | 67.8% |
| Self-Employed (Incorporated) | 104 | 2.4% |
| Self-Employed (Not Incorporated) | 35 | 0.8% |
| Not-for-profit Organizations | 511 | 11.5% |
| Local Government Employees | 431 | 9.7% |
| State Government Employees | 174 | 3.9% |
| Federal Government Employees | 174 | 3.9% |
| Unpaid Family Workers | 0 | 0.0% |
| Total | 4,433 | 100.0% |
Employment Status by Age in Panthersville
According to the labor force statistics for Panthersville, out of the total population over 16 years of age (7,436), 64.5% or 4,796 individuals are in the labor force, with 6.7% or 321 of them unemployed. The age group with the highest labor force participation rate is 30 to 34 years, with 97.4% or 705 individuals in the labor force. Within the labor force, the 16 to 19 years age range has the highest percentage of unemployed individuals, with 65.7% or 111 of them being unemployed.
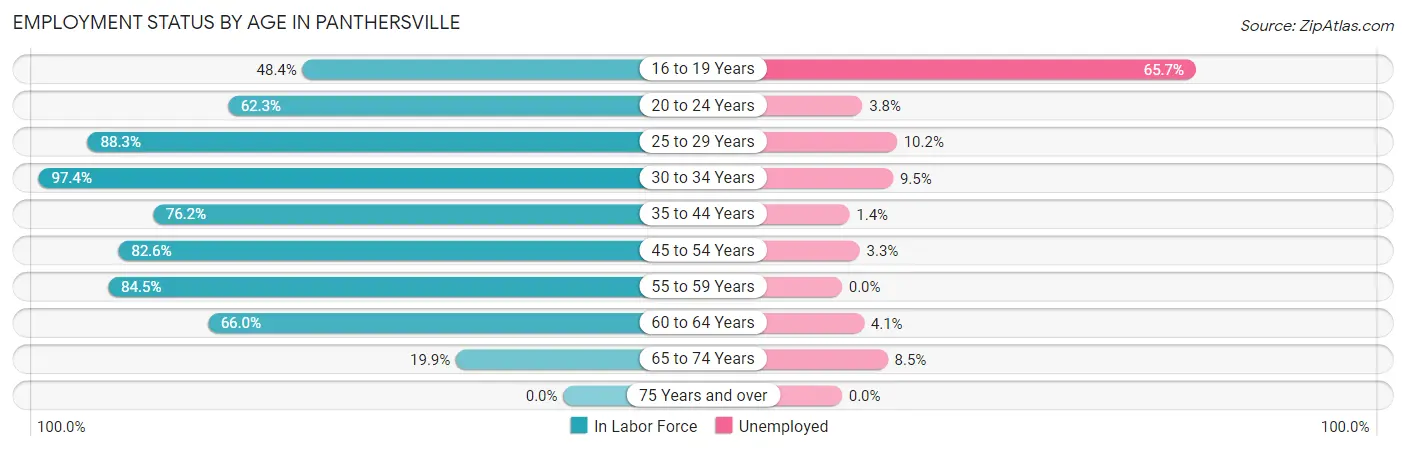
| Age Bracket | In Labor Force | Unemployed |
| 16 to 19 Years | 169 (48.4%) | 111 (65.7%) |
| 20 to 24 Years | 261 (62.3%) | 10 (3.8%) |
| 25 to 29 Years | 519 (88.3%) | 53 (10.2%) |
| 30 to 34 Years | 705 (97.4%) | 67 (9.5%) |
| 35 to 44 Years | 882 (76.2%) | 12 (1.4%) |
| 45 to 54 Years | 1,040 (82.6%) | 34 (3.3%) |
| 55 to 59 Years | 589 (84.5%) | 0 (0.0%) |
| 60 to 64 Years | 415 (66.0%) | 17 (4.1%) |
| 65 to 74 Years | 213 (19.9%) | 18 (8.5%) |
| 75 Years and over | 0 (0.0%) | 0 (0.0%) |
| Total | 4,796 (64.5%) | 321 (6.7%) |
Employment Status by Educational Attainment in Panthersville
According to labor force statistics for Panthersville, 82.1% of individuals (4,149) out of the total population between 25 and 64 years of age (5,054) are in the labor force, with 4.4% or 183 of them being unemployed. The group with the highest labor force participation rate are those with the educational attainment of bachelor's degree or higher, with 96.5% or 1,296 individuals in the labor force. Within the labor force, individuals with college / associate degree education have the highest percentage of unemployment, with 10.3% or 115 of them being unemployed.
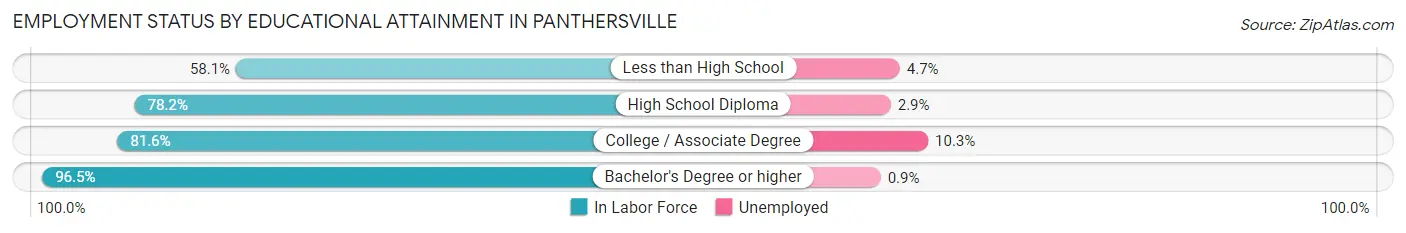
| Educational Attainment | In Labor Force | Unemployed |
| Less than High School | 274 (58.1%) | 22 (4.7%) |
| High School Diploma | 1,462 (78.2%) | 54 (2.9%) |
| College / Associate Degree | 1,118 (81.6%) | 141 (10.3%) |
| Bachelor's Degree or higher | 1,296 (96.5%) | 12 (0.9%) |
| Total | 4,149 (82.1%) | 222 (4.4%) |
Employment Occupations by Sex in Panthersville
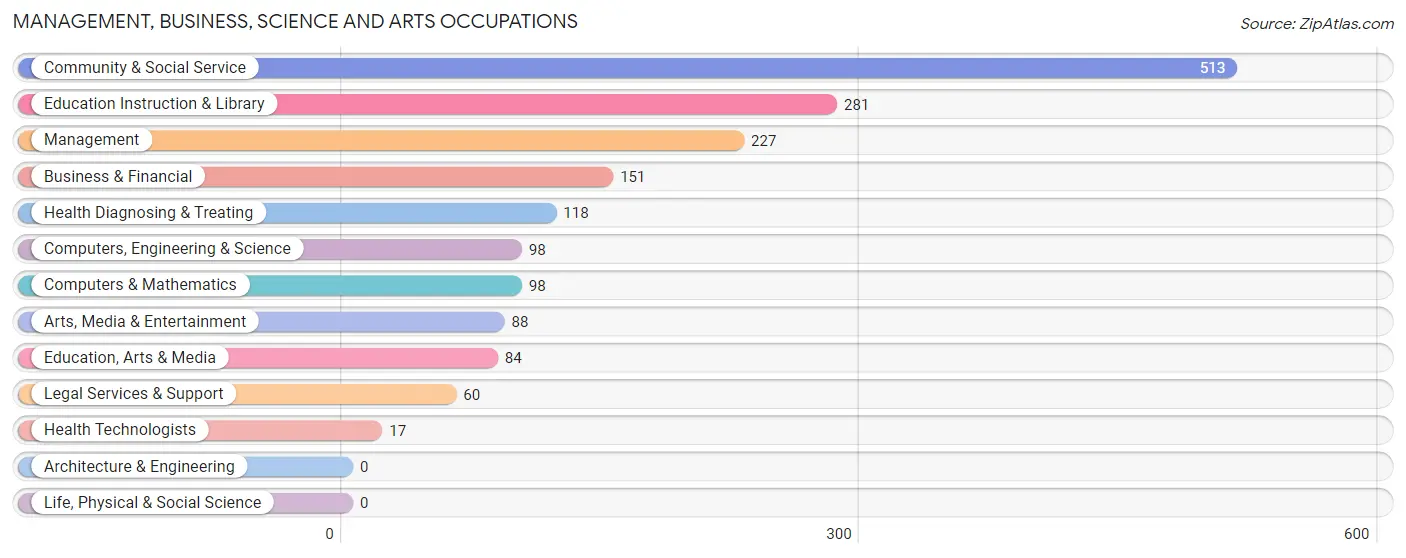
Management, Business, Science and Arts Occupations
The most common Management, Business, Science and Arts occupations in Panthersville are Community & Social Service (513 | 11.5%), Education Instruction & Library (281 | 6.3%), Management (227 | 5.1%), Business & Financial (151 | 3.4%), and Health Diagnosing & Treating (118 | 2.6%).
Management, Business, Science and Arts Occupations by Sex
Within the Management, Business, Science and Arts occupations in Panthersville, the most male-oriented occupations are Education, Arts & Media (69.1%), Management (54.2%), and Arts, Media & Entertainment (48.9%), while the most female-oriented occupations are Legal Services & Support (100.0%), Health Technologists (100.0%), and Education Instruction & Library (89.7%).
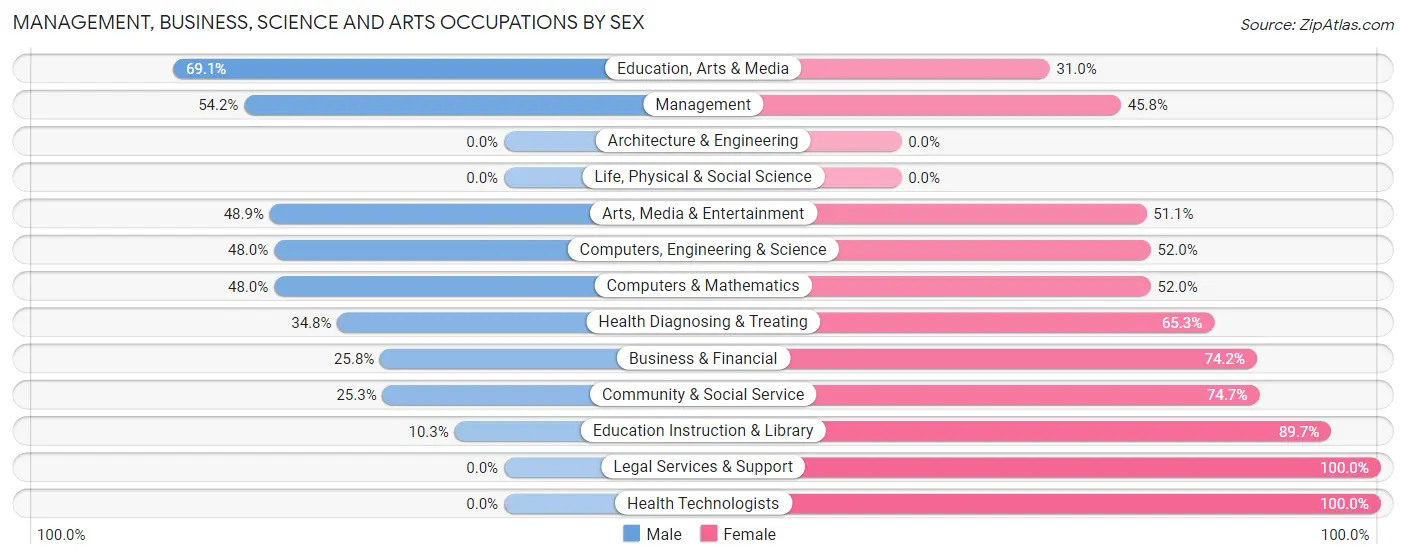
| Occupation | Male | Female |
| Management | 123 (54.2%) | 104 (45.8%) |
| Business & Financial | 39 (25.8%) | 112 (74.2%) |
| Computers, Engineering & Science | 47 (48.0%) | 51 (52.0%) |
| Computers & Mathematics | 47 (48.0%) | 51 (52.0%) |
| Architecture & Engineering | 0 (0.0%) | 0 (0.0%) |
| Life, Physical & Social Science | 0 (0.0%) | 0 (0.0%) |
| Community & Social Service | 130 (25.3%) | 383 (74.7%) |
| Education, Arts & Media | 58 (69.1%) | 26 (30.9%) |
| Legal Services & Support | 0 (0.0%) | 60 (100.0%) |
| Education Instruction & Library | 29 (10.3%) | 252 (89.7%) |
| Arts, Media & Entertainment | 43 (48.9%) | 45 (51.1%) |
| Health Diagnosing & Treating | 41 (34.7%) | 77 (65.2%) |
| Health Technologists | 0 (0.0%) | 17 (100.0%) |
| Total (Category) | 380 (34.3%) | 727 (65.7%) |
| Total (Overall) | 1,792 (40.1%) | 2,679 (59.9%) |
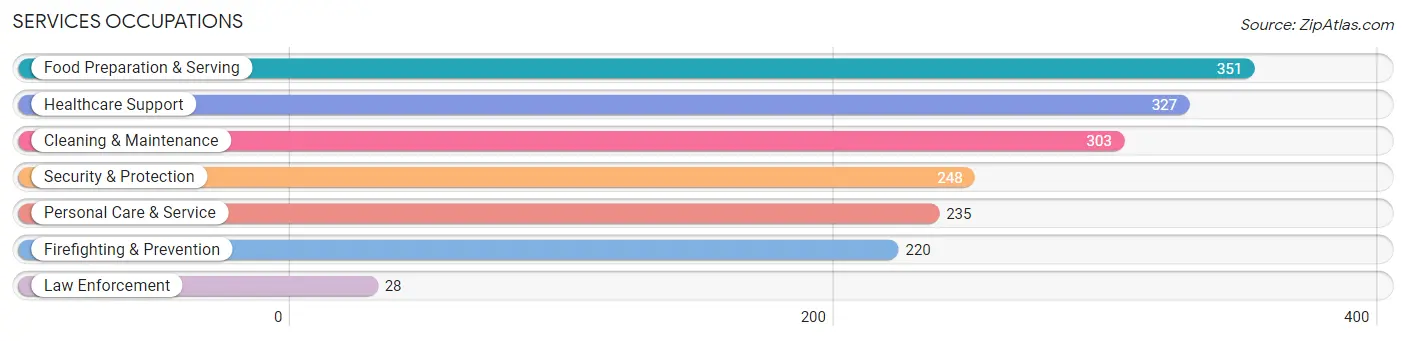
Services Occupations
The most common Services occupations in Panthersville are Food Preparation & Serving (351 | 7.9%), Healthcare Support (327 | 7.3%), Cleaning & Maintenance (303 | 6.8%), Security & Protection (248 | 5.6%), and Personal Care & Service (235 | 5.3%).
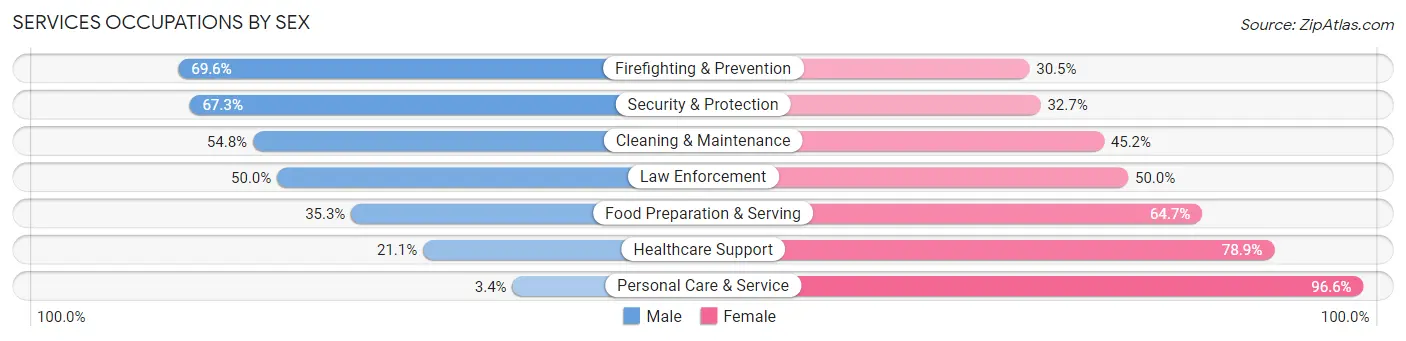
Services Occupations by Sex
Within the Services occupations in Panthersville, the most male-oriented occupations are Firefighting & Prevention (69.6%), Security & Protection (67.3%), and Cleaning & Maintenance (54.8%), while the most female-oriented occupations are Personal Care & Service (96.6%), Healthcare Support (78.9%), and Food Preparation & Serving (64.7%).
| Occupation | Male | Female |
| Healthcare Support | 69 (21.1%) | 258 (78.9%) |
| Security & Protection | 167 (67.3%) | 81 (32.7%) |
| Firefighting & Prevention | 153 (69.6%) | 67 (30.4%) |
| Law Enforcement | 14 (50.0%) | 14 (50.0%) |
| Food Preparation & Serving | 124 (35.3%) | 227 (64.7%) |
| Cleaning & Maintenance | 166 (54.8%) | 137 (45.2%) |
| Personal Care & Service | 8 (3.4%) | 227 (96.6%) |
| Total (Category) | 534 (36.5%) | 930 (63.5%) |
| Total (Overall) | 1,792 (40.1%) | 2,679 (59.9%) |
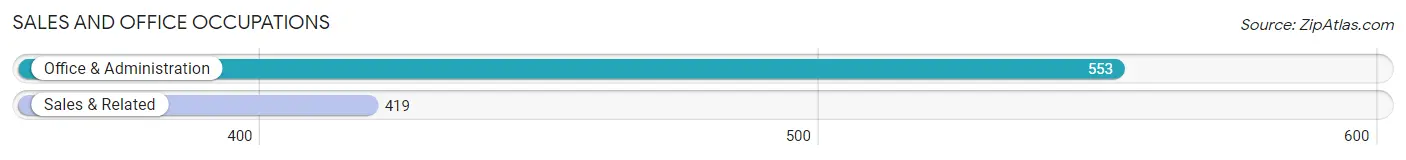
Sales and Office Occupations
The most common Sales and Office occupations in Panthersville are Office & Administration (553 | 12.4%), and Sales & Related (419 | 9.4%).
Sales and Office Occupations by Sex
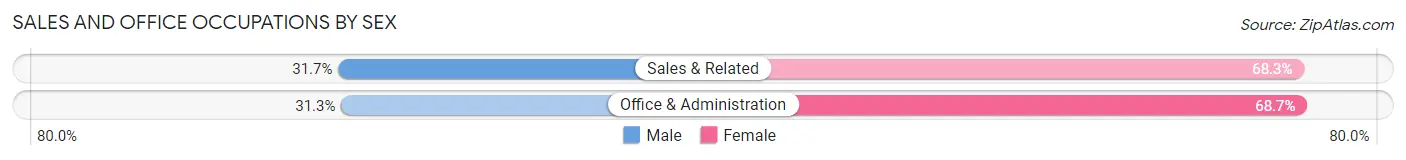
| Occupation | Male | Female |
| Sales & Related | 133 (31.7%) | 286 (68.3%) |
| Office & Administration | 173 (31.3%) | 380 (68.7%) |
| Total (Category) | 306 (31.5%) | 666 (68.5%) |
| Total (Overall) | 1,792 (40.1%) | 2,679 (59.9%) |
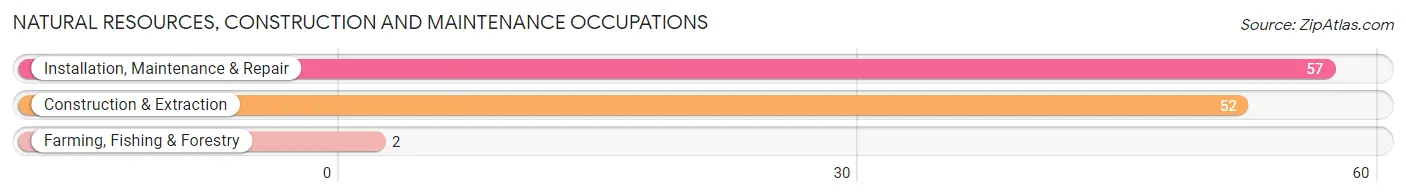
Natural Resources, Construction and Maintenance Occupations
The most common Natural Resources, Construction and Maintenance occupations in Panthersville are Installation, Maintenance & Repair (57 | 1.3%), Construction & Extraction (52 | 1.2%), and Farming, Fishing & Forestry (2 | 0.0%).
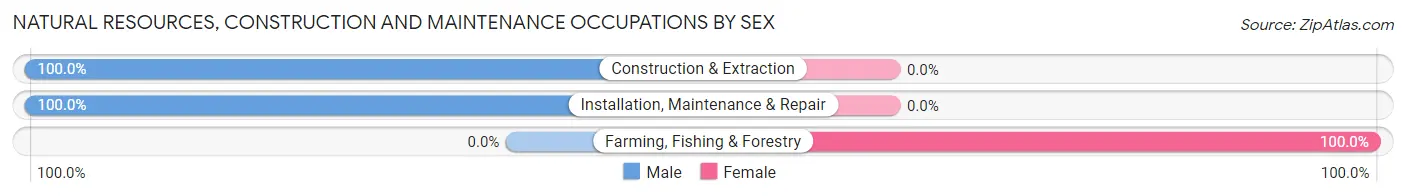
Natural Resources, Construction and Maintenance Occupations by Sex
| Occupation | Male | Female |
| Farming, Fishing & Forestry | 0 (0.0%) | 2 (100.0%) |
| Construction & Extraction | 52 (100.0%) | 0 (0.0%) |
| Installation, Maintenance & Repair | 57 (100.0%) | 0 (0.0%) |
| Total (Category) | 109 (98.2%) | 2 (1.8%) |
| Total (Overall) | 1,792 (40.1%) | 2,679 (59.9%) |
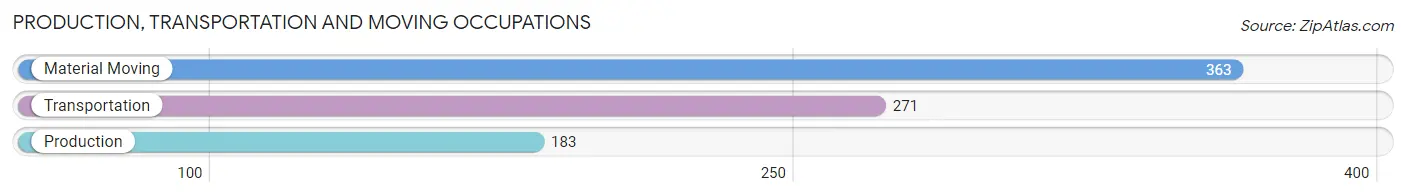
Production, Transportation and Moving Occupations
The most common Production, Transportation and Moving occupations in Panthersville are Material Moving (363 | 8.1%), Transportation (271 | 6.1%), and Production (183 | 4.1%).
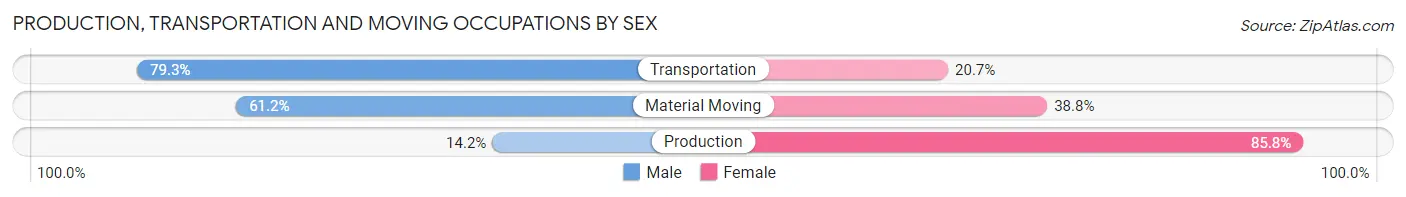
Production, Transportation and Moving Occupations by Sex
| Occupation | Male | Female |
| Production | 26 (14.2%) | 157 (85.8%) |
| Transportation | 215 (79.3%) | 56 (20.7%) |
| Material Moving | 222 (61.2%) | 141 (38.8%) |
| Total (Category) | 463 (56.7%) | 354 (43.3%) |
| Total (Overall) | 1,792 (40.1%) | 2,679 (59.9%) |
Employment Industries by Sex in Panthersville
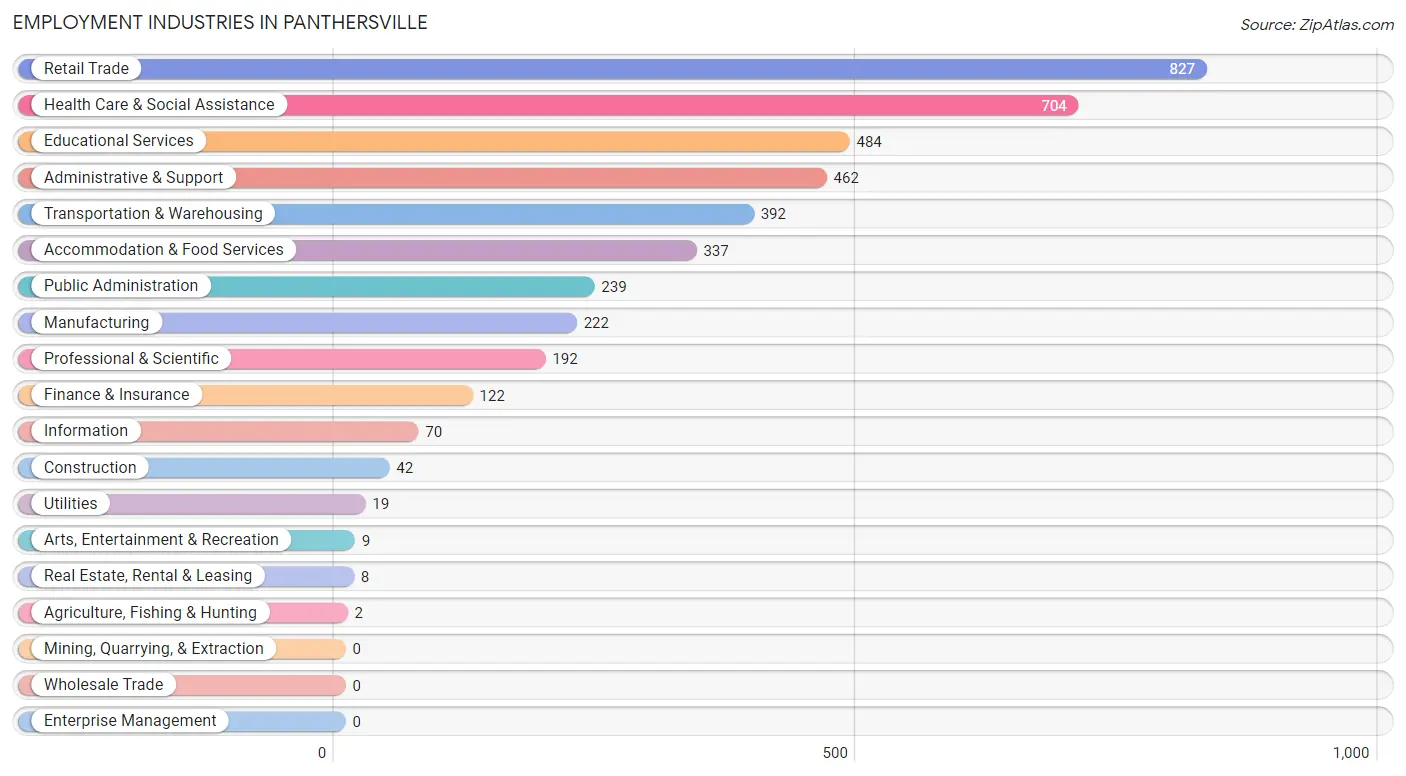
Employment Industries in Panthersville
The major employment industries in Panthersville include Retail Trade (827 | 18.5%), Health Care & Social Assistance (704 | 15.8%), Educational Services (484 | 10.8%), Administrative & Support (462 | 10.3%), and Transportation & Warehousing (392 | 8.8%).
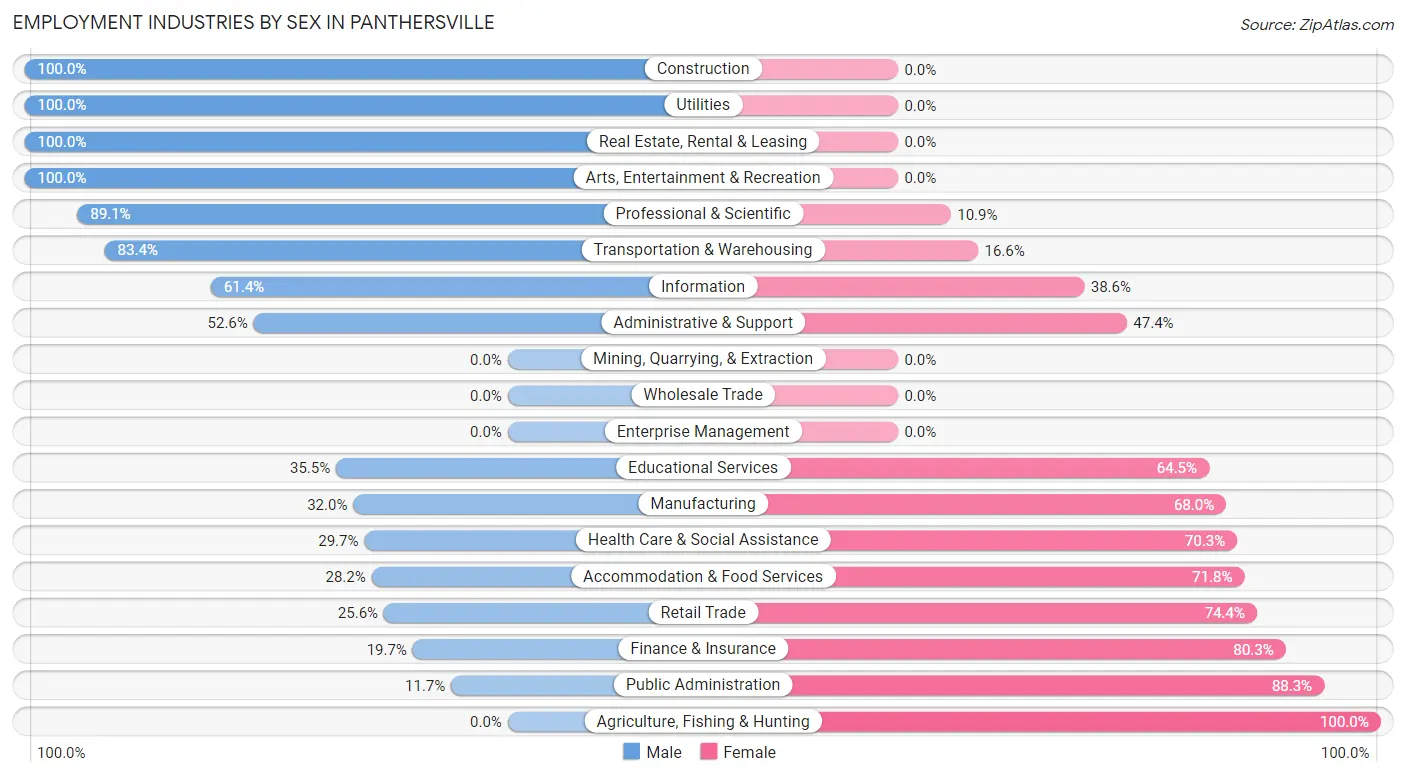
Employment Industries by Sex in Panthersville
The Panthersville industries that see more men than women are Construction (100.0%), Utilities (100.0%), and Real Estate, Rental & Leasing (100.0%), whereas the industries that tend to have a higher number of women are Agriculture, Fishing & Hunting (100.0%), Public Administration (88.3%), and Finance & Insurance (80.3%).
| Industry | Male | Female |
| Agriculture, Fishing & Hunting | 0 (0.0%) | 2 (100.0%) |
| Mining, Quarrying, & Extraction | 0 (0.0%) | 0 (0.0%) |
| Construction | 42 (100.0%) | 0 (0.0%) |
| Manufacturing | 71 (32.0%) | 151 (68.0%) |
| Wholesale Trade | 0 (0.0%) | 0 (0.0%) |
| Retail Trade | 212 (25.6%) | 615 (74.4%) |
| Transportation & Warehousing | 327 (83.4%) | 65 (16.6%) |
| Utilities | 19 (100.0%) | 0 (0.0%) |
| Information | 43 (61.4%) | 27 (38.6%) |
| Finance & Insurance | 24 (19.7%) | 98 (80.3%) |
| Real Estate, Rental & Leasing | 8 (100.0%) | 0 (0.0%) |
| Professional & Scientific | 171 (89.1%) | 21 (10.9%) |
| Enterprise Management | 0 (0.0%) | 0 (0.0%) |
| Administrative & Support | 243 (52.6%) | 219 (47.4%) |
| Educational Services | 172 (35.5%) | 312 (64.5%) |
| Health Care & Social Assistance | 209 (29.7%) | 495 (70.3%) |
| Arts, Entertainment & Recreation | 9 (100.0%) | 0 (0.0%) |
| Accommodation & Food Services | 95 (28.2%) | 242 (71.8%) |
| Public Administration | 28 (11.7%) | 211 (88.3%) |
| Total | 1,792 (40.1%) | 2,679 (59.9%) |
Education in Panthersville
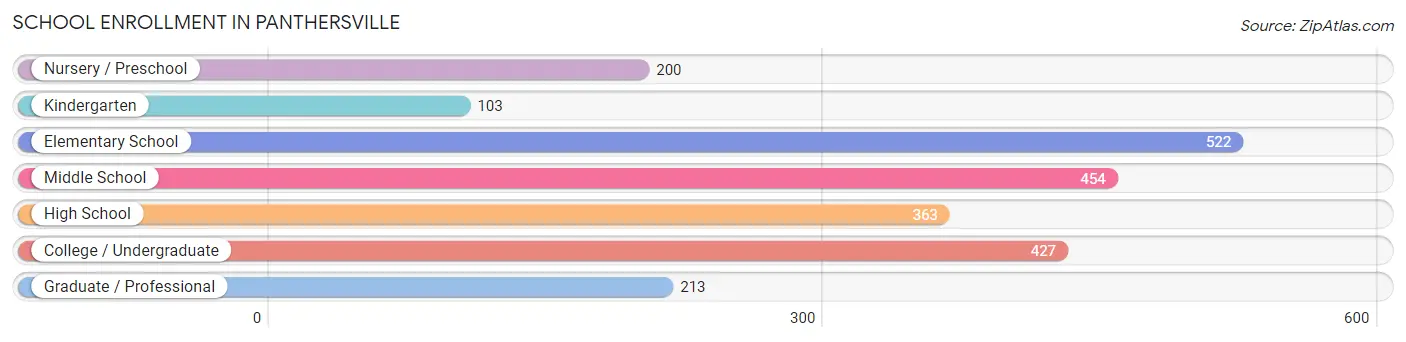
School Enrollment in Panthersville
The most common levels of schooling among the 2,282 students in Panthersville are elementary school (522 | 22.9%), middle school (454 | 19.9%), and college / undergraduate (427 | 18.7%).
| School Level | # Students | % Students |
| Nursery / Preschool | 200 | 8.8% |
| Kindergarten | 103 | 4.5% |
| Elementary School | 522 | 22.9% |
| Middle School | 454 | 19.9% |
| High School | 363 | 15.9% |
| College / Undergraduate | 427 | 18.7% |
| Graduate / Professional | 213 | 9.3% |
| Total | 2,282 | 100.0% |
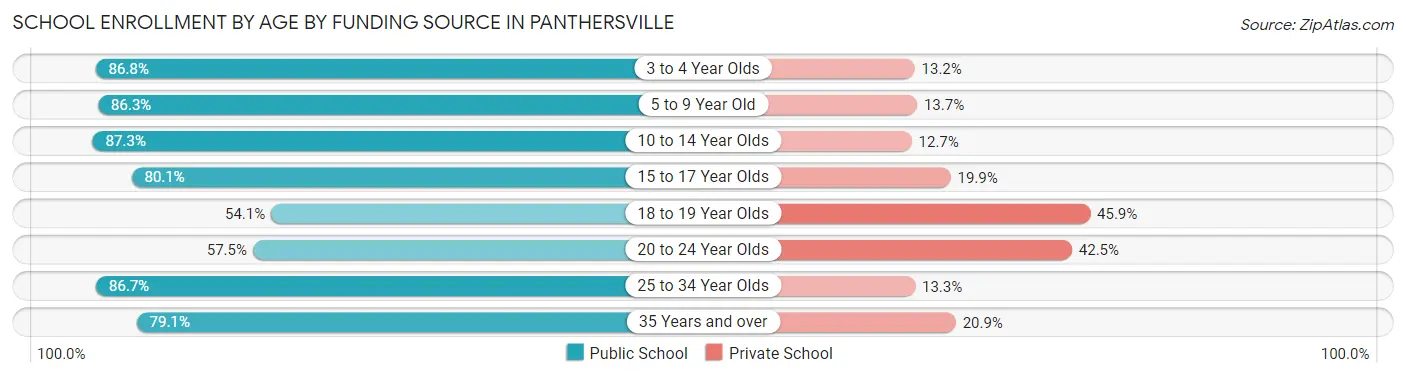
School Enrollment by Age by Funding Source in Panthersville
Out of a total of 2,282 students who are enrolled in schools in Panthersville, 406 (17.8%) attend a private institution, while the remaining 1,876 (82.2%) are enrolled in public schools. The age group of 18 to 19 year olds has the highest likelihood of being enrolled in private schools, with 28 (45.9% in the age bracket) enrolled. Conversely, the age group of 10 to 14 year olds has the lowest likelihood of being enrolled in a private school, with 545 (87.3% in the age bracket) attending a public institution.
| Age Bracket | Public School | Private School |
| 3 to 4 Year Olds | 138 (86.8%) | 21 (13.2%) |
| 5 to 9 Year Old | 512 (86.3%) | 81 (13.7%) |
| 10 to 14 Year Olds | 545 (87.3%) | 79 (12.7%) |
| 15 to 17 Year Olds | 177 (80.1%) | 44 (19.9%) |
| 18 to 19 Year Olds | 33 (54.1%) | 28 (45.9%) |
| 20 to 24 Year Olds | 92 (57.5%) | 68 (42.5%) |
| 25 to 34 Year Olds | 124 (86.7%) | 19 (13.3%) |
| 35 Years and over | 254 (79.1%) | 67 (20.9%) |
| Total | 1,876 (82.2%) | 406 (17.8%) |
Educational Attainment by Field of Study in Panthersville
Arts & humanities (447 | 22.2%), business (287 | 14.3%), social sciences (209 | 10.4%), bio, nature & agricultural (192 | 9.6%), and liberal arts & history (164 | 8.2%) are the most common fields of study among 2,010 individuals in Panthersville who have obtained a bachelor's degree or higher.
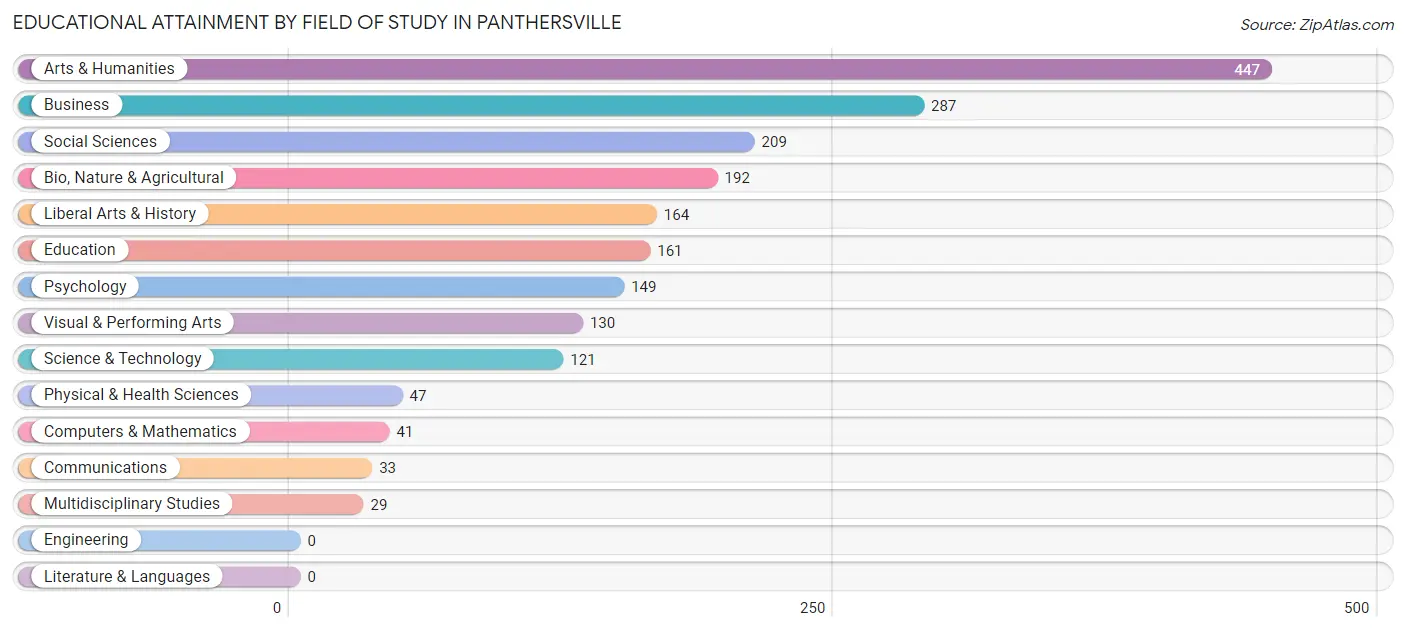
| Field of Study | # Graduates | % Graduates |
| Computers & Mathematics | 41 | 2.0% |
| Bio, Nature & Agricultural | 192 | 9.6% |
| Physical & Health Sciences | 47 | 2.3% |
| Psychology | 149 | 7.4% |
| Social Sciences | 209 | 10.4% |
| Engineering | 0 | 0.0% |
| Multidisciplinary Studies | 29 | 1.4% |
| Science & Technology | 121 | 6.0% |
| Business | 287 | 14.3% |
| Education | 161 | 8.0% |
| Literature & Languages | 0 | 0.0% |
| Liberal Arts & History | 164 | 8.2% |
| Visual & Performing Arts | 130 | 6.5% |
| Communications | 33 | 1.6% |
| Arts & Humanities | 447 | 22.2% |
| Total | 2,010 | 100.0% |
Transportation & Commute in Panthersville
Vehicle Availability by Sex in Panthersville
The most prevalent vehicle ownership categories in Panthersville are males with 1 vehicle (824, accounting for 46.0%) and females with 1 vehicle (1,026, making up 31.2%).
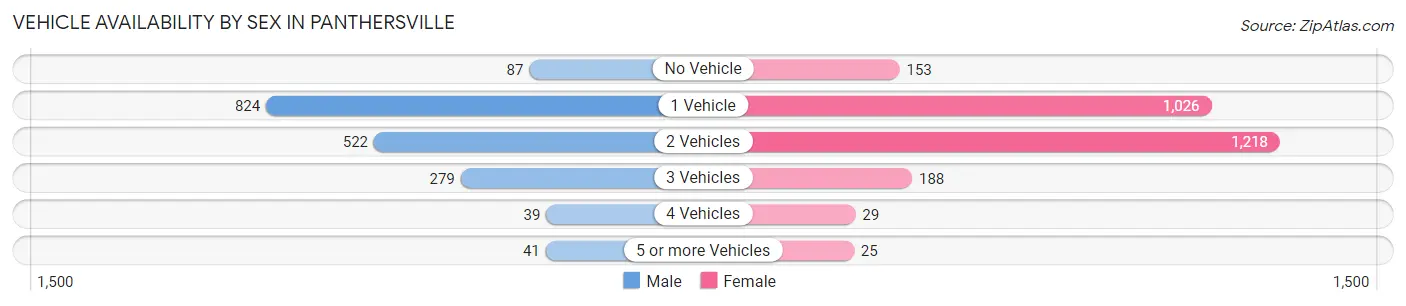
| Vehicles Available | Male | Female |
| No Vehicle | 87 (4.9%) | 153 (5.8%) |
| 1 Vehicle | 824 (46.0%) | 1,026 (38.9%) |
| 2 Vehicles | 522 (29.1%) | 1,218 (46.2%) |
| 3 Vehicles | 279 (15.6%) | 188 (7.1%) |
| 4 Vehicles | 39 (2.2%) | 29 (1.1%) |
| 5 or more Vehicles | 41 (2.3%) | 25 (0.9%) |
| Total | 1,792 (100.0%) | 2,639 (100.0%) |
Commute Time in Panthersville
The most frequently occuring commute durations in Panthersville are 20 to 24 minutes (686 commuters, 17.1%), 30 to 34 minutes (580 commuters, 14.5%), and 25 to 29 minutes (538 commuters, 13.4%).
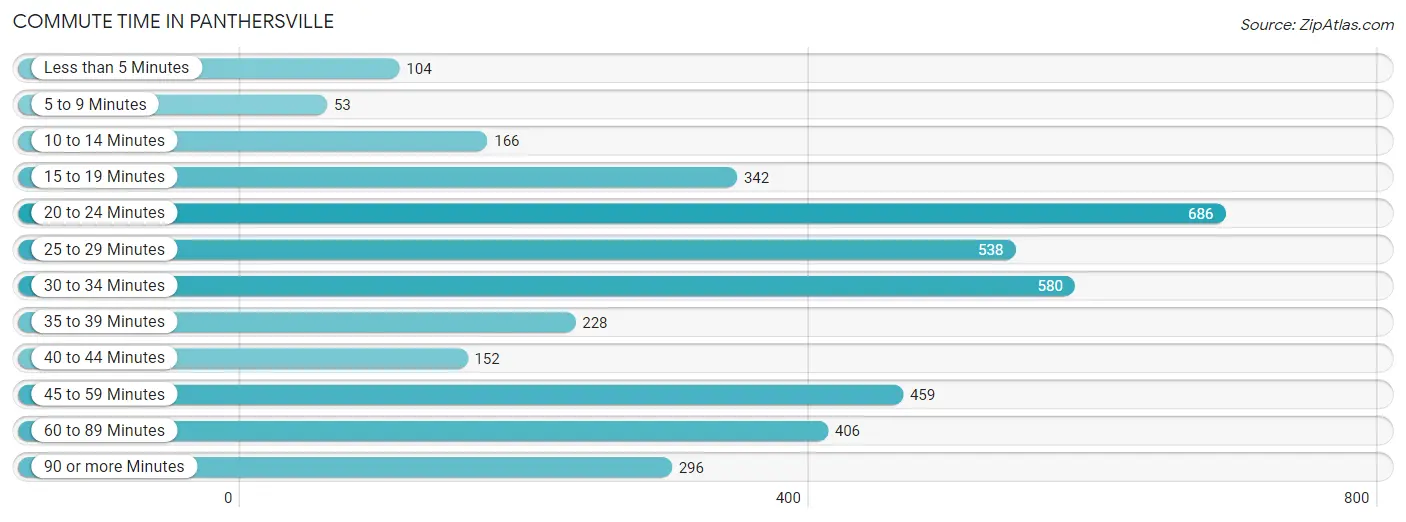
| Commute Time | # Commuters | % Commuters |
| Less than 5 Minutes | 104 | 2.6% |
| 5 to 9 Minutes | 53 | 1.3% |
| 10 to 14 Minutes | 166 | 4.1% |
| 15 to 19 Minutes | 342 | 8.5% |
| 20 to 24 Minutes | 686 | 17.1% |
| 25 to 29 Minutes | 538 | 13.4% |
| 30 to 34 Minutes | 580 | 14.5% |
| 35 to 39 Minutes | 228 | 5.7% |
| 40 to 44 Minutes | 152 | 3.8% |
| 45 to 59 Minutes | 459 | 11.5% |
| 60 to 89 Minutes | 406 | 10.1% |
| 90 or more Minutes | 296 | 7.4% |
Commute Time by Sex in Panthersville
The most common commute times in Panthersville are 20 to 24 minutes (348 commuters, 21.8%) for males and 25 to 29 minutes (414 commuters, 17.2%) for females.
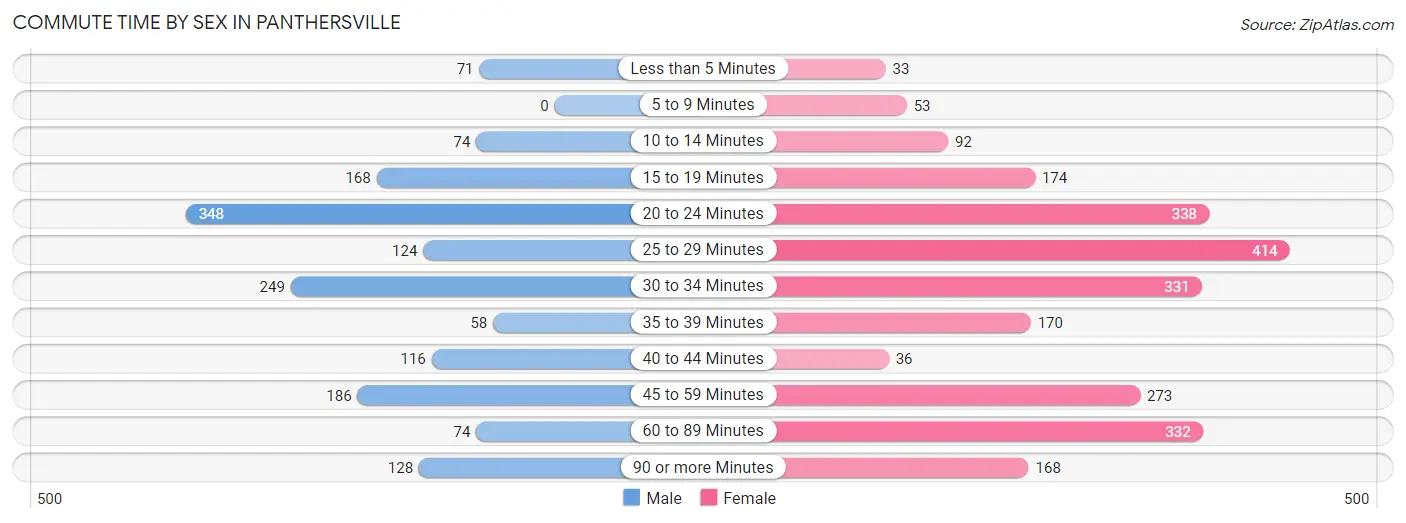
| Commute Time | Male | Female |
| Less than 5 Minutes | 71 (4.4%) | 33 (1.4%) |
| 5 to 9 Minutes | 0 (0.0%) | 53 (2.2%) |
| 10 to 14 Minutes | 74 (4.6%) | 92 (3.8%) |
| 15 to 19 Minutes | 168 (10.5%) | 174 (7.2%) |
| 20 to 24 Minutes | 348 (21.8%) | 338 (14.0%) |
| 25 to 29 Minutes | 124 (7.8%) | 414 (17.2%) |
| 30 to 34 Minutes | 249 (15.6%) | 331 (13.7%) |
| 35 to 39 Minutes | 58 (3.6%) | 170 (7.0%) |
| 40 to 44 Minutes | 116 (7.3%) | 36 (1.5%) |
| 45 to 59 Minutes | 186 (11.7%) | 273 (11.3%) |
| 60 to 89 Minutes | 74 (4.6%) | 332 (13.8%) |
| 90 or more Minutes | 128 (8.0%) | 168 (7.0%) |
Time of Departure to Work by Sex in Panthersville
The most frequent times of departure to work in Panthersville are 12:00 PM to 3:59 PM (298, 18.7%) for males and 7:00 AM to 7:29 AM (474, 19.6%) for females.
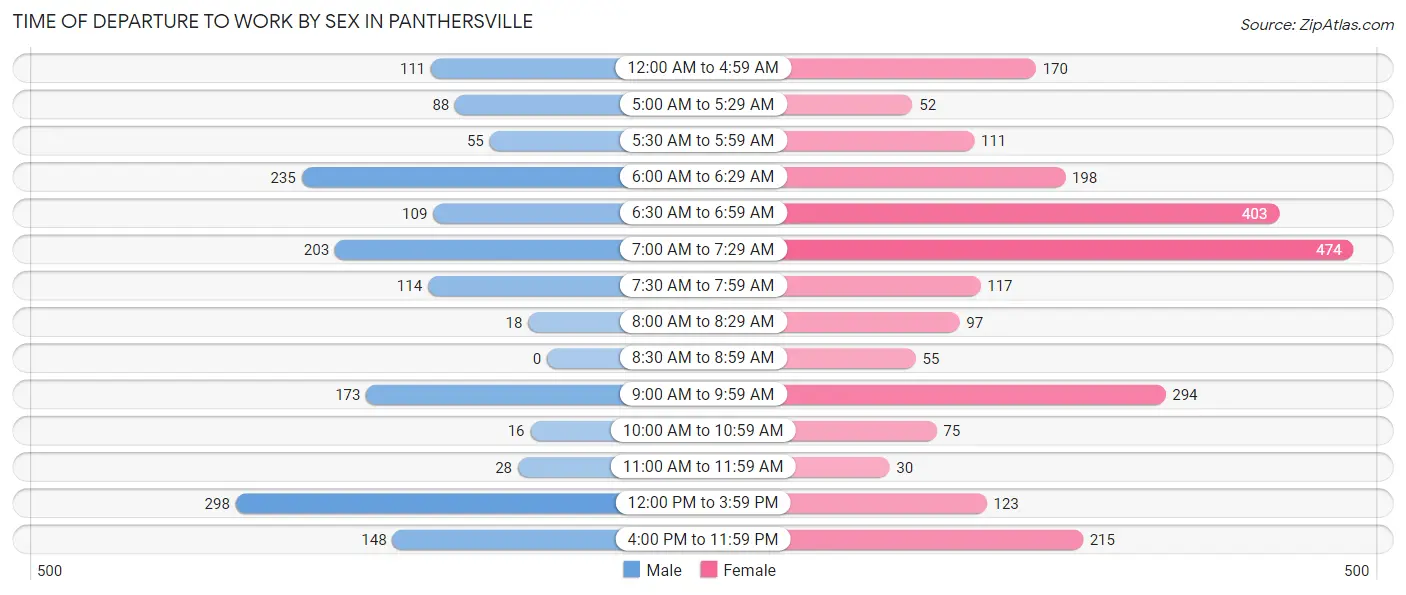
| Time of Departure | Male | Female |
| 12:00 AM to 4:59 AM | 111 (7.0%) | 170 (7.0%) |
| 5:00 AM to 5:29 AM | 88 (5.5%) | 52 (2.1%) |
| 5:30 AM to 5:59 AM | 55 (3.5%) | 111 (4.6%) |
| 6:00 AM to 6:29 AM | 235 (14.7%) | 198 (8.2%) |
| 6:30 AM to 6:59 AM | 109 (6.8%) | 403 (16.7%) |
| 7:00 AM to 7:29 AM | 203 (12.7%) | 474 (19.6%) |
| 7:30 AM to 7:59 AM | 114 (7.1%) | 117 (4.9%) |
| 8:00 AM to 8:29 AM | 18 (1.1%) | 97 (4.0%) |
| 8:30 AM to 8:59 AM | 0 (0.0%) | 55 (2.3%) |
| 9:00 AM to 9:59 AM | 173 (10.8%) | 294 (12.2%) |
| 10:00 AM to 10:59 AM | 16 (1.0%) | 75 (3.1%) |
| 11:00 AM to 11:59 AM | 28 (1.8%) | 30 (1.2%) |
| 12:00 PM to 3:59 PM | 298 (18.7%) | 123 (5.1%) |
| 4:00 PM to 11:59 PM | 148 (9.3%) | 215 (8.9%) |
| Total | 1,596 (100.0%) | 2,414 (100.0%) |
Housing Occupancy in Panthersville
Occupancy by Ownership in Panthersville
Of the total 4,054 dwellings in Panthersville, owner-occupied units account for 1,907 (47.0%), while renter-occupied units make up 2,147 (53.0%).
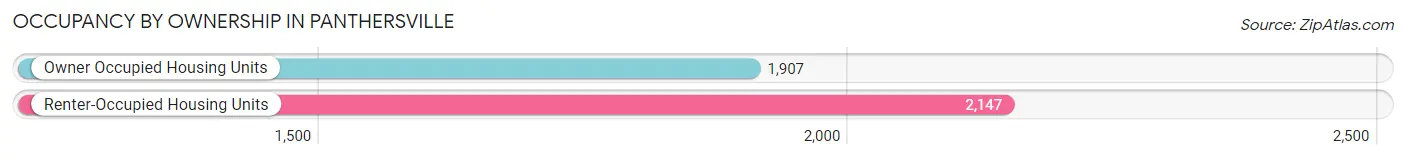
| Occupancy | # Housing Units | % Housing Units |
| Owner Occupied Housing Units | 1,907 | 47.0% |
| Renter-Occupied Housing Units | 2,147 | 53.0% |
| Total Occupied Housing Units | 4,054 | 100.0% |
Occupancy by Household Size in Panthersville
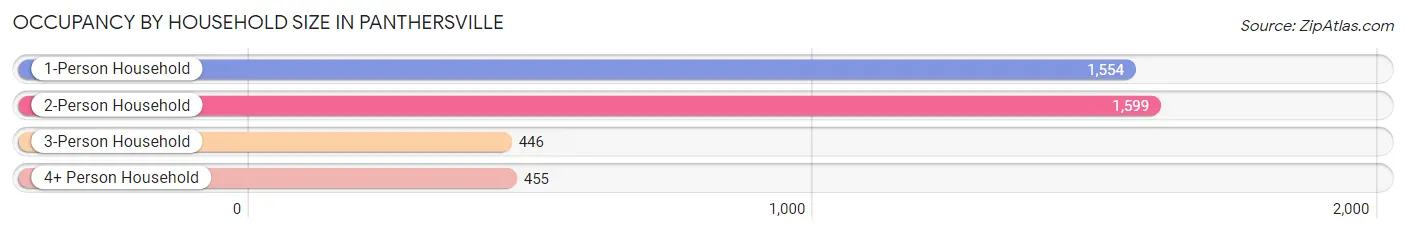
| Household Size | # Housing Units | % Housing Units |
| 1-Person Household | 1,554 | 38.3% |
| 2-Person Household | 1,599 | 39.4% |
| 3-Person Household | 446 | 11.0% |
| 4+ Person Household | 455 | 11.2% |
| Total Housing Units | 4,054 | 100.0% |
Occupancy by Ownership by Household Size in Panthersville
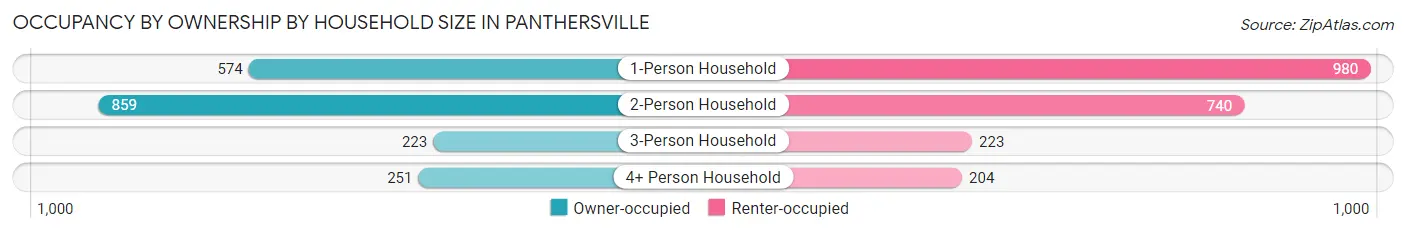
| Household Size | Owner-occupied | Renter-occupied |
| 1-Person Household | 574 (36.9%) | 980 (63.1%) |
| 2-Person Household | 859 (53.7%) | 740 (46.3%) |
| 3-Person Household | 223 (50.0%) | 223 (50.0%) |
| 4+ Person Household | 251 (55.2%) | 204 (44.8%) |
| Total Housing Units | 1,907 (47.0%) | 2,147 (53.0%) |
Occupancy by Educational Attainment in Panthersville
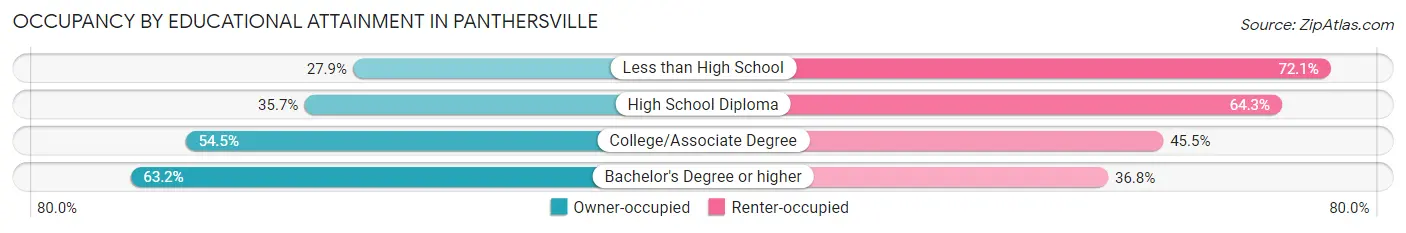
| Household Size | Owner-occupied | Renter-occupied |
| Less than High School | 140 (27.9%) | 361 (72.1%) |
| High School Diploma | 510 (35.7%) | 920 (64.3%) |
| College/Associate Degree | 530 (54.5%) | 443 (45.5%) |
| Bachelor's Degree or higher | 727 (63.2%) | 423 (36.8%) |
Occupancy by Age of Householder in Panthersville
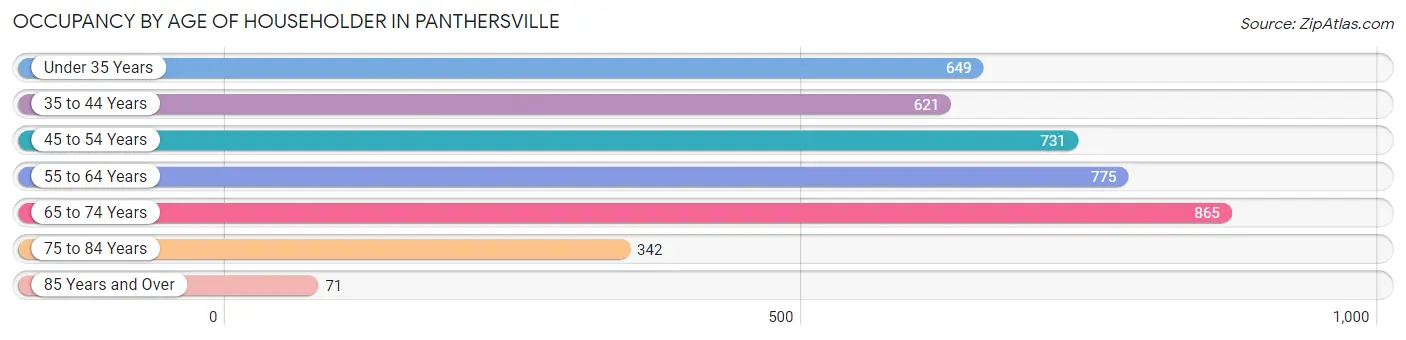
| Age Bracket | # Households | % Households |
| Under 35 Years | 649 | 16.0% |
| 35 to 44 Years | 621 | 15.3% |
| 45 to 54 Years | 731 | 18.0% |
| 55 to 64 Years | 775 | 19.1% |
| 65 to 74 Years | 865 | 21.3% |
| 75 to 84 Years | 342 | 8.4% |
| 85 Years and Over | 71 | 1.8% |
| Total | 4,054 | 100.0% |
Housing Finances in Panthersville
Median Income by Occupancy in Panthersville
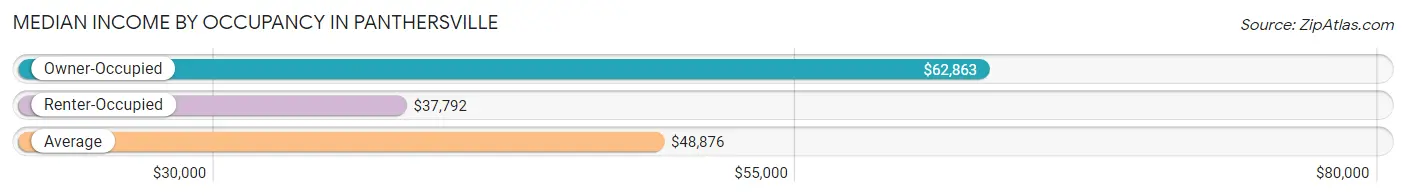
| Occupancy Type | # Households | Median Income |
| Owner-Occupied | 1,907 (47.0%) | $62,863 |
| Renter-Occupied | 2,147 (53.0%) | $37,792 |
| Average | 4,054 (100.0%) | $48,876 |
Occupancy by Householder Income Bracket in Panthersville
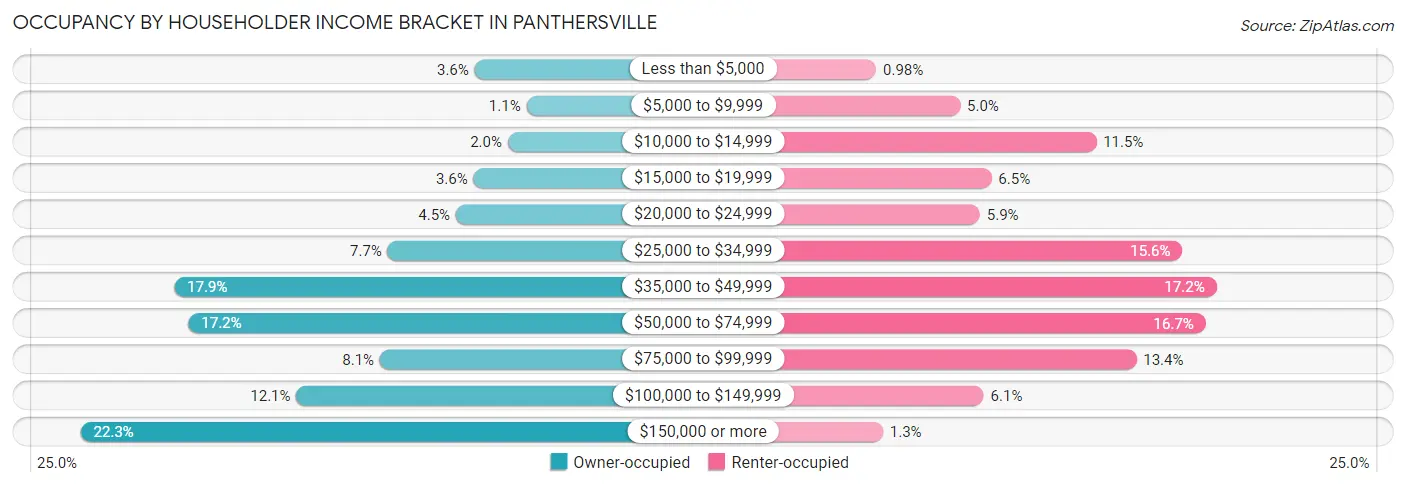
| Income Bracket | Owner-occupied | Renter-occupied |
| Less than $5,000 | 68 (3.6%) | 21 (1.0%) |
| $5,000 to $9,999 | 21 (1.1%) | 107 (5.0%) |
| $10,000 to $14,999 | 38 (2.0%) | 246 (11.5%) |
| $15,000 to $19,999 | 69 (3.6%) | 139 (6.5%) |
| $20,000 to $24,999 | 85 (4.5%) | 127 (5.9%) |
| $25,000 to $34,999 | 147 (7.7%) | 334 (15.6%) |
| $35,000 to $49,999 | 341 (17.9%) | 369 (17.2%) |
| $50,000 to $74,999 | 328 (17.2%) | 358 (16.7%) |
| $75,000 to $99,999 | 154 (8.1%) | 287 (13.4%) |
| $100,000 to $149,999 | 230 (12.1%) | 131 (6.1%) |
| $150,000 or more | 426 (22.3%) | 28 (1.3%) |
| Total | 1,907 (100.0%) | 2,147 (100.0%) |
Monthly Housing Cost Tiers in Panthersville
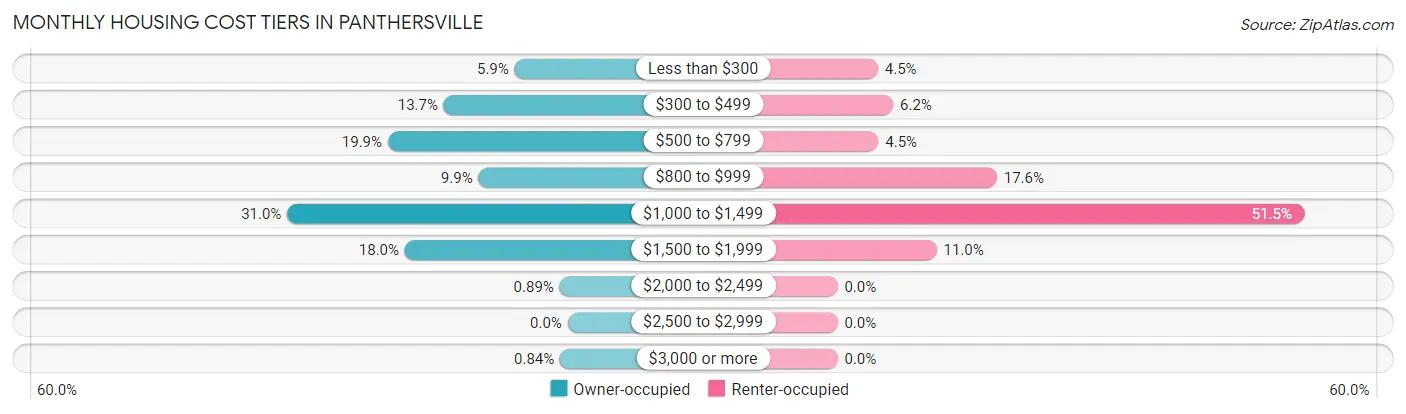
| Monthly Cost | Owner-occupied | Renter-occupied |
| Less than $300 | 112 (5.9%) | 96 (4.5%) |
| $300 to $499 | 261 (13.7%) | 132 (6.1%) |
| $500 to $799 | 379 (19.9%) | 97 (4.5%) |
| $800 to $999 | 188 (9.9%) | 378 (17.6%) |
| $1,000 to $1,499 | 591 (31.0%) | 1,106 (51.5%) |
| $1,500 to $1,999 | 343 (18.0%) | 235 (11.0%) |
| $2,000 to $2,499 | 17 (0.9%) | 0 (0.0%) |
| $2,500 to $2,999 | 0 (0.0%) | 0 (0.0%) |
| $3,000 or more | 16 (0.8%) | 0 (0.0%) |
| Total | 1,907 (100.0%) | 2,147 (100.0%) |
Physical Housing Characteristics in Panthersville
Housing Structures in Panthersville
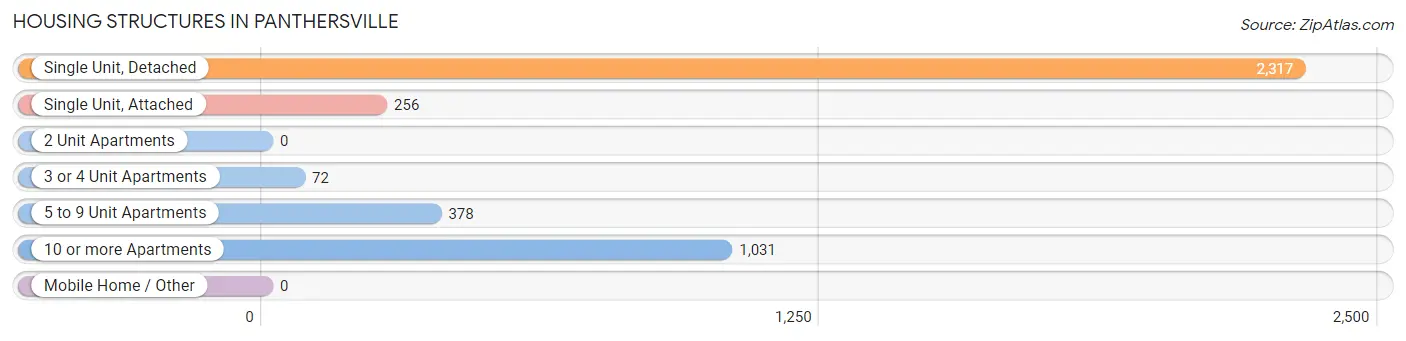
| Structure Type | # Housing Units | % Housing Units |
| Single Unit, Detached | 2,317 | 57.2% |
| Single Unit, Attached | 256 | 6.3% |
| 2 Unit Apartments | 0 | 0.0% |
| 3 or 4 Unit Apartments | 72 | 1.8% |
| 5 to 9 Unit Apartments | 378 | 9.3% |
| 10 or more Apartments | 1,031 | 25.4% |
| Mobile Home / Other | 0 | 0.0% |
| Total | 4,054 | 100.0% |
Housing Structures by Occupancy in Panthersville
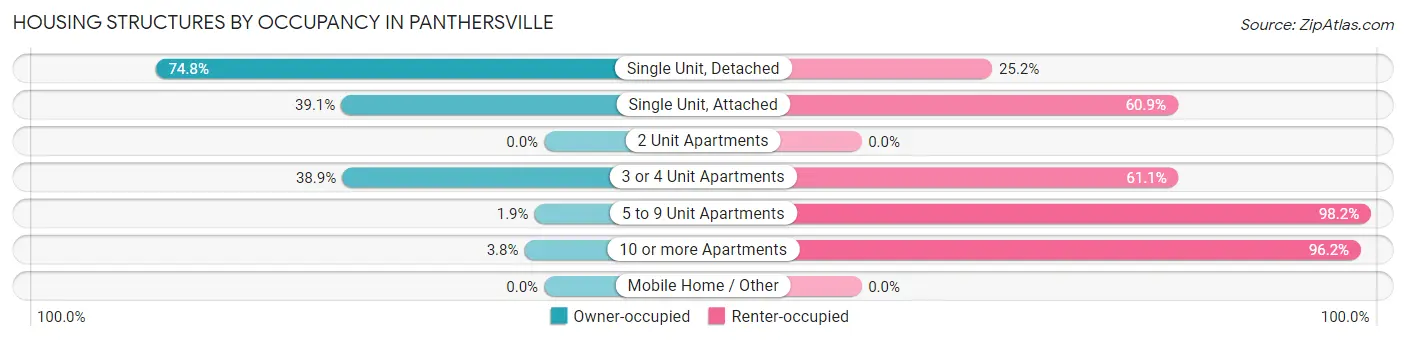
| Structure Type | Owner-occupied | Renter-occupied |
| Single Unit, Detached | 1,733 (74.8%) | 584 (25.2%) |
| Single Unit, Attached | 100 (39.1%) | 156 (60.9%) |
| 2 Unit Apartments | 0 (0.0%) | 0 (0.0%) |
| 3 or 4 Unit Apartments | 28 (38.9%) | 44 (61.1%) |
| 5 to 9 Unit Apartments | 7 (1.8%) | 371 (98.2%) |
| 10 or more Apartments | 39 (3.8%) | 992 (96.2%) |
| Mobile Home / Other | 0 (0.0%) | 0 (0.0%) |
| Total | 1,907 (47.0%) | 2,147 (53.0%) |
Housing Structures by Number of Rooms in Panthersville
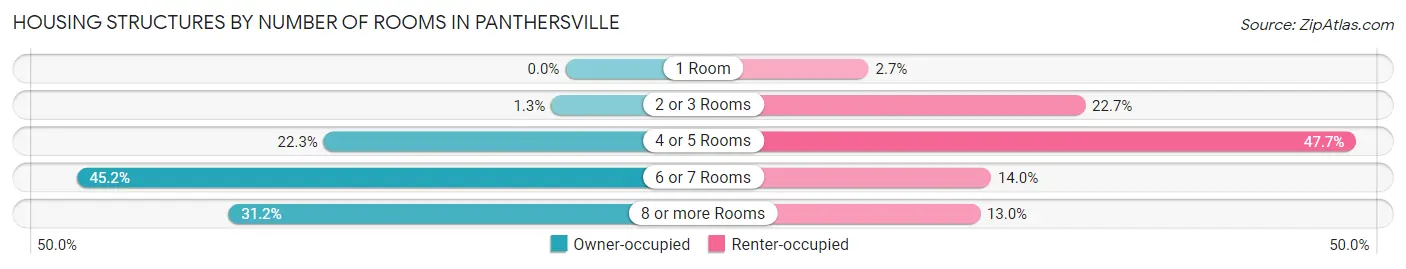
| Number of Rooms | Owner-occupied | Renter-occupied |
| 1 Room | 0 (0.0%) | 57 (2.6%) |
| 2 or 3 Rooms | 25 (1.3%) | 487 (22.7%) |
| 4 or 5 Rooms | 426 (22.3%) | 1,025 (47.7%) |
| 6 or 7 Rooms | 862 (45.2%) | 300 (14.0%) |
| 8 or more Rooms | 594 (31.1%) | 278 (13.0%) |
| Total | 1,907 (100.0%) | 2,147 (100.0%) |
Housing Structure by Heating Type in Panthersville
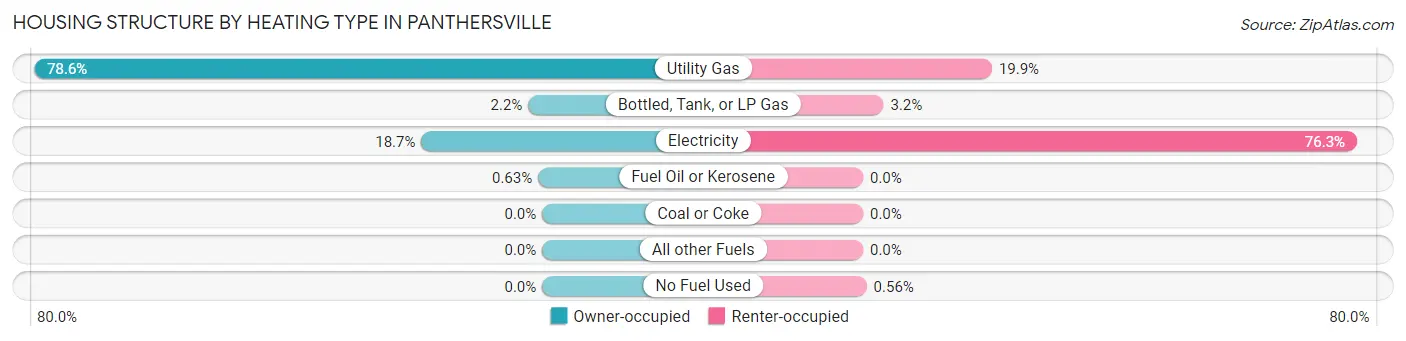
| Heating Type | Owner-occupied | Renter-occupied |
| Utility Gas | 1,498 (78.5%) | 428 (19.9%) |
| Bottled, Tank, or LP Gas | 41 (2.1%) | 68 (3.2%) |
| Electricity | 356 (18.7%) | 1,639 (76.3%) |
| Fuel Oil or Kerosene | 12 (0.6%) | 0 (0.0%) |
| Coal or Coke | 0 (0.0%) | 0 (0.0%) |
| All other Fuels | 0 (0.0%) | 0 (0.0%) |
| No Fuel Used | 0 (0.0%) | 12 (0.6%) |
| Total | 1,907 (100.0%) | 2,147 (100.0%) |
Household Vehicle Usage in Panthersville
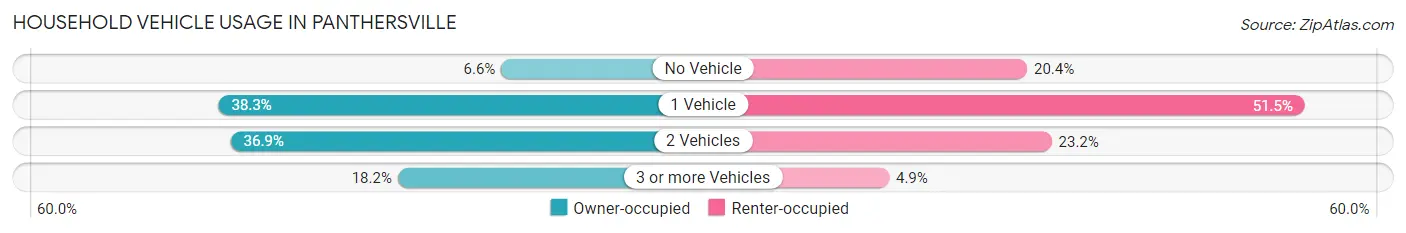
| Vehicles per Household | Owner-occupied | Renter-occupied |
| No Vehicle | 126 (6.6%) | 438 (20.4%) |
| 1 Vehicle | 730 (38.3%) | 1,106 (51.5%) |
| 2 Vehicles | 704 (36.9%) | 497 (23.2%) |
| 3 or more Vehicles | 347 (18.2%) | 106 (4.9%) |
| Total | 1,907 (100.0%) | 2,147 (100.0%) |
Real Estate & Mortgages in Panthersville
Real Estate and Mortgage Overview in Panthersville
| Characteristic | Without Mortgage | With Mortgage |
| Housing Units | 695 | 1,212 |
| Median Property Value | $181,600 | $172,900 |
| Median Household Income | $71,719 | $217 |
| Monthly Housing Costs | $485 | $16 |
| Real Estate Taxes | $1,069 | $104 |
Property Value by Mortgage Status in Panthersville
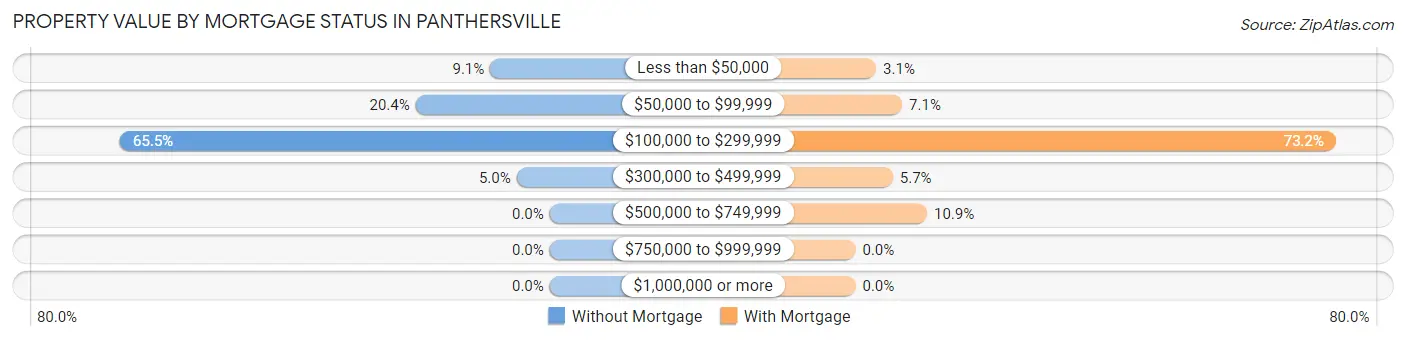
| Property Value | Without Mortgage | With Mortgage |
| Less than $50,000 | 63 (9.1%) | 38 (3.1%) |
| $50,000 to $99,999 | 142 (20.4%) | 86 (7.1%) |
| $100,000 to $299,999 | 455 (65.5%) | 887 (73.2%) |
| $300,000 to $499,999 | 35 (5.0%) | 69 (5.7%) |
| $500,000 to $749,999 | 0 (0.0%) | 132 (10.9%) |
| $750,000 to $999,999 | 0 (0.0%) | 0 (0.0%) |
| $1,000,000 or more | 0 (0.0%) | 0 (0.0%) |
| Total | 695 (100.0%) | 1,212 (100.0%) |
Household Income by Mortgage Status in Panthersville
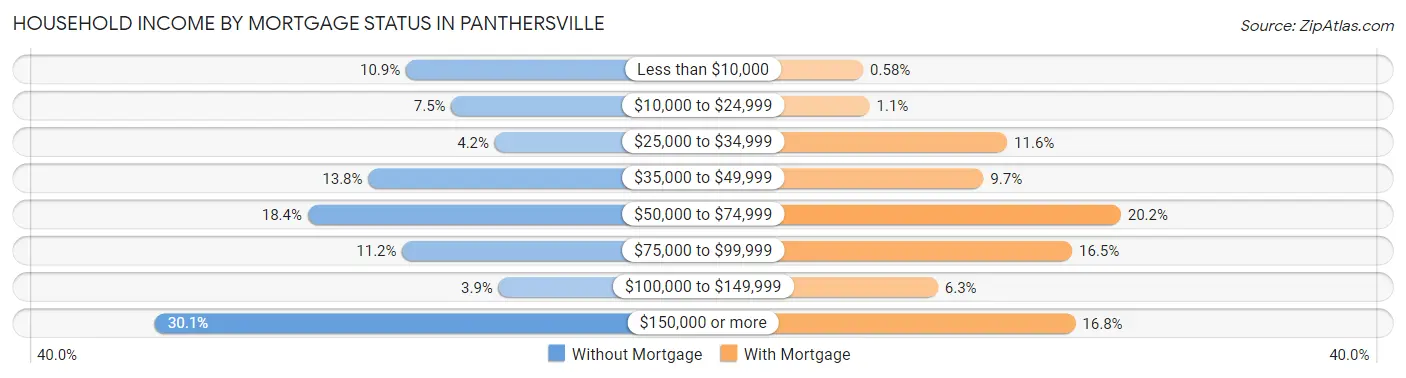
| Household Income | Without Mortgage | With Mortgage |
| Less than $10,000 | 76 (10.9%) | 7 (0.6%) |
| $10,000 to $24,999 | 52 (7.5%) | 13 (1.1%) |
| $25,000 to $34,999 | 29 (4.2%) | 140 (11.6%) |
| $35,000 to $49,999 | 96 (13.8%) | 118 (9.7%) |
| $50,000 to $74,999 | 128 (18.4%) | 245 (20.2%) |
| $75,000 to $99,999 | 78 (11.2%) | 200 (16.5%) |
| $100,000 to $149,999 | 27 (3.9%) | 76 (6.3%) |
| $150,000 or more | 209 (30.1%) | 203 (16.8%) |
| Total | 695 (100.0%) | 1,212 (100.0%) |
Property Value to Household Income Ratio in Panthersville
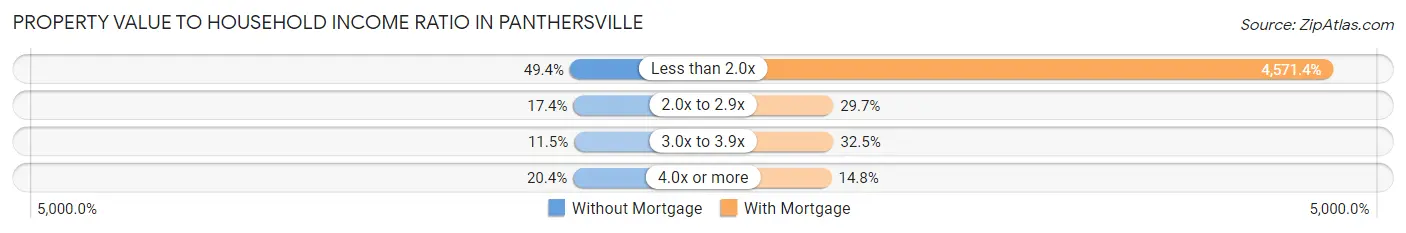
| Value-to-Income Ratio | Without Mortgage | With Mortgage |
| Less than 2.0x | 343 (49.3%) | 55,405 (4,571.4%) |
| 2.0x to 2.9x | 121 (17.4%) | 360 (29.7%) |
| 3.0x to 3.9x | 80 (11.5%) | 394 (32.5%) |
| 4.0x or more | 142 (20.4%) | 179 (14.8%) |
| Total | 695 (100.0%) | 1,212 (100.0%) |
Real Estate Taxes by Mortgage Status in Panthersville
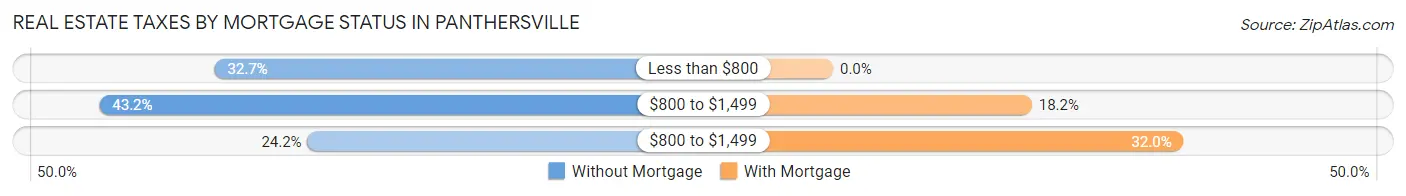
| Property Taxes | Without Mortgage | With Mortgage |
| Less than $800 | 227 (32.7%) | 0 (0.0%) |
| $800 to $1,499 | 300 (43.2%) | 220 (18.1%) |
| $800 to $1,499 | 168 (24.2%) | 388 (32.0%) |
| Total | 695 (100.0%) | 1,212 (100.0%) |
Health & Disability in Panthersville
Health Insurance Coverage by Age in Panthersville
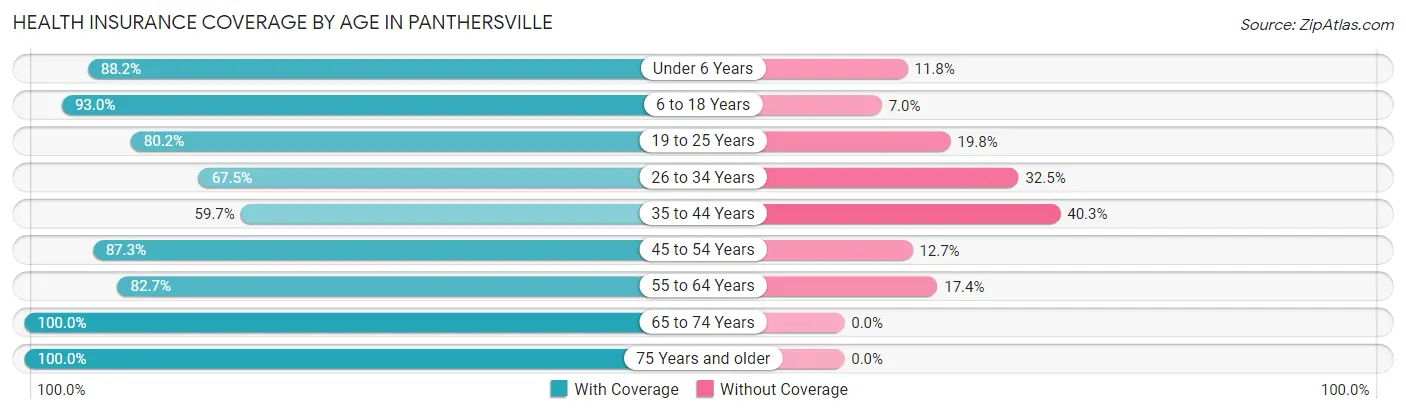
| Age Bracket | With Coverage | Without Coverage |
| Under 6 Years | 494 (88.2%) | 66 (11.8%) |
| 6 to 18 Years | 1,292 (93.0%) | 97 (7.0%) |
| 19 to 25 Years | 546 (80.2%) | 135 (19.8%) |
| 26 to 34 Years | 815 (67.5%) | 392 (32.5%) |
| 35 to 44 Years | 691 (59.7%) | 466 (40.3%) |
| 45 to 54 Years | 1,099 (87.3%) | 160 (12.7%) |
| 55 to 64 Years | 1,096 (82.7%) | 230 (17.3%) |
| 65 to 74 Years | 1,070 (100.0%) | 0 (0.0%) |
| 75 Years and older | 544 (100.0%) | 0 (0.0%) |
| Total | 7,647 (83.2%) | 1,546 (16.8%) |
Health Insurance Coverage by Citizenship Status in Panthersville
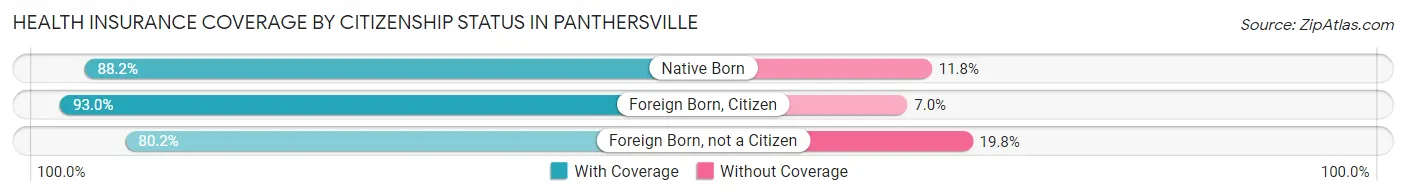
| Citizenship Status | With Coverage | Without Coverage |
| Native Born | 494 (88.2%) | 66 (11.8%) |
| Foreign Born, Citizen | 1,292 (93.0%) | 97 (7.0%) |
| Foreign Born, not a Citizen | 546 (80.2%) | 135 (19.8%) |
Health Insurance Coverage by Household Income in Panthersville
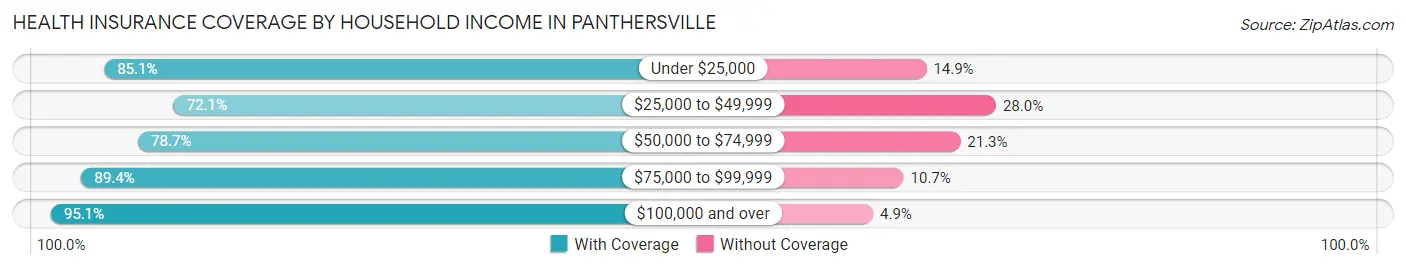
| Household Income | With Coverage | Without Coverage |
| Under $25,000 | 1,414 (85.1%) | 248 (14.9%) |
| $25,000 to $49,999 | 1,616 (72.1%) | 627 (28.0%) |
| $50,000 to $74,999 | 1,617 (78.7%) | 437 (21.3%) |
| $75,000 to $99,999 | 1,174 (89.3%) | 140 (10.6%) |
| $100,000 and over | 1,811 (95.1%) | 94 (4.9%) |
Public vs Private Health Insurance Coverage by Age in Panthersville
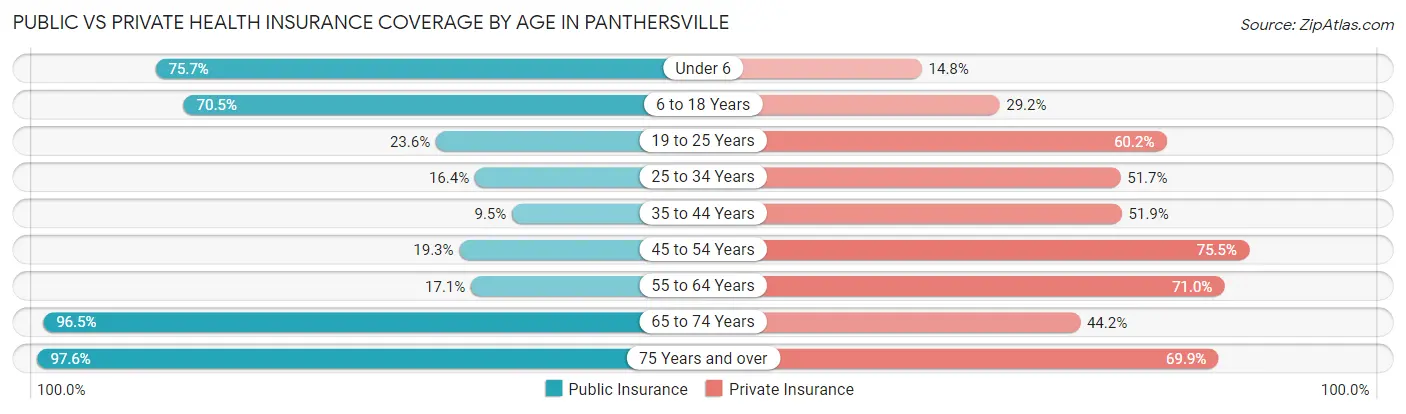
| Age Bracket | Public Insurance | Private Insurance |
| Under 6 | 424 (75.7%) | 83 (14.8%) |
| 6 to 18 Years | 979 (70.5%) | 406 (29.2%) |
| 19 to 25 Years | 161 (23.6%) | 410 (60.2%) |
| 25 to 34 Years | 198 (16.4%) | 624 (51.7%) |
| 35 to 44 Years | 110 (9.5%) | 601 (51.9%) |
| 45 to 54 Years | 243 (19.3%) | 951 (75.5%) |
| 55 to 64 Years | 227 (17.1%) | 941 (71.0%) |
| 65 to 74 Years | 1,033 (96.5%) | 473 (44.2%) |
| 75 Years and over | 531 (97.6%) | 380 (69.9%) |
| Total | 3,906 (42.5%) | 4,869 (53.0%) |
Disability Status by Sex by Age in Panthersville
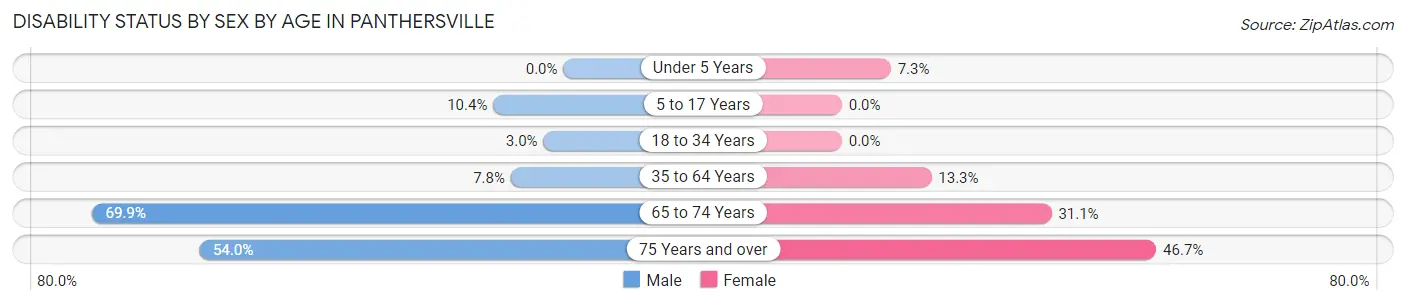
| Age Bracket | Male | Female |
| Under 5 Years | 0 (0.0%) | 23 (7.3%) |
| 5 to 17 Years | 87 (10.4%) | 0 (0.0%) |
| 18 to 34 Years | 30 (3.0%) | 0 (0.0%) |
| 35 to 64 Years | 129 (7.8%) | 278 (13.3%) |
| 65 to 74 Years | 346 (69.9%) | 179 (31.1%) |
| 75 Years and over | 82 (53.9%) | 183 (46.7%) |
Disability Class by Sex by Age in Panthersville
Disability Class: Hearing Difficulty
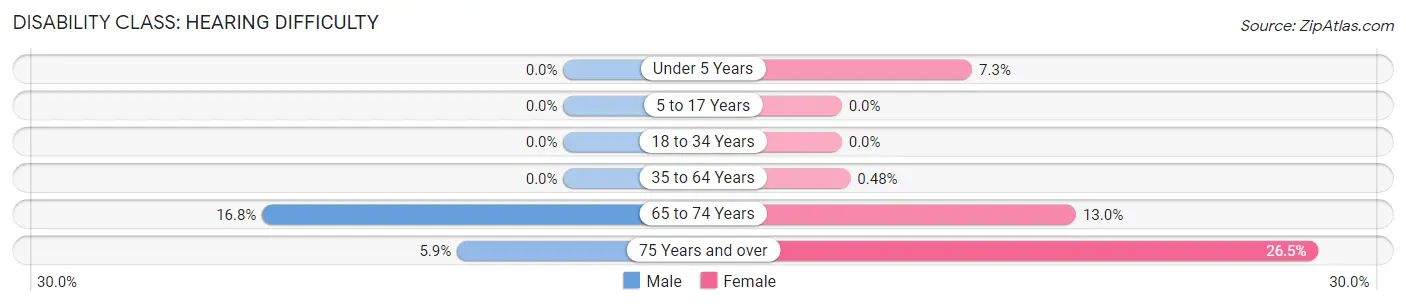
| Age Bracket | Male | Female |
| Under 5 Years | 0 (0.0%) | 23 (7.3%) |
| 5 to 17 Years | 0 (0.0%) | 0 (0.0%) |
| 18 to 34 Years | 0 (0.0%) | 0 (0.0%) |
| 35 to 64 Years | 0 (0.0%) | 10 (0.5%) |
| 65 to 74 Years | 83 (16.8%) | 75 (13.0%) |
| 75 Years and over | 9 (5.9%) | 104 (26.5%) |
Disability Class: Vision Difficulty
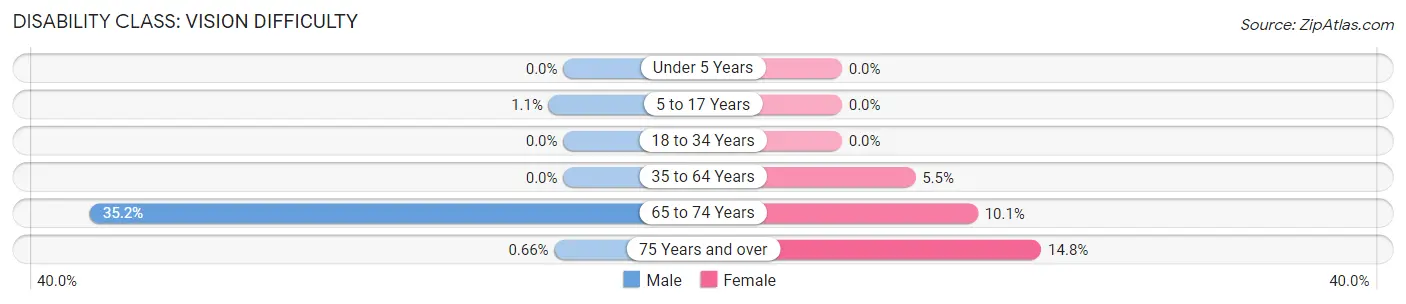
| Age Bracket | Male | Female |
| Under 5 Years | 0 (0.0%) | 0 (0.0%) |
| 5 to 17 Years | 9 (1.1%) | 0 (0.0%) |
| 18 to 34 Years | 0 (0.0%) | 0 (0.0%) |
| 35 to 64 Years | 0 (0.0%) | 114 (5.4%) |
| 65 to 74 Years | 174 (35.1%) | 58 (10.1%) |
| 75 Years and over | 1 (0.7%) | 58 (14.8%) |
Disability Class: Cognitive Difficulty
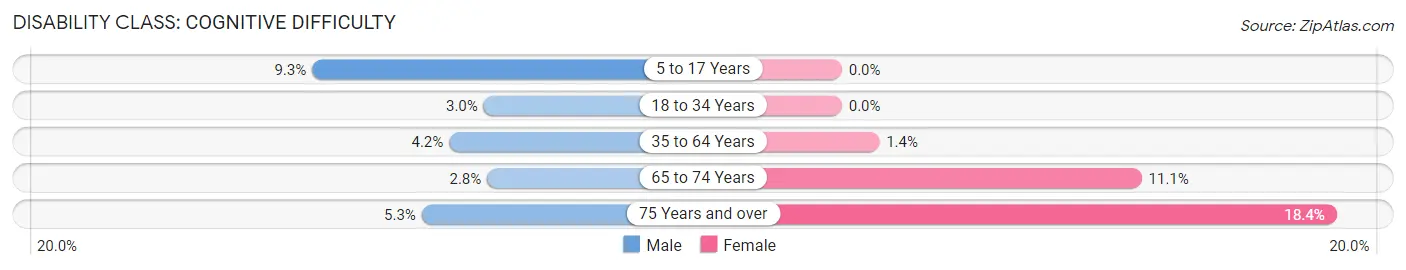
| Age Bracket | Male | Female |
| 5 to 17 Years | 78 (9.3%) | 0 (0.0%) |
| 18 to 34 Years | 30 (3.0%) | 0 (0.0%) |
| 35 to 64 Years | 70 (4.2%) | 29 (1.4%) |
| 65 to 74 Years | 14 (2.8%) | 64 (11.1%) |
| 75 Years and over | 8 (5.3%) | 72 (18.4%) |
Disability Class: Ambulatory Difficulty
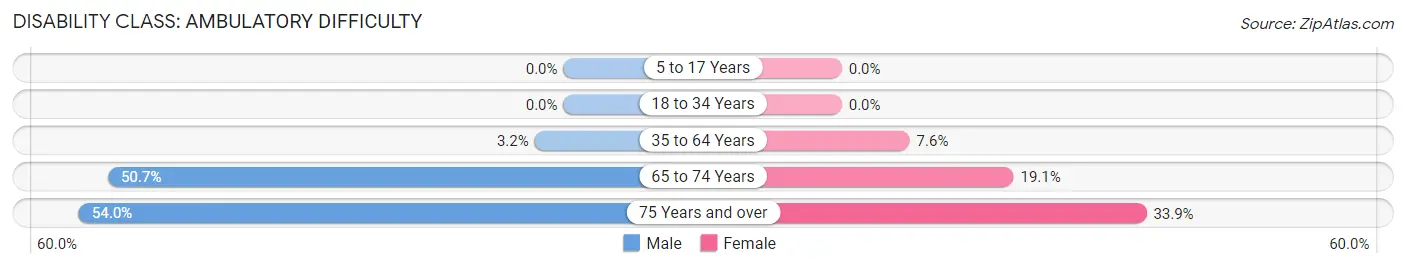
| Age Bracket | Male | Female |
| 5 to 17 Years | 0 (0.0%) | 0 (0.0%) |
| 18 to 34 Years | 0 (0.0%) | 0 (0.0%) |
| 35 to 64 Years | 53 (3.2%) | 158 (7.6%) |
| 65 to 74 Years | 251 (50.7%) | 110 (19.1%) |
| 75 Years and over | 82 (53.9%) | 133 (33.9%) |
Disability Class: Self-Care Difficulty
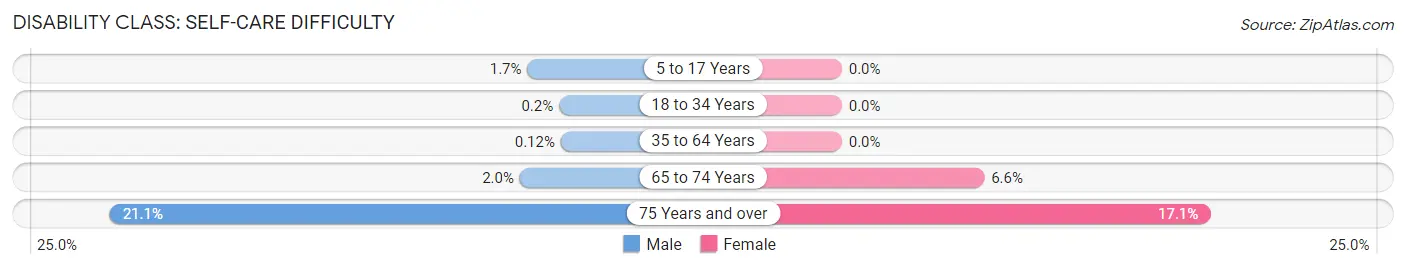
| Age Bracket | Male | Female |
| 5 to 17 Years | 14 (1.7%) | 0 (0.0%) |
| 18 to 34 Years | 2 (0.2%) | 0 (0.0%) |
| 35 to 64 Years | 2 (0.1%) | 0 (0.0%) |
| 65 to 74 Years | 10 (2.0%) | 38 (6.6%) |
| 75 Years and over | 32 (21.0%) | 67 (17.1%) |
Technology Access in Panthersville
Computing Device Access in Panthersville
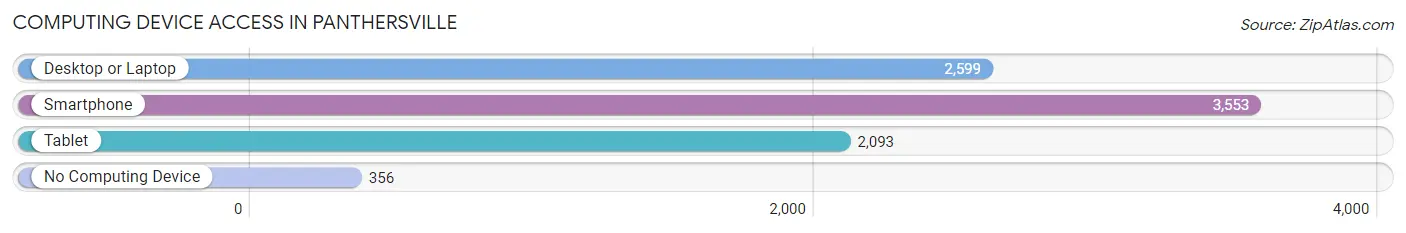
| Device Type | # Households | % Households |
| Desktop or Laptop | 2,599 | 64.1% |
| Smartphone | 3,553 | 87.6% |
| Tablet | 2,093 | 51.6% |
| No Computing Device | 356 | 8.8% |
| Total | 4,054 | 100.0% |
Internet Access in Panthersville
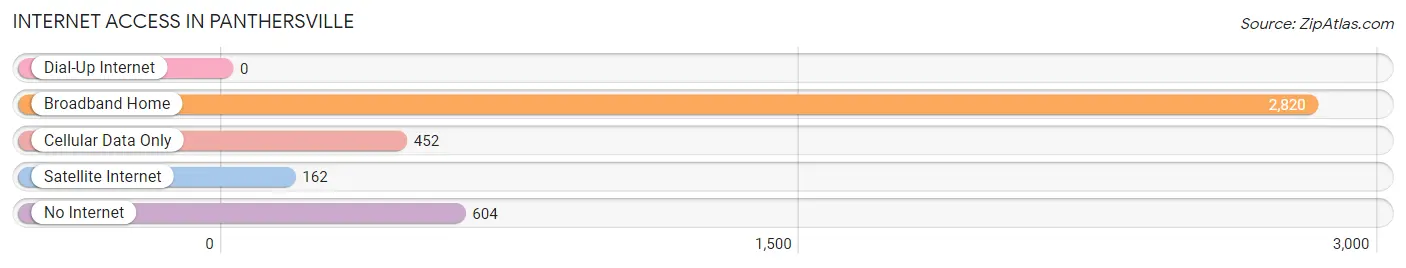
| Internet Type | # Households | % Households |
| Dial-Up Internet | 0 | 0.0% |
| Broadband Home | 2,820 | 69.6% |
| Cellular Data Only | 452 | 11.2% |
| Satellite Internet | 162 | 4.0% |
| No Internet | 604 | 14.9% |
| Total | 4,054 | 100.0% |
Panthersville Summary
Panthersville is an unincorporated community located in DeKalb County, Georgia, United States. It is located approximately 15 miles east of downtown Atlanta and is part of the Atlanta metropolitan area. The community is named after the Panther Creek which runs through the area.
History
The area that is now Panthersville was originally inhabited by the Creek Indians. The Creek Indians were a Native American tribe that lived in the area for centuries before the arrival of European settlers. The Creek Indians were eventually forced out of the area by the United States government in the 1830s.
The area was then settled by European settlers in the 1840s. The settlers were mostly farmers who grew cotton and other crops. The area was known as Panther Creek until the late 1800s when it was renamed Panthersville.
Geography
Panthersville is located in DeKalb County, Georgia, approximately 15 miles east of downtown Atlanta. The community is situated in the foothills of the Appalachian Mountains and is part of the Atlanta metropolitan area. The area is mostly rural with some residential and commercial development.
The Panther Creek runs through the area and is a tributary of the Chattahoochee River. The creek is a popular spot for fishing and other recreational activities.
Economy
The economy of Panthersville is largely based on agriculture and manufacturing. The area is home to several large farms that produce cotton, corn, soybeans, and other crops. There are also several manufacturing plants in the area that produce a variety of products including furniture, clothing, and electronics.
The area is also home to several small businesses including restaurants, retail stores, and service providers.
Demographics
As of the 2010 census, the population of Panthersville was 4,845. The racial makeup of the community was 57.3% African American, 37.2% White, 1.2% Asian, 0.3% Native American, and 4.0% from other races.
The median household income in Panthersville was $37,917, and the median family income was $45,917. The per capita income was $19,917.
Conclusion
Panthersville is an unincorporated community located in DeKalb County, Georgia, United States. It is located approximately 15 miles east of downtown Atlanta and is part of the Atlanta metropolitan area. The community is named after the Panther Creek which runs through the area. The area was originally inhabited by the Creek Indians and was later settled by European settlers in the 1840s. The economy of Panthersville is largely based on agriculture and manufacturing. As of the 2010 census, the population of Panthersville was 4,845. The racial makeup of the community was 57.3% African American, 37.2% White, 1.2% Asian, 0.3% Native American, and 4.0% from other races. The median household income in Panthersville was $37,917, and the median family income was $45,917. The per capita income was $19,917.
Common Questions
What is the Total Population of Panthersville?
Total Population of Panthersville is 9,197.
What is the Total Male Population of Panthersville?
Total Male Population of Panthersville is 4,293.
What is the Total Female Population of Panthersville?
Total Female Population of Panthersville is 4,904.
What is the Ratio of Males per 100 Females in Panthersville?
There are 87.54 Males per 100 Females in Panthersville.
What is the Ratio of Females per 100 Males in Panthersville?
There are 114.23 Females per 100 Males in Panthersville.
What is the Median Population Age in Panthersville?
Median Population Age in Panthersville is 41.9 Years.
What is the Average Family Size in Panthersville
Average Family Size in Panthersville is 3.0 People.
What is the Average Household Size in Panthersville
Average Household Size in Panthersville is 2.3 People.
What is Per Capita Income in Panthersville?
Per Capita income in Panthersville is $33,152.
What is the Median Family Income in Panthersville?
Median Family Income in Panthersville is $64,183.
What is the Median Household income in Panthersville?
Median Household Income in Panthersville is $48,876.
What is Income or Wage Gap in Panthersville?
Income or Wage Gap in Panthersville is 2.8%.
Women in Panthersville earn 97.2 cents for every dollar earned by a man.
What is Inequality or Gini Index in Panthersville?
Inequality or Gini Index in Panthersville is 0.51.
How Large is the Labor Force in Panthersville?
There are 4,796 People in the Labor Forcein in Panthersville.
What is the Percentage of People in the Labor Force in Panthersville?
64.5% of People are in the Labor Force in Panthersville.
What is the Unemployment Rate in Panthersville?
Unemployment Rate in Panthersville is 6.7%.