Lakeview Estates, GA
Lakeview Estates Map
Lakeview Estates Overview
2,714
TOTAL POPULATION
1,285
MALE POPULATION
1,429
FEMALE POPULATION
89.92
MALES / 100 FEMALES
111.21
FEMALES / 100 MALES
35.6
MEDIAN AGE
4.3
AVG FAMILY SIZE
4.1
AVG HOUSEHOLD SIZE
$30,581
PER CAPITA INCOME
$43,219
AVG HOUSEHOLD INCOME
70.0%
WAGE / INCOME GAP [ % ]
30.0¢/ $1
WAGE / INCOME GAP [ $ ]
0.71
INEQUALITY / GINI INDEX
1,332
LABOR FORCE [ PEOPLE ]
63.1%
PERCENT IN LABOR FORCE
2.9%
UNEMPLOYMENT RATE
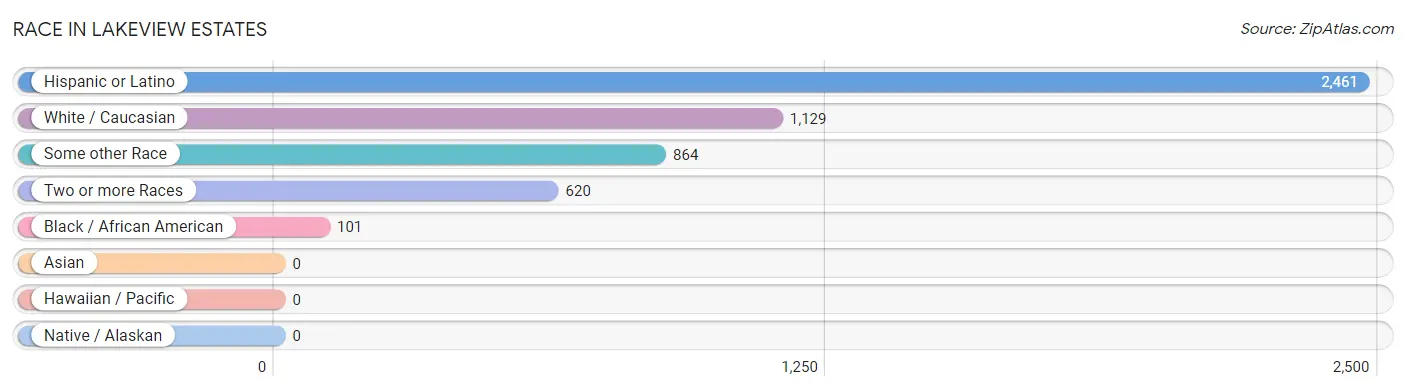
Race in Lakeview Estates
The most populous races in Lakeview Estates are Hispanic or Latino (2,461 | 90.7%), White / Caucasian (1,129 | 41.6%), and Some other Race (864 | 31.8%).
| Race | # Population | % Population |
| Asian | 0 | 0.0% |
| Black / African American | 101 | 3.7% |
| Hawaiian / Pacific | 0 | 0.0% |
| Hispanic or Latino | 2,461 | 90.7% |
| Native / Alaskan | 0 | 0.0% |
| White / Caucasian | 1,129 | 41.6% |
| Two or more Races | 620 | 22.8% |
| Some other Race | 864 | 31.8% |
| Total | 2,714 | 100.0% |
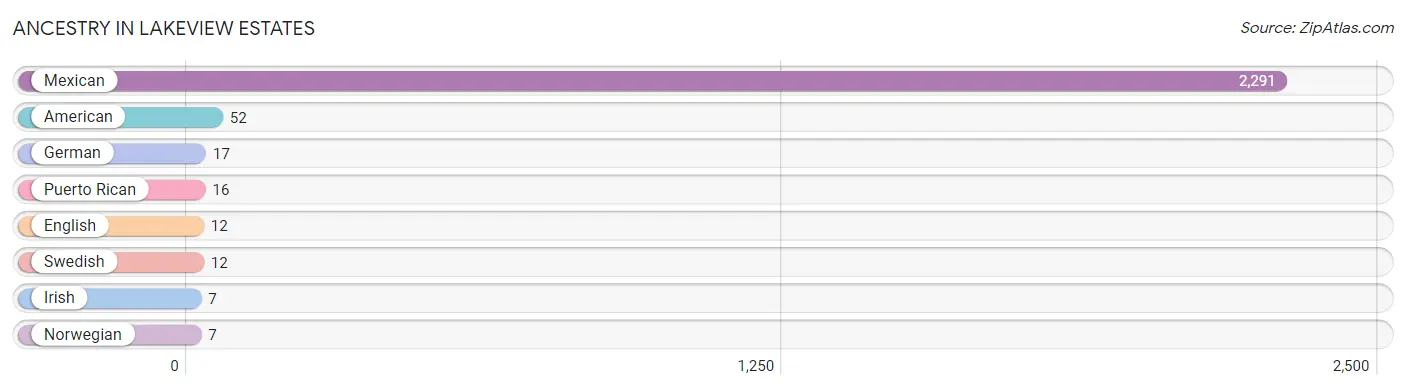
Ancestry in Lakeview Estates
The most populous ancestries reported in Lakeview Estates are Mexican (2,291 | 84.4%), American (52 | 1.9%), German (17 | 0.6%), Puerto Rican (16 | 0.6%), and English (12 | 0.4%), together accounting for 88.0% of all Lakeview Estates residents.
| Ancestry | # Population | % Population |
| American | 52 | 1.9% |
| English | 12 | 0.4% |
| German | 17 | 0.6% |
| Irish | 7 | 0.3% |
| Mexican | 2,291 | 84.4% |
| Norwegian | 7 | 0.3% |
| Puerto Rican | 16 | 0.6% |
| Swedish | 12 | 0.4% | View All 8 Rows |
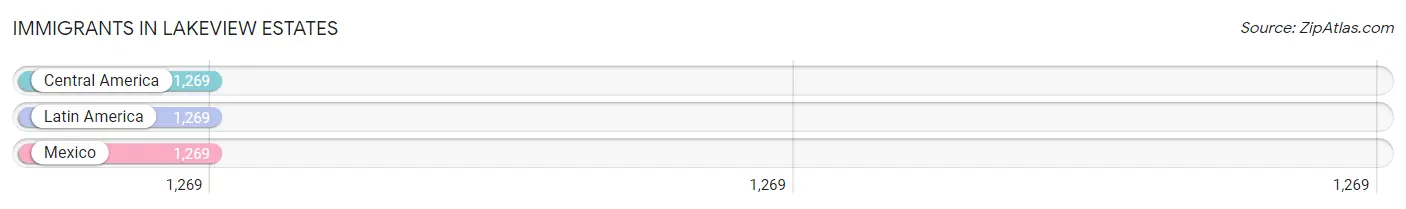
Immigrants in Lakeview Estates
The most numerous immigrant groups reported in Lakeview Estates came from Central America (1,269 | 46.8%), Latin America (1,269 | 46.8%), and Mexico (1,269 | 46.8%), together accounting for 140.3% of all Lakeview Estates residents.
| Immigration Origin | # Population | % Population |
| Central America | 1,269 | 46.8% |
| Latin America | 1,269 | 46.8% |
| Mexico | 1,269 | 46.8% | View All 3 Rows |
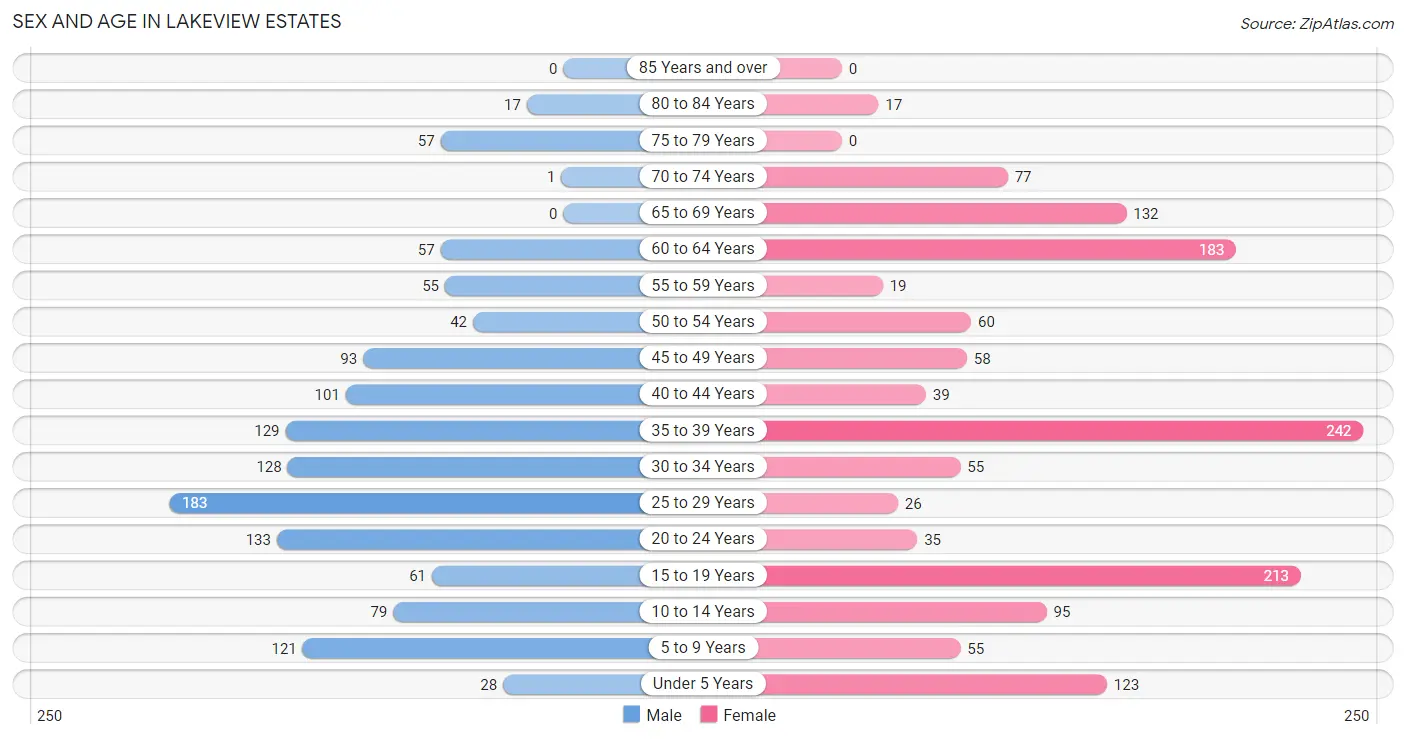
Sex and Age in Lakeview Estates
Sex and Age in Lakeview Estates
The most populous age groups in Lakeview Estates are 25 to 29 Years (183 | 14.2%) for men and 35 to 39 Years (242 | 16.9%) for women.
| Age Bracket | Male | Female |
| Under 5 Years | 28 (2.2%) | 123 (8.6%) |
| 5 to 9 Years | 121 (9.4%) | 55 (3.8%) |
| 10 to 14 Years | 79 (6.1%) | 95 (6.7%) |
| 15 to 19 Years | 61 (4.8%) | 213 (14.9%) |
| 20 to 24 Years | 133 (10.3%) | 35 (2.5%) |
| 25 to 29 Years | 183 (14.2%) | 26 (1.8%) |
| 30 to 34 Years | 128 (10.0%) | 55 (3.8%) |
| 35 to 39 Years | 129 (10.0%) | 242 (16.9%) |
| 40 to 44 Years | 101 (7.9%) | 39 (2.7%) |
| 45 to 49 Years | 93 (7.2%) | 58 (4.1%) |
| 50 to 54 Years | 42 (3.3%) | 60 (4.2%) |
| 55 to 59 Years | 55 (4.3%) | 19 (1.3%) |
| 60 to 64 Years | 57 (4.4%) | 183 (12.8%) |
| 65 to 69 Years | 0 (0.0%) | 132 (9.2%) |
| 70 to 74 Years | 1 (0.1%) | 77 (5.4%) |
| 75 to 79 Years | 57 (4.4%) | 0 (0.0%) |
| 80 to 84 Years | 17 (1.3%) | 17 (1.2%) |
| 85 Years and over | 0 (0.0%) | 0 (0.0%) |
| Total | 1,285 (100.0%) | 1,429 (100.0%) |
Families and Households in Lakeview Estates
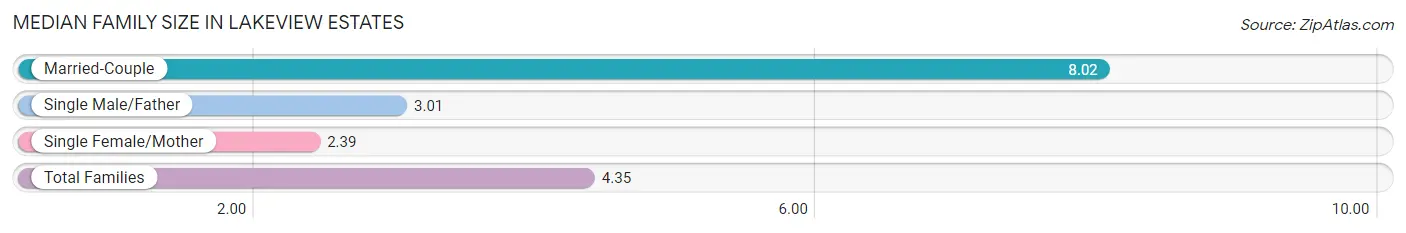
Median Family Size in Lakeview Estates
The median family size in Lakeview Estates is 4.35 persons per family, with married-couple families (183 | 32.7%) accounting for the largest median family size of 8.02 persons per family. On the other hand, single female/mother families (267 | 47.8%) represent the smallest median family size with 2.39 persons per family.
| Family Type | # Families | Family Size |
| Married-Couple | 183 (32.7%) | 8.02 |
| Single Male/Father | 109 (19.5%) | 3.01 |
| Single Female/Mother | 267 (47.8%) | 2.39 |
| Total Families | 559 (100.0%) | 4.35 |
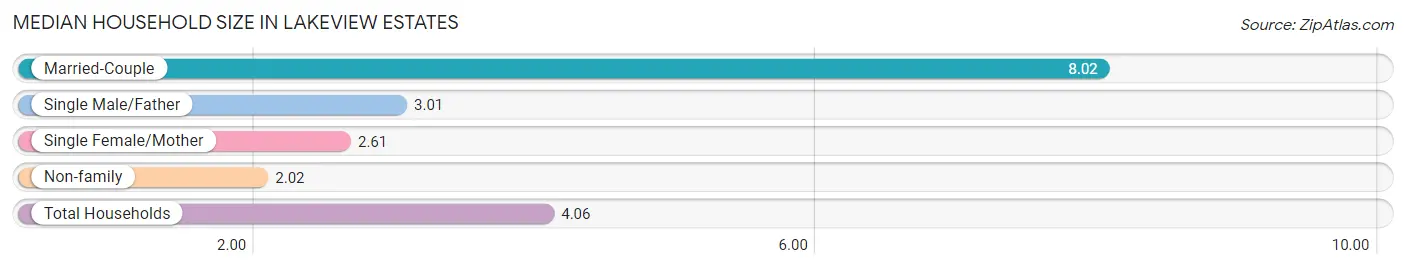
Median Household Size in Lakeview Estates
The median household size in Lakeview Estates is 4.06 persons per household, with married-couple households (183 | 27.4%) accounting for the largest median household size of 8.02 persons per household. non-family households (110 | 16.4%) represent the smallest median household size with 2.02 persons per household.
| Household Type | # Households | Household Size |
| Married-Couple | 183 (27.4%) | 8.02 |
| Single Male/Father | 109 (16.3%) | 3.01 |
| Single Female/Mother | 267 (39.9%) | 2.61 |
| Non-family | 110 (16.4%) | 2.02 |
| Total Households | 669 (100.0%) | 4.06 |
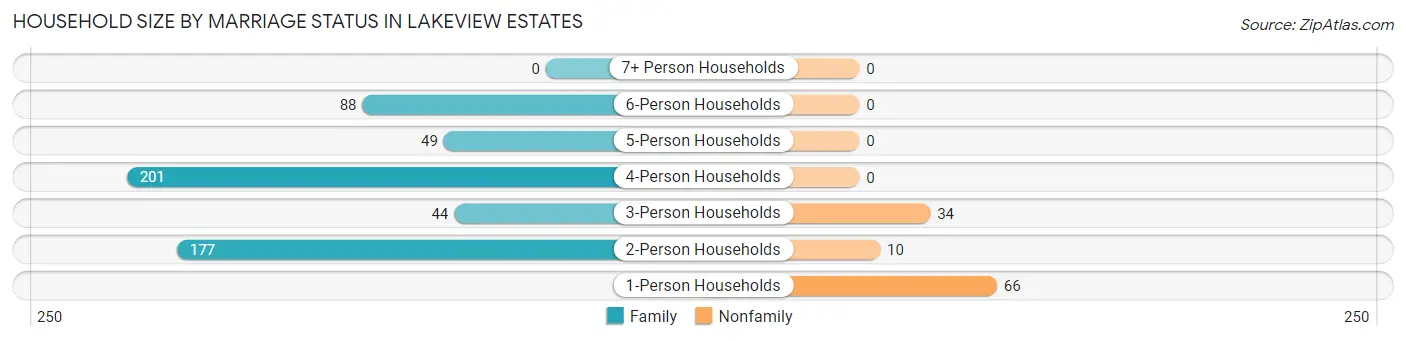
Household Size by Marriage Status in Lakeview Estates
Out of a total of 669 households in Lakeview Estates, 559 (83.6%) are family households, while 110 (16.4%) are nonfamily households. The most numerous type of family households are 4-person households, comprising 201, and the most common type of nonfamily households are 1-person households, comprising 66.
| Household Size | Family Households | Nonfamily Households |
| 1-Person Households | - | 66 (9.9%) |
| 2-Person Households | 177 (26.5%) | 10 (1.5%) |
| 3-Person Households | 44 (6.6%) | 34 (5.1%) |
| 4-Person Households | 201 (30.0%) | 0 (0.0%) |
| 5-Person Households | 49 (7.3%) | 0 (0.0%) |
| 6-Person Households | 88 (13.2%) | 0 (0.0%) |
| 7+ Person Households | 0 (0.0%) | 0 (0.0%) |
| Total | 559 (83.6%) | 110 (16.4%) |
Female Fertility in Lakeview Estates
Fertility by Age in Lakeview Estates
Average fertility rate in Lakeview Estates is 52.0 births per 1,000 women. Women in the age bracket of 35 to 50 years have the highest fertility rate with 103.0 births per 1,000 women. Women in the age bracket of 35 to 50 years acount for 100.0% of all women with births.
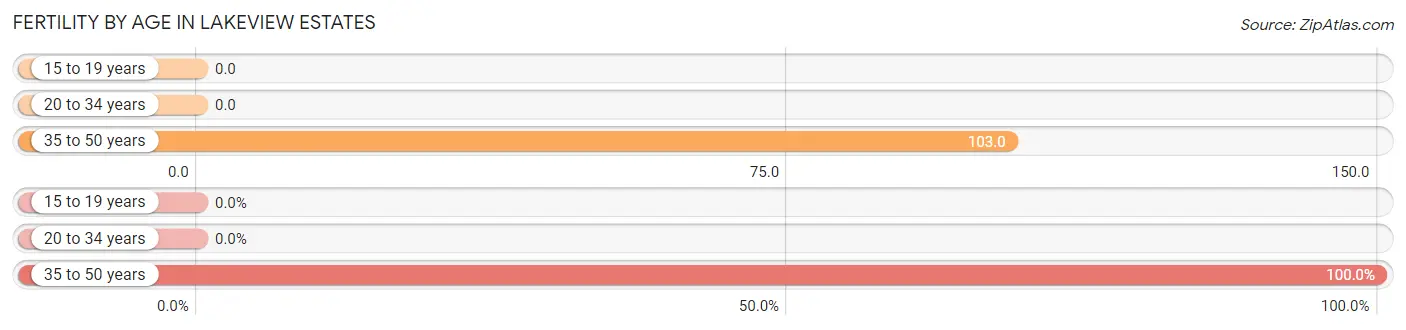
| Age Bracket | Women with Births | Births / 1,000 Women |
| 15 to 19 years | 0 (0.0%) | 0.0 |
| 20 to 34 years | 0 (0.0%) | 0.0 |
| 35 to 50 years | 35 (100.0%) | 103.0 |
| Total | 35 (100.0%) | 52.0 |
Fertility by Age by Marriage Status in Lakeview Estates
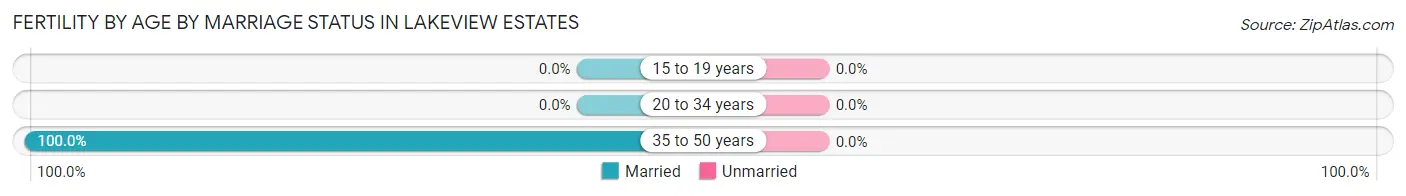
| Age Bracket | Married | Unmarried |
| 15 to 19 years | 0 (0.0%) | 0 (0.0%) |
| 20 to 34 years | 0 (0.0%) | 0 (0.0%) |
| 35 to 50 years | 35 (100.0%) | 0 (0.0%) |
| Total | 35 (100.0%) | 0 (0.0%) |
Fertility by Education in Lakeview Estates
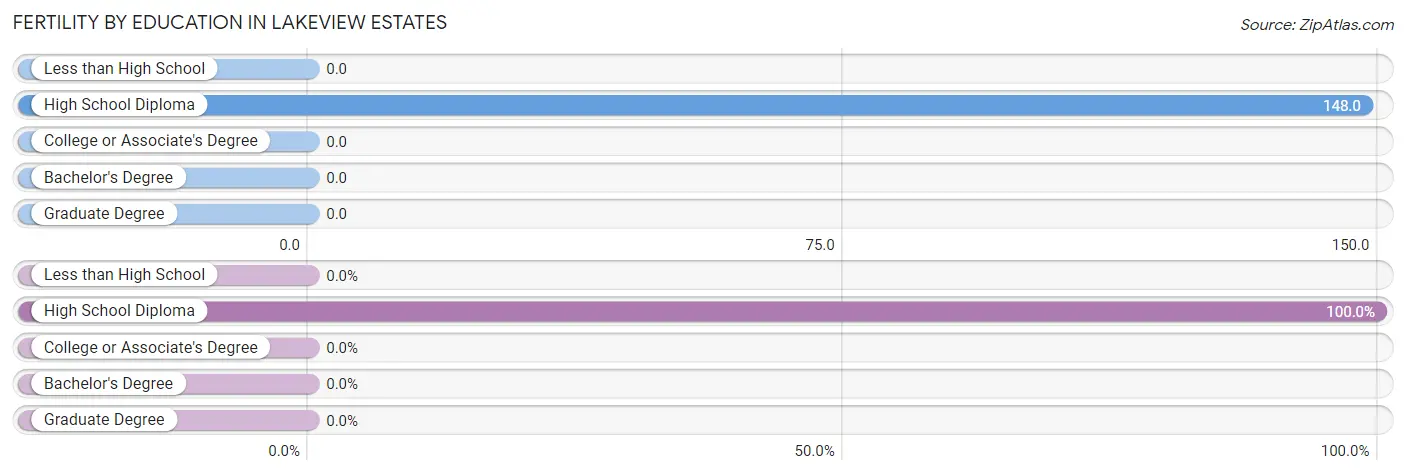
| Educational Attainment | Women with Births | Births / 1,000 Women |
| Less than High School | 0 (0.0%) | 0.0 |
| High School Diploma | 35 (100.0%) | 148.0 |
| College or Associate's Degree | 0 (0.0%) | 0.0 |
| Bachelor's Degree | 0 (0.0%) | 0.0 |
| Graduate Degree | 0 (0.0%) | 0.0 |
| Total | 35 (100.0%) | 52.0 |
Fertility by Education by Marriage Status in Lakeview Estates
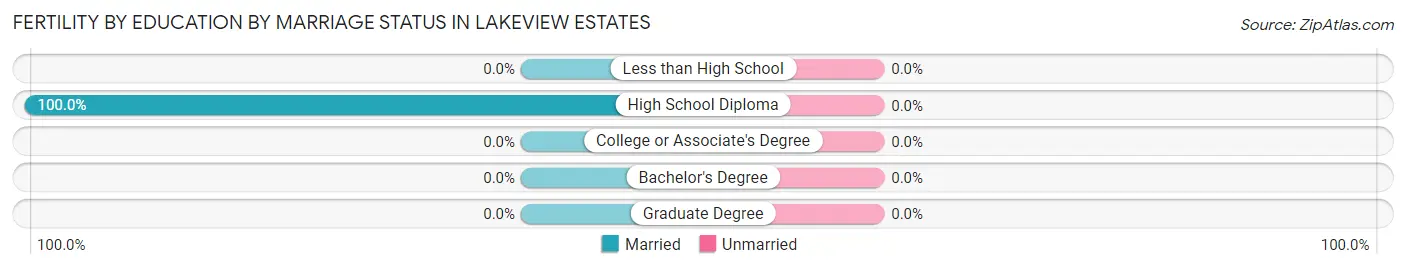
| Educational Attainment | Married | Unmarried |
| Less than High School | 0 (0.0%) | 0 (0.0%) |
| High School Diploma | 35 (100.0%) | 0 (0.0%) |
| College or Associate's Degree | 0 (0.0%) | 0 (0.0%) |
| Bachelor's Degree | 0 (0.0%) | 0 (0.0%) |
| Graduate Degree | 0 (0.0%) | 0 (0.0%) |
| Total | 35 (100.0%) | 0 (0.0%) |
Income in Lakeview Estates
Income Overview in Lakeview Estates
| Characteristic | Number | Measure |
| Per Capita Income | 2,714 | $30,581 |
| Median Family Income | 559 | $0 |
| Mean Family Income | 559 | $104,899 |
| Median Household Income | 669 | $43,219 |
| Mean Household Income | 669 | $97,718 |
| Income Deficit | 559 | $0 |
| Wage / Income Gap (%) | 2,714 | 69.98% |
| Wage / Income Gap ($) | 2,714 | 30.02¢ per $1 |
| Gini / Inequality Index | 2,714 | 0.71 |
Earnings by Sex in Lakeview Estates
Average Earnings in Lakeview Estates are $28,916, $39,620 for men and $11,892 for women, a difference of 70.0%.
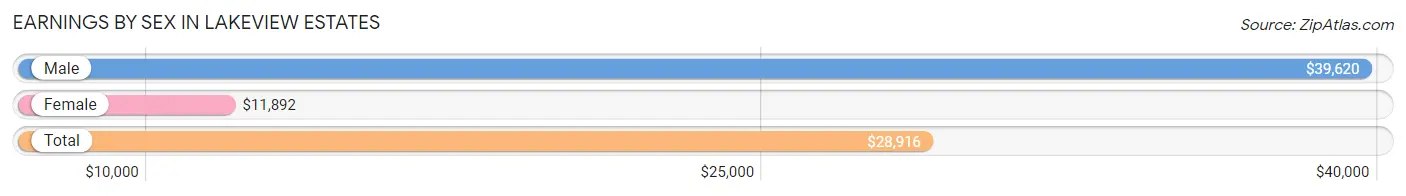
| Sex | Number | Average Earnings |
| Male | 796 (60.0%) | $39,620 |
| Female | 531 (40.0%) | $11,892 |
| Total | 1,327 (100.0%) | $28,916 |
Earnings by Sex by Income Bracket in Lakeview Estates
The most common earnings brackets in Lakeview Estates are $25,000 to $29,999 for men (182 | 22.9%) and $10,000 to $12,499 for women (183 | 34.5%).
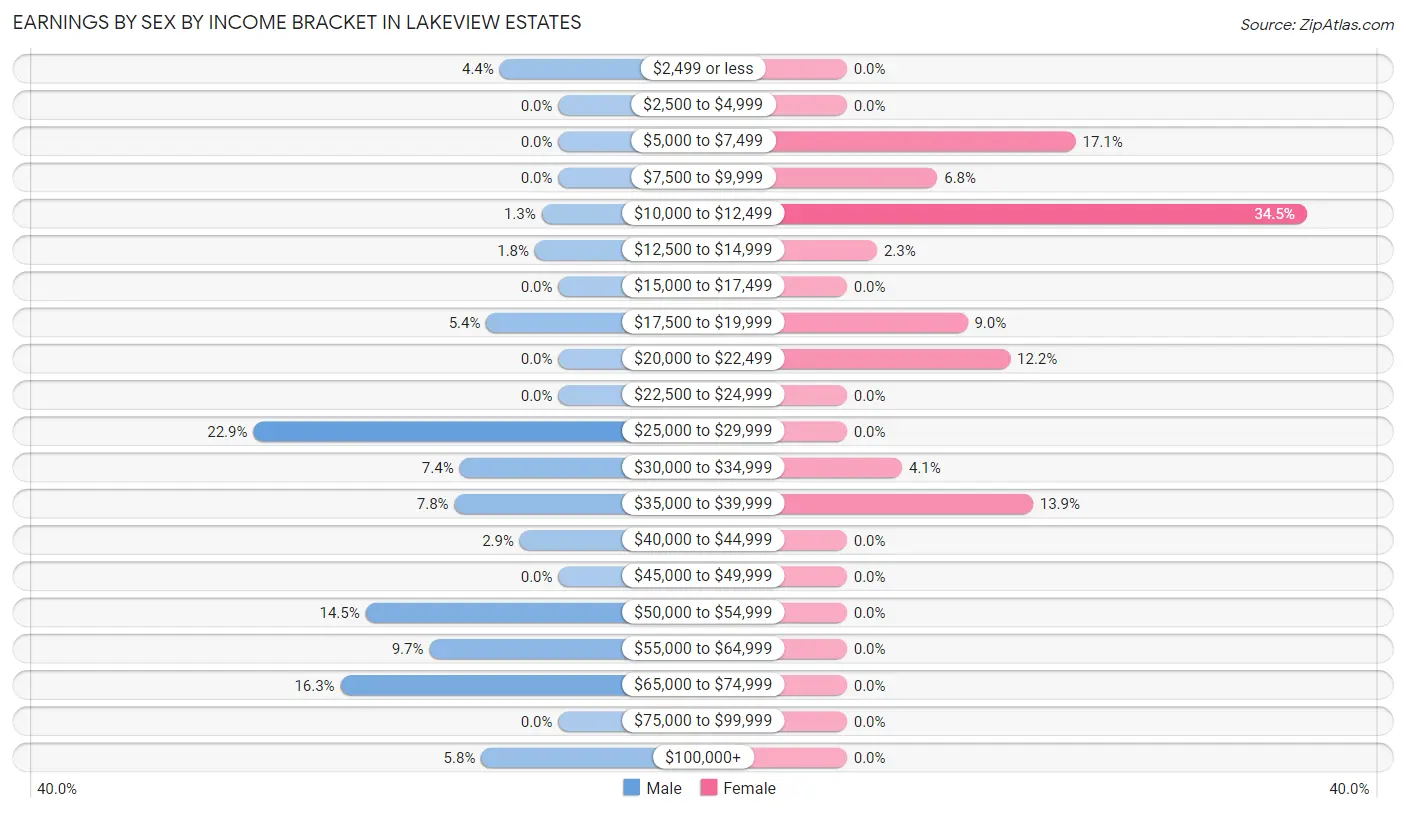
| Income | Male | Female |
| $2,499 or less | 35 (4.4%) | 0 (0.0%) |
| $2,500 to $4,999 | 0 (0.0%) | 0 (0.0%) |
| $5,000 to $7,499 | 0 (0.0%) | 91 (17.1%) |
| $7,500 to $9,999 | 0 (0.0%) | 36 (6.8%) |
| $10,000 to $12,499 | 10 (1.3%) | 183 (34.5%) |
| $12,500 to $14,999 | 14 (1.8%) | 12 (2.3%) |
| $15,000 to $17,499 | 0 (0.0%) | 0 (0.0%) |
| $17,500 to $19,999 | 43 (5.4%) | 48 (9.0%) |
| $20,000 to $22,499 | 0 (0.0%) | 65 (12.2%) |
| $22,500 to $24,999 | 0 (0.0%) | 0 (0.0%) |
| $25,000 to $29,999 | 182 (22.9%) | 0 (0.0%) |
| $30,000 to $34,999 | 59 (7.4%) | 22 (4.1%) |
| $35,000 to $39,999 | 62 (7.8%) | 74 (13.9%) |
| $40,000 to $44,999 | 23 (2.9%) | 0 (0.0%) |
| $45,000 to $49,999 | 0 (0.0%) | 0 (0.0%) |
| $50,000 to $54,999 | 115 (14.4%) | 0 (0.0%) |
| $55,000 to $64,999 | 77 (9.7%) | 0 (0.0%) |
| $65,000 to $74,999 | 130 (16.3%) | 0 (0.0%) |
| $75,000 to $99,999 | 0 (0.0%) | 0 (0.0%) |
| $100,000+ | 46 (5.8%) | 0 (0.0%) |
| Total | 796 (100.0%) | 531 (100.0%) |
Earnings by Sex by Educational Attainment in Lakeview Estates
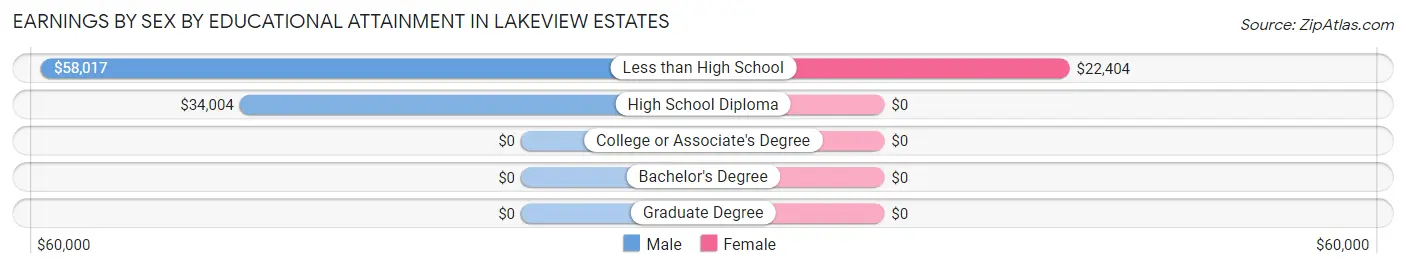
| Educational Attainment | Male Income | Female Income |
| Less than High School | $58,017 | $22,404 |
| High School Diploma | $34,004 | $0 |
| College or Associate's Degree | - | - |
| Bachelor's Degree | - | - |
| Graduate Degree | - | - |
| Total | $50,360 | $0 |
Family Income in Lakeview Estates
Family Income Brackets in Lakeview Estates
According to the Lakeview Estates family income data, there are 223 families falling into the less than $10,000 income range, which is the most common income bracket and makes up 39.9% of all families.
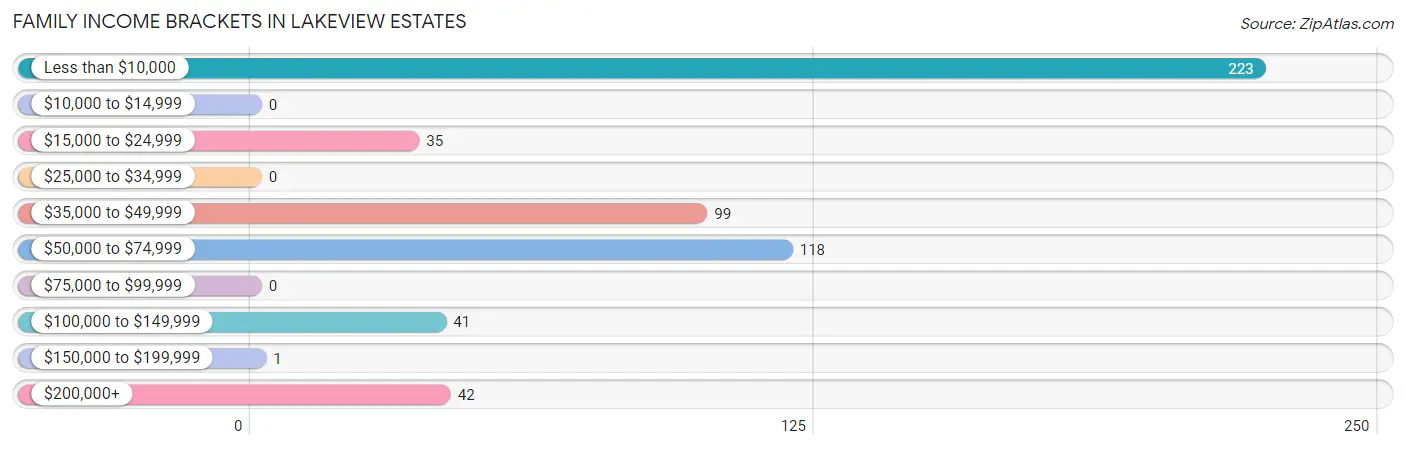
| Income Bracket | # Families | % Families |
| Less than $10,000 | 223 | 39.9% |
| $10,000 to $14,999 | 0 | 0.0% |
| $15,000 to $24,999 | 35 | 6.3% |
| $25,000 to $34,999 | 0 | 0.0% |
| $35,000 to $49,999 | 99 | 17.7% |
| $50,000 to $74,999 | 118 | 21.1% |
| $75,000 to $99,999 | 0 | 0.0% |
| $100,000 to $149,999 | 41 | 7.3% |
| $150,000 to $199,999 | 1 | 0.2% |
| $200,000+ | 42 | 7.5% |
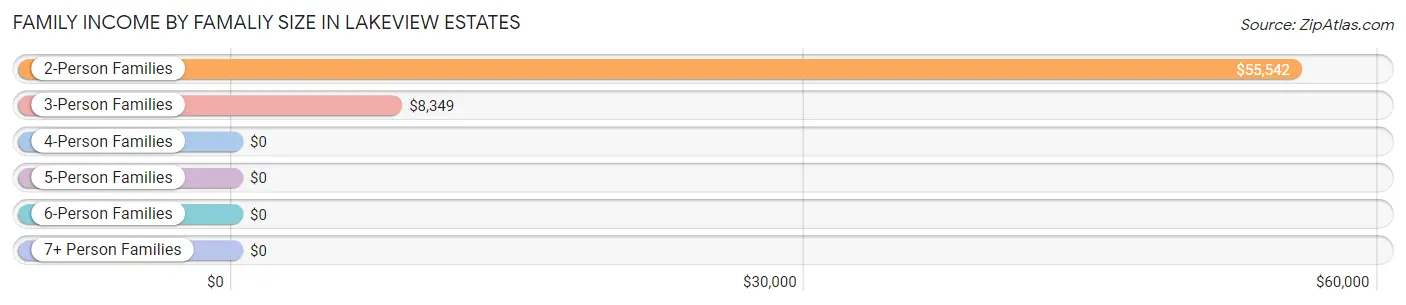
Family Income by Famaliy Size in Lakeview Estates
2-person families (177 | 31.7%) account for the highest median family income in Lakeview Estates with $55,542 per family, while 2-person families (177 | 31.7%) have the highest median income of $27,771 per family member.
| Income Bracket | # Families | Median Income |
| 2-Person Families | 177 (31.7%) | $55,542 |
| 3-Person Families | 150 (26.8%) | $8,349 |
| 4-Person Families | 95 (17.0%) | $0 |
| 5-Person Families | 49 (8.8%) | $0 |
| 6-Person Families | 88 (15.7%) | $0 |
| 7+ Person Families | 0 (0.0%) | $0 |
| Total | 559 (100.0%) | $0 |
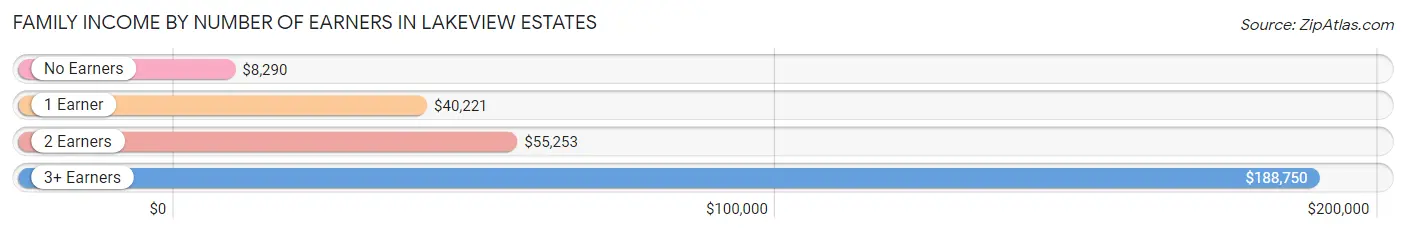
Family Income by Number of Earners in Lakeview Estates
| Number of Earners | # Families | Median Income |
| No Earners | 223 (39.9%) | $8,290 |
| 1 Earner | 119 (21.3%) | $40,221 |
| 2 Earners | 133 (23.8%) | $55,253 |
| 3+ Earners | 84 (15.0%) | $188,750 |
| Total | 559 (100.0%) | $0 |
Household Income in Lakeview Estates
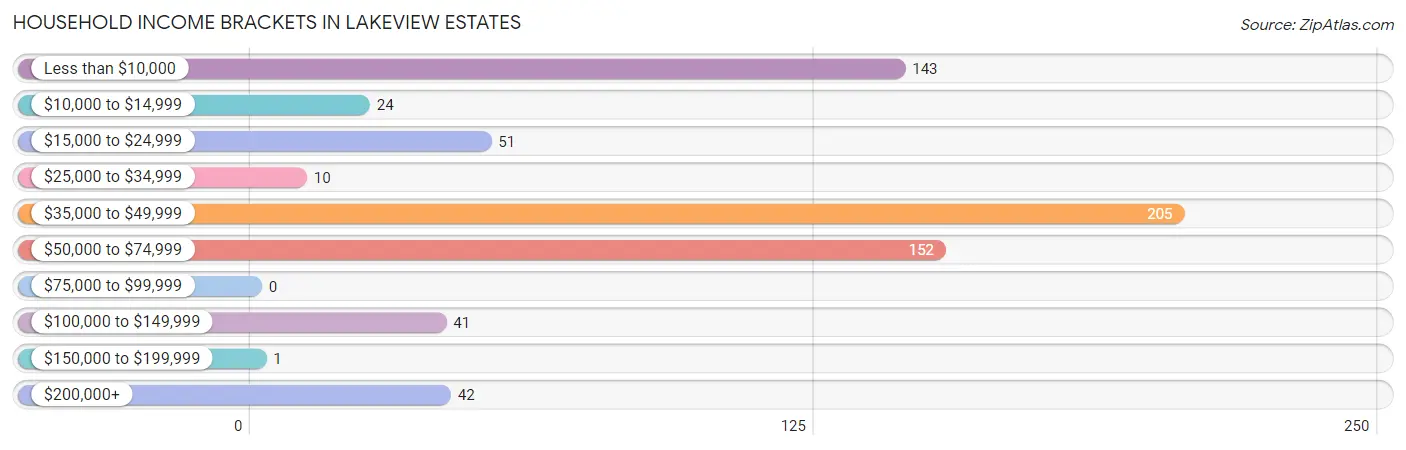
Household Income Brackets in Lakeview Estates
With 205 households falling in the category, the $35,000 to $49,999 income range is the most frequent in Lakeview Estates, accounting for 30.6% of all households.
| Income Bracket | # Households | % Households |
| Less than $10,000 | 143 | 21.4% |
| $10,000 to $14,999 | 24 | 3.6% |
| $15,000 to $24,999 | 51 | 7.6% |
| $25,000 to $34,999 | 10 | 1.5% |
| $35,000 to $49,999 | 205 | 30.6% |
| $50,000 to $74,999 | 152 | 22.7% |
| $75,000 to $99,999 | 0 | 0.0% |
| $100,000 to $149,999 | 41 | 6.1% |
| $150,000 to $199,999 | 1 | 0.1% |
| $200,000+ | 42 | 6.3% |
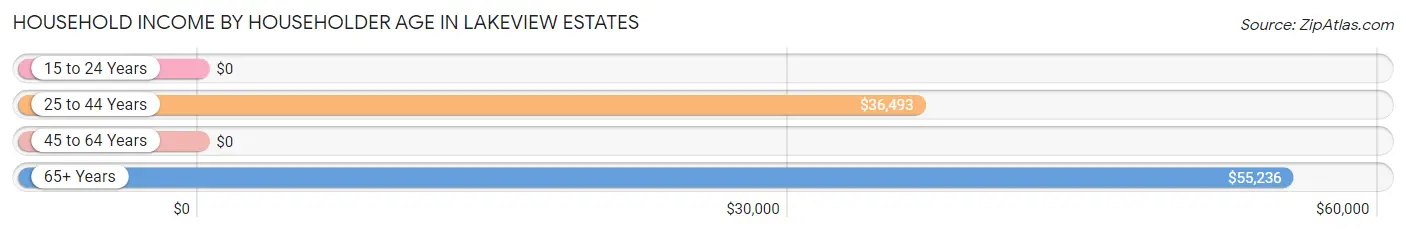
Household Income by Householder Age in Lakeview Estates
The median household income in Lakeview Estates is $43,219, with the highest median household income of $55,236 found in the 65+ years age bracket for the primary householder. A total of 228 households (34.1%) fall into this category.
| Income Bracket | # Households | Median Income |
| 15 to 24 Years | 0 (0.0%) | $0 |
| 25 to 44 Years | 313 (46.8%) | $36,493 |
| 45 to 64 Years | 128 (19.1%) | $0 |
| 65+ Years | 228 (34.1%) | $55,236 |
| Total | 669 (100.0%) | $43,219 |
Poverty in Lakeview Estates
Income Below Poverty by Sex and Age in Lakeview Estates
With 32.3% poverty level for males and 49.5% for females among the residents of Lakeview Estates, under 5 year old males and 15 year old females are the most vulnerable to poverty, with 28 males (100.0%) and 102 females (100.0%) in their respective age groups living below the poverty level.
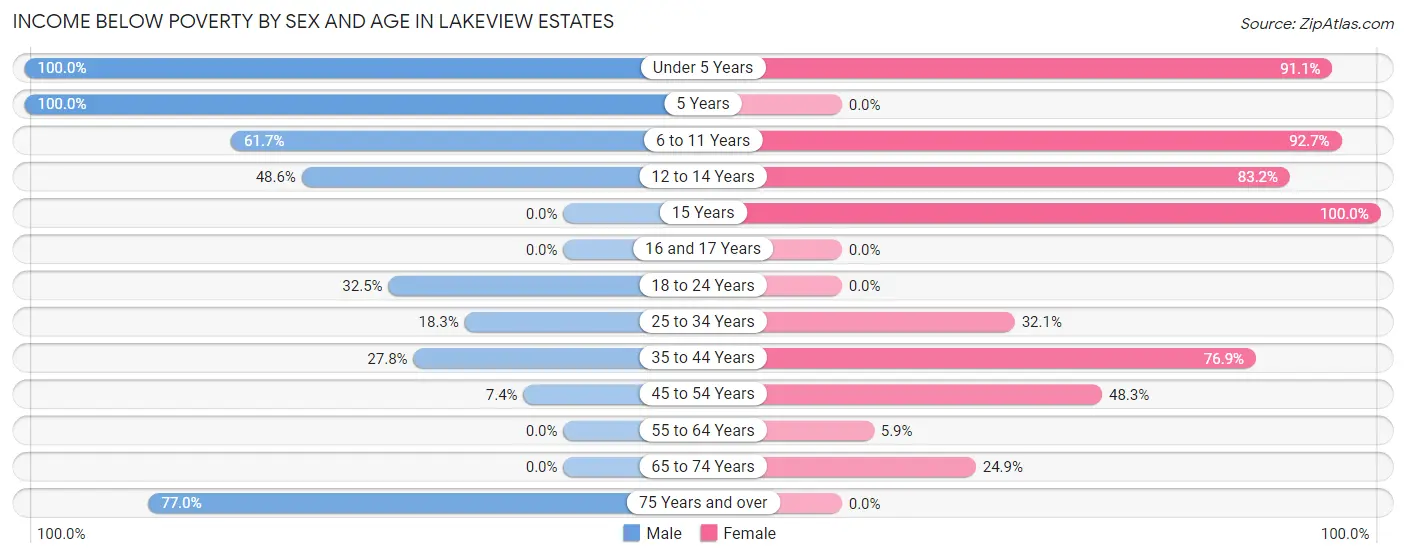
| Age Bracket | Male | Female |
| Under 5 Years | 28 (100.0%) | 112 (91.1%) |
| 5 Years | 45 (100.0%) | 0 (0.0%) |
| 6 to 11 Years | 74 (61.7%) | 51 (92.7%) |
| 12 to 14 Years | 17 (48.6%) | 79 (83.2%) |
| 15 Years | 0 (0.0%) | 102 (100.0%) |
| 16 and 17 Years | 0 (0.0%) | 0 (0.0%) |
| 18 to 24 Years | 63 (32.5%) | 0 (0.0%) |
| 25 to 34 Years | 57 (18.3%) | 26 (32.1%) |
| 35 to 44 Years | 64 (27.8%) | 216 (76.9%) |
| 45 to 54 Years | 10 (7.4%) | 57 (48.3%) |
| 55 to 64 Years | 0 (0.0%) | 12 (5.9%) |
| 65 to 74 Years | 0 (0.0%) | 52 (24.9%) |
| 75 Years and over | 57 (77.0%) | 0 (0.0%) |
| Total | 415 (32.3%) | 707 (49.5%) |
Income Above Poverty by Sex and Age in Lakeview Estates
According to the poverty statistics in Lakeview Estates, males aged 55 to 64 years and females aged 18 to 24 years are the age groups that are most secure financially, with 100.0% of males and 100.0% of females in these age groups living above the poverty line.
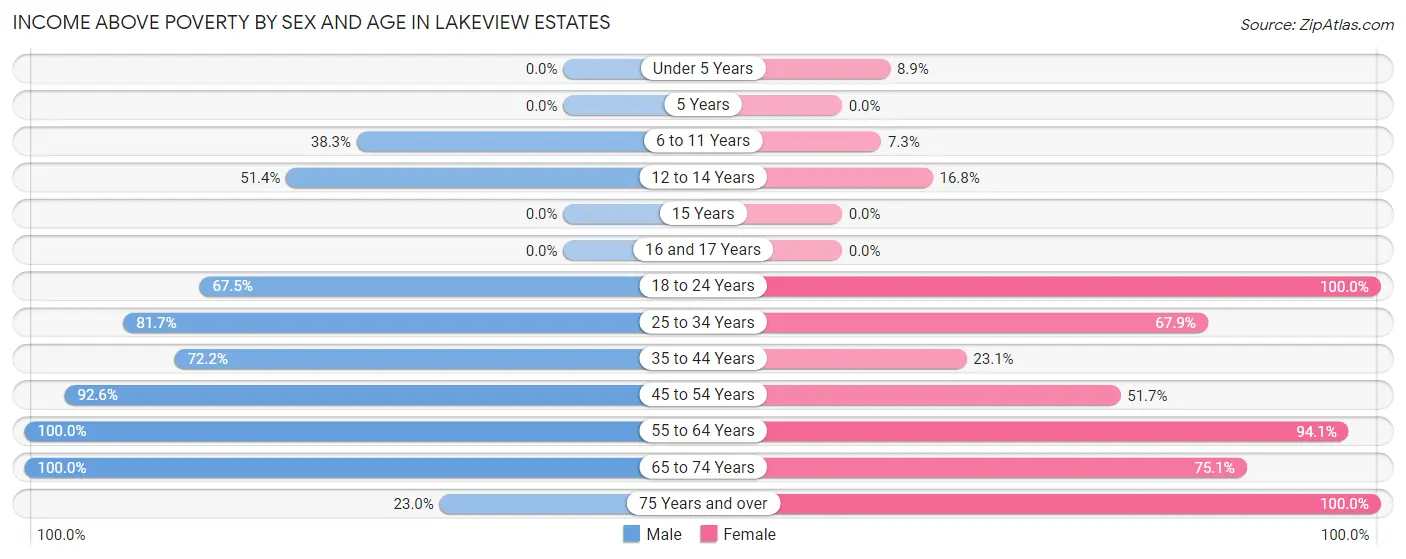
| Age Bracket | Male | Female |
| Under 5 Years | 0 (0.0%) | 11 (8.9%) |
| 5 Years | 0 (0.0%) | 0 (0.0%) |
| 6 to 11 Years | 46 (38.3%) | 4 (7.3%) |
| 12 to 14 Years | 18 (51.4%) | 16 (16.8%) |
| 15 Years | 0 (0.0%) | 0 (0.0%) |
| 16 and 17 Years | 0 (0.0%) | 0 (0.0%) |
| 18 to 24 Years | 131 (67.5%) | 146 (100.0%) |
| 25 to 34 Years | 254 (81.7%) | 55 (67.9%) |
| 35 to 44 Years | 166 (72.2%) | 65 (23.1%) |
| 45 to 54 Years | 125 (92.6%) | 61 (51.7%) |
| 55 to 64 Years | 112 (100.0%) | 190 (94.1%) |
| 65 to 74 Years | 1 (100.0%) | 157 (75.1%) |
| 75 Years and over | 17 (23.0%) | 17 (100.0%) |
| Total | 870 (67.7%) | 722 (50.5%) |
Income Below Poverty Among Married-Couple Families in Lakeview Estates
The poverty statistics for married-couple families in Lakeview Estates show that 50.3% or 92 of the total 183 families live below the poverty line. Families with 3 or 4 children have the highest poverty rate of 75.5%, comprising of 71 families. On the other hand, families with no children have the lowest poverty rate of 0.0%, which includes 0 families.
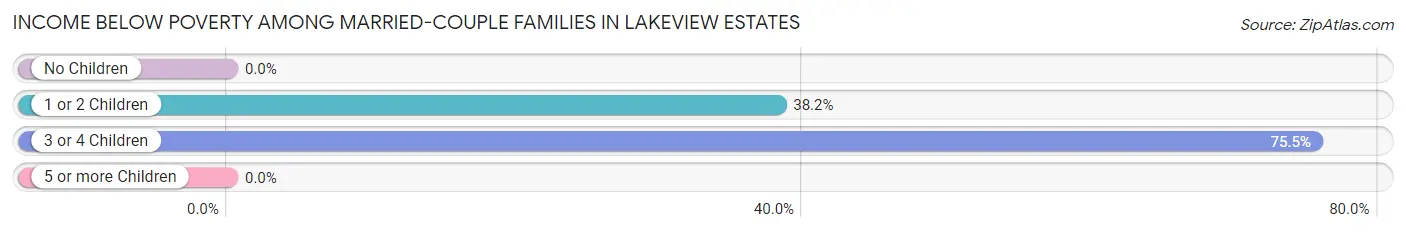
| Children | Above Poverty | Below Poverty |
| No Children | 34 (100.0%) | 0 (0.0%) |
| 1 or 2 Children | 34 (61.8%) | 21 (38.2%) |
| 3 or 4 Children | 23 (24.5%) | 71 (75.5%) |
| 5 or more Children | 0 (0.0%) | 0 (0.0%) |
| Total | 91 (49.7%) | 92 (50.3%) |
Income Below Poverty Among Single-Parent Households in Lakeview Estates
According to the poverty data in Lakeview Estates, 52.3% or 57 single-father households and 54.3% or 145 single-mother households are living below the poverty line. Among single-father households, those with no children have the highest poverty rate, with 57 households (59.4%) experiencing poverty. Likewise, among single-mother households, those with 1 or 2 children have the highest poverty rate, with 145 households (100.0%) falling below the poverty line.
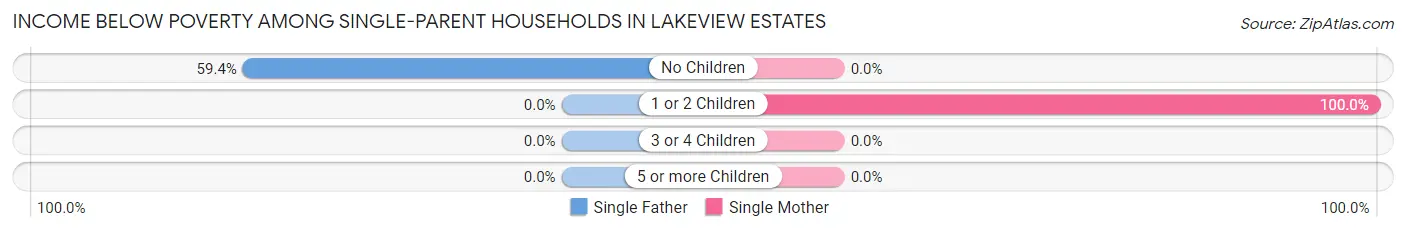
| Children | Single Father | Single Mother |
| No Children | 57 (59.4%) | 0 (0.0%) |
| 1 or 2 Children | 0 (0.0%) | 145 (100.0%) |
| 3 or 4 Children | 0 (0.0%) | 0 (0.0%) |
| 5 or more Children | 0 (0.0%) | 0 (0.0%) |
| Total | 57 (52.3%) | 145 (54.3%) |
Income Below Poverty Among Married-Couple vs Single-Parent Households in Lakeview Estates
The poverty data for Lakeview Estates shows that 92 of the married-couple family households (50.3%) and 202 of the single-parent households (53.7%) are living below the poverty level. Within the married-couple family households, those with 3 or 4 children have the highest poverty rate, with 71 households (75.5%) falling below the poverty line. Among the single-parent households, those with 1 or 2 children have the highest poverty rate, with 145 household (91.8%) living below poverty.
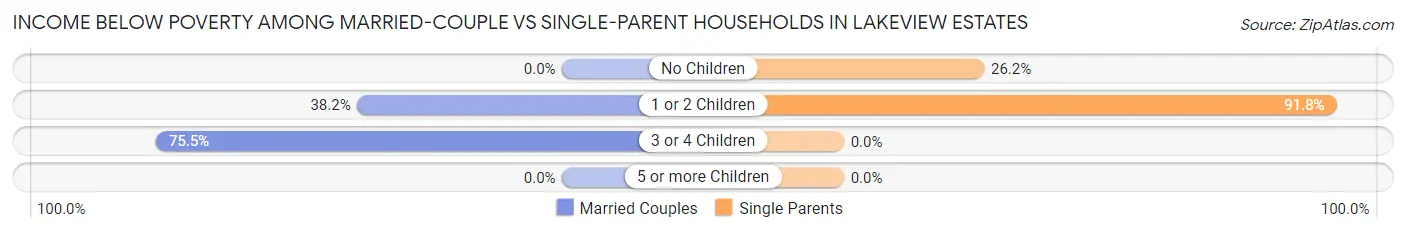
| Children | Married-Couple Families | Single-Parent Households |
| No Children | 0 (0.0%) | 57 (26.2%) |
| 1 or 2 Children | 21 (38.2%) | 145 (91.8%) |
| 3 or 4 Children | 71 (75.5%) | 0 (0.0%) |
| 5 or more Children | 0 (0.0%) | 0 (0.0%) |
| Total | 92 (50.3%) | 202 (53.7%) |
Employment Characteristics in Lakeview Estates
Employment by Class of Employer in Lakeview Estates
Among the 1,292 employed individuals in Lakeview Estates, private company employees (1,104 | 85.5%), and self-employed (not incorporated) (188 | 14.5%) make up the most common classes of employment.
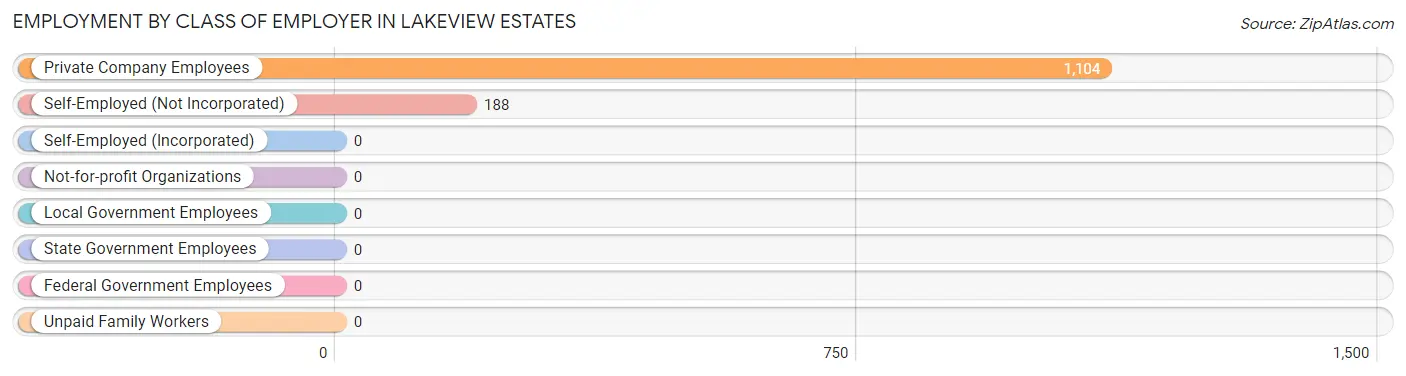
| Employer Class | # Employees | % Employees |
| Private Company Employees | 1,104 | 85.5% |
| Self-Employed (Incorporated) | 0 | 0.0% |
| Self-Employed (Not Incorporated) | 188 | 14.5% |
| Not-for-profit Organizations | 0 | 0.0% |
| Local Government Employees | 0 | 0.0% |
| State Government Employees | 0 | 0.0% |
| Federal Government Employees | 0 | 0.0% |
| Unpaid Family Workers | 0 | 0.0% |
| Total | 1,292 | 100.0% |
Employment Status by Age in Lakeview Estates
According to the labor force statistics for Lakeview Estates, out of the total population over 16 years of age (2,111), 63.1% or 1,332 individuals are in the labor force, with 2.9% or 39 of them unemployed. The age group with the highest labor force participation rate is 55 to 59 years, with 100.0% or 74 individuals in the labor force. Within the labor force, the 35 to 44 years age range has the highest percentage of unemployed individuals, with 11.2% or 39 of them being unemployed.
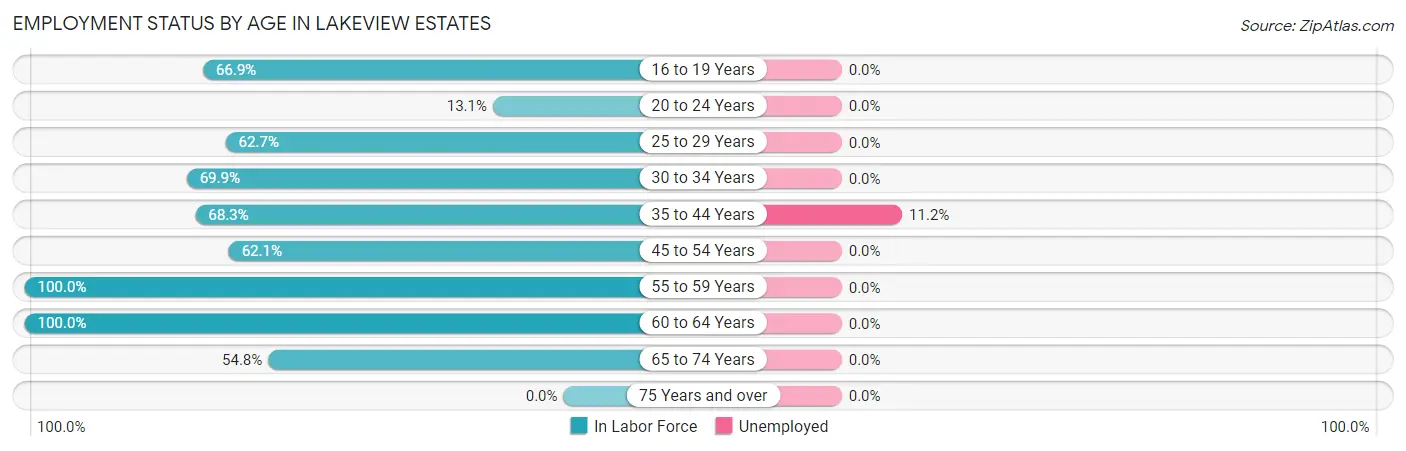
| Age Bracket | In Labor Force | Unemployed |
| 16 to 19 Years | 115 (66.9%) | 0 (0.0%) |
| 20 to 24 Years | 22 (13.1%) | 0 (0.0%) |
| 25 to 29 Years | 131 (62.7%) | 0 (0.0%) |
| 30 to 34 Years | 128 (69.9%) | 0 (0.0%) |
| 35 to 44 Years | 349 (68.3%) | 39 (11.2%) |
| 45 to 54 Years | 157 (62.1%) | 0 (0.0%) |
| 55 to 59 Years | 74 (100.0%) | 0 (0.0%) |
| 60 to 64 Years | 240 (100.0%) | 0 (0.0%) |
| 65 to 74 Years | 115 (54.8%) | 0 (0.0%) |
| 75 Years and over | 0 (0.0%) | 0 (0.0%) |
| Total | 1,332 (63.1%) | 39 (2.9%) |
Employment Status by Educational Attainment in Lakeview Estates
According to labor force statistics for Lakeview Estates, 73.4% of individuals (1,079) out of the total population between 25 and 64 years of age (1,470) are in the labor force, with 3.6% or 39 of them being unemployed. The group with the highest labor force participation rate are those with the educational attainment of bachelor's degree or higher, with 100.0% or 75 individuals in the labor force. Within the labor force, individuals with less than high school education have the highest percentage of unemployment, with 10.9% or 39 of them being unemployed.
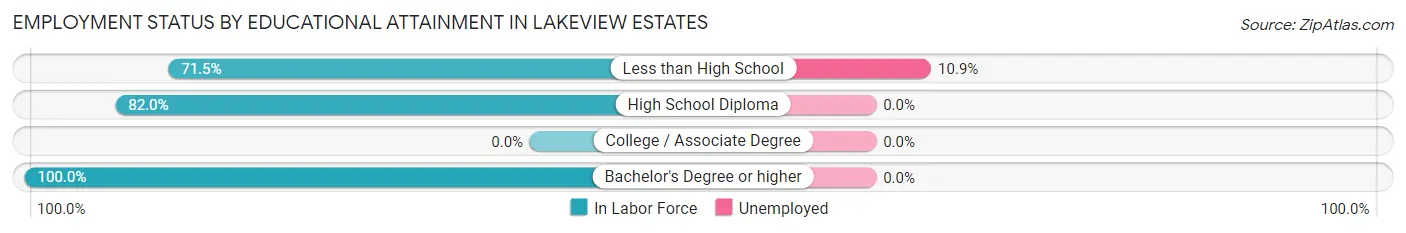
| Educational Attainment | In Labor Force | Unemployed |
| Less than High School | 358 (71.5%) | 55 (10.9%) |
| High School Diploma | 646 (82.0%) | 0 (0.0%) |
| College / Associate Degree | 0 (0.0%) | 0 (0.0%) |
| Bachelor's Degree or higher | 75 (100.0%) | 0 (0.0%) |
| Total | 1,079 (73.4%) | 53 (3.6%) |
Employment Occupations by Sex in Lakeview Estates
Management, Business, Science and Arts Occupations
The most common Management, Business, Science and Arts occupations in Lakeview Estates are Health Diagnosing & Treating (47 | 3.6%), and Management (13 | 1.0%).
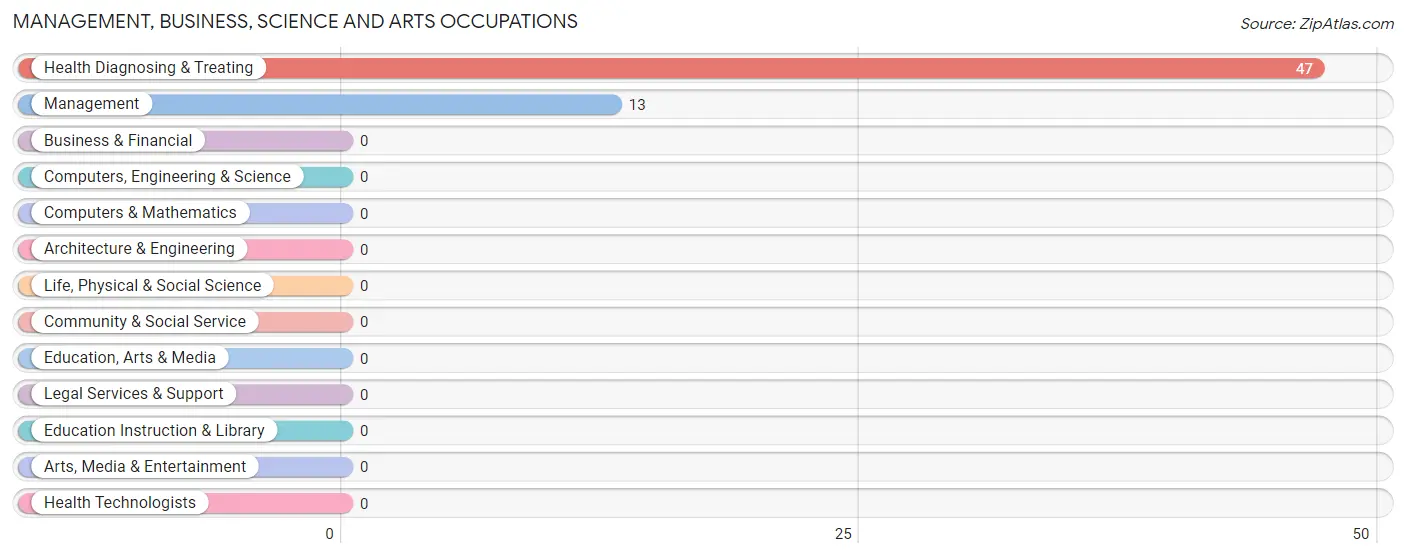
Management, Business, Science and Arts Occupations by Sex
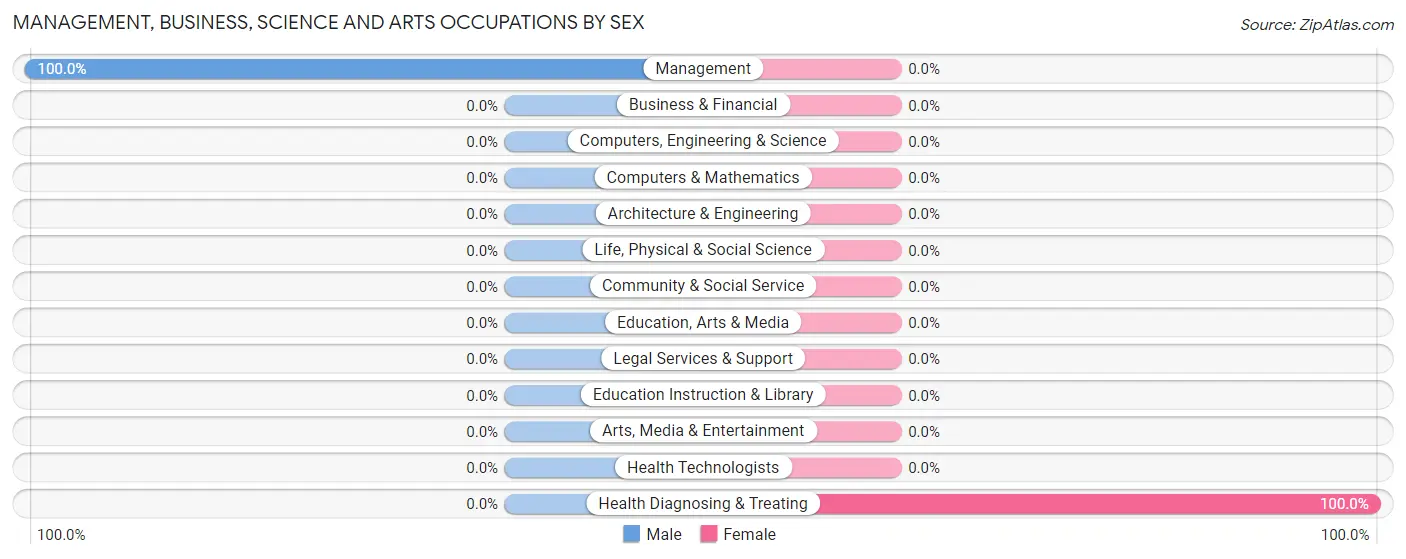
| Occupation | Male | Female |
| Management | 13 (100.0%) | 0 (0.0%) |
| Business & Financial | 0 (0.0%) | 0 (0.0%) |
| Computers, Engineering & Science | 0 (0.0%) | 0 (0.0%) |
| Computers & Mathematics | 0 (0.0%) | 0 (0.0%) |
| Architecture & Engineering | 0 (0.0%) | 0 (0.0%) |
| Life, Physical & Social Science | 0 (0.0%) | 0 (0.0%) |
| Community & Social Service | 0 (0.0%) | 0 (0.0%) |
| Education, Arts & Media | 0 (0.0%) | 0 (0.0%) |
| Legal Services & Support | 0 (0.0%) | 0 (0.0%) |
| Education Instruction & Library | 0 (0.0%) | 0 (0.0%) |
| Arts, Media & Entertainment | 0 (0.0%) | 0 (0.0%) |
| Health Diagnosing & Treating | 0 (0.0%) | 47 (100.0%) |
| Health Technologists | 0 (0.0%) | 0 (0.0%) |
| Total (Category) | 13 (21.7%) | 47 (78.3%) |
| Total (Overall) | 761 (58.9%) | 531 (41.1%) |
Services Occupations
The most common Services occupations in Lakeview Estates are Personal Care & Service (58 | 4.5%), Cleaning & Maintenance (57 | 4.4%), and Food Preparation & Serving (41 | 3.2%).
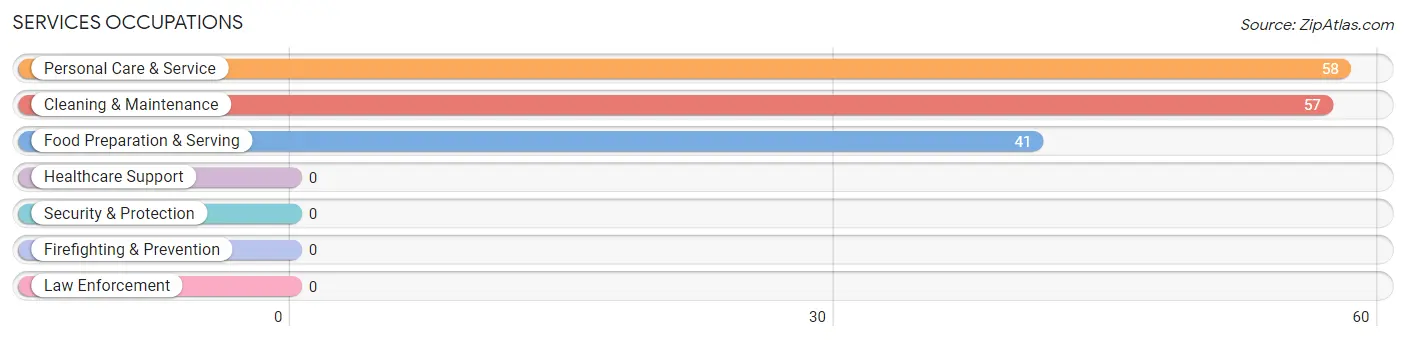
Services Occupations by Sex
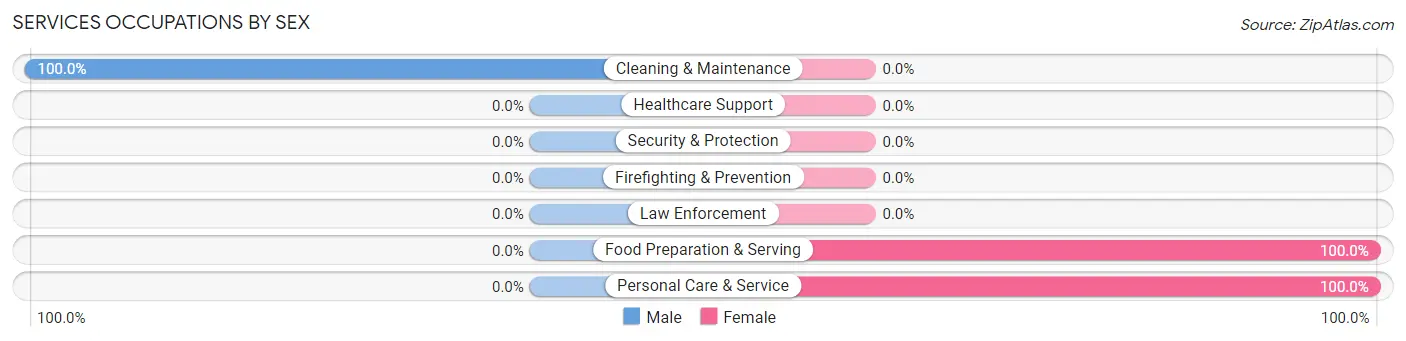
| Occupation | Male | Female |
| Healthcare Support | 0 (0.0%) | 0 (0.0%) |
| Security & Protection | 0 (0.0%) | 0 (0.0%) |
| Firefighting & Prevention | 0 (0.0%) | 0 (0.0%) |
| Law Enforcement | 0 (0.0%) | 0 (0.0%) |
| Food Preparation & Serving | 0 (0.0%) | 41 (100.0%) |
| Cleaning & Maintenance | 57 (100.0%) | 0 (0.0%) |
| Personal Care & Service | 0 (0.0%) | 58 (100.0%) |
| Total (Category) | 57 (36.5%) | 99 (63.5%) |
| Total (Overall) | 761 (58.9%) | 531 (41.1%) |
Sales and Office Occupations
The most common Sales and Office occupations in Lakeview Estates are Sales & Related (42 | 3.3%), and Office & Administration (19 | 1.5%).
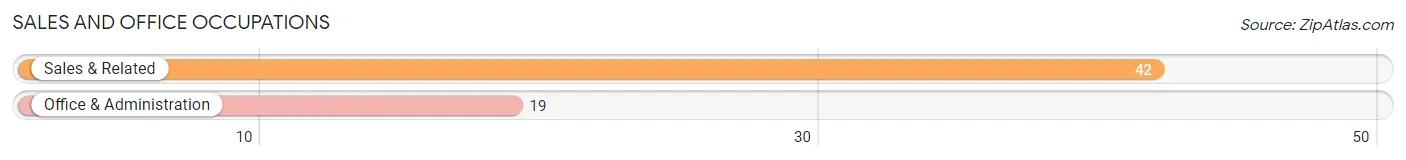
Sales and Office Occupations by Sex

| Occupation | Male | Female |
| Sales & Related | 42 (100.0%) | 0 (0.0%) |
| Office & Administration | 0 (0.0%) | 19 (100.0%) |
| Total (Category) | 42 (68.9%) | 19 (31.1%) |
| Total (Overall) | 761 (58.9%) | 531 (41.1%) |
Natural Resources, Construction and Maintenance Occupations
The most common Natural Resources, Construction and Maintenance occupations in Lakeview Estates are Construction & Extraction (404 | 31.3%), and Installation, Maintenance & Repair (10 | 0.8%).

Natural Resources, Construction and Maintenance Occupations by Sex

| Occupation | Male | Female |
| Farming, Fishing & Forestry | 0 (0.0%) | 0 (0.0%) |
| Construction & Extraction | 265 (65.6%) | 139 (34.4%) |
| Installation, Maintenance & Repair | 10 (100.0%) | 0 (0.0%) |
| Total (Category) | 275 (66.4%) | 139 (33.6%) |
| Total (Overall) | 761 (58.9%) | 531 (41.1%) |
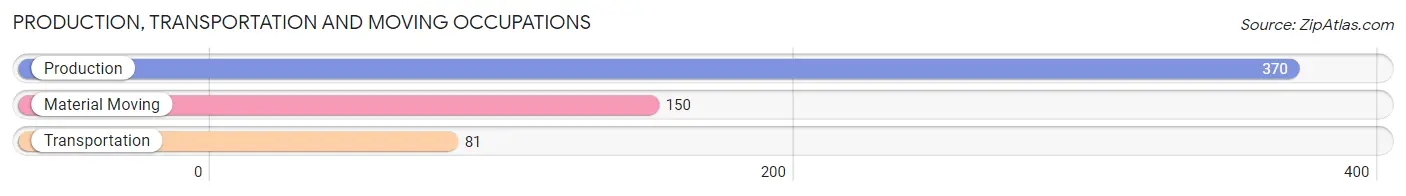
Production, Transportation and Moving Occupations
The most common Production, Transportation and Moving occupations in Lakeview Estates are Production (370 | 28.6%), Material Moving (150 | 11.6%), and Transportation (81 | 6.3%).
Production, Transportation and Moving Occupations by Sex
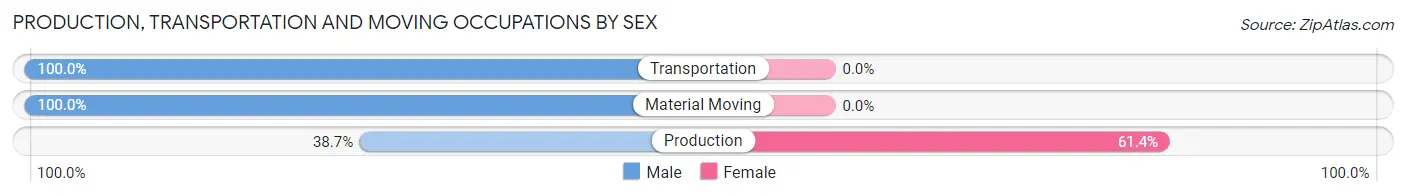
| Occupation | Male | Female |
| Production | 143 (38.7%) | 227 (61.4%) |
| Transportation | 81 (100.0%) | 0 (0.0%) |
| Material Moving | 150 (100.0%) | 0 (0.0%) |
| Total (Category) | 374 (62.2%) | 227 (37.8%) |
| Total (Overall) | 761 (58.9%) | 531 (41.1%) |
Employment Industries by Sex in Lakeview Estates
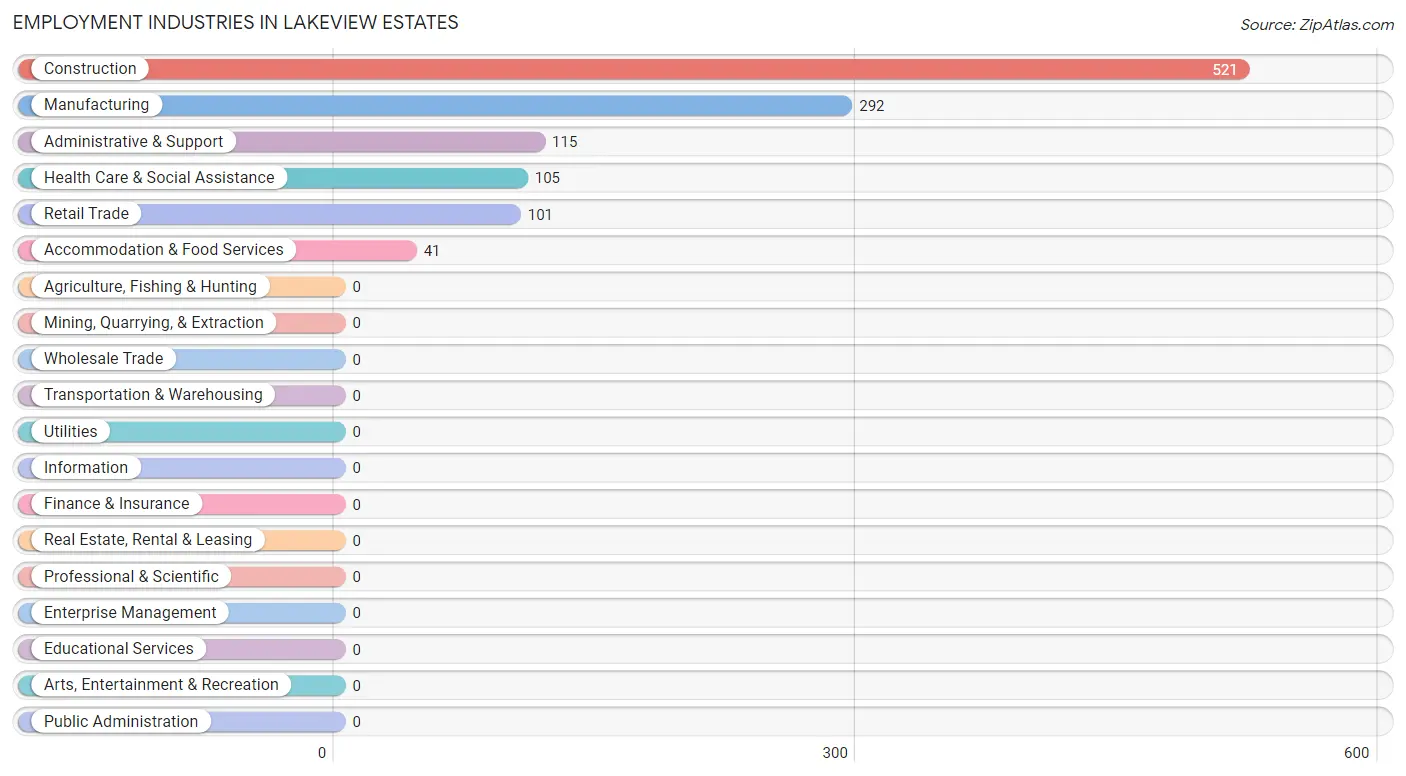
Employment Industries in Lakeview Estates
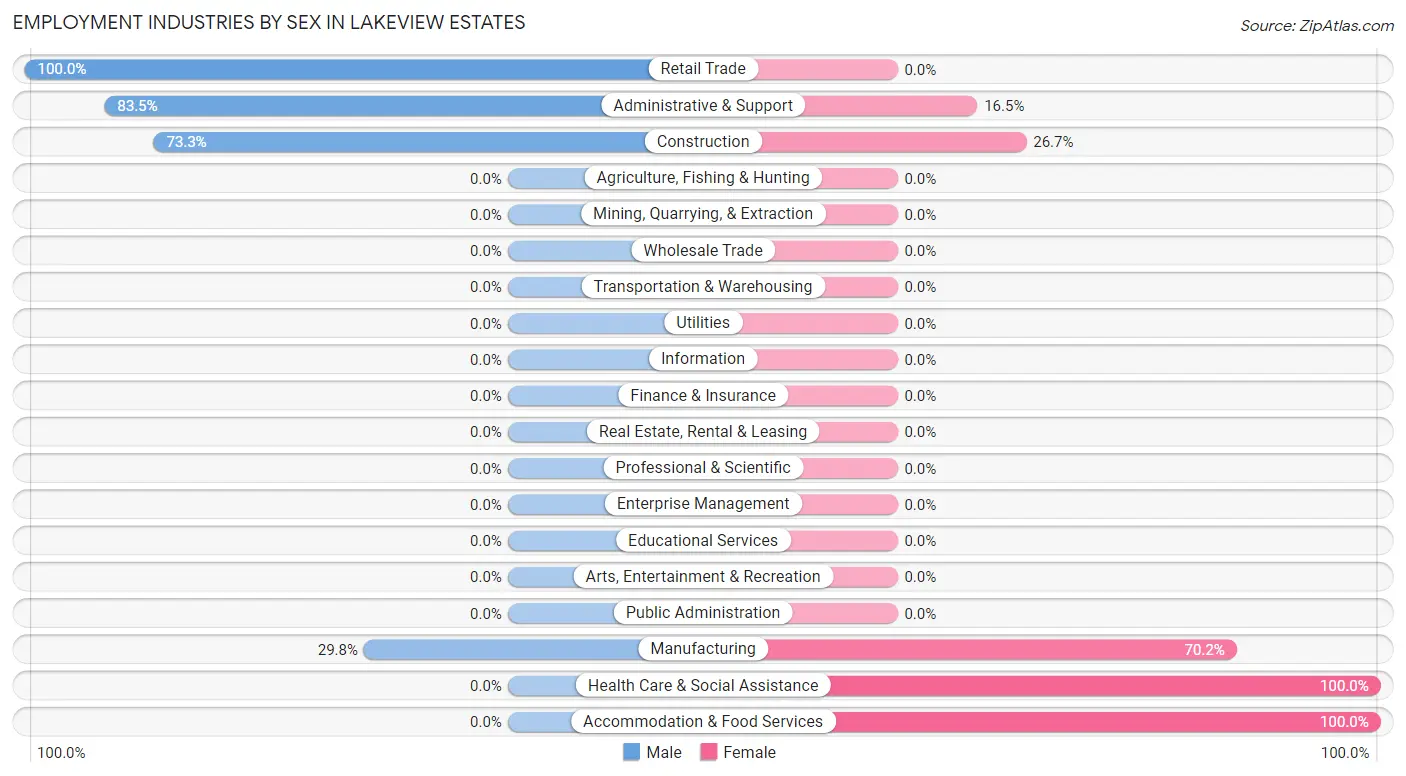
The major employment industries in Lakeview Estates include Construction (521 | 40.3%), Manufacturing (292 | 22.6%), Administrative & Support (115 | 8.9%), Health Care & Social Assistance (105 | 8.1%), and Retail Trade (101 | 7.8%).
Employment Industries by Sex in Lakeview Estates
The Lakeview Estates industries that see more men than women are Retail Trade (100.0%), Administrative & Support (83.5%), and Construction (73.3%), whereas the industries that tend to have a higher number of women are Health Care & Social Assistance (100.0%), Accommodation & Food Services (100.0%), and Manufacturing (70.2%).
| Industry | Male | Female |
| Agriculture, Fishing & Hunting | 0 (0.0%) | 0 (0.0%) |
| Mining, Quarrying, & Extraction | 0 (0.0%) | 0 (0.0%) |
| Construction | 382 (73.3%) | 139 (26.7%) |
| Manufacturing | 87 (29.8%) | 205 (70.2%) |
| Wholesale Trade | 0 (0.0%) | 0 (0.0%) |
| Retail Trade | 101 (100.0%) | 0 (0.0%) |
| Transportation & Warehousing | 0 (0.0%) | 0 (0.0%) |
| Utilities | 0 (0.0%) | 0 (0.0%) |
| Information | 0 (0.0%) | 0 (0.0%) |
| Finance & Insurance | 0 (0.0%) | 0 (0.0%) |
| Real Estate, Rental & Leasing | 0 (0.0%) | 0 (0.0%) |
| Professional & Scientific | 0 (0.0%) | 0 (0.0%) |
| Enterprise Management | 0 (0.0%) | 0 (0.0%) |
| Administrative & Support | 96 (83.5%) | 19 (16.5%) |
| Educational Services | 0 (0.0%) | 0 (0.0%) |
| Health Care & Social Assistance | 0 (0.0%) | 105 (100.0%) |
| Arts, Entertainment & Recreation | 0 (0.0%) | 0 (0.0%) |
| Accommodation & Food Services | 0 (0.0%) | 41 (100.0%) |
| Public Administration | 0 (0.0%) | 0 (0.0%) |
| Total | 761 (58.9%) | 531 (41.1%) |
Education in Lakeview Estates
School Enrollment in Lakeview Estates
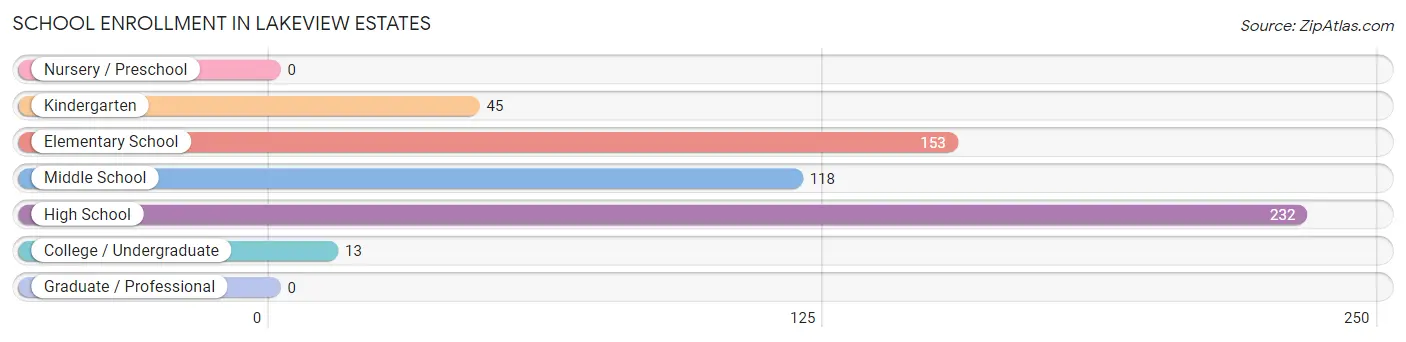
The most common levels of schooling among the 561 students in Lakeview Estates are high school (232 | 41.3%), elementary school (153 | 27.3%), and middle school (118 | 21.0%).
| School Level | # Students | % Students |
| Nursery / Preschool | 0 | 0.0% |
| Kindergarten | 45 | 8.0% |
| Elementary School | 153 | 27.3% |
| Middle School | 118 | 21.0% |
| High School | 232 | 41.3% |
| College / Undergraduate | 13 | 2.3% |
| Graduate / Professional | 0 | 0.0% |
| Total | 561 | 100.0% |
School Enrollment by Age by Funding Source in Lakeview Estates
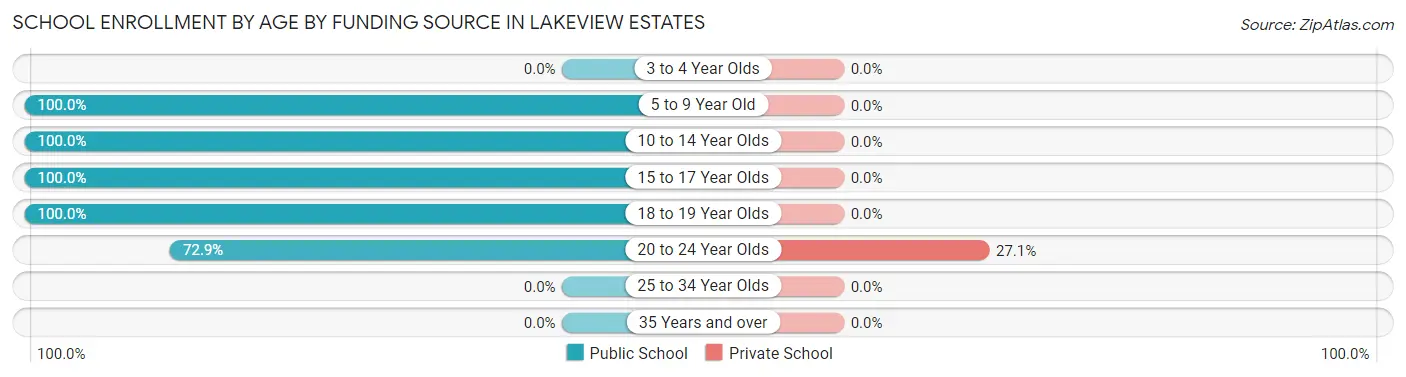
Out of a total of 561 students who are enrolled in schools in Lakeview Estates, 13 (2.3%) attend a private institution, while the remaining 548 (97.7%) are enrolled in public schools. The age group of 20 to 24 year olds has the highest likelihood of being enrolled in private schools, with 13 (27.1% in the age bracket) enrolled. Conversely, the age group of 5 to 9 year old has the lowest likelihood of being enrolled in a private school, with 176 (100.0% in the age bracket) attending a public institution.
| Age Bracket | Public School | Private School |
| 3 to 4 Year Olds | 0 (0.0%) | 0 (0.0%) |
| 5 to 9 Year Old | 176 (100.0%) | 0 (0.0%) |
| 10 to 14 Year Olds | 174 (100.0%) | 0 (0.0%) |
| 15 to 17 Year Olds | 102 (100.0%) | 0 (0.0%) |
| 18 to 19 Year Olds | 61 (100.0%) | 0 (0.0%) |
| 20 to 24 Year Olds | 35 (72.9%) | 13 (27.1%) |
| 25 to 34 Year Olds | 0 (0.0%) | 0 (0.0%) |
| 35 Years and over | 0 (0.0%) | 0 (0.0%) |
| Total | 548 (97.7%) | 13 (2.3%) |
Educational Attainment by Field of Study in Lakeview Estates
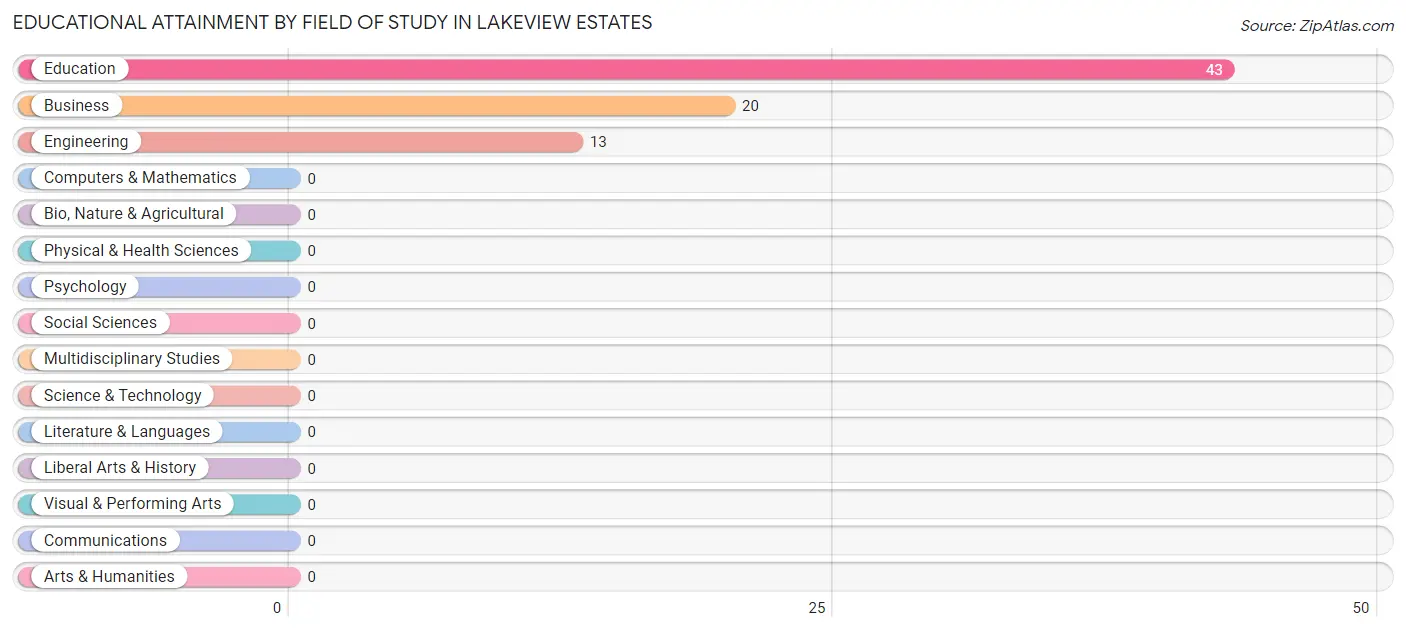
Education (43 | 56.6%), business (20 | 26.3%), and engineering (13 | 17.1%) are the most common fields of study among 76 individuals in Lakeview Estates who have obtained a bachelor's degree or higher.
| Field of Study | # Graduates | % Graduates |
| Computers & Mathematics | 0 | 0.0% |
| Bio, Nature & Agricultural | 0 | 0.0% |
| Physical & Health Sciences | 0 | 0.0% |
| Psychology | 0 | 0.0% |
| Social Sciences | 0 | 0.0% |
| Engineering | 13 | 17.1% |
| Multidisciplinary Studies | 0 | 0.0% |
| Science & Technology | 0 | 0.0% |
| Business | 20 | 26.3% |
| Education | 43 | 56.6% |
| Literature & Languages | 0 | 0.0% |
| Liberal Arts & History | 0 | 0.0% |
| Visual & Performing Arts | 0 | 0.0% |
| Communications | 0 | 0.0% |
| Arts & Humanities | 0 | 0.0% |
| Total | 76 | 100.0% |
Transportation & Commute in Lakeview Estates
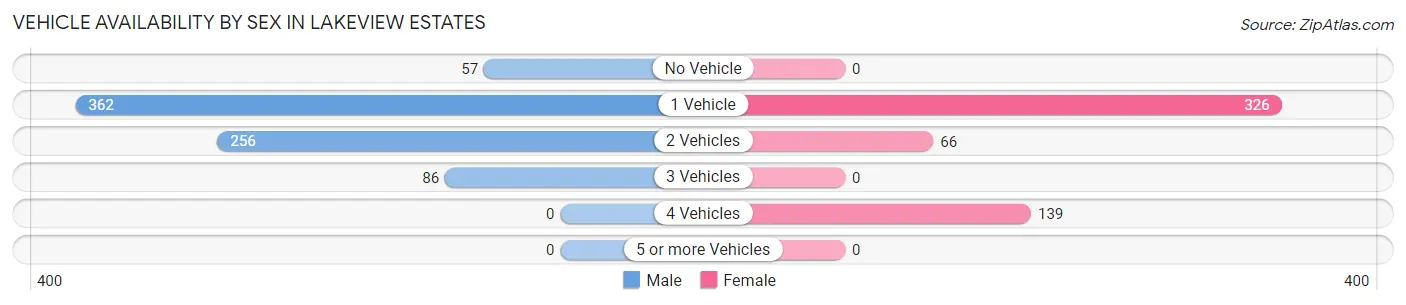
Vehicle Availability by Sex in Lakeview Estates
The most prevalent vehicle ownership categories in Lakeview Estates are males with 1 vehicle (362, accounting for 47.6%) and females with 1 vehicle (326, making up 68.2%).
| Vehicles Available | Male | Female |
| No Vehicle | 57 (7.5%) | 0 (0.0%) |
| 1 Vehicle | 362 (47.6%) | 326 (61.4%) |
| 2 Vehicles | 256 (33.6%) | 66 (12.4%) |
| 3 Vehicles | 86 (11.3%) | 0 (0.0%) |
| 4 Vehicles | 0 (0.0%) | 139 (26.2%) |
| 5 or more Vehicles | 0 (0.0%) | 0 (0.0%) |
| Total | 761 (100.0%) | 531 (100.0%) |
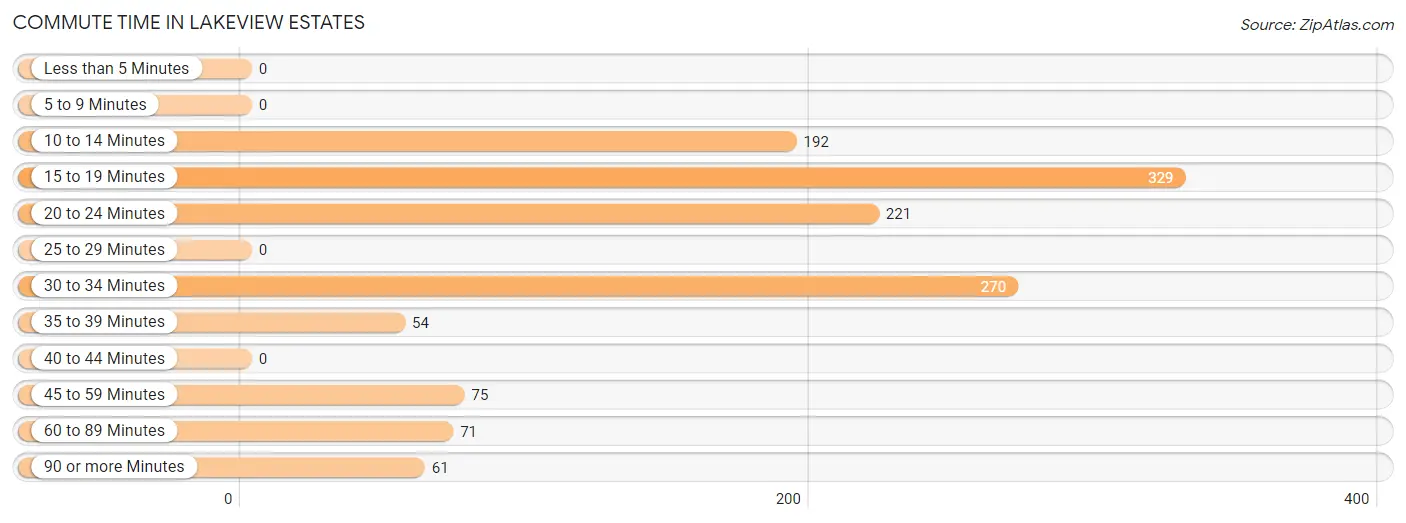
Commute Time in Lakeview Estates
The most frequently occuring commute durations in Lakeview Estates are 15 to 19 minutes (329 commuters, 25.8%), 30 to 34 minutes (270 commuters, 21.2%), and 20 to 24 minutes (221 commuters, 17.4%).
| Commute Time | # Commuters | % Commuters |
| Less than 5 Minutes | 0 | 0.0% |
| 5 to 9 Minutes | 0 | 0.0% |
| 10 to 14 Minutes | 192 | 15.1% |
| 15 to 19 Minutes | 329 | 25.8% |
| 20 to 24 Minutes | 221 | 17.4% |
| 25 to 29 Minutes | 0 | 0.0% |
| 30 to 34 Minutes | 270 | 21.2% |
| 35 to 39 Minutes | 54 | 4.2% |
| 40 to 44 Minutes | 0 | 0.0% |
| 45 to 59 Minutes | 75 | 5.9% |
| 60 to 89 Minutes | 71 | 5.6% |
| 90 or more Minutes | 61 | 4.8% |
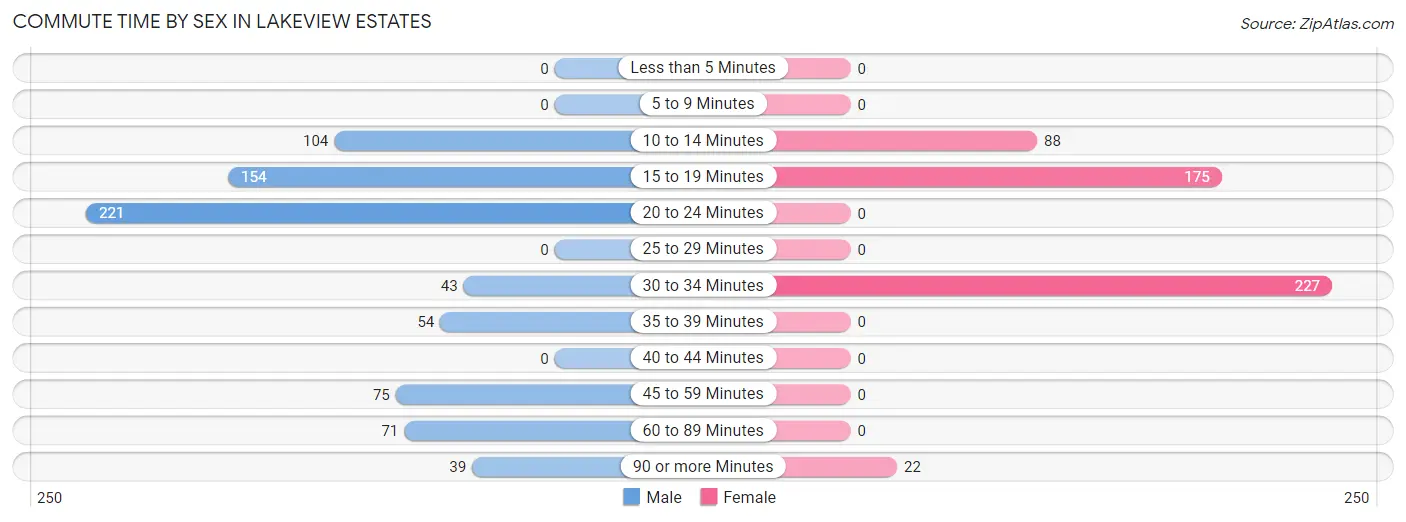
Commute Time by Sex in Lakeview Estates
The most common commute times in Lakeview Estates are 20 to 24 minutes (221 commuters, 29.0%) for males and 30 to 34 minutes (227 commuters, 44.3%) for females.
| Commute Time | Male | Female |
| Less than 5 Minutes | 0 (0.0%) | 0 (0.0%) |
| 5 to 9 Minutes | 0 (0.0%) | 0 (0.0%) |
| 10 to 14 Minutes | 104 (13.7%) | 88 (17.2%) |
| 15 to 19 Minutes | 154 (20.2%) | 175 (34.2%) |
| 20 to 24 Minutes | 221 (29.0%) | 0 (0.0%) |
| 25 to 29 Minutes | 0 (0.0%) | 0 (0.0%) |
| 30 to 34 Minutes | 43 (5.7%) | 227 (44.3%) |
| 35 to 39 Minutes | 54 (7.1%) | 0 (0.0%) |
| 40 to 44 Minutes | 0 (0.0%) | 0 (0.0%) |
| 45 to 59 Minutes | 75 (9.9%) | 0 (0.0%) |
| 60 to 89 Minutes | 71 (9.3%) | 0 (0.0%) |
| 90 or more Minutes | 39 (5.1%) | 22 (4.3%) |
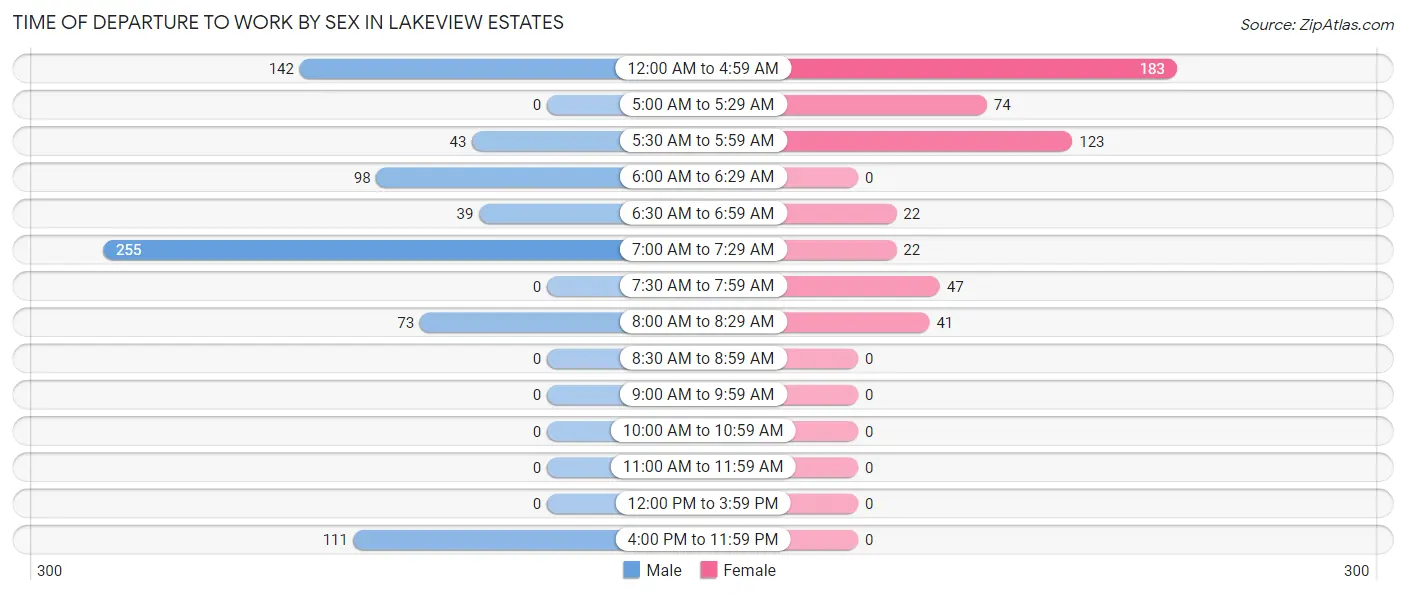
Time of Departure to Work by Sex in Lakeview Estates
The most frequent times of departure to work in Lakeview Estates are 7:00 AM to 7:29 AM (255, 33.5%) for males and 12:00 AM to 4:59 AM (183, 35.7%) for females.
| Time of Departure | Male | Female |
| 12:00 AM to 4:59 AM | 142 (18.7%) | 183 (35.7%) |
| 5:00 AM to 5:29 AM | 0 (0.0%) | 74 (14.4%) |
| 5:30 AM to 5:59 AM | 43 (5.7%) | 123 (24.0%) |
| 6:00 AM to 6:29 AM | 98 (12.9%) | 0 (0.0%) |
| 6:30 AM to 6:59 AM | 39 (5.1%) | 22 (4.3%) |
| 7:00 AM to 7:29 AM | 255 (33.5%) | 22 (4.3%) |
| 7:30 AM to 7:59 AM | 0 (0.0%) | 47 (9.2%) |
| 8:00 AM to 8:29 AM | 73 (9.6%) | 41 (8.0%) |
| 8:30 AM to 8:59 AM | 0 (0.0%) | 0 (0.0%) |
| 9:00 AM to 9:59 AM | 0 (0.0%) | 0 (0.0%) |
| 10:00 AM to 10:59 AM | 0 (0.0%) | 0 (0.0%) |
| 11:00 AM to 11:59 AM | 0 (0.0%) | 0 (0.0%) |
| 12:00 PM to 3:59 PM | 0 (0.0%) | 0 (0.0%) |
| 4:00 PM to 11:59 PM | 111 (14.6%) | 0 (0.0%) |
| Total | 761 (100.0%) | 512 (100.0%) |
Housing Occupancy in Lakeview Estates
Occupancy by Ownership in Lakeview Estates
Of the total 669 dwellings in Lakeview Estates, owner-occupied units account for 151 (22.6%), while renter-occupied units make up 518 (77.4%).
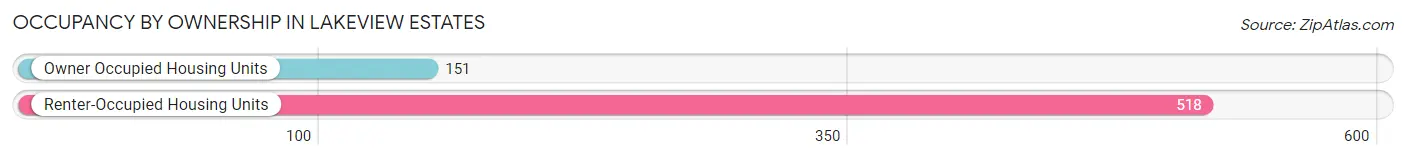
| Occupancy | # Housing Units | % Housing Units |
| Owner Occupied Housing Units | 151 | 22.6% |
| Renter-Occupied Housing Units | 518 | 77.4% |
| Total Occupied Housing Units | 669 | 100.0% |
Occupancy by Household Size in Lakeview Estates
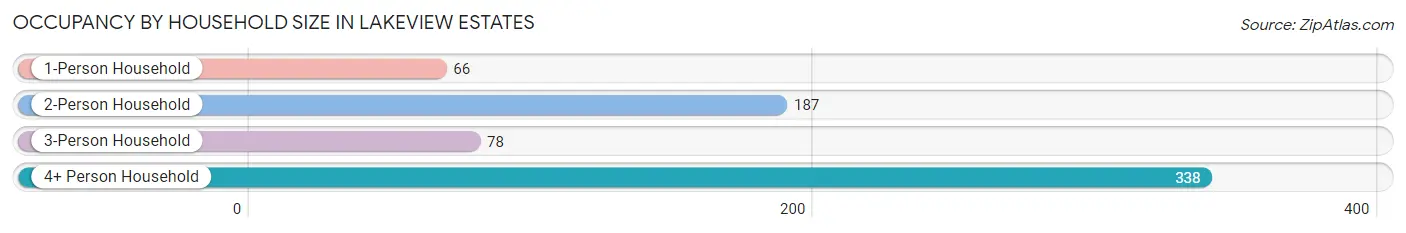
| Household Size | # Housing Units | % Housing Units |
| 1-Person Household | 66 | 9.9% |
| 2-Person Household | 187 | 28.0% |
| 3-Person Household | 78 | 11.7% |
| 4+ Person Household | 338 | 50.5% |
| Total Housing Units | 669 | 100.0% |
Occupancy by Ownership by Household Size in Lakeview Estates
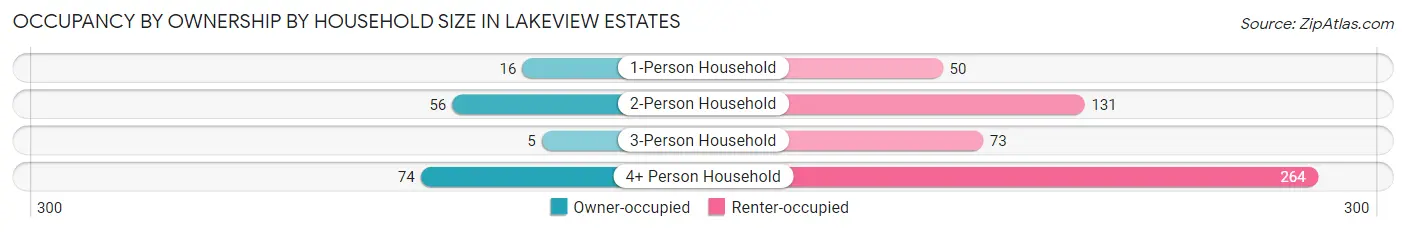
| Household Size | Owner-occupied | Renter-occupied |
| 1-Person Household | 16 (24.2%) | 50 (75.8%) |
| 2-Person Household | 56 (29.9%) | 131 (70.1%) |
| 3-Person Household | 5 (6.4%) | 73 (93.6%) |
| 4+ Person Household | 74 (21.9%) | 264 (78.1%) |
| Total Housing Units | 151 (22.6%) | 518 (77.4%) |
Occupancy by Educational Attainment in Lakeview Estates
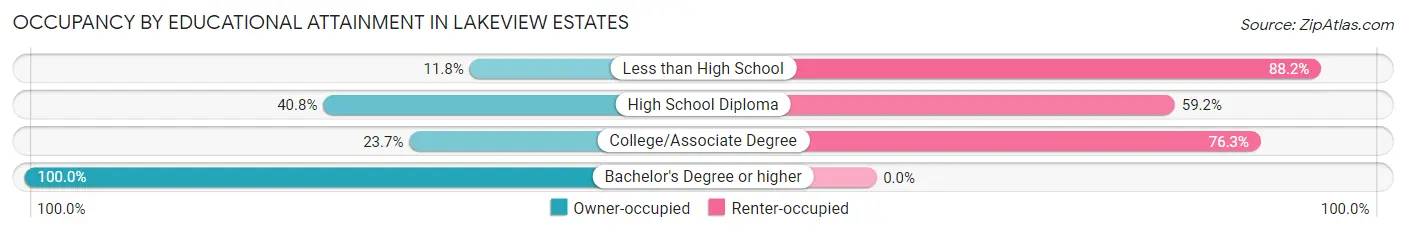
| Household Size | Owner-occupied | Renter-occupied |
| Less than High School | 43 (11.8%) | 322 (88.2%) |
| High School Diploma | 62 (40.8%) | 90 (59.2%) |
| College/Associate Degree | 33 (23.7%) | 106 (76.3%) |
| Bachelor's Degree or higher | 13 (100.0%) | 0 (0.0%) |
Occupancy by Age of Householder in Lakeview Estates
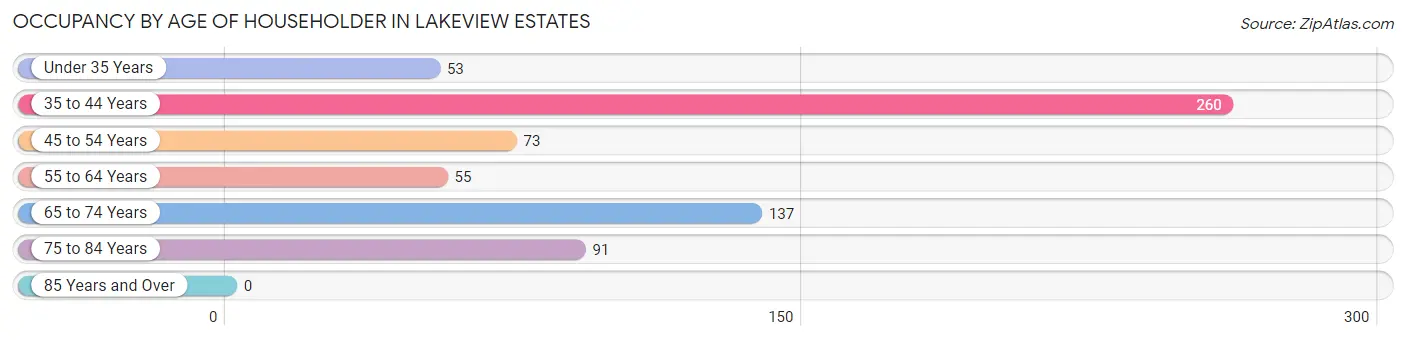
| Age Bracket | # Households | % Households |
| Under 35 Years | 53 | 7.9% |
| 35 to 44 Years | 260 | 38.9% |
| 45 to 54 Years | 73 | 10.9% |
| 55 to 64 Years | 55 | 8.2% |
| 65 to 74 Years | 137 | 20.5% |
| 75 to 84 Years | 91 | 13.6% |
| 85 Years and Over | 0 | 0.0% |
| Total | 669 | 100.0% |
Housing Finances in Lakeview Estates
Median Income by Occupancy in Lakeview Estates
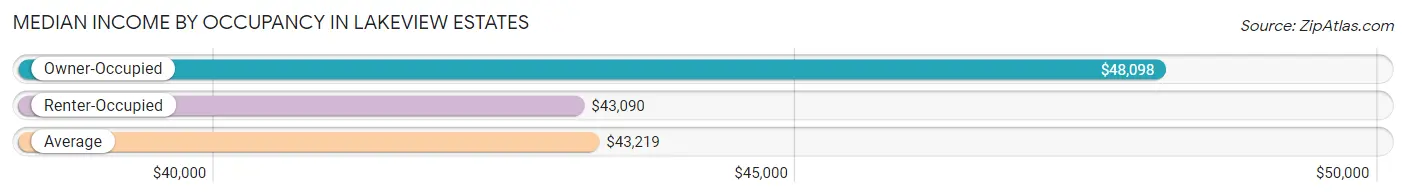
| Occupancy Type | # Households | Median Income |
| Owner-Occupied | 151 (22.6%) | $48,098 |
| Renter-Occupied | 518 (77.4%) | $43,090 |
| Average | 669 (100.0%) | $43,219 |
Occupancy by Householder Income Bracket in Lakeview Estates
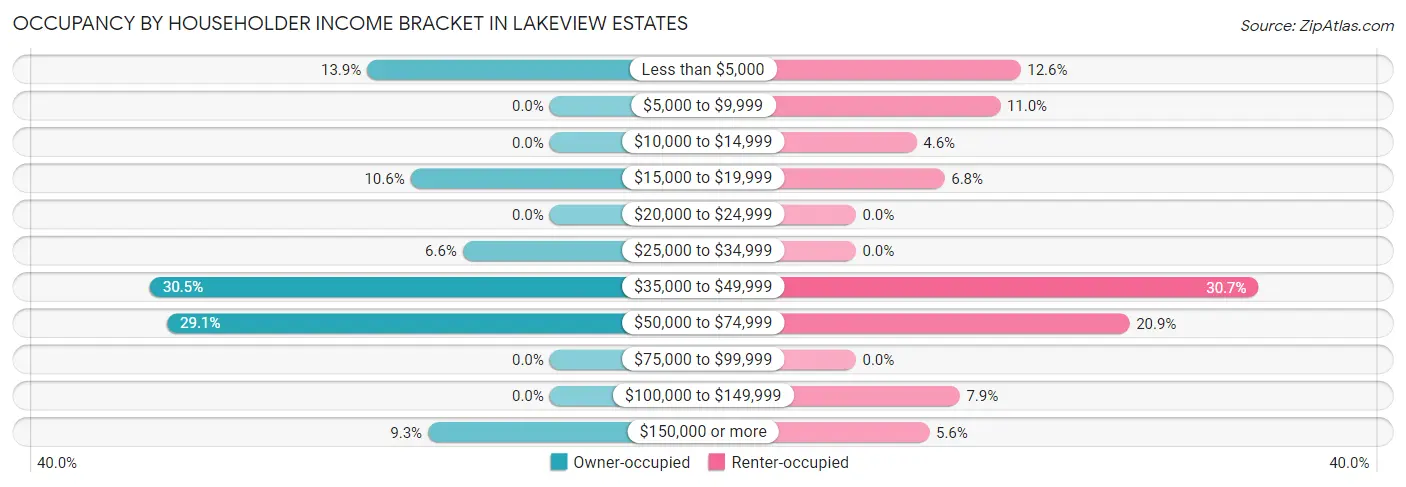
| Income Bracket | Owner-occupied | Renter-occupied |
| Less than $5,000 | 21 (13.9%) | 65 (12.6%) |
| $5,000 to $9,999 | 0 (0.0%) | 57 (11.0%) |
| $10,000 to $14,999 | 0 (0.0%) | 24 (4.6%) |
| $15,000 to $19,999 | 16 (10.6%) | 35 (6.8%) |
| $20,000 to $24,999 | 0 (0.0%) | 0 (0.0%) |
| $25,000 to $34,999 | 10 (6.6%) | 0 (0.0%) |
| $35,000 to $49,999 | 46 (30.5%) | 159 (30.7%) |
| $50,000 to $74,999 | 44 (29.1%) | 108 (20.8%) |
| $75,000 to $99,999 | 0 (0.0%) | 0 (0.0%) |
| $100,000 to $149,999 | 0 (0.0%) | 41 (7.9%) |
| $150,000 or more | 14 (9.3%) | 29 (5.6%) |
| Total | 151 (100.0%) | 518 (100.0%) |
Monthly Housing Cost Tiers in Lakeview Estates
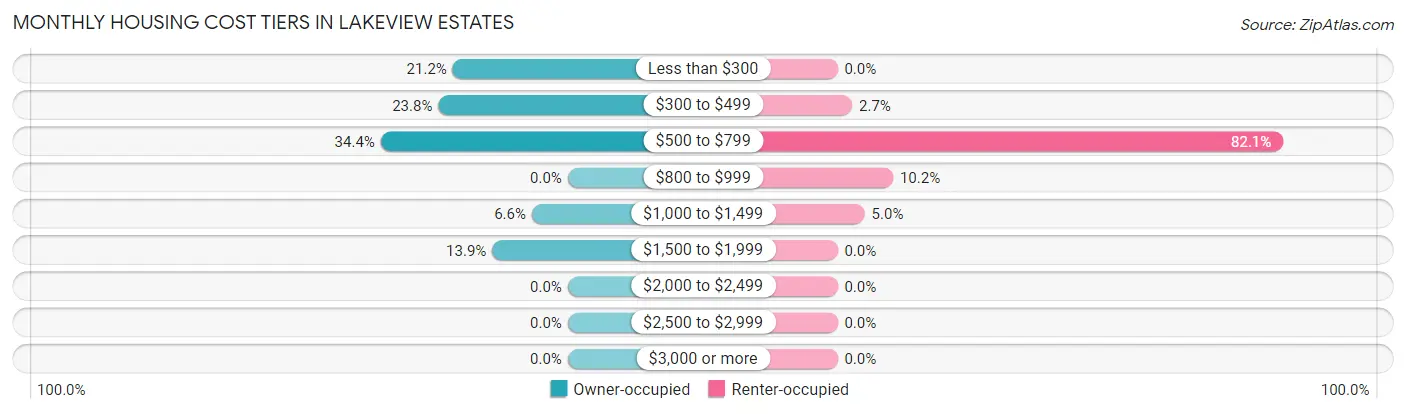
| Monthly Cost | Owner-occupied | Renter-occupied |
| Less than $300 | 32 (21.2%) | 0 (0.0%) |
| $300 to $499 | 36 (23.8%) | 14 (2.7%) |
| $500 to $799 | 52 (34.4%) | 425 (82.1%) |
| $800 to $999 | 0 (0.0%) | 53 (10.2%) |
| $1,000 to $1,499 | 10 (6.6%) | 26 (5.0%) |
| $1,500 to $1,999 | 21 (13.9%) | 0 (0.0%) |
| $2,000 to $2,499 | 0 (0.0%) | 0 (0.0%) |
| $2,500 to $2,999 | 0 (0.0%) | 0 (0.0%) |
| $3,000 or more | 0 (0.0%) | 0 (0.0%) |
| Total | 151 (100.0%) | 518 (100.0%) |
Physical Housing Characteristics in Lakeview Estates
Housing Structures in Lakeview Estates
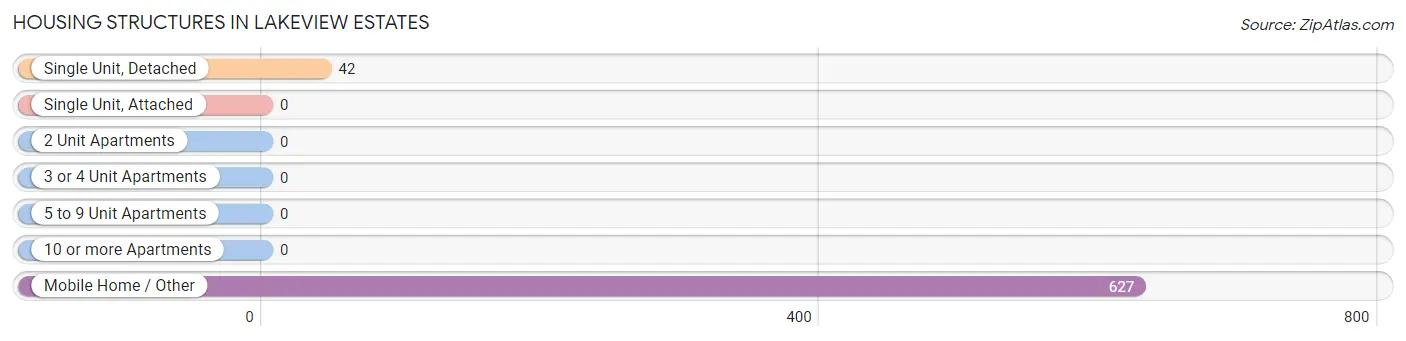
| Structure Type | # Housing Units | % Housing Units |
| Single Unit, Detached | 42 | 6.3% |
| Single Unit, Attached | 0 | 0.0% |
| 2 Unit Apartments | 0 | 0.0% |
| 3 or 4 Unit Apartments | 0 | 0.0% |
| 5 to 9 Unit Apartments | 0 | 0.0% |
| 10 or more Apartments | 0 | 0.0% |
| Mobile Home / Other | 627 | 93.7% |
| Total | 669 | 100.0% |
Housing Structures by Occupancy in Lakeview Estates
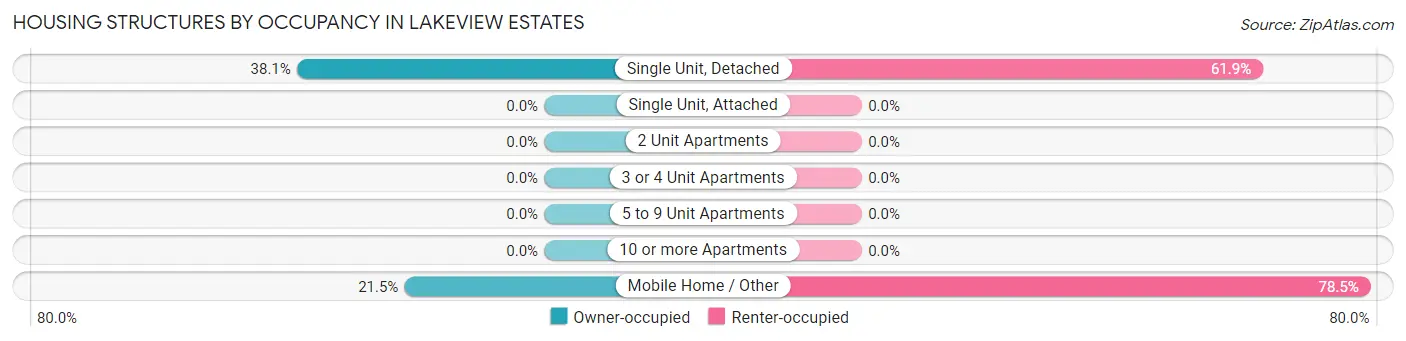
| Structure Type | Owner-occupied | Renter-occupied |
| Single Unit, Detached | 16 (38.1%) | 26 (61.9%) |
| Single Unit, Attached | 0 (0.0%) | 0 (0.0%) |
| 2 Unit Apartments | 0 (0.0%) | 0 (0.0%) |
| 3 or 4 Unit Apartments | 0 (0.0%) | 0 (0.0%) |
| 5 to 9 Unit Apartments | 0 (0.0%) | 0 (0.0%) |
| 10 or more Apartments | 0 (0.0%) | 0 (0.0%) |
| Mobile Home / Other | 135 (21.5%) | 492 (78.5%) |
| Total | 151 (22.6%) | 518 (77.4%) |
Housing Structures by Number of Rooms in Lakeview Estates
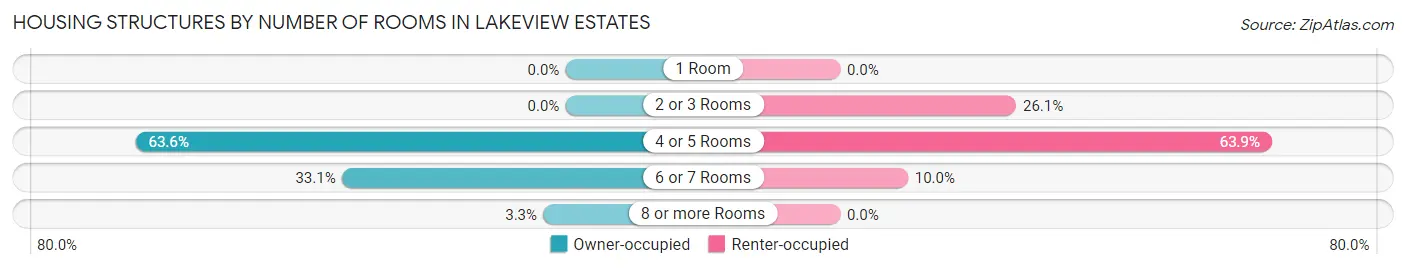
| Number of Rooms | Owner-occupied | Renter-occupied |
| 1 Room | 0 (0.0%) | 0 (0.0%) |
| 2 or 3 Rooms | 0 (0.0%) | 135 (26.1%) |
| 4 or 5 Rooms | 96 (63.6%) | 331 (63.9%) |
| 6 or 7 Rooms | 50 (33.1%) | 52 (10.0%) |
| 8 or more Rooms | 5 (3.3%) | 0 (0.0%) |
| Total | 151 (100.0%) | 518 (100.0%) |
Housing Structure by Heating Type in Lakeview Estates
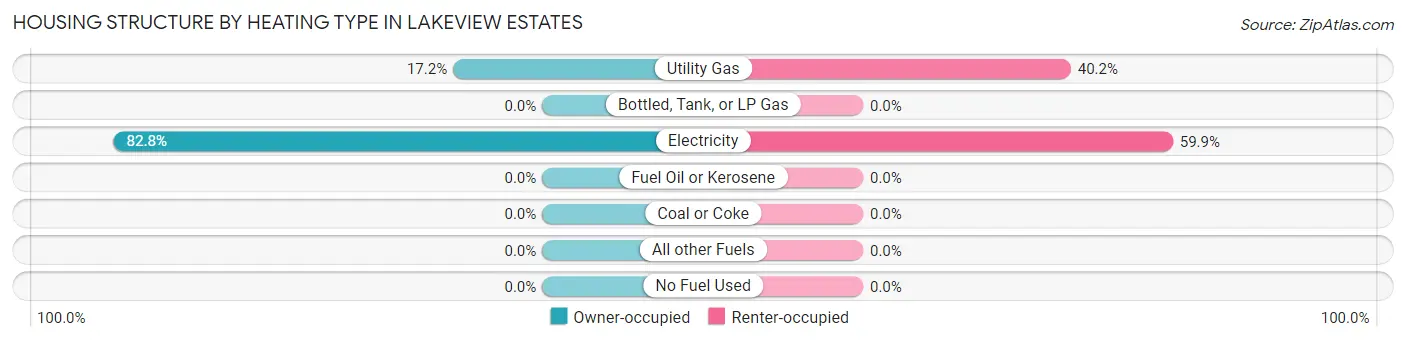
| Heating Type | Owner-occupied | Renter-occupied |
| Utility Gas | 26 (17.2%) | 208 (40.2%) |
| Bottled, Tank, or LP Gas | 0 (0.0%) | 0 (0.0%) |
| Electricity | 125 (82.8%) | 310 (59.9%) |
| Fuel Oil or Kerosene | 0 (0.0%) | 0 (0.0%) |
| Coal or Coke | 0 (0.0%) | 0 (0.0%) |
| All other Fuels | 0 (0.0%) | 0 (0.0%) |
| No Fuel Used | 0 (0.0%) | 0 (0.0%) |
| Total | 151 (100.0%) | 518 (100.0%) |
Household Vehicle Usage in Lakeview Estates
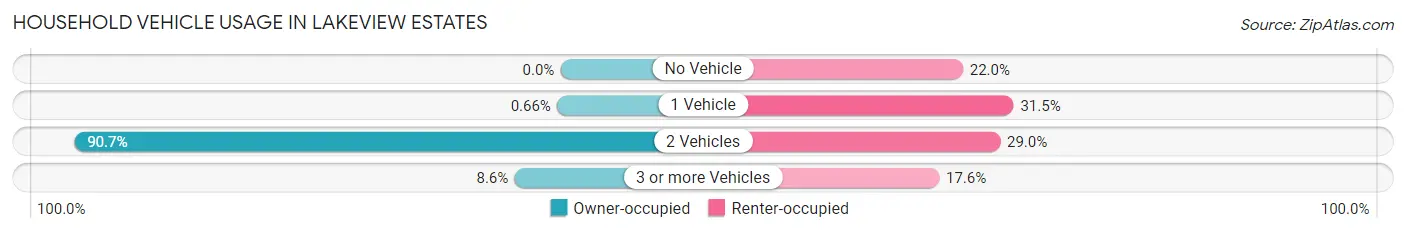
| Vehicles per Household | Owner-occupied | Renter-occupied |
| No Vehicle | 0 (0.0%) | 114 (22.0%) |
| 1 Vehicle | 1 (0.7%) | 163 (31.5%) |
| 2 Vehicles | 137 (90.7%) | 150 (29.0%) |
| 3 or more Vehicles | 13 (8.6%) | 91 (17.6%) |
| Total | 151 (100.0%) | 518 (100.0%) |
Real Estate & Mortgages in Lakeview Estates
Real Estate and Mortgage Overview in Lakeview Estates
| Characteristic | Without Mortgage | With Mortgage |
| Housing Units | 113 | 38 |
| Median Property Value | $45,000 | $0 |
| Median Household Income | $55,096 | $0 |
| Monthly Housing Costs | $468 | $0 |
| Real Estate Taxes | $199 | $38 |
Property Value by Mortgage Status in Lakeview Estates
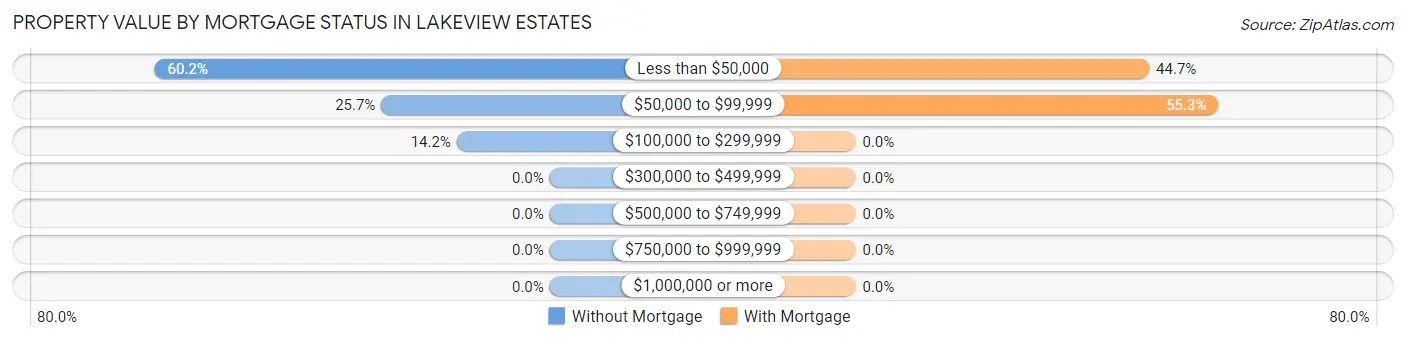
| Property Value | Without Mortgage | With Mortgage |
| Less than $50,000 | 68 (60.2%) | 17 (44.7%) |
| $50,000 to $99,999 | 29 (25.7%) | 21 (55.3%) |
| $100,000 to $299,999 | 16 (14.2%) | 0 (0.0%) |
| $300,000 to $499,999 | 0 (0.0%) | 0 (0.0%) |
| $500,000 to $749,999 | 0 (0.0%) | 0 (0.0%) |
| $750,000 to $999,999 | 0 (0.0%) | 0 (0.0%) |
| $1,000,000 or more | 0 (0.0%) | 0 (0.0%) |
| Total | 113 (100.0%) | 38 (100.0%) |
Household Income by Mortgage Status in Lakeview Estates
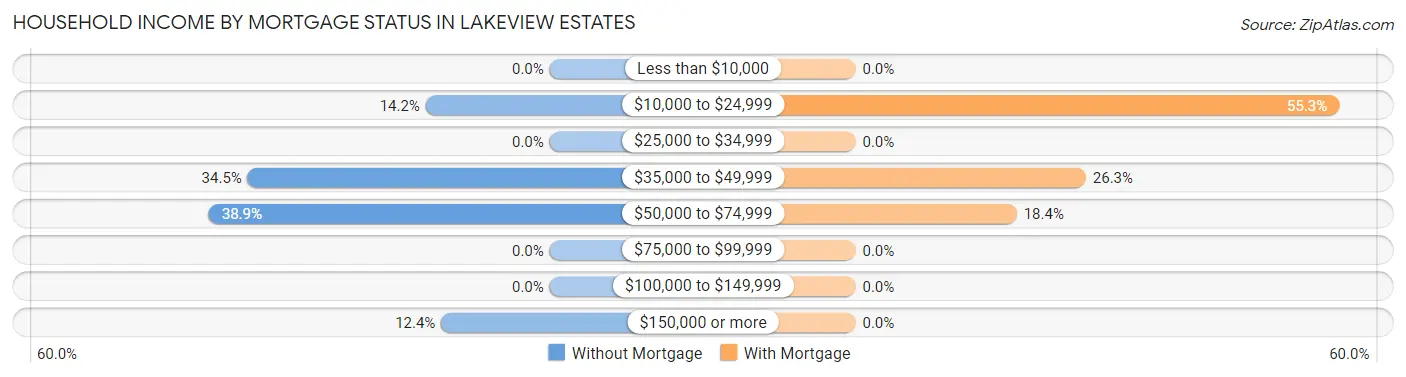
| Household Income | Without Mortgage | With Mortgage |
| Less than $10,000 | 0 (0.0%) | 0 (0.0%) |
| $10,000 to $24,999 | 16 (14.2%) | 21 (55.3%) |
| $25,000 to $34,999 | 0 (0.0%) | 0 (0.0%) |
| $35,000 to $49,999 | 39 (34.5%) | 10 (26.3%) |
| $50,000 to $74,999 | 44 (38.9%) | 7 (18.4%) |
| $75,000 to $99,999 | 0 (0.0%) | 0 (0.0%) |
| $100,000 to $149,999 | 0 (0.0%) | 0 (0.0%) |
| $150,000 or more | 14 (12.4%) | 0 (0.0%) |
| Total | 113 (100.0%) | 38 (100.0%) |
Property Value to Household Income Ratio in Lakeview Estates
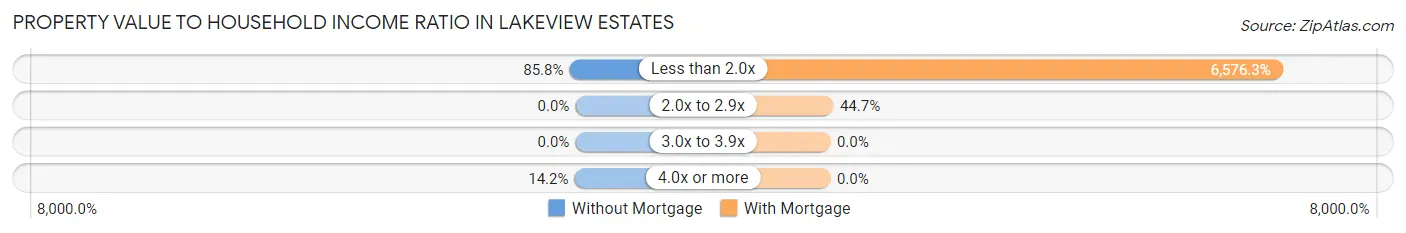
| Value-to-Income Ratio | Without Mortgage | With Mortgage |
| Less than 2.0x | 97 (85.8%) | 2,499 (6,576.3%) |
| 2.0x to 2.9x | 0 (0.0%) | 17 (44.7%) |
| 3.0x to 3.9x | 0 (0.0%) | 0 (0.0%) |
| 4.0x or more | 16 (14.2%) | 0 (0.0%) |
| Total | 113 (100.0%) | 38 (100.0%) |
Real Estate Taxes by Mortgage Status in Lakeview Estates
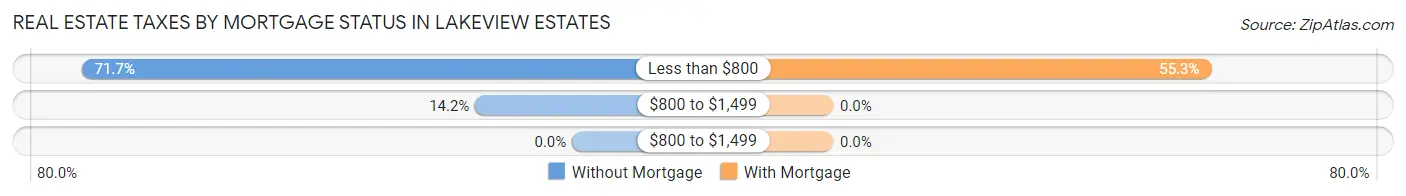
| Property Taxes | Without Mortgage | With Mortgage |
| Less than $800 | 81 (71.7%) | 21 (55.3%) |
| $800 to $1,499 | 16 (14.2%) | 0 (0.0%) |
| $800 to $1,499 | 0 (0.0%) | 0 (0.0%) |
| Total | 113 (100.0%) | 38 (100.0%) |
Health & Disability in Lakeview Estates
Health Insurance Coverage by Age in Lakeview Estates
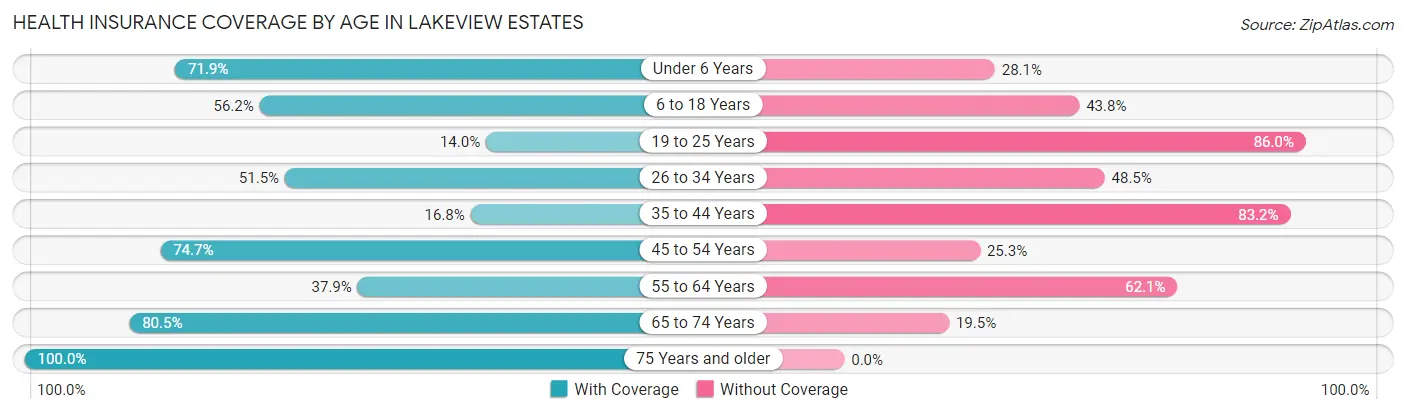
| Age Bracket | With Coverage | Without Coverage |
| Under 6 Years | 141 (71.9%) | 55 (28.1%) |
| 6 to 18 Years | 313 (56.2%) | 244 (43.8%) |
| 19 to 25 Years | 43 (14.0%) | 265 (86.0%) |
| 26 to 34 Years | 141 (51.5%) | 133 (48.5%) |
| 35 to 44 Years | 86 (16.8%) | 425 (83.2%) |
| 45 to 54 Years | 189 (74.7%) | 64 (25.3%) |
| 55 to 64 Years | 119 (37.9%) | 195 (62.1%) |
| 65 to 74 Years | 169 (80.5%) | 41 (19.5%) |
| 75 Years and older | 91 (100.0%) | 0 (0.0%) |
| Total | 1,292 (47.6%) | 1,422 (52.4%) |
Health Insurance Coverage by Citizenship Status in Lakeview Estates

| Citizenship Status | With Coverage | Without Coverage |
| Native Born | 141 (71.9%) | 55 (28.1%) |
| Foreign Born, Citizen | 313 (56.2%) | 244 (43.8%) |
| Foreign Born, not a Citizen | 43 (14.0%) | 265 (86.0%) |
Health Insurance Coverage by Household Income in Lakeview Estates
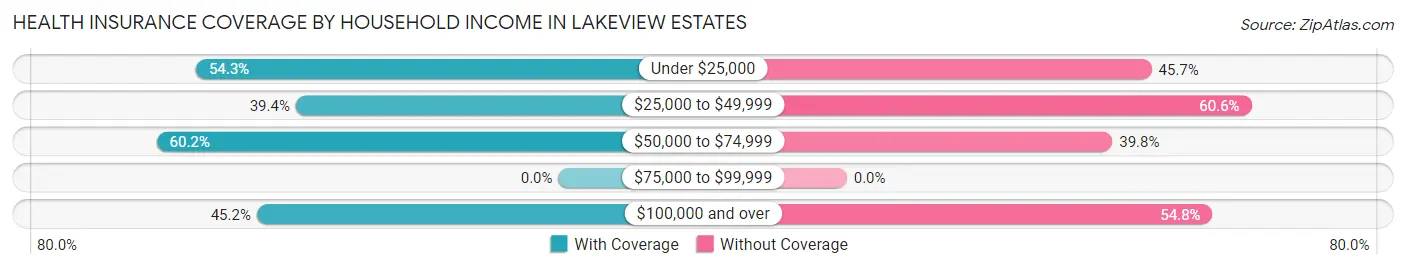
| Household Income | With Coverage | Without Coverage |
| Under $25,000 | 353 (54.3%) | 297 (45.7%) |
| $25,000 to $49,999 | 346 (39.4%) | 533 (60.6%) |
| $50,000 to $74,999 | 230 (60.2%) | 152 (39.8%) |
| $75,000 to $99,999 | 0 (0.0%) | 0 (0.0%) |
| $100,000 and over | 363 (45.2%) | 440 (54.8%) |
Public vs Private Health Insurance Coverage by Age in Lakeview Estates
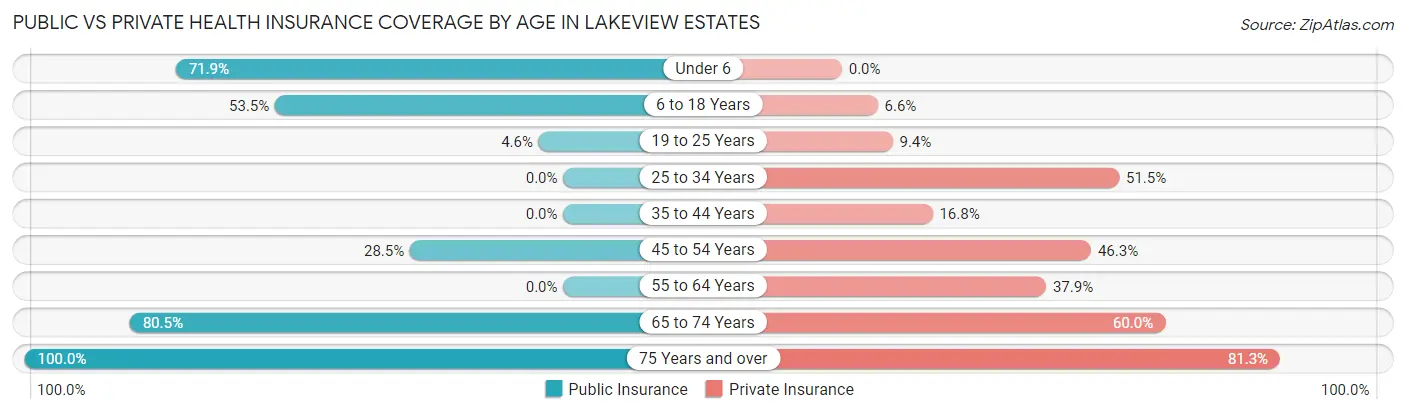
| Age Bracket | Public Insurance | Private Insurance |
| Under 6 | 141 (71.9%) | 0 (0.0%) |
| 6 to 18 Years | 298 (53.5%) | 37 (6.6%) |
| 19 to 25 Years | 14 (4.5%) | 29 (9.4%) |
| 25 to 34 Years | 0 (0.0%) | 141 (51.5%) |
| 35 to 44 Years | 0 (0.0%) | 86 (16.8%) |
| 45 to 54 Years | 72 (28.5%) | 117 (46.3%) |
| 55 to 64 Years | 0 (0.0%) | 119 (37.9%) |
| 65 to 74 Years | 169 (80.5%) | 126 (60.0%) |
| 75 Years and over | 91 (100.0%) | 74 (81.3%) |
| Total | 785 (28.9%) | 729 (26.9%) |
Disability Status by Sex by Age in Lakeview Estates
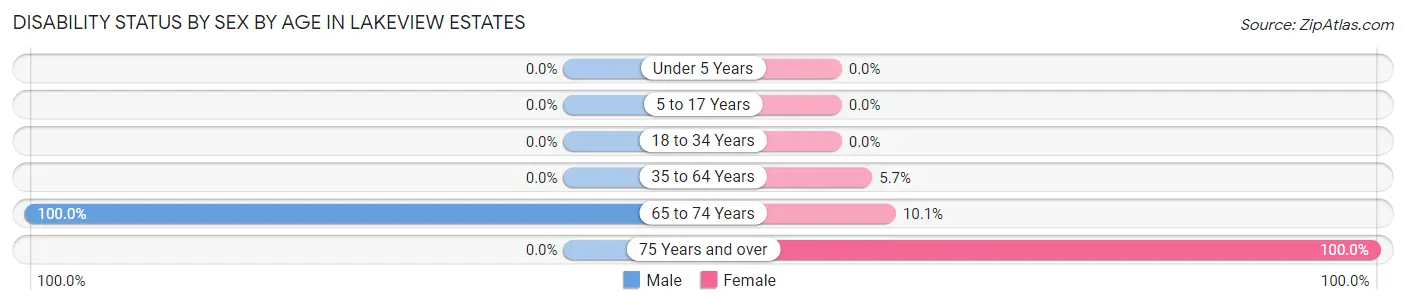
| Age Bracket | Male | Female |
| Under 5 Years | 0 (0.0%) | 0 (0.0%) |
| 5 to 17 Years | 0 (0.0%) | 0 (0.0%) |
| 18 to 34 Years | 0 (0.0%) | 0 (0.0%) |
| 35 to 64 Years | 0 (0.0%) | 34 (5.7%) |
| 65 to 74 Years | 1 (100.0%) | 21 (10.1%) |
| 75 Years and over | 0 (0.0%) | 17 (100.0%) |
Disability Class by Sex by Age in Lakeview Estates
Disability Class: Hearing Difficulty
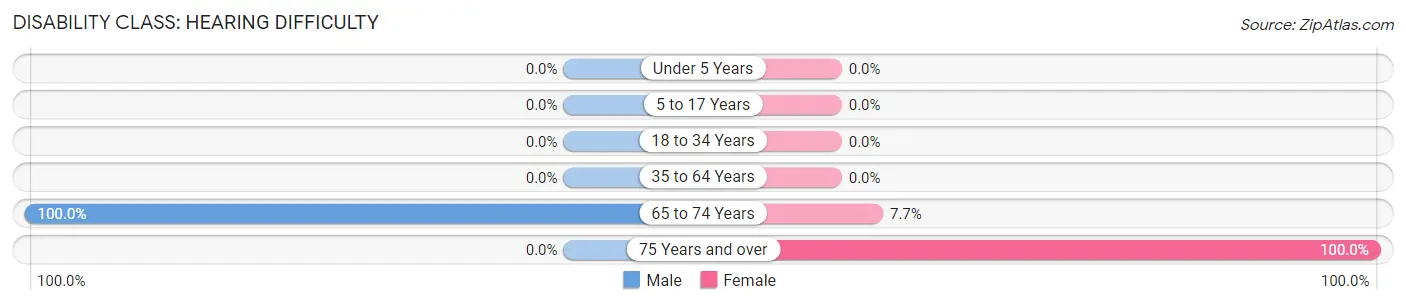
| Age Bracket | Male | Female |
| Under 5 Years | 0 (0.0%) | 0 (0.0%) |
| 5 to 17 Years | 0 (0.0%) | 0 (0.0%) |
| 18 to 34 Years | 0 (0.0%) | 0 (0.0%) |
| 35 to 64 Years | 0 (0.0%) | 0 (0.0%) |
| 65 to 74 Years | 1 (100.0%) | 16 (7.7%) |
| 75 Years and over | 0 (0.0%) | 17 (100.0%) |
Disability Class: Vision Difficulty
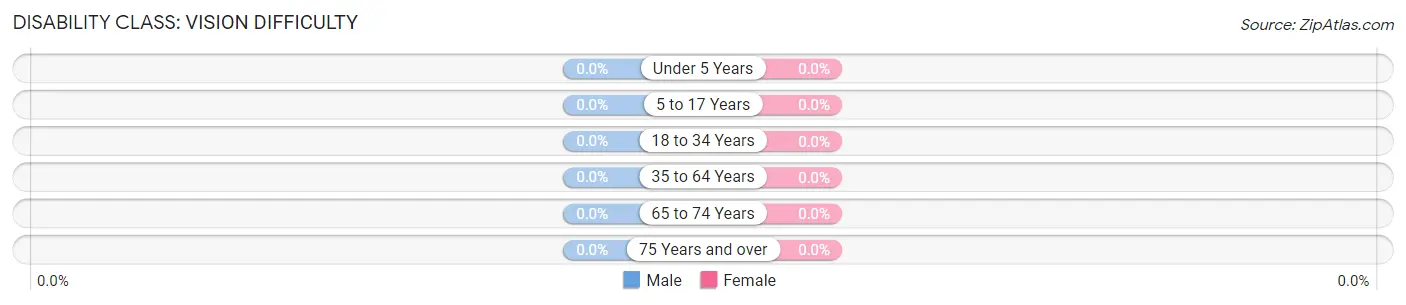
| Age Bracket | Male | Female |
| Under 5 Years | 0 (0.0%) | 0 (0.0%) |
| 5 to 17 Years | 0 (0.0%) | 0 (0.0%) |
| 18 to 34 Years | 0 (0.0%) | 0 (0.0%) |
| 35 to 64 Years | 0 (0.0%) | 0 (0.0%) |
| 65 to 74 Years | 0 (0.0%) | 0 (0.0%) |
| 75 Years and over | 0 (0.0%) | 0 (0.0%) |
Disability Class: Cognitive Difficulty
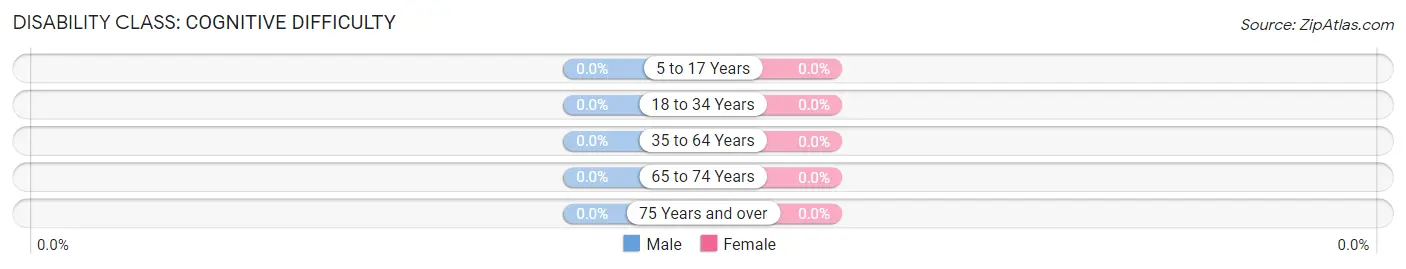
| Age Bracket | Male | Female |
| 5 to 17 Years | 0 (0.0%) | 0 (0.0%) |
| 18 to 34 Years | 0 (0.0%) | 0 (0.0%) |
| 35 to 64 Years | 0 (0.0%) | 0 (0.0%) |
| 65 to 74 Years | 0 (0.0%) | 0 (0.0%) |
| 75 Years and over | 0 (0.0%) | 0 (0.0%) |
Disability Class: Ambulatory Difficulty
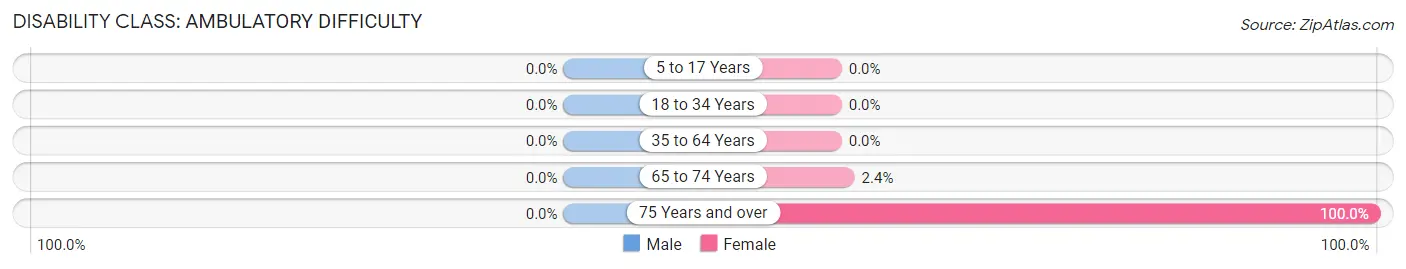
| Age Bracket | Male | Female |
| 5 to 17 Years | 0 (0.0%) | 0 (0.0%) |
| 18 to 34 Years | 0 (0.0%) | 0 (0.0%) |
| 35 to 64 Years | 0 (0.0%) | 0 (0.0%) |
| 65 to 74 Years | 0 (0.0%) | 5 (2.4%) |
| 75 Years and over | 0 (0.0%) | 17 (100.0%) |
Disability Class: Self-Care Difficulty
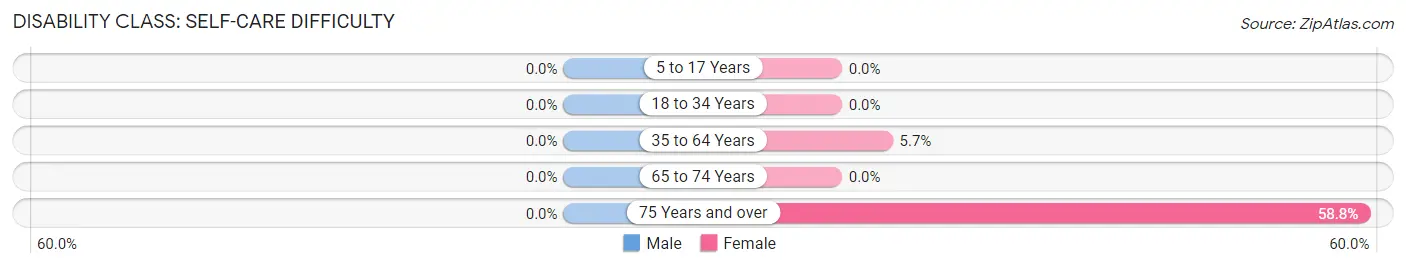
| Age Bracket | Male | Female |
| 5 to 17 Years | 0 (0.0%) | 0 (0.0%) |
| 18 to 34 Years | 0 (0.0%) | 0 (0.0%) |
| 35 to 64 Years | 0 (0.0%) | 34 (5.7%) |
| 65 to 74 Years | 0 (0.0%) | 0 (0.0%) |
| 75 Years and over | 0 (0.0%) | 10 (58.8%) |
Technology Access in Lakeview Estates
Computing Device Access in Lakeview Estates
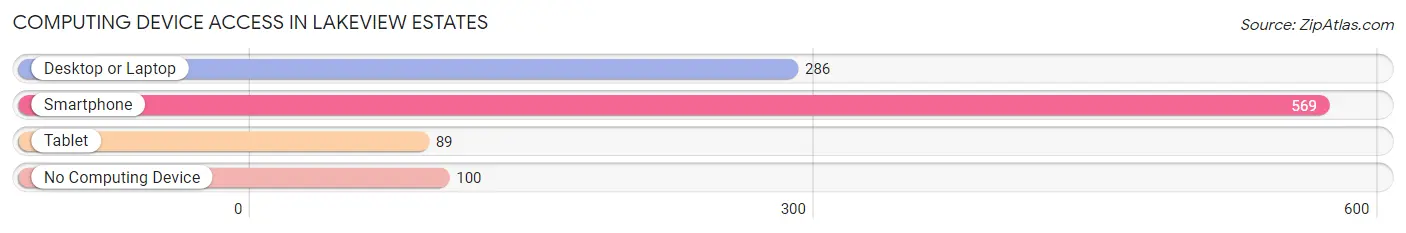
| Device Type | # Households | % Households |
| Desktop or Laptop | 286 | 42.7% |
| Smartphone | 569 | 85.1% |
| Tablet | 89 | 13.3% |
| No Computing Device | 100 | 14.9% |
| Total | 669 | 100.0% |
Internet Access in Lakeview Estates
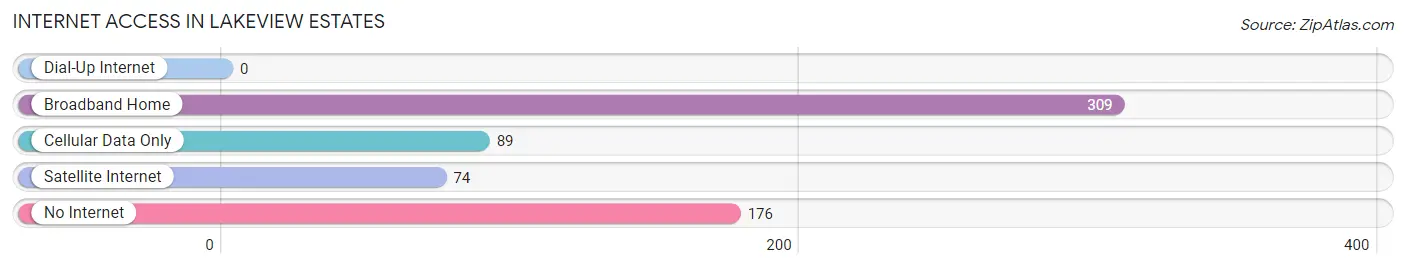
| Internet Type | # Households | % Households |
| Dial-Up Internet | 0 | 0.0% |
| Broadband Home | 309 | 46.2% |
| Cellular Data Only | 89 | 13.3% |
| Satellite Internet | 74 | 11.1% |
| No Internet | 176 | 26.3% |
| Total | 669 | 100.0% |
Lakeview Estates Summary
Introduction
Located in the state of Georgia, Lakeview Estates is a small, unincorporated community in the county of Forsyth. It is situated in the foothills of the Blue Ridge Mountains, and is surrounded by the Chattahoochee National Forest. The community is known for its rural charm and scenic beauty, and is home to a diverse population of people from all walks of life.
History
The area that is now Lakeview Estates was first settled in the early 1800s by a group of settlers from North Carolina. The settlers were attracted to the area due to its abundance of natural resources, including timber, water, and fertile soil. The settlers established a small farming community, and the area quickly grew in population.
In the late 1800s, the area was developed into a resort community, and the first hotel was built in the area. The hotel was a popular destination for tourists, and the area quickly became known for its scenic beauty and recreational opportunities.
In the early 1900s, the area was developed into a residential community, and the first homes were built in the area. The community was named Lakeview Estates, and it quickly became a popular destination for families looking for a peaceful and scenic place to live.
Geography
Lakeview Estates is located in the foothills of the Blue Ridge Mountains in the county of Forsyth. The community is situated on the banks of Lake Lanier, and is surrounded by the Chattahoochee National Forest. The area is known for its scenic beauty, and is home to a variety of wildlife, including deer, turkey, and a variety of birds.
The climate in Lakeview Estates is mild, with temperatures ranging from the mid-50s in the winter to the mid-80s in the summer. The area receives an average of 45 inches of rain per year, and is known for its mild winters and hot summers.
Economy
The economy of Lakeview Estates is largely based on tourism and agriculture. The area is home to a variety of tourist attractions, including Lake Lanier, the Chattahoochee National Forest, and a variety of outdoor recreational activities. The area is also home to a number of farms, which produce a variety of crops, including corn, soybeans, and wheat.
Demographics
As of the 2010 census, the population of Lakeview Estates was 1,845. The population is largely white (90.2%), with a small percentage of African Americans (4.2%), Hispanics (2.7%), and Asians (1.7%). The median household income in the area is $50,000, and the median home value is $150,000.
Conclusion
Lakeview Estates is a small, unincorporated community in the county of Forsyth, Georgia. The area is known for its rural charm and scenic beauty, and is home to a diverse population of people from all walks of life. The economy of the area is largely based on tourism and agriculture, and the area is home to a variety of tourist attractions and outdoor recreational activities. The population of the area is largely white, with a small percentage of African Americans, Hispanics, and Asians.
Common Questions
What is the Total Population of Lakeview Estates?
Total Population of Lakeview Estates is 2,714.
What is the Total Male Population of Lakeview Estates?
Total Male Population of Lakeview Estates is 1,285.
What is the Total Female Population of Lakeview Estates?
Total Female Population of Lakeview Estates is 1,429.
What is the Ratio of Males per 100 Females in Lakeview Estates?
There are 89.92 Males per 100 Females in Lakeview Estates.
What is the Ratio of Females per 100 Males in Lakeview Estates?
There are 111.21 Females per 100 Males in Lakeview Estates.
What is the Median Population Age in Lakeview Estates?
Median Population Age in Lakeview Estates is 35.6 Years.
What is the Average Family Size in Lakeview Estates
Average Family Size in Lakeview Estates is 4.3 People.
What is the Average Household Size in Lakeview Estates
Average Household Size in Lakeview Estates is 4.1 People.
What is Per Capita Income in Lakeview Estates?
Per Capita income in Lakeview Estates is $30,581.
What is the Median Household income in Lakeview Estates?
Median Household Income in Lakeview Estates is $43,219.
What is Income or Wage Gap in Lakeview Estates?
Income or Wage Gap in Lakeview Estates is 70.0%.
Women in Lakeview Estates earn 30.0 cents for every dollar earned by a man.
What is Inequality or Gini Index in Lakeview Estates?
Inequality or Gini Index in Lakeview Estates is 0.71.
How Large is the Labor Force in Lakeview Estates?
There are 1,332 People in the Labor Forcein in Lakeview Estates.
What is the Percentage of People in the Labor Force in Lakeview Estates?
63.1% of People are in the Labor Force in Lakeview Estates.
What is the Unemployment Rate in Lakeview Estates?
Unemployment Rate in Lakeview Estates is 2.9%.