Fruitville, FL
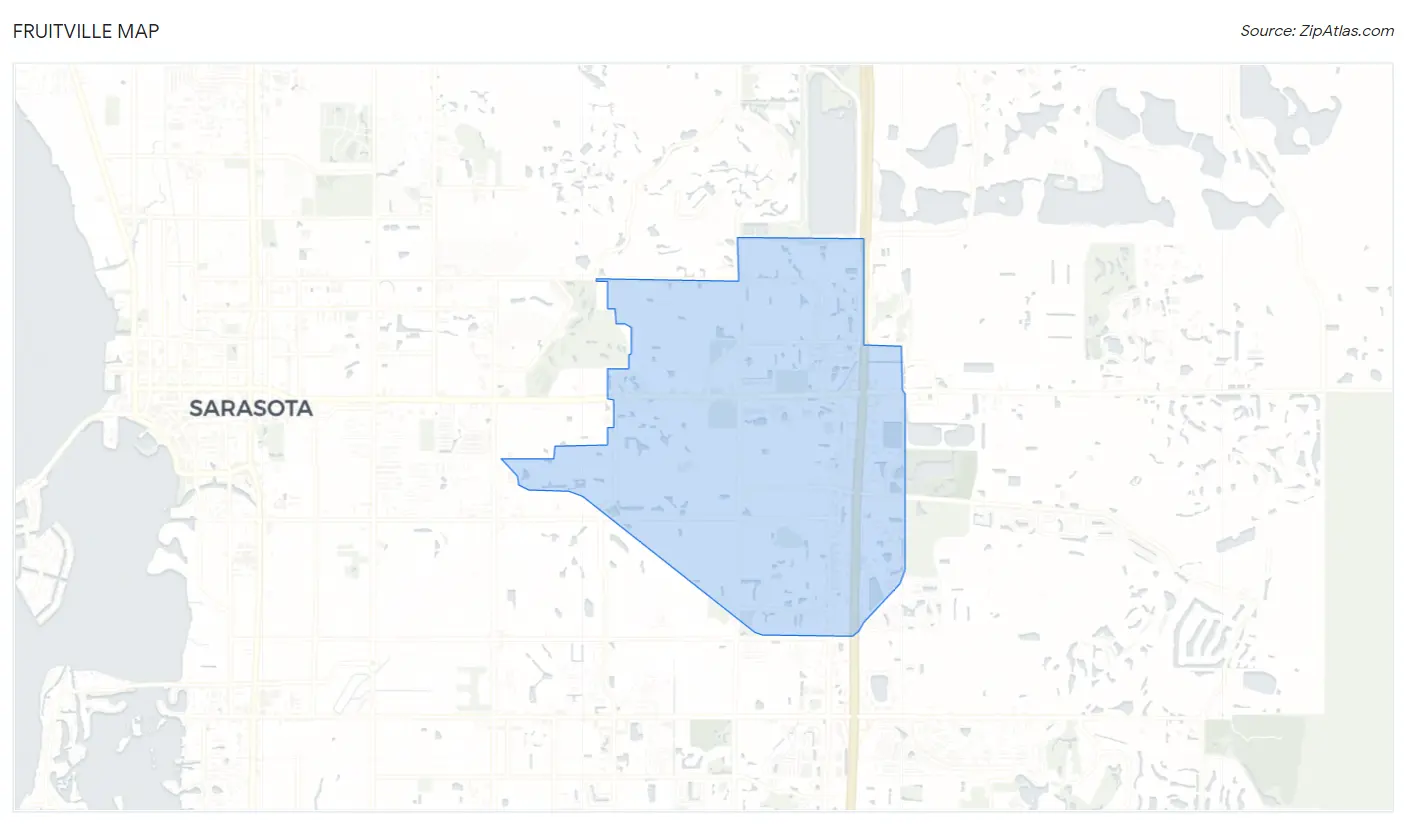
Fruitville Map
Fruitville Overview
15,333
TOTAL POPULATION
7,503
MALE POPULATION
7,830
FEMALE POPULATION
95.82
MALES / 100 FEMALES
104.36
FEMALES / 100 MALES
47.4
MEDIAN AGE
2.8
AVG FAMILY SIZE
2.2
AVG HOUSEHOLD SIZE
$45,809
PER CAPITA INCOME
$102,161
AVG FAMILY INCOME
$84,070
AVG HOUSEHOLD INCOME
32.2%
WAGE / INCOME GAP [ % ]
67.8¢/ $1
WAGE / INCOME GAP [ $ ]
0.42
INEQUALITY / GINI INDEX
8,270
LABOR FORCE [ PEOPLE ]
63.1%
PERCENT IN LABOR FORCE
2.7%
UNEMPLOYMENT RATE
Race in Fruitville
The most populous races in Fruitville are White / Caucasian (13,075 | 85.3%), Hispanic or Latino (1,691 | 11.0%), and Two or more Races (989 | 6.5%).
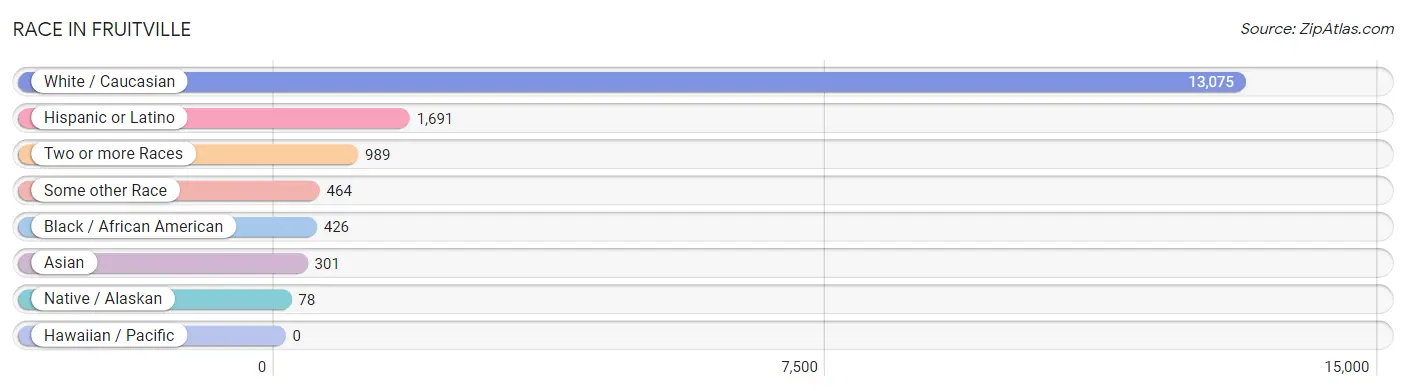
| Race | # Population | % Population |
| Asian | 301 | 2.0% |
| Black / African American | 426 | 2.8% |
| Hawaiian / Pacific | 0 | 0.0% |
| Hispanic or Latino | 1,691 | 11.0% |
| Native / Alaskan | 78 | 0.5% |
| White / Caucasian | 13,075 | 85.3% |
| Two or more Races | 989 | 6.5% |
| Some other Race | 464 | 3.0% |
| Total | 15,333 | 100.0% |
Ancestry in Fruitville
The most populous ancestries reported in Fruitville are German (2,431 | 15.9%), American (2,264 | 14.8%), English (1,539 | 10.0%), Irish (1,439 | 9.4%), and Italian (1,203 | 7.9%), together accounting for 57.9% of all Fruitville residents.

| Ancestry | # Population | % Population |
| African | 43 | 0.3% |
| American | 2,264 | 14.8% |
| Arab | 182 | 1.2% |
| Armenian | 16 | 0.1% |
| Australian | 20 | 0.1% |
| Austrian | 19 | 0.1% |
| Belgian | 13 | 0.1% |
| Blackfeet | 22 | 0.1% |
| Brazilian | 45 | 0.3% |
| British | 58 | 0.4% |
| Burmese | 7 | 0.1% |
| Canadian | 111 | 0.7% |
| Central American | 172 | 1.1% |
| Cherokee | 56 | 0.4% |
| Colombian | 185 | 1.2% |
| Creek | 28 | 0.2% |
| Croatian | 12 | 0.1% |
| Cuban | 138 | 0.9% |
| Czech | 133 | 0.9% |
| Czechoslovakian | 10 | 0.1% |
| Danish | 22 | 0.1% |
| Dominican | 135 | 0.9% |
| Dutch | 126 | 0.8% |
| Eastern European | 11 | 0.1% |
| English | 1,539 | 10.0% |
| European | 136 | 0.9% |
| French | 334 | 2.2% |
| French Canadian | 47 | 0.3% |
| German | 2,431 | 15.9% |
| Greek | 70 | 0.5% |
| Guatemalan | 101 | 0.7% |
| Guyanese | 16 | 0.1% |
| Hungarian | 153 | 1.0% |
| Icelander | 4 | 0.0% |
| Indian (Asian) | 41 | 0.3% |
| Irish | 1,439 | 9.4% |
| Iroquois | 52 | 0.3% |
| Israeli | 64 | 0.4% |
| Italian | 1,203 | 7.9% |
| Jamaican | 65 | 0.4% |
| Korean | 27 | 0.2% |
| Lebanese | 10 | 0.1% |
| Lithuanian | 29 | 0.2% |
| Mexican | 483 | 3.2% |
| Mexican American Indian | 12 | 0.1% |
| Moroccan | 26 | 0.2% |
| Nicaraguan | 49 | 0.3% |
| Northern European | 40 | 0.3% |
| Norwegian | 115 | 0.7% |
| Pakistani | 82 | 0.5% |
| Palestinian | 11 | 0.1% |
| Peruvian | 75 | 0.5% |
| Polish | 562 | 3.7% |
| Portuguese | 10 | 0.1% |
| Puerto Rican | 274 | 1.8% |
| Russian | 215 | 1.4% |
| Salvadoran | 22 | 0.1% |
| Scandinavian | 20 | 0.1% |
| Scotch-Irish | 140 | 0.9% |
| Scottish | 182 | 1.2% |
| Serbian | 7 | 0.1% |
| Slovak | 45 | 0.3% |
| South American | 307 | 2.0% |
| Spaniard | 90 | 0.6% |
| Spanish | 49 | 0.3% |
| Sri Lankan | 187 | 1.2% |
| Subsaharan African | 43 | 0.3% |
| Swedish | 157 | 1.0% |
| Swiss | 158 | 1.0% |
| Syrian | 14 | 0.1% |
| Thai | 36 | 0.2% |
| Trinidadian and Tobagonian | 35 | 0.2% |
| Ukrainian | 69 | 0.4% |
| Venezuelan | 47 | 0.3% |
| Welsh | 46 | 0.3% | View All 75 Rows |
Immigrants in Fruitville
The most numerous immigrant groups reported in Fruitville came from Latin America (897 | 5.9%), Europe (432 | 2.8%), Caribbean (308 | 2.0%), South America (298 | 1.9%), and Central America (291 | 1.9%), together accounting for 14.5% of all Fruitville residents.
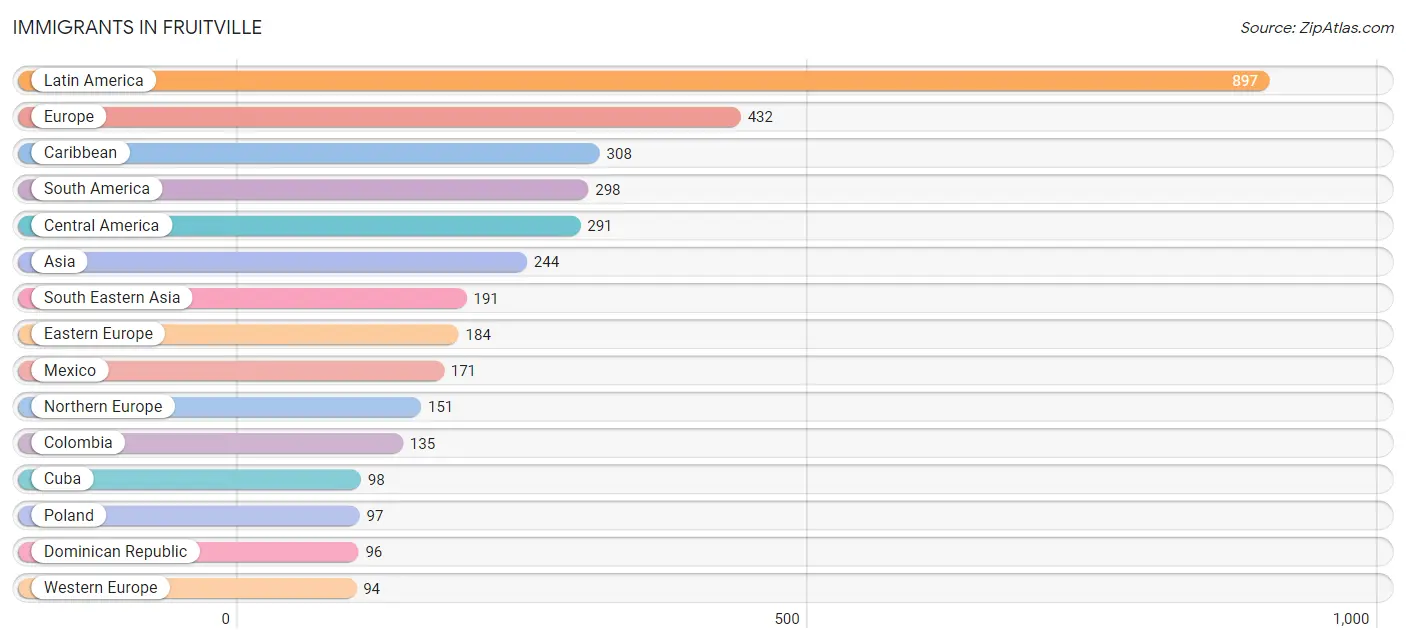
| Immigration Origin | # Population | % Population |
| Africa | 69 | 0.4% |
| Asia | 244 | 1.6% |
| Austria | 6 | 0.0% |
| Belarus | 27 | 0.2% |
| Brazil | 56 | 0.4% |
| Canada | 62 | 0.4% |
| Caribbean | 308 | 2.0% |
| Central America | 291 | 1.9% |
| China | 21 | 0.1% |
| Colombia | 135 | 0.9% |
| Costa Rica | 7 | 0.1% |
| Cuba | 98 | 0.6% |
| Denmark | 9 | 0.1% |
| Dominican Republic | 96 | 0.6% |
| Eastern Asia | 21 | 0.1% |
| Eastern Europe | 184 | 1.2% |
| El Salvador | 13 | 0.1% |
| England | 68 | 0.4% |
| Europe | 432 | 2.8% |
| France | 10 | 0.1% |
| Germany | 70 | 0.5% |
| Guatemala | 51 | 0.3% |
| Guyana | 27 | 0.2% |
| Haiti | 16 | 0.1% |
| Hungary | 9 | 0.1% |
| India | 24 | 0.2% |
| Indonesia | 26 | 0.2% |
| Jamaica | 42 | 0.3% |
| Latin America | 897 | 5.9% |
| Lebanon | 8 | 0.1% |
| Mexico | 171 | 1.1% |
| Morocco | 69 | 0.4% |
| Nicaragua | 49 | 0.3% |
| Northern Africa | 69 | 0.4% |
| Northern Europe | 151 | 1.0% |
| Peru | 37 | 0.2% |
| Philippines | 27 | 0.2% |
| Poland | 97 | 0.6% |
| Russia | 35 | 0.2% |
| South America | 298 | 1.9% |
| South Central Asia | 24 | 0.2% |
| South Eastern Asia | 191 | 1.3% |
| Sweden | 17 | 0.1% |
| Switzerland | 8 | 0.1% |
| Thailand | 81 | 0.5% |
| Trinidad and Tobago | 56 | 0.4% |
| Ukraine | 16 | 0.1% |
| Venezuela | 43 | 0.3% |
| Vietnam | 57 | 0.4% |
| Western Asia | 8 | 0.1% |
| Western Europe | 94 | 0.6% | View All 51 Rows |
Sex and Age in Fruitville
Sex and Age in Fruitville
The most populous age groups in Fruitville are 60 to 64 Years (676 | 9.0%) for men and 55 to 59 Years (676 | 8.6%) for women.
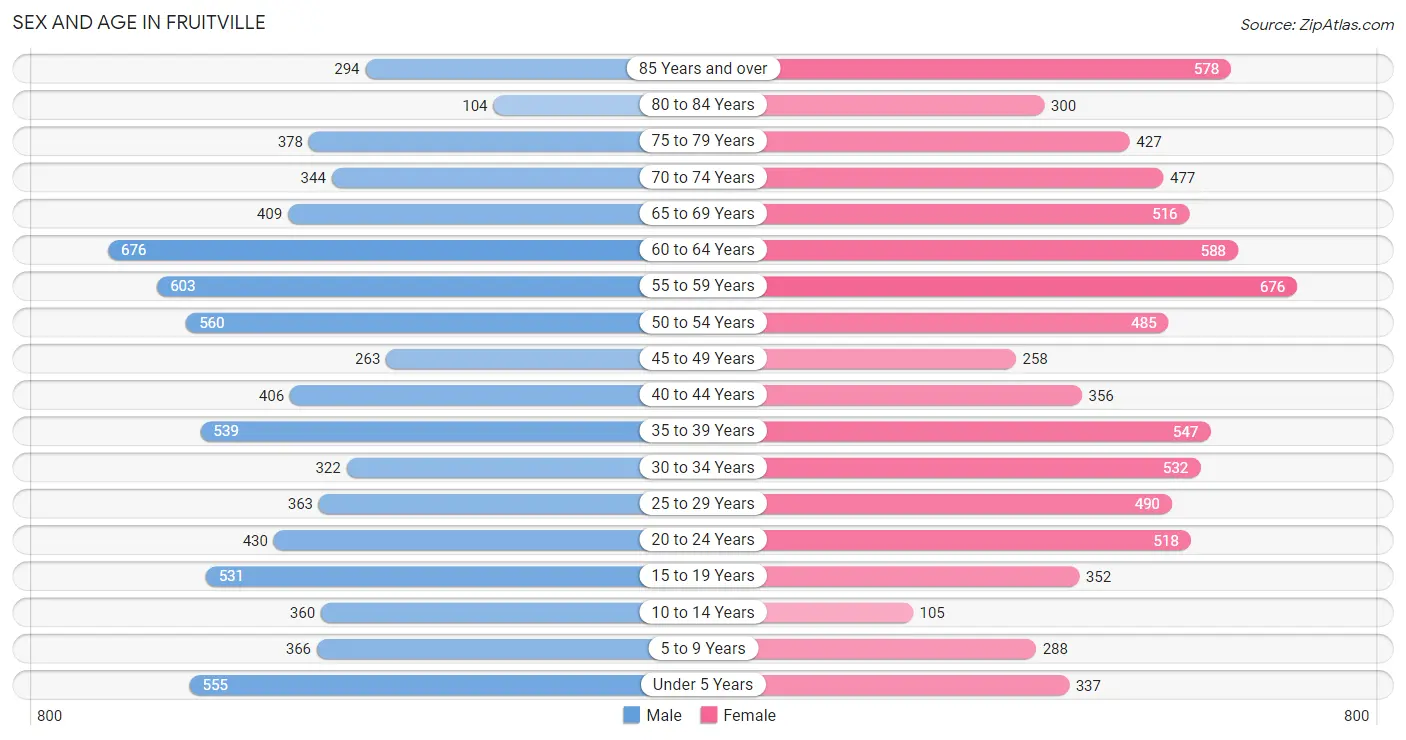
| Age Bracket | Male | Female |
| Under 5 Years | 555 (7.4%) | 337 (4.3%) |
| 5 to 9 Years | 366 (4.9%) | 288 (3.7%) |
| 10 to 14 Years | 360 (4.8%) | 105 (1.3%) |
| 15 to 19 Years | 531 (7.1%) | 352 (4.5%) |
| 20 to 24 Years | 430 (5.7%) | 518 (6.6%) |
| 25 to 29 Years | 363 (4.8%) | 490 (6.3%) |
| 30 to 34 Years | 322 (4.3%) | 532 (6.8%) |
| 35 to 39 Years | 539 (7.2%) | 547 (7.0%) |
| 40 to 44 Years | 406 (5.4%) | 356 (4.5%) |
| 45 to 49 Years | 263 (3.5%) | 258 (3.3%) |
| 50 to 54 Years | 560 (7.5%) | 485 (6.2%) |
| 55 to 59 Years | 603 (8.0%) | 676 (8.6%) |
| 60 to 64 Years | 676 (9.0%) | 588 (7.5%) |
| 65 to 69 Years | 409 (5.4%) | 516 (6.6%) |
| 70 to 74 Years | 344 (4.6%) | 477 (6.1%) |
| 75 to 79 Years | 378 (5.0%) | 427 (5.4%) |
| 80 to 84 Years | 104 (1.4%) | 300 (3.8%) |
| 85 Years and over | 294 (3.9%) | 578 (7.4%) |
| Total | 7,503 (100.0%) | 7,830 (100.0%) |
Families and Households in Fruitville
Median Family Size in Fruitville
The median family size in Fruitville is 2.81 persons per family, with single male/father families (294 | 7.5%) accounting for the largest median family size of 2.93 persons per family. On the other hand, single female/mother families (478 | 12.1%) represent the smallest median family size with 2.71 persons per family.
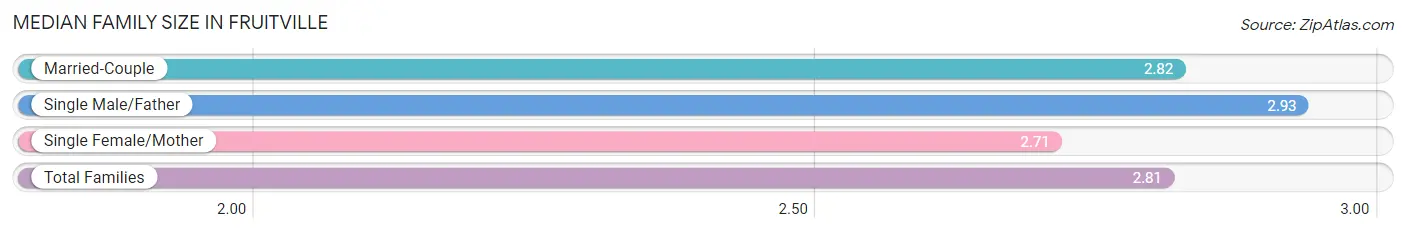
| Family Type | # Families | Family Size |
| Married-Couple | 3,164 (80.4%) | 2.82 |
| Single Male/Father | 294 (7.5%) | 2.93 |
| Single Female/Mother | 478 (12.1%) | 2.71 |
| Total Families | 3,936 (100.0%) | 2.81 |
Median Household Size in Fruitville
The median household size in Fruitville is 2.23 persons per household, with single male/father households (294 | 4.3%) accounting for the largest median household size of 3.38 persons per household. non-family households (2,821 | 41.7%) represent the smallest median household size with 1.24 persons per household.
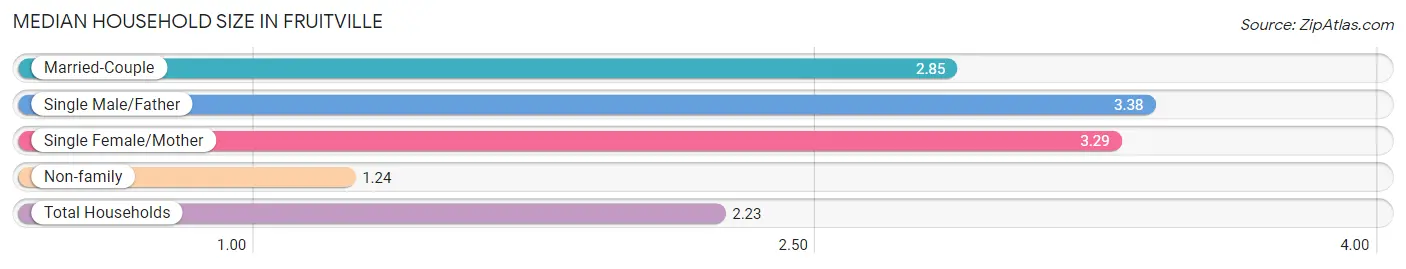
| Household Type | # Households | Household Size |
| Married-Couple | 3,164 (46.8%) | 2.85 |
| Single Male/Father | 294 (4.3%) | 3.38 |
| Single Female/Mother | 478 (7.1%) | 3.29 |
| Non-family | 2,821 (41.7%) | 1.24 |
| Total Households | 6,757 (100.0%) | 2.23 |
Household Size by Marriage Status in Fruitville
Out of a total of 6,757 households in Fruitville, 3,936 (58.3%) are family households, while 2,821 (41.7%) are nonfamily households. The most numerous type of family households are 2-person households, comprising 2,065, and the most common type of nonfamily households are 1-person households, comprising 2,221.
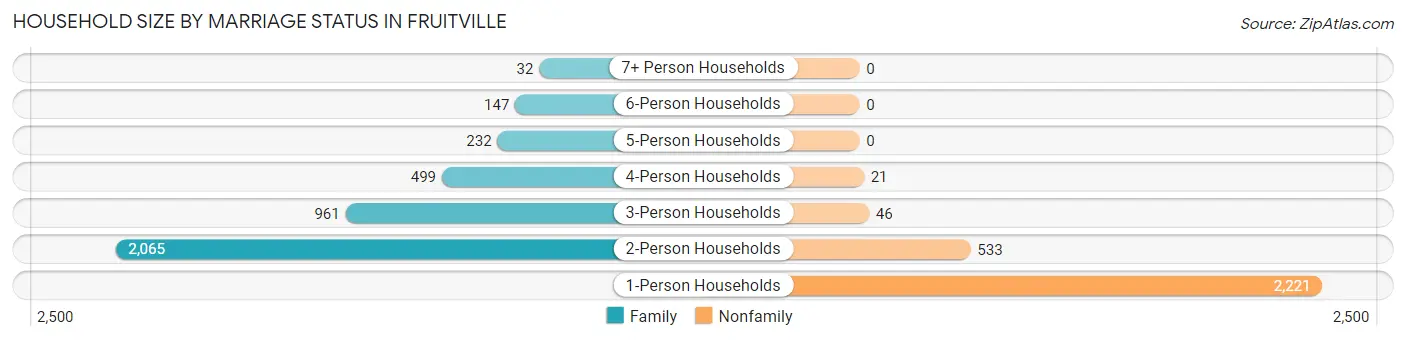
| Household Size | Family Households | Nonfamily Households |
| 1-Person Households | - | 2,221 (32.9%) |
| 2-Person Households | 2,065 (30.6%) | 533 (7.9%) |
| 3-Person Households | 961 (14.2%) | 46 (0.7%) |
| 4-Person Households | 499 (7.4%) | 21 (0.3%) |
| 5-Person Households | 232 (3.4%) | 0 (0.0%) |
| 6-Person Households | 147 (2.2%) | 0 (0.0%) |
| 7+ Person Households | 32 (0.5%) | 0 (0.0%) |
| Total | 3,936 (58.3%) | 2,821 (41.7%) |
Female Fertility in Fruitville
Fertility by Age in Fruitville
Average fertility rate in Fruitville is 52.0 births per 1,000 women. Women in the age bracket of 20 to 34 years have the highest fertility rate with 78.0 births per 1,000 women. Women in the age bracket of 20 to 34 years acount for 72.3% of all women with births.
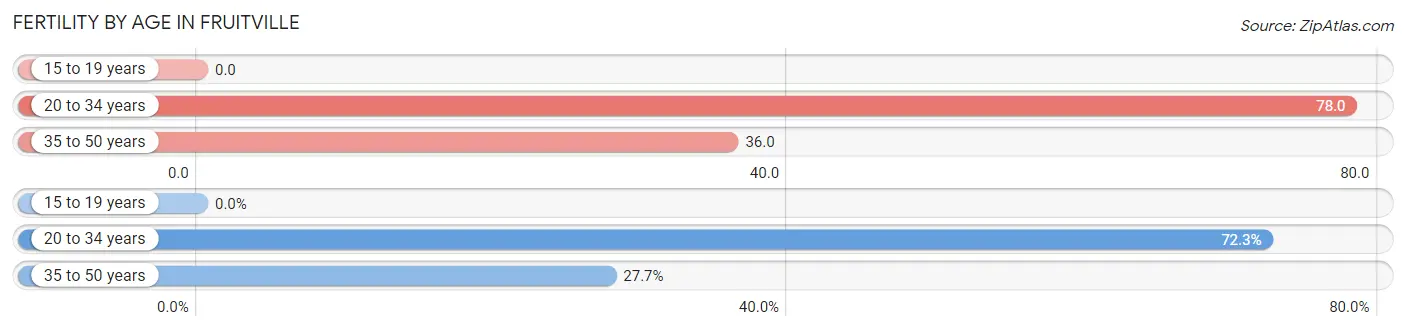
| Age Bracket | Women with Births | Births / 1,000 Women |
| 15 to 19 years | 0 (0.0%) | 0.0 |
| 20 to 34 years | 120 (72.3%) | 78.0 |
| 35 to 50 years | 46 (27.7%) | 36.0 |
| Total | 166 (100.0%) | 52.0 |
Fertility by Age by Marriage Status in Fruitville
88.0% of women with births (166) in Fruitville are married. The highest percentage of unmarried women with births falls into 35 to 50 years age bracket with 43.5% of them unmarried at the time of birth, while the lowest percentage of unmarried women with births belong to 20 to 34 years age bracket with 0.0% of them unmarried.
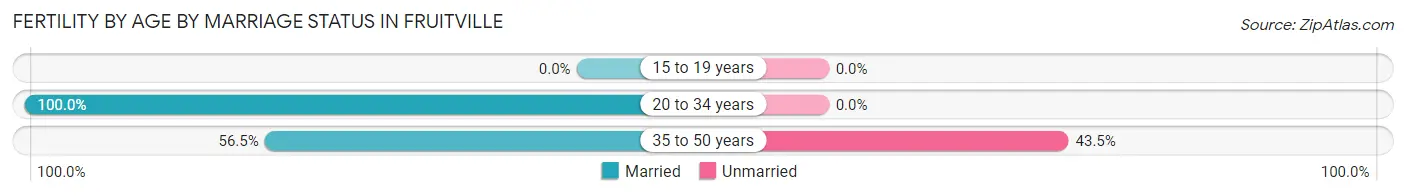
| Age Bracket | Married | Unmarried |
| 15 to 19 years | 0 (0.0%) | 0 (0.0%) |
| 20 to 34 years | 120 (100.0%) | 0 (0.0%) |
| 35 to 50 years | 26 (56.5%) | 20 (43.5%) |
| Total | 146 (87.9%) | 20 (12.0%) |
Fertility by Education in Fruitville
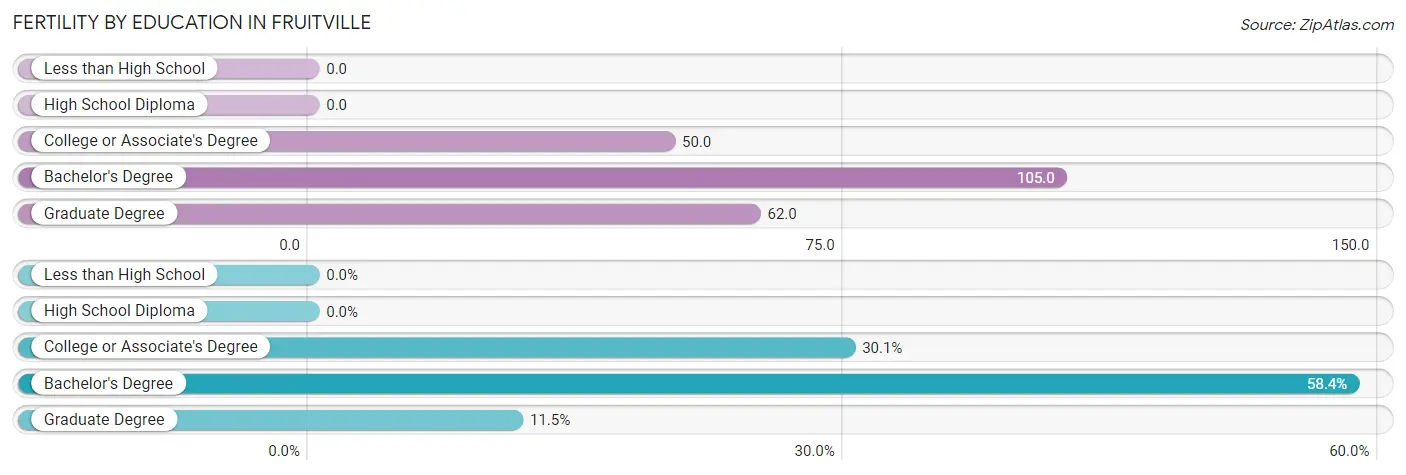
| Educational Attainment | Women with Births | Births / 1,000 Women |
| Less than High School | 0 (0.0%) | 0.0 |
| High School Diploma | 0 (0.0%) | 0.0 |
| College or Associate's Degree | 50 (30.1%) | 50.0 |
| Bachelor's Degree | 97 (58.4%) | 105.0 |
| Graduate Degree | 19 (11.5%) | 62.0 |
| Total | 166 (100.0%) | 52.0 |
Fertility by Education by Marriage Status in Fruitville
12.0% of women with births in Fruitville are unmarried. Women with the educational attainment of college or associate's degree are most likely to be married with 100.0% of them married at childbirth, while women with the educational attainment of bachelor's degree are least likely to be married with 20.6% of them unmarried at childbirth.
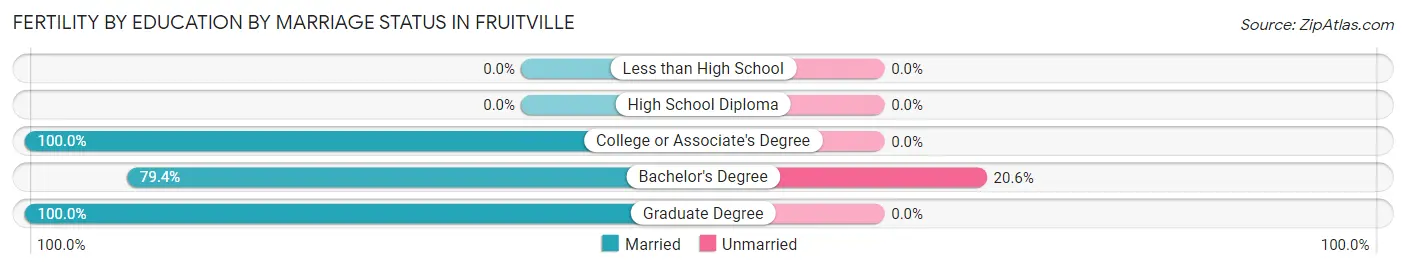
| Educational Attainment | Married | Unmarried |
| Less than High School | 0 (0.0%) | 0 (0.0%) |
| High School Diploma | 0 (0.0%) | 0 (0.0%) |
| College or Associate's Degree | 50 (100.0%) | 0 (0.0%) |
| Bachelor's Degree | 77 (79.4%) | 20 (20.6%) |
| Graduate Degree | 19 (100.0%) | 0 (0.0%) |
| Total | 146 (87.9%) | 20 (12.0%) |
Income in Fruitville
Income Overview in Fruitville
Per Capita Income in Fruitville is $45,809, while median incomes of families and households are $102,161 and $84,070 respectively.
| Characteristic | Number | Measure |
| Per Capita Income | 15,333 | $45,809 |
| Median Family Income | 3,936 | $102,161 |
| Mean Family Income | 3,936 | $127,007 |
| Median Household Income | 6,757 | $84,070 |
| Mean Household Income | 6,757 | $102,877 |
| Income Deficit | 3,936 | $0 |
| Wage / Income Gap (%) | 15,333 | 32.20% |
| Wage / Income Gap ($) | 15,333 | 67.80¢ per $1 |
| Gini / Inequality Index | 15,333 | 0.42 |
Earnings by Sex in Fruitville
Average Earnings in Fruitville are $43,808, $53,175 for men and $36,050 for women, a difference of 32.2%.
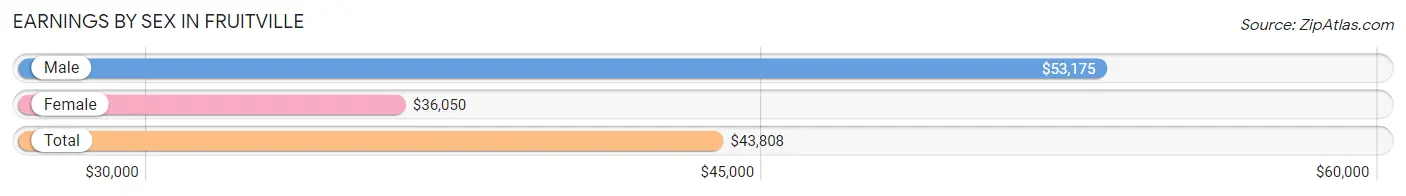
| Sex | Number | Average Earnings |
| Male | 4,378 (50.5%) | $53,175 |
| Female | 4,295 (49.5%) | $36,050 |
| Total | 8,673 (100.0%) | $43,808 |
Earnings by Sex by Income Bracket in Fruitville
The most common earnings brackets in Fruitville are $100,000+ for men (804 | 18.4%) and $55,000 to $64,999 for women (421 | 9.8%).
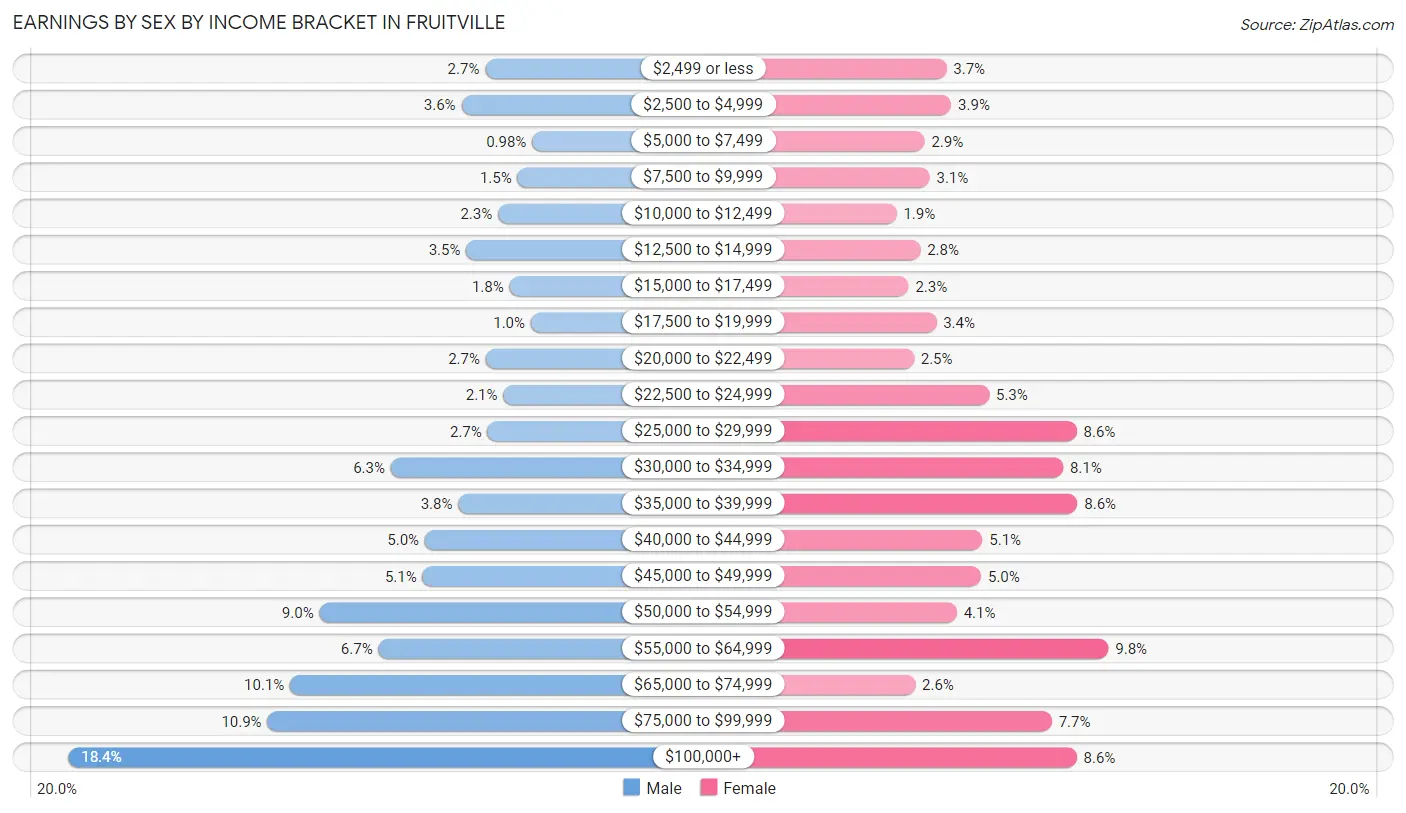
| Income | Male | Female |
| $2,499 or less | 120 (2.7%) | 160 (3.7%) |
| $2,500 to $4,999 | 159 (3.6%) | 168 (3.9%) |
| $5,000 to $7,499 | 43 (1.0%) | 125 (2.9%) |
| $7,500 to $9,999 | 67 (1.5%) | 133 (3.1%) |
| $10,000 to $12,499 | 99 (2.3%) | 80 (1.9%) |
| $12,500 to $14,999 | 151 (3.5%) | 118 (2.8%) |
| $15,000 to $17,499 | 80 (1.8%) | 99 (2.3%) |
| $17,500 to $19,999 | 45 (1.0%) | 144 (3.4%) |
| $20,000 to $22,499 | 119 (2.7%) | 108 (2.5%) |
| $22,500 to $24,999 | 90 (2.1%) | 229 (5.3%) |
| $25,000 to $29,999 | 116 (2.6%) | 370 (8.6%) |
| $30,000 to $34,999 | 275 (6.3%) | 348 (8.1%) |
| $35,000 to $39,999 | 164 (3.7%) | 371 (8.6%) |
| $40,000 to $44,999 | 219 (5.0%) | 218 (5.1%) |
| $45,000 to $49,999 | 223 (5.1%) | 216 (5.0%) |
| $50,000 to $54,999 | 392 (8.9%) | 177 (4.1%) |
| $55,000 to $64,999 | 295 (6.7%) | 421 (9.8%) |
| $65,000 to $74,999 | 440 (10.1%) | 110 (2.6%) |
| $75,000 to $99,999 | 477 (10.9%) | 330 (7.7%) |
| $100,000+ | 804 (18.4%) | 370 (8.6%) |
| Total | 4,378 (100.0%) | 4,295 (100.0%) |
Earnings by Sex by Educational Attainment in Fruitville
Average earnings in Fruitville are $58,681 for men and $39,801 for women, a difference of 32.2%. Men with an educational attainment of graduate degree enjoy the highest average annual earnings of $97,587, while those with high school diploma education earn the least with $47,731. Women with an educational attainment of graduate degree earn the most with the average annual earnings of $58,409, while those with less than high school education have the smallest earnings of $22,926.
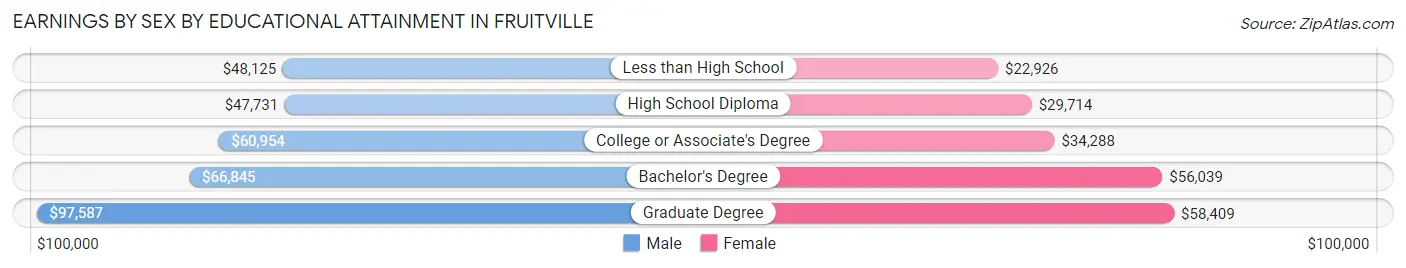
| Educational Attainment | Male Income | Female Income |
| Less than High School | $48,125 | $22,926 |
| High School Diploma | $47,731 | $29,714 |
| College or Associate's Degree | $60,954 | $34,288 |
| Bachelor's Degree | $66,845 | $56,039 |
| Graduate Degree | $97,587 | $58,409 |
| Total | $58,681 | $39,801 |
Family Income in Fruitville
Family Income Brackets in Fruitville
According to the Fruitville family income data, there are 1,015 families falling into the $100,000 to $149,999 income range, which is the most common income bracket and makes up 25.8% of all families. Conversely, the $10,000 to $14,999 income bracket is the least frequent group with only 16 families (0.4%) belonging to this category.
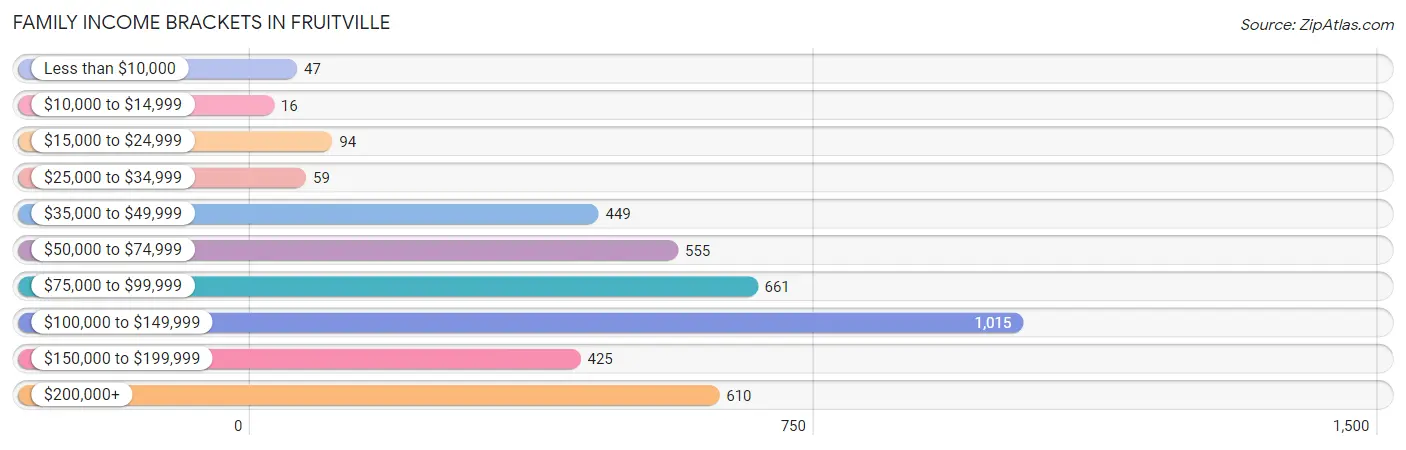
| Income Bracket | # Families | % Families |
| Less than $10,000 | 47 | 1.2% |
| $10,000 to $14,999 | 16 | 0.4% |
| $15,000 to $24,999 | 94 | 2.4% |
| $25,000 to $34,999 | 59 | 1.5% |
| $35,000 to $49,999 | 449 | 11.4% |
| $50,000 to $74,999 | 555 | 14.1% |
| $75,000 to $99,999 | 661 | 16.8% |
| $100,000 to $149,999 | 1,015 | 25.8% |
| $150,000 to $199,999 | 425 | 10.8% |
| $200,000+ | 610 | 15.5% |
Family Income by Famaliy Size in Fruitville
5-person families (154 | 3.9%) account for the highest median family income in Fruitville with $127,674 per family, while 2-person families (2,298 | 58.4%) have the highest median income of $47,306 per family member.
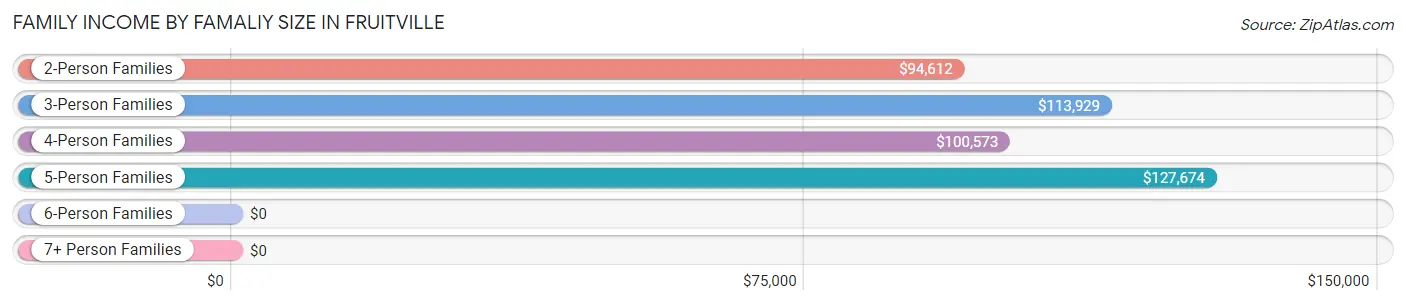
| Income Bracket | # Families | Median Income |
| 2-Person Families | 2,298 (58.4%) | $94,612 |
| 3-Person Families | 880 (22.4%) | $113,929 |
| 4-Person Families | 435 (11.1%) | $100,573 |
| 5-Person Families | 154 (3.9%) | $127,674 |
| 6-Person Families | 137 (3.5%) | $0 |
| 7+ Person Families | 32 (0.8%) | $0 |
| Total | 3,936 (100.0%) | $102,161 |
Family Income by Number of Earners in Fruitville
The median family income in Fruitville is $102,161, with families comprising 2 earners (1,656) having the highest median family income of $133,095, while families with no earners (642) have the lowest median family income of $51,705, accounting for 42.1% and 16.3% of families, respectively.
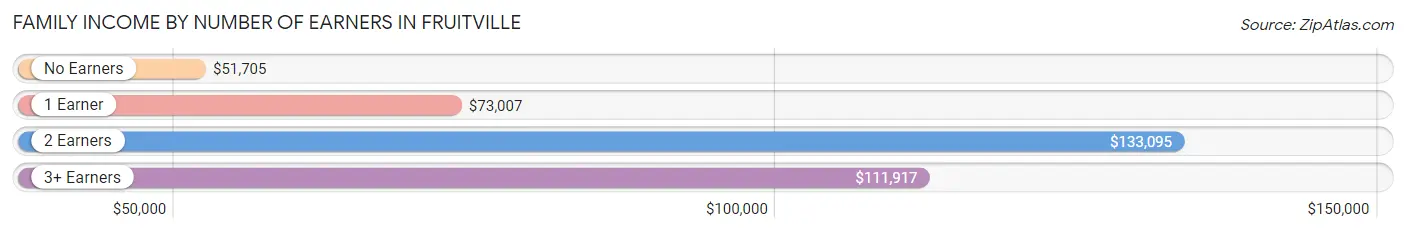
| Number of Earners | # Families | Median Income |
| No Earners | 642 (16.3%) | $51,705 |
| 1 Earner | 1,168 (29.7%) | $73,007 |
| 2 Earners | 1,656 (42.1%) | $133,095 |
| 3+ Earners | 470 (11.9%) | $111,917 |
| Total | 3,936 (100.0%) | $102,161 |
Household Income in Fruitville
Household Income Brackets in Fruitville
With 1,453 households falling in the category, the $100,000 to $149,999 income range is the most frequent in Fruitville, accounting for 21.5% of all households. In contrast, only 162 households (2.4%) fall into the $10,000 to $14,999 income bracket, making it the least populous group.
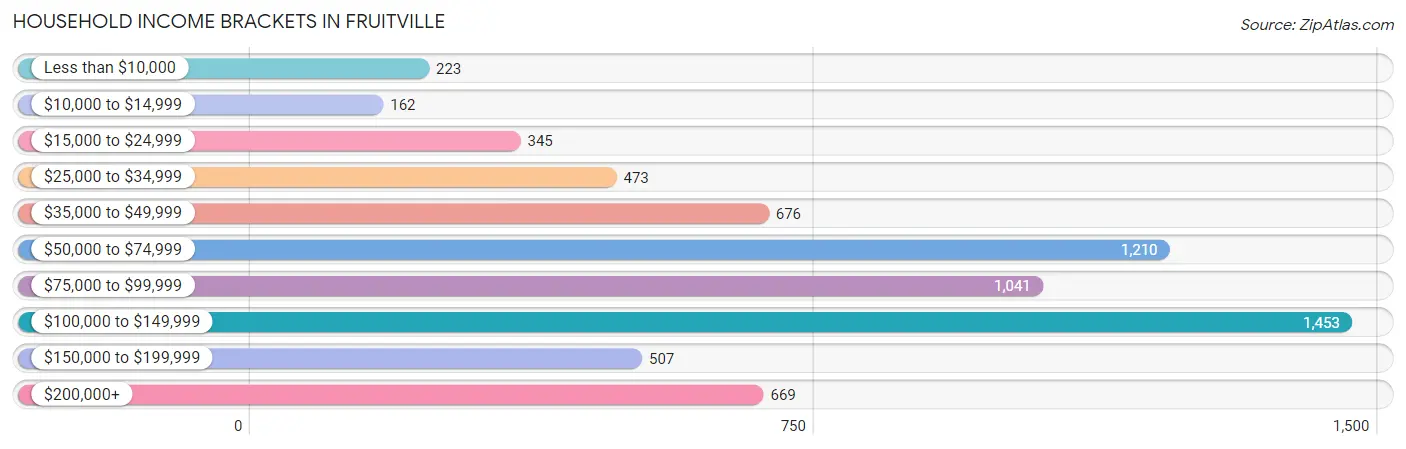
| Income Bracket | # Households | % Households |
| Less than $10,000 | 223 | 3.3% |
| $10,000 to $14,999 | 162 | 2.4% |
| $15,000 to $24,999 | 345 | 5.1% |
| $25,000 to $34,999 | 473 | 7.0% |
| $35,000 to $49,999 | 676 | 10.0% |
| $50,000 to $74,999 | 1,210 | 17.9% |
| $75,000 to $99,999 | 1,041 | 15.4% |
| $100,000 to $149,999 | 1,453 | 21.5% |
| $150,000 to $199,999 | 507 | 7.5% |
| $200,000+ | 669 | 9.9% |
Household Income by Householder Age in Fruitville
The median household income in Fruitville is $84,070, with the highest median household income of $107,692 found in the 25 to 44 years age bracket for the primary householder. A total of 1,844 households (27.3%) fall into this category. Meanwhile, the 15 to 24 years age bracket for the primary householder has the lowest median household income of $56,324, with 324 households (4.8%) in this group.
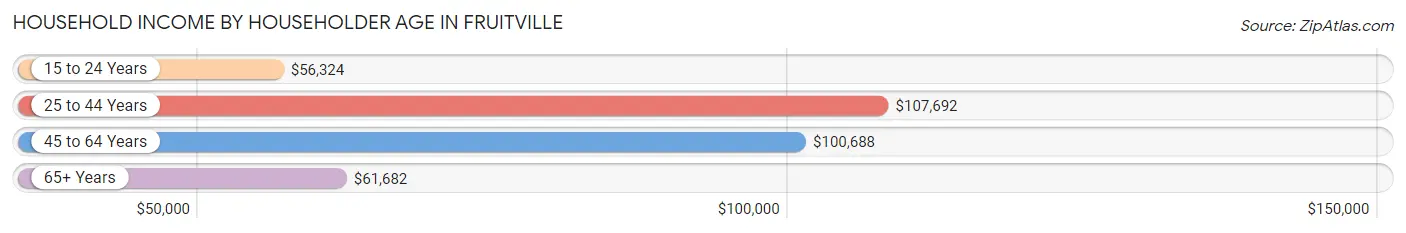
| Income Bracket | # Households | Median Income |
| 15 to 24 Years | 324 (4.8%) | $56,324 |
| 25 to 44 Years | 1,844 (27.3%) | $107,692 |
| 45 to 64 Years | 2,287 (33.9%) | $100,688 |
| 65+ Years | 2,302 (34.1%) | $61,682 |
| Total | 6,757 (100.0%) | $84,070 |
Poverty in Fruitville
Income Below Poverty by Sex and Age in Fruitville
With 5.3% poverty level for males and 8.5% for females among the residents of Fruitville, 15 year old males and 16 and 17 year old females are the most vulnerable to poverty, with 40 males (28.0%) and 48 females (30.8%) in their respective age groups living below the poverty level.
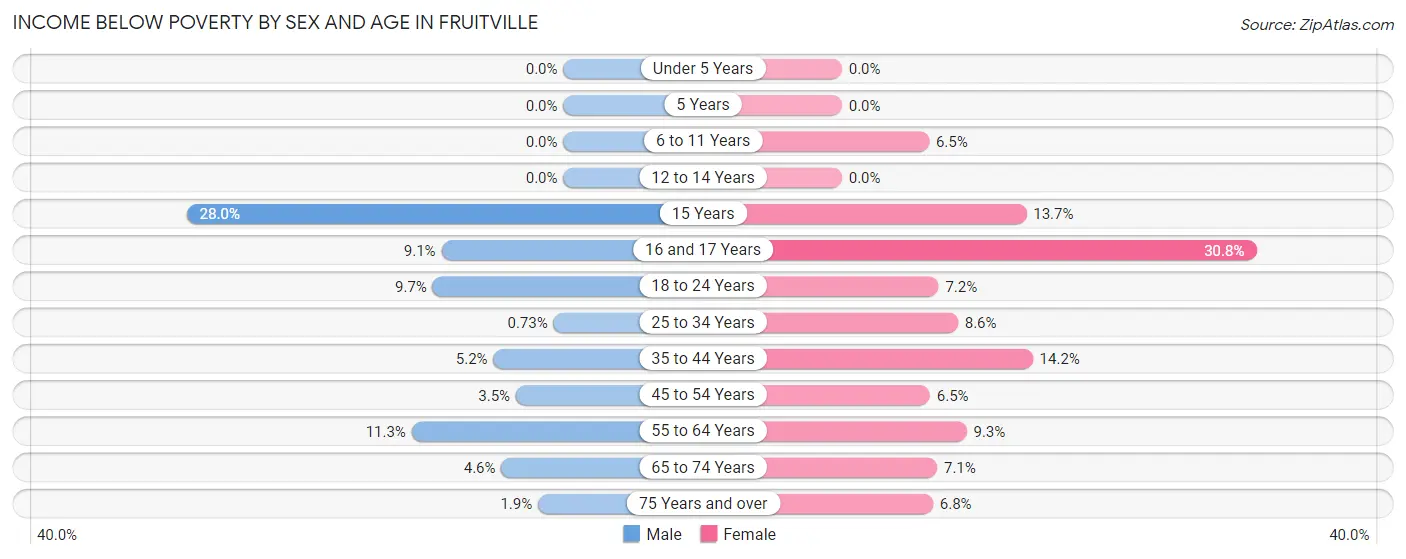
| Age Bracket | Male | Female |
| Under 5 Years | 0 (0.0%) | 0 (0.0%) |
| 5 Years | 0 (0.0%) | 0 (0.0%) |
| 6 to 11 Years | 0 (0.0%) | 11 (6.5%) |
| 12 to 14 Years | 0 (0.0%) | 0 (0.0%) |
| 15 Years | 40 (28.0%) | 10 (13.7%) |
| 16 and 17 Years | 19 (9.0%) | 48 (30.8%) |
| 18 to 24 Years | 59 (9.7%) | 46 (7.2%) |
| 25 to 34 Years | 5 (0.7%) | 88 (8.6%) |
| 35 to 44 Years | 49 (5.2%) | 128 (14.2%) |
| 45 to 54 Years | 29 (3.5%) | 48 (6.5%) |
| 55 to 64 Years | 144 (11.3%) | 117 (9.3%) |
| 65 to 74 Years | 32 (4.6%) | 69 (7.1%) |
| 75 Years and over | 14 (1.9%) | 81 (6.8%) |
| Total | 391 (5.3%) | 646 (8.5%) |
Income Above Poverty by Sex and Age in Fruitville
According to the poverty statistics in Fruitville, males aged under 5 years and females aged under 5 years are the age groups that are most secure financially, with 100.0% of males and 100.0% of females in these age groups living above the poverty line.
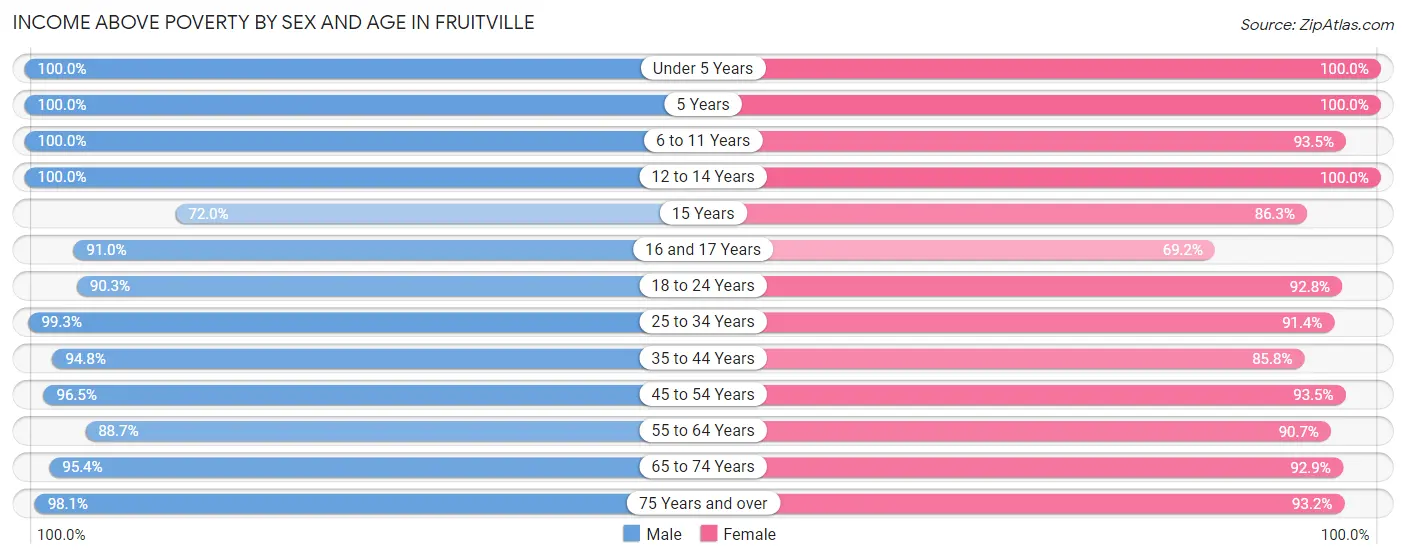
| Age Bracket | Male | Female |
| Under 5 Years | 538 (100.0%) | 321 (100.0%) |
| 5 Years | 90 (100.0%) | 77 (100.0%) |
| 6 to 11 Years | 400 (100.0%) | 159 (93.5%) |
| 12 to 14 Years | 226 (100.0%) | 93 (100.0%) |
| 15 Years | 103 (72.0%) | 63 (86.3%) |
| 16 and 17 Years | 191 (90.9%) | 108 (69.2%) |
| 18 to 24 Years | 549 (90.3%) | 595 (92.8%) |
| 25 to 34 Years | 680 (99.3%) | 934 (91.4%) |
| 35 to 44 Years | 896 (94.8%) | 775 (85.8%) |
| 45 to 54 Years | 794 (96.5%) | 686 (93.5%) |
| 55 to 64 Years | 1,135 (88.7%) | 1,147 (90.7%) |
| 65 to 74 Years | 663 (95.4%) | 907 (92.9%) |
| 75 Years and over | 729 (98.1%) | 1,117 (93.2%) |
| Total | 6,994 (94.7%) | 6,982 (91.5%) |
Income Below Poverty Among Married-Couple Families in Fruitville
The poverty statistics for married-couple families in Fruitville show that 0.9% or 29 of the total 3,164 families live below the poverty line. Families with 1 or 2 children have the highest poverty rate of 1.3%, comprising of 10 families. On the other hand, families with 3 or 4 children have the lowest poverty rate of 0.0%, which includes 0 families.
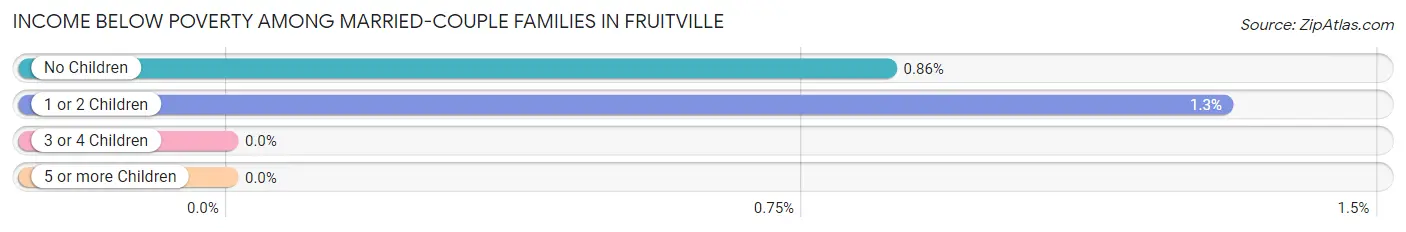
| Children | Above Poverty | Below Poverty |
| No Children | 2,183 (99.1%) | 19 (0.9%) |
| 1 or 2 Children | 760 (98.7%) | 10 (1.3%) |
| 3 or 4 Children | 188 (100.0%) | 0 (0.0%) |
| 5 or more Children | 4 (100.0%) | 0 (0.0%) |
| Total | 3,135 (99.1%) | 29 (0.9%) |
Income Below Poverty Among Single-Parent Households in Fruitville
According to the poverty data in Fruitville, 18.4% or 54 single-father households and 7.1% or 34 single-mother households are living below the poverty line. Among single-father households, those with 1 or 2 children have the highest poverty rate, with 37 households (22.7%) experiencing poverty. Likewise, among single-mother households, those with no children have the highest poverty rate, with 15 households (7.9%) falling below the poverty line.
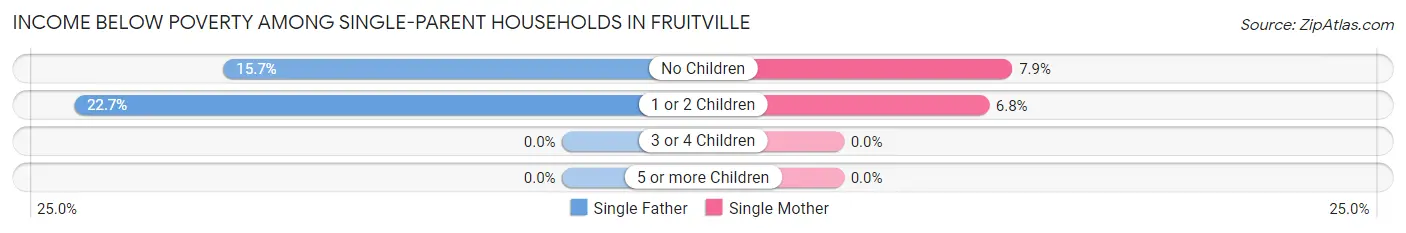
| Children | Single Father | Single Mother |
| No Children | 17 (15.7%) | 15 (7.9%) |
| 1 or 2 Children | 37 (22.7%) | 19 (6.8%) |
| 3 or 4 Children | 0 (0.0%) | 0 (0.0%) |
| 5 or more Children | 0 (0.0%) | 0 (0.0%) |
| Total | 54 (18.4%) | 34 (7.1%) |
Income Below Poverty Among Married-Couple vs Single-Parent Households in Fruitville
The poverty data for Fruitville shows that 29 of the married-couple family households (0.9%) and 88 of the single-parent households (11.4%) are living below the poverty level. Within the married-couple family households, those with 1 or 2 children have the highest poverty rate, with 10 households (1.3%) falling below the poverty line. Among the single-parent households, those with 1 or 2 children have the highest poverty rate, with 56 household (12.6%) living below poverty.
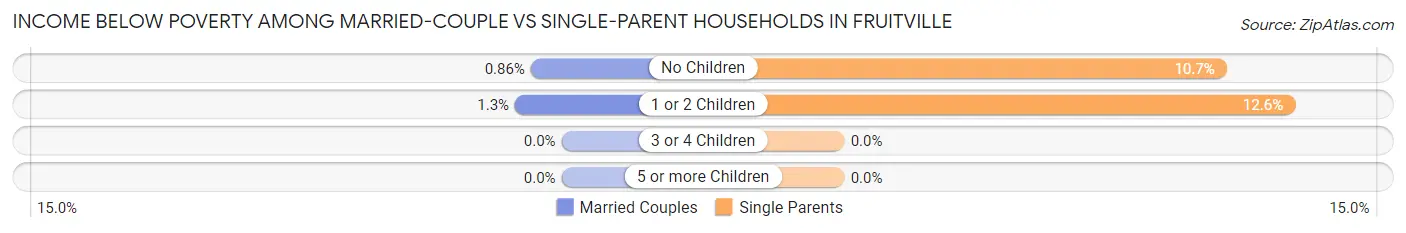
| Children | Married-Couple Families | Single-Parent Households |
| No Children | 19 (0.9%) | 32 (10.7%) |
| 1 or 2 Children | 10 (1.3%) | 56 (12.6%) |
| 3 or 4 Children | 0 (0.0%) | 0 (0.0%) |
| 5 or more Children | 0 (0.0%) | 0 (0.0%) |
| Total | 29 (0.9%) | 88 (11.4%) |
Employment Characteristics in Fruitville
Employment by Class of Employer in Fruitville
Among the 7,870 employed individuals in Fruitville, private company employees (5,320 | 67.6%), local government employees (657 | 8.4%), and self-employed (incorporated) (577 | 7.3%) make up the most common classes of employment.
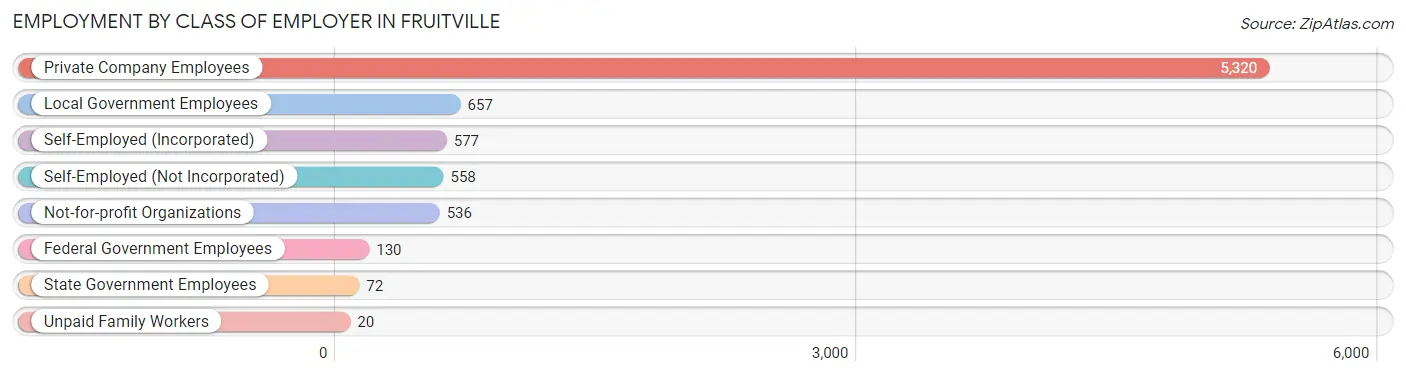
| Employer Class | # Employees | % Employees |
| Private Company Employees | 5,320 | 67.6% |
| Self-Employed (Incorporated) | 577 | 7.3% |
| Self-Employed (Not Incorporated) | 558 | 7.1% |
| Not-for-profit Organizations | 536 | 6.8% |
| Local Government Employees | 657 | 8.4% |
| State Government Employees | 72 | 0.9% |
| Federal Government Employees | 130 | 1.7% |
| Unpaid Family Workers | 20 | 0.3% |
| Total | 7,870 | 100.0% |
Employment Status by Age in Fruitville
According to the labor force statistics for Fruitville, out of the total population over 16 years of age (13,106), 63.1% or 8,270 individuals are in the labor force, with 2.7% or 223 of them unemployed. The age group with the highest labor force participation rate is 25 to 29 years, with 97.0% or 827 individuals in the labor force. Within the labor force, the 65 to 74 years age range has the highest percentage of unemployed individuals, with 8.2% or 47 of them being unemployed.
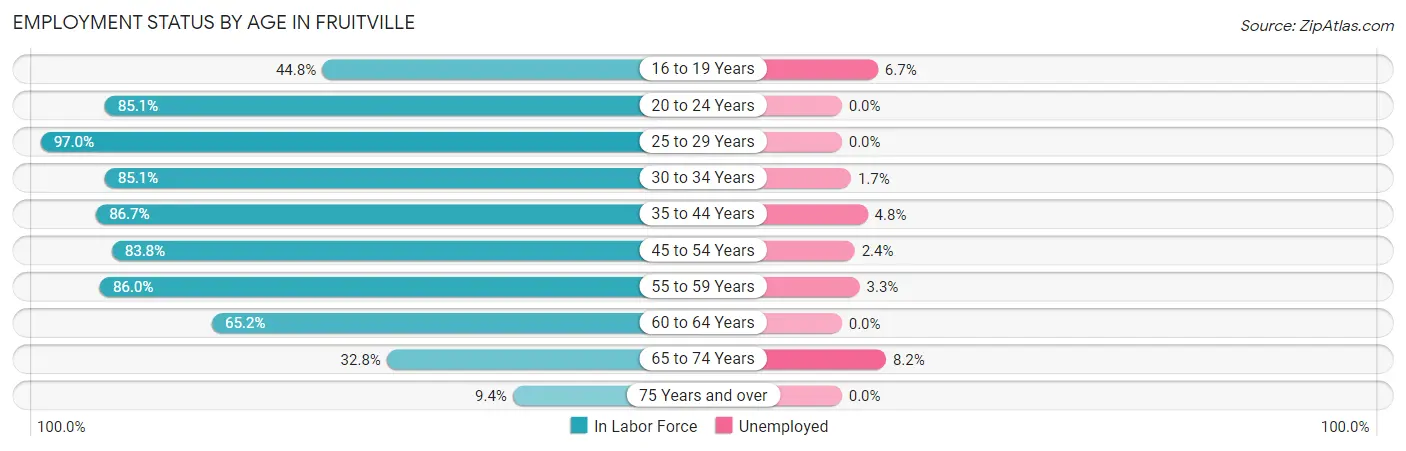
| Age Bracket | In Labor Force | Unemployed |
| 16 to 19 Years | 299 (44.8%) | 20 (6.7%) |
| 20 to 24 Years | 807 (85.1%) | 0 (0.0%) |
| 25 to 29 Years | 827 (97.0%) | 0 (0.0%) |
| 30 to 34 Years | 727 (85.1%) | 12 (1.7%) |
| 35 to 44 Years | 1,602 (86.7%) | 77 (4.8%) |
| 45 to 54 Years | 1,312 (83.8%) | 31 (2.4%) |
| 55 to 59 Years | 1,100 (86.0%) | 36 (3.3%) |
| 60 to 64 Years | 824 (65.2%) | 0 (0.0%) |
| 65 to 74 Years | 573 (32.8%) | 47 (8.2%) |
| 75 Years and over | 196 (9.4%) | 0 (0.0%) |
| Total | 8,270 (63.1%) | 223 (2.7%) |
Employment Status by Educational Attainment in Fruitville
According to labor force statistics for Fruitville, 83.4% of individuals (6,392) out of the total population between 25 and 64 years of age (7,664) are in the labor force, with 2.5% or 160 of them being unemployed. The group with the highest labor force participation rate are those with the educational attainment of bachelor's degree or higher, with 87.5% or 2,703 individuals in the labor force. Within the labor force, individuals with bachelor's degree or higher education have the highest percentage of unemployment, with 4.9% or 132 of them being unemployed.
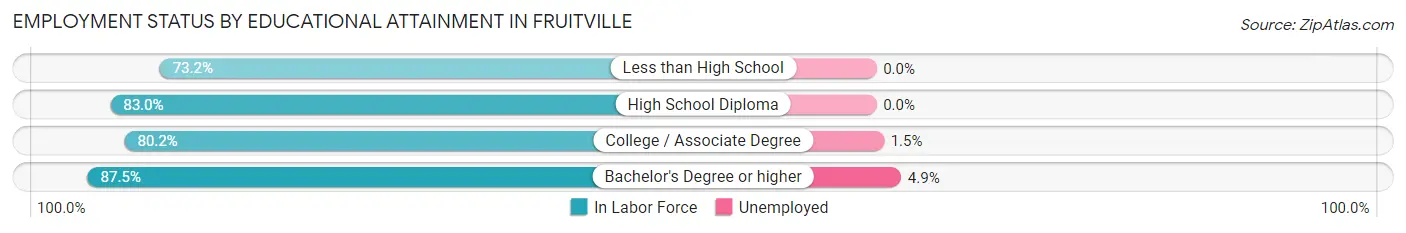
| Educational Attainment | In Labor Force | Unemployed |
| Less than High School | 375 (73.2%) | 0 (0.0%) |
| High School Diploma | 1,702 (83.0%) | 0 (0.0%) |
| College / Associate Degree | 1,614 (80.2%) | 30 (1.5%) |
| Bachelor's Degree or higher | 2,703 (87.5%) | 151 (4.9%) |
| Total | 6,392 (83.4%) | 192 (2.5%) |
Employment Occupations by Sex in Fruitville
Management, Business, Science and Arts Occupations
The most common Management, Business, Science and Arts occupations in Fruitville are Management (810 | 10.1%), Health Diagnosing & Treating (794 | 9.9%), Community & Social Service (767 | 9.6%), Health Technologists (641 | 8.0%), and Business & Financial (466 | 5.8%).
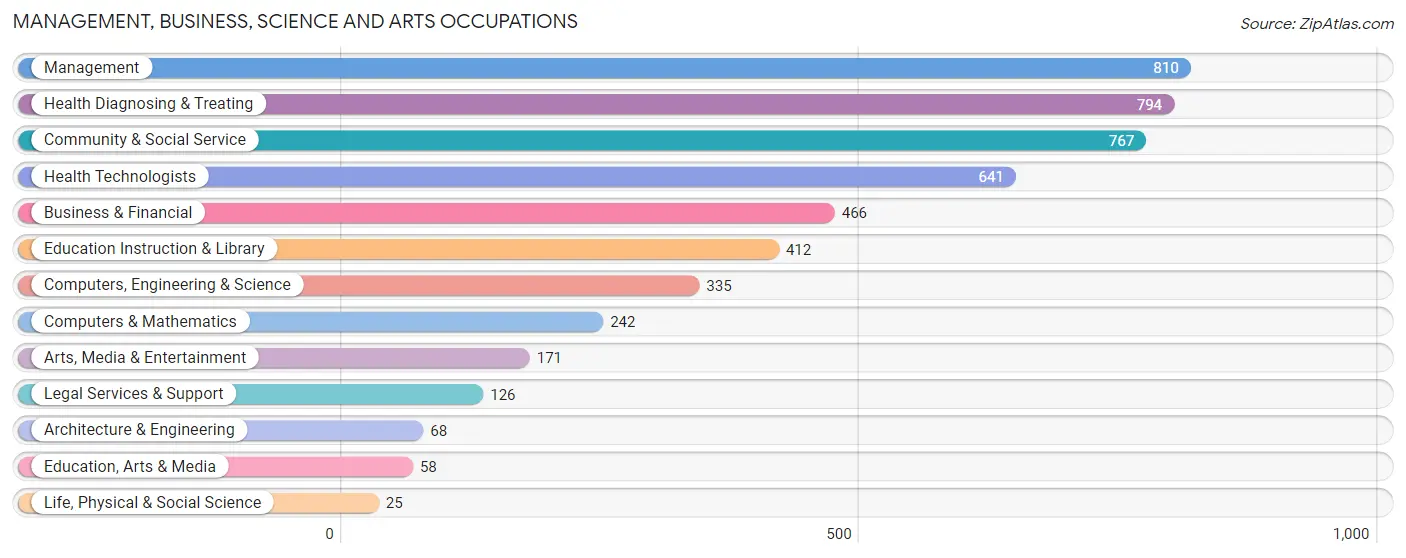
Management, Business, Science and Arts Occupations by Sex
Within the Management, Business, Science and Arts occupations in Fruitville, the most male-oriented occupations are Architecture & Engineering (100.0%), Computers, Engineering & Science (81.5%), and Computers & Mathematics (78.5%), while the most female-oriented occupations are Education, Arts & Media (96.6%), Education Instruction & Library (78.2%), and Health Diagnosing & Treating (74.8%).
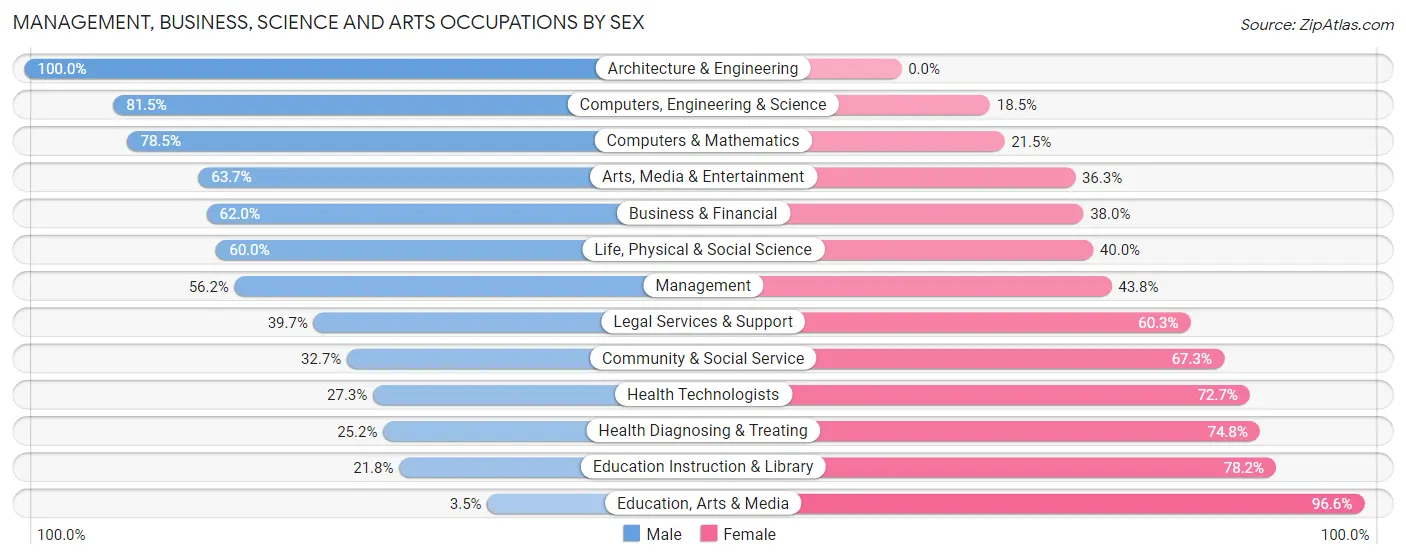
| Occupation | Male | Female |
| Management | 455 (56.2%) | 355 (43.8%) |
| Business & Financial | 289 (62.0%) | 177 (38.0%) |
| Computers, Engineering & Science | 273 (81.5%) | 62 (18.5%) |
| Computers & Mathematics | 190 (78.5%) | 52 (21.5%) |
| Architecture & Engineering | 68 (100.0%) | 0 (0.0%) |
| Life, Physical & Social Science | 15 (60.0%) | 10 (40.0%) |
| Community & Social Service | 251 (32.7%) | 516 (67.3%) |
| Education, Arts & Media | 2 (3.5%) | 56 (96.6%) |
| Legal Services & Support | 50 (39.7%) | 76 (60.3%) |
| Education Instruction & Library | 90 (21.8%) | 322 (78.2%) |
| Arts, Media & Entertainment | 109 (63.7%) | 62 (36.3%) |
| Health Diagnosing & Treating | 200 (25.2%) | 594 (74.8%) |
| Health Technologists | 175 (27.3%) | 466 (72.7%) |
| Total (Category) | 1,468 (46.3%) | 1,704 (53.7%) |
| Total (Overall) | 4,061 (50.6%) | 3,971 (49.4%) |
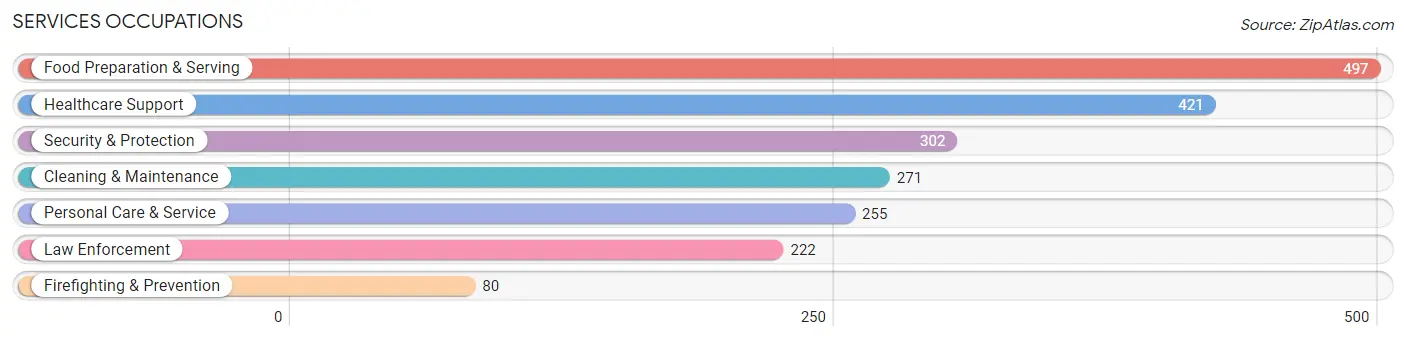
Services Occupations
The most common Services occupations in Fruitville are Food Preparation & Serving (497 | 6.2%), Healthcare Support (421 | 5.2%), Security & Protection (302 | 3.8%), Cleaning & Maintenance (271 | 3.4%), and Personal Care & Service (255 | 3.2%).
Services Occupations by Sex
Within the Services occupations in Fruitville, the most male-oriented occupations are Cleaning & Maintenance (98.2%), Firefighting & Prevention (83.8%), and Security & Protection (71.9%), while the most female-oriented occupations are Healthcare Support (83.4%), Personal Care & Service (62.4%), and Food Preparation & Serving (40.2%).
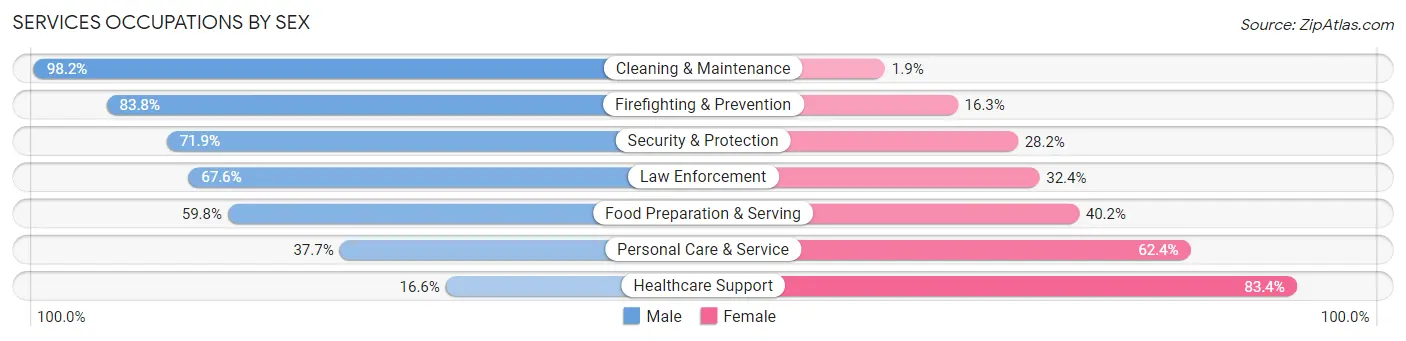
| Occupation | Male | Female |
| Healthcare Support | 70 (16.6%) | 351 (83.4%) |
| Security & Protection | 217 (71.9%) | 85 (28.1%) |
| Firefighting & Prevention | 67 (83.8%) | 13 (16.3%) |
| Law Enforcement | 150 (67.6%) | 72 (32.4%) |
| Food Preparation & Serving | 297 (59.8%) | 200 (40.2%) |
| Cleaning & Maintenance | 266 (98.2%) | 5 (1.8%) |
| Personal Care & Service | 96 (37.7%) | 159 (62.4%) |
| Total (Category) | 946 (54.2%) | 800 (45.8%) |
| Total (Overall) | 4,061 (50.6%) | 3,971 (49.4%) |
Sales and Office Occupations
The most common Sales and Office occupations in Fruitville are Sales & Related (1,191 | 14.8%), and Office & Administration (879 | 10.9%).

Sales and Office Occupations by Sex
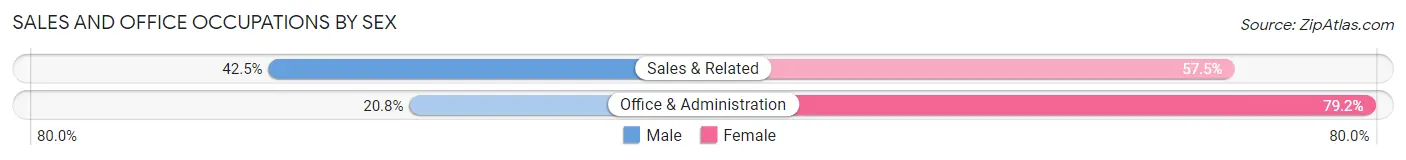
| Occupation | Male | Female |
| Sales & Related | 506 (42.5%) | 685 (57.5%) |
| Office & Administration | 183 (20.8%) | 696 (79.2%) |
| Total (Category) | 689 (33.3%) | 1,381 (66.7%) |
| Total (Overall) | 4,061 (50.6%) | 3,971 (49.4%) |
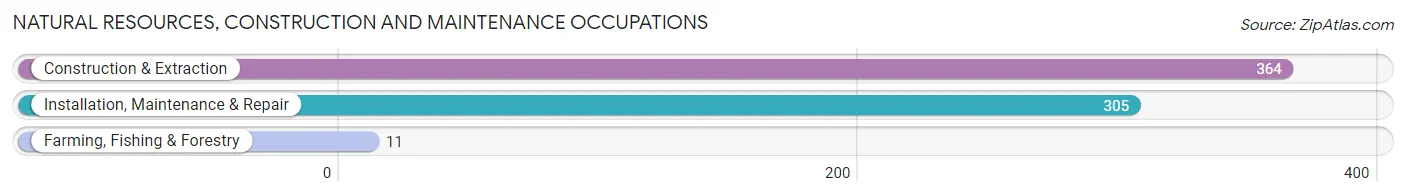
Natural Resources, Construction and Maintenance Occupations
The most common Natural Resources, Construction and Maintenance occupations in Fruitville are Construction & Extraction (364 | 4.5%), Installation, Maintenance & Repair (305 | 3.8%), and Farming, Fishing & Forestry (11 | 0.1%).
Natural Resources, Construction and Maintenance Occupations by Sex
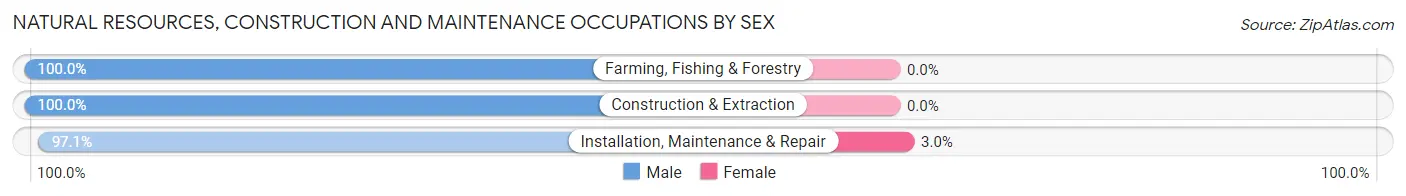
| Occupation | Male | Female |
| Farming, Fishing & Forestry | 11 (100.0%) | 0 (0.0%) |
| Construction & Extraction | 364 (100.0%) | 0 (0.0%) |
| Installation, Maintenance & Repair | 296 (97.1%) | 9 (2.9%) |
| Total (Category) | 671 (98.7%) | 9 (1.3%) |
| Total (Overall) | 4,061 (50.6%) | 3,971 (49.4%) |
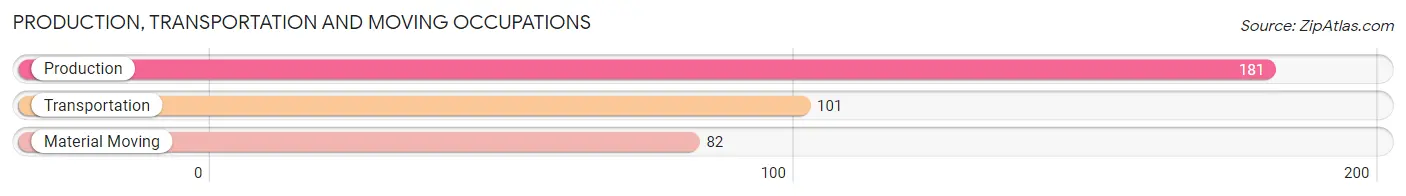
Production, Transportation and Moving Occupations
The most common Production, Transportation and Moving occupations in Fruitville are Production (181 | 2.2%), Transportation (101 | 1.3%), and Material Moving (82 | 1.0%).
Production, Transportation and Moving Occupations by Sex
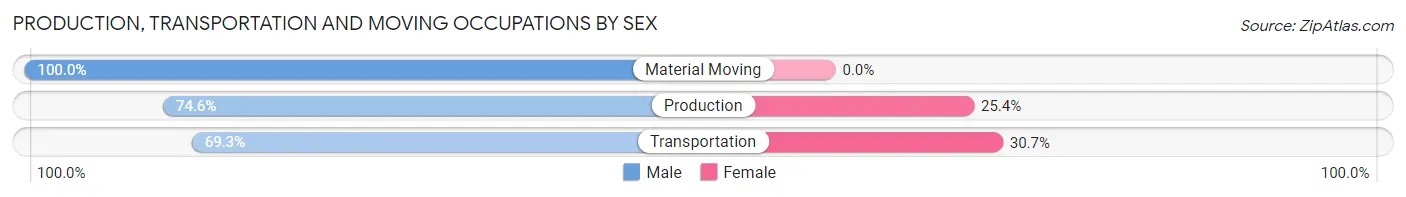
| Occupation | Male | Female |
| Production | 135 (74.6%) | 46 (25.4%) |
| Transportation | 70 (69.3%) | 31 (30.7%) |
| Material Moving | 82 (100.0%) | 0 (0.0%) |
| Total (Category) | 287 (78.8%) | 77 (21.1%) |
| Total (Overall) | 4,061 (50.6%) | 3,971 (49.4%) |
Employment Industries by Sex in Fruitville
Employment Industries in Fruitville
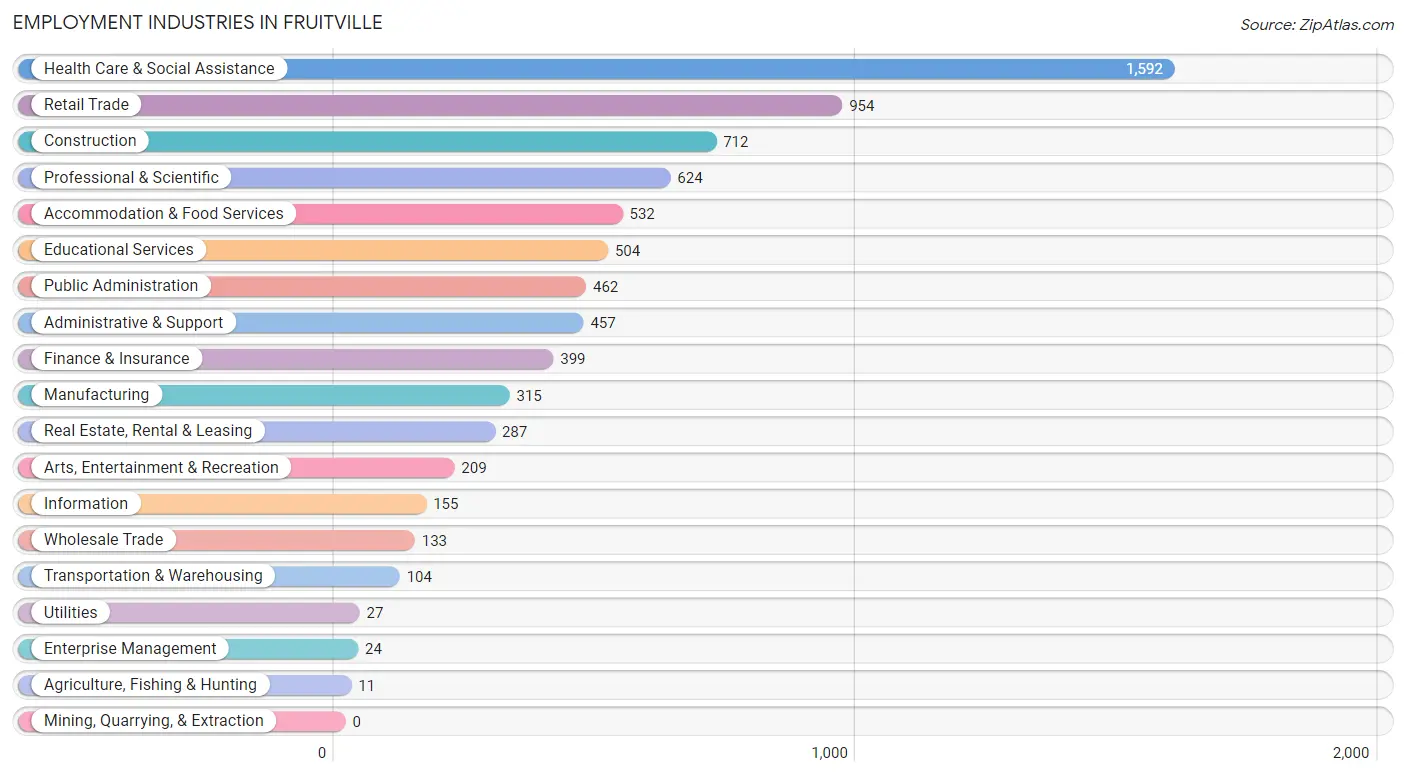
The major employment industries in Fruitville include Health Care & Social Assistance (1,592 | 19.8%), Retail Trade (954 | 11.9%), Construction (712 | 8.9%), Professional & Scientific (624 | 7.8%), and Accommodation & Food Services (532 | 6.6%).
Employment Industries by Sex in Fruitville
The Fruitville industries that see more men than women are Agriculture, Fishing & Hunting (100.0%), Enterprise Management (100.0%), and Construction (93.0%), whereas the industries that tend to have a higher number of women are Educational Services (81.1%), Health Care & Social Assistance (72.7%), and Utilities (59.3%).
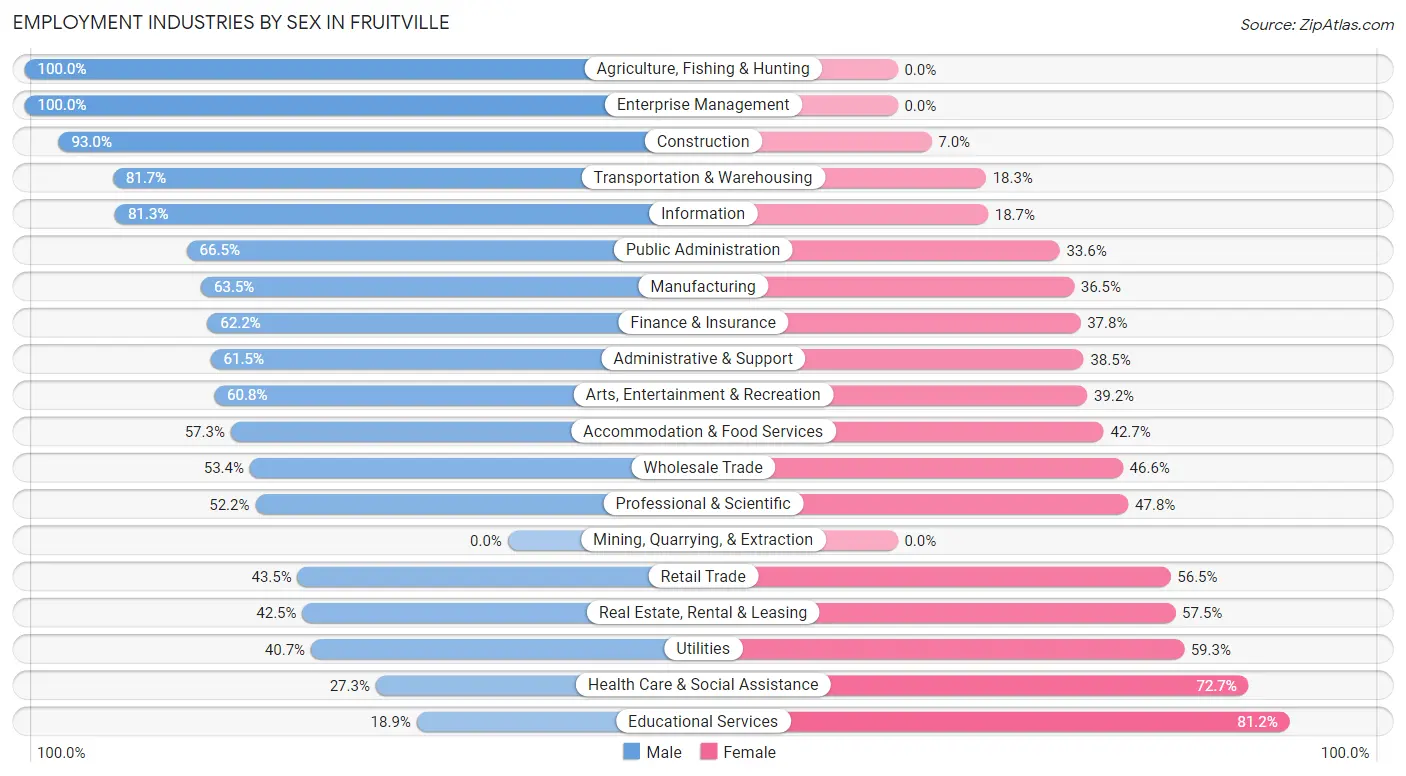
| Industry | Male | Female |
| Agriculture, Fishing & Hunting | 11 (100.0%) | 0 (0.0%) |
| Mining, Quarrying, & Extraction | 0 (0.0%) | 0 (0.0%) |
| Construction | 662 (93.0%) | 50 (7.0%) |
| Manufacturing | 200 (63.5%) | 115 (36.5%) |
| Wholesale Trade | 71 (53.4%) | 62 (46.6%) |
| Retail Trade | 415 (43.5%) | 539 (56.5%) |
| Transportation & Warehousing | 85 (81.7%) | 19 (18.3%) |
| Utilities | 11 (40.7%) | 16 (59.3%) |
| Information | 126 (81.3%) | 29 (18.7%) |
| Finance & Insurance | 248 (62.2%) | 151 (37.8%) |
| Real Estate, Rental & Leasing | 122 (42.5%) | 165 (57.5%) |
| Professional & Scientific | 326 (52.2%) | 298 (47.8%) |
| Enterprise Management | 24 (100.0%) | 0 (0.0%) |
| Administrative & Support | 281 (61.5%) | 176 (38.5%) |
| Educational Services | 95 (18.9%) | 409 (81.1%) |
| Health Care & Social Assistance | 435 (27.3%) | 1,157 (72.7%) |
| Arts, Entertainment & Recreation | 127 (60.8%) | 82 (39.2%) |
| Accommodation & Food Services | 305 (57.3%) | 227 (42.7%) |
| Public Administration | 307 (66.4%) | 155 (33.6%) |
| Total | 4,061 (50.6%) | 3,971 (49.4%) |
Education in Fruitville
School Enrollment in Fruitville
The most common levels of schooling among the 2,748 students in Fruitville are high school (865 | 31.5%), college / undergraduate (599 | 21.8%), and elementary school (349 | 12.7%).
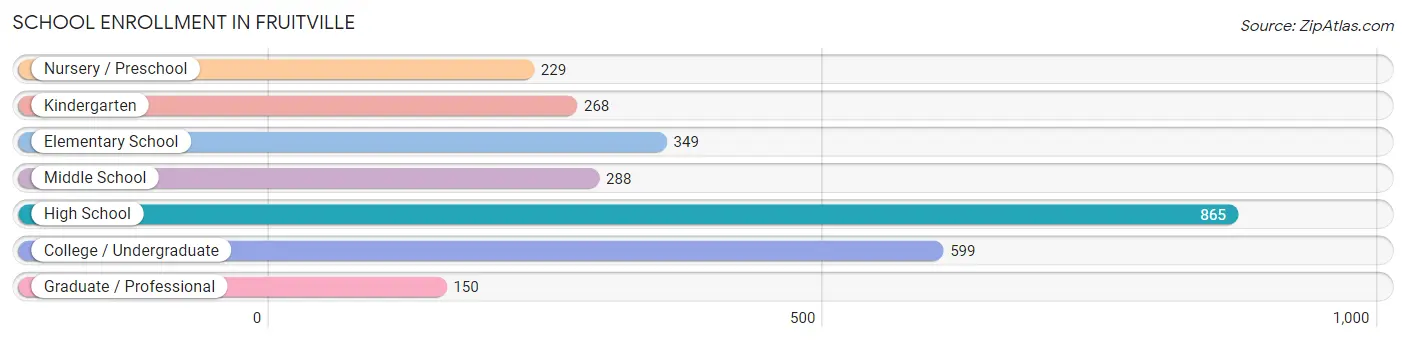
| School Level | # Students | % Students |
| Nursery / Preschool | 229 | 8.3% |
| Kindergarten | 268 | 9.8% |
| Elementary School | 349 | 12.7% |
| Middle School | 288 | 10.5% |
| High School | 865 | 31.5% |
| College / Undergraduate | 599 | 21.8% |
| Graduate / Professional | 150 | 5.5% |
| Total | 2,748 | 100.0% |
School Enrollment by Age by Funding Source in Fruitville
Out of a total of 2,748 students who are enrolled in schools in Fruitville, 778 (28.3%) attend a private institution, while the remaining 1,970 (71.7%) are enrolled in public schools. The age group of 3 to 4 year olds has the highest likelihood of being enrolled in private schools, with 144 (79.1% in the age bracket) enrolled. Conversely, the age group of 18 to 19 year olds has the lowest likelihood of being enrolled in a private school, with 243 (89.3% in the age bracket) attending a public institution.
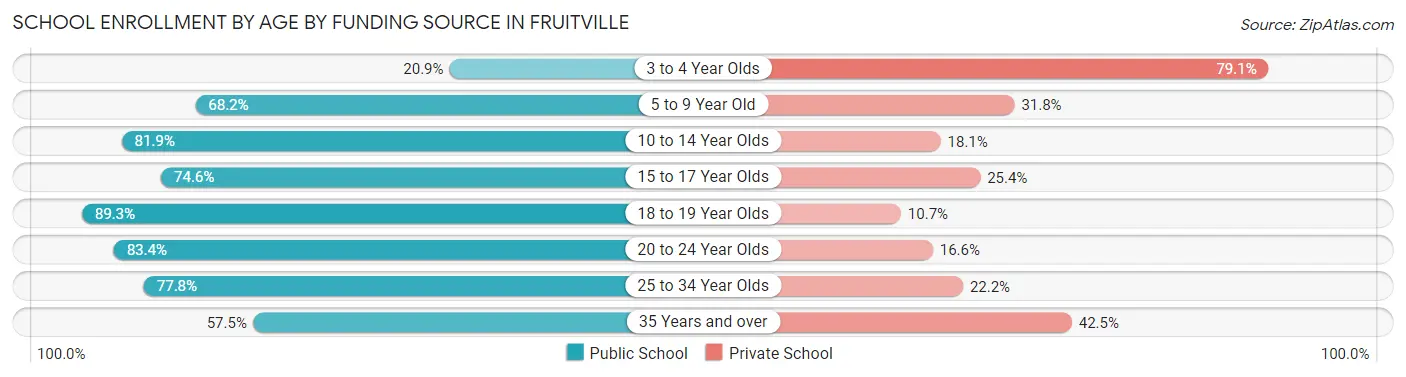
| Age Bracket | Public School | Private School |
| 3 to 4 Year Olds | 38 (20.9%) | 144 (79.1%) |
| 5 to 9 Year Old | 433 (68.2%) | 202 (31.8%) |
| 10 to 14 Year Olds | 381 (81.9%) | 84 (18.1%) |
| 15 to 17 Year Olds | 434 (74.6%) | 148 (25.4%) |
| 18 to 19 Year Olds | 243 (89.3%) | 29 (10.7%) |
| 20 to 24 Year Olds | 196 (83.4%) | 39 (16.6%) |
| 25 to 34 Year Olds | 112 (77.8%) | 32 (22.2%) |
| 35 Years and over | 134 (57.5%) | 99 (42.5%) |
| Total | 1,970 (71.7%) | 778 (28.3%) |
Educational Attainment by Field of Study in Fruitville
Business (1,072 | 23.1%), science & technology (560 | 12.1%), education (493 | 10.6%), visual & performing arts (317 | 6.8%), and engineering (290 | 6.3%) are the most common fields of study among 4,635 individuals in Fruitville who have obtained a bachelor's degree or higher.
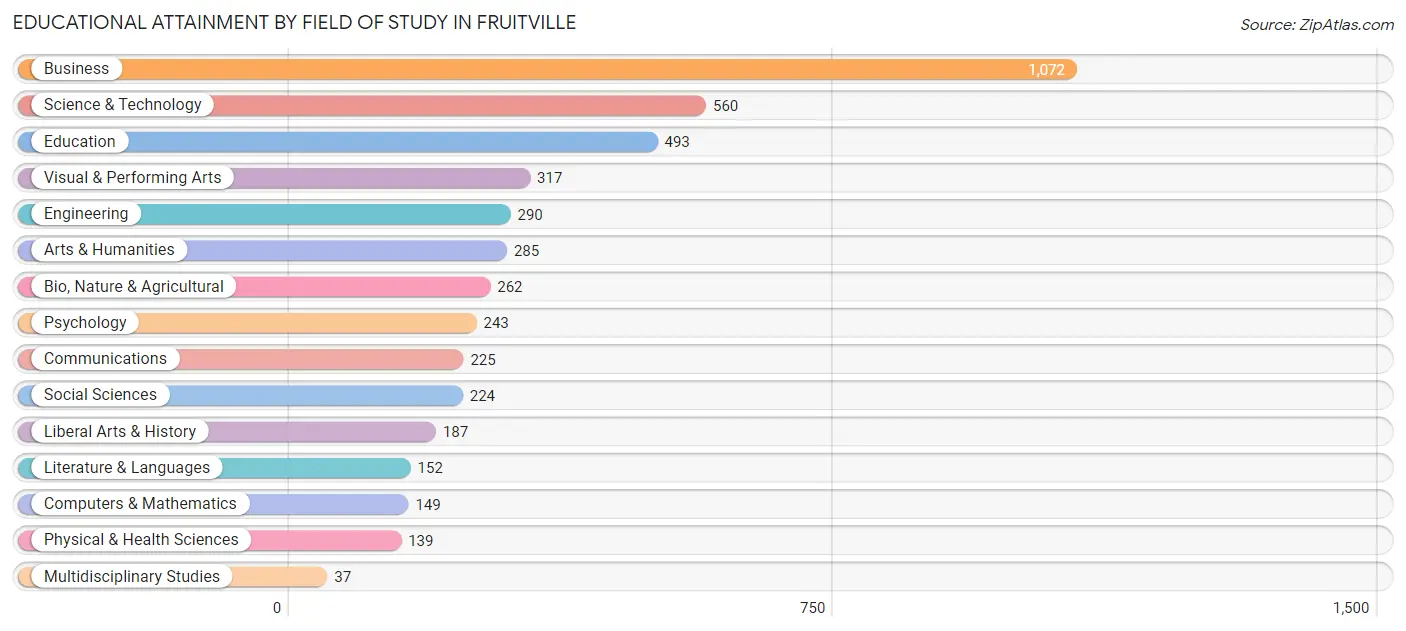
| Field of Study | # Graduates | % Graduates |
| Computers & Mathematics | 149 | 3.2% |
| Bio, Nature & Agricultural | 262 | 5.7% |
| Physical & Health Sciences | 139 | 3.0% |
| Psychology | 243 | 5.2% |
| Social Sciences | 224 | 4.8% |
| Engineering | 290 | 6.3% |
| Multidisciplinary Studies | 37 | 0.8% |
| Science & Technology | 560 | 12.1% |
| Business | 1,072 | 23.1% |
| Education | 493 | 10.6% |
| Literature & Languages | 152 | 3.3% |
| Liberal Arts & History | 187 | 4.0% |
| Visual & Performing Arts | 317 | 6.8% |
| Communications | 225 | 4.9% |
| Arts & Humanities | 285 | 6.1% |
| Total | 4,635 | 100.0% |
Transportation & Commute in Fruitville
Vehicle Availability by Sex in Fruitville
The most prevalent vehicle ownership categories in Fruitville are males with 2 vehicles (2,171, accounting for 54.3%) and females with 2 vehicles (1,954, making up 56.2%).
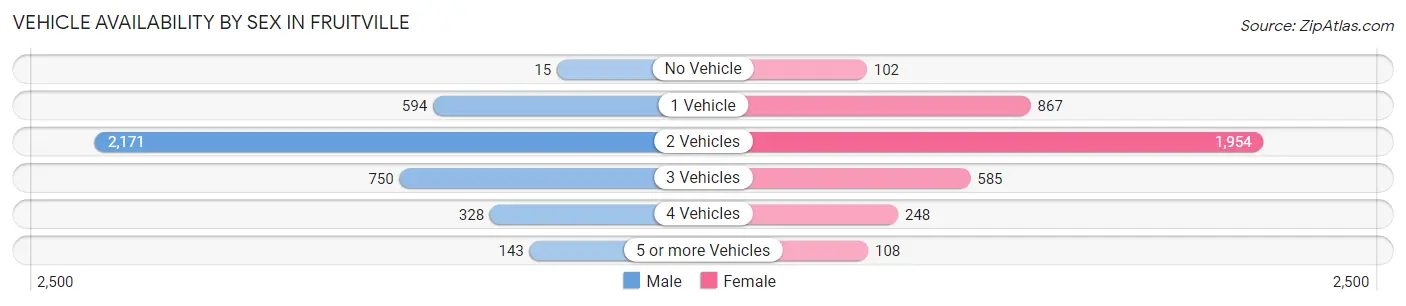
| Vehicles Available | Male | Female |
| No Vehicle | 15 (0.4%) | 102 (2.6%) |
| 1 Vehicle | 594 (14.8%) | 867 (22.4%) |
| 2 Vehicles | 2,171 (54.3%) | 1,954 (50.6%) |
| 3 Vehicles | 750 (18.8%) | 585 (15.1%) |
| 4 Vehicles | 328 (8.2%) | 248 (6.4%) |
| 5 or more Vehicles | 143 (3.6%) | 108 (2.8%) |
| Total | 4,001 (100.0%) | 3,864 (100.0%) |
Commute Time in Fruitville
The most frequently occuring commute durations in Fruitville are 20 to 24 minutes (1,867 commuters, 26.6%), 15 to 19 minutes (1,595 commuters, 22.7%), and 30 to 34 minutes (987 commuters, 14.0%).
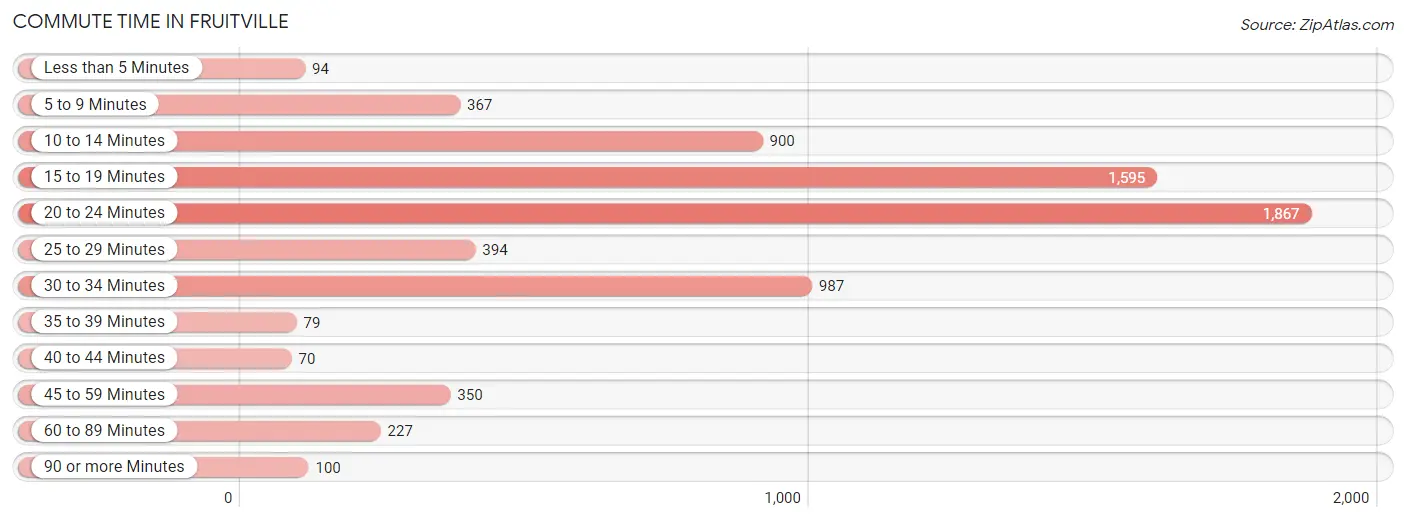
| Commute Time | # Commuters | % Commuters |
| Less than 5 Minutes | 94 | 1.3% |
| 5 to 9 Minutes | 367 | 5.2% |
| 10 to 14 Minutes | 900 | 12.8% |
| 15 to 19 Minutes | 1,595 | 22.7% |
| 20 to 24 Minutes | 1,867 | 26.6% |
| 25 to 29 Minutes | 394 | 5.6% |
| 30 to 34 Minutes | 987 | 14.0% |
| 35 to 39 Minutes | 79 | 1.1% |
| 40 to 44 Minutes | 70 | 1.0% |
| 45 to 59 Minutes | 350 | 5.0% |
| 60 to 89 Minutes | 227 | 3.2% |
| 90 or more Minutes | 100 | 1.4% |
Commute Time by Sex in Fruitville
The most common commute times in Fruitville are 20 to 24 minutes (992 commuters, 28.1%) for males and 20 to 24 minutes (875 commuters, 25.0%) for females.
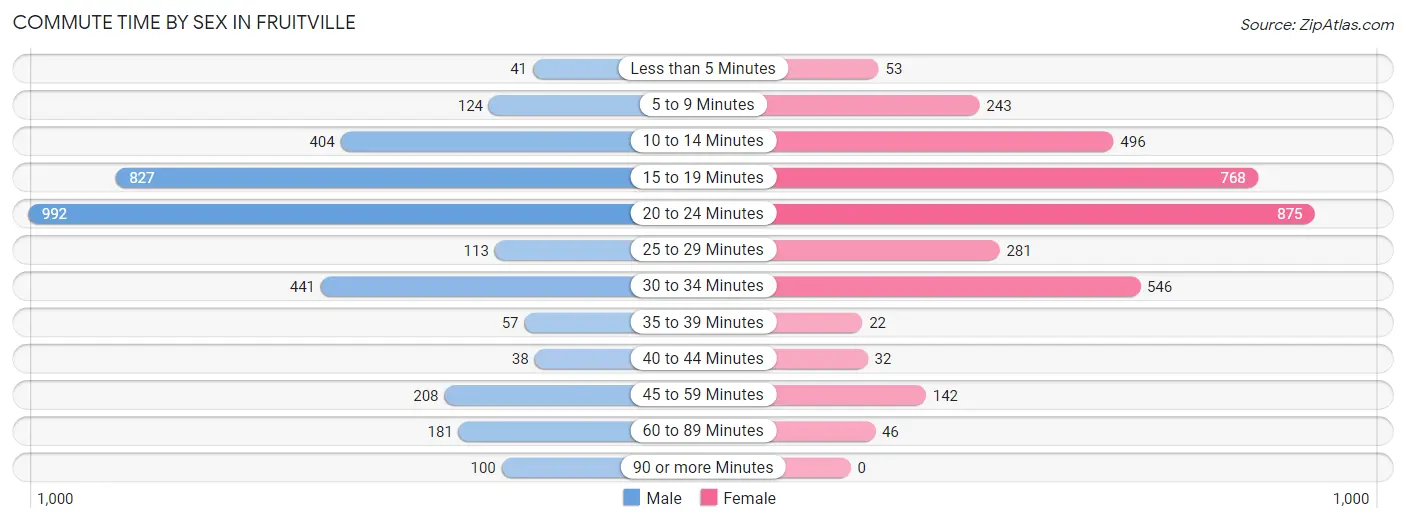
| Commute Time | Male | Female |
| Less than 5 Minutes | 41 (1.2%) | 53 (1.5%) |
| 5 to 9 Minutes | 124 (3.5%) | 243 (6.9%) |
| 10 to 14 Minutes | 404 (11.5%) | 496 (14.2%) |
| 15 to 19 Minutes | 827 (23.4%) | 768 (21.9%) |
| 20 to 24 Minutes | 992 (28.1%) | 875 (25.0%) |
| 25 to 29 Minutes | 113 (3.2%) | 281 (8.0%) |
| 30 to 34 Minutes | 441 (12.5%) | 546 (15.6%) |
| 35 to 39 Minutes | 57 (1.6%) | 22 (0.6%) |
| 40 to 44 Minutes | 38 (1.1%) | 32 (0.9%) |
| 45 to 59 Minutes | 208 (5.9%) | 142 (4.1%) |
| 60 to 89 Minutes | 181 (5.1%) | 46 (1.3%) |
| 90 or more Minutes | 100 (2.8%) | 0 (0.0%) |
Time of Departure to Work by Sex in Fruitville
The most frequent times of departure to work in Fruitville are 7:00 AM to 7:29 AM (533, 15.1%) for males and 7:00 AM to 7:29 AM (566, 16.2%) for females.
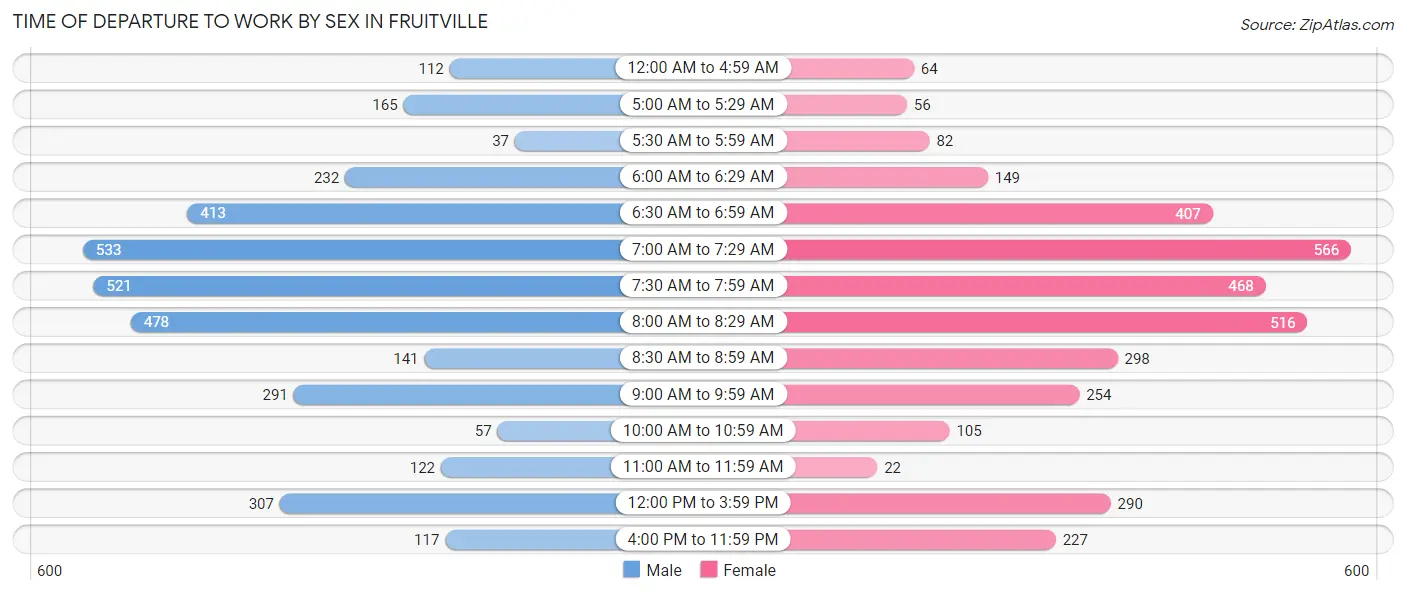
| Time of Departure | Male | Female |
| 12:00 AM to 4:59 AM | 112 (3.2%) | 64 (1.8%) |
| 5:00 AM to 5:29 AM | 165 (4.7%) | 56 (1.6%) |
| 5:30 AM to 5:59 AM | 37 (1.1%) | 82 (2.3%) |
| 6:00 AM to 6:29 AM | 232 (6.6%) | 149 (4.3%) |
| 6:30 AM to 6:59 AM | 413 (11.7%) | 407 (11.6%) |
| 7:00 AM to 7:29 AM | 533 (15.1%) | 566 (16.2%) |
| 7:30 AM to 7:59 AM | 521 (14.8%) | 468 (13.4%) |
| 8:00 AM to 8:29 AM | 478 (13.6%) | 516 (14.7%) |
| 8:30 AM to 8:59 AM | 141 (4.0%) | 298 (8.5%) |
| 9:00 AM to 9:59 AM | 291 (8.3%) | 254 (7.2%) |
| 10:00 AM to 10:59 AM | 57 (1.6%) | 105 (3.0%) |
| 11:00 AM to 11:59 AM | 122 (3.5%) | 22 (0.6%) |
| 12:00 PM to 3:59 PM | 307 (8.7%) | 290 (8.3%) |
| 4:00 PM to 11:59 PM | 117 (3.3%) | 227 (6.5%) |
| Total | 3,526 (100.0%) | 3,504 (100.0%) |
Housing Occupancy in Fruitville
Occupancy by Ownership in Fruitville
Of the total 6,757 dwellings in Fruitville, owner-occupied units account for 4,263 (63.1%), while renter-occupied units make up 2,494 (36.9%).
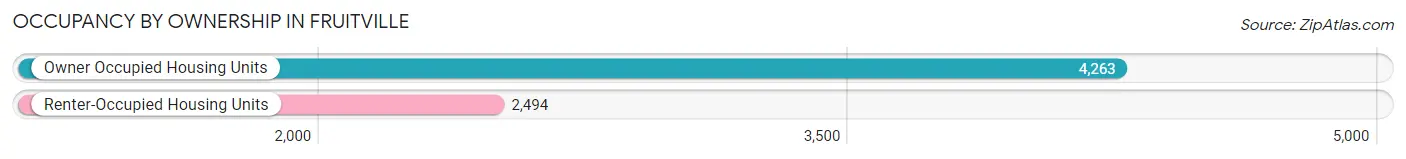
| Occupancy | # Housing Units | % Housing Units |
| Owner Occupied Housing Units | 4,263 | 63.1% |
| Renter-Occupied Housing Units | 2,494 | 36.9% |
| Total Occupied Housing Units | 6,757 | 100.0% |
Occupancy by Household Size in Fruitville
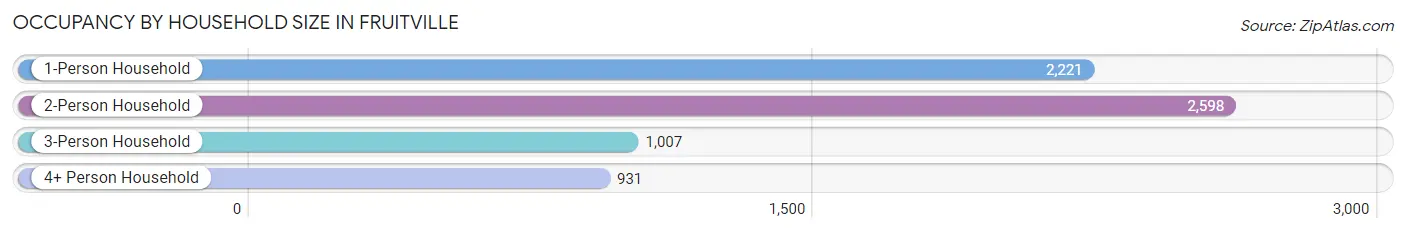
| Household Size | # Housing Units | % Housing Units |
| 1-Person Household | 2,221 | 32.9% |
| 2-Person Household | 2,598 | 38.5% |
| 3-Person Household | 1,007 | 14.9% |
| 4+ Person Household | 931 | 13.8% |
| Total Housing Units | 6,757 | 100.0% |
Occupancy by Ownership by Household Size in Fruitville
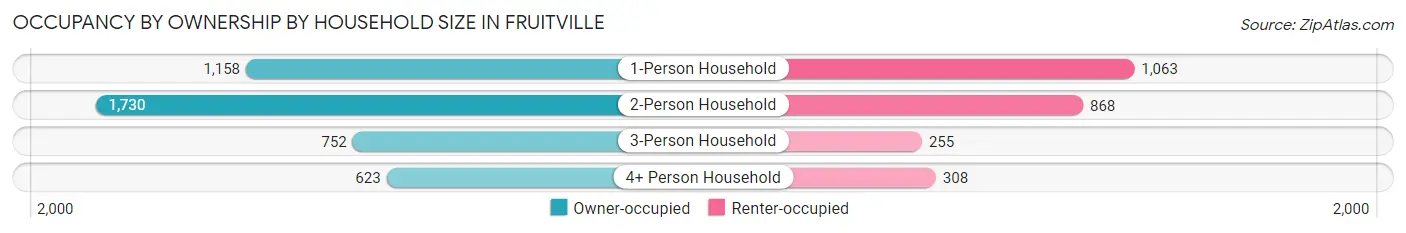
| Household Size | Owner-occupied | Renter-occupied |
| 1-Person Household | 1,158 (52.1%) | 1,063 (47.9%) |
| 2-Person Household | 1,730 (66.6%) | 868 (33.4%) |
| 3-Person Household | 752 (74.7%) | 255 (25.3%) |
| 4+ Person Household | 623 (66.9%) | 308 (33.1%) |
| Total Housing Units | 4,263 (63.1%) | 2,494 (36.9%) |
Occupancy by Educational Attainment in Fruitville
| Household Size | Owner-occupied | Renter-occupied |
| Less than High School | 148 (39.6%) | 226 (60.4%) |
| High School Diploma | 1,127 (65.2%) | 601 (34.8%) |
| College/Associate Degree | 1,118 (60.2%) | 738 (39.8%) |
| Bachelor's Degree or higher | 1,870 (66.8%) | 929 (33.2%) |
Occupancy by Age of Householder in Fruitville
| Age Bracket | # Households | % Households |
| Under 35 Years | 1,110 | 16.4% |
| 35 to 44 Years | 1,058 | 15.7% |
| 45 to 54 Years | 778 | 11.5% |
| 55 to 64 Years | 1,509 | 22.3% |
| 65 to 74 Years | 928 | 13.7% |
| 75 to 84 Years | 857 | 12.7% |
| 85 Years and Over | 517 | 7.6% |
| Total | 6,757 | 100.0% |
Housing Finances in Fruitville
Median Income by Occupancy in Fruitville
| Occupancy Type | # Households | Median Income |
| Owner-Occupied | 4,263 (63.1%) | $93,954 |
| Renter-Occupied | 2,494 (36.9%) | $63,232 |
| Average | 6,757 (100.0%) | $84,070 |
Occupancy by Householder Income Bracket in Fruitville
| Income Bracket | Owner-occupied | Renter-occupied |
| Less than $5,000 | 110 (2.6%) | 30 (1.2%) |
| $5,000 to $9,999 | 43 (1.0%) | 37 (1.5%) |
| $10,000 to $14,999 | 91 (2.1%) | 72 (2.9%) |
| $15,000 to $19,999 | 48 (1.1%) | 153 (6.1%) |
| $20,000 to $24,999 | 113 (2.6%) | 28 (1.1%) |
| $25,000 to $34,999 | 236 (5.5%) | 239 (9.6%) |
| $35,000 to $49,999 | 335 (7.9%) | 340 (13.6%) |
| $50,000 to $74,999 | 690 (16.2%) | 522 (20.9%) |
| $75,000 to $99,999 | 679 (15.9%) | 361 (14.5%) |
| $100,000 to $149,999 | 911 (21.4%) | 541 (21.7%) |
| $150,000 or more | 1,007 (23.6%) | 171 (6.9%) |
| Total | 4,263 (100.0%) | 2,494 (100.0%) |
Monthly Housing Cost Tiers in Fruitville
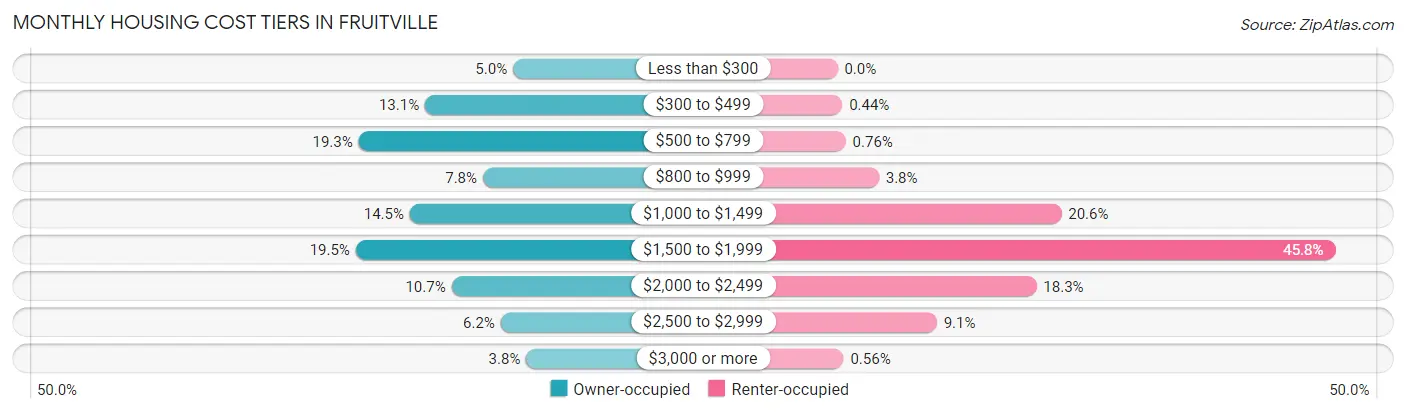
| Monthly Cost | Owner-occupied | Renter-occupied |
| Less than $300 | 215 (5.0%) | 0 (0.0%) |
| $300 to $499 | 560 (13.1%) | 11 (0.4%) |
| $500 to $799 | 821 (19.3%) | 19 (0.8%) |
| $800 to $999 | 333 (7.8%) | 95 (3.8%) |
| $1,000 to $1,499 | 620 (14.5%) | 514 (20.6%) |
| $1,500 to $1,999 | 832 (19.5%) | 1,143 (45.8%) |
| $2,000 to $2,499 | 456 (10.7%) | 457 (18.3%) |
| $2,500 to $2,999 | 263 (6.2%) | 228 (9.1%) |
| $3,000 or more | 163 (3.8%) | 14 (0.6%) |
| Total | 4,263 (100.0%) | 2,494 (100.0%) |
Physical Housing Characteristics in Fruitville
Housing Structures in Fruitville
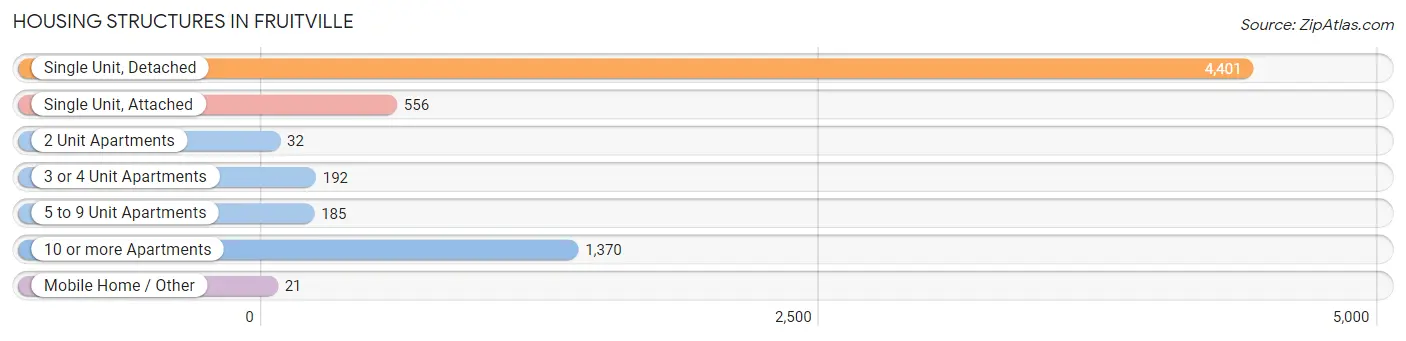
| Structure Type | # Housing Units | % Housing Units |
| Single Unit, Detached | 4,401 | 65.1% |
| Single Unit, Attached | 556 | 8.2% |
| 2 Unit Apartments | 32 | 0.5% |
| 3 or 4 Unit Apartments | 192 | 2.8% |
| 5 to 9 Unit Apartments | 185 | 2.7% |
| 10 or more Apartments | 1,370 | 20.3% |
| Mobile Home / Other | 21 | 0.3% |
| Total | 6,757 | 100.0% |
Housing Structures by Occupancy in Fruitville
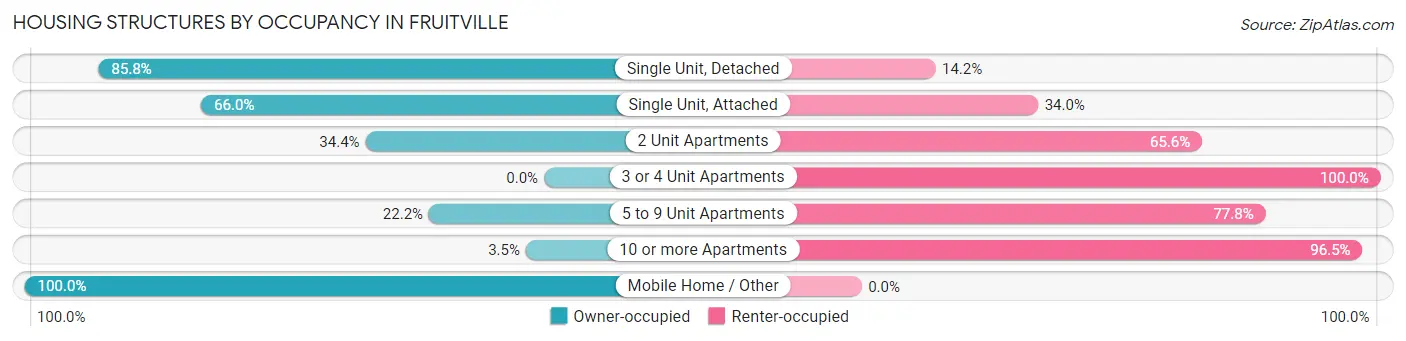
| Structure Type | Owner-occupied | Renter-occupied |
| Single Unit, Detached | 3,775 (85.8%) | 626 (14.2%) |
| Single Unit, Attached | 367 (66.0%) | 189 (34.0%) |
| 2 Unit Apartments | 11 (34.4%) | 21 (65.6%) |
| 3 or 4 Unit Apartments | 0 (0.0%) | 192 (100.0%) |
| 5 to 9 Unit Apartments | 41 (22.2%) | 144 (77.8%) |
| 10 or more Apartments | 48 (3.5%) | 1,322 (96.5%) |
| Mobile Home / Other | 21 (100.0%) | 0 (0.0%) |
| Total | 4,263 (63.1%) | 2,494 (36.9%) |
Housing Structures by Number of Rooms in Fruitville
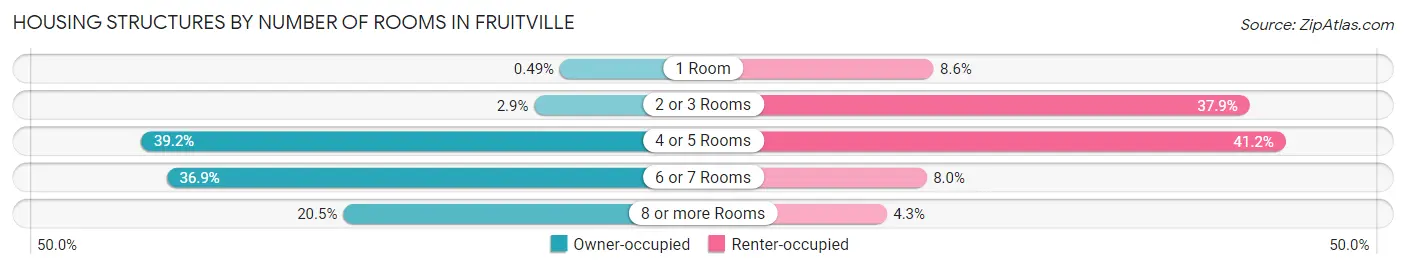
| Number of Rooms | Owner-occupied | Renter-occupied |
| 1 Room | 21 (0.5%) | 215 (8.6%) |
| 2 or 3 Rooms | 122 (2.9%) | 945 (37.9%) |
| 4 or 5 Rooms | 1,673 (39.2%) | 1,028 (41.2%) |
| 6 or 7 Rooms | 1,572 (36.9%) | 199 (8.0%) |
| 8 or more Rooms | 875 (20.5%) | 107 (4.3%) |
| Total | 4,263 (100.0%) | 2,494 (100.0%) |
Housing Structure by Heating Type in Fruitville
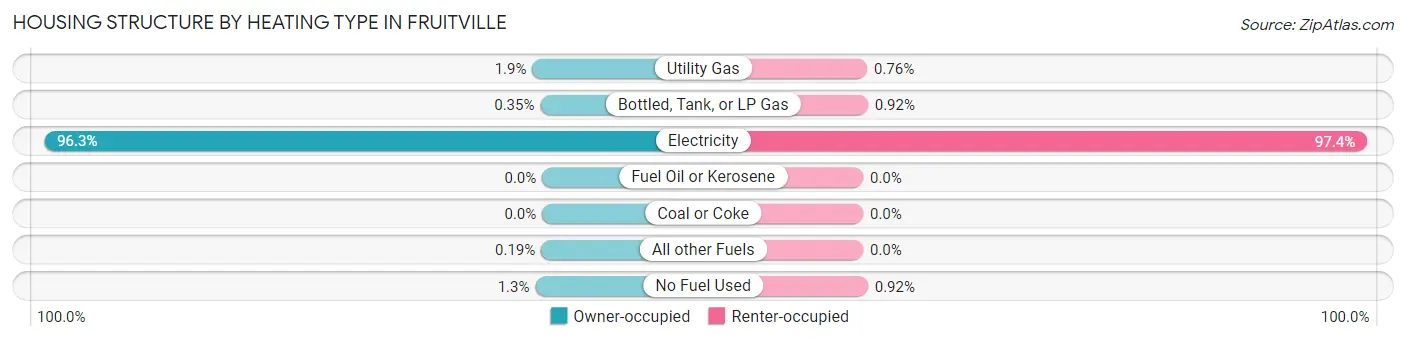
| Heating Type | Owner-occupied | Renter-occupied |
| Utility Gas | 81 (1.9%) | 19 (0.8%) |
| Bottled, Tank, or LP Gas | 15 (0.4%) | 23 (0.9%) |
| Electricity | 4,103 (96.3%) | 2,429 (97.4%) |
| Fuel Oil or Kerosene | 0 (0.0%) | 0 (0.0%) |
| Coal or Coke | 0 (0.0%) | 0 (0.0%) |
| All other Fuels | 8 (0.2%) | 0 (0.0%) |
| No Fuel Used | 56 (1.3%) | 23 (0.9%) |
| Total | 4,263 (100.0%) | 2,494 (100.0%) |
Household Vehicle Usage in Fruitville
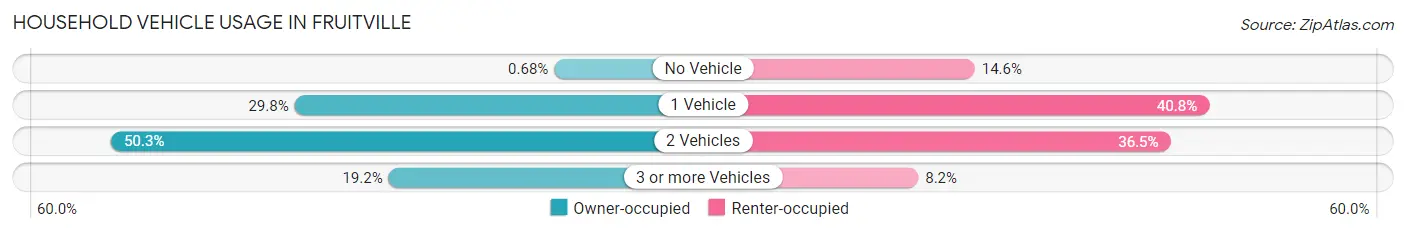
| Vehicles per Household | Owner-occupied | Renter-occupied |
| No Vehicle | 29 (0.7%) | 363 (14.5%) |
| 1 Vehicle | 1,269 (29.8%) | 1,017 (40.8%) |
| 2 Vehicles | 2,145 (50.3%) | 909 (36.4%) |
| 3 or more Vehicles | 820 (19.2%) | 205 (8.2%) |
| Total | 4,263 (100.0%) | 2,494 (100.0%) |
Real Estate & Mortgages in Fruitville
Real Estate and Mortgage Overview in Fruitville
| Characteristic | Without Mortgage | With Mortgage |
| Housing Units | 1,912 | 2,351 |
| Median Property Value | $351,800 | $351,700 |
| Median Household Income | $72,639 | $715 |
| Monthly Housing Costs | $569 | $163 |
| Real Estate Taxes | $2,240 | $10 |
Property Value by Mortgage Status in Fruitville
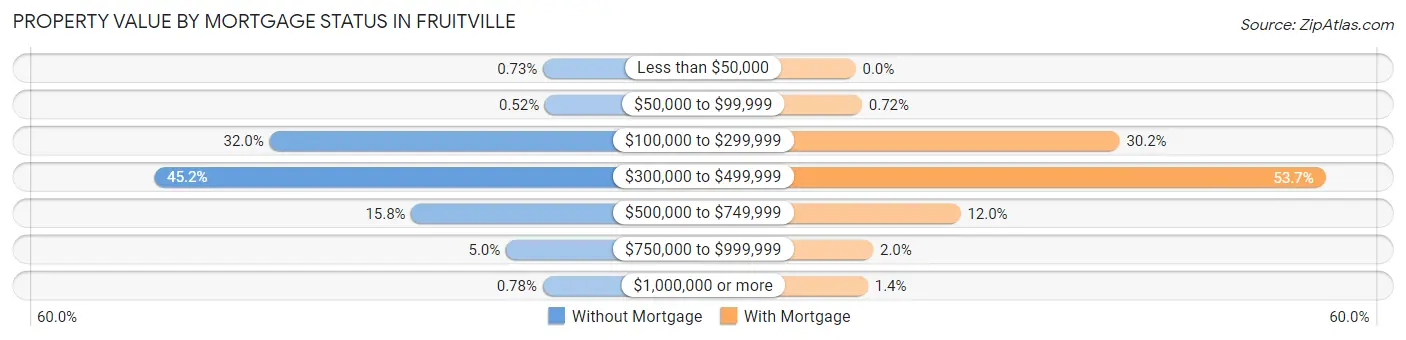
| Property Value | Without Mortgage | With Mortgage |
| Less than $50,000 | 14 (0.7%) | 0 (0.0%) |
| $50,000 to $99,999 | 10 (0.5%) | 17 (0.7%) |
| $100,000 to $299,999 | 612 (32.0%) | 709 (30.2%) |
| $300,000 to $499,999 | 864 (45.2%) | 1,263 (53.7%) |
| $500,000 to $749,999 | 302 (15.8%) | 282 (12.0%) |
| $750,000 to $999,999 | 95 (5.0%) | 47 (2.0%) |
| $1,000,000 or more | 15 (0.8%) | 33 (1.4%) |
| Total | 1,912 (100.0%) | 2,351 (100.0%) |
Household Income by Mortgage Status in Fruitville
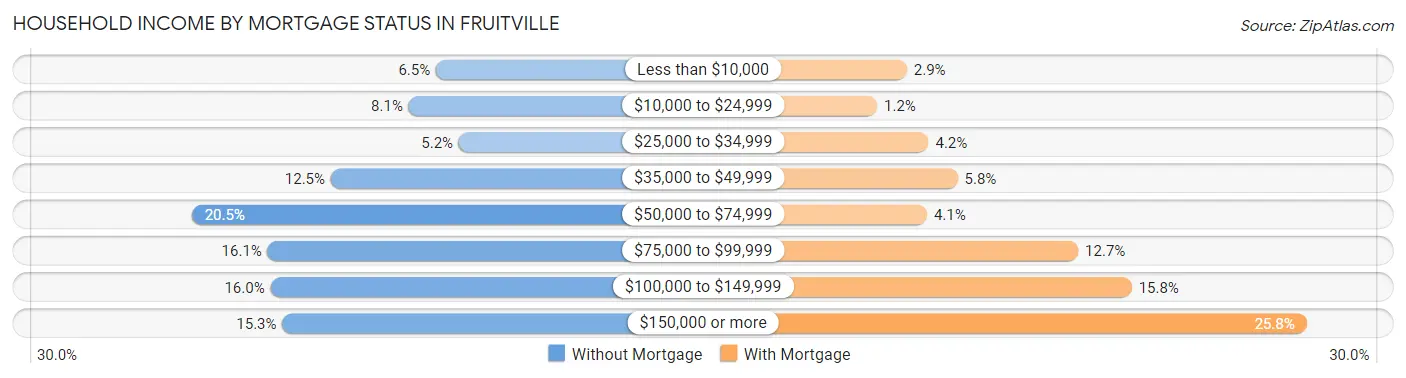
| Household Income | Without Mortgage | With Mortgage |
| Less than $10,000 | 124 (6.5%) | 69 (2.9%) |
| $10,000 to $24,999 | 154 (8.1%) | 29 (1.2%) |
| $25,000 to $34,999 | 99 (5.2%) | 98 (4.2%) |
| $35,000 to $49,999 | 239 (12.5%) | 137 (5.8%) |
| $50,000 to $74,999 | 391 (20.4%) | 96 (4.1%) |
| $75,000 to $99,999 | 308 (16.1%) | 299 (12.7%) |
| $100,000 to $149,999 | 305 (16.0%) | 371 (15.8%) |
| $150,000 or more | 292 (15.3%) | 606 (25.8%) |
| Total | 1,912 (100.0%) | 2,351 (100.0%) |
Property Value to Household Income Ratio in Fruitville
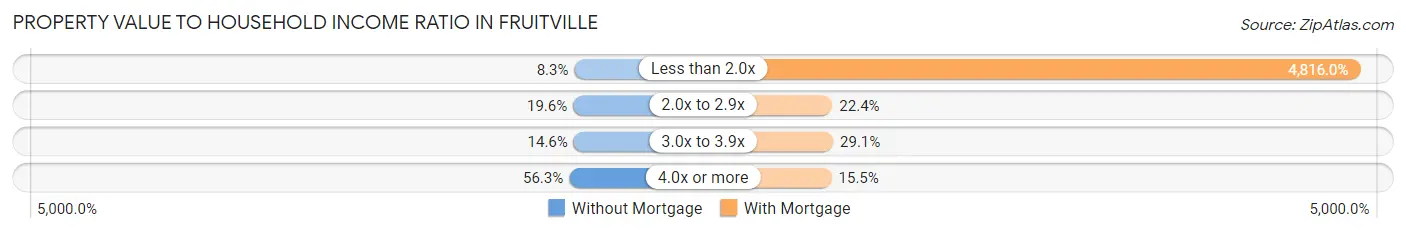
| Value-to-Income Ratio | Without Mortgage | With Mortgage |
| Less than 2.0x | 159 (8.3%) | 113,225 (4,816.0%) |
| 2.0x to 2.9x | 374 (19.6%) | 526 (22.4%) |
| 3.0x to 3.9x | 279 (14.6%) | 684 (29.1%) |
| 4.0x or more | 1,076 (56.3%) | 364 (15.5%) |
| Total | 1,912 (100.0%) | 2,351 (100.0%) |
Real Estate Taxes by Mortgage Status in Fruitville
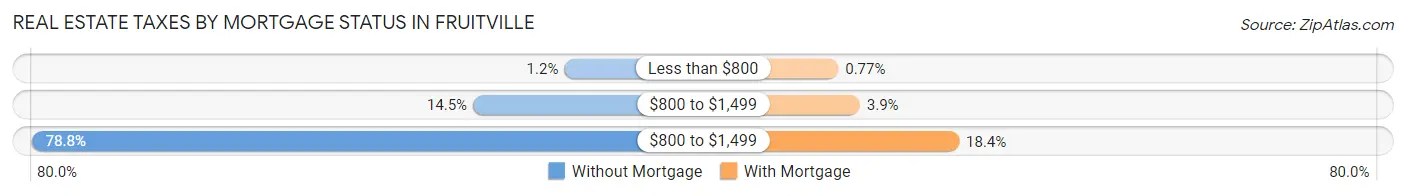
| Property Taxes | Without Mortgage | With Mortgage |
| Less than $800 | 22 (1.1%) | 18 (0.8%) |
| $800 to $1,499 | 277 (14.5%) | 92 (3.9%) |
| $800 to $1,499 | 1,507 (78.8%) | 433 (18.4%) |
| Total | 1,912 (100.0%) | 2,351 (100.0%) |
Health & Disability in Fruitville
Health Insurance Coverage by Age in Fruitville
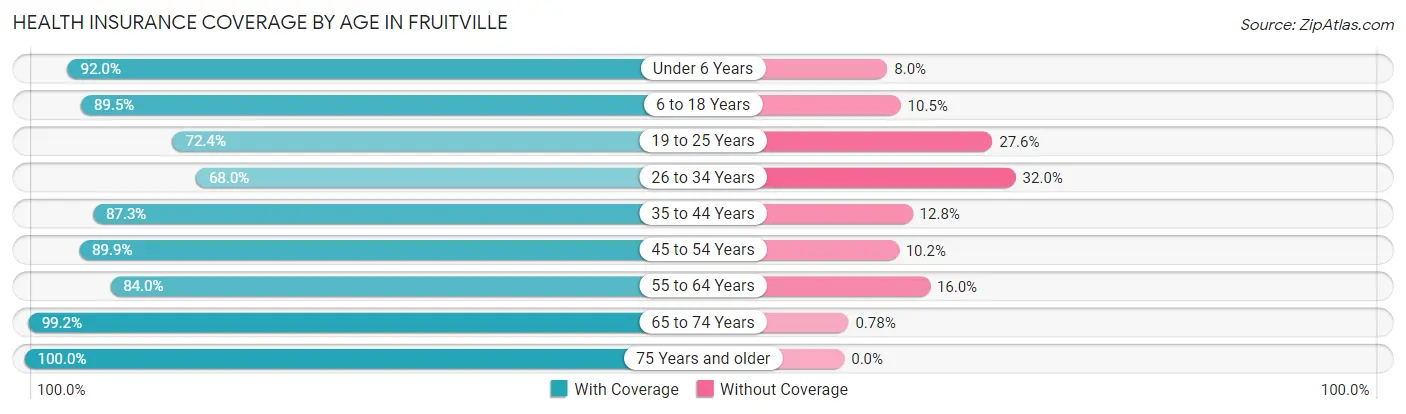
| Age Bracket | With Coverage | Without Coverage |
| Under 6 Years | 974 (92.0%) | 85 (8.0%) |
| 6 to 18 Years | 1,499 (89.5%) | 176 (10.5%) |
| 19 to 25 Years | 876 (72.4%) | 334 (27.6%) |
| 26 to 34 Years | 1,092 (68.0%) | 513 (32.0%) |
| 35 to 44 Years | 1,601 (87.3%) | 234 (12.8%) |
| 45 to 54 Years | 1,399 (89.8%) | 158 (10.2%) |
| 55 to 64 Years | 2,137 (84.0%) | 406 (16.0%) |
| 65 to 74 Years | 1,658 (99.2%) | 13 (0.8%) |
| 75 Years and older | 1,941 (100.0%) | 0 (0.0%) |
| Total | 13,177 (87.3%) | 1,919 (12.7%) |
Health Insurance Coverage by Citizenship Status in Fruitville
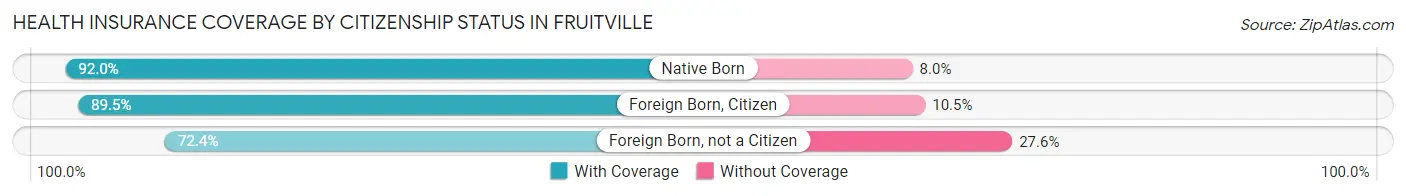
| Citizenship Status | With Coverage | Without Coverage |
| Native Born | 974 (92.0%) | 85 (8.0%) |
| Foreign Born, Citizen | 1,499 (89.5%) | 176 (10.5%) |
| Foreign Born, not a Citizen | 876 (72.4%) | 334 (27.6%) |
Health Insurance Coverage by Household Income in Fruitville
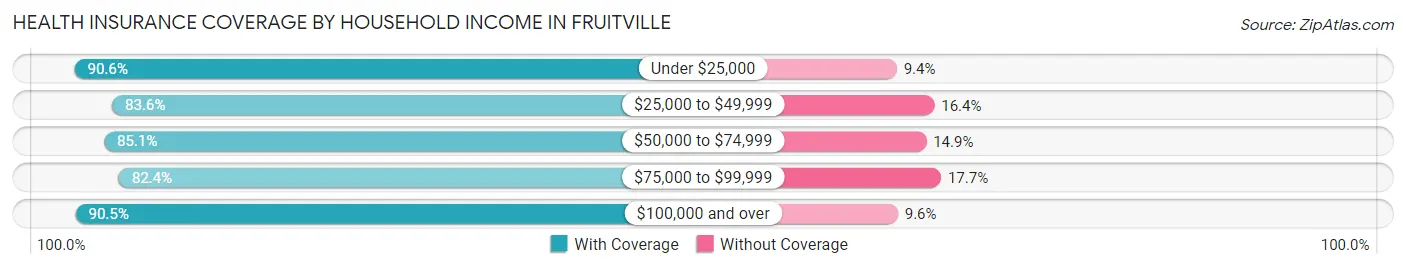
| Household Income | With Coverage | Without Coverage |
| Under $25,000 | 891 (90.6%) | 92 (9.4%) |
| $25,000 to $49,999 | 1,500 (83.6%) | 294 (16.4%) |
| $50,000 to $74,999 | 1,956 (85.1%) | 342 (14.9%) |
| $75,000 to $99,999 | 2,225 (82.4%) | 477 (17.6%) |
| $100,000 and over | 6,595 (90.4%) | 696 (9.6%) |
Public vs Private Health Insurance Coverage by Age in Fruitville
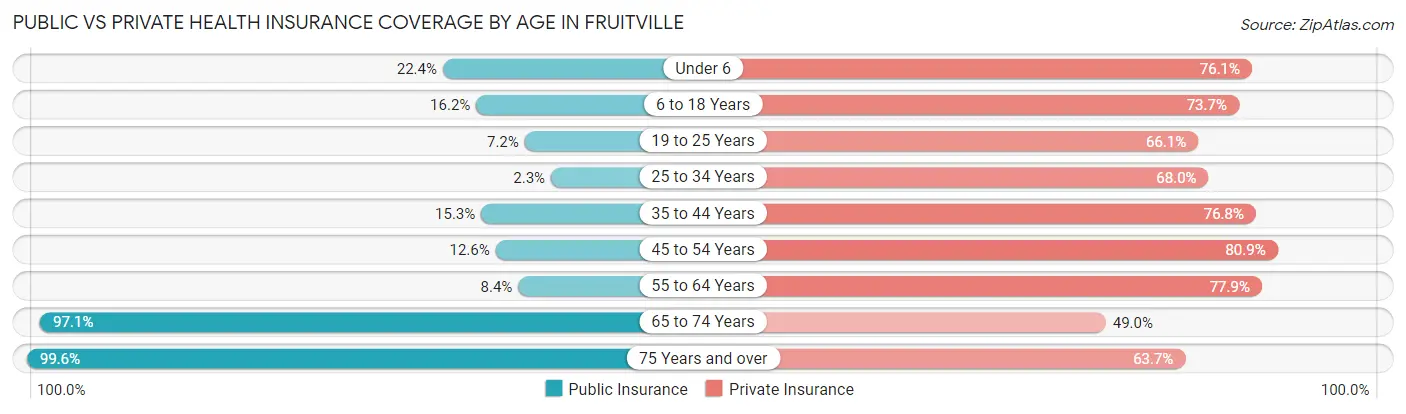
| Age Bracket | Public Insurance | Private Insurance |
| Under 6 | 237 (22.4%) | 806 (76.1%) |
| 6 to 18 Years | 271 (16.2%) | 1,234 (73.7%) |
| 19 to 25 Years | 87 (7.2%) | 800 (66.1%) |
| 25 to 34 Years | 37 (2.3%) | 1,092 (68.0%) |
| 35 to 44 Years | 280 (15.3%) | 1,410 (76.8%) |
| 45 to 54 Years | 196 (12.6%) | 1,259 (80.9%) |
| 55 to 64 Years | 213 (8.4%) | 1,982 (77.9%) |
| 65 to 74 Years | 1,623 (97.1%) | 819 (49.0%) |
| 75 Years and over | 1,933 (99.6%) | 1,237 (63.7%) |
| Total | 4,877 (32.3%) | 10,639 (70.5%) |
Disability Status by Sex by Age in Fruitville
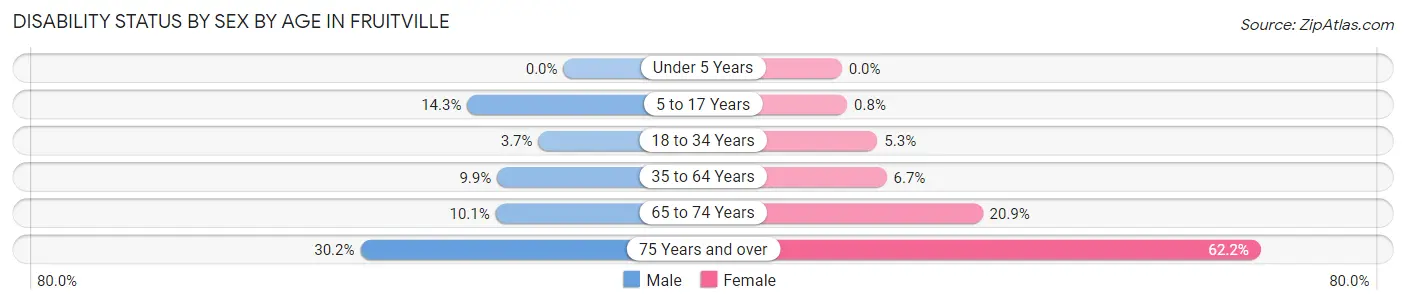
| Age Bracket | Male | Female |
| Under 5 Years | 0 (0.0%) | 0 (0.0%) |
| 5 to 17 Years | 154 (14.3%) | 5 (0.8%) |
| 18 to 34 Years | 48 (3.7%) | 88 (5.3%) |
| 35 to 64 Years | 299 (9.9%) | 193 (6.7%) |
| 65 to 74 Years | 70 (10.1%) | 204 (20.9%) |
| 75 Years and over | 224 (30.1%) | 745 (62.2%) |
Disability Class by Sex by Age in Fruitville
Disability Class: Hearing Difficulty
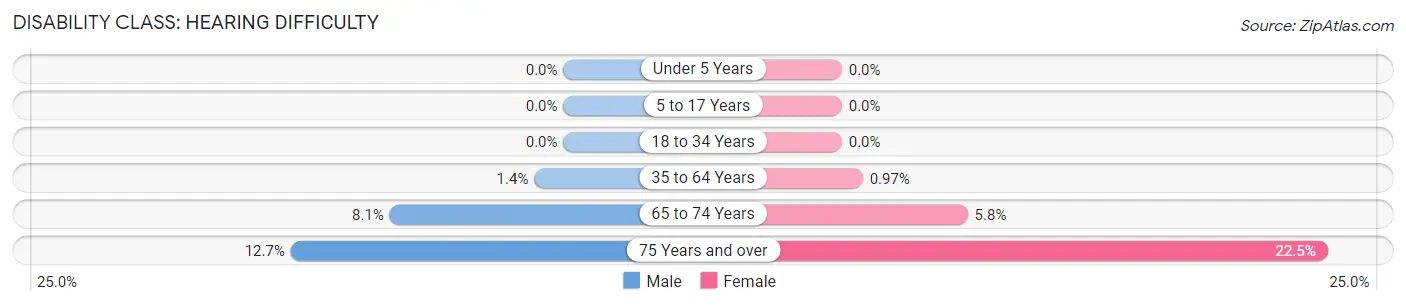
| Age Bracket | Male | Female |
| Under 5 Years | 0 (0.0%) | 0 (0.0%) |
| 5 to 17 Years | 0 (0.0%) | 0 (0.0%) |
| 18 to 34 Years | 0 (0.0%) | 0 (0.0%) |
| 35 to 64 Years | 41 (1.3%) | 28 (1.0%) |
| 65 to 74 Years | 56 (8.1%) | 57 (5.8%) |
| 75 Years and over | 94 (12.7%) | 270 (22.5%) |
Disability Class: Vision Difficulty
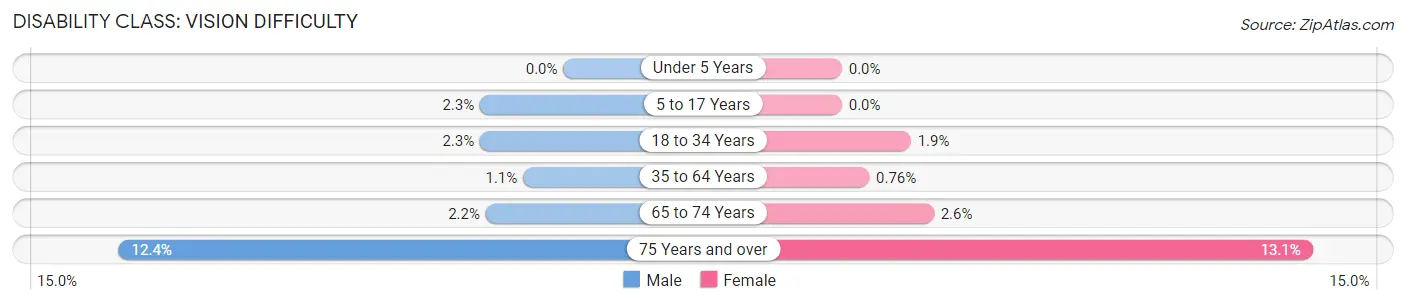
| Age Bracket | Male | Female |
| Under 5 Years | 0 (0.0%) | 0 (0.0%) |
| 5 to 17 Years | 25 (2.3%) | 0 (0.0%) |
| 18 to 34 Years | 30 (2.3%) | 32 (1.9%) |
| 35 to 64 Years | 34 (1.1%) | 22 (0.8%) |
| 65 to 74 Years | 15 (2.2%) | 25 (2.6%) |
| 75 Years and over | 92 (12.4%) | 157 (13.1%) |
Disability Class: Cognitive Difficulty
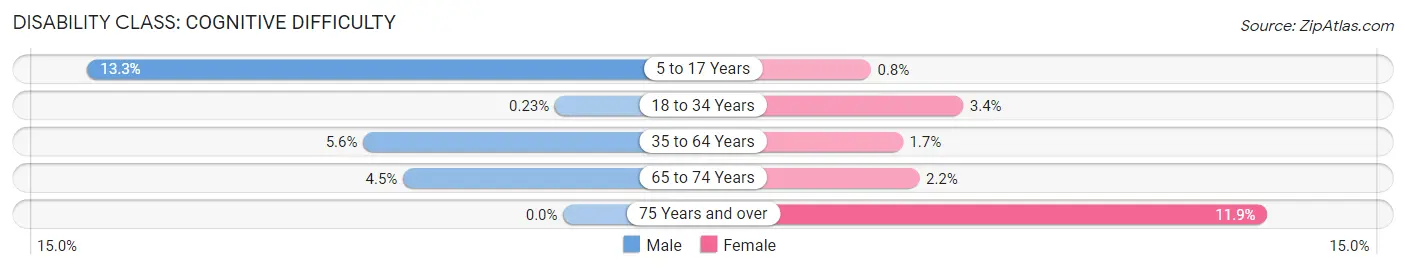
| Age Bracket | Male | Female |
| 5 to 17 Years | 143 (13.3%) | 5 (0.8%) |
| 18 to 34 Years | 3 (0.2%) | 56 (3.4%) |
| 35 to 64 Years | 169 (5.6%) | 49 (1.7%) |
| 65 to 74 Years | 31 (4.5%) | 21 (2.1%) |
| 75 Years and over | 0 (0.0%) | 142 (11.8%) |
Disability Class: Ambulatory Difficulty
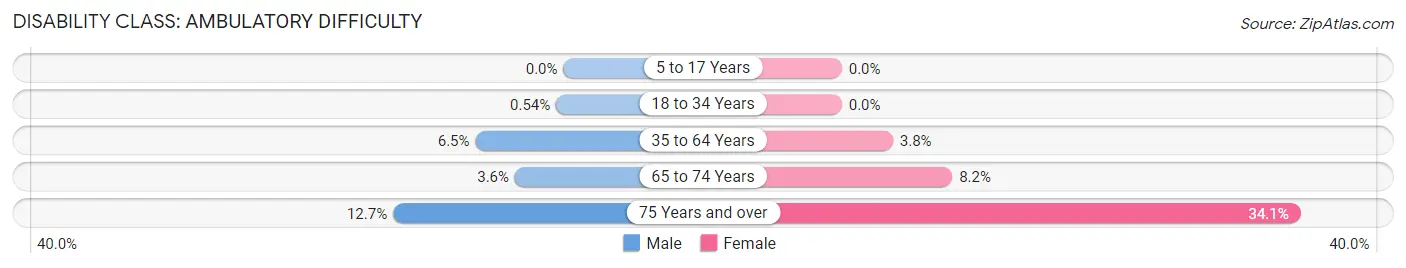
| Age Bracket | Male | Female |
| 5 to 17 Years | 0 (0.0%) | 0 (0.0%) |
| 18 to 34 Years | 7 (0.5%) | 0 (0.0%) |
| 35 to 64 Years | 198 (6.5%) | 110 (3.8%) |
| 65 to 74 Years | 25 (3.6%) | 80 (8.2%) |
| 75 Years and over | 94 (12.7%) | 408 (34.1%) |
Disability Class: Self-Care Difficulty
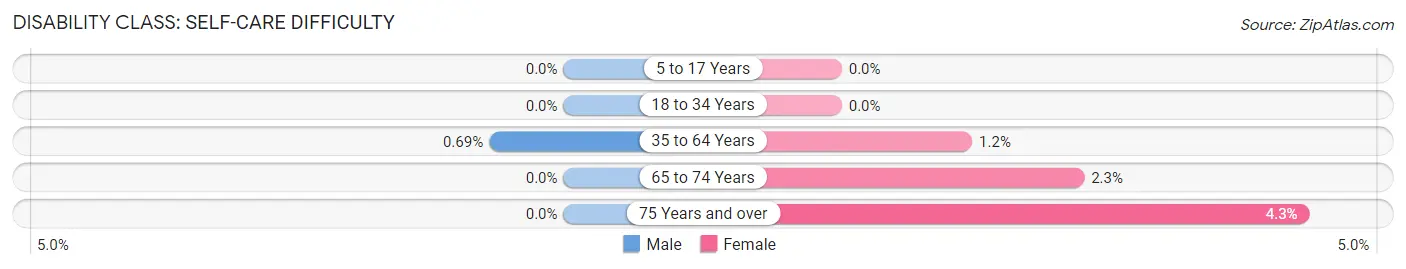
| Age Bracket | Male | Female |
| 5 to 17 Years | 0 (0.0%) | 0 (0.0%) |
| 18 to 34 Years | 0 (0.0%) | 0 (0.0%) |
| 35 to 64 Years | 21 (0.7%) | 35 (1.2%) |
| 65 to 74 Years | 0 (0.0%) | 22 (2.2%) |
| 75 Years and over | 0 (0.0%) | 52 (4.3%) |
Technology Access in Fruitville
Computing Device Access in Fruitville
| Device Type | # Households | % Households |
| Desktop or Laptop | 5,999 | 88.8% |
| Smartphone | 5,907 | 87.4% |
| Tablet | 4,229 | 62.6% |
| No Computing Device | 433 | 6.4% |
| Total | 6,757 | 100.0% |
Internet Access in Fruitville
| Internet Type | # Households | % Households |
| Dial-Up Internet | 7 | 0.1% |
| Broadband Home | 5,694 | 84.3% |
| Cellular Data Only | 368 | 5.4% |
| Satellite Internet | 163 | 2.4% |
| No Internet | 633 | 9.4% |
| Total | 6,757 | 100.0% |
Fruitville Summary
Fruitville is a small unincorporated community located in Sarasota County, Florida. It is located just east of the city of Sarasota and is part of the Bradenton-Sarasota-Venice Metropolitan Statistical Area. The population of Fruitville was estimated to be 1,845 in 2019.
Geography
Fruitville is located at 27°20'45"N 82°31'45"W (27.3458, -82.5294). It is situated in the central part of Sarasota County, just east of the city of Sarasota. The community is bordered by the Myakka River to the north, the Sarasota-Bradenton International Airport to the east, and the city of Sarasota to the west. The community is located at an elevation of 11 feet (3.4 m) above sea level.
The climate in Fruitville is classified as humid subtropical, with hot, humid summers and mild, dry winters. The average annual temperature is 73.2°F (22.9°C), with an average high of 81.7°F (27.6°C) and an average low of 64.7°F (18.2°C). The average annual precipitation is 54.3 inches (137.9 cm).
Economy
Fruitville is primarily a residential community, with most of its residents commuting to nearby cities for work. The largest employers in the area are Sarasota Memorial Hospital, Sarasota County Schools, and the Sarasota-Bradenton International Airport. Other major employers include Publix Super Markets, Sarasota County Government, and the University of South Florida.
Demographics
As of the 2010 census, Fruitville had a population of 1,845. The racial makeup of the community was 79.2% White, 11.2% African American, 0.3% Native American, 2.2% Asian, 0.1% Pacific Islander, 4.7% from other races, and 2.3% from two or more races. Hispanic or Latino of any race were 11.2% of the population.
The median household income in Fruitville was $50,945 in 2019, with a poverty rate of 8.3%. The median age of the population was 44.3 years, with 24.3% of the population under the age of 18 and 11.2% over the age of 65.
Conclusion
Fruitville is a small unincorporated community located in Sarasota County, Florida. It is located just east of the city of Sarasota and is part of the Bradenton-Sarasota-Venice Metropolitan Statistical Area. The population of Fruitville was estimated to be 1,845 in 2019. The community is primarily residential, with most of its residents commuting to nearby cities for work. The largest employers in the area are Sarasota Memorial Hospital, Sarasota County Schools, and the Sarasota-Bradenton International Airport. The racial makeup of the community was 79.2% White, 11.2% African American, 0.3% Native American, 2.2% Asian, 0.1% Pacific Islander, 4.7% from other races, and 2.3% from two or more races. The median household income in Fruitville was $50,945 in 2019, with a poverty rate of 8.3%. Fruitville is a diverse and vibrant community that offers its residents a high quality of life.
Common Questions
What is the Total Population of Fruitville?
Total Population of Fruitville is 15,333.
What is the Total Male Population of Fruitville?
Total Male Population of Fruitville is 7,503.
What is the Total Female Population of Fruitville?
Total Female Population of Fruitville is 7,830.
What is the Ratio of Males per 100 Females in Fruitville?
There are 95.82 Males per 100 Females in Fruitville.
What is the Ratio of Females per 100 Males in Fruitville?
There are 104.36 Females per 100 Males in Fruitville.
What is the Median Population Age in Fruitville?
Median Population Age in Fruitville is 47.4 Years.
What is the Average Family Size in Fruitville
Average Family Size in Fruitville is 2.8 People.
What is the Average Household Size in Fruitville
Average Household Size in Fruitville is 2.2 People.
What is Per Capita Income in Fruitville?
Per Capita income in Fruitville is $45,809.
What is the Median Family Income in Fruitville?
Median Family Income in Fruitville is $102,161.
What is the Median Household income in Fruitville?
Median Household Income in Fruitville is $84,070.
What is Income or Wage Gap in Fruitville?
Income or Wage Gap in Fruitville is 32.2%.
Women in Fruitville earn 67.8 cents for every dollar earned by a man.
What is Inequality or Gini Index in Fruitville?
Inequality or Gini Index in Fruitville is 0.42.
How Large is the Labor Force in Fruitville?
There are 8,270 People in the Labor Forcein in Fruitville.
What is the Percentage of People in the Labor Force in Fruitville?
63.1% of People are in the Labor Force in Fruitville.
What is the Unemployment Rate in Fruitville?
Unemployment Rate in Fruitville is 2.7%.