South Venice, FL
South Venice Map
South Venice Overview
17,469
TOTAL POPULATION
8,573
MALE POPULATION
8,896
FEMALE POPULATION
96.37
MALES / 100 FEMALES
103.77
FEMALES / 100 MALES
49.6
MEDIAN AGE
2.8
AVG FAMILY SIZE
2.4
AVG HOUSEHOLD SIZE
$39,385
PER CAPITA INCOME
$80,040
AVG FAMILY INCOME
$71,241
AVG HOUSEHOLD INCOME
40.0%
WAGE / INCOME GAP [ % ]
60.0¢/ $1
WAGE / INCOME GAP [ $ ]
0.46
INEQUALITY / GINI INDEX
9,086
LABOR FORCE [ PEOPLE ]
61.9%
PERCENT IN LABOR FORCE
3.5%
UNEMPLOYMENT RATE
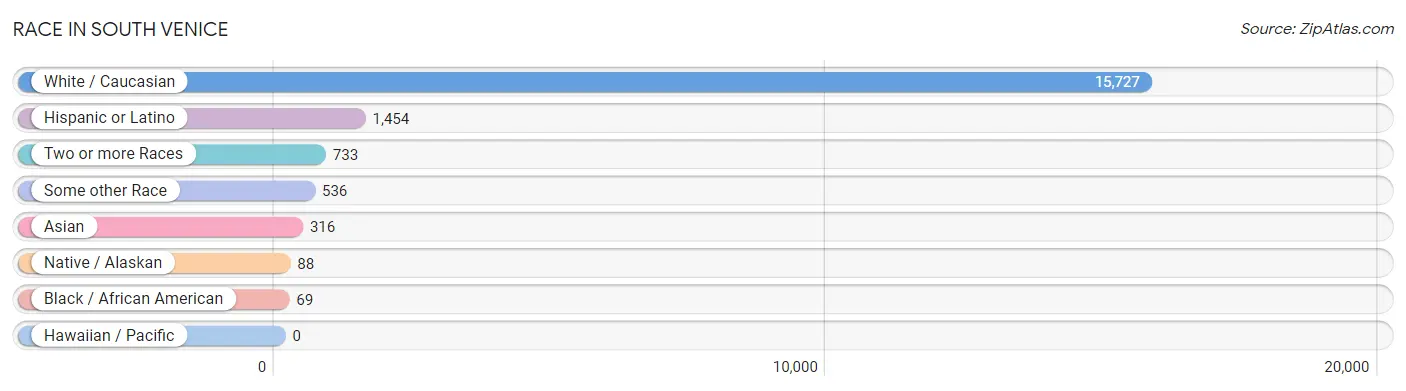
Race in South Venice
The most populous races in South Venice are White / Caucasian (15,727 | 90.0%), Hispanic or Latino (1,454 | 8.3%), and Two or more Races (733 | 4.2%).
| Race | # Population | % Population |
| Asian | 316 | 1.8% |
| Black / African American | 69 | 0.4% |
| Hawaiian / Pacific | 0 | 0.0% |
| Hispanic or Latino | 1,454 | 8.3% |
| Native / Alaskan | 88 | 0.5% |
| White / Caucasian | 15,727 | 90.0% |
| Two or more Races | 733 | 4.2% |
| Some other Race | 536 | 3.1% |
| Total | 17,469 | 100.0% |
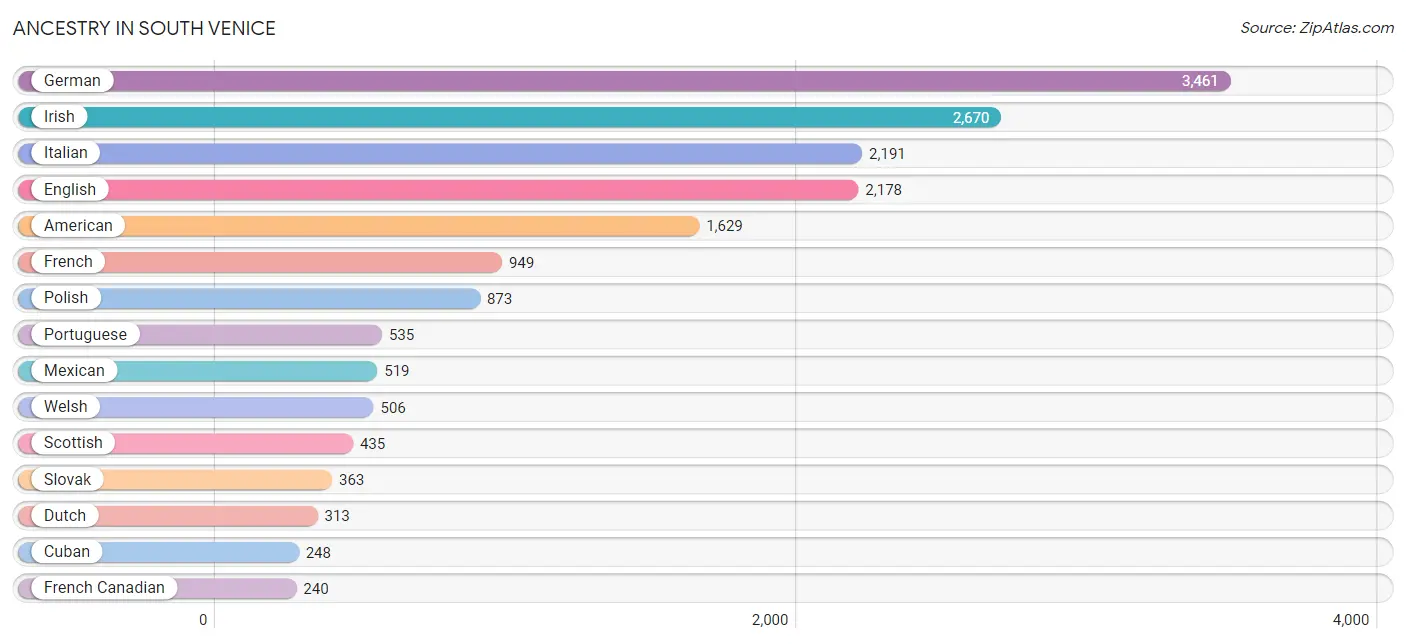
Ancestry in South Venice
The most populous ancestries reported in South Venice are German (3,461 | 19.8%), Irish (2,670 | 15.3%), Italian (2,191 | 12.5%), English (2,178 | 12.5%), and American (1,629 | 9.3%), together accounting for 69.4% of all South Venice residents.
| Ancestry | # Population | % Population |
| Alsatian | 8 | 0.1% |
| American | 1,629 | 9.3% |
| Arab | 144 | 0.8% |
| Argentinean | 153 | 0.9% |
| Armenian | 27 | 0.2% |
| Austrian | 38 | 0.2% |
| Basque | 27 | 0.2% |
| Belgian | 9 | 0.1% |
| British | 138 | 0.8% |
| Bulgarian | 11 | 0.1% |
| Burmese | 36 | 0.2% |
| Canadian | 13 | 0.1% |
| Central American | 154 | 0.9% |
| Central American Indian | 53 | 0.3% |
| Cherokee | 92 | 0.5% |
| Chippewa | 26 | 0.2% |
| Colombian | 6 | 0.0% |
| Creek | 14 | 0.1% |
| Cuban | 248 | 1.4% |
| Czech | 115 | 0.7% |
| Czechoslovakian | 6 | 0.0% |
| Danish | 43 | 0.3% |
| Dutch | 313 | 1.8% |
| Eastern European | 41 | 0.2% |
| English | 2,178 | 12.5% |
| European | 163 | 0.9% |
| Finnish | 10 | 0.1% |
| French | 949 | 5.4% |
| French Canadian | 240 | 1.4% |
| German | 3,461 | 19.8% |
| Greek | 73 | 0.4% |
| Guatemalan | 149 | 0.9% |
| Hungarian | 206 | 1.2% |
| Indian (Asian) | 124 | 0.7% |
| Irish | 2,670 | 15.3% |
| Italian | 2,191 | 12.5% |
| Jamaican | 8 | 0.1% |
| Korean | 64 | 0.4% |
| Lithuanian | 69 | 0.4% |
| Macedonian | 6 | 0.0% |
| Mexican | 519 | 3.0% |
| Moroccan | 13 | 0.1% |
| Northern European | 7 | 0.0% |
| Norwegian | 203 | 1.2% |
| Polish | 873 | 5.0% |
| Portuguese | 535 | 3.1% |
| Puerto Rican | 231 | 1.3% |
| Romanian | 12 | 0.1% |
| Russian | 156 | 0.9% |
| Salvadoran | 5 | 0.0% |
| Scandinavian | 79 | 0.4% |
| Scotch-Irish | 129 | 0.7% |
| Scottish | 435 | 2.5% |
| Serbian | 29 | 0.2% |
| Sioux | 14 | 0.1% |
| Slavic | 32 | 0.2% |
| Slovak | 363 | 2.1% |
| South American | 167 | 1.0% |
| South American Indian | 15 | 0.1% |
| Spaniard | 55 | 0.3% |
| Spanish | 38 | 0.2% |
| Sri Lankan | 182 | 1.0% |
| Swedish | 164 | 0.9% |
| Swiss | 76 | 0.4% |
| Ukrainian | 81 | 0.5% |
| Venezuelan | 8 | 0.1% |
| Welsh | 506 | 2.9% | View All 67 Rows |
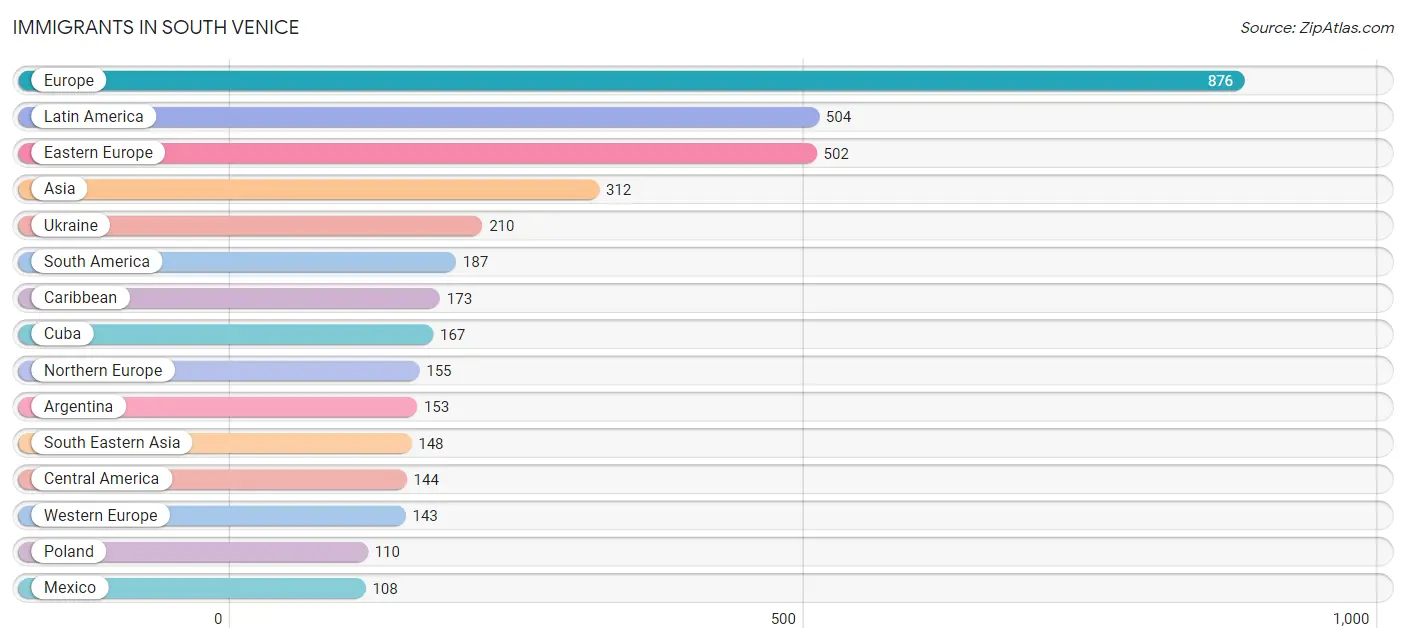
Immigrants in South Venice
The most numerous immigrant groups reported in South Venice came from Europe (876 | 5.0%), Latin America (504 | 2.9%), Eastern Europe (502 | 2.9%), Asia (312 | 1.8%), and Ukraine (210 | 1.2%), together accounting for 13.8% of all South Venice residents.
| Immigration Origin | # Population | % Population |
| Africa | 44 | 0.3% |
| Argentina | 153 | 0.9% |
| Asia | 312 | 1.8% |
| Bahamas | 6 | 0.0% |
| Bosnia and Herzegovina | 10 | 0.1% |
| Bulgaria | 11 | 0.1% |
| Canada | 97 | 0.6% |
| Caribbean | 173 | 1.0% |
| Central America | 144 | 0.8% |
| China | 51 | 0.3% |
| Colombia | 6 | 0.0% |
| Cuba | 167 | 1.0% |
| Czechoslovakia | 5 | 0.0% |
| Eastern Asia | 70 | 0.4% |
| Eastern Europe | 502 | 2.9% |
| El Salvador | 5 | 0.0% |
| England | 10 | 0.1% |
| Europe | 876 | 5.0% |
| France | 65 | 0.4% |
| Germany | 53 | 0.3% |
| Greece | 35 | 0.2% |
| Guatemala | 31 | 0.2% |
| Hong Kong | 14 | 0.1% |
| Hungary | 40 | 0.2% |
| Ireland | 30 | 0.2% |
| Italy | 30 | 0.2% |
| Kazakhstan | 94 | 0.5% |
| Korea | 19 | 0.1% |
| Latin America | 504 | 2.9% |
| Latvia | 9 | 0.1% |
| Mexico | 108 | 0.6% |
| Moldova | 39 | 0.2% |
| Morocco | 13 | 0.1% |
| Netherlands | 25 | 0.1% |
| Northern Africa | 13 | 0.1% |
| Northern Europe | 155 | 0.9% |
| Philippines | 64 | 0.4% |
| Poland | 110 | 0.6% |
| Portugal | 11 | 0.1% |
| Romania | 6 | 0.0% |
| Russia | 62 | 0.4% |
| South Africa | 31 | 0.2% |
| South America | 187 | 1.1% |
| South Central Asia | 94 | 0.5% |
| South Eastern Asia | 148 | 0.9% |
| Southern Europe | 76 | 0.4% |
| Sweden | 88 | 0.5% |
| Ukraine | 210 | 1.2% |
| Venezuela | 13 | 0.1% |
| Vietnam | 84 | 0.5% |
| Western Europe | 143 | 0.8% | View All 51 Rows |
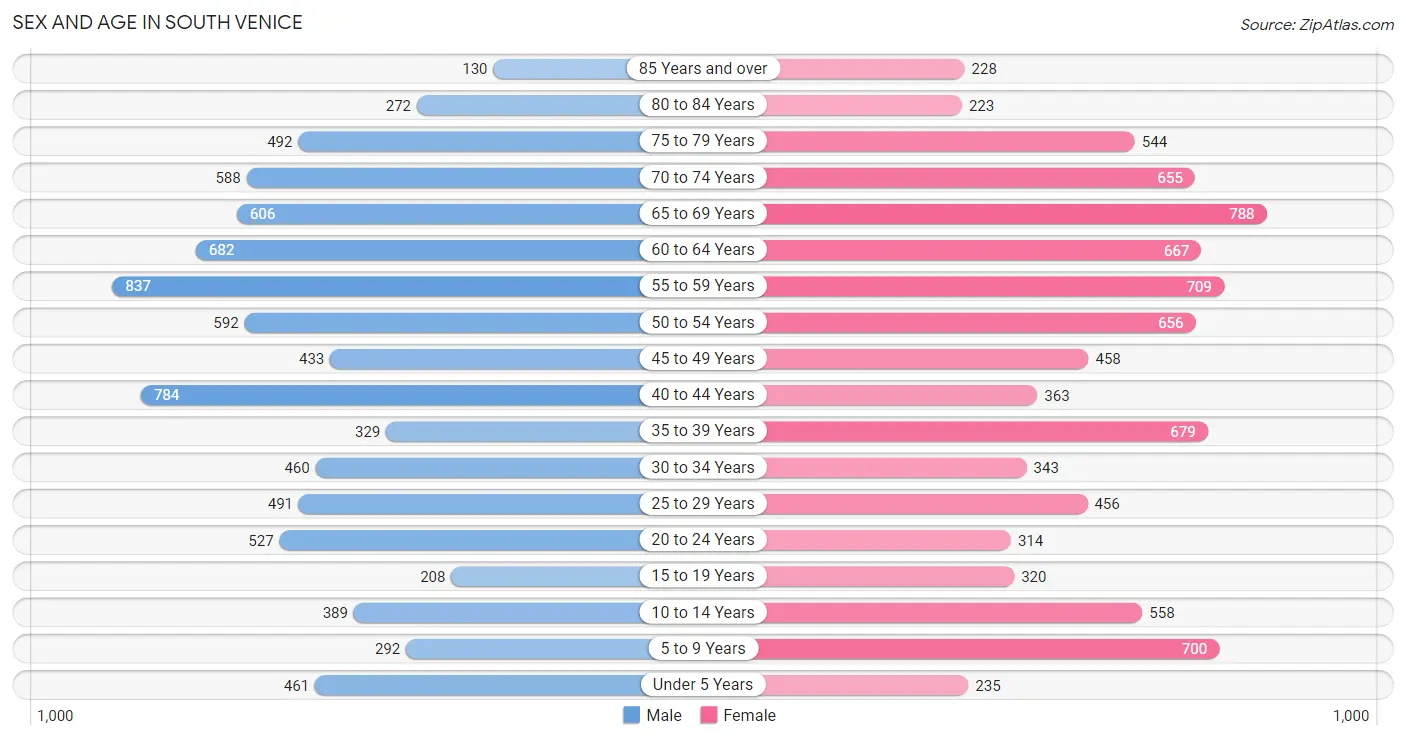
Sex and Age in South Venice
Sex and Age in South Venice
The most populous age groups in South Venice are 55 to 59 Years (837 | 9.8%) for men and 65 to 69 Years (788 | 8.9%) for women.
| Age Bracket | Male | Female |
| Under 5 Years | 461 (5.4%) | 235 (2.6%) |
| 5 to 9 Years | 292 (3.4%) | 700 (7.9%) |
| 10 to 14 Years | 389 (4.5%) | 558 (6.3%) |
| 15 to 19 Years | 208 (2.4%) | 320 (3.6%) |
| 20 to 24 Years | 527 (6.1%) | 314 (3.5%) |
| 25 to 29 Years | 491 (5.7%) | 456 (5.1%) |
| 30 to 34 Years | 460 (5.4%) | 343 (3.9%) |
| 35 to 39 Years | 329 (3.8%) | 679 (7.6%) |
| 40 to 44 Years | 784 (9.1%) | 363 (4.1%) |
| 45 to 49 Years | 433 (5.1%) | 458 (5.1%) |
| 50 to 54 Years | 592 (6.9%) | 656 (7.4%) |
| 55 to 59 Years | 837 (9.8%) | 709 (8.0%) |
| 60 to 64 Years | 682 (8.0%) | 667 (7.5%) |
| 65 to 69 Years | 606 (7.1%) | 788 (8.9%) |
| 70 to 74 Years | 588 (6.9%) | 655 (7.4%) |
| 75 to 79 Years | 492 (5.7%) | 544 (6.1%) |
| 80 to 84 Years | 272 (3.2%) | 223 (2.5%) |
| 85 Years and over | 130 (1.5%) | 228 (2.6%) |
| Total | 8,573 (100.0%) | 8,896 (100.0%) |
Families and Households in South Venice
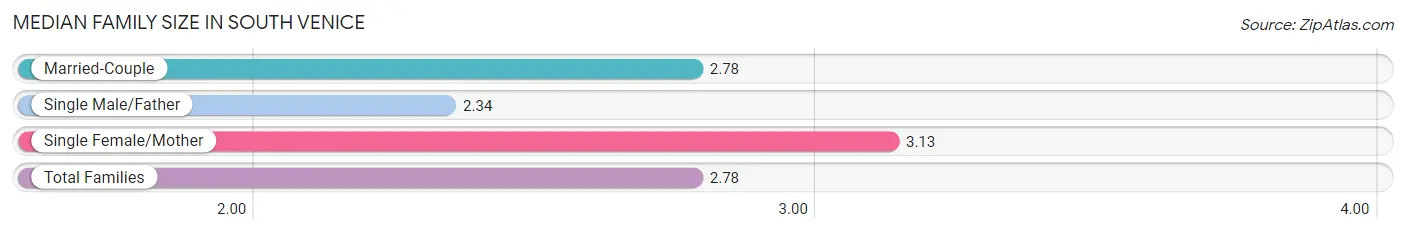
Median Family Size in South Venice
The median family size in South Venice is 2.78 persons per family, with single female/mother families (472 | 9.0%) accounting for the largest median family size of 3.13 persons per family. On the other hand, single male/father families (398 | 7.6%) represent the smallest median family size with 2.34 persons per family.
| Family Type | # Families | Family Size |
| Married-Couple | 4,373 (83.4%) | 2.78 |
| Single Male/Father | 398 (7.6%) | 2.34 |
| Single Female/Mother | 472 (9.0%) | 3.13 |
| Total Families | 5,243 (100.0%) | 2.78 |
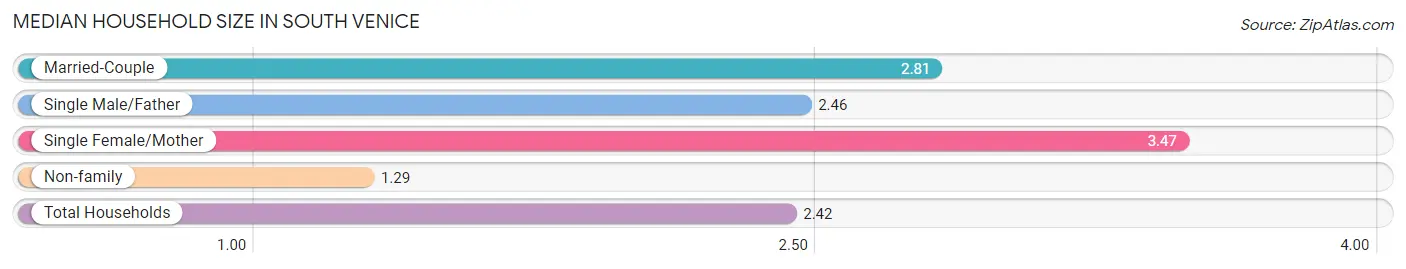
Median Household Size in South Venice
The median household size in South Venice is 2.42 persons per household, with single female/mother households (472 | 6.5%) accounting for the largest median household size of 3.47 persons per household. non-family households (1,975 | 27.4%) represent the smallest median household size with 1.29 persons per household.
| Household Type | # Households | Household Size |
| Married-Couple | 4,373 (60.6%) | 2.81 |
| Single Male/Father | 398 (5.5%) | 2.46 |
| Single Female/Mother | 472 (6.5%) | 3.47 |
| Non-family | 1,975 (27.4%) | 1.29 |
| Total Households | 7,218 (100.0%) | 2.42 |
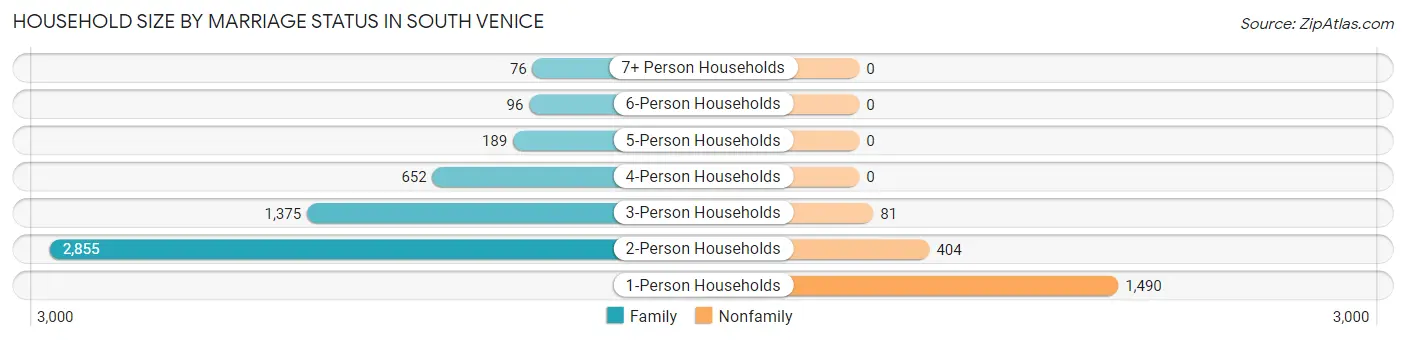
Household Size by Marriage Status in South Venice
Out of a total of 7,218 households in South Venice, 5,243 (72.6%) are family households, while 1,975 (27.4%) are nonfamily households. The most numerous type of family households are 2-person households, comprising 2,855, and the most common type of nonfamily households are 1-person households, comprising 1,490.
| Household Size | Family Households | Nonfamily Households |
| 1-Person Households | - | 1,490 (20.6%) |
| 2-Person Households | 2,855 (39.6%) | 404 (5.6%) |
| 3-Person Households | 1,375 (19.1%) | 81 (1.1%) |
| 4-Person Households | 652 (9.0%) | 0 (0.0%) |
| 5-Person Households | 189 (2.6%) | 0 (0.0%) |
| 6-Person Households | 96 (1.3%) | 0 (0.0%) |
| 7+ Person Households | 76 (1.1%) | 0 (0.0%) |
| Total | 5,243 (72.6%) | 1,975 (27.4%) |
Female Fertility in South Venice
Fertility by Age in South Venice
Average fertility rate in South Venice is 16.0 births per 1,000 women. Women in the age bracket of 20 to 34 years have the highest fertility rate with 21.0 births per 1,000 women. Women in the age bracket of 35 to 50 years acount for 53.1% of all women with births.
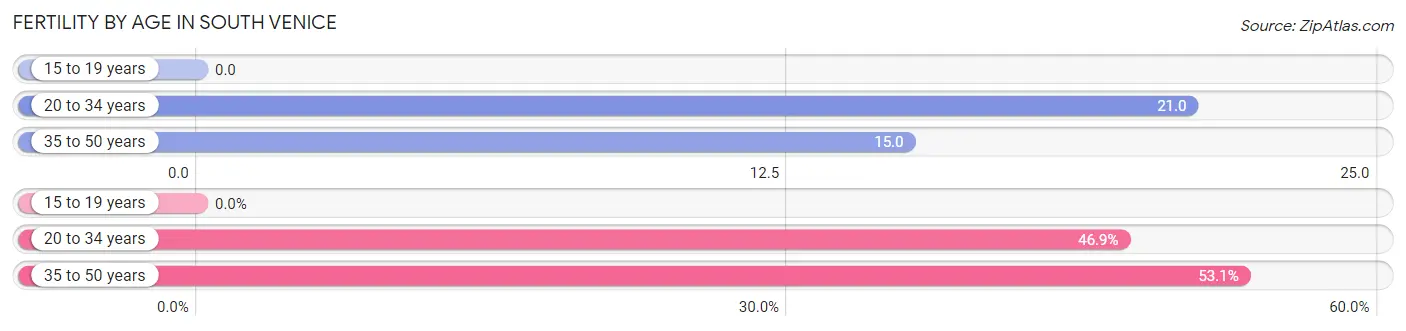
| Age Bracket | Women with Births | Births / 1,000 Women |
| 15 to 19 years | 0 (0.0%) | 0.0 |
| 20 to 34 years | 23 (46.9%) | 21.0 |
| 35 to 50 years | 26 (53.1%) | 15.0 |
| Total | 49 (100.0%) | 16.0 |
Fertility by Age by Marriage Status in South Venice
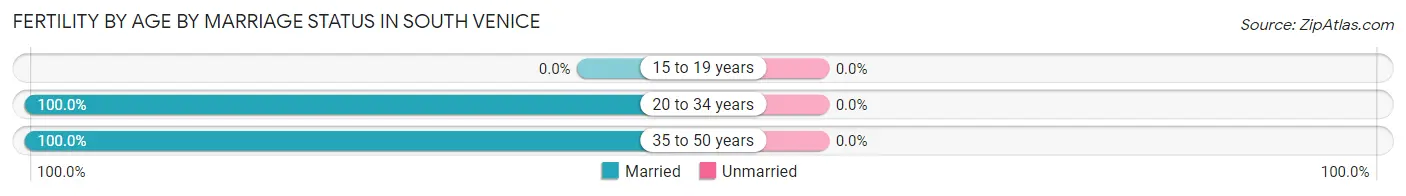
| Age Bracket | Married | Unmarried |
| 15 to 19 years | 0 (0.0%) | 0 (0.0%) |
| 20 to 34 years | 23 (100.0%) | 0 (0.0%) |
| 35 to 50 years | 26 (100.0%) | 0 (0.0%) |
| Total | 49 (100.0%) | 0 (0.0%) |
Fertility by Education in South Venice
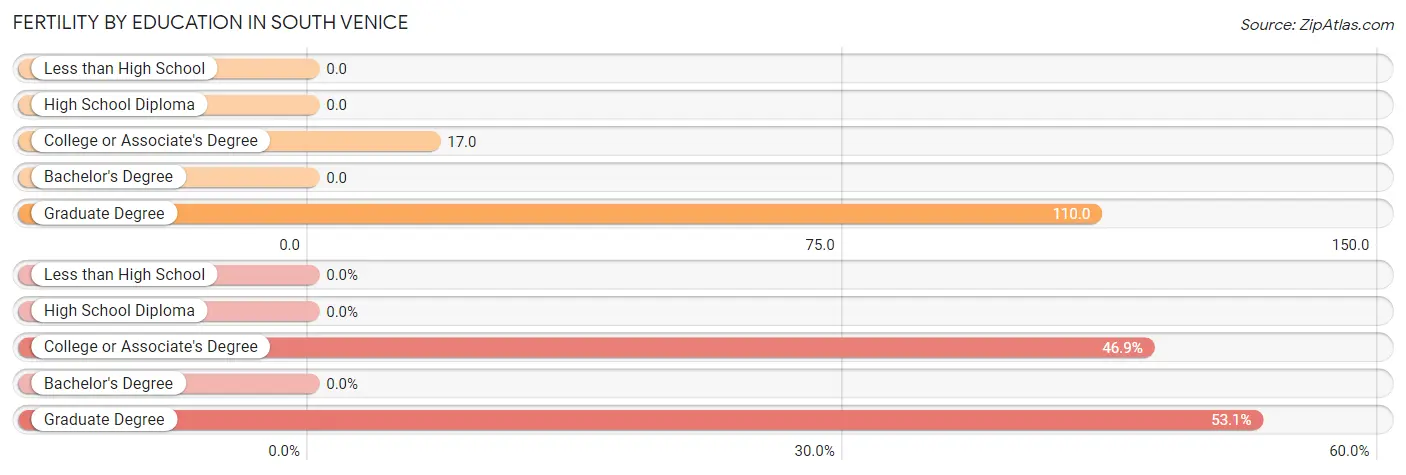
| Educational Attainment | Women with Births | Births / 1,000 Women |
| Less than High School | 0 (0.0%) | 0.0 |
| High School Diploma | 0 (0.0%) | 0.0 |
| College or Associate's Degree | 23 (46.9%) | 17.0 |
| Bachelor's Degree | 0 (0.0%) | 0.0 |
| Graduate Degree | 26 (53.1%) | 110.0 |
| Total | 49 (100.0%) | 16.0 |
Fertility by Education by Marriage Status in South Venice
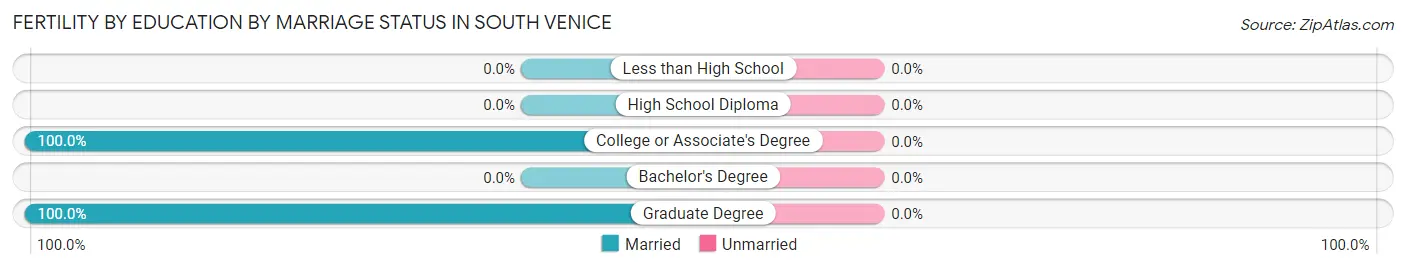
| Educational Attainment | Married | Unmarried |
| Less than High School | 0 (0.0%) | 0 (0.0%) |
| High School Diploma | 0 (0.0%) | 0 (0.0%) |
| College or Associate's Degree | 23 (100.0%) | 0 (0.0%) |
| Bachelor's Degree | 0 (0.0%) | 0 (0.0%) |
| Graduate Degree | 26 (100.0%) | 0 (0.0%) |
| Total | 49 (100.0%) | 0 (0.0%) |
Income in South Venice
Income Overview in South Venice
Per Capita Income in South Venice is $39,385, while median incomes of families and households are $80,040 and $71,241 respectively.
| Characteristic | Number | Measure |
| Per Capita Income | 17,469 | $39,385 |
| Median Family Income | 5,243 | $80,040 |
| Mean Family Income | 5,243 | $105,255 |
| Median Household Income | 7,218 | $71,241 |
| Mean Household Income | 7,218 | $94,248 |
| Income Deficit | 5,243 | $0 |
| Wage / Income Gap (%) | 17,469 | 39.97% |
| Wage / Income Gap ($) | 17,469 | 60.03¢ per $1 |
| Gini / Inequality Index | 17,469 | 0.46 |
Earnings by Sex in South Venice
Average Earnings in South Venice are $34,494, $42,802 for men and $25,692 for women, a difference of 40.0%.
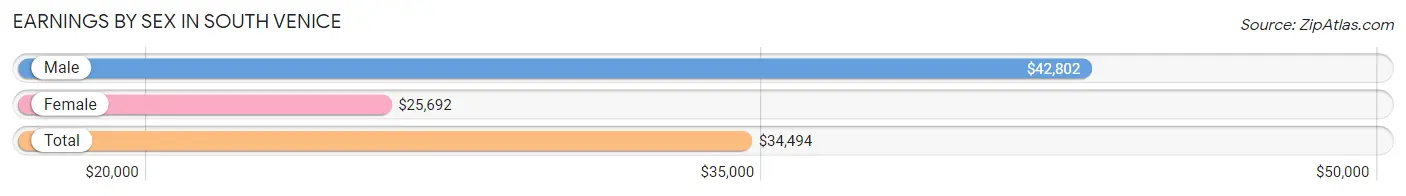
| Sex | Number | Average Earnings |
| Male | 5,143 (53.2%) | $42,802 |
| Female | 4,526 (46.8%) | $25,692 |
| Total | 9,669 (100.0%) | $34,494 |
Earnings by Sex by Income Bracket in South Venice
The most common earnings brackets in South Venice are $65,000 to $74,999 for men (569 | 11.1%) and $17,500 to $19,999 for women (575 | 12.7%).
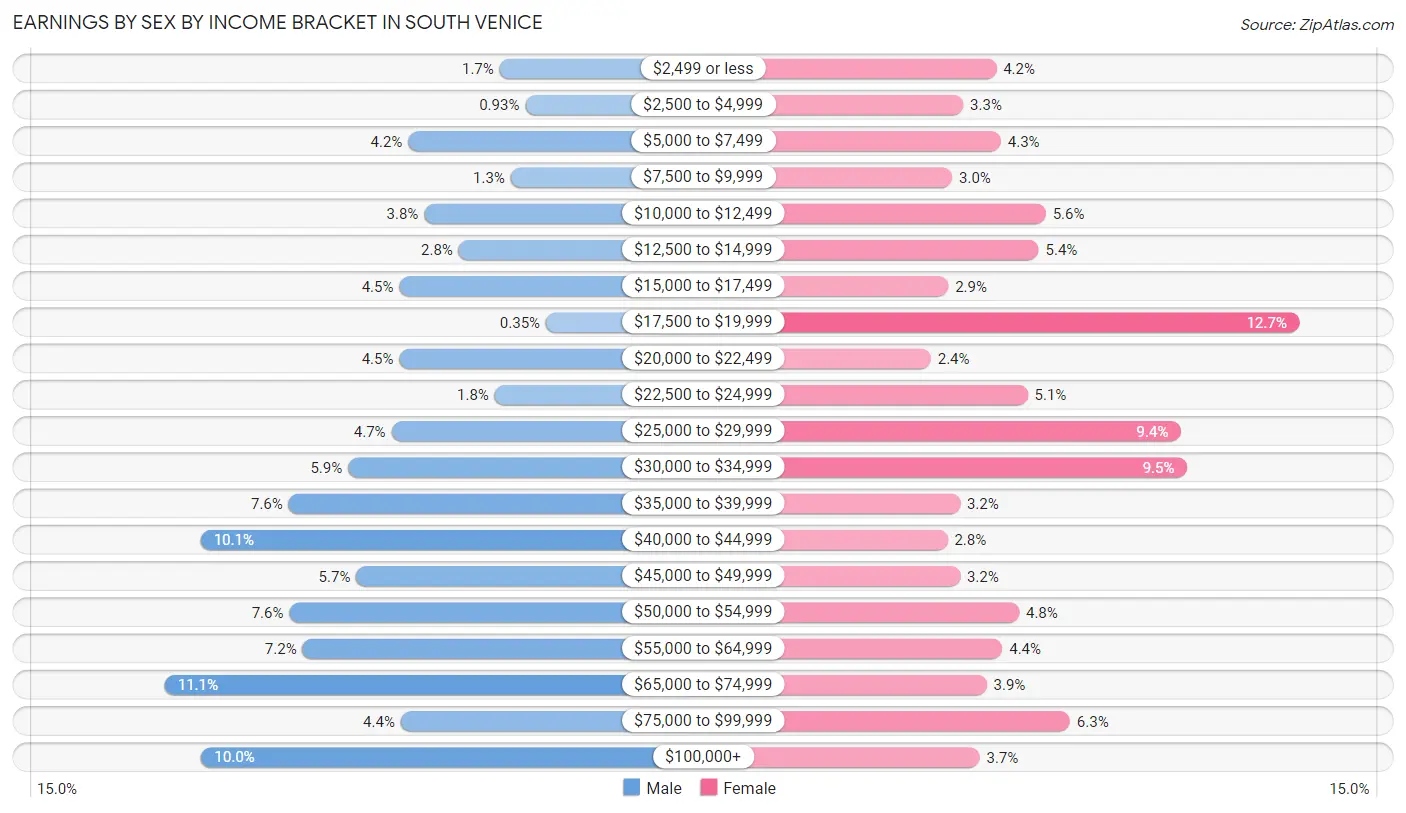
| Income | Male | Female |
| $2,499 or less | 85 (1.7%) | 190 (4.2%) |
| $2,500 to $4,999 | 48 (0.9%) | 148 (3.3%) |
| $5,000 to $7,499 | 217 (4.2%) | 196 (4.3%) |
| $7,500 to $9,999 | 69 (1.3%) | 134 (3.0%) |
| $10,000 to $12,499 | 194 (3.8%) | 253 (5.6%) |
| $12,500 to $14,999 | 144 (2.8%) | 244 (5.4%) |
| $15,000 to $17,499 | 230 (4.5%) | 129 (2.9%) |
| $17,500 to $19,999 | 18 (0.4%) | 575 (12.7%) |
| $20,000 to $22,499 | 230 (4.5%) | 107 (2.4%) |
| $22,500 to $24,999 | 92 (1.8%) | 230 (5.1%) |
| $25,000 to $29,999 | 241 (4.7%) | 424 (9.4%) |
| $30,000 to $34,999 | 304 (5.9%) | 432 (9.5%) |
| $35,000 to $39,999 | 390 (7.6%) | 144 (3.2%) |
| $40,000 to $44,999 | 517 (10.1%) | 128 (2.8%) |
| $45,000 to $49,999 | 292 (5.7%) | 144 (3.2%) |
| $50,000 to $54,999 | 389 (7.6%) | 219 (4.8%) |
| $55,000 to $64,999 | 370 (7.2%) | 198 (4.4%) |
| $65,000 to $74,999 | 569 (11.1%) | 178 (3.9%) |
| $75,000 to $99,999 | 228 (4.4%) | 284 (6.3%) |
| $100,000+ | 516 (10.0%) | 169 (3.7%) |
| Total | 5,143 (100.0%) | 4,526 (100.0%) |
Earnings by Sex by Educational Attainment in South Venice
Average earnings in South Venice are $46,142 for men and $26,657 for women, a difference of 42.2%. Men with an educational attainment of less than high school enjoy the highest average annual earnings of $67,832, while those with high school diploma education earn the least with $41,976. Women with an educational attainment of graduate degree earn the most with the average annual earnings of $59,717, while those with college or associate's degree education have the smallest earnings of $22,500.
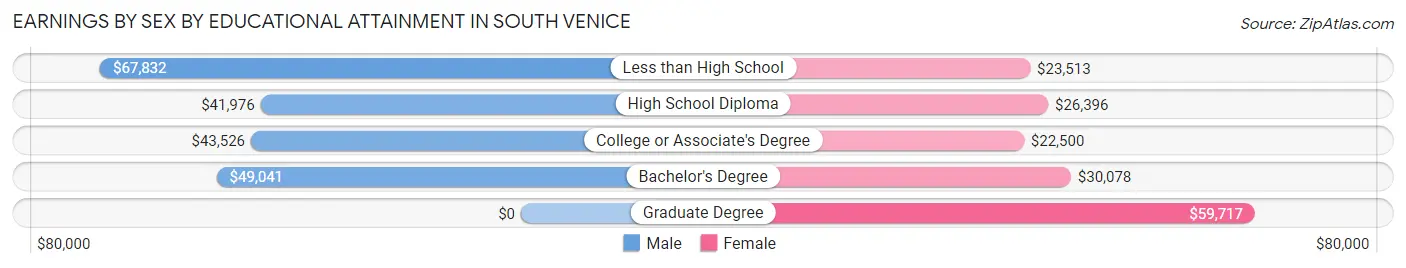
| Educational Attainment | Male Income | Female Income |
| Less than High School | $67,832 | $23,513 |
| High School Diploma | $41,976 | $26,396 |
| College or Associate's Degree | $43,526 | $22,500 |
| Bachelor's Degree | $49,041 | $30,078 |
| Graduate Degree | - | - |
| Total | $46,142 | $26,657 |
Family Income in South Venice
Family Income Brackets in South Venice
According to the South Venice family income data, there are 1,264 families falling into the $50,000 to $74,999 income range, which is the most common income bracket and makes up 24.1% of all families. Conversely, the $10,000 to $14,999 income bracket is the least frequent group with only 31 families (0.6%) belonging to this category.
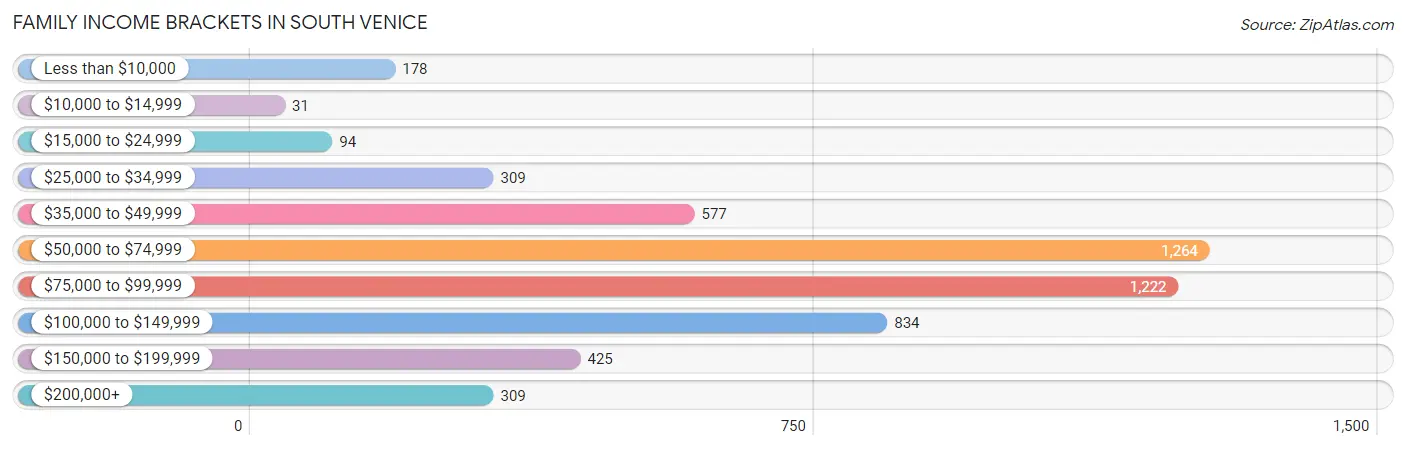
| Income Bracket | # Families | % Families |
| Less than $10,000 | 178 | 3.4% |
| $10,000 to $14,999 | 31 | 0.6% |
| $15,000 to $24,999 | 94 | 1.8% |
| $25,000 to $34,999 | 309 | 5.9% |
| $35,000 to $49,999 | 577 | 11.0% |
| $50,000 to $74,999 | 1,264 | 24.1% |
| $75,000 to $99,999 | 1,222 | 23.3% |
| $100,000 to $149,999 | 834 | 15.9% |
| $150,000 to $199,999 | 425 | 8.1% |
| $200,000+ | 309 | 5.9% |
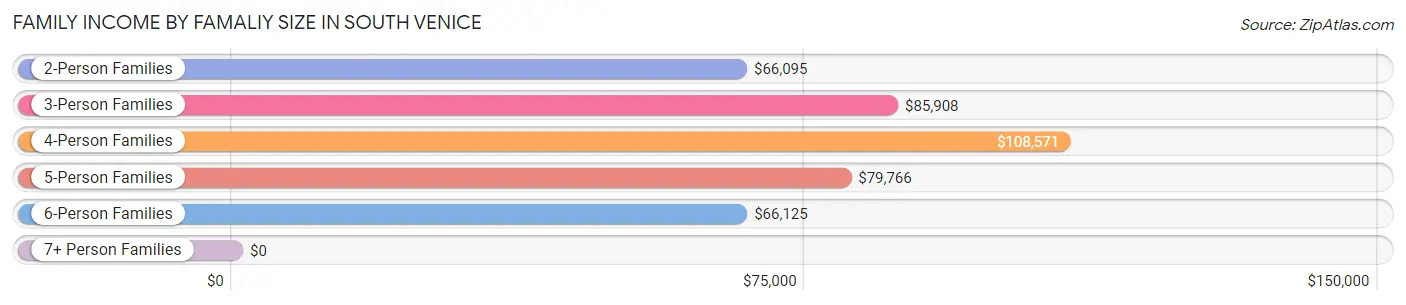
Family Income by Famaliy Size in South Venice
4-person families (554 | 10.6%) account for the highest median family income in South Venice with $108,571 per family, while 2-person families (2,967 | 56.6%) have the highest median income of $33,048 per family member.
| Income Bracket | # Families | Median Income |
| 2-Person Families | 2,967 (56.6%) | $66,095 |
| 3-Person Families | 1,390 (26.5%) | $85,908 |
| 4-Person Families | 554 (10.6%) | $108,571 |
| 5-Person Families | 165 (3.2%) | $79,766 |
| 6-Person Families | 139 (2.6%) | $66,125 |
| 7+ Person Families | 28 (0.5%) | $0 |
| Total | 5,243 (100.0%) | $80,040 |
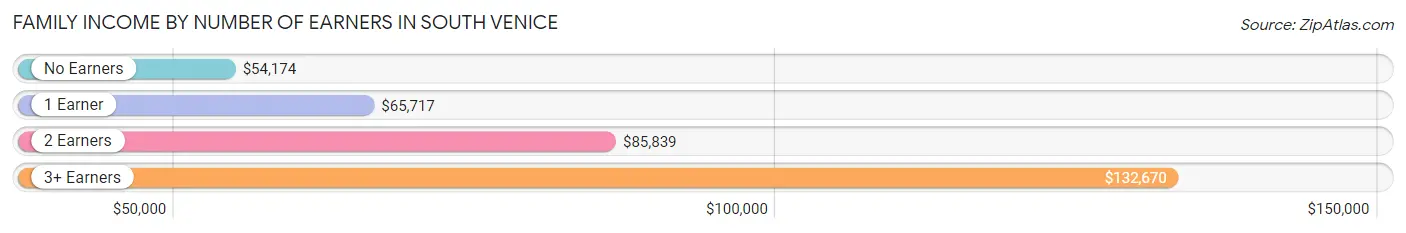
Family Income by Number of Earners in South Venice
The median family income in South Venice is $80,040, with families comprising 3+ earners (581) having the highest median family income of $132,670, while families with no earners (1,035) have the lowest median family income of $54,174, accounting for 11.1% and 19.7% of families, respectively.
| Number of Earners | # Families | Median Income |
| No Earners | 1,035 (19.7%) | $54,174 |
| 1 Earner | 1,445 (27.6%) | $65,717 |
| 2 Earners | 2,182 (41.6%) | $85,839 |
| 3+ Earners | 581 (11.1%) | $132,670 |
| Total | 5,243 (100.0%) | $80,040 |
Household Income in South Venice
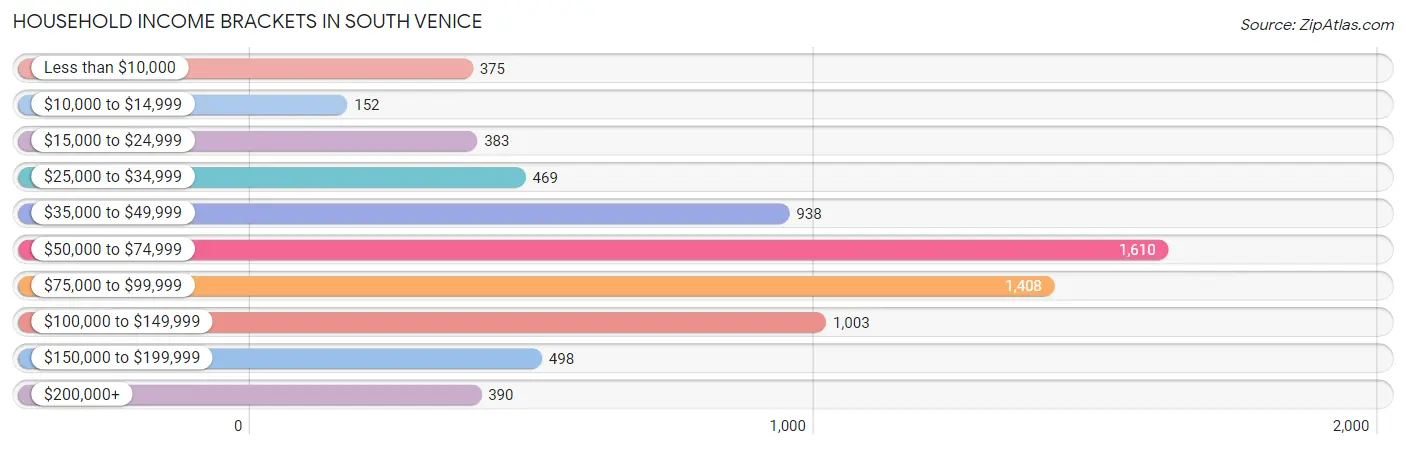
Household Income Brackets in South Venice
With 1,610 households falling in the category, the $50,000 to $74,999 income range is the most frequent in South Venice, accounting for 22.3% of all households. In contrast, only 152 households (2.1%) fall into the $10,000 to $14,999 income bracket, making it the least populous group.
| Income Bracket | # Households | % Households |
| Less than $10,000 | 375 | 5.2% |
| $10,000 to $14,999 | 152 | 2.1% |
| $15,000 to $24,999 | 383 | 5.3% |
| $25,000 to $34,999 | 469 | 6.5% |
| $35,000 to $49,999 | 938 | 13.0% |
| $50,000 to $74,999 | 1,610 | 22.3% |
| $75,000 to $99,999 | 1,408 | 19.5% |
| $100,000 to $149,999 | 1,003 | 13.9% |
| $150,000 to $199,999 | 498 | 6.9% |
| $200,000+ | 390 | 5.4% |
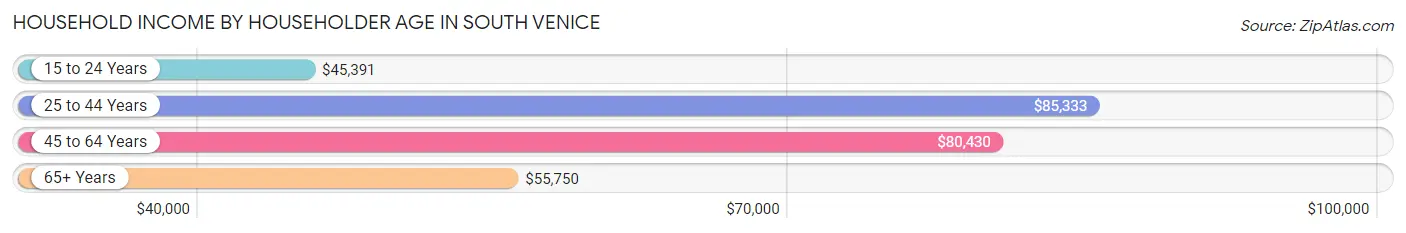
Household Income by Householder Age in South Venice
The median household income in South Venice is $71,241, with the highest median household income of $85,333 found in the 25 to 44 years age bracket for the primary householder. A total of 1,673 households (23.2%) fall into this category. Meanwhile, the 15 to 24 years age bracket for the primary householder has the lowest median household income of $45,391, with 144 households (2.0%) in this group.
| Income Bracket | # Households | Median Income |
| 15 to 24 Years | 144 (2.0%) | $45,391 |
| 25 to 44 Years | 1,673 (23.2%) | $85,333 |
| 45 to 64 Years | 2,568 (35.6%) | $80,430 |
| 65+ Years | 2,833 (39.3%) | $55,750 |
| Total | 7,218 (100.0%) | $71,241 |
Poverty in South Venice
Income Below Poverty by Sex and Age in South Venice
With 8.7% poverty level for males and 9.2% for females among the residents of South Venice, 16 and 17 year old males and under 5 year old females are the most vulnerable to poverty, with 31 males (100.0%) and 75 females (32.8%) in their respective age groups living below the poverty level.
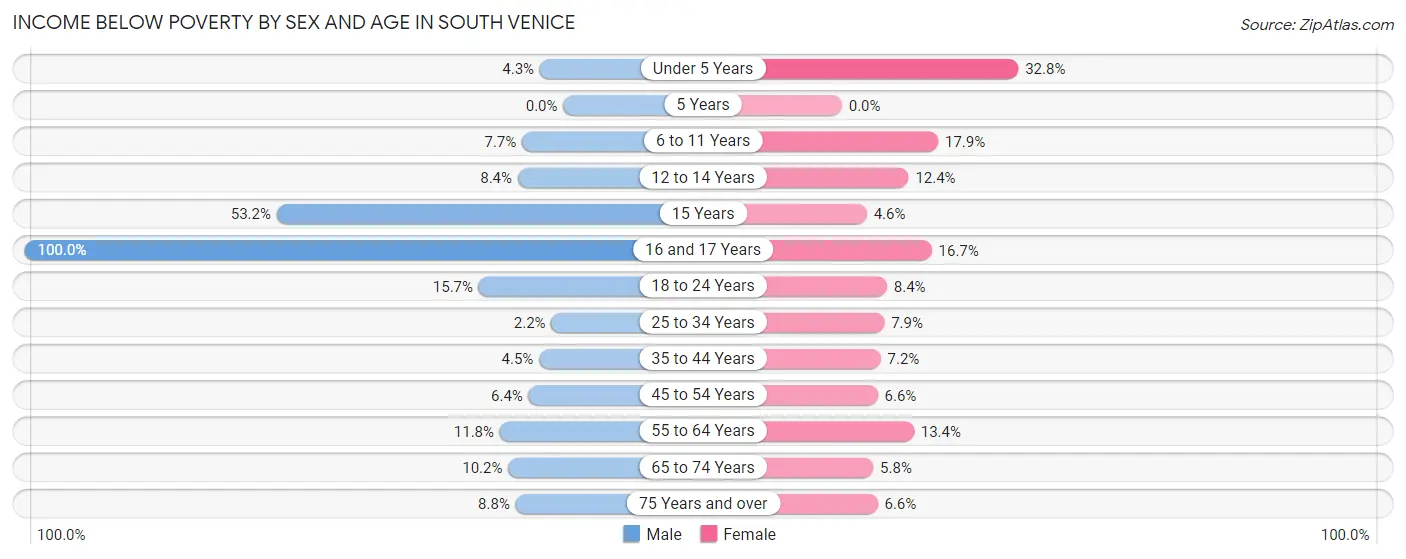
| Age Bracket | Male | Female |
| Under 5 Years | 20 (4.3%) | 75 (32.8%) |
| 5 Years | 0 (0.0%) | 0 (0.0%) |
| 6 to 11 Years | 28 (7.6%) | 100 (17.9%) |
| 12 to 14 Years | 20 (8.4%) | 46 (12.4%) |
| 15 Years | 25 (53.2%) | 5 (4.6%) |
| 16 and 17 Years | 31 (100.0%) | 10 (16.7%) |
| 18 to 24 Years | 103 (15.7%) | 39 (8.4%) |
| 25 to 34 Years | 21 (2.2%) | 63 (7.9%) |
| 35 to 44 Years | 50 (4.5%) | 75 (7.2%) |
| 45 to 54 Years | 66 (6.4%) | 74 (6.6%) |
| 55 to 64 Years | 179 (11.8%) | 184 (13.4%) |
| 65 to 74 Years | 122 (10.2%) | 84 (5.8%) |
| 75 Years and over | 79 (8.8%) | 66 (6.6%) |
| Total | 744 (8.7%) | 821 (9.2%) |
Income Above Poverty by Sex and Age in South Venice
According to the poverty statistics in South Venice, males aged 5 years and females aged 5 years are the age groups that are most secure financially, with 100.0% of males and 100.0% of females in these age groups living above the poverty line.
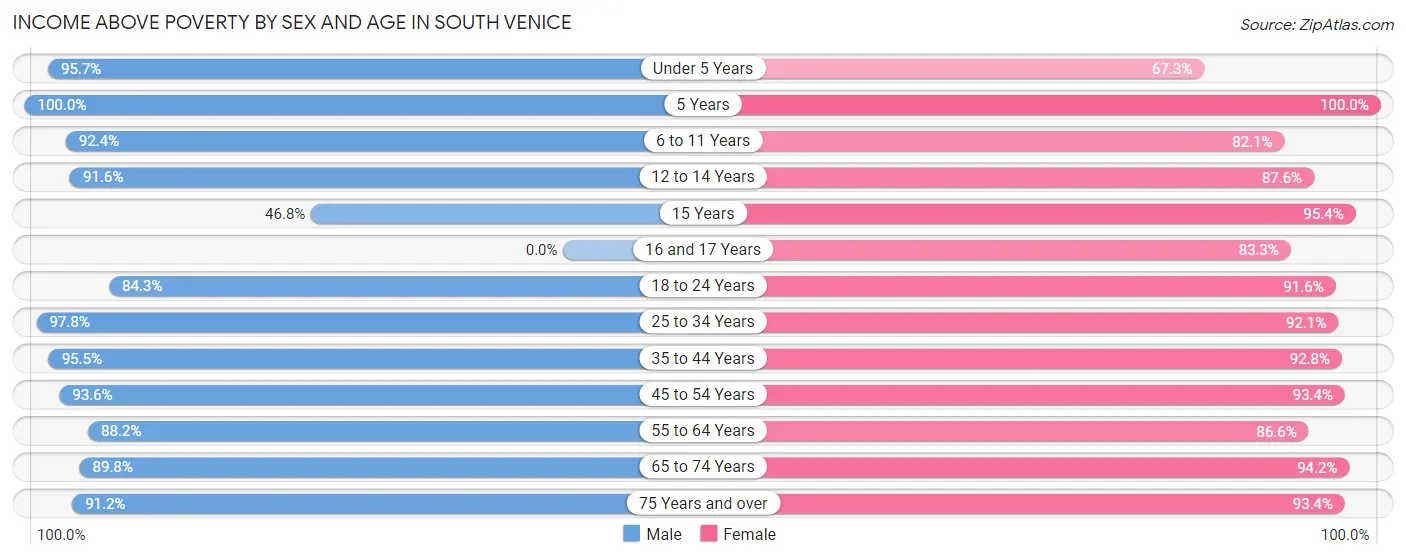
| Age Bracket | Male | Female |
| Under 5 Years | 441 (95.7%) | 154 (67.2%) |
| 5 Years | 51 (100.0%) | 326 (100.0%) |
| 6 to 11 Years | 338 (92.3%) | 460 (82.1%) |
| 12 to 14 Years | 217 (91.6%) | 326 (87.6%) |
| 15 Years | 22 (46.8%) | 103 (95.4%) |
| 16 and 17 Years | 0 (0.0%) | 50 (83.3%) |
| 18 to 24 Years | 554 (84.3%) | 427 (91.6%) |
| 25 to 34 Years | 930 (97.8%) | 736 (92.1%) |
| 35 to 44 Years | 1,063 (95.5%) | 967 (92.8%) |
| 45 to 54 Years | 959 (93.6%) | 1,040 (93.4%) |
| 55 to 64 Years | 1,340 (88.2%) | 1,192 (86.6%) |
| 65 to 74 Years | 1,072 (89.8%) | 1,359 (94.2%) |
| 75 Years and over | 815 (91.2%) | 929 (93.4%) |
| Total | 7,802 (91.3%) | 8,069 (90.8%) |
Income Below Poverty Among Married-Couple Families in South Venice
The poverty statistics for married-couple families in South Venice show that 4.7% or 205 of the total 4,373 families live below the poverty line. Families with 3 or 4 children have the highest poverty rate of 17.1%, comprising of 26 families. On the other hand, families with 1 or 2 children have the lowest poverty rate of 2.4%, which includes 30 families.
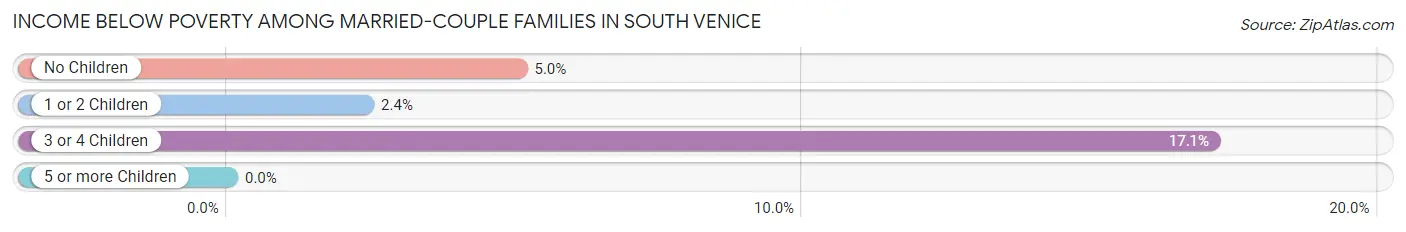
| Children | Above Poverty | Below Poverty |
| No Children | 2,806 (95.0%) | 149 (5.0%) |
| 1 or 2 Children | 1,236 (97.6%) | 30 (2.4%) |
| 3 or 4 Children | 126 (82.9%) | 26 (17.1%) |
| 5 or more Children | 0 (0.0%) | 0 (0.0%) |
| Total | 4,168 (95.3%) | 205 (4.7%) |
Income Below Poverty Among Single-Parent Households in South Venice
According to the poverty data in South Venice, 1.8% or 7 single-father households and 15.2% or 72 single-mother households are living below the poverty line. Among single-father households, those with no children have the highest poverty rate, with 7 households (3.3%) experiencing poverty. Likewise, among single-mother households, those with 5 or more children have the highest poverty rate, with 17 households (100.0%) falling below the poverty line.
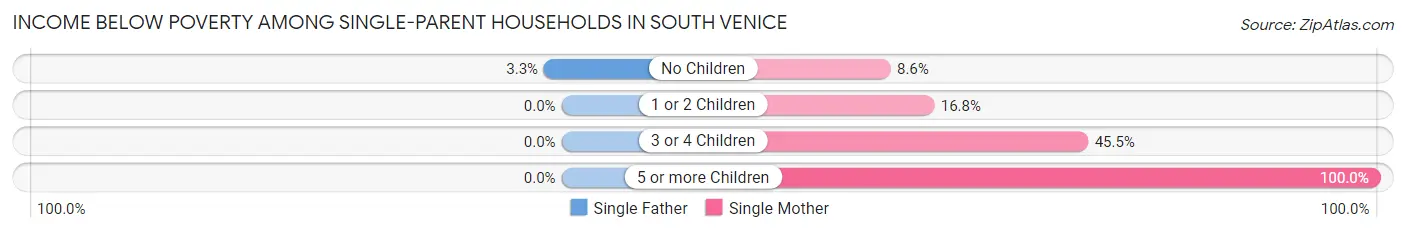
| Children | Single Father | Single Mother |
| No Children | 7 (3.3%) | 26 (8.6%) |
| 1 or 2 Children | 0 (0.0%) | 24 (16.8%) |
| 3 or 4 Children | 0 (0.0%) | 5 (45.5%) |
| 5 or more Children | 0 (0.0%) | 17 (100.0%) |
| Total | 7 (1.8%) | 72 (15.2%) |
Income Below Poverty Among Married-Couple vs Single-Parent Households in South Venice
The poverty data for South Venice shows that 205 of the married-couple family households (4.7%) and 79 of the single-parent households (9.1%) are living below the poverty level. Within the married-couple family households, those with 3 or 4 children have the highest poverty rate, with 26 households (17.1%) falling below the poverty line. Among the single-parent households, those with 5 or more children have the highest poverty rate, with 17 household (100.0%) living below poverty.
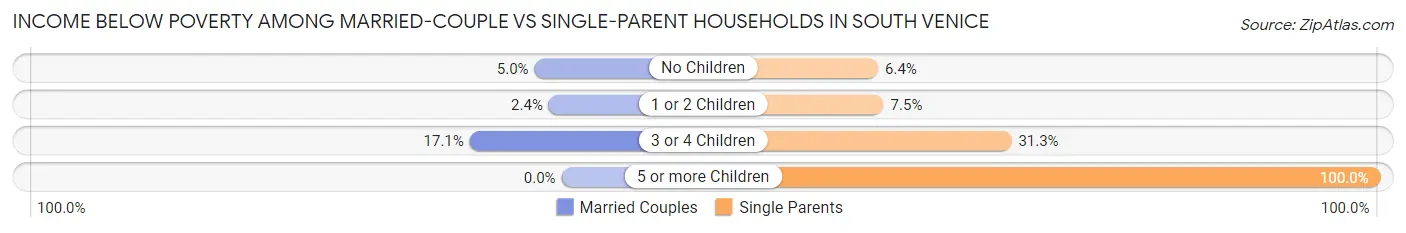
| Children | Married-Couple Families | Single-Parent Households |
| No Children | 149 (5.0%) | 33 (6.4%) |
| 1 or 2 Children | 30 (2.4%) | 24 (7.4%) |
| 3 or 4 Children | 26 (17.1%) | 5 (31.2%) |
| 5 or more Children | 0 (0.0%) | 17 (100.0%) |
| Total | 205 (4.7%) | 79 (9.1%) |
Employment Characteristics in South Venice
Employment by Class of Employer in South Venice
Among the 8,314 employed individuals in South Venice, private company employees (5,829 | 70.1%), self-employed (not incorporated) (609 | 7.3%), and not-for-profit organizations (583 | 7.0%) make up the most common classes of employment.
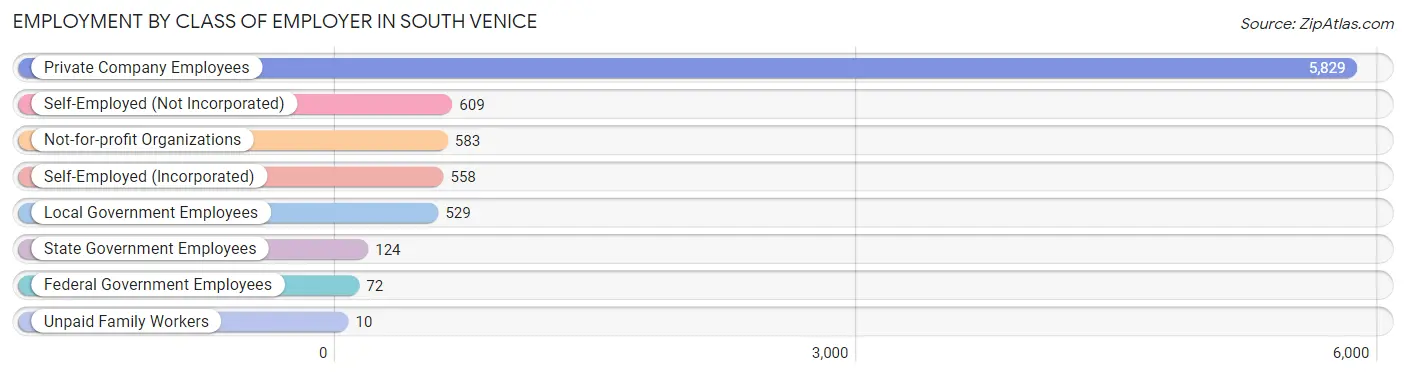
| Employer Class | # Employees | % Employees |
| Private Company Employees | 5,829 | 70.1% |
| Self-Employed (Incorporated) | 558 | 6.7% |
| Self-Employed (Not Incorporated) | 609 | 7.3% |
| Not-for-profit Organizations | 583 | 7.0% |
| Local Government Employees | 529 | 6.4% |
| State Government Employees | 124 | 1.5% |
| Federal Government Employees | 72 | 0.9% |
| Unpaid Family Workers | 10 | 0.1% |
| Total | 8,314 | 100.0% |
Employment Status by Age in South Venice
According to the labor force statistics for South Venice, out of the total population over 16 years of age (14,679), 61.9% or 9,086 individuals are in the labor force, with 3.5% or 318 of them unemployed. The age group with the highest labor force participation rate is 20 to 24 years, with 98.2% or 826 individuals in the labor force. Within the labor force, the 75 years and over age range has the highest percentage of unemployed individuals, with 18.1% or 32 of them being unemployed.
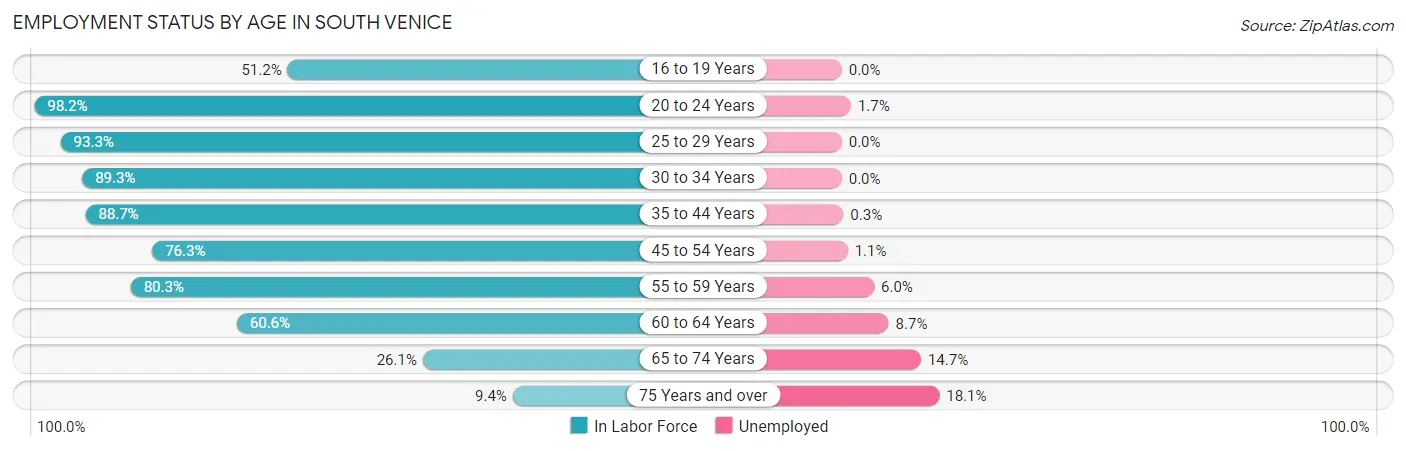
| Age Bracket | In Labor Force | Unemployed |
| 16 to 19 Years | 191 (51.2%) | 0 (0.0%) |
| 20 to 24 Years | 826 (98.2%) | 14 (1.7%) |
| 25 to 29 Years | 884 (93.3%) | 0 (0.0%) |
| 30 to 34 Years | 717 (89.3%) | 0 (0.0%) |
| 35 to 44 Years | 1,911 (88.7%) | 6 (0.3%) |
| 45 to 54 Years | 1,632 (76.3%) | 18 (1.1%) |
| 55 to 59 Years | 1,241 (80.3%) | 74 (6.0%) |
| 60 to 64 Years | 817 (60.6%) | 71 (8.7%) |
| 65 to 74 Years | 688 (26.1%) | 101 (14.7%) |
| 75 Years and over | 178 (9.4%) | 32 (18.1%) |
| Total | 9,086 (61.9%) | 318 (3.5%) |
Employment Status by Educational Attainment in South Venice
According to labor force statistics for South Venice, 80.6% of individuals (7,205) out of the total population between 25 and 64 years of age (8,939) are in the labor force, with 2.4% or 173 of them being unemployed. The group with the highest labor force participation rate are those with the educational attainment of college / associate degree, with 85.9% or 3,074 individuals in the labor force. Within the labor force, individuals with bachelor's degree or higher education have the highest percentage of unemployment, with 4.8% or 72 of them being unemployed.
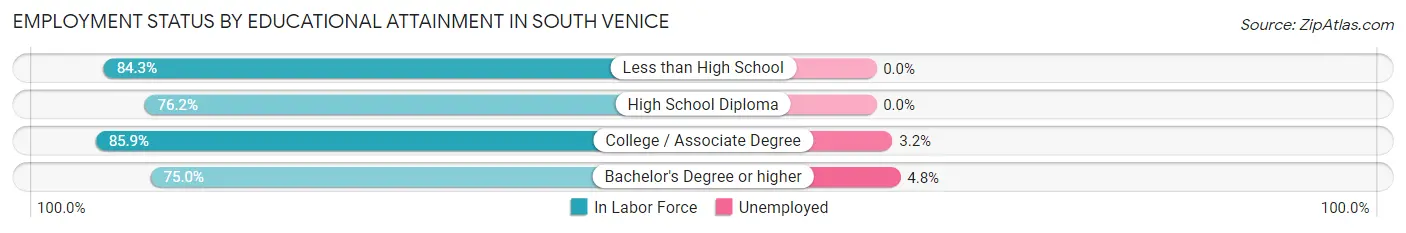
| Educational Attainment | In Labor Force | Unemployed |
| Less than High School | 705 (84.3%) | 0 (0.0%) |
| High School Diploma | 1,926 (76.2%) | 0 (0.0%) |
| College / Associate Degree | 3,074 (85.9%) | 114 (3.2%) |
| Bachelor's Degree or higher | 1,498 (75.0%) | 96 (4.8%) |
| Total | 7,205 (80.6%) | 215 (2.4%) |
Employment Occupations by Sex in South Venice
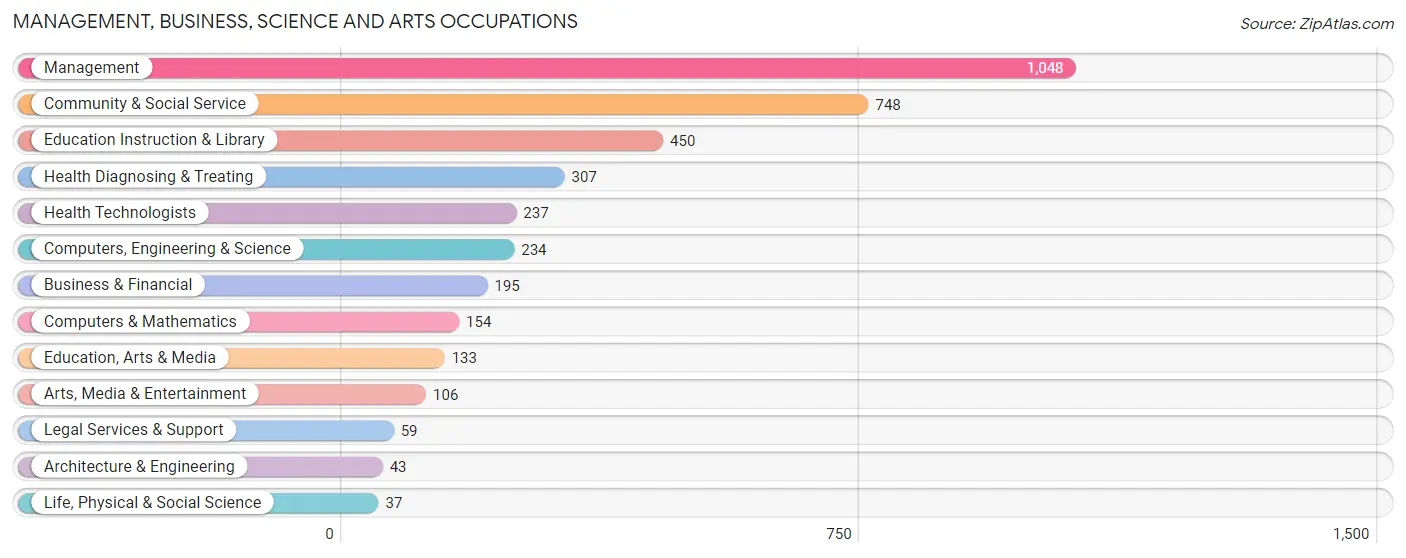
Management, Business, Science and Arts Occupations
The most common Management, Business, Science and Arts occupations in South Venice are Management (1,048 | 12.0%), Community & Social Service (748 | 8.5%), Education Instruction & Library (450 | 5.1%), Health Diagnosing & Treating (307 | 3.5%), and Health Technologists (237 | 2.7%).
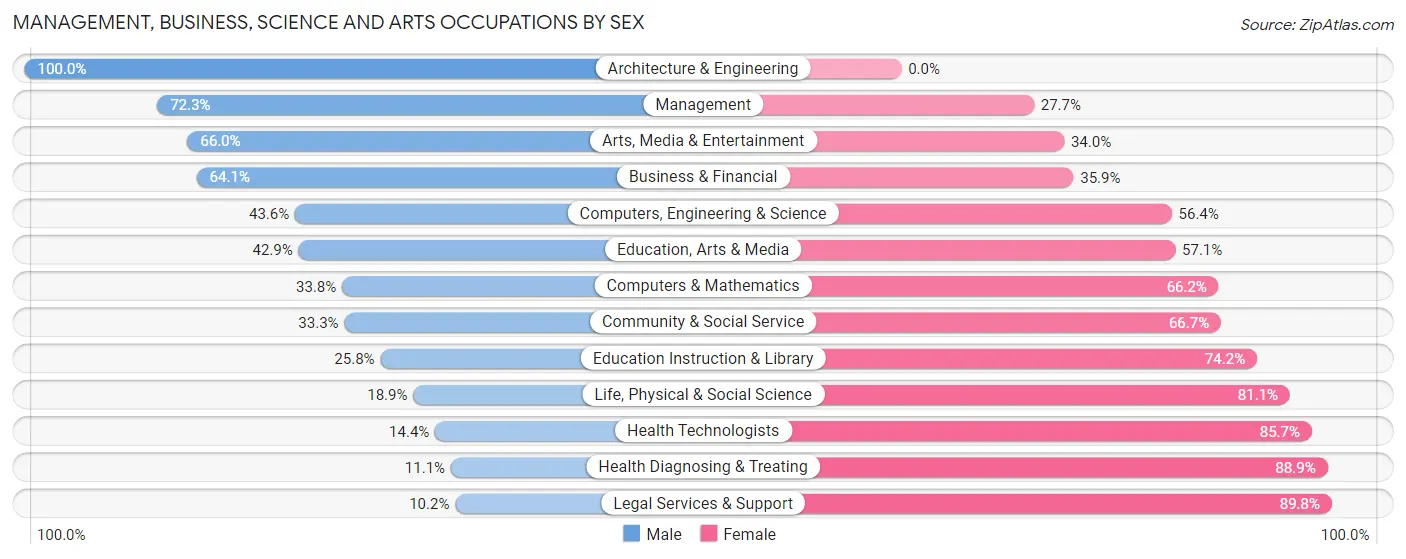
Management, Business, Science and Arts Occupations by Sex
Within the Management, Business, Science and Arts occupations in South Venice, the most male-oriented occupations are Architecture & Engineering (100.0%), Management (72.3%), and Arts, Media & Entertainment (66.0%), while the most female-oriented occupations are Legal Services & Support (89.8%), Health Diagnosing & Treating (88.9%), and Health Technologists (85.7%).
| Occupation | Male | Female |
| Management | 758 (72.3%) | 290 (27.7%) |
| Business & Financial | 125 (64.1%) | 70 (35.9%) |
| Computers, Engineering & Science | 102 (43.6%) | 132 (56.4%) |
| Computers & Mathematics | 52 (33.8%) | 102 (66.2%) |
| Architecture & Engineering | 43 (100.0%) | 0 (0.0%) |
| Life, Physical & Social Science | 7 (18.9%) | 30 (81.1%) |
| Community & Social Service | 249 (33.3%) | 499 (66.7%) |
| Education, Arts & Media | 57 (42.9%) | 76 (57.1%) |
| Legal Services & Support | 6 (10.2%) | 53 (89.8%) |
| Education Instruction & Library | 116 (25.8%) | 334 (74.2%) |
| Arts, Media & Entertainment | 70 (66.0%) | 36 (34.0%) |
| Health Diagnosing & Treating | 34 (11.1%) | 273 (88.9%) |
| Health Technologists | 34 (14.3%) | 203 (85.7%) |
| Total (Category) | 1,268 (50.1%) | 1,264 (49.9%) |
| Total (Overall) | 4,791 (54.6%) | 3,975 (45.4%) |
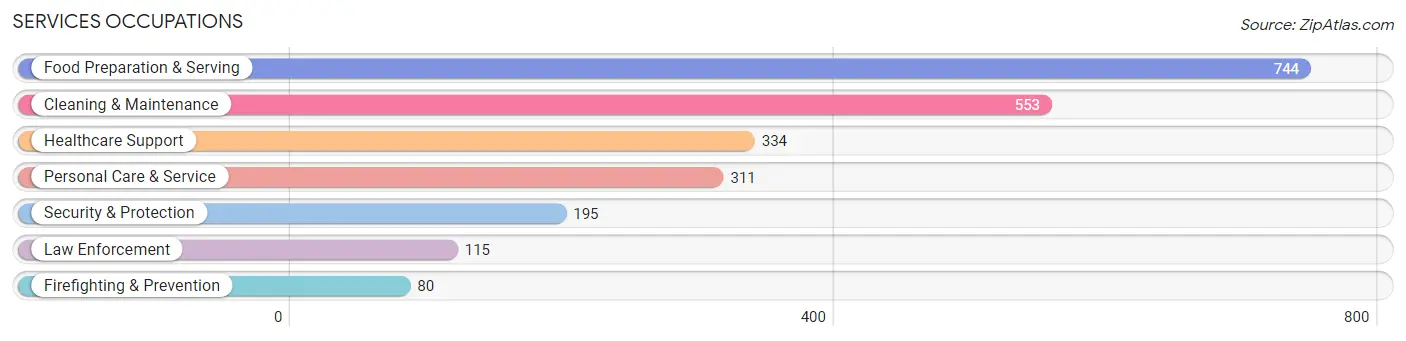
Services Occupations
The most common Services occupations in South Venice are Food Preparation & Serving (744 | 8.5%), Cleaning & Maintenance (553 | 6.3%), Healthcare Support (334 | 3.8%), Personal Care & Service (311 | 3.5%), and Security & Protection (195 | 2.2%).
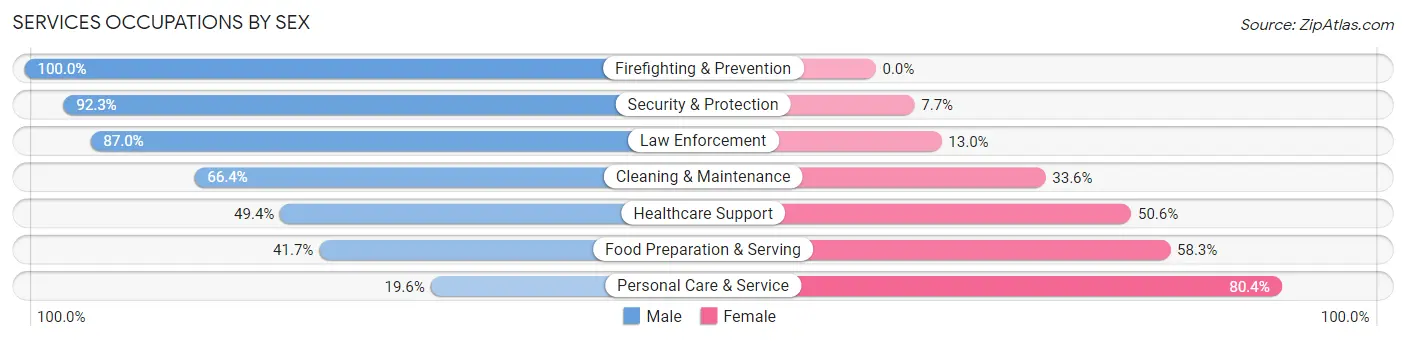
Services Occupations by Sex
Within the Services occupations in South Venice, the most male-oriented occupations are Firefighting & Prevention (100.0%), Security & Protection (92.3%), and Law Enforcement (87.0%), while the most female-oriented occupations are Personal Care & Service (80.4%), Food Preparation & Serving (58.3%), and Healthcare Support (50.6%).
| Occupation | Male | Female |
| Healthcare Support | 165 (49.4%) | 169 (50.6%) |
| Security & Protection | 180 (92.3%) | 15 (7.7%) |
| Firefighting & Prevention | 80 (100.0%) | 0 (0.0%) |
| Law Enforcement | 100 (87.0%) | 15 (13.0%) |
| Food Preparation & Serving | 310 (41.7%) | 434 (58.3%) |
| Cleaning & Maintenance | 367 (66.4%) | 186 (33.6%) |
| Personal Care & Service | 61 (19.6%) | 250 (80.4%) |
| Total (Category) | 1,083 (50.7%) | 1,054 (49.3%) |
| Total (Overall) | 4,791 (54.6%) | 3,975 (45.4%) |
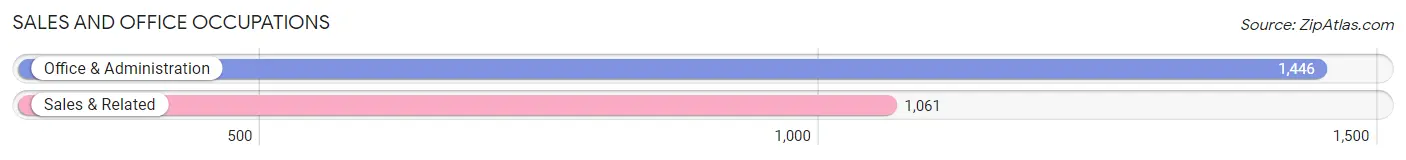
Sales and Office Occupations
The most common Sales and Office occupations in South Venice are Office & Administration (1,446 | 16.5%), and Sales & Related (1,061 | 12.1%).
Sales and Office Occupations by Sex
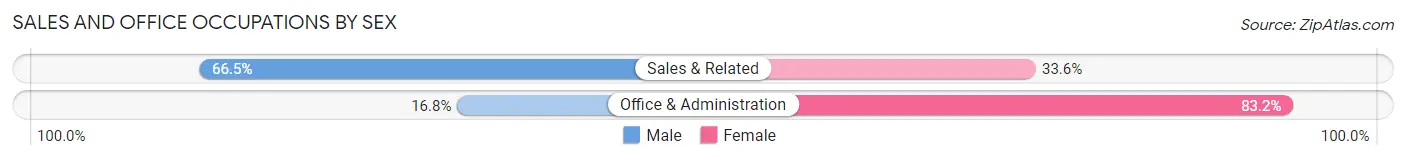
| Occupation | Male | Female |
| Sales & Related | 705 (66.4%) | 356 (33.6%) |
| Office & Administration | 243 (16.8%) | 1,203 (83.2%) |
| Total (Category) | 948 (37.8%) | 1,559 (62.2%) |
| Total (Overall) | 4,791 (54.6%) | 3,975 (45.4%) |
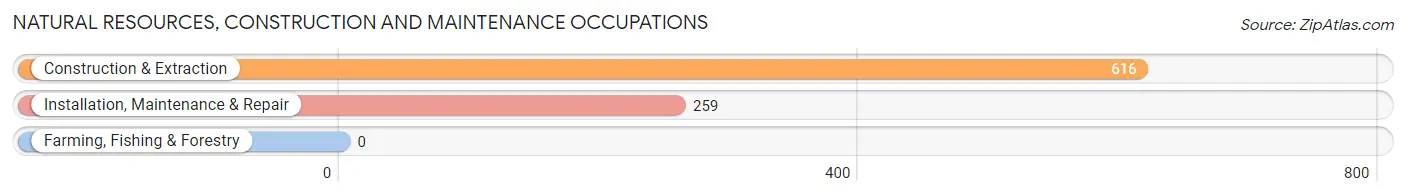
Natural Resources, Construction and Maintenance Occupations
The most common Natural Resources, Construction and Maintenance occupations in South Venice are Construction & Extraction (616 | 7.0%), and Installation, Maintenance & Repair (259 | 2.9%).
Natural Resources, Construction and Maintenance Occupations by Sex
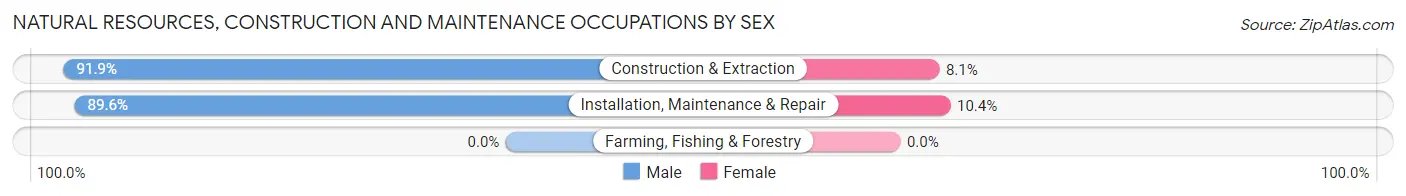
| Occupation | Male | Female |
| Farming, Fishing & Forestry | 0 (0.0%) | 0 (0.0%) |
| Construction & Extraction | 566 (91.9%) | 50 (8.1%) |
| Installation, Maintenance & Repair | 232 (89.6%) | 27 (10.4%) |
| Total (Category) | 798 (91.2%) | 77 (8.8%) |
| Total (Overall) | 4,791 (54.6%) | 3,975 (45.4%) |
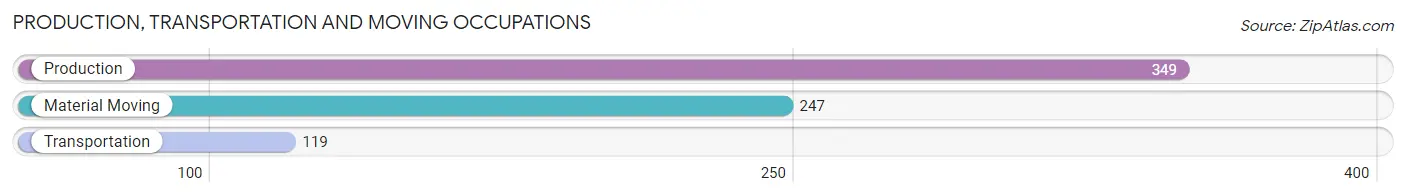
Production, Transportation and Moving Occupations
The most common Production, Transportation and Moving occupations in South Venice are Production (349 | 4.0%), Material Moving (247 | 2.8%), and Transportation (119 | 1.4%).
Production, Transportation and Moving Occupations by Sex
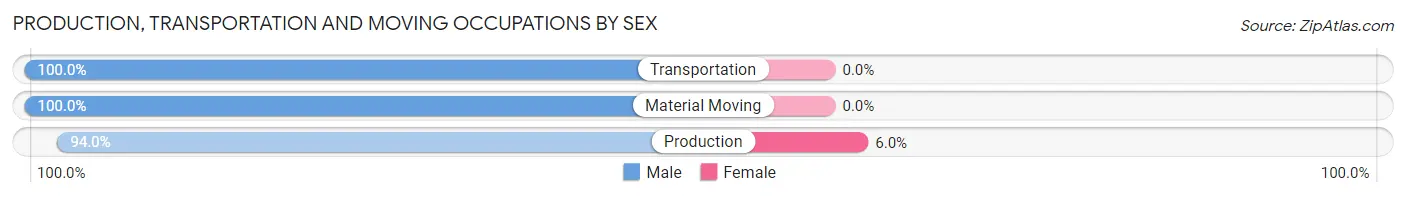
| Occupation | Male | Female |
| Production | 328 (94.0%) | 21 (6.0%) |
| Transportation | 119 (100.0%) | 0 (0.0%) |
| Material Moving | 247 (100.0%) | 0 (0.0%) |
| Total (Category) | 694 (97.1%) | 21 (2.9%) |
| Total (Overall) | 4,791 (54.6%) | 3,975 (45.4%) |
Employment Industries by Sex in South Venice
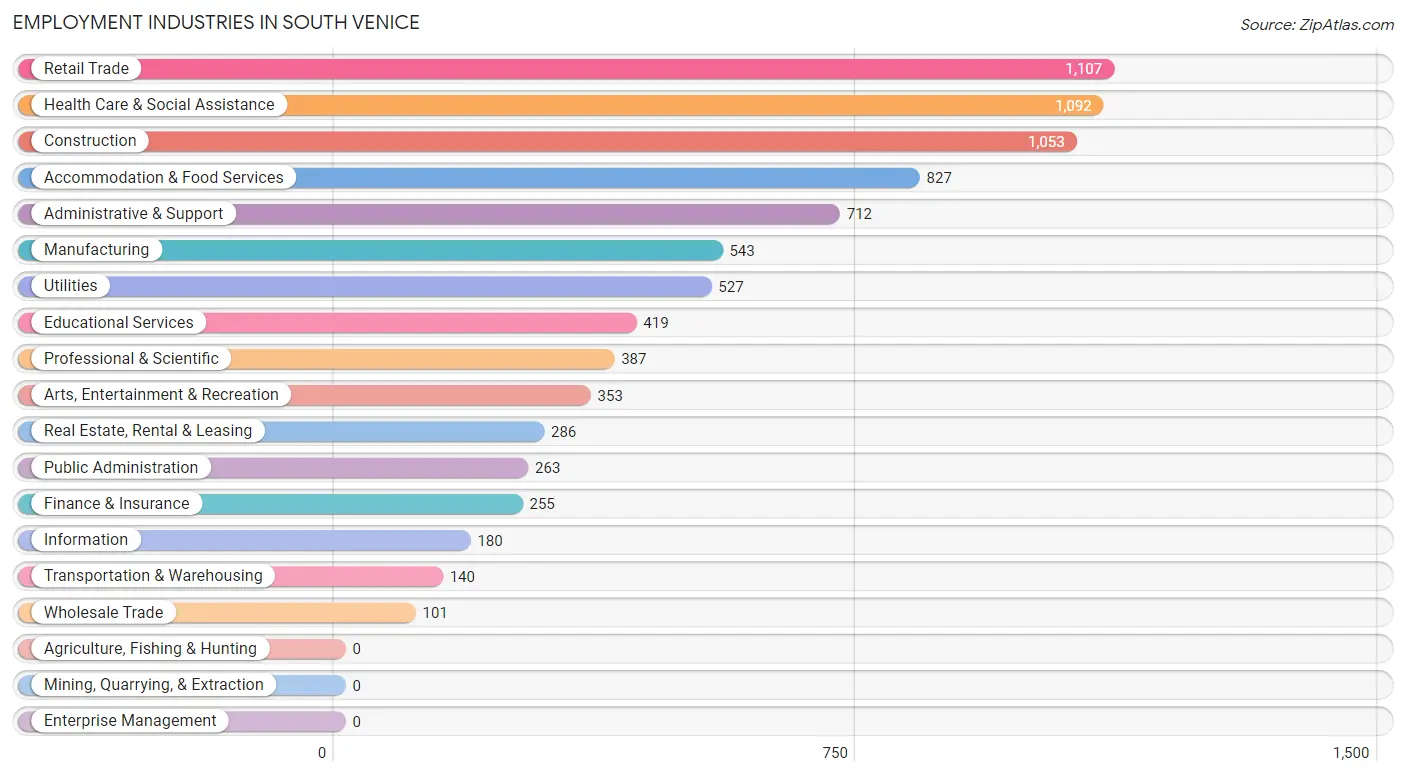
Employment Industries in South Venice
The major employment industries in South Venice include Retail Trade (1,107 | 12.6%), Health Care & Social Assistance (1,092 | 12.5%), Construction (1,053 | 12.0%), Accommodation & Food Services (827 | 9.4%), and Administrative & Support (712 | 8.1%).
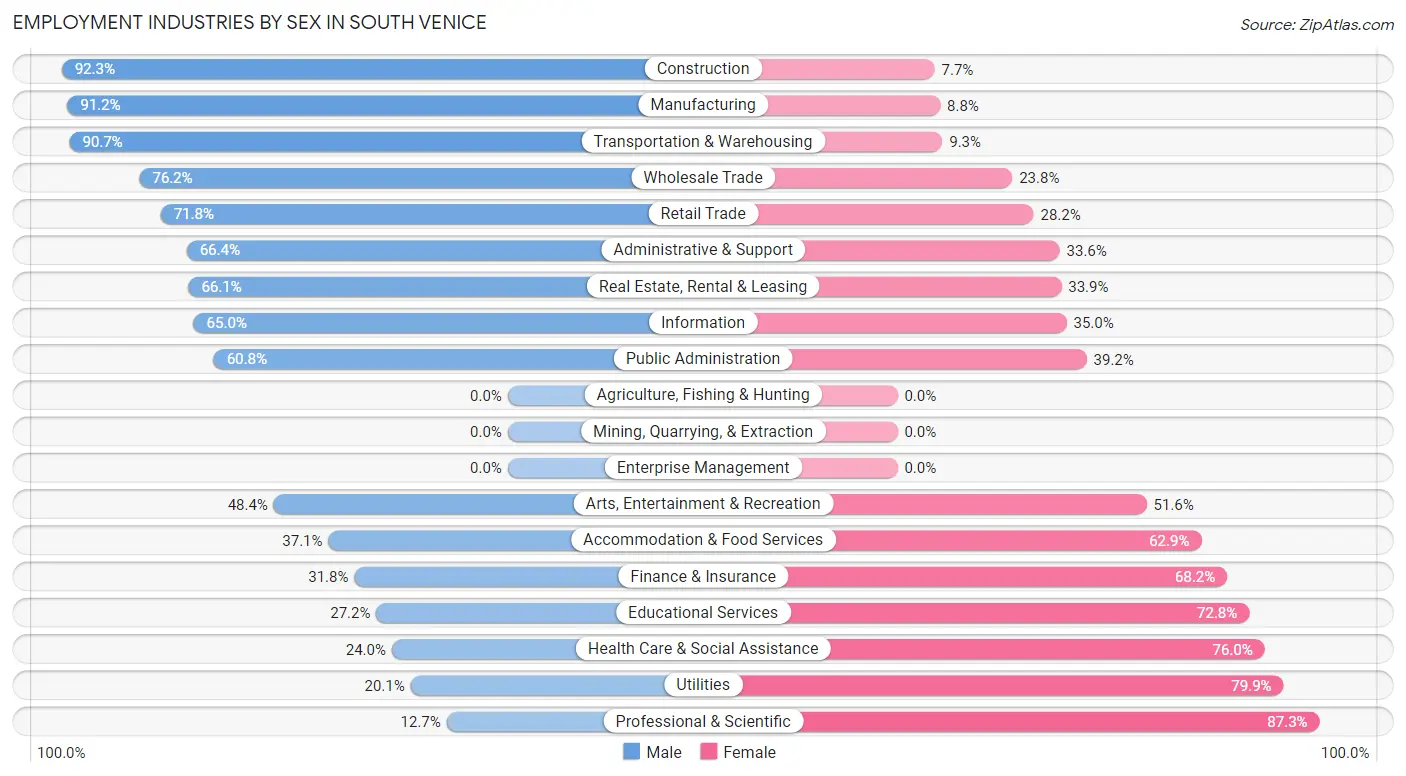
Employment Industries by Sex in South Venice
The South Venice industries that see more men than women are Construction (92.3%), Manufacturing (91.2%), and Transportation & Warehousing (90.7%), whereas the industries that tend to have a higher number of women are Professional & Scientific (87.3%), Utilities (79.9%), and Health Care & Social Assistance (76.0%).
| Industry | Male | Female |
| Agriculture, Fishing & Hunting | 0 (0.0%) | 0 (0.0%) |
| Mining, Quarrying, & Extraction | 0 (0.0%) | 0 (0.0%) |
| Construction | 972 (92.3%) | 81 (7.7%) |
| Manufacturing | 495 (91.2%) | 48 (8.8%) |
| Wholesale Trade | 77 (76.2%) | 24 (23.8%) |
| Retail Trade | 795 (71.8%) | 312 (28.2%) |
| Transportation & Warehousing | 127 (90.7%) | 13 (9.3%) |
| Utilities | 106 (20.1%) | 421 (79.9%) |
| Information | 117 (65.0%) | 63 (35.0%) |
| Finance & Insurance | 81 (31.8%) | 174 (68.2%) |
| Real Estate, Rental & Leasing | 189 (66.1%) | 97 (33.9%) |
| Professional & Scientific | 49 (12.7%) | 338 (87.3%) |
| Enterprise Management | 0 (0.0%) | 0 (0.0%) |
| Administrative & Support | 473 (66.4%) | 239 (33.6%) |
| Educational Services | 114 (27.2%) | 305 (72.8%) |
| Health Care & Social Assistance | 262 (24.0%) | 830 (76.0%) |
| Arts, Entertainment & Recreation | 171 (48.4%) | 182 (51.6%) |
| Accommodation & Food Services | 307 (37.1%) | 520 (62.9%) |
| Public Administration | 160 (60.8%) | 103 (39.2%) |
| Total | 4,791 (54.6%) | 3,975 (45.4%) |
Education in South Venice
School Enrollment in South Venice
The most common levels of schooling among the 2,789 students in South Venice are elementary school (689 | 24.7%), middle school (687 | 24.6%), and high school (504 | 18.1%).
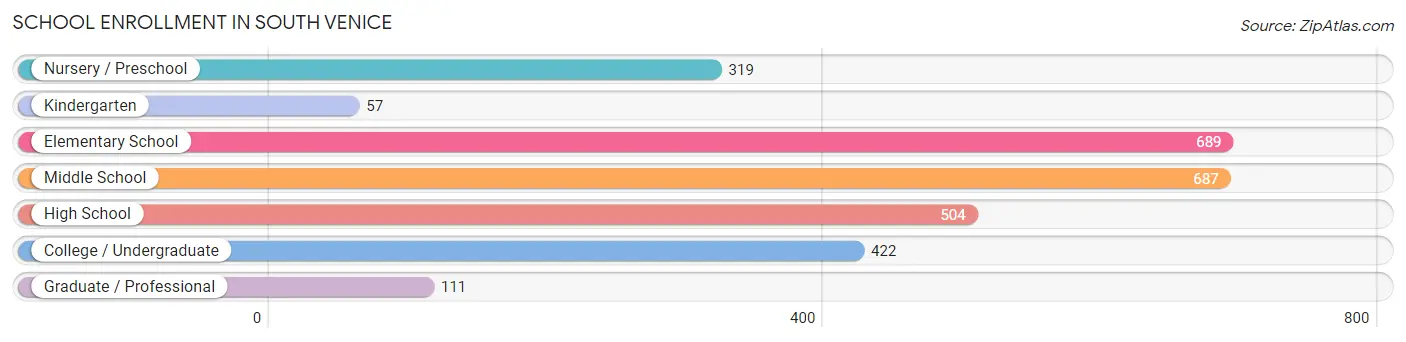
| School Level | # Students | % Students |
| Nursery / Preschool | 319 | 11.4% |
| Kindergarten | 57 | 2.0% |
| Elementary School | 689 | 24.7% |
| Middle School | 687 | 24.6% |
| High School | 504 | 18.1% |
| College / Undergraduate | 422 | 15.1% |
| Graduate / Professional | 111 | 4.0% |
| Total | 2,789 | 100.0% |
School Enrollment by Age by Funding Source in South Venice
Out of a total of 2,789 students who are enrolled in schools in South Venice, 541 (19.4%) attend a private institution, while the remaining 2,248 (80.6%) are enrolled in public schools. The age group of 5 to 9 year old has the highest likelihood of being enrolled in private schools, with 386 (42.1% in the age bracket) enrolled. Conversely, the age group of 3 to 4 year olds has the lowest likelihood of being enrolled in a private school, with 33 (100.0% in the age bracket) attending a public institution.
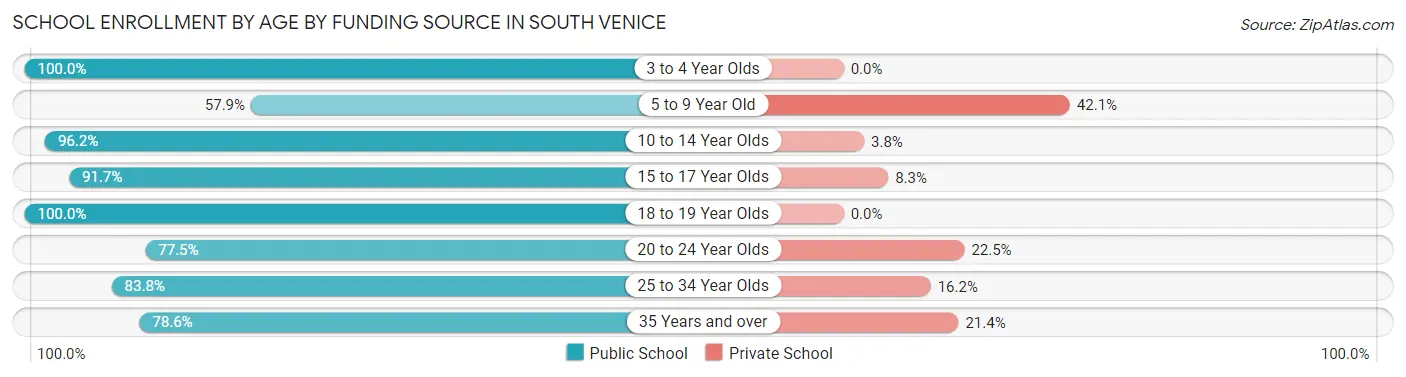
| Age Bracket | Public School | Private School |
| 3 to 4 Year Olds | 33 (100.0%) | 0 (0.0%) |
| 5 to 9 Year Old | 530 (57.9%) | 386 (42.1%) |
| 10 to 14 Year Olds | 911 (96.2%) | 36 (3.8%) |
| 15 to 17 Year Olds | 221 (91.7%) | 20 (8.3%) |
| 18 to 19 Year Olds | 157 (100.0%) | 0 (0.0%) |
| 20 to 24 Year Olds | 124 (77.5%) | 36 (22.5%) |
| 25 to 34 Year Olds | 124 (83.8%) | 24 (16.2%) |
| 35 Years and over | 147 (78.6%) | 40 (21.4%) |
| Total | 2,248 (80.6%) | 541 (19.4%) |
Educational Attainment by Field of Study in South Venice
Business (695 | 21.2%), education (448 | 13.7%), engineering (358 | 10.9%), science & technology (315 | 9.6%), and social sciences (271 | 8.3%) are the most common fields of study among 3,275 individuals in South Venice who have obtained a bachelor's degree or higher.
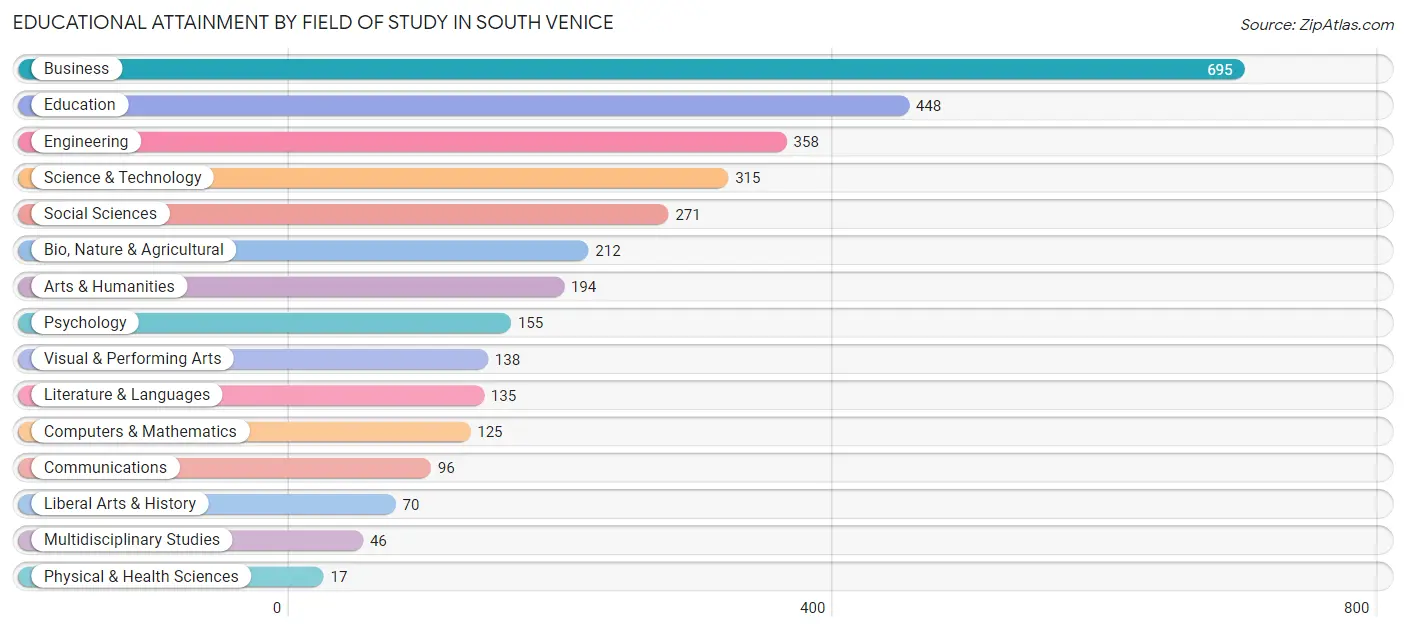
| Field of Study | # Graduates | % Graduates |
| Computers & Mathematics | 125 | 3.8% |
| Bio, Nature & Agricultural | 212 | 6.5% |
| Physical & Health Sciences | 17 | 0.5% |
| Psychology | 155 | 4.7% |
| Social Sciences | 271 | 8.3% |
| Engineering | 358 | 10.9% |
| Multidisciplinary Studies | 46 | 1.4% |
| Science & Technology | 315 | 9.6% |
| Business | 695 | 21.2% |
| Education | 448 | 13.7% |
| Literature & Languages | 135 | 4.1% |
| Liberal Arts & History | 70 | 2.1% |
| Visual & Performing Arts | 138 | 4.2% |
| Communications | 96 | 2.9% |
| Arts & Humanities | 194 | 5.9% |
| Total | 3,275 | 100.0% |
Transportation & Commute in South Venice
Vehicle Availability by Sex in South Venice
The most prevalent vehicle ownership categories in South Venice are males with 2 vehicles (2,165, accounting for 49.3%) and females with 2 vehicles (2,144, making up 55.4%).
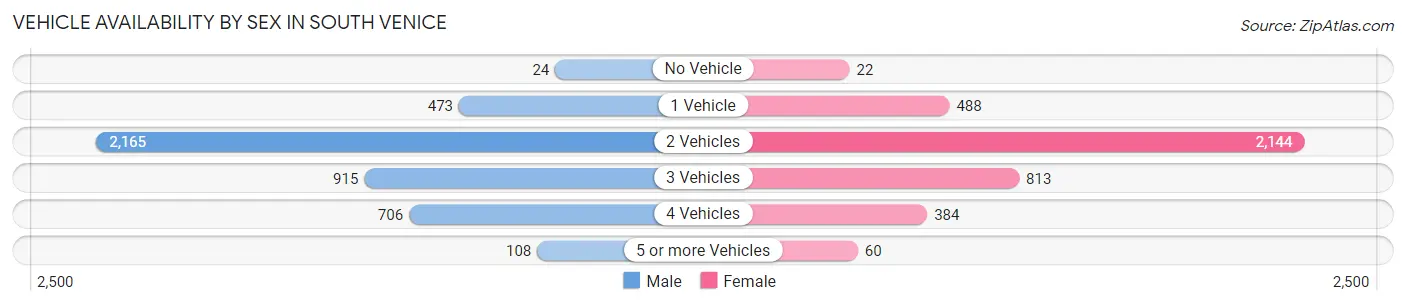
| Vehicles Available | Male | Female |
| No Vehicle | 24 (0.5%) | 22 (0.6%) |
| 1 Vehicle | 473 (10.8%) | 488 (12.5%) |
| 2 Vehicles | 2,165 (49.3%) | 2,144 (54.8%) |
| 3 Vehicles | 915 (20.8%) | 813 (20.8%) |
| 4 Vehicles | 706 (16.1%) | 384 (9.8%) |
| 5 or more Vehicles | 108 (2.5%) | 60 (1.5%) |
| Total | 4,391 (100.0%) | 3,911 (100.0%) |
Commute Time in South Venice
The most frequently occuring commute durations in South Venice are 10 to 14 minutes (1,462 commuters, 20.8%), 20 to 24 minutes (1,111 commuters, 15.8%), and 15 to 19 minutes (993 commuters, 14.1%).
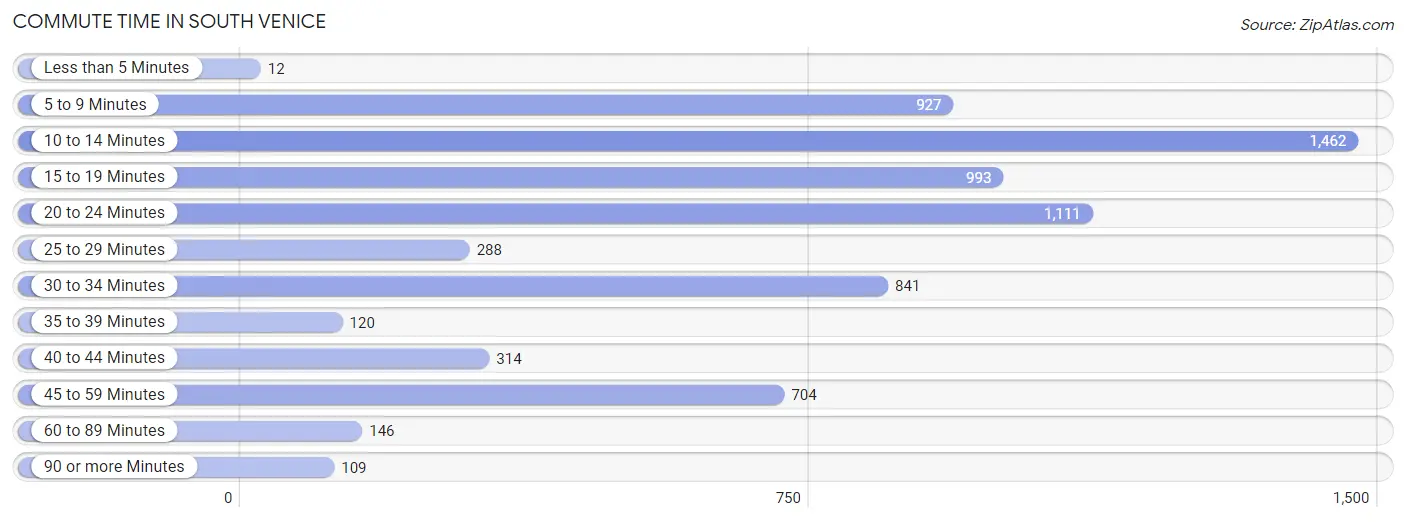
| Commute Time | # Commuters | % Commuters |
| Less than 5 Minutes | 12 | 0.2% |
| 5 to 9 Minutes | 927 | 13.2% |
| 10 to 14 Minutes | 1,462 | 20.8% |
| 15 to 19 Minutes | 993 | 14.1% |
| 20 to 24 Minutes | 1,111 | 15.8% |
| 25 to 29 Minutes | 288 | 4.1% |
| 30 to 34 Minutes | 841 | 12.0% |
| 35 to 39 Minutes | 120 | 1.7% |
| 40 to 44 Minutes | 314 | 4.5% |
| 45 to 59 Minutes | 704 | 10.0% |
| 60 to 89 Minutes | 146 | 2.1% |
| 90 or more Minutes | 109 | 1.5% |
Commute Time by Sex in South Venice
The most common commute times in South Venice are 10 to 14 minutes (736 commuters, 18.5%) for males and 10 to 14 minutes (726 commuters, 23.8%) for females.
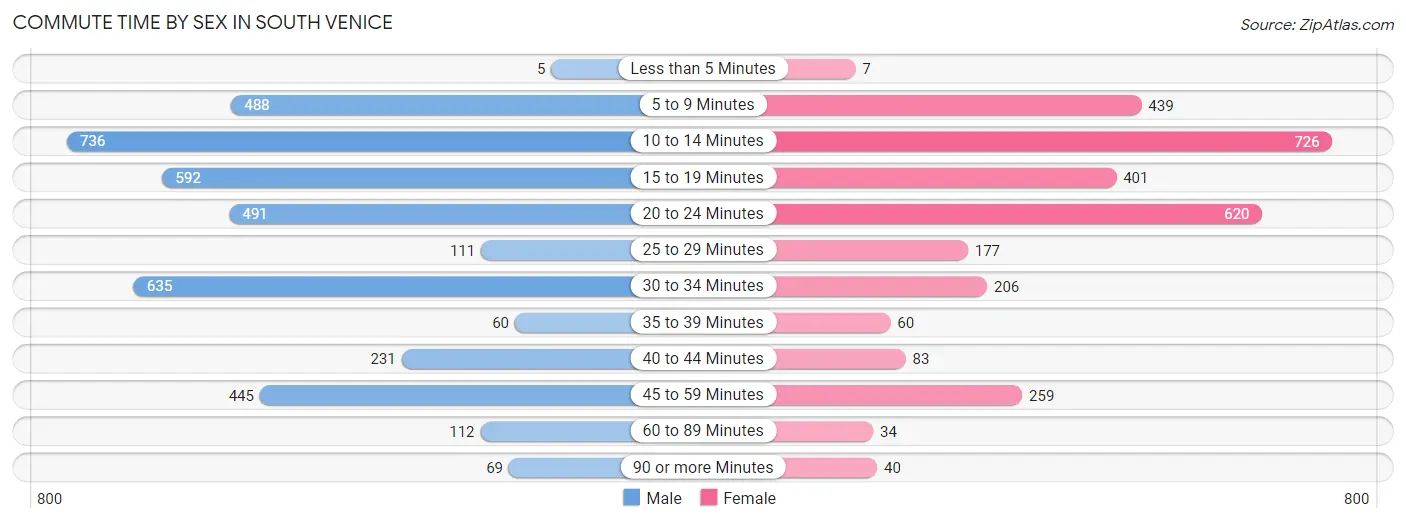
| Commute Time | Male | Female |
| Less than 5 Minutes | 5 (0.1%) | 7 (0.2%) |
| 5 to 9 Minutes | 488 (12.3%) | 439 (14.4%) |
| 10 to 14 Minutes | 736 (18.5%) | 726 (23.8%) |
| 15 to 19 Minutes | 592 (14.9%) | 401 (13.1%) |
| 20 to 24 Minutes | 491 (12.3%) | 620 (20.3%) |
| 25 to 29 Minutes | 111 (2.8%) | 177 (5.8%) |
| 30 to 34 Minutes | 635 (16.0%) | 206 (6.8%) |
| 35 to 39 Minutes | 60 (1.5%) | 60 (2.0%) |
| 40 to 44 Minutes | 231 (5.8%) | 83 (2.7%) |
| 45 to 59 Minutes | 445 (11.2%) | 259 (8.5%) |
| 60 to 89 Minutes | 112 (2.8%) | 34 (1.1%) |
| 90 or more Minutes | 69 (1.7%) | 40 (1.3%) |
Time of Departure to Work by Sex in South Venice
The most frequent times of departure to work in South Venice are 7:30 AM to 7:59 AM (798, 20.1%) for males and 8:00 AM to 8:29 AM (377, 12.3%) for females.
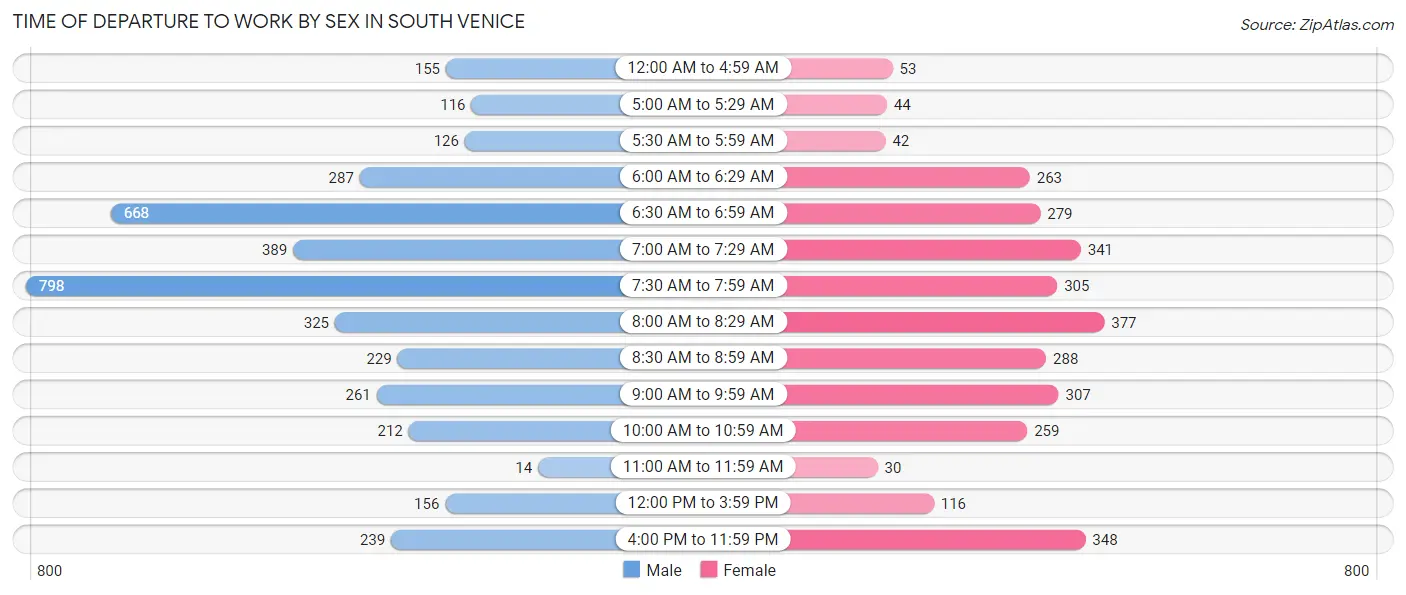
| Time of Departure | Male | Female |
| 12:00 AM to 4:59 AM | 155 (3.9%) | 53 (1.7%) |
| 5:00 AM to 5:29 AM | 116 (2.9%) | 44 (1.4%) |
| 5:30 AM to 5:59 AM | 126 (3.2%) | 42 (1.4%) |
| 6:00 AM to 6:29 AM | 287 (7.2%) | 263 (8.6%) |
| 6:30 AM to 6:59 AM | 668 (16.8%) | 279 (9.1%) |
| 7:00 AM to 7:29 AM | 389 (9.8%) | 341 (11.2%) |
| 7:30 AM to 7:59 AM | 798 (20.1%) | 305 (10.0%) |
| 8:00 AM to 8:29 AM | 325 (8.2%) | 377 (12.3%) |
| 8:30 AM to 8:59 AM | 229 (5.8%) | 288 (9.4%) |
| 9:00 AM to 9:59 AM | 261 (6.6%) | 307 (10.1%) |
| 10:00 AM to 10:59 AM | 212 (5.3%) | 259 (8.5%) |
| 11:00 AM to 11:59 AM | 14 (0.4%) | 30 (1.0%) |
| 12:00 PM to 3:59 PM | 156 (3.9%) | 116 (3.8%) |
| 4:00 PM to 11:59 PM | 239 (6.0%) | 348 (11.4%) |
| Total | 3,975 (100.0%) | 3,052 (100.0%) |
Housing Occupancy in South Venice
Occupancy by Ownership in South Venice
Of the total 7,218 dwellings in South Venice, owner-occupied units account for 5,961 (82.6%), while renter-occupied units make up 1,257 (17.4%).
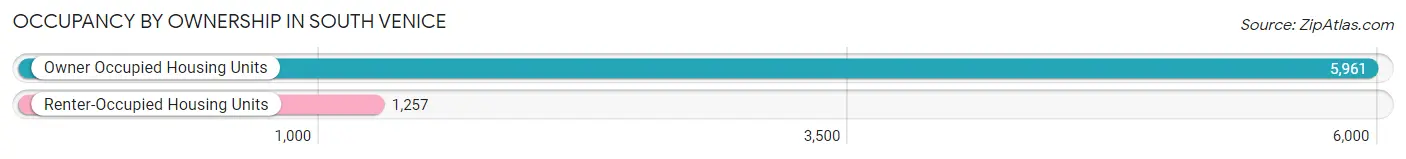
| Occupancy | # Housing Units | % Housing Units |
| Owner Occupied Housing Units | 5,961 | 82.6% |
| Renter-Occupied Housing Units | 1,257 | 17.4% |
| Total Occupied Housing Units | 7,218 | 100.0% |
Occupancy by Household Size in South Venice
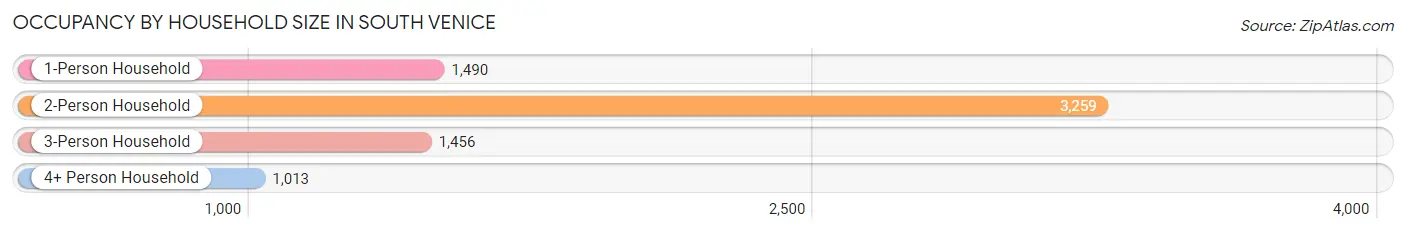
| Household Size | # Housing Units | % Housing Units |
| 1-Person Household | 1,490 | 20.6% |
| 2-Person Household | 3,259 | 45.2% |
| 3-Person Household | 1,456 | 20.2% |
| 4+ Person Household | 1,013 | 14.0% |
| Total Housing Units | 7,218 | 100.0% |
Occupancy by Ownership by Household Size in South Venice
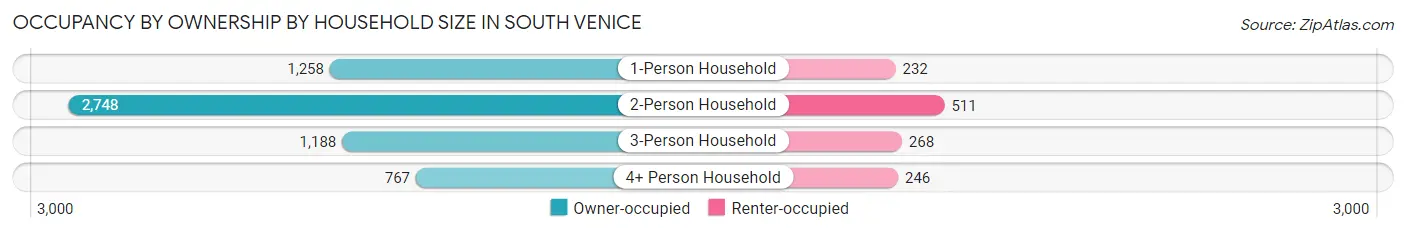
| Household Size | Owner-occupied | Renter-occupied |
| 1-Person Household | 1,258 (84.4%) | 232 (15.6%) |
| 2-Person Household | 2,748 (84.3%) | 511 (15.7%) |
| 3-Person Household | 1,188 (81.6%) | 268 (18.4%) |
| 4+ Person Household | 767 (75.7%) | 246 (24.3%) |
| Total Housing Units | 5,961 (82.6%) | 1,257 (17.4%) |
Occupancy by Educational Attainment in South Venice
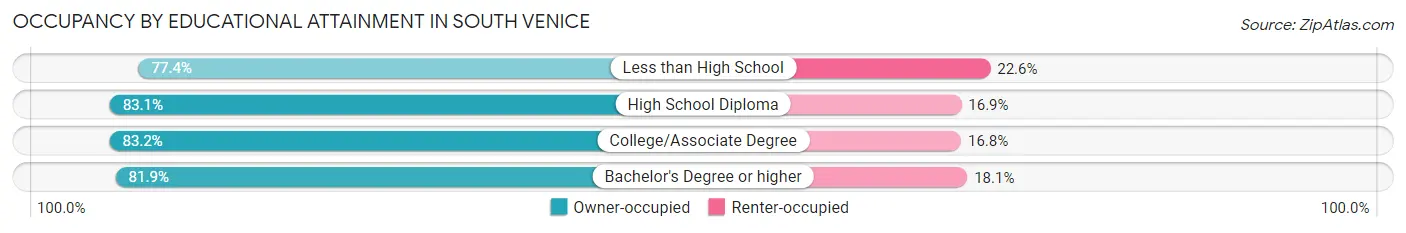
| Household Size | Owner-occupied | Renter-occupied |
| Less than High School | 236 (77.4%) | 69 (22.6%) |
| High School Diploma | 1,634 (83.1%) | 332 (16.9%) |
| College/Associate Degree | 2,526 (83.2%) | 511 (16.8%) |
| Bachelor's Degree or higher | 1,565 (81.9%) | 345 (18.1%) |
Occupancy by Age of Householder in South Venice
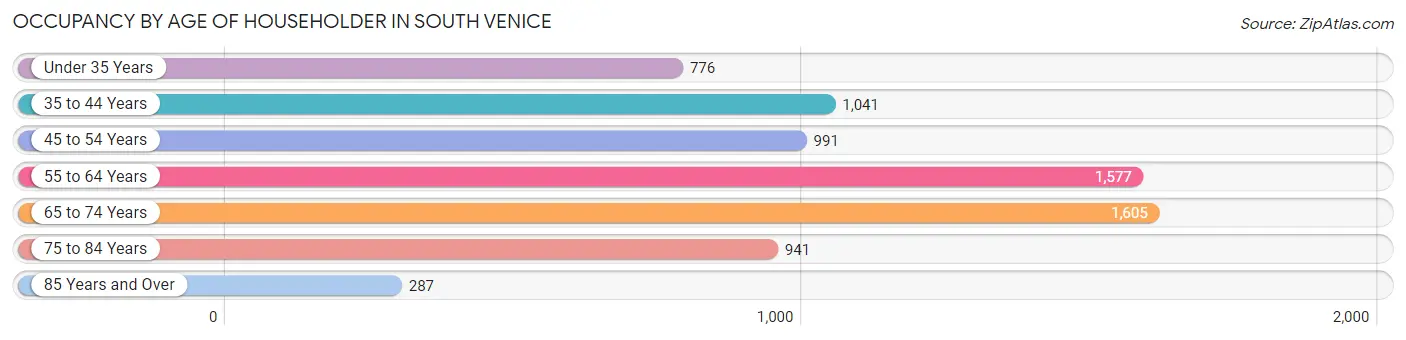
| Age Bracket | # Households | % Households |
| Under 35 Years | 776 | 10.7% |
| 35 to 44 Years | 1,041 | 14.4% |
| 45 to 54 Years | 991 | 13.7% |
| 55 to 64 Years | 1,577 | 21.8% |
| 65 to 74 Years | 1,605 | 22.2% |
| 75 to 84 Years | 941 | 13.0% |
| 85 Years and Over | 287 | 4.0% |
| Total | 7,218 | 100.0% |
Housing Finances in South Venice
Median Income by Occupancy in South Venice
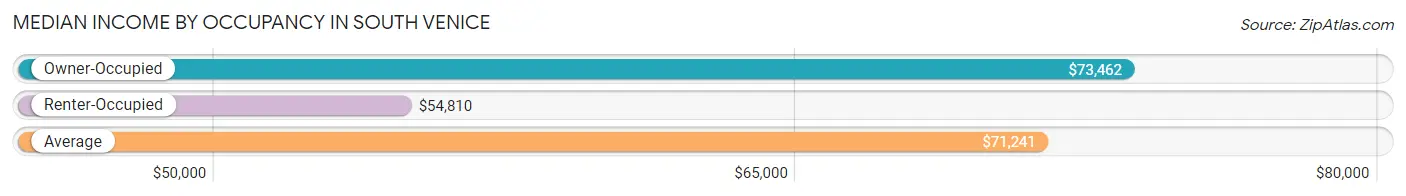
| Occupancy Type | # Households | Median Income |
| Owner-Occupied | 5,961 (82.6%) | $73,462 |
| Renter-Occupied | 1,257 (17.4%) | $54,810 |
| Average | 7,218 (100.0%) | $71,241 |
Occupancy by Householder Income Bracket in South Venice
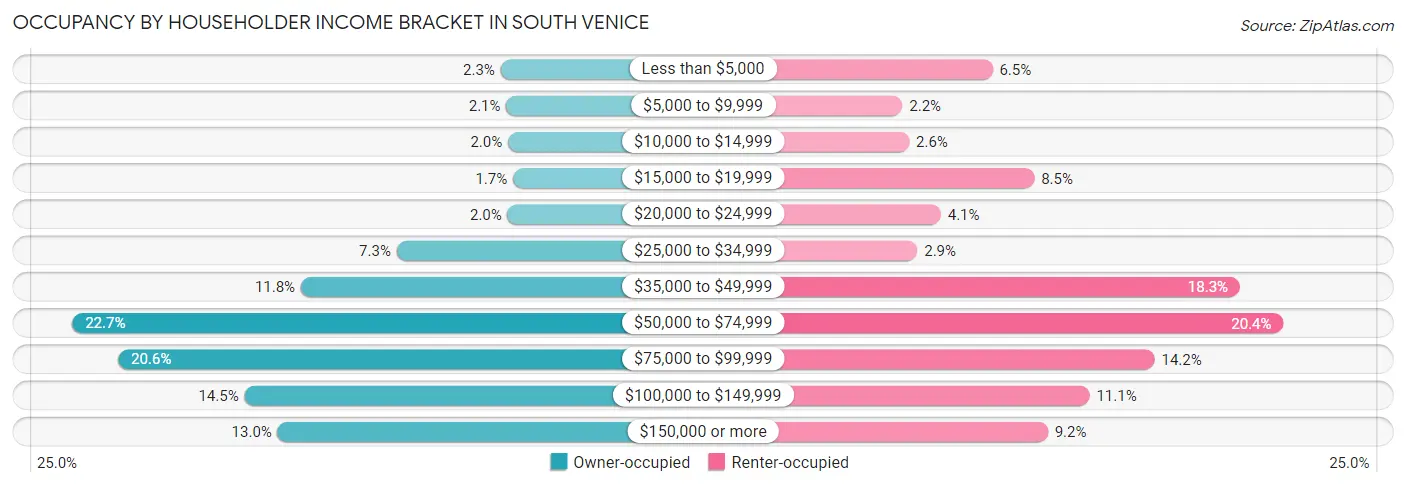
| Income Bracket | Owner-occupied | Renter-occupied |
| Less than $5,000 | 139 (2.3%) | 82 (6.5%) |
| $5,000 to $9,999 | 123 (2.1%) | 28 (2.2%) |
| $10,000 to $14,999 | 118 (2.0%) | 32 (2.5%) |
| $15,000 to $19,999 | 104 (1.7%) | 107 (8.5%) |
| $20,000 to $24,999 | 119 (2.0%) | 51 (4.1%) |
| $25,000 to $34,999 | 434 (7.3%) | 37 (2.9%) |
| $35,000 to $49,999 | 706 (11.8%) | 230 (18.3%) |
| $50,000 to $74,999 | 1,355 (22.7%) | 256 (20.4%) |
| $75,000 to $99,999 | 1,225 (20.5%) | 179 (14.2%) |
| $100,000 to $149,999 | 866 (14.5%) | 140 (11.1%) |
| $150,000 or more | 772 (13.0%) | 115 (9.1%) |
| Total | 5,961 (100.0%) | 1,257 (100.0%) |
Monthly Housing Cost Tiers in South Venice
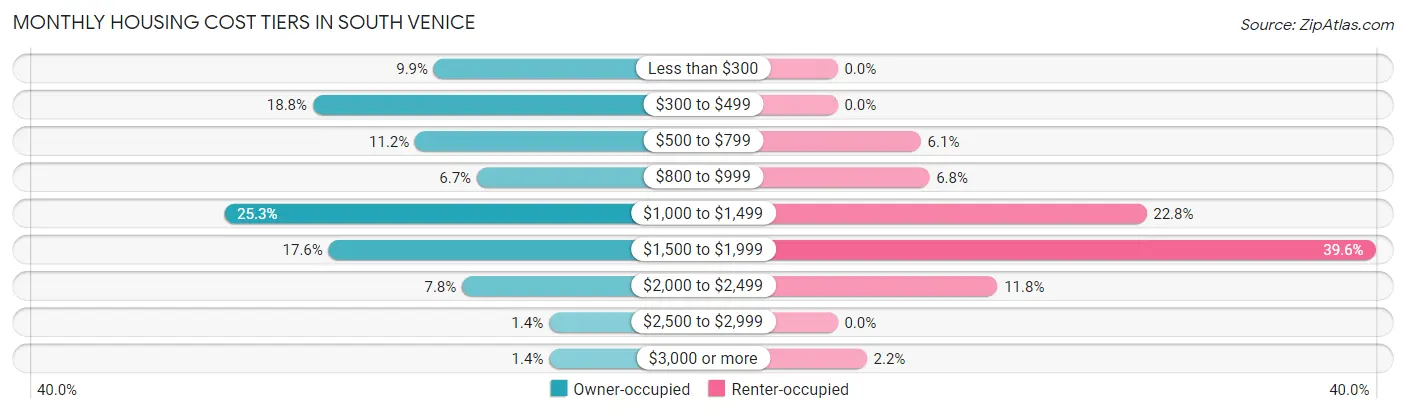
| Monthly Cost | Owner-occupied | Renter-occupied |
| Less than $300 | 588 (9.9%) | 0 (0.0%) |
| $300 to $499 | 1,119 (18.8%) | 0 (0.0%) |
| $500 to $799 | 670 (11.2%) | 77 (6.1%) |
| $800 to $999 | 399 (6.7%) | 85 (6.8%) |
| $1,000 to $1,499 | 1,508 (25.3%) | 286 (22.8%) |
| $1,500 to $1,999 | 1,050 (17.6%) | 498 (39.6%) |
| $2,000 to $2,499 | 464 (7.8%) | 148 (11.8%) |
| $2,500 to $2,999 | 82 (1.4%) | 0 (0.0%) |
| $3,000 or more | 81 (1.4%) | 27 (2.1%) |
| Total | 5,961 (100.0%) | 1,257 (100.0%) |
Physical Housing Characteristics in South Venice
Housing Structures in South Venice
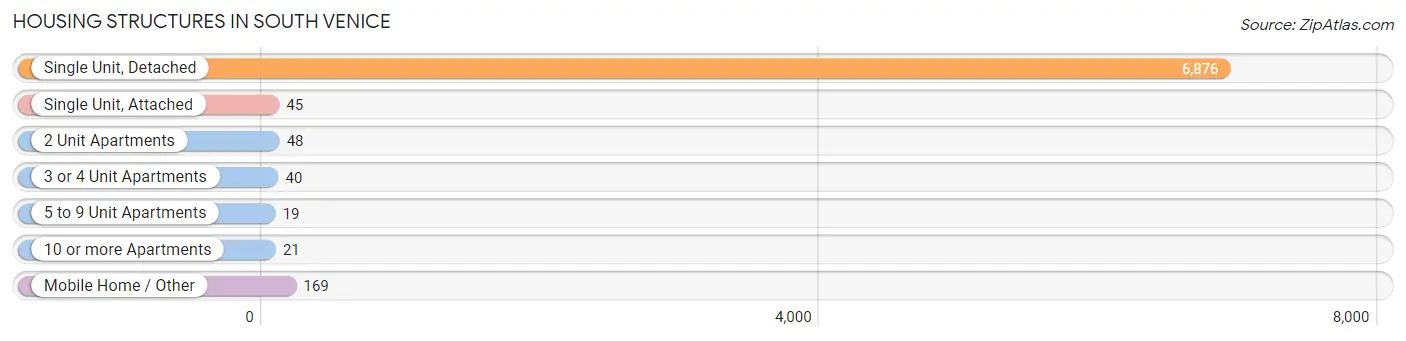
| Structure Type | # Housing Units | % Housing Units |
| Single Unit, Detached | 6,876 | 95.3% |
| Single Unit, Attached | 45 | 0.6% |
| 2 Unit Apartments | 48 | 0.7% |
| 3 or 4 Unit Apartments | 40 | 0.5% |
| 5 to 9 Unit Apartments | 19 | 0.3% |
| 10 or more Apartments | 21 | 0.3% |
| Mobile Home / Other | 169 | 2.3% |
| Total | 7,218 | 100.0% |
Housing Structures by Occupancy in South Venice
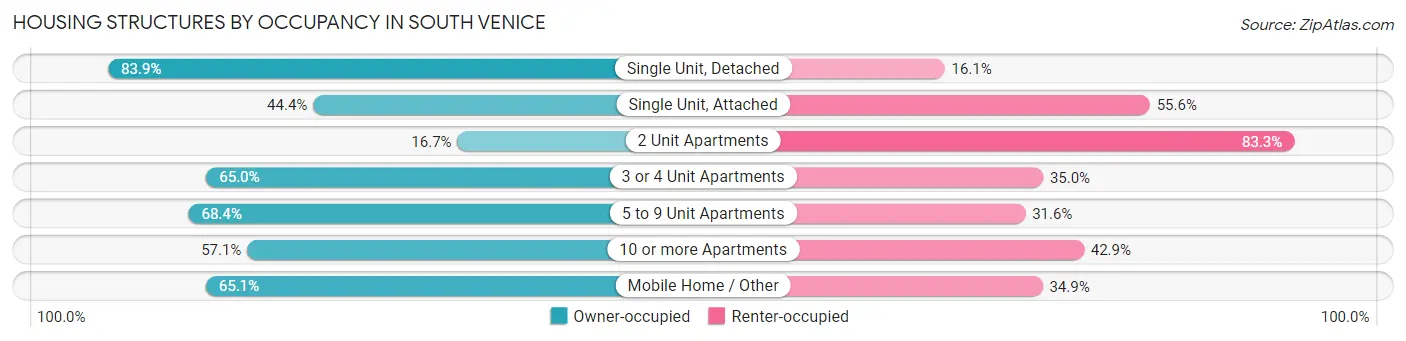
| Structure Type | Owner-occupied | Renter-occupied |
| Single Unit, Detached | 5,772 (83.9%) | 1,104 (16.1%) |
| Single Unit, Attached | 20 (44.4%) | 25 (55.6%) |
| 2 Unit Apartments | 8 (16.7%) | 40 (83.3%) |
| 3 or 4 Unit Apartments | 26 (65.0%) | 14 (35.0%) |
| 5 to 9 Unit Apartments | 13 (68.4%) | 6 (31.6%) |
| 10 or more Apartments | 12 (57.1%) | 9 (42.9%) |
| Mobile Home / Other | 110 (65.1%) | 59 (34.9%) |
| Total | 5,961 (82.6%) | 1,257 (17.4%) |
Housing Structures by Number of Rooms in South Venice
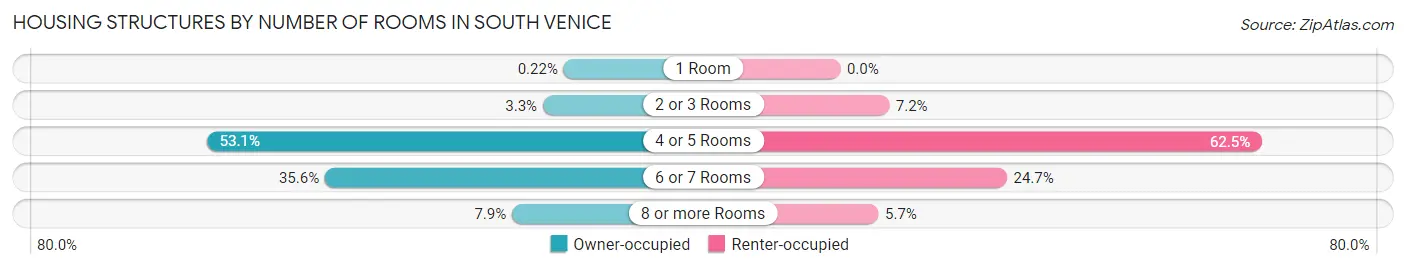
| Number of Rooms | Owner-occupied | Renter-occupied |
| 1 Room | 13 (0.2%) | 0 (0.0%) |
| 2 or 3 Rooms | 197 (3.3%) | 91 (7.2%) |
| 4 or 5 Rooms | 3,163 (53.1%) | 785 (62.5%) |
| 6 or 7 Rooms | 2,119 (35.5%) | 310 (24.7%) |
| 8 or more Rooms | 469 (7.9%) | 71 (5.7%) |
| Total | 5,961 (100.0%) | 1,257 (100.0%) |
Housing Structure by Heating Type in South Venice
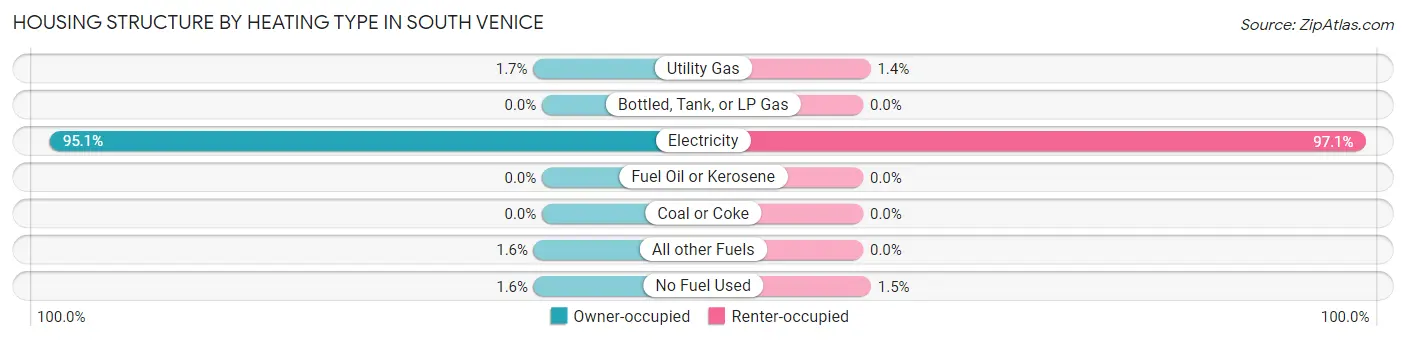
| Heating Type | Owner-occupied | Renter-occupied |
| Utility Gas | 101 (1.7%) | 18 (1.4%) |
| Bottled, Tank, or LP Gas | 0 (0.0%) | 0 (0.0%) |
| Electricity | 5,670 (95.1%) | 1,220 (97.1%) |
| Fuel Oil or Kerosene | 0 (0.0%) | 0 (0.0%) |
| Coal or Coke | 0 (0.0%) | 0 (0.0%) |
| All other Fuels | 95 (1.6%) | 0 (0.0%) |
| No Fuel Used | 95 (1.6%) | 19 (1.5%) |
| Total | 5,961 (100.0%) | 1,257 (100.0%) |
Household Vehicle Usage in South Venice
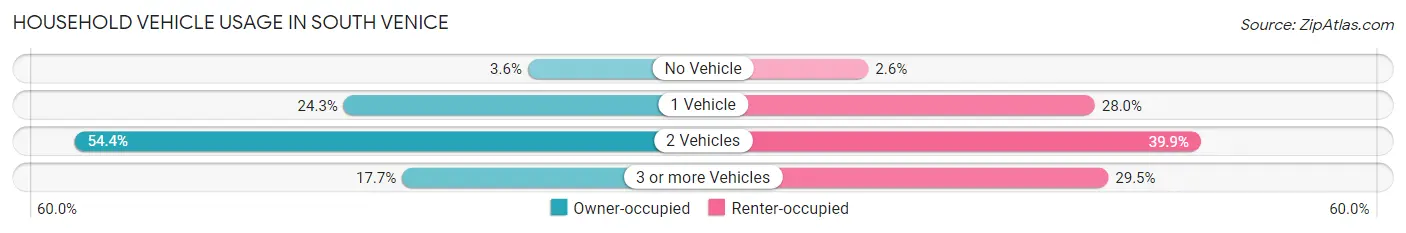
| Vehicles per Household | Owner-occupied | Renter-occupied |
| No Vehicle | 217 (3.6%) | 33 (2.6%) |
| 1 Vehicle | 1,446 (24.3%) | 352 (28.0%) |
| 2 Vehicles | 3,242 (54.4%) | 501 (39.9%) |
| 3 or more Vehicles | 1,056 (17.7%) | 371 (29.5%) |
| Total | 5,961 (100.0%) | 1,257 (100.0%) |
Real Estate & Mortgages in South Venice
Real Estate and Mortgage Overview in South Venice
| Characteristic | Without Mortgage | With Mortgage |
| Housing Units | 2,277 | 3,684 |
| Median Property Value | $243,400 | $283,600 |
| Median Household Income | $57,801 | $652 |
| Monthly Housing Costs | $394 | $81 |
| Real Estate Taxes | $1,565 | $50 |
Property Value by Mortgage Status in South Venice
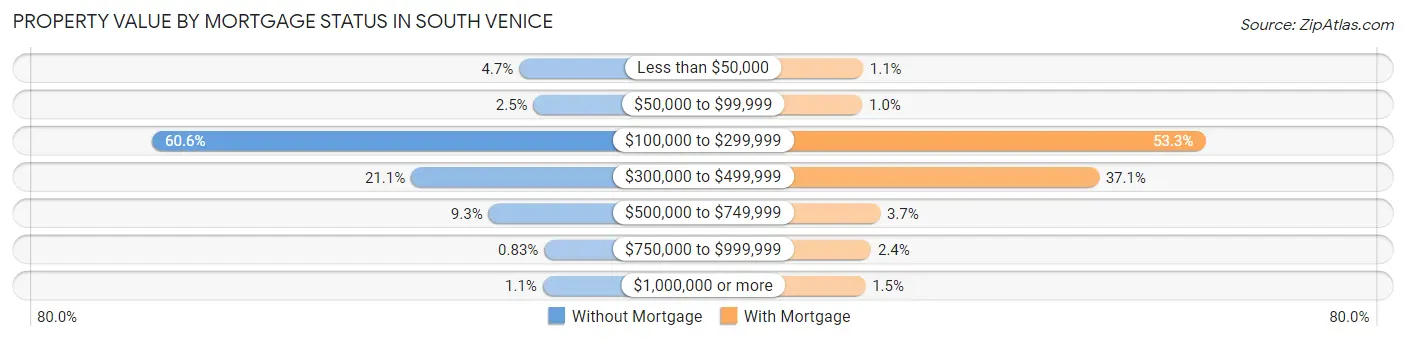
| Property Value | Without Mortgage | With Mortgage |
| Less than $50,000 | 106 (4.7%) | 41 (1.1%) |
| $50,000 to $99,999 | 56 (2.5%) | 37 (1.0%) |
| $100,000 to $299,999 | 1,379 (60.6%) | 1,963 (53.3%) |
| $300,000 to $499,999 | 481 (21.1%) | 1,365 (37.0%) |
| $500,000 to $749,999 | 212 (9.3%) | 137 (3.7%) |
| $750,000 to $999,999 | 19 (0.8%) | 87 (2.4%) |
| $1,000,000 or more | 24 (1.1%) | 54 (1.5%) |
| Total | 2,277 (100.0%) | 3,684 (100.0%) |
Household Income by Mortgage Status in South Venice
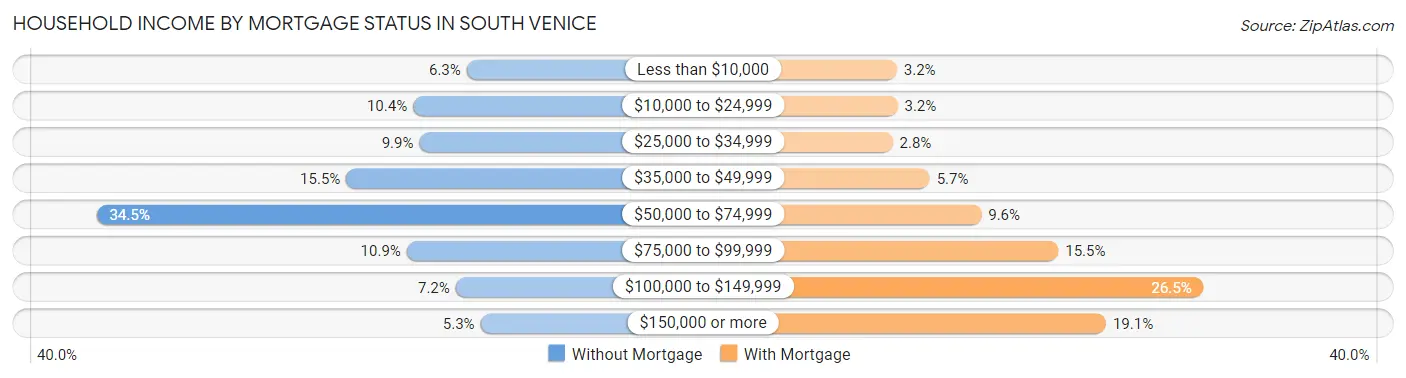
| Household Income | Without Mortgage | With Mortgage |
| Less than $10,000 | 144 (6.3%) | 116 (3.2%) |
| $10,000 to $24,999 | 237 (10.4%) | 118 (3.2%) |
| $25,000 to $34,999 | 226 (9.9%) | 104 (2.8%) |
| $35,000 to $49,999 | 353 (15.5%) | 208 (5.7%) |
| $50,000 to $74,999 | 786 (34.5%) | 353 (9.6%) |
| $75,000 to $99,999 | 248 (10.9%) | 569 (15.4%) |
| $100,000 to $149,999 | 163 (7.2%) | 977 (26.5%) |
| $150,000 or more | 120 (5.3%) | 703 (19.1%) |
| Total | 2,277 (100.0%) | 3,684 (100.0%) |
Property Value to Household Income Ratio in South Venice
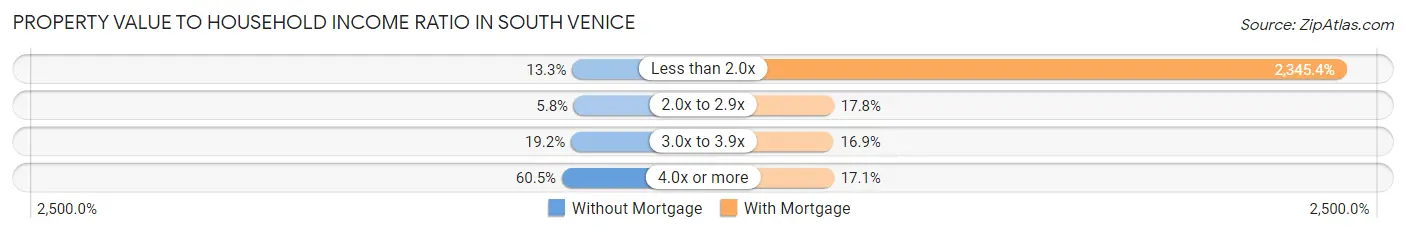
| Value-to-Income Ratio | Without Mortgage | With Mortgage |
| Less than 2.0x | 303 (13.3%) | 86,404 (2,345.4%) |
| 2.0x to 2.9x | 133 (5.8%) | 657 (17.8%) |
| 3.0x to 3.9x | 437 (19.2%) | 623 (16.9%) |
| 4.0x or more | 1,377 (60.5%) | 630 (17.1%) |
| Total | 2,277 (100.0%) | 3,684 (100.0%) |
Real Estate Taxes by Mortgage Status in South Venice
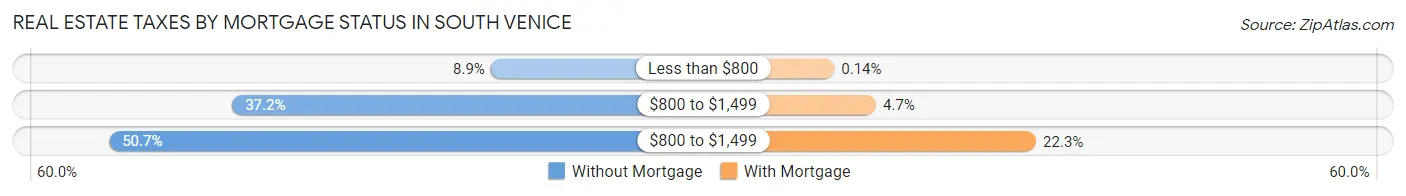
| Property Taxes | Without Mortgage | With Mortgage |
| Less than $800 | 203 (8.9%) | 5 (0.1%) |
| $800 to $1,499 | 848 (37.2%) | 174 (4.7%) |
| $800 to $1,499 | 1,155 (50.7%) | 820 (22.3%) |
| Total | 2,277 (100.0%) | 3,684 (100.0%) |
Health & Disability in South Venice
Health Insurance Coverage by Age in South Venice
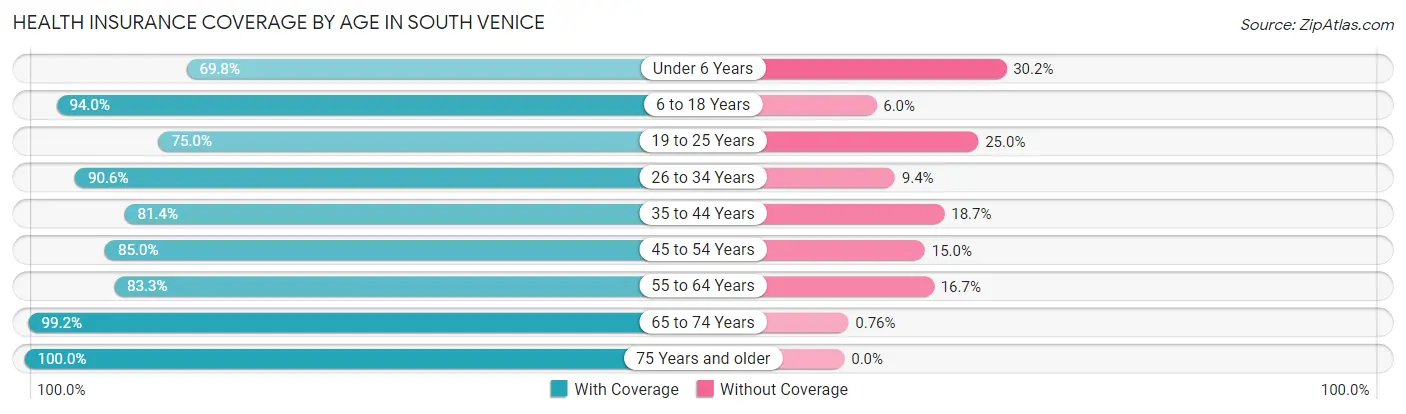
| Age Bracket | With Coverage | Without Coverage |
| Under 6 Years | 749 (69.8%) | 324 (30.2%) |
| 6 to 18 Years | 1,831 (94.0%) | 116 (6.0%) |
| 19 to 25 Years | 904 (75.0%) | 301 (25.0%) |
| 26 to 34 Years | 1,385 (90.6%) | 144 (9.4%) |
| 35 to 44 Years | 1,753 (81.4%) | 402 (18.6%) |
| 45 to 54 Years | 1,818 (85.0%) | 321 (15.0%) |
| 55 to 64 Years | 2,412 (83.3%) | 483 (16.7%) |
| 65 to 74 Years | 2,617 (99.2%) | 20 (0.8%) |
| 75 Years and older | 1,889 (100.0%) | 0 (0.0%) |
| Total | 15,358 (87.9%) | 2,111 (12.1%) |
Health Insurance Coverage by Citizenship Status in South Venice
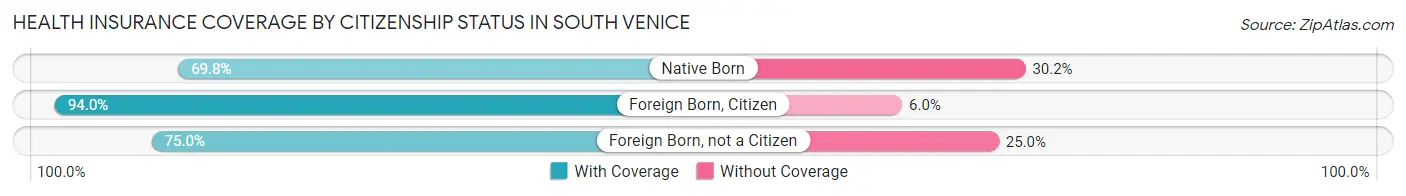
| Citizenship Status | With Coverage | Without Coverage |
| Native Born | 749 (69.8%) | 324 (30.2%) |
| Foreign Born, Citizen | 1,831 (94.0%) | 116 (6.0%) |
| Foreign Born, not a Citizen | 904 (75.0%) | 301 (25.0%) |
Health Insurance Coverage by Household Income in South Venice
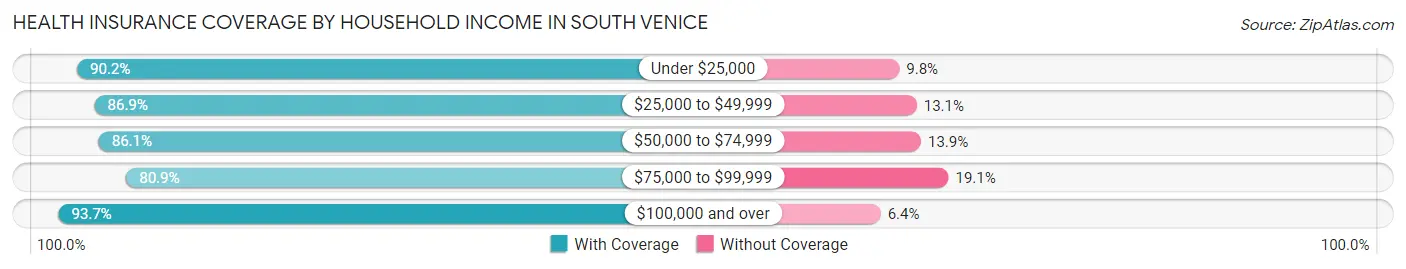
| Household Income | With Coverage | Without Coverage |
| Under $25,000 | 1,283 (90.2%) | 140 (9.8%) |
| $25,000 to $49,999 | 2,444 (86.9%) | 369 (13.1%) |
| $50,000 to $74,999 | 3,483 (86.1%) | 563 (13.9%) |
| $75,000 to $99,999 | 2,892 (80.9%) | 681 (19.1%) |
| $100,000 and over | 5,234 (93.6%) | 355 (6.4%) |
Public vs Private Health Insurance Coverage by Age in South Venice
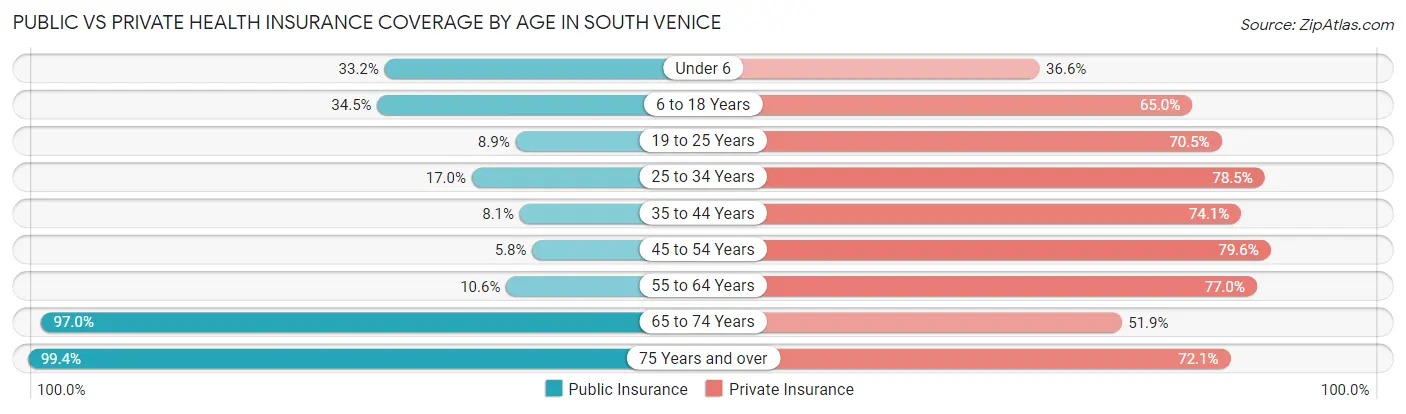
| Age Bracket | Public Insurance | Private Insurance |
| Under 6 | 356 (33.2%) | 393 (36.6%) |
| 6 to 18 Years | 672 (34.5%) | 1,266 (65.0%) |
| 19 to 25 Years | 107 (8.9%) | 849 (70.5%) |
| 25 to 34 Years | 260 (17.0%) | 1,200 (78.5%) |
| 35 to 44 Years | 174 (8.1%) | 1,597 (74.1%) |
| 45 to 54 Years | 123 (5.8%) | 1,702 (79.6%) |
| 55 to 64 Years | 307 (10.6%) | 2,230 (77.0%) |
| 65 to 74 Years | 2,559 (97.0%) | 1,368 (51.9%) |
| 75 Years and over | 1,878 (99.4%) | 1,362 (72.1%) |
| Total | 6,436 (36.8%) | 11,967 (68.5%) |
Disability Status by Sex by Age in South Venice
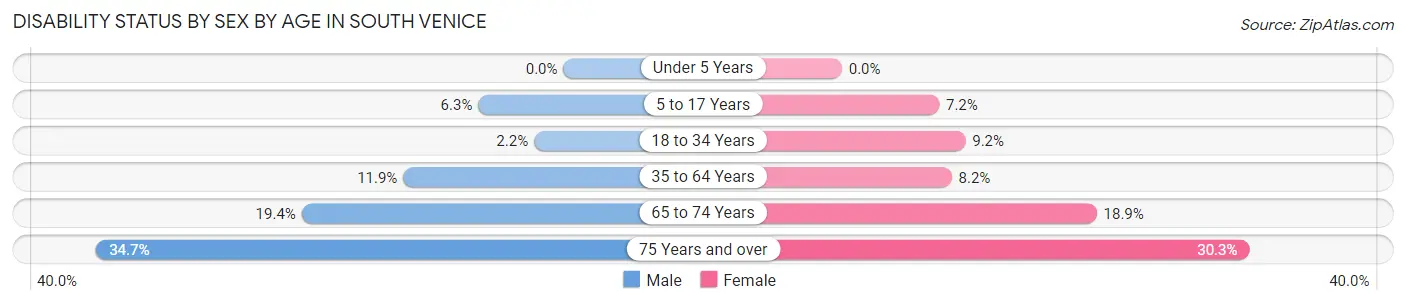
| Age Bracket | Male | Female |
| Under 5 Years | 0 (0.0%) | 0 (0.0%) |
| 5 to 17 Years | 48 (6.3%) | 103 (7.2%) |
| 18 to 34 Years | 35 (2.2%) | 116 (9.2%) |
| 35 to 64 Years | 435 (11.9%) | 288 (8.2%) |
| 65 to 74 Years | 232 (19.4%) | 273 (18.9%) |
| 75 Years and over | 310 (34.7%) | 301 (30.2%) |
Disability Class by Sex by Age in South Venice
Disability Class: Hearing Difficulty
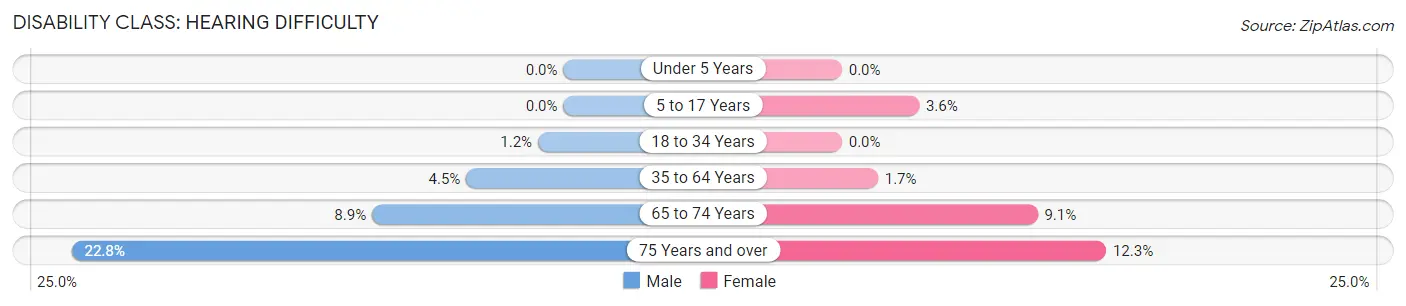
| Age Bracket | Male | Female |
| Under 5 Years | 0 (0.0%) | 0 (0.0%) |
| 5 to 17 Years | 0 (0.0%) | 51 (3.6%) |
| 18 to 34 Years | 19 (1.2%) | 0 (0.0%) |
| 35 to 64 Years | 165 (4.5%) | 59 (1.7%) |
| 65 to 74 Years | 106 (8.9%) | 131 (9.1%) |
| 75 Years and over | 204 (22.8%) | 122 (12.3%) |
Disability Class: Vision Difficulty
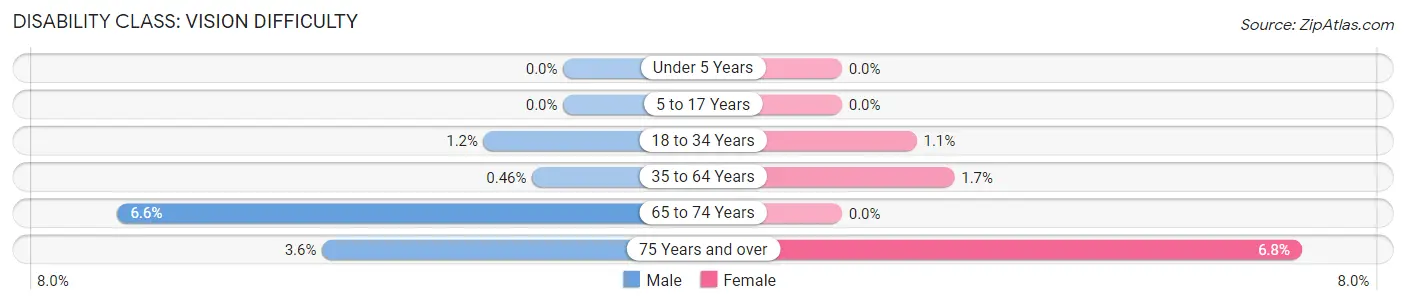
| Age Bracket | Male | Female |
| Under 5 Years | 0 (0.0%) | 0 (0.0%) |
| 5 to 17 Years | 0 (0.0%) | 0 (0.0%) |
| 18 to 34 Years | 19 (1.2%) | 14 (1.1%) |
| 35 to 64 Years | 17 (0.5%) | 59 (1.7%) |
| 65 to 74 Years | 79 (6.6%) | 0 (0.0%) |
| 75 Years and over | 32 (3.6%) | 68 (6.8%) |
Disability Class: Cognitive Difficulty
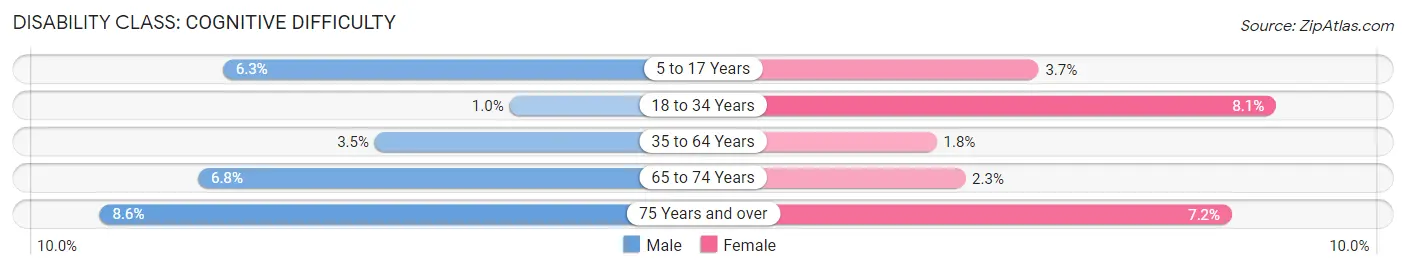
| Age Bracket | Male | Female |
| 5 to 17 Years | 48 (6.3%) | 52 (3.6%) |
| 18 to 34 Years | 16 (1.0%) | 102 (8.1%) |
| 35 to 64 Years | 128 (3.5%) | 62 (1.8%) |
| 65 to 74 Years | 81 (6.8%) | 33 (2.3%) |
| 75 Years and over | 77 (8.6%) | 72 (7.2%) |
Disability Class: Ambulatory Difficulty
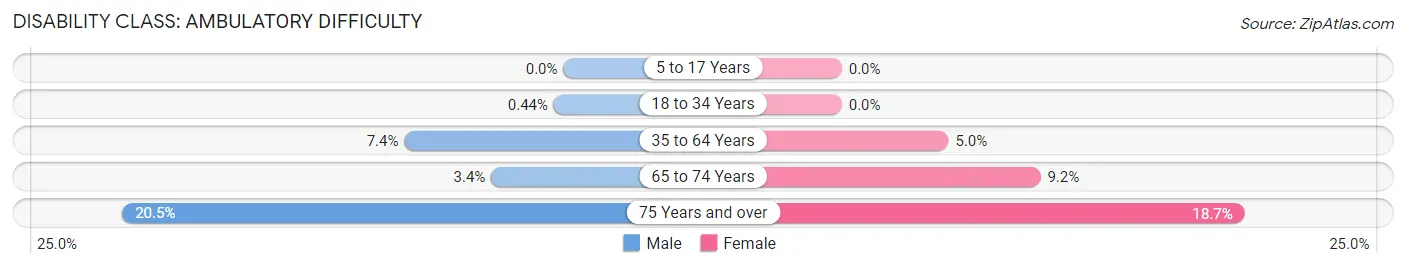
| Age Bracket | Male | Female |
| 5 to 17 Years | 0 (0.0%) | 0 (0.0%) |
| 18 to 34 Years | 7 (0.4%) | 0 (0.0%) |
| 35 to 64 Years | 270 (7.4%) | 175 (5.0%) |
| 65 to 74 Years | 40 (3.4%) | 133 (9.2%) |
| 75 Years and over | 183 (20.5%) | 186 (18.7%) |
Disability Class: Self-Care Difficulty
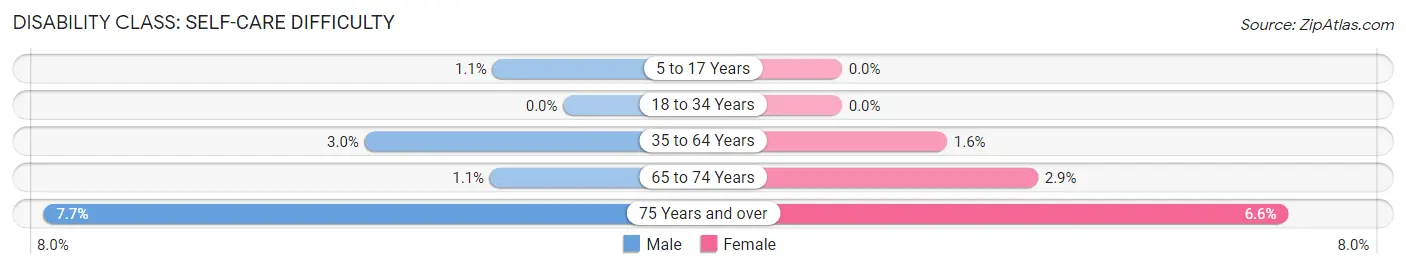
| Age Bracket | Male | Female |
| 5 to 17 Years | 8 (1.1%) | 0 (0.0%) |
| 18 to 34 Years | 0 (0.0%) | 0 (0.0%) |
| 35 to 64 Years | 108 (2.9%) | 55 (1.6%) |
| 65 to 74 Years | 13 (1.1%) | 42 (2.9%) |
| 75 Years and over | 69 (7.7%) | 66 (6.6%) |
Technology Access in South Venice
Computing Device Access in South Venice
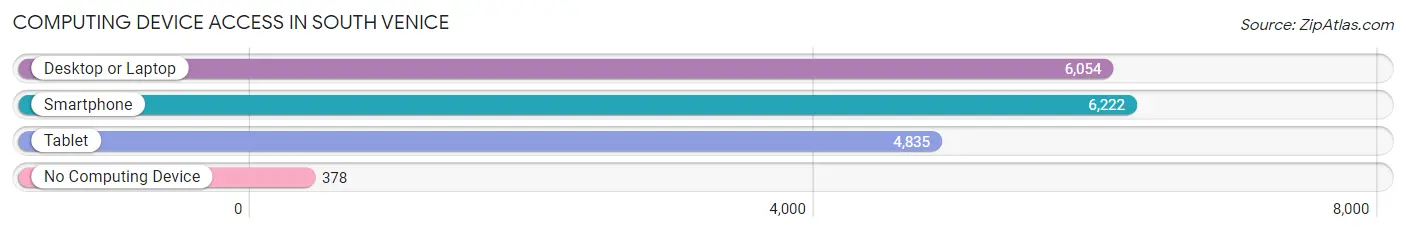
| Device Type | # Households | % Households |
| Desktop or Laptop | 6,054 | 83.9% |
| Smartphone | 6,222 | 86.2% |
| Tablet | 4,835 | 67.0% |
| No Computing Device | 378 | 5.2% |
| Total | 7,218 | 100.0% |
Internet Access in South Venice
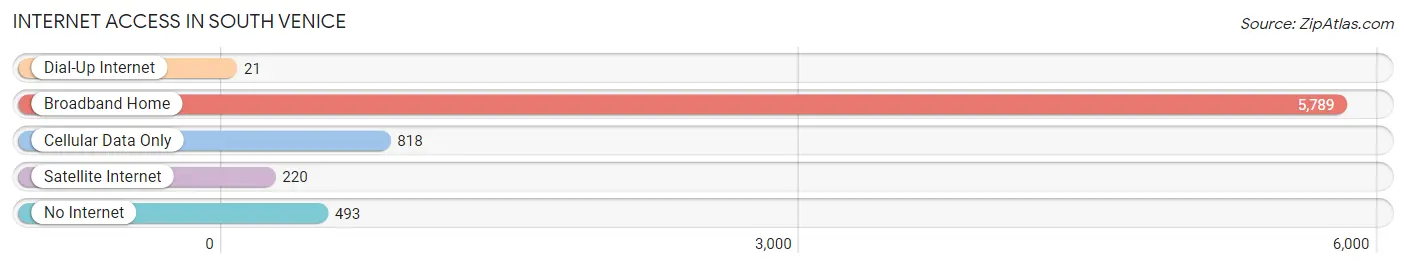
| Internet Type | # Households | % Households |
| Dial-Up Internet | 21 | 0.3% |
| Broadband Home | 5,789 | 80.2% |
| Cellular Data Only | 818 | 11.3% |
| Satellite Internet | 220 | 3.0% |
| No Internet | 493 | 6.8% |
| Total | 7,218 | 100.0% |
South Venice Summary
Venice, Florida is a small city located in Sarasota County, on the Gulf Coast of Florida. It is part of the Bradenton-Sarasota-Venice Metropolitan Statistical Area. The city is known for its beaches, canals, and its unique architecture.
History
The area that is now Venice was first inhabited by the Calusa Indians, who lived in the area for thousands of years before the arrival of Europeans. The first Europeans to settle in the area were the Spanish, who arrived in the late 1500s. The Spanish established a mission in the area, but it was abandoned in the early 1700s.
In the late 1800s, the area was settled by pioneers from Kentucky and Tennessee. The pioneers built a small fishing village, which they named Venice after the Italian city. The village was incorporated in 1927, and the city of Venice was officially established.
Geography
Venice is located on the Gulf Coast of Florida, about 40 miles south of Tampa. It is bordered by the cities of North Port to the north, Englewood to the east, and Sarasota to the south. The city is situated on the Gulf of Mexico, and is home to several beaches, including Caspersen Beach, Manasota Beach, and Venice Beach. The city is also home to several canals, which are used for fishing and boating.
Economy
The economy of Venice is largely based on tourism and retirement. The city is home to several resorts and hotels, as well as a number of retirement communities. The city is also home to several manufacturing companies, including a paper mill and a boat manufacturing plant.
Demographics
As of the 2010 census, the population of Venice was 20,744. The racial makeup of the city was 94.3% White, 2.2% African American, 0.4% Native American, 1.2% Asian, 0.1% Pacific Islander, and 1.8% from other races. The median household income was $41,945, and the median family income was $50,945.
Conclusion
Venice, Florida is a small city located on the Gulf Coast of Florida. It is known for its beaches, canals, and its unique architecture. The city has a largely tourism- and retirement-based economy, and its population is mostly white. Venice is a popular destination for tourists and retirees alike, and is a great place to live and visit.
Common Questions
What is the Total Population of South Venice?
Total Population of South Venice is 17,469.
What is the Total Male Population of South Venice?
Total Male Population of South Venice is 8,573.
What is the Total Female Population of South Venice?
Total Female Population of South Venice is 8,896.
What is the Ratio of Males per 100 Females in South Venice?
There are 96.37 Males per 100 Females in South Venice.
What is the Ratio of Females per 100 Males in South Venice?
There are 103.77 Females per 100 Males in South Venice.
What is the Median Population Age in South Venice?
Median Population Age in South Venice is 49.6 Years.
What is the Average Family Size in South Venice
Average Family Size in South Venice is 2.8 People.
What is the Average Household Size in South Venice
Average Household Size in South Venice is 2.4 People.
What is Per Capita Income in South Venice?
Per Capita income in South Venice is $39,385.
What is the Median Family Income in South Venice?
Median Family Income in South Venice is $80,040.
What is the Median Household income in South Venice?
Median Household Income in South Venice is $71,241.
What is Income or Wage Gap in South Venice?
Income or Wage Gap in South Venice is 40.0%.
Women in South Venice earn 60.0 cents for every dollar earned by a man.
What is Inequality or Gini Index in South Venice?
Inequality or Gini Index in South Venice is 0.46.
How Large is the Labor Force in South Venice?
There are 9,086 People in the Labor Forcein in South Venice.
What is the Percentage of People in the Labor Force in South Venice?
61.9% of People are in the Labor Force in South Venice.
What is the Unemployment Rate in South Venice?
Unemployment Rate in South Venice is 3.5%.