Beverly Hills, FL
Beverly Hills Map
Beverly Hills Overview
9,787
TOTAL POPULATION
4,564
MALE POPULATION
5,223
FEMALE POPULATION
87.38
MALES / 100 FEMALES
114.44
FEMALES / 100 MALES
49.2
MEDIAN AGE
2.9
AVG FAMILY SIZE
2.2
AVG HOUSEHOLD SIZE
$27,043
PER CAPITA INCOME
$55,512
AVG FAMILY INCOME
$42,165
AVG HOUSEHOLD INCOME
28.2%
WAGE / INCOME GAP [ % ]
71.8¢/ $1
WAGE / INCOME GAP [ $ ]
0.45
INEQUALITY / GINI INDEX
4,078
LABOR FORCE [ PEOPLE ]
47.3%
PERCENT IN LABOR FORCE
8.5%
UNEMPLOYMENT RATE
Beverly Hills Zip Codes
Beverly Hills Area Codes
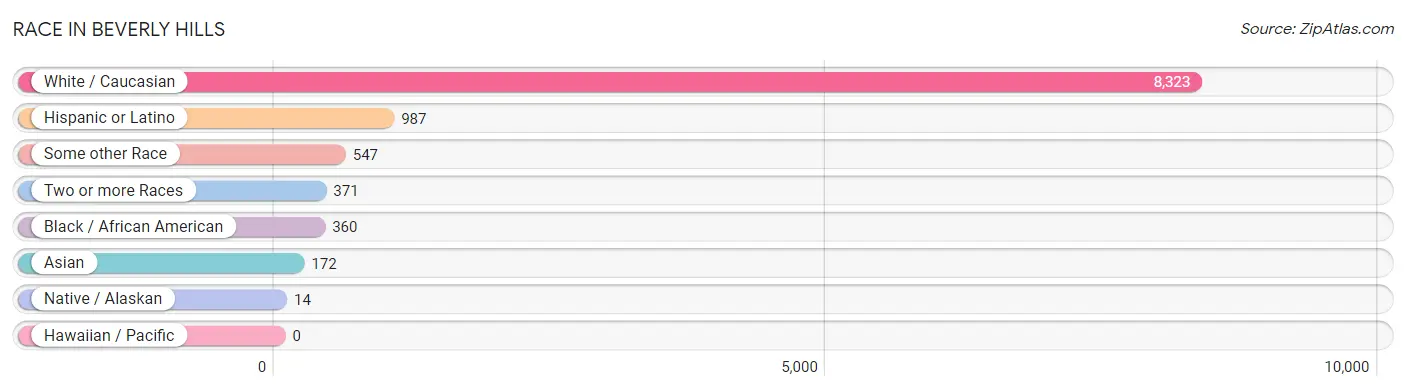
Race in Beverly Hills
The most populous races in Beverly Hills are White / Caucasian (8,323 | 85.0%), Hispanic or Latino (987 | 10.1%), and Some other Race (547 | 5.6%).
| Race | # Population | % Population |
| Asian | 172 | 1.8% |
| Black / African American | 360 | 3.7% |
| Hawaiian / Pacific | 0 | 0.0% |
| Hispanic or Latino | 987 | 10.1% |
| Native / Alaskan | 14 | 0.1% |
| White / Caucasian | 8,323 | 85.0% |
| Two or more Races | 371 | 3.8% |
| Some other Race | 547 | 5.6% |
| Total | 9,787 | 100.0% |
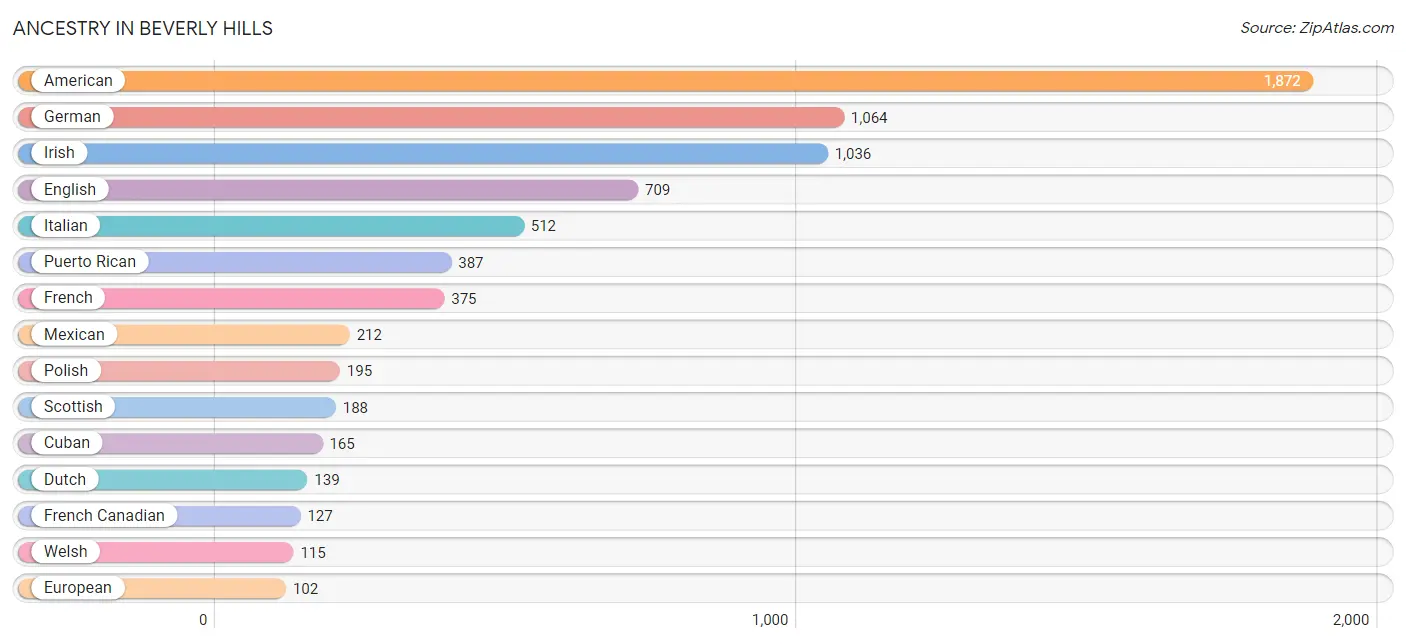
Ancestry in Beverly Hills
The most populous ancestries reported in Beverly Hills are American (1,872 | 19.1%), German (1,064 | 10.9%), Irish (1,036 | 10.6%), English (709 | 7.2%), and Italian (512 | 5.2%), together accounting for 53.1% of all Beverly Hills residents.
| Ancestry | # Population | % Population |
| American | 1,872 | 19.1% |
| Austrian | 29 | 0.3% |
| Bahamian | 11 | 0.1% |
| Belgian | 41 | 0.4% |
| British | 44 | 0.4% |
| Canadian | 21 | 0.2% |
| Central American | 71 | 0.7% |
| Cherokee | 19 | 0.2% |
| Colombian | 27 | 0.3% |
| Costa Rican | 38 | 0.4% |
| Cuban | 165 | 1.7% |
| Czechoslovakian | 22 | 0.2% |
| Dominican | 78 | 0.8% |
| Dutch | 139 | 1.4% |
| Eastern European | 20 | 0.2% |
| Ecuadorian | 40 | 0.4% |
| English | 709 | 7.2% |
| European | 102 | 1.0% |
| Finnish | 13 | 0.1% |
| French | 375 | 3.8% |
| French Canadian | 127 | 1.3% |
| German | 1,064 | 10.9% |
| Greek | 28 | 0.3% |
| Haitian | 3 | 0.0% |
| Honduran | 16 | 0.2% |
| Hungarian | 9 | 0.1% |
| Indian (Asian) | 31 | 0.3% |
| Irish | 1,036 | 10.6% |
| Italian | 512 | 5.2% |
| Jamaican | 61 | 0.6% |
| Korean | 95 | 1.0% |
| Lithuanian | 32 | 0.3% |
| Mexican | 212 | 2.2% |
| Norwegian | 9 | 0.1% |
| Panamanian | 17 | 0.2% |
| Pennsylvania German | 33 | 0.3% |
| Polish | 195 | 2.0% |
| Portuguese | 43 | 0.4% |
| Puerto Rican | 387 | 4.0% |
| Russian | 50 | 0.5% |
| Scotch-Irish | 92 | 0.9% |
| Scottish | 188 | 1.9% |
| Seminole | 22 | 0.2% |
| South American | 67 | 0.7% |
| Sri Lankan | 77 | 0.8% |
| Swedish | 34 | 0.4% |
| Swiss | 23 | 0.2% |
| Thai | 7 | 0.1% |
| Ukrainian | 11 | 0.1% |
| Welsh | 115 | 1.2% |
| West Indian | 15 | 0.2% | View All 51 Rows |
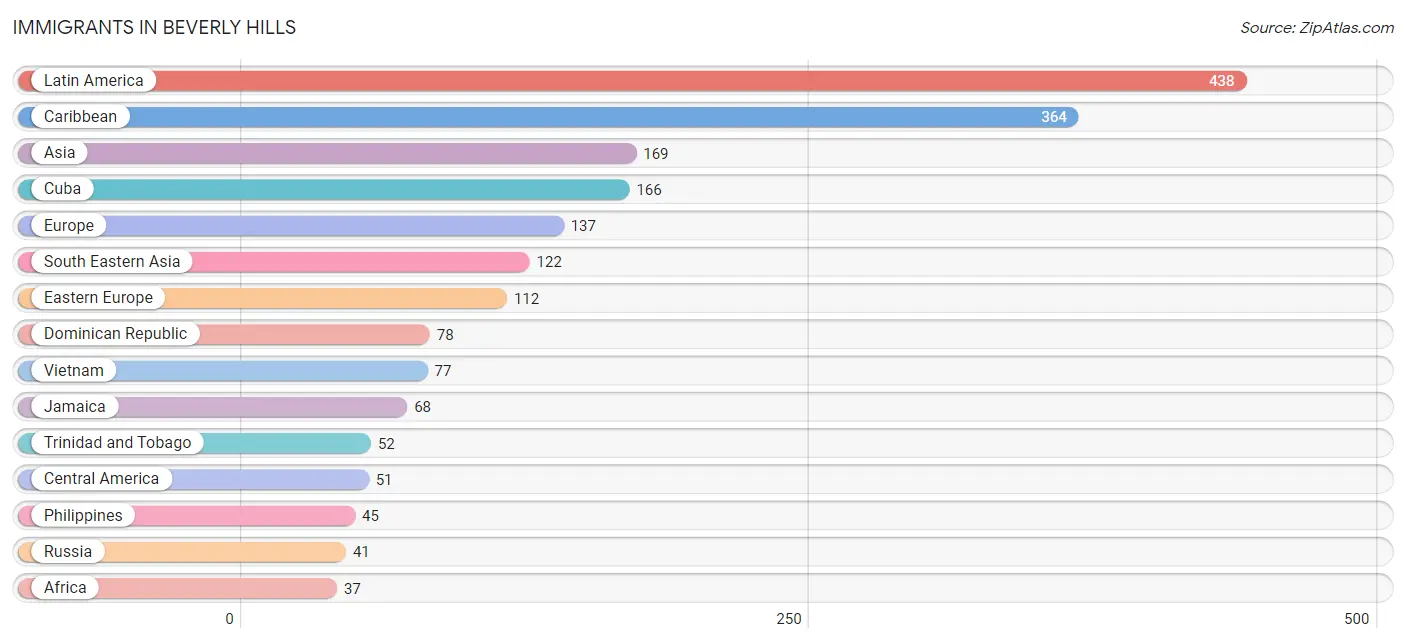
Immigrants in Beverly Hills
The most numerous immigrant groups reported in Beverly Hills came from Latin America (438 | 4.5%), Caribbean (364 | 3.7%), Asia (169 | 1.7%), Cuba (166 | 1.7%), and Europe (137 | 1.4%), together accounting for 13.0% of all Beverly Hills residents.
| Immigration Origin | # Population | % Population |
| Africa | 37 | 0.4% |
| Asia | 169 | 1.7% |
| Canada | 29 | 0.3% |
| Caribbean | 364 | 3.7% |
| Central America | 51 | 0.5% |
| China | 31 | 0.3% |
| Costa Rica | 20 | 0.2% |
| Croatia | 29 | 0.3% |
| Cuba | 166 | 1.7% |
| Dominican Republic | 78 | 0.8% |
| Eastern Asia | 31 | 0.3% |
| Eastern Europe | 112 | 1.1% |
| Ecuador | 23 | 0.2% |
| England | 11 | 0.1% |
| Europe | 137 | 1.4% |
| Germany | 14 | 0.1% |
| Honduras | 16 | 0.2% |
| India | 7 | 0.1% |
| Israel | 9 | 0.1% |
| Jamaica | 68 | 0.7% |
| Latin America | 438 | 4.5% |
| Mexico | 15 | 0.2% |
| Morocco | 28 | 0.3% |
| Northern Africa | 28 | 0.3% |
| Northern Europe | 11 | 0.1% |
| Philippines | 45 | 0.5% |
| Poland | 32 | 0.3% |
| Russia | 41 | 0.4% |
| South America | 23 | 0.2% |
| South Central Asia | 7 | 0.1% |
| South Eastern Asia | 122 | 1.3% |
| Trinidad and Tobago | 52 | 0.5% |
| Vietnam | 77 | 0.8% |
| Western Asia | 9 | 0.1% |
| Western Europe | 14 | 0.1% | View All 35 Rows |
Sex and Age in Beverly Hills
Sex and Age in Beverly Hills
The most populous age groups in Beverly Hills are 70 to 74 Years (384 | 8.4%) for men and 70 to 74 Years (715 | 13.7%) for women.
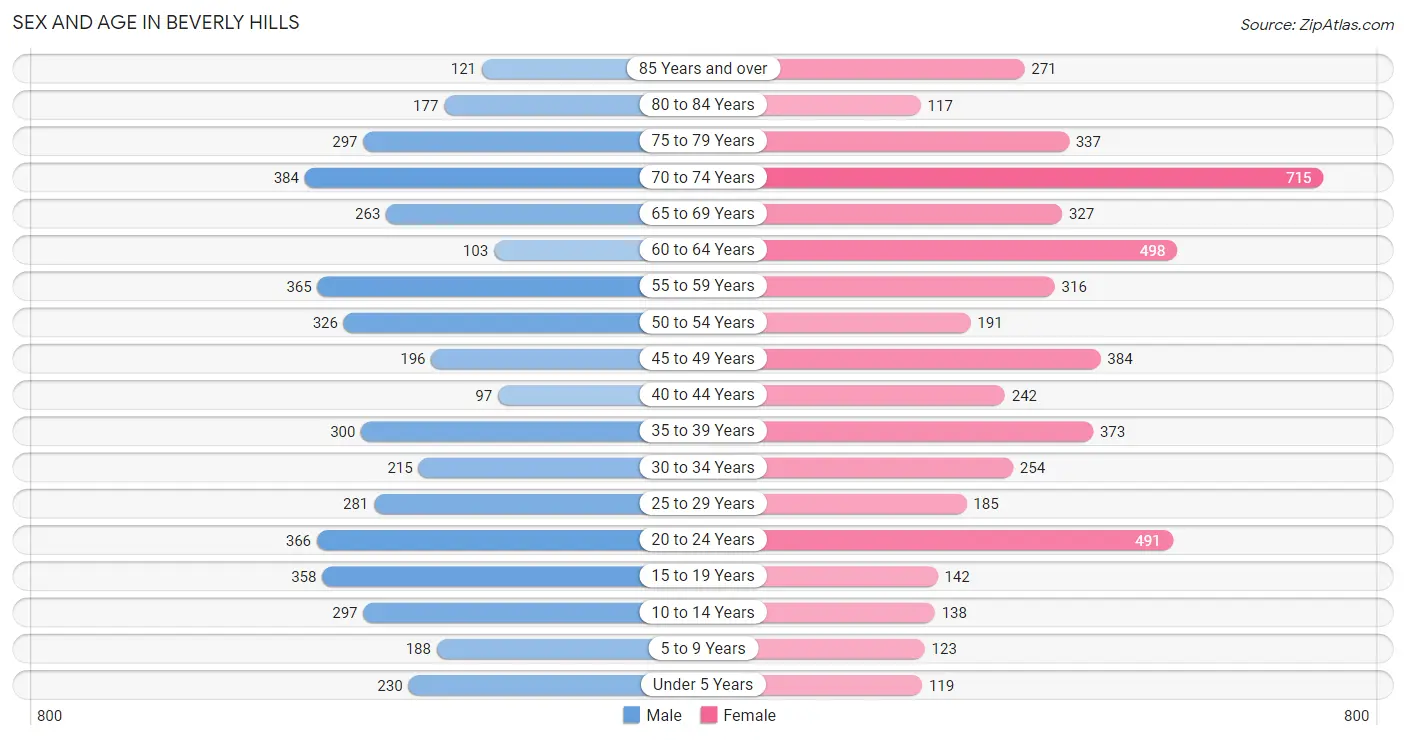
| Age Bracket | Male | Female |
| Under 5 Years | 230 (5.0%) | 119 (2.3%) |
| 5 to 9 Years | 188 (4.1%) | 123 (2.4%) |
| 10 to 14 Years | 297 (6.5%) | 138 (2.6%) |
| 15 to 19 Years | 358 (7.8%) | 142 (2.7%) |
| 20 to 24 Years | 366 (8.0%) | 491 (9.4%) |
| 25 to 29 Years | 281 (6.2%) | 185 (3.5%) |
| 30 to 34 Years | 215 (4.7%) | 254 (4.9%) |
| 35 to 39 Years | 300 (6.6%) | 373 (7.1%) |
| 40 to 44 Years | 97 (2.1%) | 242 (4.6%) |
| 45 to 49 Years | 196 (4.3%) | 384 (7.3%) |
| 50 to 54 Years | 326 (7.1%) | 191 (3.7%) |
| 55 to 59 Years | 365 (8.0%) | 316 (6.0%) |
| 60 to 64 Years | 103 (2.3%) | 498 (9.5%) |
| 65 to 69 Years | 263 (5.8%) | 327 (6.3%) |
| 70 to 74 Years | 384 (8.4%) | 715 (13.7%) |
| 75 to 79 Years | 297 (6.5%) | 337 (6.5%) |
| 80 to 84 Years | 177 (3.9%) | 117 (2.2%) |
| 85 Years and over | 121 (2.6%) | 271 (5.2%) |
| Total | 4,564 (100.0%) | 5,223 (100.0%) |
Families and Households in Beverly Hills
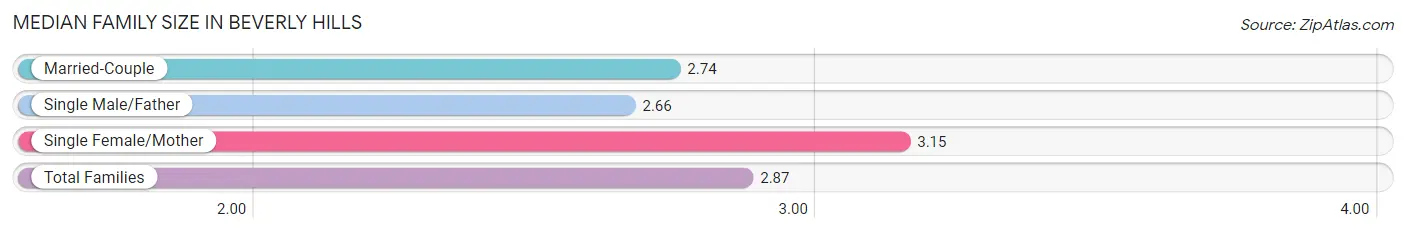
Median Family Size in Beverly Hills
The median family size in Beverly Hills is 2.87 persons per family, with single female/mother families (772 | 31.8%) accounting for the largest median family size of 3.15 persons per family. On the other hand, single male/father families (195 | 8.0%) represent the smallest median family size with 2.66 persons per family.
| Family Type | # Families | Family Size |
| Married-Couple | 1,463 (60.2%) | 2.74 |
| Single Male/Father | 195 (8.0%) | 2.66 |
| Single Female/Mother | 772 (31.8%) | 3.15 |
| Total Families | 2,430 (100.0%) | 2.87 |
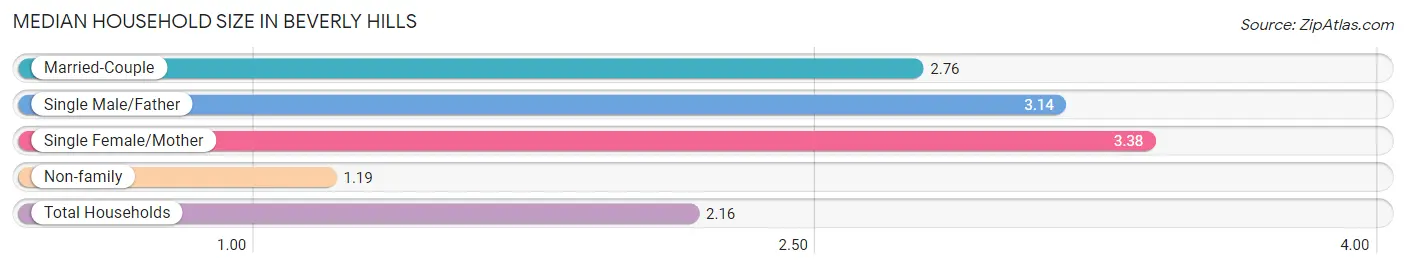
Median Household Size in Beverly Hills
The median household size in Beverly Hills is 2.16 persons per household, with single female/mother households (772 | 17.2%) accounting for the largest median household size of 3.38 persons per household. non-family households (2,072 | 46.0%) represent the smallest median household size with 1.19 persons per household.
| Household Type | # Households | Household Size |
| Married-Couple | 1,463 (32.5%) | 2.76 |
| Single Male/Father | 195 (4.3%) | 3.14 |
| Single Female/Mother | 772 (17.2%) | 3.38 |
| Non-family | 2,072 (46.0%) | 1.19 |
| Total Households | 4,502 (100.0%) | 2.16 |
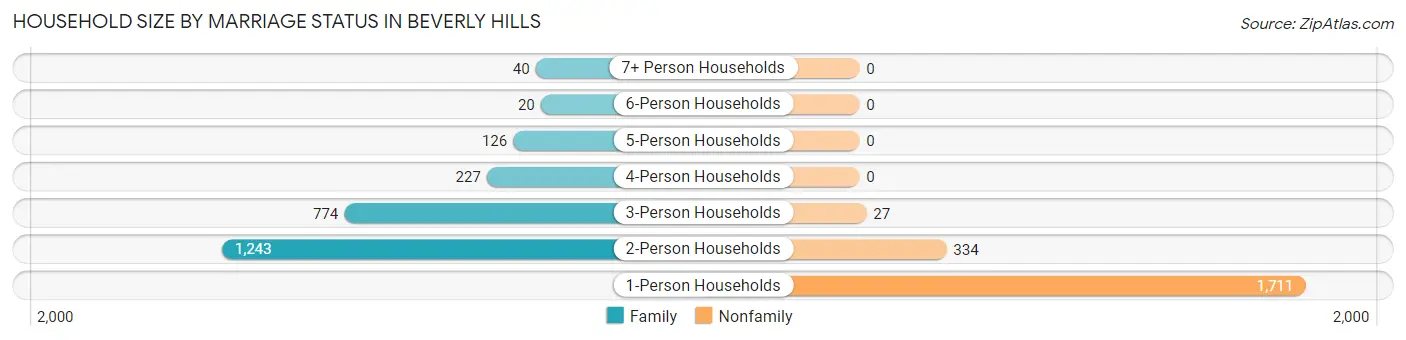
Household Size by Marriage Status in Beverly Hills
Out of a total of 4,502 households in Beverly Hills, 2,430 (54.0%) are family households, while 2,072 (46.0%) are nonfamily households. The most numerous type of family households are 2-person households, comprising 1,243, and the most common type of nonfamily households are 1-person households, comprising 1,711.
| Household Size | Family Households | Nonfamily Households |
| 1-Person Households | - | 1,711 (38.0%) |
| 2-Person Households | 1,243 (27.6%) | 334 (7.4%) |
| 3-Person Households | 774 (17.2%) | 27 (0.6%) |
| 4-Person Households | 227 (5.0%) | 0 (0.0%) |
| 5-Person Households | 126 (2.8%) | 0 (0.0%) |
| 6-Person Households | 20 (0.4%) | 0 (0.0%) |
| 7+ Person Households | 40 (0.9%) | 0 (0.0%) |
| Total | 2,430 (54.0%) | 2,072 (46.0%) |
Female Fertility in Beverly Hills
Fertility by Age in Beverly Hills
| Age Bracket | Women with Births | Births / 1,000 Women |
| 15 to 19 years | 0 (0.0%) | 0.0 |
| 20 to 34 years | 0 (0.0%) | 0.0 |
| 35 to 50 years | 0 (0.0%) | 0.0 |
| Total | 0 (0.0%) | 0.0 |
Fertility by Age by Marriage Status in Beverly Hills
| Age Bracket | Married | Unmarried |
| 15 to 19 years | 0 (0.0%) | 0 (0.0%) |
| 20 to 34 years | 0 (0.0%) | 0 (0.0%) |
| 35 to 50 years | 0 (0.0%) | 0 (0.0%) |
| Total | 0 (0.0%) | 0 (0.0%) |
Fertility by Education in Beverly Hills
| Educational Attainment | Women with Births | Births / 1,000 Women |
| Less than High School | 0 (0.0%) | 0.0 |
| High School Diploma | 0 (0.0%) | 0.0 |
| College or Associate's Degree | 0 (0.0%) | 0.0 |
| Bachelor's Degree | 0 (0.0%) | 0.0 |
| Graduate Degree | 0 (0.0%) | 0.0 |
| Total | 0 (0.0%) | 0.0 |
Fertility by Education by Marriage Status in Beverly Hills
| Educational Attainment | Married | Unmarried |
| Less than High School | 0 (0.0%) | 0 (0.0%) |
| High School Diploma | 0 (0.0%) | 0 (0.0%) |
| College or Associate's Degree | 0 (0.0%) | 0 (0.0%) |
| Bachelor's Degree | 0 (0.0%) | 0 (0.0%) |
| Graduate Degree | 0 (0.0%) | 0 (0.0%) |
| Total | 0 (0.0%) | 0 (0.0%) |
Income in Beverly Hills
Income Overview in Beverly Hills
Per Capita Income in Beverly Hills is $27,043, while median incomes of families and households are $55,512 and $42,165 respectively.
| Characteristic | Number | Measure |
| Per Capita Income | 9,787 | $27,043 |
| Median Family Income | 2,430 | $55,512 |
| Mean Family Income | 2,430 | $70,838 |
| Median Household Income | 4,502 | $42,165 |
| Mean Household Income | 4,502 | $56,510 |
| Income Deficit | 2,430 | $0 |
| Wage / Income Gap (%) | 9,787 | 28.24% |
| Wage / Income Gap ($) | 9,787 | 71.76¢ per $1 |
| Gini / Inequality Index | 9,787 | 0.45 |
Earnings by Sex in Beverly Hills
Average Earnings in Beverly Hills are $24,927, $31,731 for men and $22,771 for women, a difference of 28.2%.
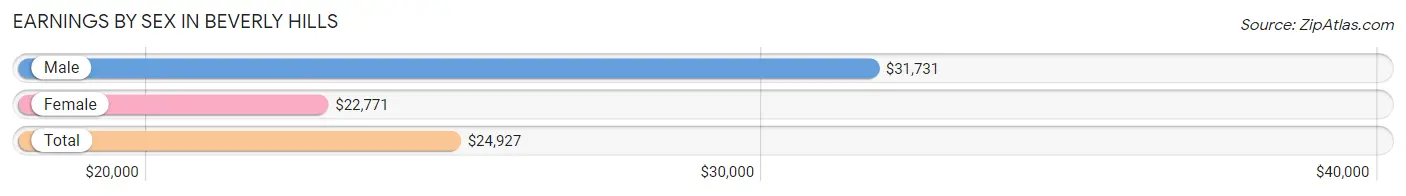
| Sex | Number | Average Earnings |
| Male | 2,024 (47.4%) | $31,731 |
| Female | 2,243 (52.6%) | $22,771 |
| Total | 4,267 (100.0%) | $24,927 |
Earnings by Sex by Income Bracket in Beverly Hills
The most common earnings brackets in Beverly Hills are $30,000 to $34,999 for men (234 | 11.6%) and $25,000 to $29,999 for women (389 | 17.3%).
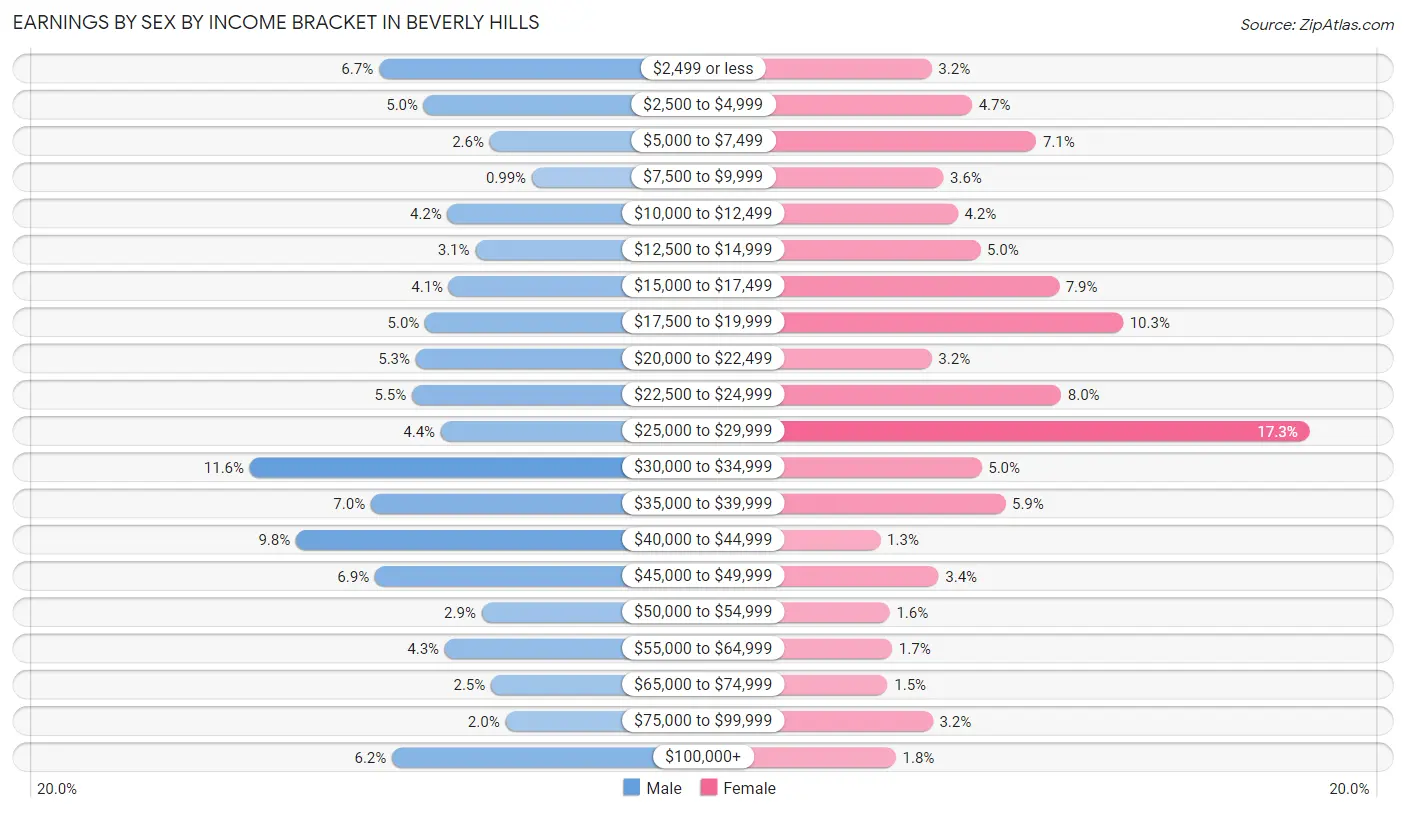
| Income | Male | Female |
| $2,499 or less | 136 (6.7%) | 71 (3.2%) |
| $2,500 to $4,999 | 102 (5.0%) | 105 (4.7%) |
| $5,000 to $7,499 | 52 (2.6%) | 159 (7.1%) |
| $7,500 to $9,999 | 20 (1.0%) | 81 (3.6%) |
| $10,000 to $12,499 | 84 (4.2%) | 93 (4.2%) |
| $12,500 to $14,999 | 63 (3.1%) | 112 (5.0%) |
| $15,000 to $17,499 | 83 (4.1%) | 178 (7.9%) |
| $17,500 to $19,999 | 101 (5.0%) | 232 (10.3%) |
| $20,000 to $22,499 | 108 (5.3%) | 71 (3.2%) |
| $22,500 to $24,999 | 111 (5.5%) | 180 (8.0%) |
| $25,000 to $29,999 | 89 (4.4%) | 389 (17.3%) |
| $30,000 to $34,999 | 234 (11.6%) | 113 (5.0%) |
| $35,000 to $39,999 | 142 (7.0%) | 133 (5.9%) |
| $40,000 to $44,999 | 199 (9.8%) | 28 (1.3%) |
| $45,000 to $49,999 | 139 (6.9%) | 77 (3.4%) |
| $50,000 to $54,999 | 58 (2.9%) | 36 (1.6%) |
| $55,000 to $64,999 | 86 (4.3%) | 38 (1.7%) |
| $65,000 to $74,999 | 51 (2.5%) | 34 (1.5%) |
| $75,000 to $99,999 | 40 (2.0%) | 72 (3.2%) |
| $100,000+ | 126 (6.2%) | 41 (1.8%) |
| Total | 2,024 (100.0%) | 2,243 (100.0%) |
Earnings by Sex by Educational Attainment in Beverly Hills
Average earnings in Beverly Hills are $34,698 for men and $22,538 for women, a difference of 35.0%. Men with an educational attainment of bachelor's degree enjoy the highest average annual earnings of $37,424, while those with college or associate's degree education earn the least with $31,763. Women with an educational attainment of bachelor's degree earn the most with the average annual earnings of $35,417, while those with high school diploma education have the smallest earnings of $19,451.
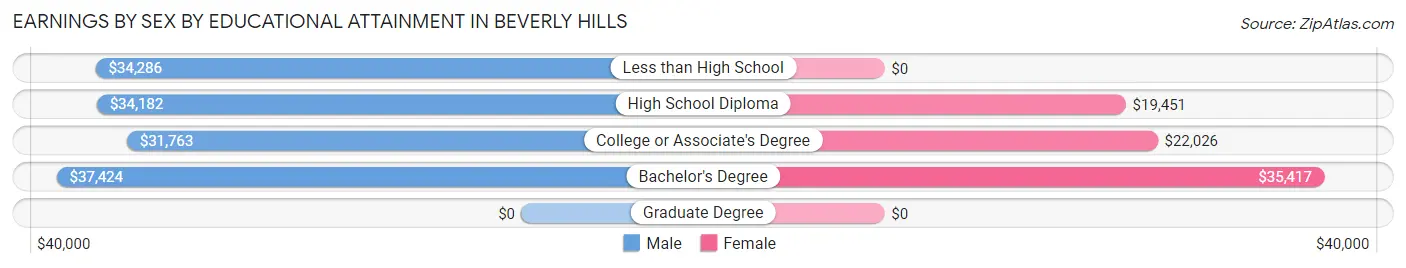
| Educational Attainment | Male Income | Female Income |
| Less than High School | $34,286 | $0 |
| High School Diploma | $34,182 | $19,451 |
| College or Associate's Degree | $31,763 | $22,026 |
| Bachelor's Degree | $37,424 | $35,417 |
| Graduate Degree | - | - |
| Total | $34,698 | $22,538 |
Family Income in Beverly Hills
Family Income Brackets in Beverly Hills
According to the Beverly Hills family income data, there are 702 families falling into the $50,000 to $74,999 income range, which is the most common income bracket and makes up 28.9% of all families. Conversely, the $200,000+ income bracket is the least frequent group with only 36 families (1.5%) belonging to this category.
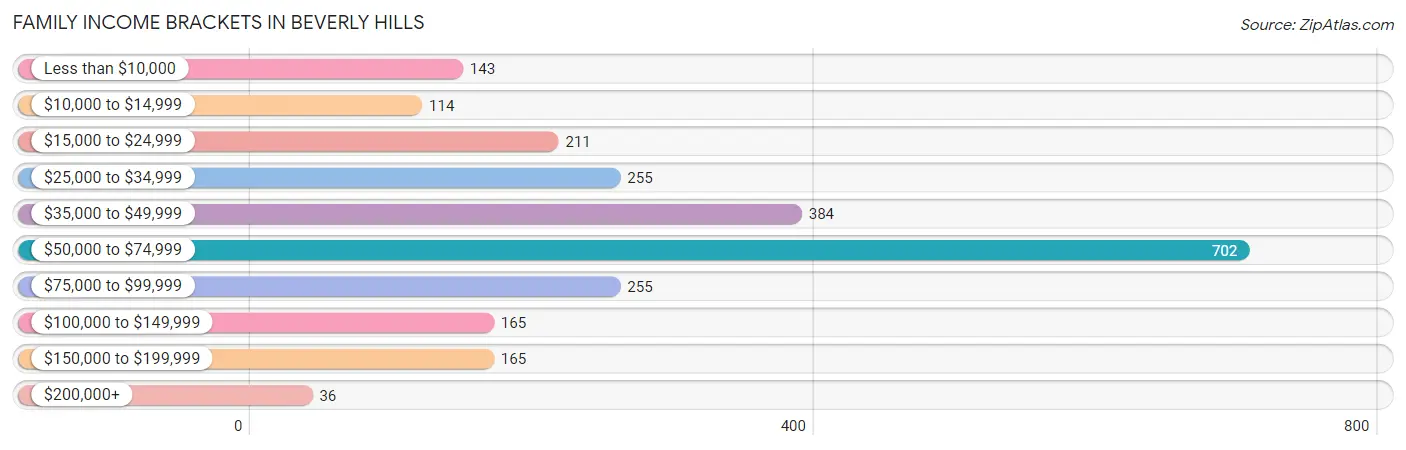
| Income Bracket | # Families | % Families |
| Less than $10,000 | 143 | 5.9% |
| $10,000 to $14,999 | 114 | 4.7% |
| $15,000 to $24,999 | 211 | 8.7% |
| $25,000 to $34,999 | 255 | 10.5% |
| $35,000 to $49,999 | 384 | 15.8% |
| $50,000 to $74,999 | 702 | 28.9% |
| $75,000 to $99,999 | 255 | 10.5% |
| $100,000 to $149,999 | 165 | 6.8% |
| $150,000 to $199,999 | 165 | 6.8% |
| $200,000+ | 36 | 1.5% |
Family Income by Famaliy Size in Beverly Hills
4-person families (192 | 7.9%) account for the highest median family income in Beverly Hills with $63,214 per family, while 2-person families (1,425 | 58.6%) have the highest median income of $23,390 per family member.
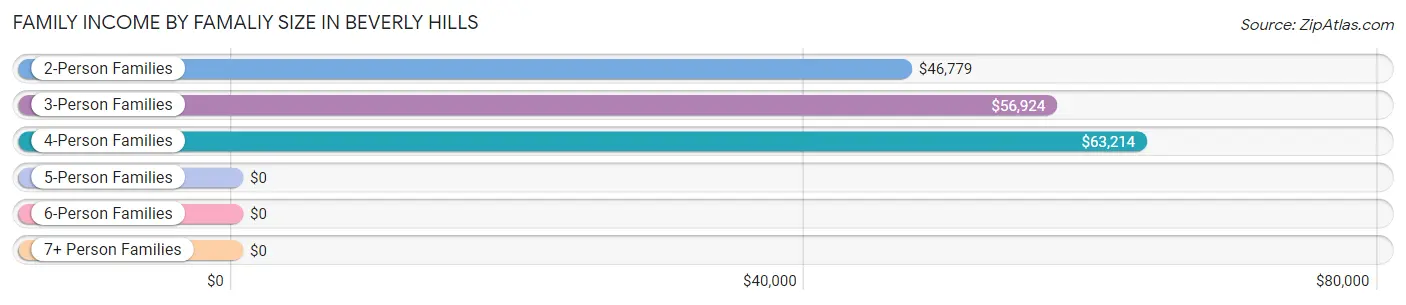
| Income Bracket | # Families | Median Income |
| 2-Person Families | 1,425 (58.6%) | $46,779 |
| 3-Person Families | 668 (27.5%) | $56,924 |
| 4-Person Families | 192 (7.9%) | $63,214 |
| 5-Person Families | 105 (4.3%) | $0 |
| 6-Person Families | 0 (0.0%) | $0 |
| 7+ Person Families | 40 (1.7%) | $0 |
| Total | 2,430 (100.0%) | $55,512 |
Family Income by Number of Earners in Beverly Hills
The median family income in Beverly Hills is $55,512, with families comprising 3+ earners (196) having the highest median family income of $67,500, while families with 1 earner (830) have the lowest median family income of $41,266, accounting for 8.1% and 34.2% of families, respectively.
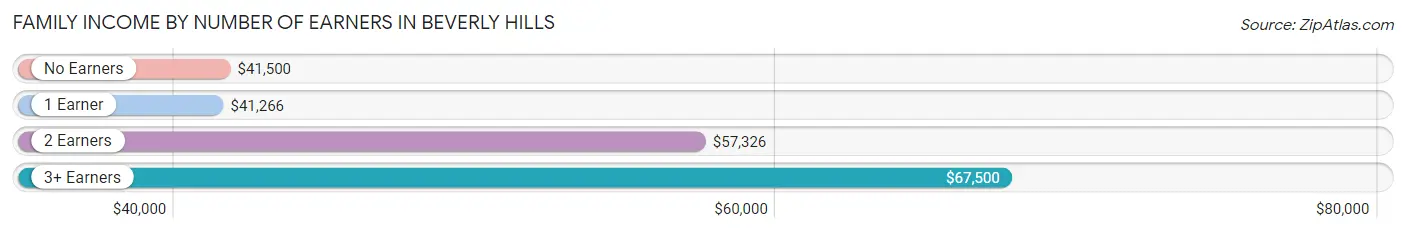
| Number of Earners | # Families | Median Income |
| No Earners | 712 (29.3%) | $41,500 |
| 1 Earner | 830 (34.2%) | $41,266 |
| 2 Earners | 692 (28.5%) | $57,326 |
| 3+ Earners | 196 (8.1%) | $67,500 |
| Total | 2,430 (100.0%) | $55,512 |
Household Income in Beverly Hills
Household Income Brackets in Beverly Hills
With 923 households falling in the category, the $50,000 to $74,999 income range is the most frequent in Beverly Hills, accounting for 20.5% of all households. In contrast, only 36 households (0.8%) fall into the $200,000+ income bracket, making it the least populous group.
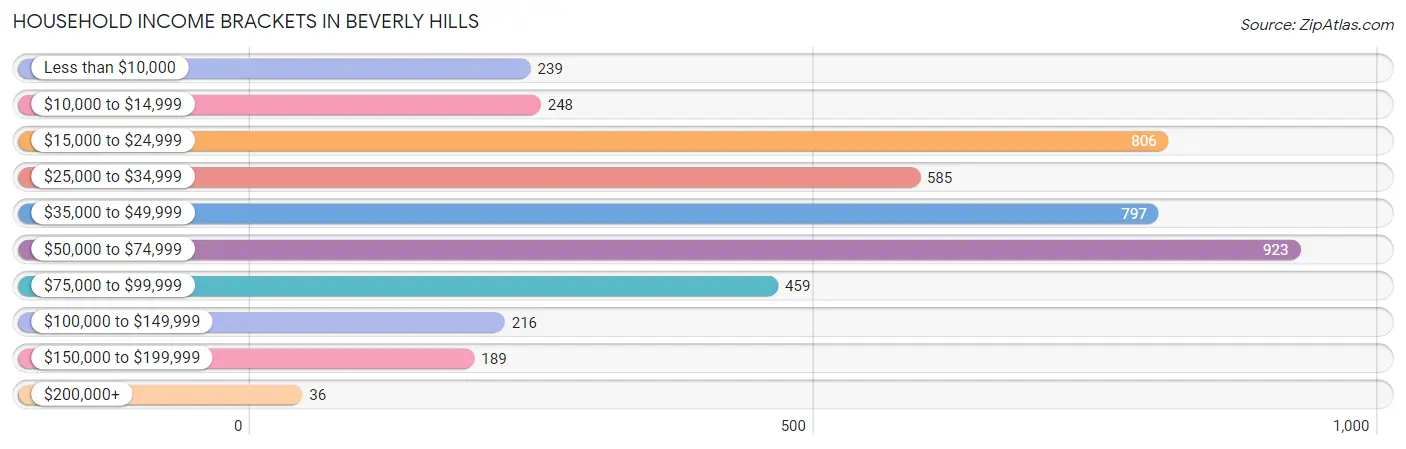
| Income Bracket | # Households | % Households |
| Less than $10,000 | 239 | 5.3% |
| $10,000 to $14,999 | 248 | 5.5% |
| $15,000 to $24,999 | 806 | 17.9% |
| $25,000 to $34,999 | 585 | 13.0% |
| $35,000 to $49,999 | 797 | 17.7% |
| $50,000 to $74,999 | 923 | 20.5% |
| $75,000 to $99,999 | 459 | 10.2% |
| $100,000 to $149,999 | 216 | 4.8% |
| $150,000 to $199,999 | 189 | 4.2% |
| $200,000+ | 36 | 0.8% |
Household Income by Householder Age in Beverly Hills
The median household income in Beverly Hills is $42,165, with the highest median household income of $52,891 found in the 25 to 44 years age bracket for the primary householder. A total of 838 households (18.6%) fall into this category. Meanwhile, the 15 to 24 years age bracket for the primary householder has the lowest median household income of $0, with 157 households (3.5%) in this group.
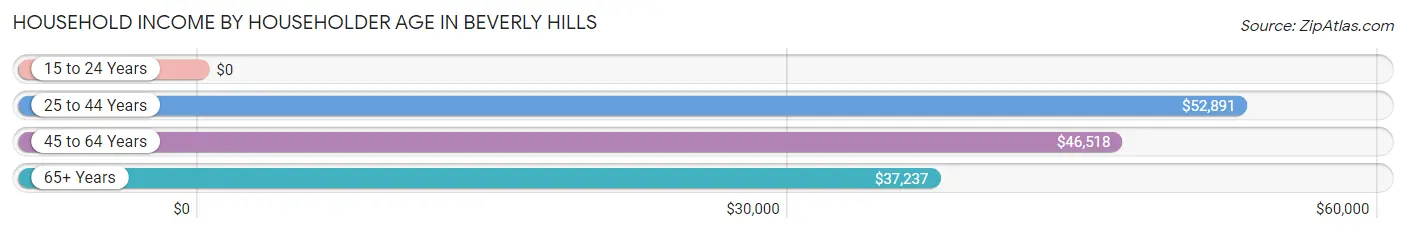
| Income Bracket | # Households | Median Income |
| 15 to 24 Years | 157 (3.5%) | $0 |
| 25 to 44 Years | 838 (18.6%) | $52,891 |
| 45 to 64 Years | 1,393 (30.9%) | $46,518 |
| 65+ Years | 2,114 (47.0%) | $37,237 |
| Total | 4,502 (100.0%) | $42,165 |
Poverty in Beverly Hills
Income Below Poverty by Sex and Age in Beverly Hills
With 25.2% poverty level for males and 21.4% for females among the residents of Beverly Hills, 15 year old males and 12 to 14 year old females are the most vulnerable to poverty, with 57 males (81.4%) and 89 females (89.9%) in their respective age groups living below the poverty level.
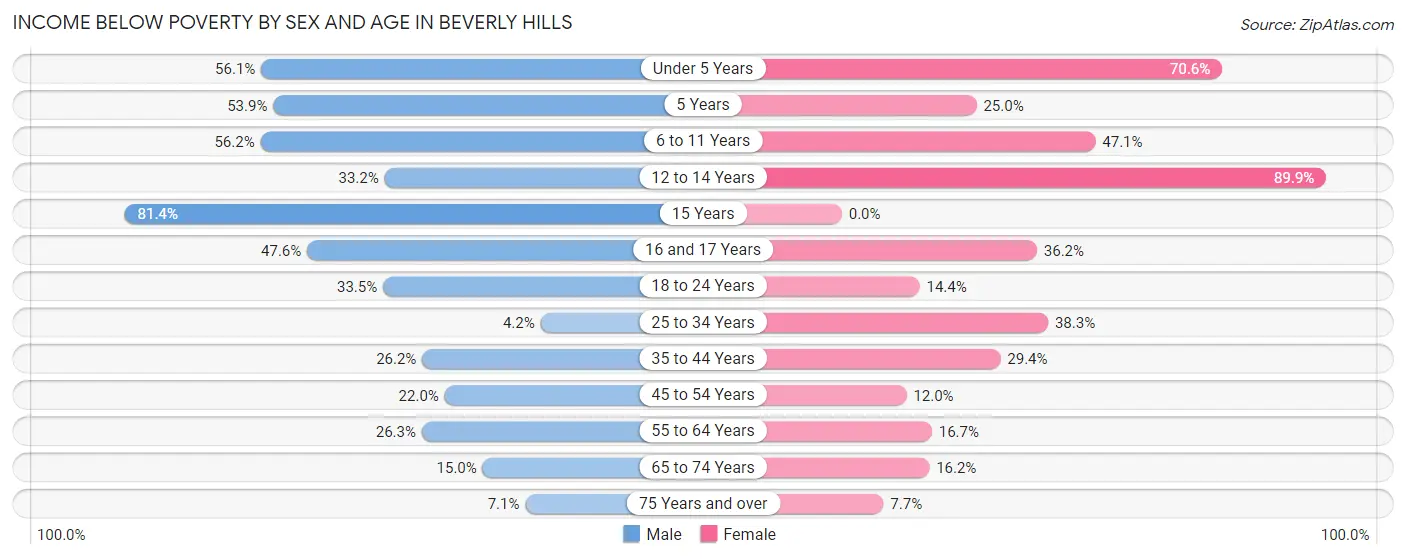
| Age Bracket | Male | Female |
| Under 5 Years | 129 (56.1%) | 84 (70.6%) |
| 5 Years | 21 (53.8%) | 15 (25.0%) |
| 6 to 11 Years | 122 (56.2%) | 48 (47.1%) |
| 12 to 14 Years | 76 (33.2%) | 89 (89.9%) |
| 15 Years | 57 (81.4%) | 0 (0.0%) |
| 16 and 17 Years | 78 (47.6%) | 21 (36.2%) |
| 18 to 24 Years | 164 (33.5%) | 83 (14.4%) |
| 25 to 34 Years | 21 (4.2%) | 168 (38.3%) |
| 35 to 44 Years | 104 (26.2%) | 181 (29.4%) |
| 45 to 54 Years | 115 (22.0%) | 69 (12.0%) |
| 55 to 64 Years | 123 (26.3%) | 136 (16.7%) |
| 65 to 74 Years | 97 (15.0%) | 169 (16.2%) |
| 75 Years and over | 42 (7.1%) | 56 (7.7%) |
| Total | 1,149 (25.2%) | 1,119 (21.4%) |
Income Above Poverty by Sex and Age in Beverly Hills
According to the poverty statistics in Beverly Hills, males aged 25 to 34 years and females aged 75 years and over are the age groups that are most secure financially, with 95.8% of males and 92.3% of females in these age groups living above the poverty line.
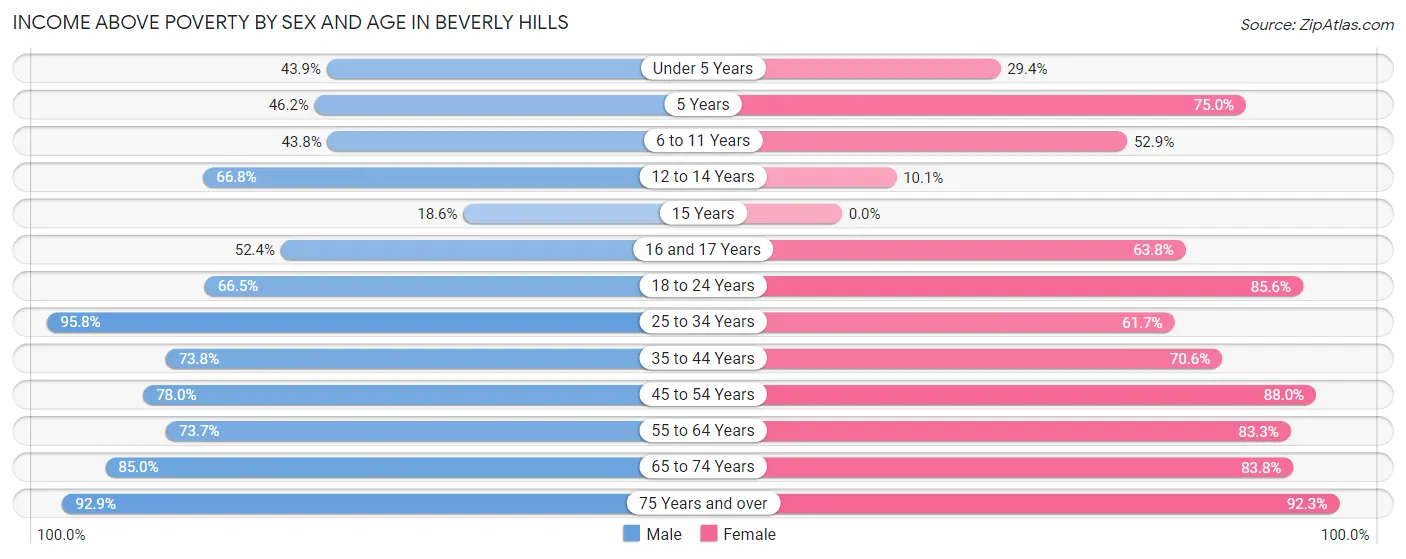
| Age Bracket | Male | Female |
| Under 5 Years | 101 (43.9%) | 35 (29.4%) |
| 5 Years | 18 (46.2%) | 45 (75.0%) |
| 6 to 11 Years | 95 (43.8%) | 54 (52.9%) |
| 12 to 14 Years | 153 (66.8%) | 10 (10.1%) |
| 15 Years | 13 (18.6%) | 0 (0.0%) |
| 16 and 17 Years | 86 (52.4%) | 37 (63.8%) |
| 18 to 24 Years | 326 (66.5%) | 492 (85.6%) |
| 25 to 34 Years | 475 (95.8%) | 271 (61.7%) |
| 35 to 44 Years | 293 (73.8%) | 434 (70.6%) |
| 45 to 54 Years | 407 (78.0%) | 506 (88.0%) |
| 55 to 64 Years | 345 (73.7%) | 678 (83.3%) |
| 65 to 74 Years | 550 (85.0%) | 873 (83.8%) |
| 75 Years and over | 553 (92.9%) | 669 (92.3%) |
| Total | 3,415 (74.8%) | 4,104 (78.6%) |
Income Below Poverty Among Married-Couple Families in Beverly Hills
The poverty statistics for married-couple families in Beverly Hills show that 10.9% or 160 of the total 1,463 families live below the poverty line. Families with 5 or more children have the highest poverty rate of 100.0%, comprising of 40 families. On the other hand, families with no children have the lowest poverty rate of 5.0%, which includes 55 families.
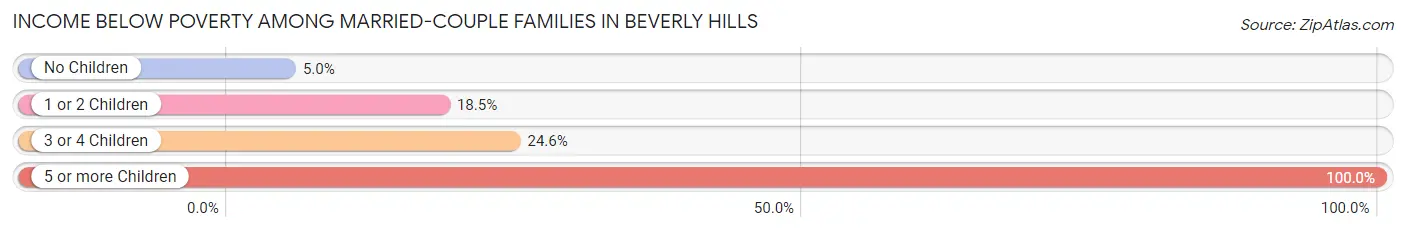
| Children | Above Poverty | Below Poverty |
| No Children | 1,036 (95.0%) | 55 (5.0%) |
| 1 or 2 Children | 221 (81.6%) | 50 (18.4%) |
| 3 or 4 Children | 46 (75.4%) | 15 (24.6%) |
| 5 or more Children | 0 (0.0%) | 40 (100.0%) |
| Total | 1,303 (89.1%) | 160 (10.9%) |
Income Below Poverty Among Single-Parent Households in Beverly Hills
According to the poverty data in Beverly Hills, 28.7% or 56 single-father households and 24.1% or 186 single-mother households are living below the poverty line. Among single-father households, those with 1 or 2 children have the highest poverty rate, with 20 households (36.4%) experiencing poverty. Likewise, among single-mother households, those with 3 or 4 children have the highest poverty rate, with 69 households (100.0%) falling below the poverty line.
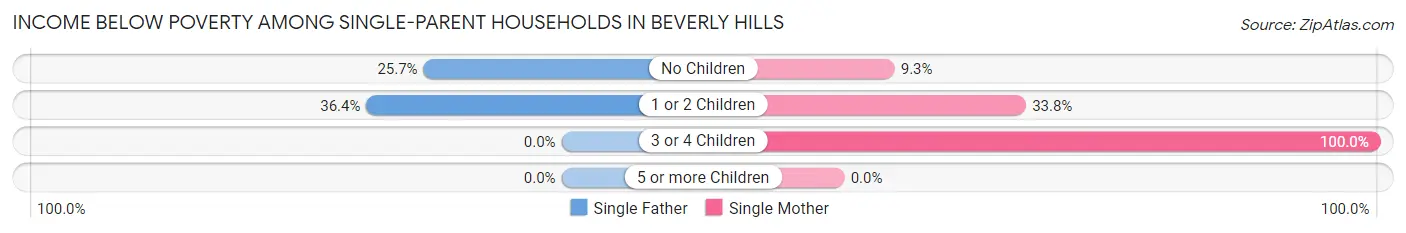
| Children | Single Father | Single Mother |
| No Children | 36 (25.7%) | 46 (9.3%) |
| 1 or 2 Children | 20 (36.4%) | 71 (33.8%) |
| 3 or 4 Children | 0 (0.0%) | 69 (100.0%) |
| 5 or more Children | 0 (0.0%) | 0 (0.0%) |
| Total | 56 (28.7%) | 186 (24.1%) |
Income Below Poverty Among Married-Couple vs Single-Parent Households in Beverly Hills
The poverty data for Beverly Hills shows that 160 of the married-couple family households (10.9%) and 242 of the single-parent households (25.0%) are living below the poverty level. Within the married-couple family households, those with 5 or more children have the highest poverty rate, with 40 households (100.0%) falling below the poverty line. Among the single-parent households, those with 3 or 4 children have the highest poverty rate, with 69 household (100.0%) living below poverty.
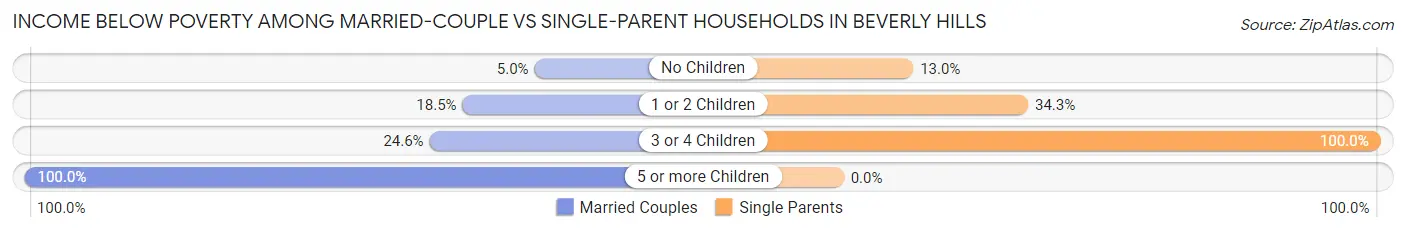
| Children | Married-Couple Families | Single-Parent Households |
| No Children | 55 (5.0%) | 82 (13.0%) |
| 1 or 2 Children | 50 (18.4%) | 91 (34.3%) |
| 3 or 4 Children | 15 (24.6%) | 69 (100.0%) |
| 5 or more Children | 40 (100.0%) | 0 (0.0%) |
| Total | 160 (10.9%) | 242 (25.0%) |
Employment Characteristics in Beverly Hills
Employment by Class of Employer in Beverly Hills
Among the 3,600 employed individuals in Beverly Hills, private company employees (3,037 | 84.4%), self-employed (incorporated) (177 | 4.9%), and local government employees (130 | 3.6%) make up the most common classes of employment.
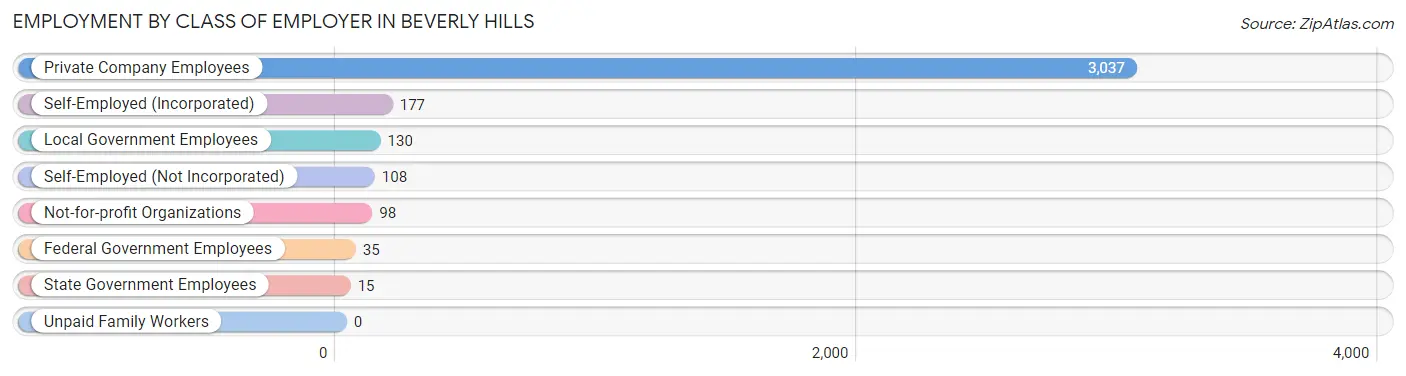
| Employer Class | # Employees | % Employees |
| Private Company Employees | 3,037 | 84.4% |
| Self-Employed (Incorporated) | 177 | 4.9% |
| Self-Employed (Not Incorporated) | 108 | 3.0% |
| Not-for-profit Organizations | 98 | 2.7% |
| Local Government Employees | 130 | 3.6% |
| State Government Employees | 15 | 0.4% |
| Federal Government Employees | 35 | 1.0% |
| Unpaid Family Workers | 0 | 0.0% |
| Total | 3,600 | 100.0% |
Employment Status by Age in Beverly Hills
According to the labor force statistics for Beverly Hills, out of the total population over 16 years of age (8,622), 47.3% or 4,078 individuals are in the labor force, with 8.5% or 347 of them unemployed. The age group with the highest labor force participation rate is 45 to 54 years, with 84.0% or 921 individuals in the labor force. Within the labor force, the 16 to 19 years age range has the highest percentage of unemployed individuals, with 27.0% or 63 of them being unemployed.
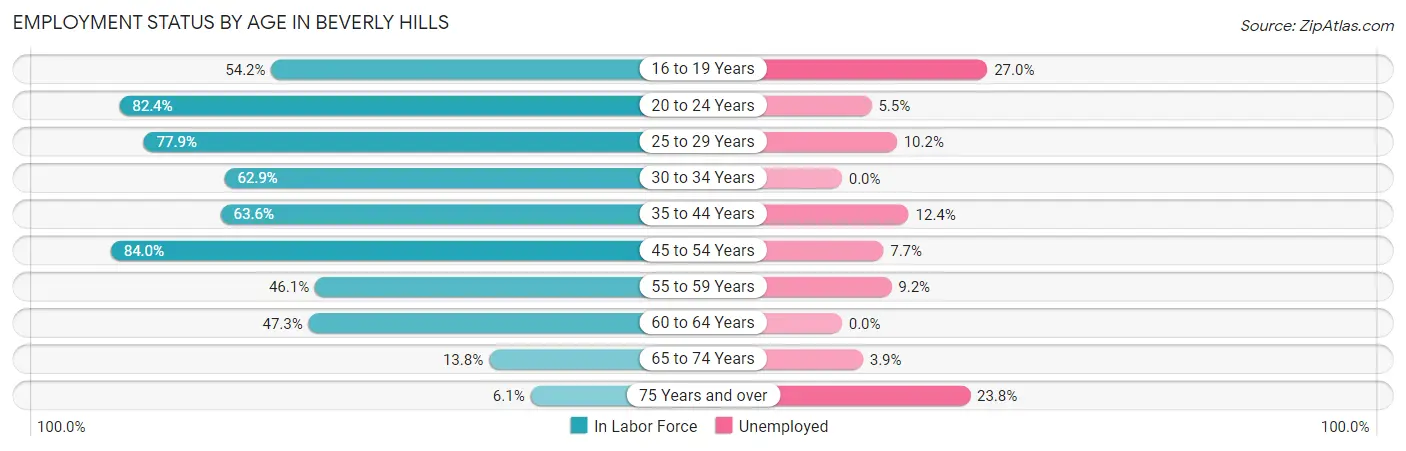
| Age Bracket | In Labor Force | Unemployed |
| 16 to 19 Years | 233 (54.2%) | 63 (27.0%) |
| 20 to 24 Years | 706 (82.4%) | 39 (5.5%) |
| 25 to 29 Years | 363 (77.9%) | 37 (10.2%) |
| 30 to 34 Years | 295 (62.9%) | 0 (0.0%) |
| 35 to 44 Years | 644 (63.6%) | 80 (12.4%) |
| 45 to 54 Years | 921 (84.0%) | 71 (7.7%) |
| 55 to 59 Years | 314 (46.1%) | 29 (9.2%) |
| 60 to 64 Years | 284 (47.3%) | 0 (0.0%) |
| 65 to 74 Years | 233 (13.8%) | 9 (3.9%) |
| 75 Years and over | 81 (6.1%) | 19 (23.8%) |
| Total | 4,078 (47.3%) | 347 (8.5%) |
Employment Status by Educational Attainment in Beverly Hills
According to labor force statistics for Beverly Hills, 65.2% of individuals (2,821) out of the total population between 25 and 64 years of age (4,326) are in the labor force, with 7.7% or 217 of them being unemployed. The group with the highest labor force participation rate are those with the educational attainment of bachelor's degree or higher, with 84.9% or 314 individuals in the labor force. Within the labor force, individuals with less than high school education have the highest percentage of unemployment, with 16.1% or 35 of them being unemployed.
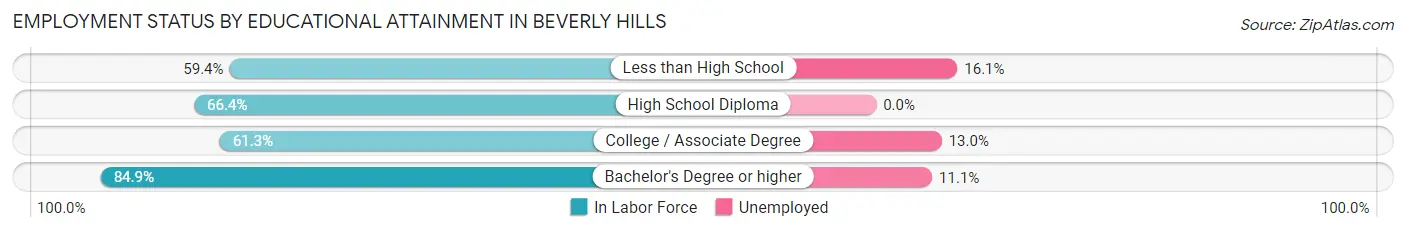
| Educational Attainment | In Labor Force | Unemployed |
| Less than High School | 218 (59.4%) | 59 (16.1%) |
| High School Diploma | 1,161 (66.4%) | 0 (0.0%) |
| College / Associate Degree | 1,129 (61.3%) | 239 (13.0%) |
| Bachelor's Degree or higher | 314 (84.9%) | 41 (11.1%) |
| Total | 2,821 (65.2%) | 333 (7.7%) |
Employment Occupations by Sex in Beverly Hills
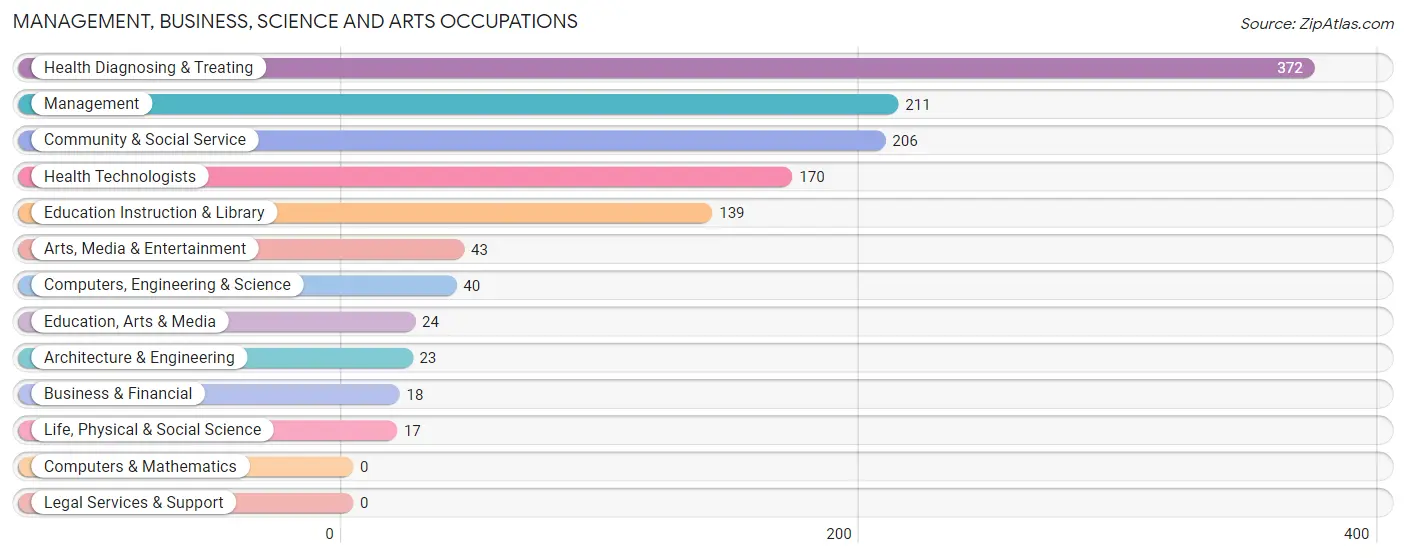
Management, Business, Science and Arts Occupations
The most common Management, Business, Science and Arts occupations in Beverly Hills are Health Diagnosing & Treating (372 | 10.0%), Management (211 | 5.7%), Community & Social Service (206 | 5.5%), Health Technologists (170 | 4.6%), and Education Instruction & Library (139 | 3.7%).
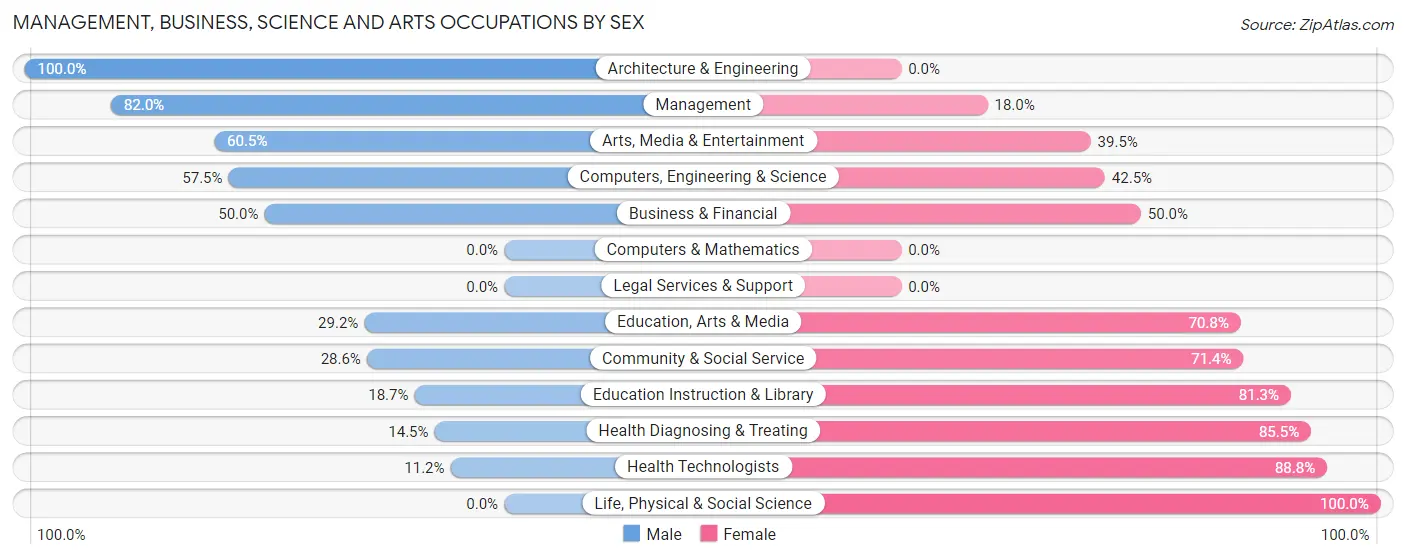
Management, Business, Science and Arts Occupations by Sex
Within the Management, Business, Science and Arts occupations in Beverly Hills, the most male-oriented occupations are Architecture & Engineering (100.0%), Management (82.0%), and Arts, Media & Entertainment (60.5%), while the most female-oriented occupations are Life, Physical & Social Science (100.0%), Health Technologists (88.8%), and Health Diagnosing & Treating (85.5%).
| Occupation | Male | Female |
| Management | 173 (82.0%) | 38 (18.0%) |
| Business & Financial | 9 (50.0%) | 9 (50.0%) |
| Computers, Engineering & Science | 23 (57.5%) | 17 (42.5%) |
| Computers & Mathematics | 0 (0.0%) | 0 (0.0%) |
| Architecture & Engineering | 23 (100.0%) | 0 (0.0%) |
| Life, Physical & Social Science | 0 (0.0%) | 17 (100.0%) |
| Community & Social Service | 59 (28.6%) | 147 (71.4%) |
| Education, Arts & Media | 7 (29.2%) | 17 (70.8%) |
| Legal Services & Support | 0 (0.0%) | 0 (0.0%) |
| Education Instruction & Library | 26 (18.7%) | 113 (81.3%) |
| Arts, Media & Entertainment | 26 (60.5%) | 17 (39.5%) |
| Health Diagnosing & Treating | 54 (14.5%) | 318 (85.5%) |
| Health Technologists | 19 (11.2%) | 151 (88.8%) |
| Total (Category) | 318 (37.5%) | 529 (62.5%) |
| Total (Overall) | 1,661 (44.6%) | 2,066 (55.4%) |
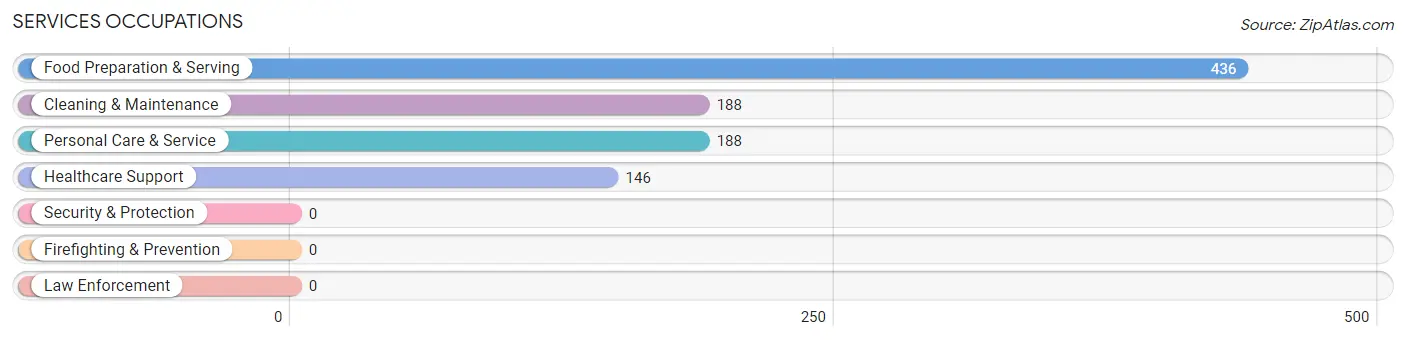
Services Occupations
The most common Services occupations in Beverly Hills are Food Preparation & Serving (436 | 11.7%), Cleaning & Maintenance (188 | 5.0%), Personal Care & Service (188 | 5.0%), and Healthcare Support (146 | 3.9%).
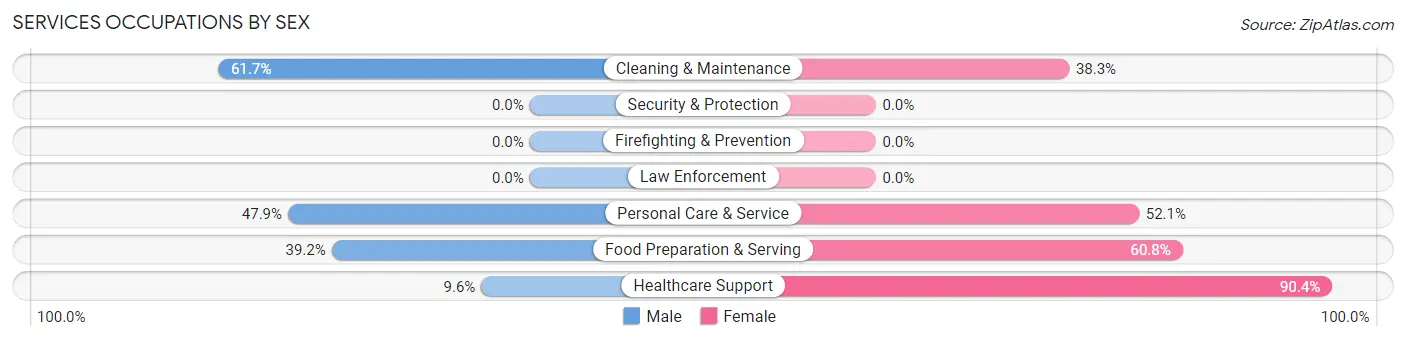
Services Occupations by Sex
Within the Services occupations in Beverly Hills, the most male-oriented occupations are Cleaning & Maintenance (61.7%), Personal Care & Service (47.9%), and Food Preparation & Serving (39.2%), while the most female-oriented occupations are Healthcare Support (90.4%), Food Preparation & Serving (60.8%), and Personal Care & Service (52.1%).
| Occupation | Male | Female |
| Healthcare Support | 14 (9.6%) | 132 (90.4%) |
| Security & Protection | 0 (0.0%) | 0 (0.0%) |
| Firefighting & Prevention | 0 (0.0%) | 0 (0.0%) |
| Law Enforcement | 0 (0.0%) | 0 (0.0%) |
| Food Preparation & Serving | 171 (39.2%) | 265 (60.8%) |
| Cleaning & Maintenance | 116 (61.7%) | 72 (38.3%) |
| Personal Care & Service | 90 (47.9%) | 98 (52.1%) |
| Total (Category) | 391 (40.8%) | 567 (59.2%) |
| Total (Overall) | 1,661 (44.6%) | 2,066 (55.4%) |
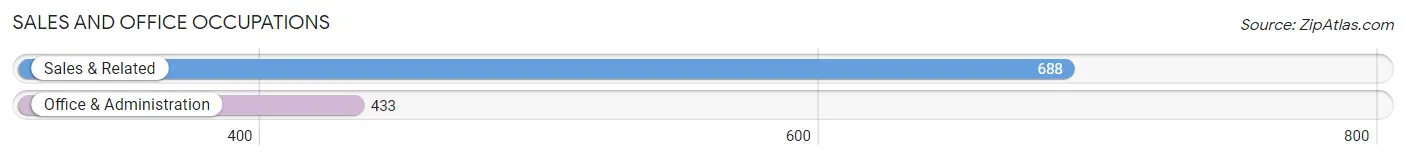
Sales and Office Occupations
The most common Sales and Office occupations in Beverly Hills are Sales & Related (688 | 18.5%), and Office & Administration (433 | 11.6%).
Sales and Office Occupations by Sex
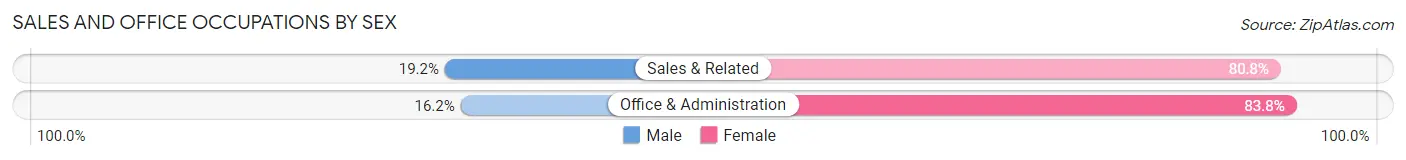
| Occupation | Male | Female |
| Sales & Related | 132 (19.2%) | 556 (80.8%) |
| Office & Administration | 70 (16.2%) | 363 (83.8%) |
| Total (Category) | 202 (18.0%) | 919 (82.0%) |
| Total (Overall) | 1,661 (44.6%) | 2,066 (55.4%) |
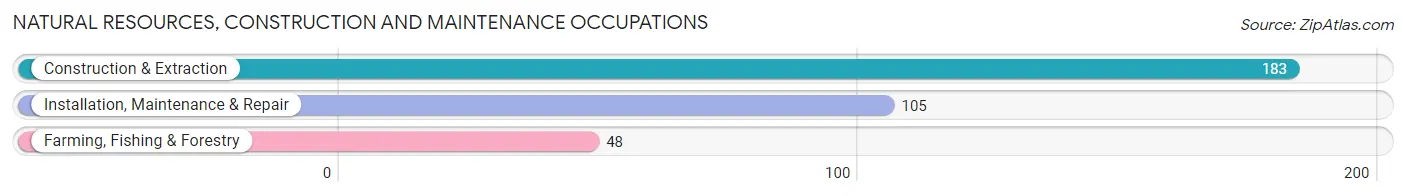
Natural Resources, Construction and Maintenance Occupations
The most common Natural Resources, Construction and Maintenance occupations in Beverly Hills are Construction & Extraction (183 | 4.9%), Installation, Maintenance & Repair (105 | 2.8%), and Farming, Fishing & Forestry (48 | 1.3%).
Natural Resources, Construction and Maintenance Occupations by Sex
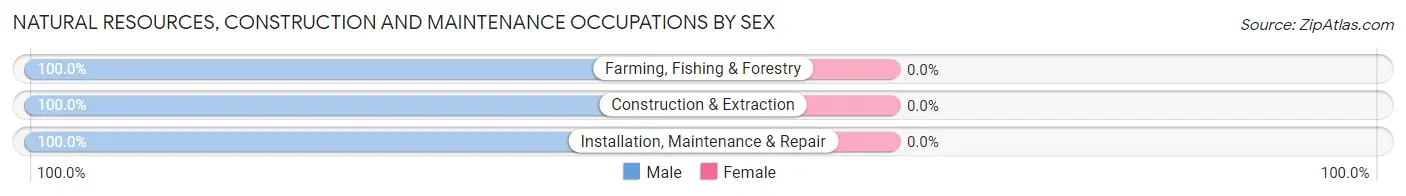
| Occupation | Male | Female |
| Farming, Fishing & Forestry | 48 (100.0%) | 0 (0.0%) |
| Construction & Extraction | 183 (100.0%) | 0 (0.0%) |
| Installation, Maintenance & Repair | 105 (100.0%) | 0 (0.0%) |
| Total (Category) | 336 (100.0%) | 0 (0.0%) |
| Total (Overall) | 1,661 (44.6%) | 2,066 (55.4%) |
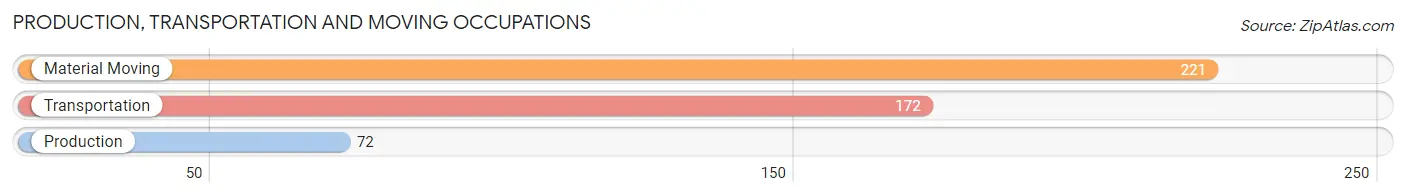
Production, Transportation and Moving Occupations
The most common Production, Transportation and Moving occupations in Beverly Hills are Material Moving (221 | 5.9%), Transportation (172 | 4.6%), and Production (72 | 1.9%).
Production, Transportation and Moving Occupations by Sex
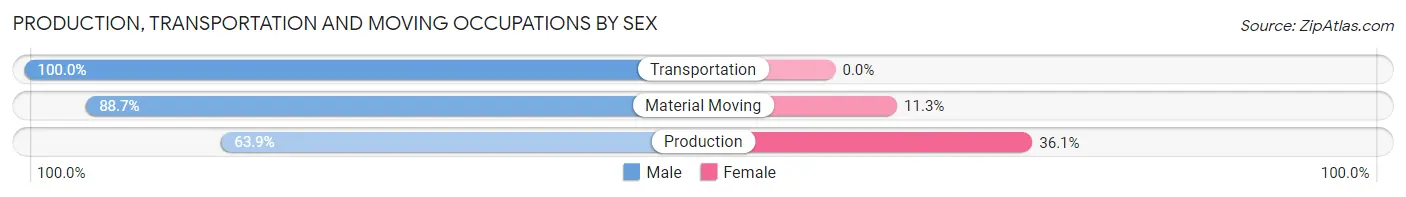
| Occupation | Male | Female |
| Production | 46 (63.9%) | 26 (36.1%) |
| Transportation | 172 (100.0%) | 0 (0.0%) |
| Material Moving | 196 (88.7%) | 25 (11.3%) |
| Total (Category) | 414 (89.0%) | 51 (11.0%) |
| Total (Overall) | 1,661 (44.6%) | 2,066 (55.4%) |
Employment Industries by Sex in Beverly Hills
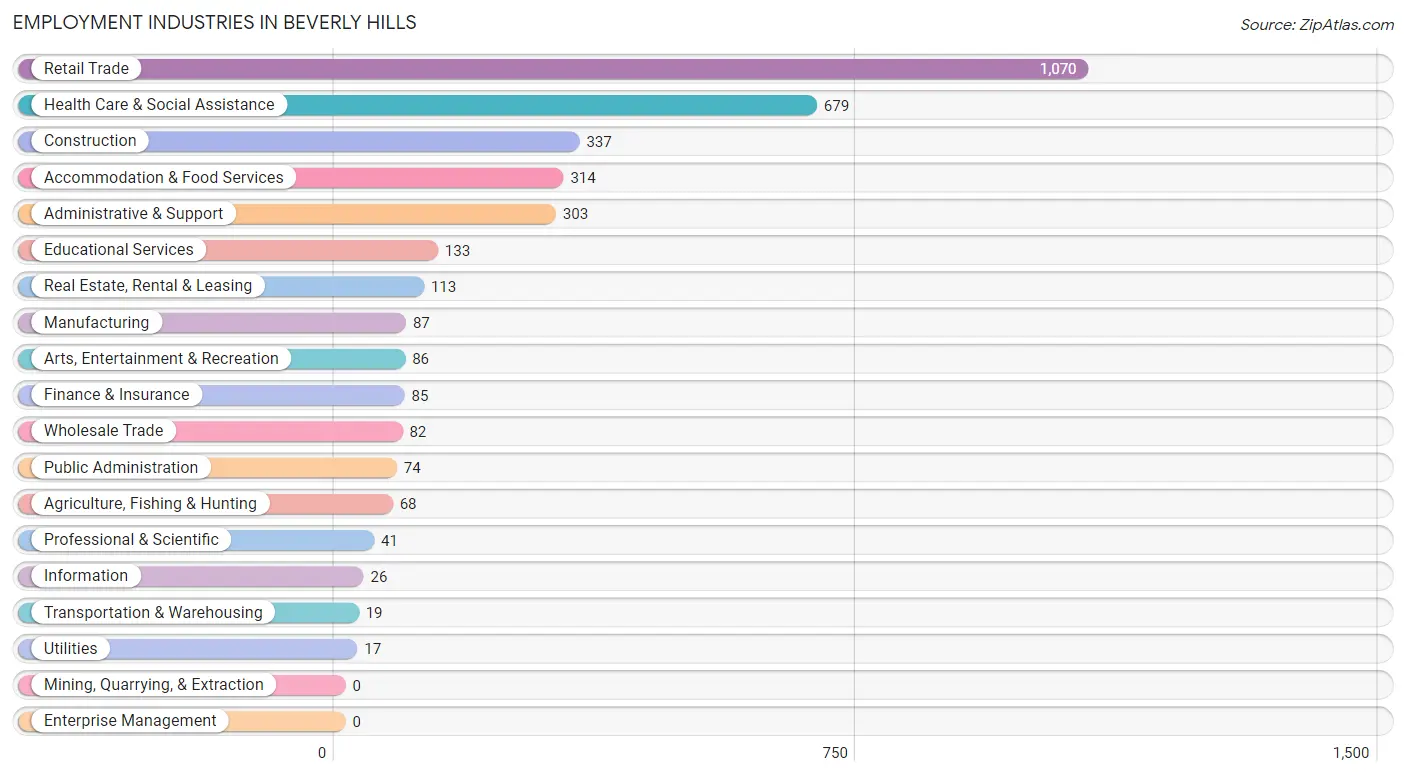
Employment Industries in Beverly Hills
The major employment industries in Beverly Hills include Retail Trade (1,070 | 28.7%), Health Care & Social Assistance (679 | 18.2%), Construction (337 | 9.0%), Accommodation & Food Services (314 | 8.4%), and Administrative & Support (303 | 8.1%).
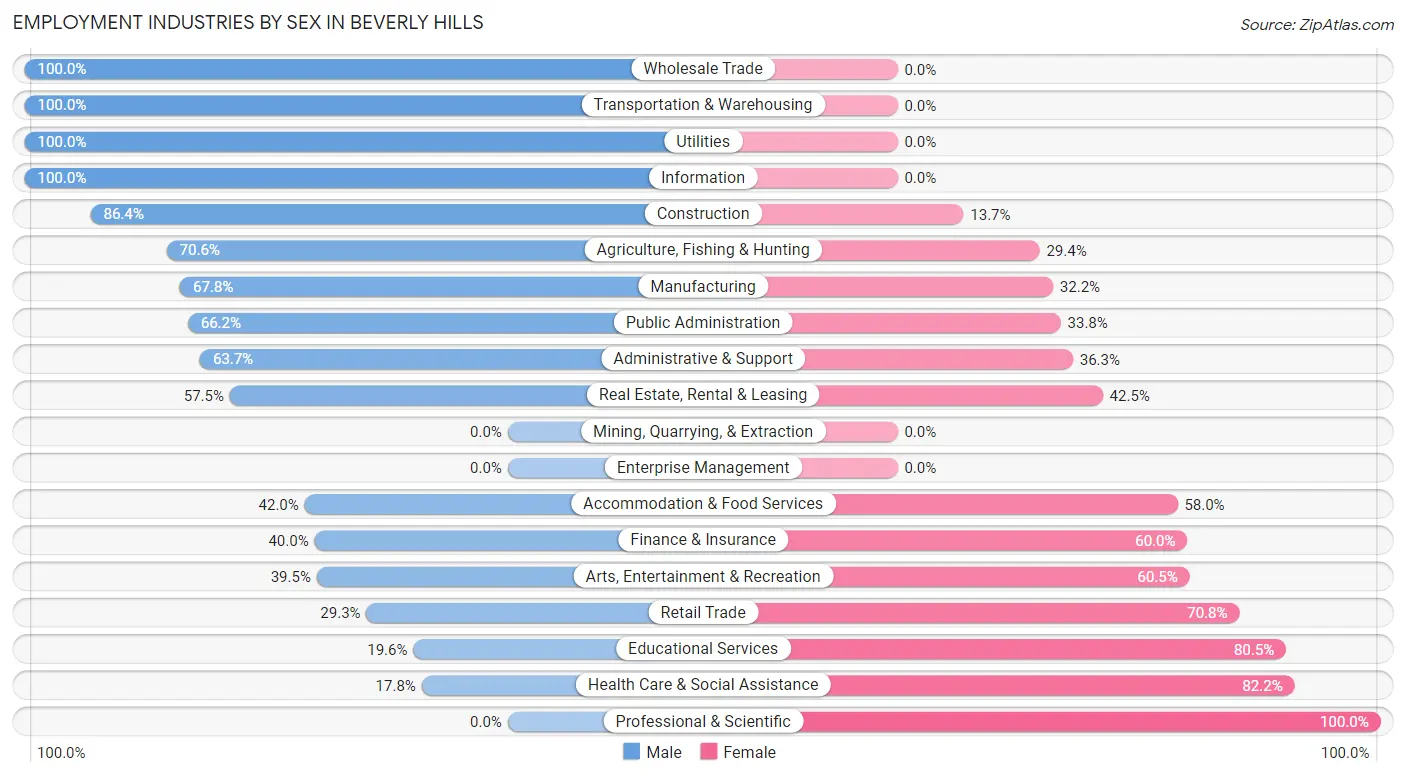
Employment Industries by Sex in Beverly Hills
The Beverly Hills industries that see more men than women are Wholesale Trade (100.0%), Transportation & Warehousing (100.0%), and Utilities (100.0%), whereas the industries that tend to have a higher number of women are Professional & Scientific (100.0%), Health Care & Social Assistance (82.2%), and Educational Services (80.4%).
| Industry | Male | Female |
| Agriculture, Fishing & Hunting | 48 (70.6%) | 20 (29.4%) |
| Mining, Quarrying, & Extraction | 0 (0.0%) | 0 (0.0%) |
| Construction | 291 (86.4%) | 46 (13.7%) |
| Manufacturing | 59 (67.8%) | 28 (32.2%) |
| Wholesale Trade | 82 (100.0%) | 0 (0.0%) |
| Retail Trade | 313 (29.2%) | 757 (70.8%) |
| Transportation & Warehousing | 19 (100.0%) | 0 (0.0%) |
| Utilities | 17 (100.0%) | 0 (0.0%) |
| Information | 26 (100.0%) | 0 (0.0%) |
| Finance & Insurance | 34 (40.0%) | 51 (60.0%) |
| Real Estate, Rental & Leasing | 65 (57.5%) | 48 (42.5%) |
| Professional & Scientific | 0 (0.0%) | 41 (100.0%) |
| Enterprise Management | 0 (0.0%) | 0 (0.0%) |
| Administrative & Support | 193 (63.7%) | 110 (36.3%) |
| Educational Services | 26 (19.6%) | 107 (80.4%) |
| Health Care & Social Assistance | 121 (17.8%) | 558 (82.2%) |
| Arts, Entertainment & Recreation | 34 (39.5%) | 52 (60.5%) |
| Accommodation & Food Services | 132 (42.0%) | 182 (58.0%) |
| Public Administration | 49 (66.2%) | 25 (33.8%) |
| Total | 1,661 (44.6%) | 2,066 (55.4%) |
Education in Beverly Hills
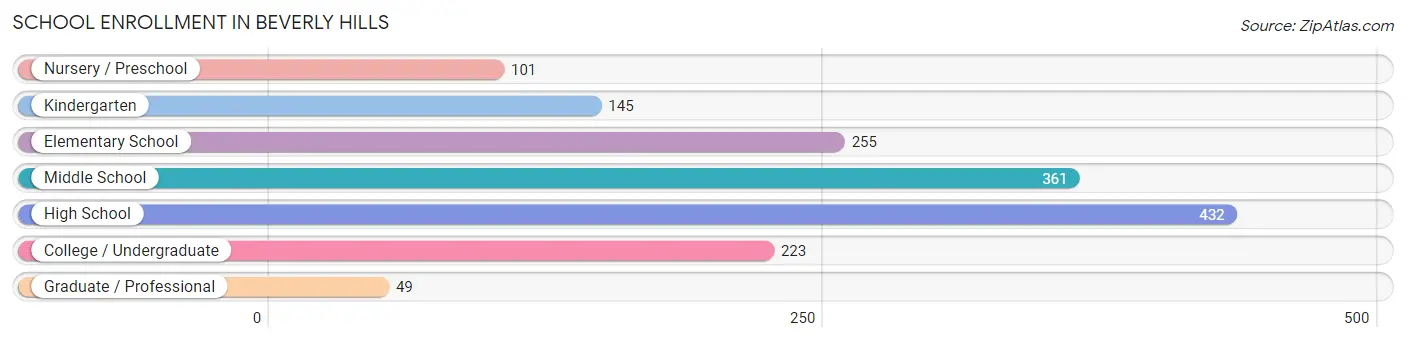
School Enrollment in Beverly Hills
The most common levels of schooling among the 1,566 students in Beverly Hills are high school (432 | 27.6%), middle school (361 | 23.1%), and elementary school (255 | 16.3%).
| School Level | # Students | % Students |
| Nursery / Preschool | 101 | 6.5% |
| Kindergarten | 145 | 9.3% |
| Elementary School | 255 | 16.3% |
| Middle School | 361 | 23.1% |
| High School | 432 | 27.6% |
| College / Undergraduate | 223 | 14.2% |
| Graduate / Professional | 49 | 3.1% |
| Total | 1,566 | 100.0% |
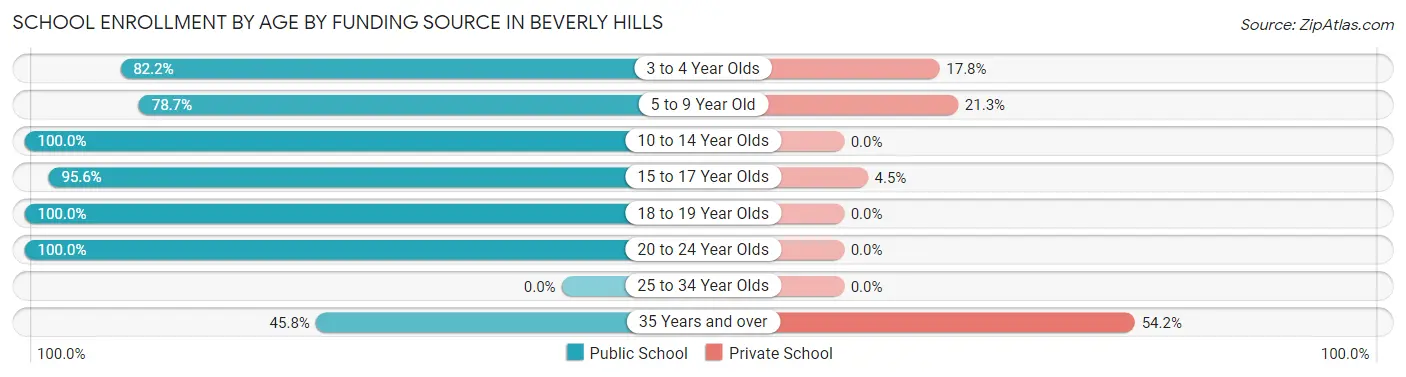
School Enrollment by Age by Funding Source in Beverly Hills
Out of a total of 1,566 students who are enrolled in schools in Beverly Hills, 152 (9.7%) attend a private institution, while the remaining 1,414 (90.3%) are enrolled in public schools. The age group of 35 years and over has the highest likelihood of being enrolled in private schools, with 58 (54.2% in the age bracket) enrolled. Conversely, the age group of 10 to 14 year olds has the lowest likelihood of being enrolled in a private school, with 435 (100.0% in the age bracket) attending a public institution.
| Age Bracket | Public School | Private School |
| 3 to 4 Year Olds | 83 (82.2%) | 18 (17.8%) |
| 5 to 9 Year Old | 233 (78.7%) | 63 (21.3%) |
| 10 to 14 Year Olds | 435 (100.0%) | 0 (0.0%) |
| 15 to 17 Year Olds | 279 (95.6%) | 13 (4.4%) |
| 18 to 19 Year Olds | 170 (100.0%) | 0 (0.0%) |
| 20 to 24 Year Olds | 165 (100.0%) | 0 (0.0%) |
| 25 to 34 Year Olds | 0 (0.0%) | 0 (0.0%) |
| 35 Years and over | 49 (45.8%) | 58 (54.2%) |
| Total | 1,414 (90.3%) | 152 (9.7%) |
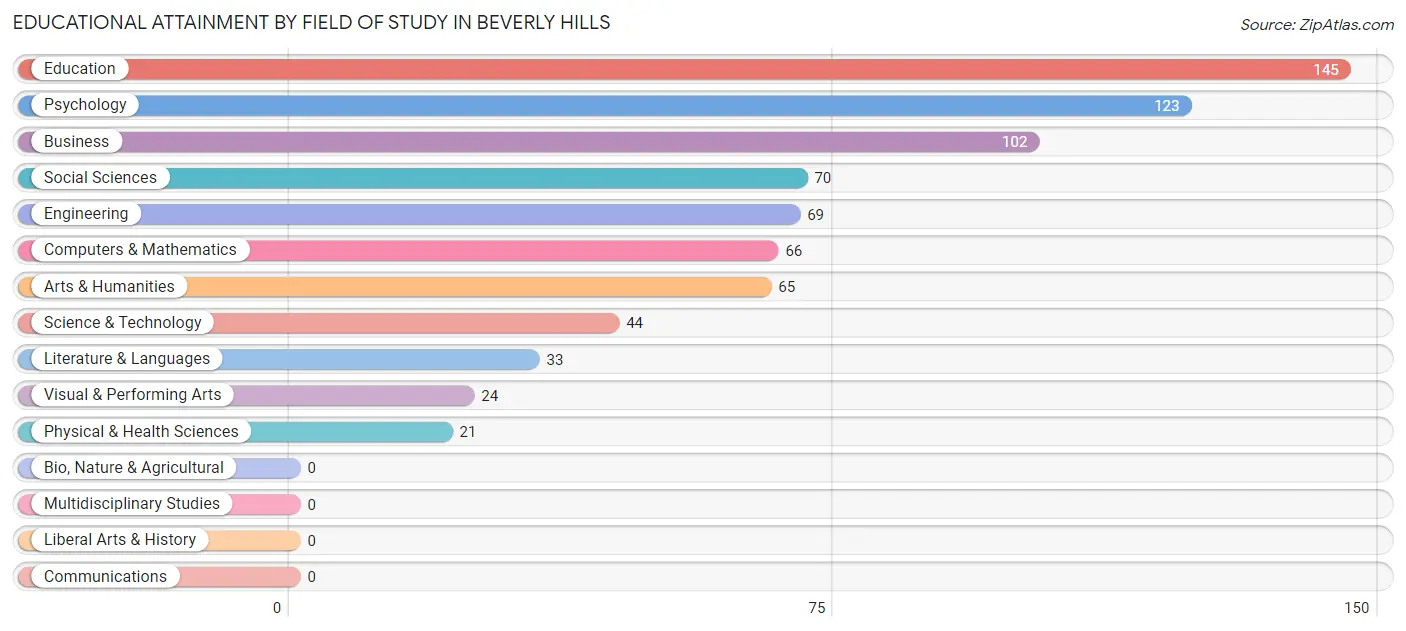
Educational Attainment by Field of Study in Beverly Hills
Education (145 | 19.0%), psychology (123 | 16.1%), business (102 | 13.4%), social sciences (70 | 9.2%), and engineering (69 | 9.1%) are the most common fields of study among 762 individuals in Beverly Hills who have obtained a bachelor's degree or higher.
| Field of Study | # Graduates | % Graduates |
| Computers & Mathematics | 66 | 8.7% |
| Bio, Nature & Agricultural | 0 | 0.0% |
| Physical & Health Sciences | 21 | 2.8% |
| Psychology | 123 | 16.1% |
| Social Sciences | 70 | 9.2% |
| Engineering | 69 | 9.1% |
| Multidisciplinary Studies | 0 | 0.0% |
| Science & Technology | 44 | 5.8% |
| Business | 102 | 13.4% |
| Education | 145 | 19.0% |
| Literature & Languages | 33 | 4.3% |
| Liberal Arts & History | 0 | 0.0% |
| Visual & Performing Arts | 24 | 3.2% |
| Communications | 0 | 0.0% |
| Arts & Humanities | 65 | 8.5% |
| Total | 762 | 100.0% |
Transportation & Commute in Beverly Hills
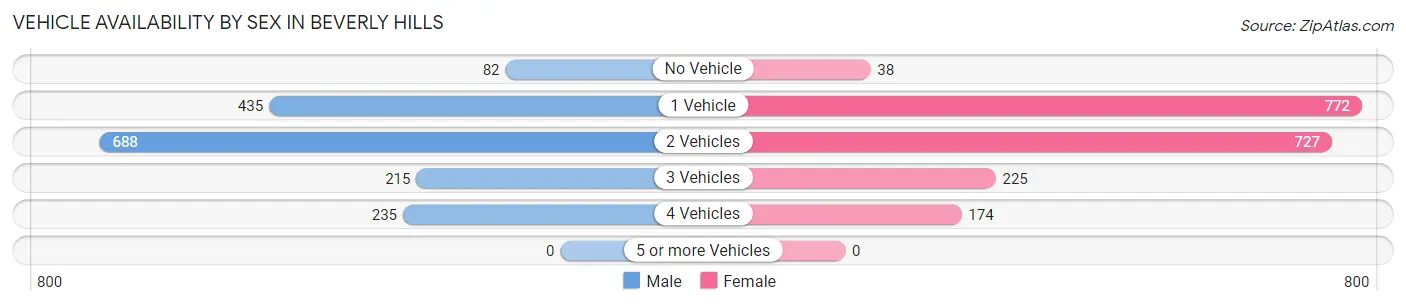
Vehicle Availability by Sex in Beverly Hills
The most prevalent vehicle ownership categories in Beverly Hills are males with 2 vehicles (688, accounting for 41.6%) and females with 2 vehicles (727, making up 35.5%).
| Vehicles Available | Male | Female |
| No Vehicle | 82 (5.0%) | 38 (2.0%) |
| 1 Vehicle | 435 (26.3%) | 772 (39.9%) |
| 2 Vehicles | 688 (41.6%) | 727 (37.6%) |
| 3 Vehicles | 215 (13.0%) | 225 (11.6%) |
| 4 Vehicles | 235 (14.2%) | 174 (9.0%) |
| 5 or more Vehicles | 0 (0.0%) | 0 (0.0%) |
| Total | 1,655 (100.0%) | 1,936 (100.0%) |
Commute Time in Beverly Hills
The most frequently occuring commute durations in Beverly Hills are 20 to 24 minutes (761 commuters, 22.2%), 10 to 14 minutes (658 commuters, 19.2%), and 30 to 34 minutes (395 commuters, 11.5%).
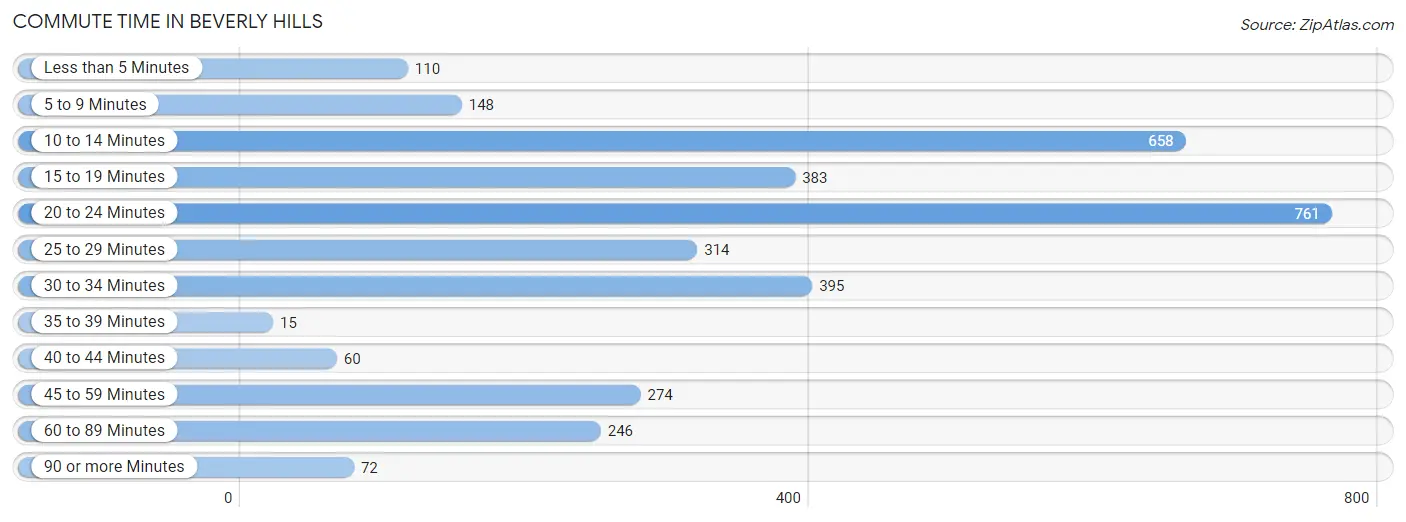
| Commute Time | # Commuters | % Commuters |
| Less than 5 Minutes | 110 | 3.2% |
| 5 to 9 Minutes | 148 | 4.3% |
| 10 to 14 Minutes | 658 | 19.2% |
| 15 to 19 Minutes | 383 | 11.2% |
| 20 to 24 Minutes | 761 | 22.2% |
| 25 to 29 Minutes | 314 | 9.1% |
| 30 to 34 Minutes | 395 | 11.5% |
| 35 to 39 Minutes | 15 | 0.4% |
| 40 to 44 Minutes | 60 | 1.8% |
| 45 to 59 Minutes | 274 | 8.0% |
| 60 to 89 Minutes | 246 | 7.2% |
| 90 or more Minutes | 72 | 2.1% |
Commute Time by Sex in Beverly Hills
The most common commute times in Beverly Hills are 20 to 24 minutes (393 commuters, 24.0%) for males and 20 to 24 minutes (368 commuters, 20.5%) for females.
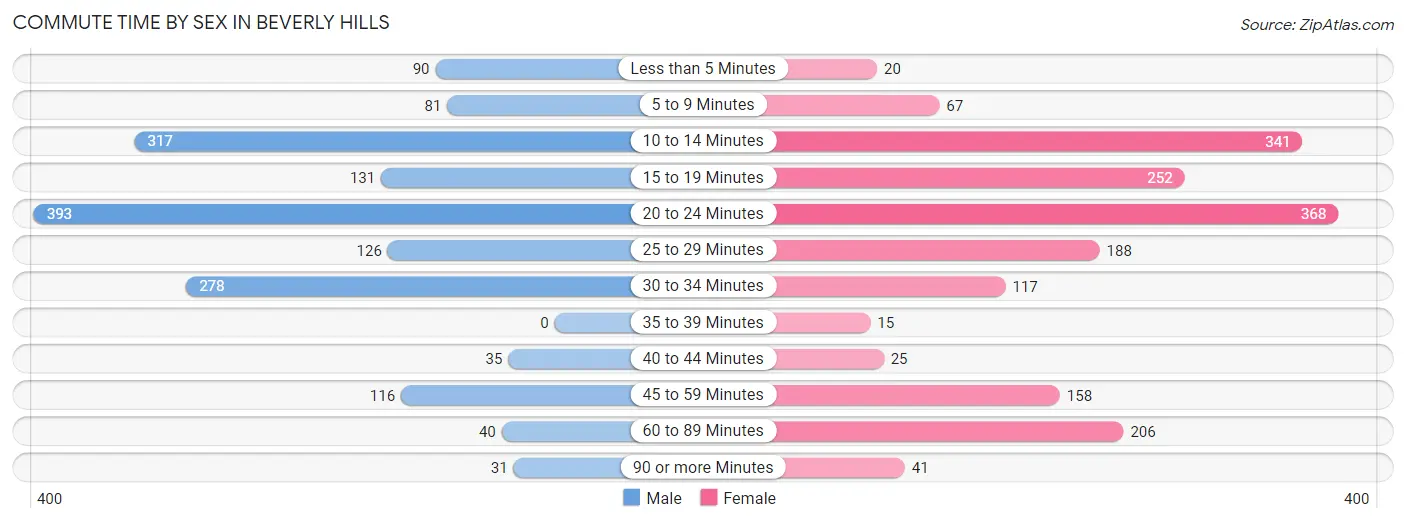
| Commute Time | Male | Female |
| Less than 5 Minutes | 90 (5.5%) | 20 (1.1%) |
| 5 to 9 Minutes | 81 (5.0%) | 67 (3.7%) |
| 10 to 14 Minutes | 317 (19.4%) | 341 (19.0%) |
| 15 to 19 Minutes | 131 (8.0%) | 252 (14.0%) |
| 20 to 24 Minutes | 393 (24.0%) | 368 (20.5%) |
| 25 to 29 Minutes | 126 (7.7%) | 188 (10.5%) |
| 30 to 34 Minutes | 278 (17.0%) | 117 (6.5%) |
| 35 to 39 Minutes | 0 (0.0%) | 15 (0.8%) |
| 40 to 44 Minutes | 35 (2.1%) | 25 (1.4%) |
| 45 to 59 Minutes | 116 (7.1%) | 158 (8.8%) |
| 60 to 89 Minutes | 40 (2.4%) | 206 (11.5%) |
| 90 or more Minutes | 31 (1.9%) | 41 (2.3%) |
Time of Departure to Work by Sex in Beverly Hills
The most frequent times of departure to work in Beverly Hills are 6:30 AM to 6:59 AM (353, 21.5%) for males and 8:00 AM to 8:29 AM (469, 26.1%) for females.
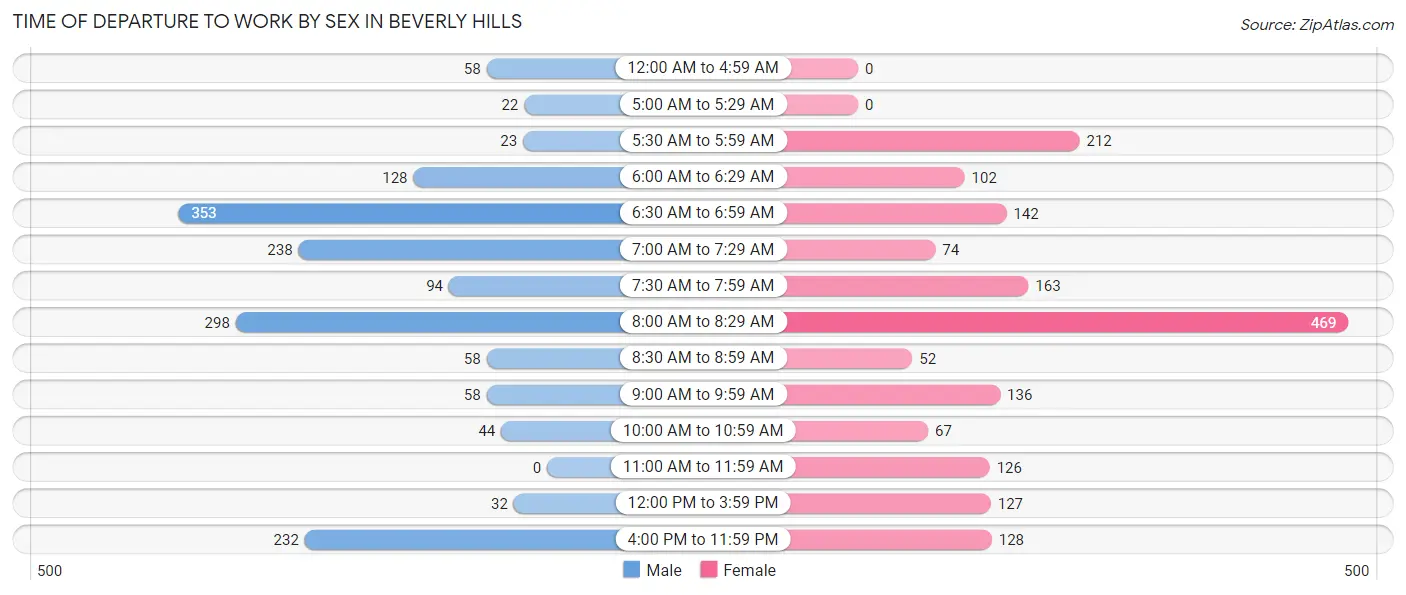
| Time of Departure | Male | Female |
| 12:00 AM to 4:59 AM | 58 (3.5%) | 0 (0.0%) |
| 5:00 AM to 5:29 AM | 22 (1.3%) | 0 (0.0%) |
| 5:30 AM to 5:59 AM | 23 (1.4%) | 212 (11.8%) |
| 6:00 AM to 6:29 AM | 128 (7.8%) | 102 (5.7%) |
| 6:30 AM to 6:59 AM | 353 (21.5%) | 142 (7.9%) |
| 7:00 AM to 7:29 AM | 238 (14.5%) | 74 (4.1%) |
| 7:30 AM to 7:59 AM | 94 (5.7%) | 163 (9.1%) |
| 8:00 AM to 8:29 AM | 298 (18.2%) | 469 (26.1%) |
| 8:30 AM to 8:59 AM | 58 (3.5%) | 52 (2.9%) |
| 9:00 AM to 9:59 AM | 58 (3.5%) | 136 (7.6%) |
| 10:00 AM to 10:59 AM | 44 (2.7%) | 67 (3.7%) |
| 11:00 AM to 11:59 AM | 0 (0.0%) | 126 (7.0%) |
| 12:00 PM to 3:59 PM | 32 (1.9%) | 127 (7.1%) |
| 4:00 PM to 11:59 PM | 232 (14.2%) | 128 (7.1%) |
| Total | 1,638 (100.0%) | 1,798 (100.0%) |
Housing Occupancy in Beverly Hills
Occupancy by Ownership in Beverly Hills
Of the total 4,502 dwellings in Beverly Hills, owner-occupied units account for 3,012 (66.9%), while renter-occupied units make up 1,490 (33.1%).
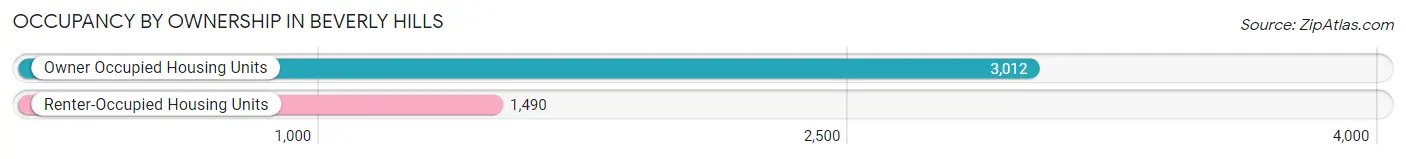
| Occupancy | # Housing Units | % Housing Units |
| Owner Occupied Housing Units | 3,012 | 66.9% |
| Renter-Occupied Housing Units | 1,490 | 33.1% |
| Total Occupied Housing Units | 4,502 | 100.0% |
Occupancy by Household Size in Beverly Hills
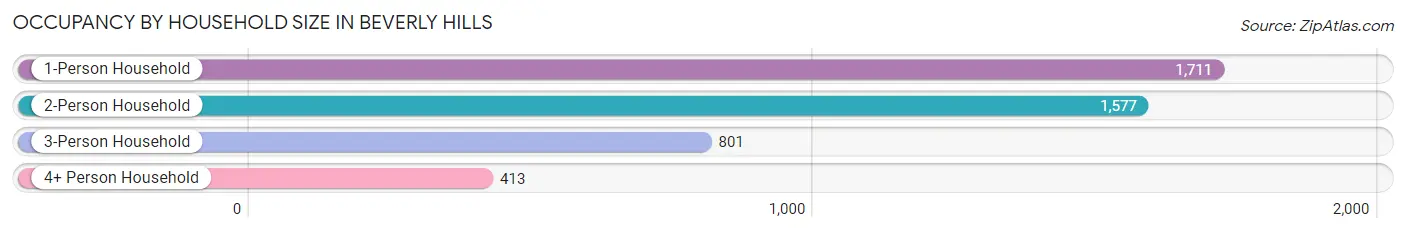
| Household Size | # Housing Units | % Housing Units |
| 1-Person Household | 1,711 | 38.0% |
| 2-Person Household | 1,577 | 35.0% |
| 3-Person Household | 801 | 17.8% |
| 4+ Person Household | 413 | 9.2% |
| Total Housing Units | 4,502 | 100.0% |
Occupancy by Ownership by Household Size in Beverly Hills
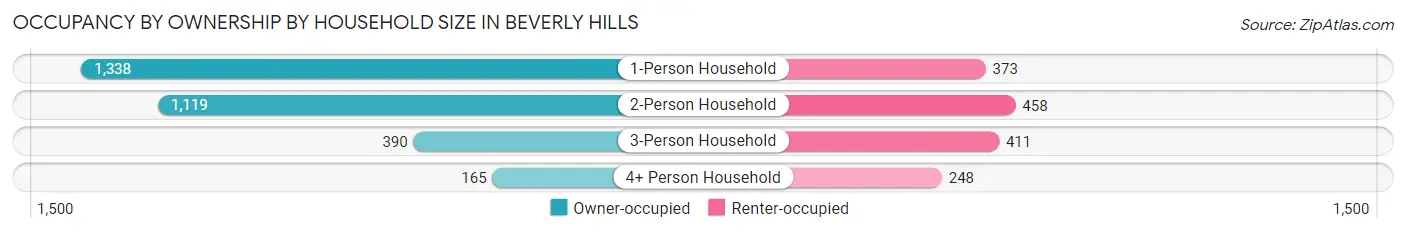
| Household Size | Owner-occupied | Renter-occupied |
| 1-Person Household | 1,338 (78.2%) | 373 (21.8%) |
| 2-Person Household | 1,119 (71.0%) | 458 (29.0%) |
| 3-Person Household | 390 (48.7%) | 411 (51.3%) |
| 4+ Person Household | 165 (40.0%) | 248 (60.1%) |
| Total Housing Units | 3,012 (66.9%) | 1,490 (33.1%) |
Occupancy by Educational Attainment in Beverly Hills
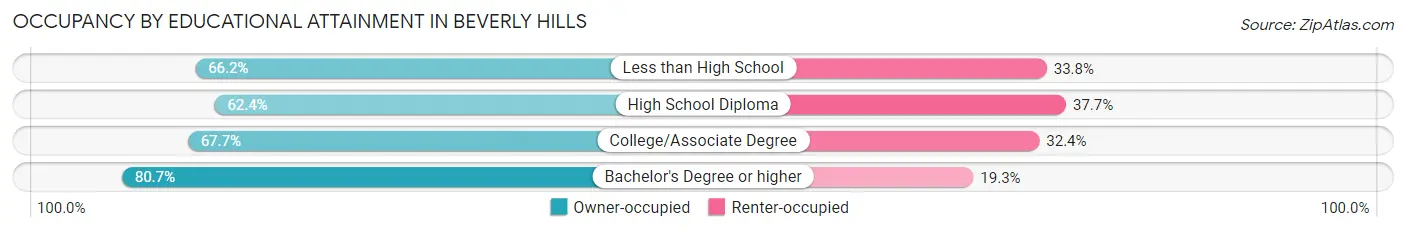
| Household Size | Owner-occupied | Renter-occupied |
| Less than High School | 221 (66.2%) | 113 (33.8%) |
| High School Diploma | 1,063 (62.4%) | 642 (37.7%) |
| College/Associate Degree | 1,347 (67.6%) | 644 (32.4%) |
| Bachelor's Degree or higher | 381 (80.7%) | 91 (19.3%) |
Occupancy by Age of Householder in Beverly Hills
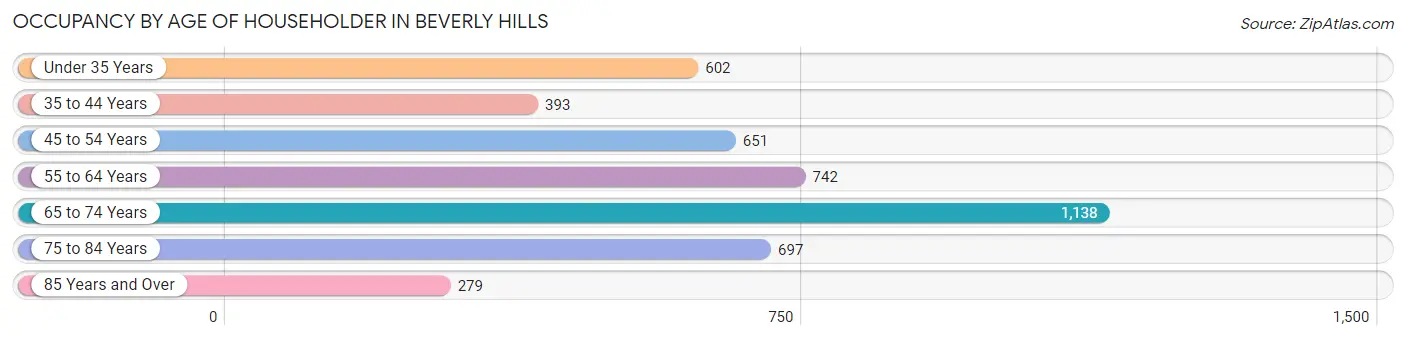
| Age Bracket | # Households | % Households |
| Under 35 Years | 602 | 13.4% |
| 35 to 44 Years | 393 | 8.7% |
| 45 to 54 Years | 651 | 14.5% |
| 55 to 64 Years | 742 | 16.5% |
| 65 to 74 Years | 1,138 | 25.3% |
| 75 to 84 Years | 697 | 15.5% |
| 85 Years and Over | 279 | 6.2% |
| Total | 4,502 | 100.0% |
Housing Finances in Beverly Hills
Median Income by Occupancy in Beverly Hills
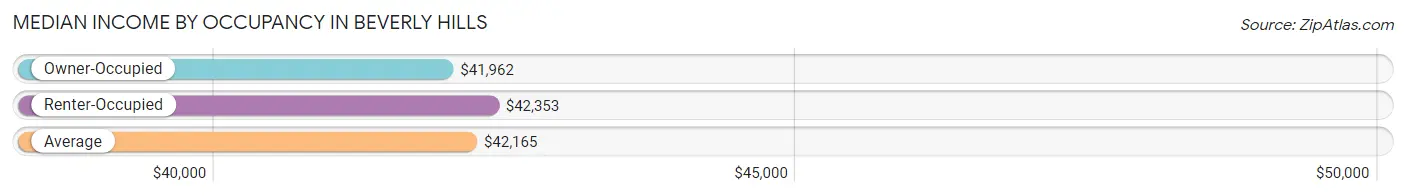
| Occupancy Type | # Households | Median Income |
| Owner-Occupied | 3,012 (66.9%) | $41,962 |
| Renter-Occupied | 1,490 (33.1%) | $42,353 |
| Average | 4,502 (100.0%) | $42,165 |
Occupancy by Householder Income Bracket in Beverly Hills
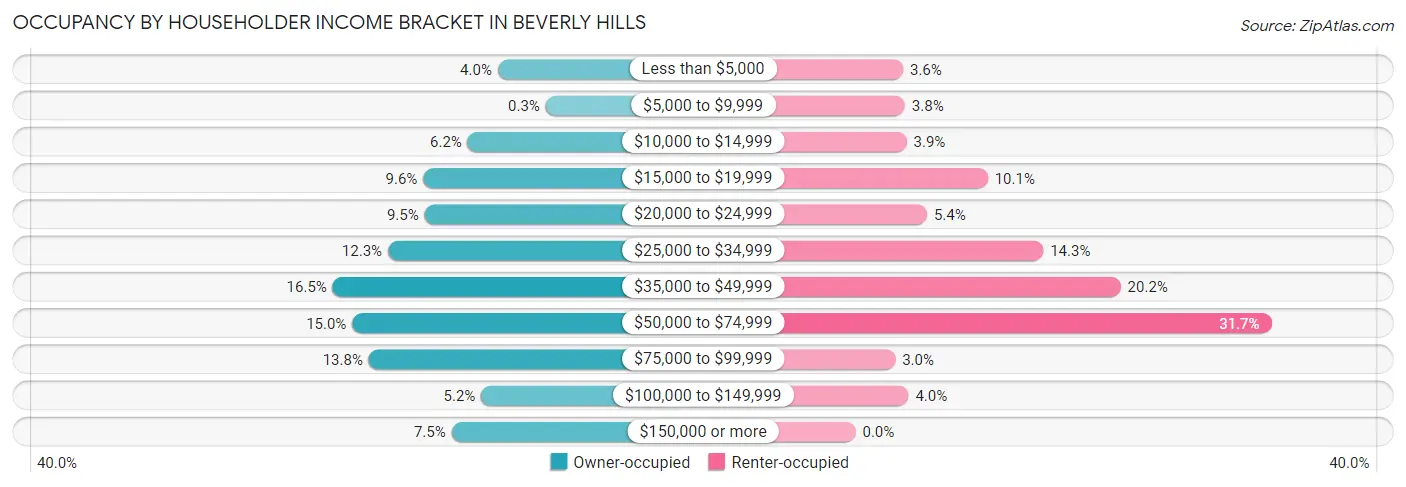
| Income Bracket | Owner-occupied | Renter-occupied |
| Less than $5,000 | 119 (4.0%) | 54 (3.6%) |
| $5,000 to $9,999 | 9 (0.3%) | 56 (3.8%) |
| $10,000 to $14,999 | 188 (6.2%) | 58 (3.9%) |
| $15,000 to $19,999 | 290 (9.6%) | 150 (10.1%) |
| $20,000 to $24,999 | 287 (9.5%) | 81 (5.4%) |
| $25,000 to $34,999 | 371 (12.3%) | 213 (14.3%) |
| $35,000 to $49,999 | 498 (16.5%) | 301 (20.2%) |
| $50,000 to $74,999 | 453 (15.0%) | 472 (31.7%) |
| $75,000 to $99,999 | 415 (13.8%) | 45 (3.0%) |
| $100,000 to $149,999 | 157 (5.2%) | 60 (4.0%) |
| $150,000 or more | 225 (7.5%) | 0 (0.0%) |
| Total | 3,012 (100.0%) | 1,490 (100.0%) |
Monthly Housing Cost Tiers in Beverly Hills
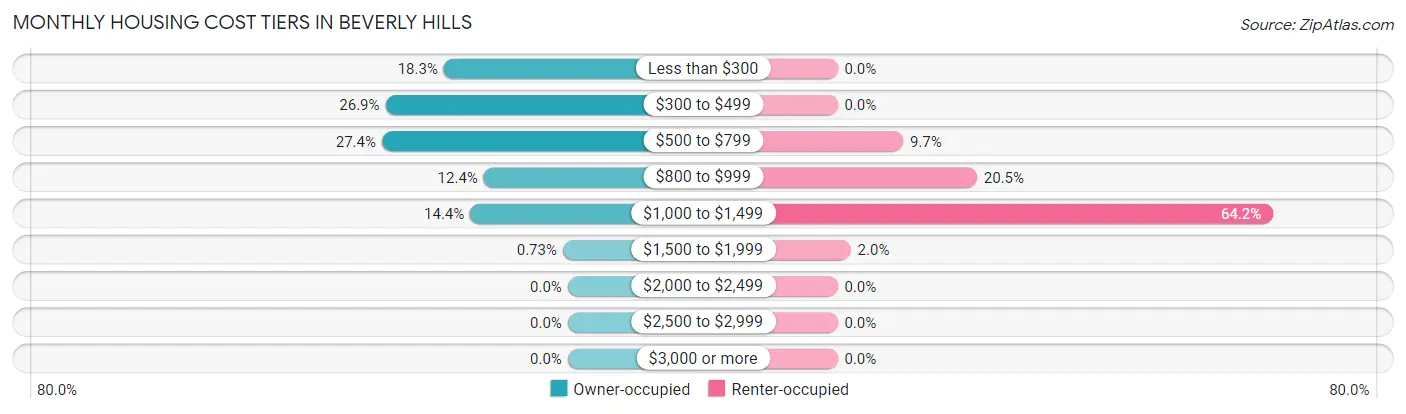
| Monthly Cost | Owner-occupied | Renter-occupied |
| Less than $300 | 550 (18.3%) | 0 (0.0%) |
| $300 to $499 | 809 (26.9%) | 0 (0.0%) |
| $500 to $799 | 825 (27.4%) | 144 (9.7%) |
| $800 to $999 | 373 (12.4%) | 306 (20.5%) |
| $1,000 to $1,499 | 433 (14.4%) | 956 (64.2%) |
| $1,500 to $1,999 | 22 (0.7%) | 29 (1.9%) |
| $2,000 to $2,499 | 0 (0.0%) | 0 (0.0%) |
| $2,500 to $2,999 | 0 (0.0%) | 0 (0.0%) |
| $3,000 or more | 0 (0.0%) | 0 (0.0%) |
| Total | 3,012 (100.0%) | 1,490 (100.0%) |
Physical Housing Characteristics in Beverly Hills
Housing Structures in Beverly Hills
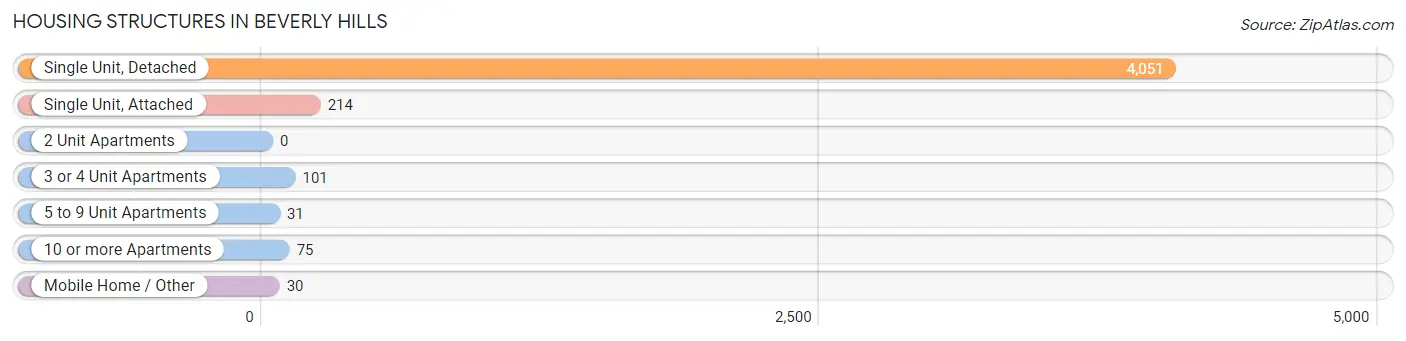
| Structure Type | # Housing Units | % Housing Units |
| Single Unit, Detached | 4,051 | 90.0% |
| Single Unit, Attached | 214 | 4.8% |
| 2 Unit Apartments | 0 | 0.0% |
| 3 or 4 Unit Apartments | 101 | 2.2% |
| 5 to 9 Unit Apartments | 31 | 0.7% |
| 10 or more Apartments | 75 | 1.7% |
| Mobile Home / Other | 30 | 0.7% |
| Total | 4,502 | 100.0% |
Housing Structures by Occupancy in Beverly Hills
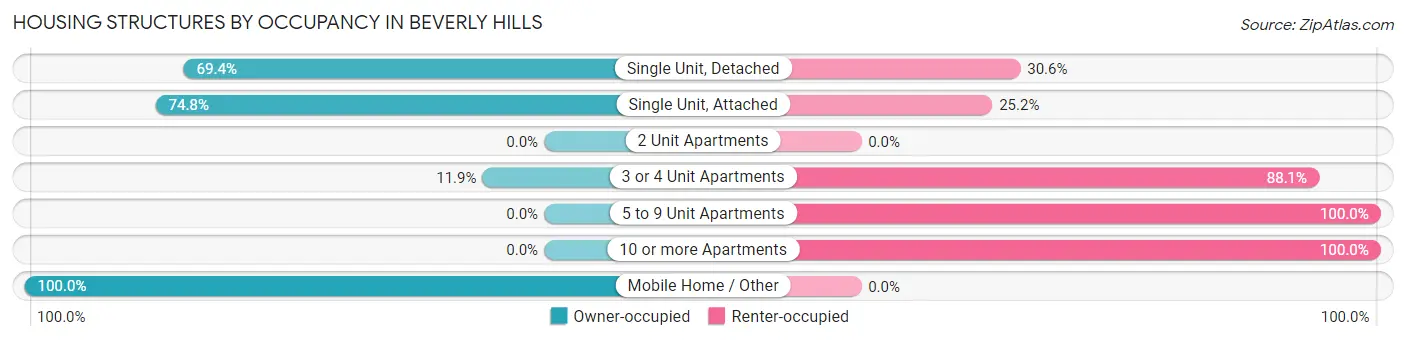
| Structure Type | Owner-occupied | Renter-occupied |
| Single Unit, Detached | 2,810 (69.4%) | 1,241 (30.6%) |
| Single Unit, Attached | 160 (74.8%) | 54 (25.2%) |
| 2 Unit Apartments | 0 (0.0%) | 0 (0.0%) |
| 3 or 4 Unit Apartments | 12 (11.9%) | 89 (88.1%) |
| 5 to 9 Unit Apartments | 0 (0.0%) | 31 (100.0%) |
| 10 or more Apartments | 0 (0.0%) | 75 (100.0%) |
| Mobile Home / Other | 30 (100.0%) | 0 (0.0%) |
| Total | 3,012 (66.9%) | 1,490 (33.1%) |
Housing Structures by Number of Rooms in Beverly Hills
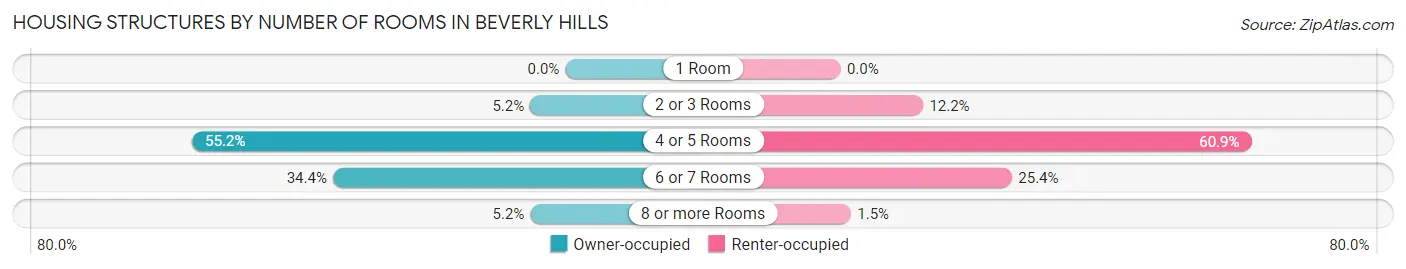
| Number of Rooms | Owner-occupied | Renter-occupied |
| 1 Room | 0 (0.0%) | 0 (0.0%) |
| 2 or 3 Rooms | 157 (5.2%) | 182 (12.2%) |
| 4 or 5 Rooms | 1,663 (55.2%) | 907 (60.9%) |
| 6 or 7 Rooms | 1,036 (34.4%) | 378 (25.4%) |
| 8 or more Rooms | 156 (5.2%) | 23 (1.5%) |
| Total | 3,012 (100.0%) | 1,490 (100.0%) |
Housing Structure by Heating Type in Beverly Hills
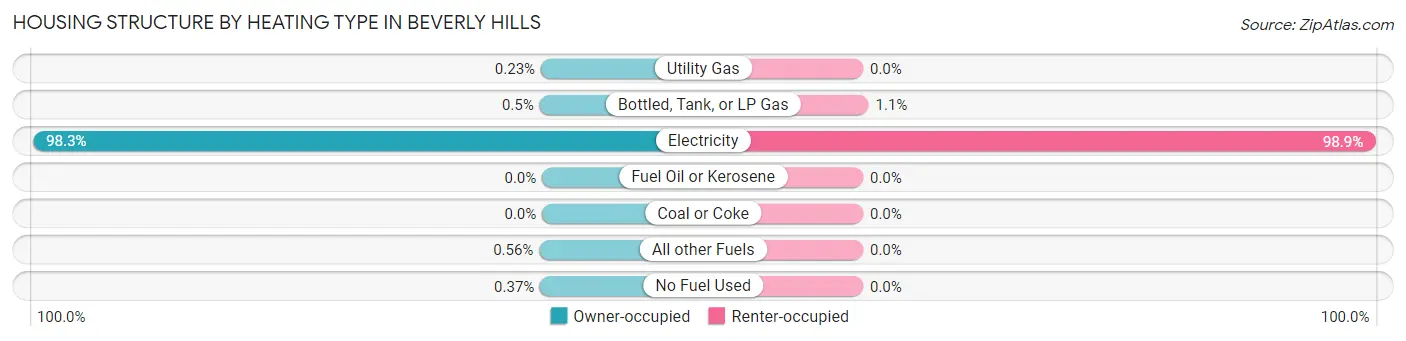
| Heating Type | Owner-occupied | Renter-occupied |
| Utility Gas | 7 (0.2%) | 0 (0.0%) |
| Bottled, Tank, or LP Gas | 15 (0.5%) | 16 (1.1%) |
| Electricity | 2,962 (98.3%) | 1,474 (98.9%) |
| Fuel Oil or Kerosene | 0 (0.0%) | 0 (0.0%) |
| Coal or Coke | 0 (0.0%) | 0 (0.0%) |
| All other Fuels | 17 (0.6%) | 0 (0.0%) |
| No Fuel Used | 11 (0.4%) | 0 (0.0%) |
| Total | 3,012 (100.0%) | 1,490 (100.0%) |
Household Vehicle Usage in Beverly Hills
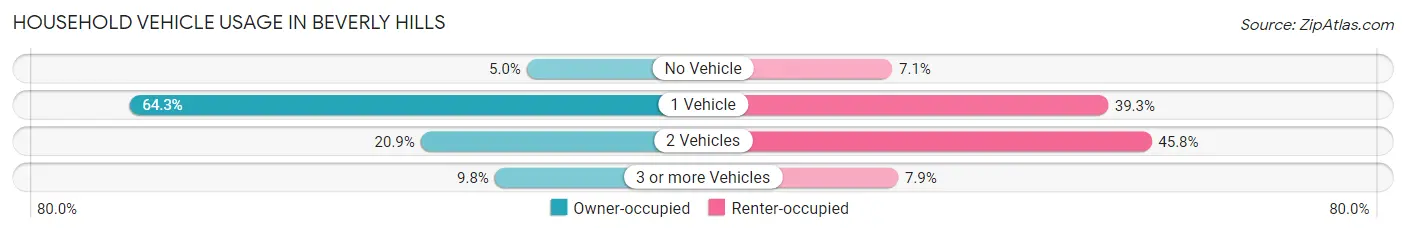
| Vehicles per Household | Owner-occupied | Renter-occupied |
| No Vehicle | 151 (5.0%) | 105 (7.0%) |
| 1 Vehicle | 1,938 (64.3%) | 585 (39.3%) |
| 2 Vehicles | 628 (20.8%) | 682 (45.8%) |
| 3 or more Vehicles | 295 (9.8%) | 118 (7.9%) |
| Total | 3,012 (100.0%) | 1,490 (100.0%) |
Real Estate & Mortgages in Beverly Hills
Real Estate and Mortgage Overview in Beverly Hills
| Characteristic | Without Mortgage | With Mortgage |
| Housing Units | 1,405 | 1,607 |
| Median Property Value | $124,500 | $128,100 |
| Median Household Income | $39,704 | $45 |
| Monthly Housing Costs | $328 | $0 |
| Real Estate Taxes | $584 | $126 |
Property Value by Mortgage Status in Beverly Hills
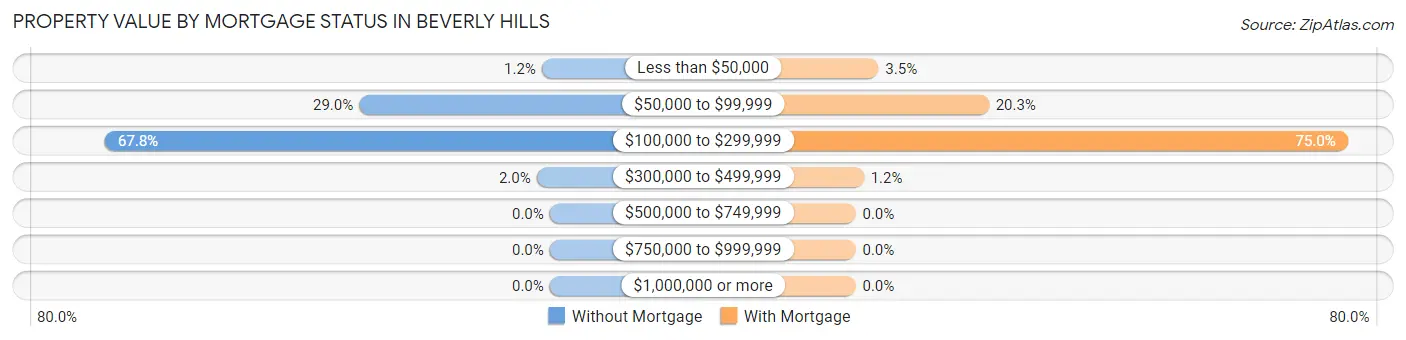
| Property Value | Without Mortgage | With Mortgage |
| Less than $50,000 | 17 (1.2%) | 56 (3.5%) |
| $50,000 to $99,999 | 408 (29.0%) | 326 (20.3%) |
| $100,000 to $299,999 | 952 (67.8%) | 1,205 (75.0%) |
| $300,000 to $499,999 | 28 (2.0%) | 20 (1.2%) |
| $500,000 to $749,999 | 0 (0.0%) | 0 (0.0%) |
| $750,000 to $999,999 | 0 (0.0%) | 0 (0.0%) |
| $1,000,000 or more | 0 (0.0%) | 0 (0.0%) |
| Total | 1,405 (100.0%) | 1,607 (100.0%) |
Household Income by Mortgage Status in Beverly Hills
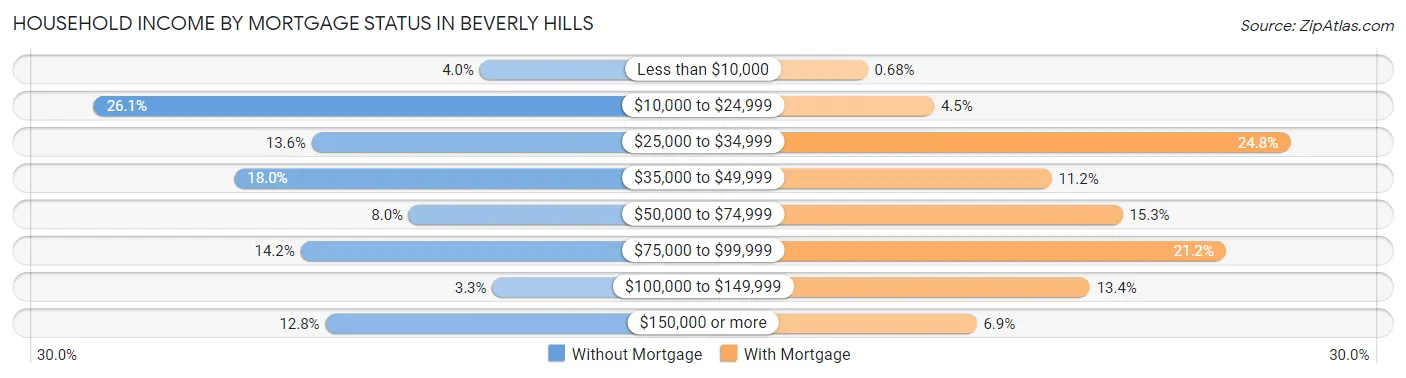
| Household Income | Without Mortgage | With Mortgage |
| Less than $10,000 | 56 (4.0%) | 11 (0.7%) |
| $10,000 to $24,999 | 366 (26.1%) | 72 (4.5%) |
| $25,000 to $34,999 | 191 (13.6%) | 399 (24.8%) |
| $35,000 to $49,999 | 253 (18.0%) | 180 (11.2%) |
| $50,000 to $74,999 | 113 (8.0%) | 245 (15.2%) |
| $75,000 to $99,999 | 200 (14.2%) | 340 (21.2%) |
| $100,000 to $149,999 | 46 (3.3%) | 215 (13.4%) |
| $150,000 or more | 180 (12.8%) | 111 (6.9%) |
| Total | 1,405 (100.0%) | 1,607 (100.0%) |
Property Value to Household Income Ratio in Beverly Hills
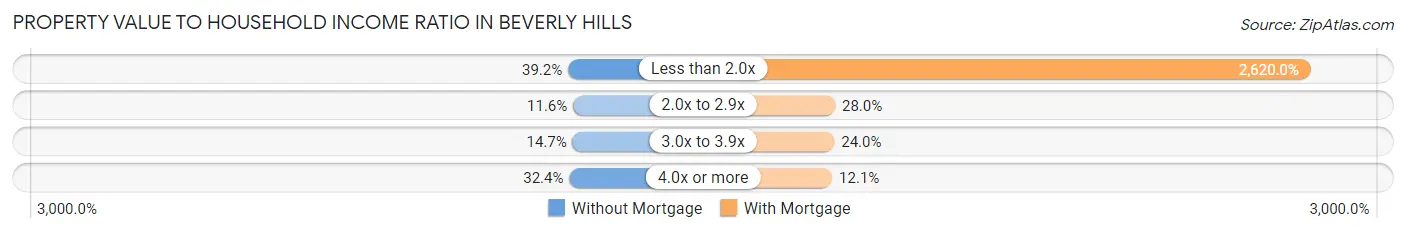
| Value-to-Income Ratio | Without Mortgage | With Mortgage |
| Less than 2.0x | 550 (39.2%) | 42,104 (2,620.0%) |
| 2.0x to 2.9x | 163 (11.6%) | 450 (28.0%) |
| 3.0x to 3.9x | 207 (14.7%) | 386 (24.0%) |
| 4.0x or more | 455 (32.4%) | 195 (12.1%) |
| Total | 1,405 (100.0%) | 1,607 (100.0%) |
Real Estate Taxes by Mortgage Status in Beverly Hills
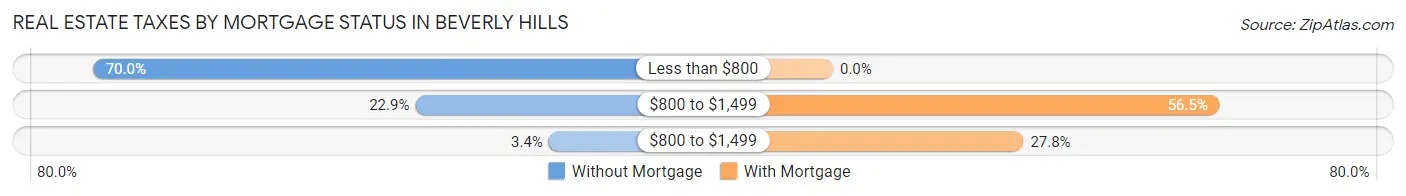
| Property Taxes | Without Mortgage | With Mortgage |
| Less than $800 | 984 (70.0%) | 0 (0.0%) |
| $800 to $1,499 | 322 (22.9%) | 908 (56.5%) |
| $800 to $1,499 | 48 (3.4%) | 447 (27.8%) |
| Total | 1,405 (100.0%) | 1,607 (100.0%) |
Health & Disability in Beverly Hills
Health Insurance Coverage by Age in Beverly Hills
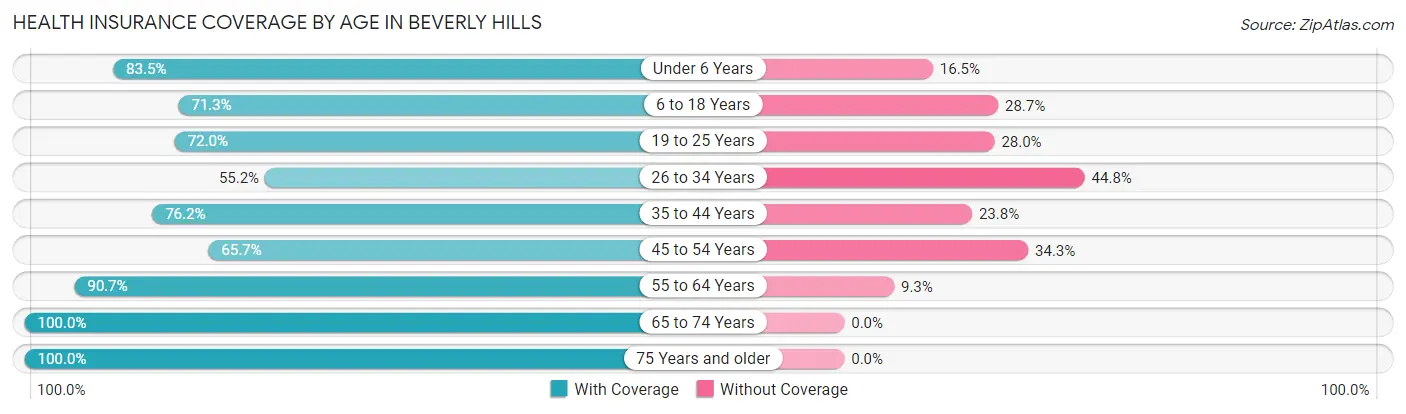
| Age Bracket | With Coverage | Without Coverage |
| Under 6 Years | 374 (83.5%) | 74 (16.5%) |
| 6 to 18 Years | 791 (71.3%) | 318 (28.7%) |
| 19 to 25 Years | 720 (72.0%) | 280 (28.0%) |
| 26 to 34 Years | 458 (55.2%) | 372 (44.8%) |
| 35 to 44 Years | 771 (76.2%) | 241 (23.8%) |
| 45 to 54 Years | 721 (65.7%) | 376 (34.3%) |
| 55 to 64 Years | 1,163 (90.7%) | 119 (9.3%) |
| 65 to 74 Years | 1,689 (100.0%) | 0 (0.0%) |
| 75 Years and older | 1,320 (100.0%) | 0 (0.0%) |
| Total | 8,007 (81.8%) | 1,780 (18.2%) |
Health Insurance Coverage by Citizenship Status in Beverly Hills
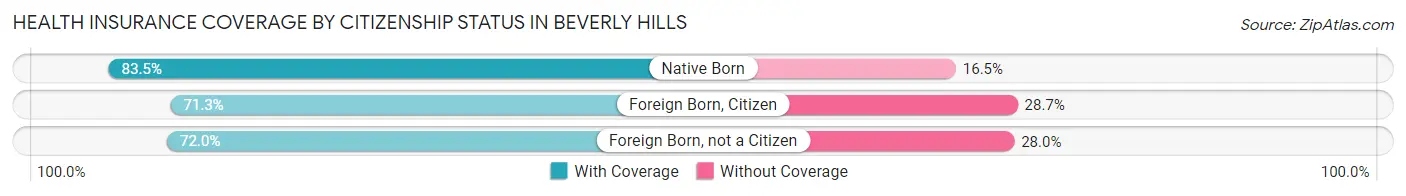
| Citizenship Status | With Coverage | Without Coverage |
| Native Born | 374 (83.5%) | 74 (16.5%) |
| Foreign Born, Citizen | 791 (71.3%) | 318 (28.7%) |
| Foreign Born, not a Citizen | 720 (72.0%) | 280 (28.0%) |
Health Insurance Coverage by Household Income in Beverly Hills
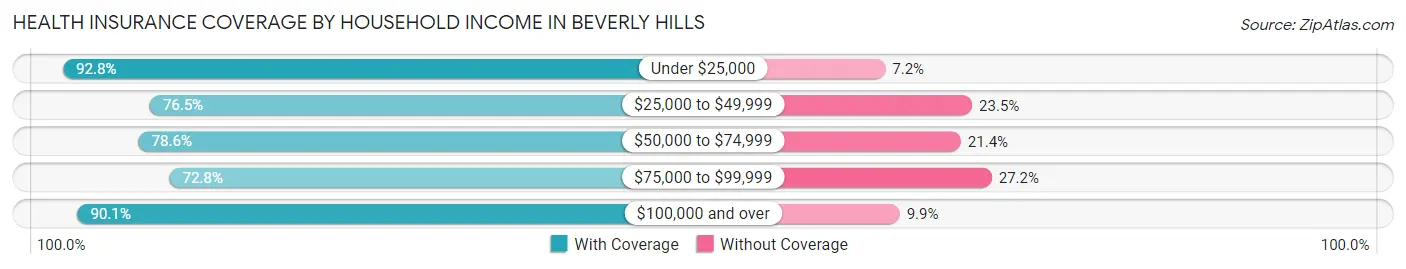
| Household Income | With Coverage | Without Coverage |
| Under $25,000 | 2,003 (92.8%) | 156 (7.2%) |
| $25,000 to $49,999 | 2,182 (76.5%) | 670 (23.5%) |
| $50,000 to $74,999 | 1,931 (78.6%) | 525 (21.4%) |
| $75,000 to $99,999 | 732 (72.8%) | 273 (27.2%) |
| $100,000 and over | 1,145 (90.1%) | 126 (9.9%) |
Public vs Private Health Insurance Coverage by Age in Beverly Hills
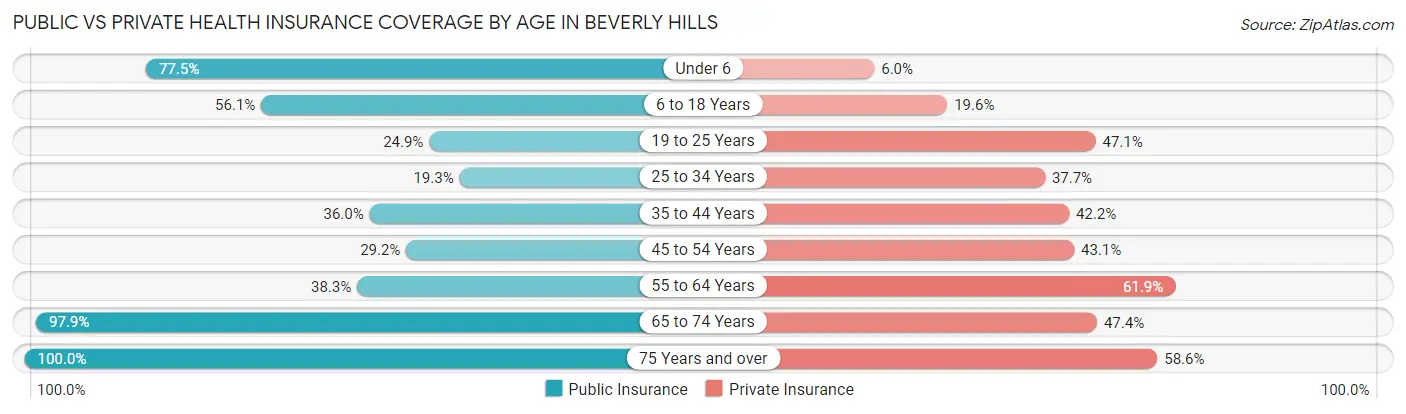
| Age Bracket | Public Insurance | Private Insurance |
| Under 6 | 347 (77.5%) | 27 (6.0%) |
| 6 to 18 Years | 622 (56.1%) | 217 (19.6%) |
| 19 to 25 Years | 249 (24.9%) | 471 (47.1%) |
| 25 to 34 Years | 160 (19.3%) | 313 (37.7%) |
| 35 to 44 Years | 364 (36.0%) | 427 (42.2%) |
| 45 to 54 Years | 320 (29.2%) | 473 (43.1%) |
| 55 to 64 Years | 491 (38.3%) | 793 (61.9%) |
| 65 to 74 Years | 1,653 (97.9%) | 800 (47.4%) |
| 75 Years and over | 1,320 (100.0%) | 773 (58.6%) |
| Total | 5,526 (56.5%) | 4,294 (43.9%) |
Disability Status by Sex by Age in Beverly Hills
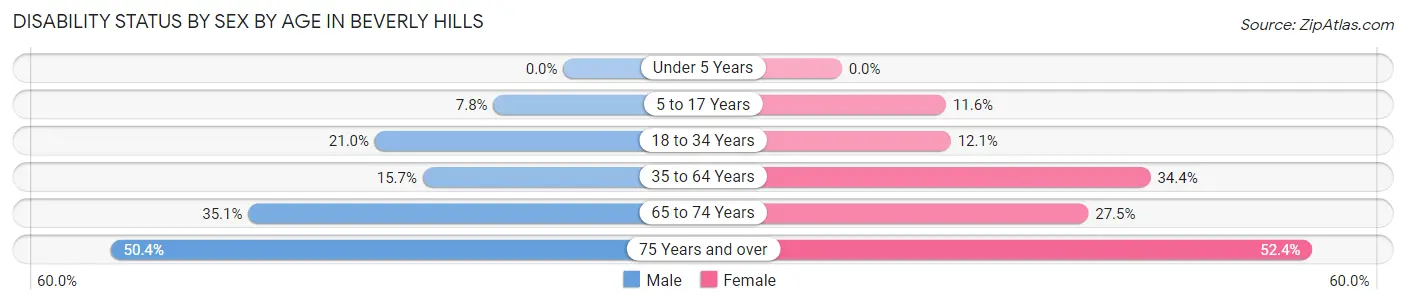
| Age Bracket | Male | Female |
| Under 5 Years | 0 (0.0%) | 0 (0.0%) |
| 5 to 17 Years | 56 (7.8%) | 37 (11.6%) |
| 18 to 34 Years | 207 (21.0%) | 123 (12.1%) |
| 35 to 64 Years | 217 (15.7%) | 689 (34.4%) |
| 65 to 74 Years | 227 (35.1%) | 286 (27.5%) |
| 75 Years and over | 300 (50.4%) | 380 (52.4%) |
Disability Class by Sex by Age in Beverly Hills
Disability Class: Hearing Difficulty
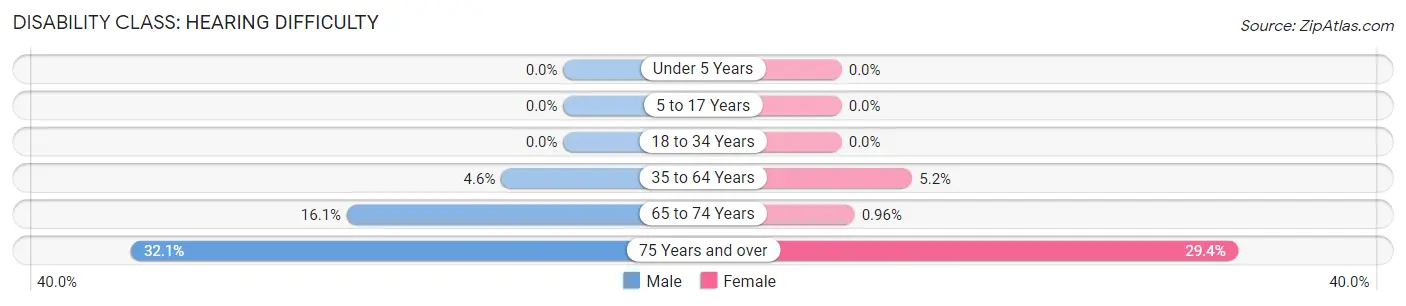
| Age Bracket | Male | Female |
| Under 5 Years | 0 (0.0%) | 0 (0.0%) |
| 5 to 17 Years | 0 (0.0%) | 0 (0.0%) |
| 18 to 34 Years | 0 (0.0%) | 0 (0.0%) |
| 35 to 64 Years | 64 (4.6%) | 105 (5.2%) |
| 65 to 74 Years | 104 (16.1%) | 10 (1.0%) |
| 75 Years and over | 191 (32.1%) | 213 (29.4%) |
Disability Class: Vision Difficulty
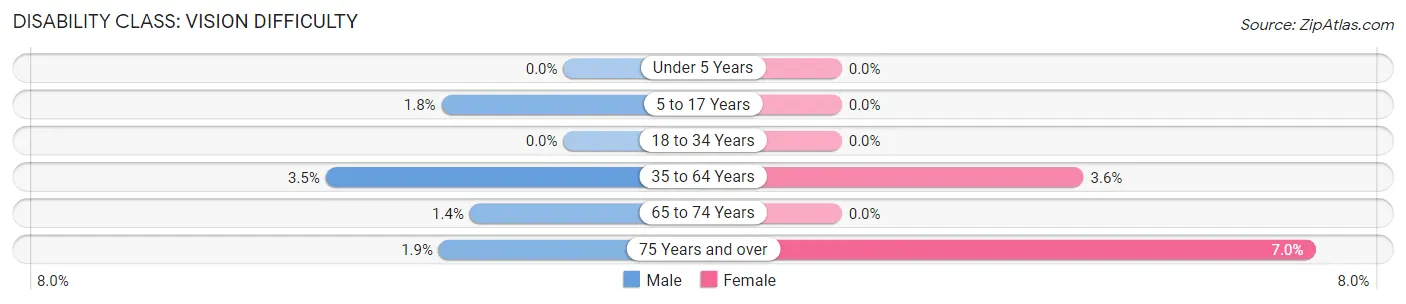
| Age Bracket | Male | Female |
| Under 5 Years | 0 (0.0%) | 0 (0.0%) |
| 5 to 17 Years | 13 (1.8%) | 0 (0.0%) |
| 18 to 34 Years | 0 (0.0%) | 0 (0.0%) |
| 35 to 64 Years | 49 (3.5%) | 72 (3.6%) |
| 65 to 74 Years | 9 (1.4%) | 0 (0.0%) |
| 75 Years and over | 11 (1.8%) | 51 (7.0%) |
Disability Class: Cognitive Difficulty
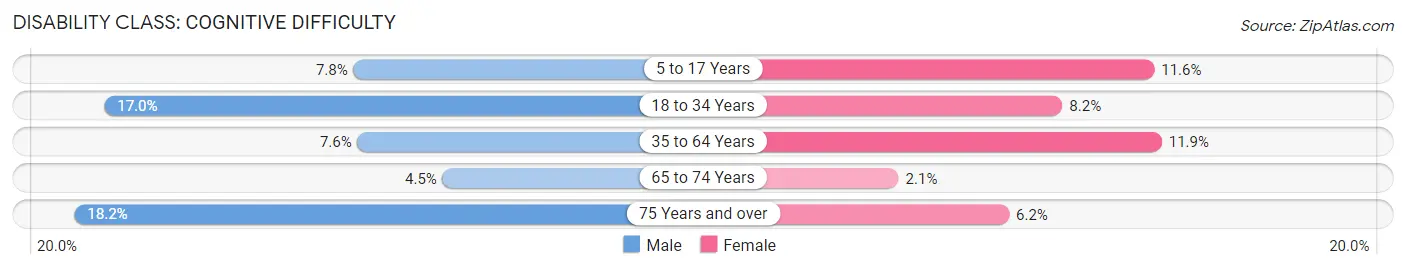
| Age Bracket | Male | Female |
| 5 to 17 Years | 56 (7.8%) | 37 (11.6%) |
| 18 to 34 Years | 168 (17.0%) | 83 (8.2%) |
| 35 to 64 Years | 106 (7.6%) | 238 (11.9%) |
| 65 to 74 Years | 29 (4.5%) | 22 (2.1%) |
| 75 Years and over | 108 (18.1%) | 45 (6.2%) |
Disability Class: Ambulatory Difficulty
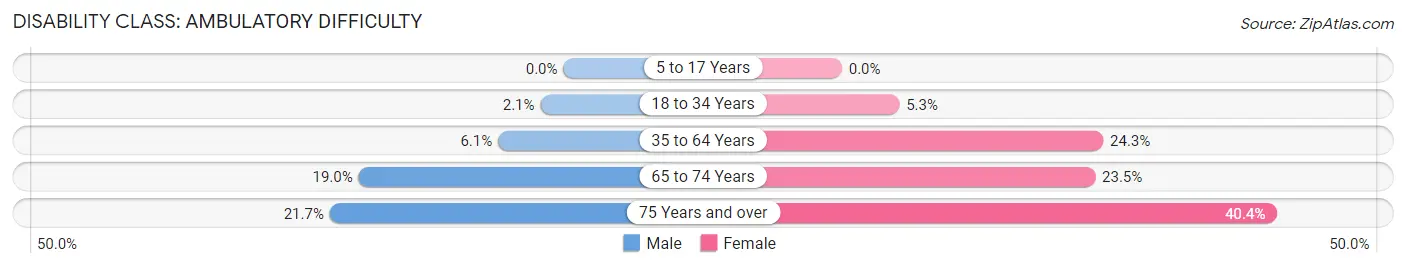
| Age Bracket | Male | Female |
| 5 to 17 Years | 0 (0.0%) | 0 (0.0%) |
| 18 to 34 Years | 21 (2.1%) | 54 (5.3%) |
| 35 to 64 Years | 84 (6.1%) | 486 (24.2%) |
| 65 to 74 Years | 123 (19.0%) | 245 (23.5%) |
| 75 Years and over | 129 (21.7%) | 293 (40.4%) |
Disability Class: Self-Care Difficulty
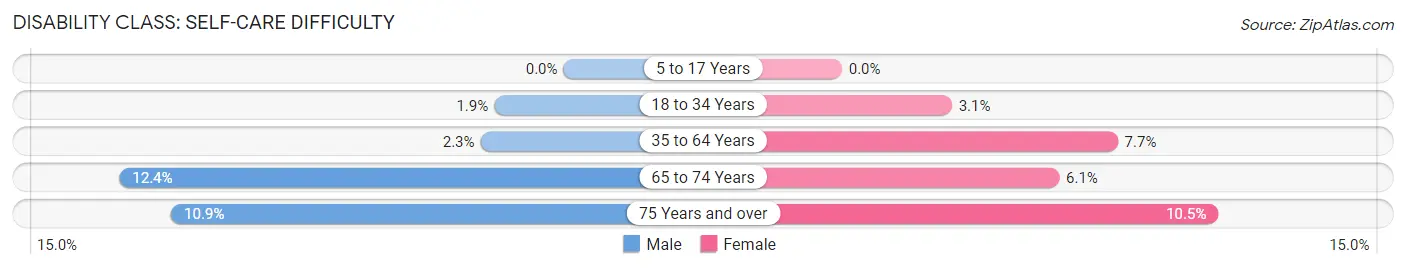
| Age Bracket | Male | Female |
| 5 to 17 Years | 0 (0.0%) | 0 (0.0%) |
| 18 to 34 Years | 19 (1.9%) | 31 (3.1%) |
| 35 to 64 Years | 32 (2.3%) | 154 (7.7%) |
| 65 to 74 Years | 80 (12.4%) | 63 (6.0%) |
| 75 Years and over | 65 (10.9%) | 76 (10.5%) |
Technology Access in Beverly Hills
Computing Device Access in Beverly Hills
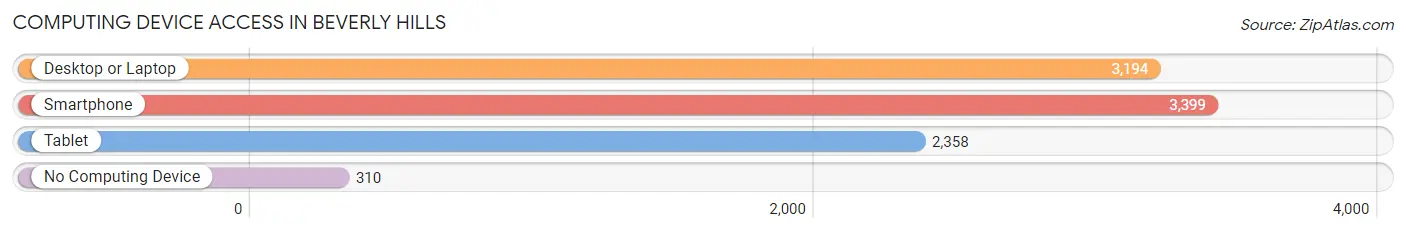
| Device Type | # Households | % Households |
| Desktop or Laptop | 3,194 | 71.0% |
| Smartphone | 3,399 | 75.5% |
| Tablet | 2,358 | 52.4% |
| No Computing Device | 310 | 6.9% |
| Total | 4,502 | 100.0% |
Internet Access in Beverly Hills
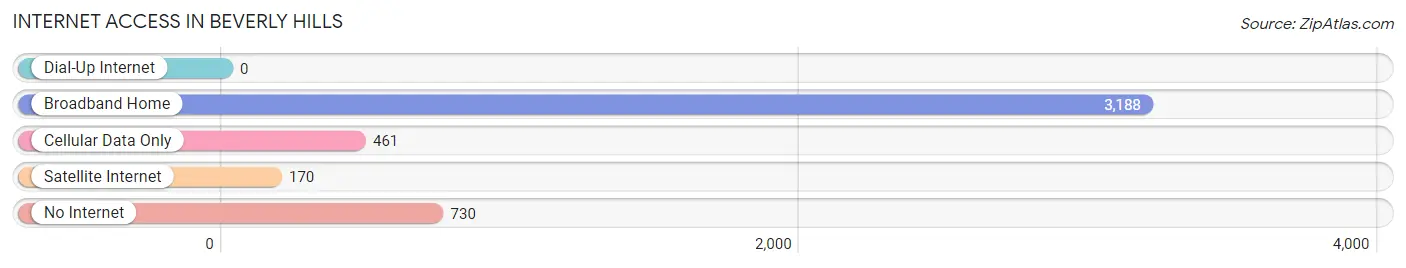
| Internet Type | # Households | % Households |
| Dial-Up Internet | 0 | 0.0% |
| Broadband Home | 3,188 | 70.8% |
| Cellular Data Only | 461 | 10.2% |
| Satellite Internet | 170 | 3.8% |
| No Internet | 730 | 16.2% |
| Total | 4,502 | 100.0% |
Beverly Hills Summary
Beverly Hills is an unincorporated community located in Citrus County, Florida, United States. It is located approximately 8 miles (13 km) north of the city of Inverness, the county seat. The population of Beverly Hills was 6,637 at the 2010 census.
History
Beverly Hills was originally known as Citrus Springs, and was established in the late 1800s. The area was first settled by the family of William and Mary Ann Hensley, who moved to the area from Georgia in 1887. The Hensleys built a home and a general store, and the area began to grow. In the early 1900s, the area was renamed Beverly Hills, after the famous Beverly Hills in California.
In the 1920s, the area began to develop as a tourist destination, with the construction of several hotels and resorts. The area was also home to a number of citrus groves, which provided employment for many of the residents.
In the 1950s, the area began to experience a population boom, as many people moved to the area from other parts of the country. The population continued to grow throughout the 1960s and 1970s, and the area began to develop into a suburban community.
Geography
Beverly Hills is located in central Citrus County, approximately 8 miles (13 km) north of the city of Inverness, the county seat. The community is located at the intersection of State Road 44 and County Road 491.
The terrain of Beverly Hills is mostly flat, with some rolling hills. The area is mostly wooded, with some open fields. The area is home to several lakes, including Lake Tsala Apopka, Lake Rousseau, and Lake Henderson.
Economy
The economy of Beverly Hills is largely based on tourism and agriculture. The area is home to several resorts and hotels, as well as a number of citrus groves. The area is also home to several retail stores, restaurants, and other businesses.
Demographics
As of the 2010 census, there were 6,637 people, 2,845 households, and 1,945 families residing in Beverly Hills. The population density was 1,093.3 people per square mile (422.2/km2). The racial makeup of the community was 94.2% White, 1.7% African American, 0.4% Native American, 0.9% Asian, 0.1% Pacific Islander, 1.3% from other races, and 1.4% from two or more races. Hispanic or Latino of any race were 5.2% of the population.
The median income for a household in Beverly Hills was $37,917, and the median income for a family was $45,917. Males had a median income of $35,917 versus $25,917 for females. The per capita income for the community was $20,917. About 8.2% of families and 10.2% of the population were below the poverty line, including 14.2% of those under age 18 and 6.2% of those age 65 or over.
Common Questions
What is the Total Population of Beverly Hills?
Total Population of Beverly Hills is 9,787.
What is the Total Male Population of Beverly Hills?
Total Male Population of Beverly Hills is 4,564.
What is the Total Female Population of Beverly Hills?
Total Female Population of Beverly Hills is 5,223.
What is the Ratio of Males per 100 Females in Beverly Hills?
There are 87.38 Males per 100 Females in Beverly Hills.
What is the Ratio of Females per 100 Males in Beverly Hills?
There are 114.44 Females per 100 Males in Beverly Hills.
What is the Median Population Age in Beverly Hills?
Median Population Age in Beverly Hills is 49.2 Years.
What is the Average Family Size in Beverly Hills
Average Family Size in Beverly Hills is 2.9 People.
What is the Average Household Size in Beverly Hills
Average Household Size in Beverly Hills is 2.2 People.
What is Per Capita Income in Beverly Hills?
Per Capita income in Beverly Hills is $27,043.
What is the Median Family Income in Beverly Hills?
Median Family Income in Beverly Hills is $55,512.
What is the Median Household income in Beverly Hills?
Median Household Income in Beverly Hills is $42,165.
What is Income or Wage Gap in Beverly Hills?
Income or Wage Gap in Beverly Hills is 28.2%.
Women in Beverly Hills earn 71.8 cents for every dollar earned by a man.
What is Inequality or Gini Index in Beverly Hills?
Inequality or Gini Index in Beverly Hills is 0.45.
How Large is the Labor Force in Beverly Hills?
There are 4,078 People in the Labor Forcein in Beverly Hills.
What is the Percentage of People in the Labor Force in Beverly Hills?
47.3% of People are in the Labor Force in Beverly Hills.
What is the Unemployment Rate in Beverly Hills?
Unemployment Rate in Beverly Hills is 8.5%.