Warrington, FL
Warrington Map
Warrington Overview
16,567
TOTAL POPULATION
7,751
MALE POPULATION
8,816
FEMALE POPULATION
87.92
MALES / 100 FEMALES
113.74
FEMALES / 100 MALES
45.1
MEDIAN AGE
2.9
AVG FAMILY SIZE
2.3
AVG HOUSEHOLD SIZE
$34,658
PER CAPITA INCOME
$56,055
AVG FAMILY INCOME
$51,016
AVG HOUSEHOLD INCOME
29.5%
WAGE / INCOME GAP [ % ]
70.5¢/ $1
WAGE / INCOME GAP [ $ ]
$11,466
FAMILY INCOME DEFICIT
0.51
INEQUALITY / GINI INDEX
8,206
LABOR FORCE [ PEOPLE ]
60.8%
PERCENT IN LABOR FORCE
7.7%
UNEMPLOYMENT RATE
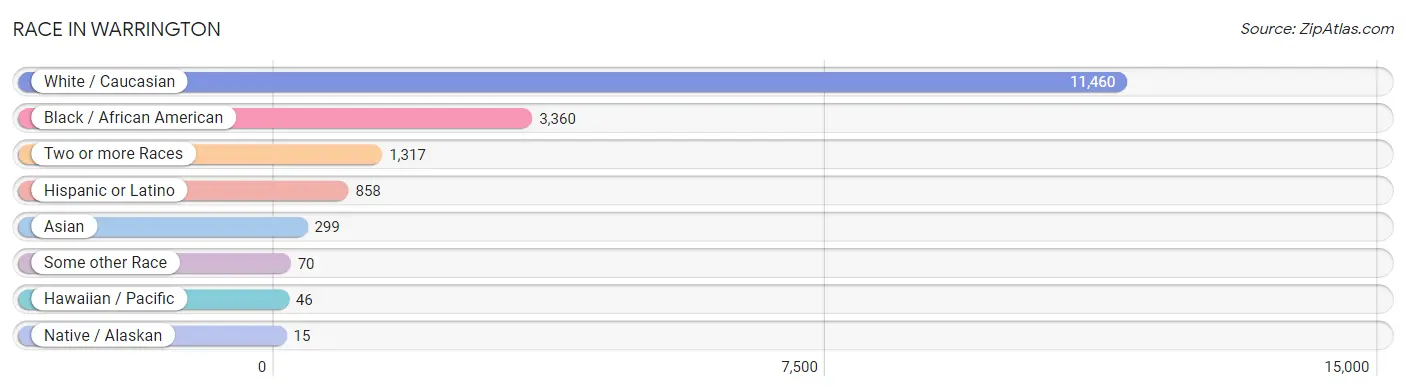
Race in Warrington
The most populous races in Warrington are White / Caucasian (11,460 | 69.2%), Black / African American (3,360 | 20.3%), and Two or more Races (1,317 | 8.0%).
| Race | # Population | % Population |
| Asian | 299 | 1.8% |
| Black / African American | 3,360 | 20.3% |
| Hawaiian / Pacific | 46 | 0.3% |
| Hispanic or Latino | 858 | 5.2% |
| Native / Alaskan | 15 | 0.1% |
| White / Caucasian | 11,460 | 69.2% |
| Two or more Races | 1,317 | 8.0% |
| Some other Race | 70 | 0.4% |
| Total | 16,567 | 100.0% |
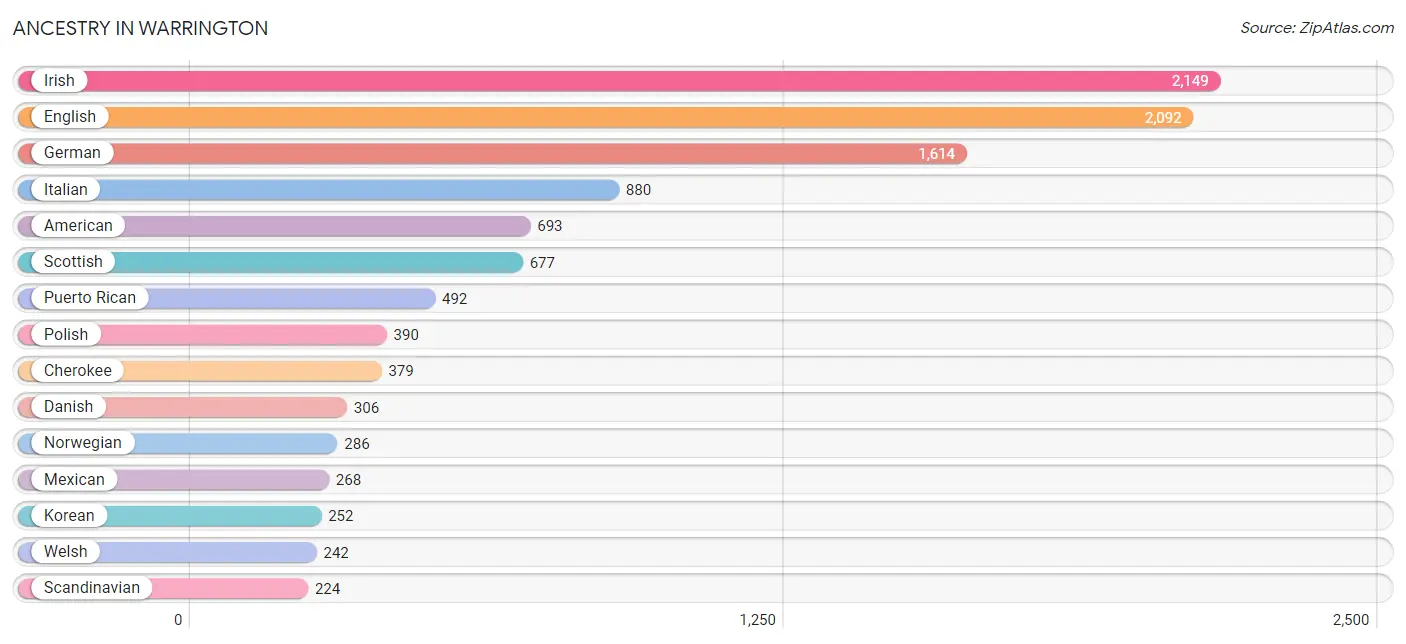
Ancestry in Warrington
The most populous ancestries reported in Warrington are Irish (2,149 | 13.0%), English (2,092 | 12.6%), German (1,614 | 9.7%), Italian (880 | 5.3%), and American (693 | 4.2%), together accounting for 44.8% of all Warrington residents.
| Ancestry | # Population | % Population |
| American | 693 | 4.2% |
| Arab | 18 | 0.1% |
| Argentinean | 12 | 0.1% |
| Austrian | 34 | 0.2% |
| Bahamian | 13 | 0.1% |
| Bhutanese | 74 | 0.4% |
| Blackfeet | 40 | 0.2% |
| British | 98 | 0.6% |
| Canadian | 8 | 0.1% |
| Central American | 16 | 0.1% |
| Cherokee | 379 | 2.3% |
| Choctaw | 11 | 0.1% |
| Creek | 82 | 0.5% |
| Cuban | 7 | 0.0% |
| Czechoslovakian | 17 | 0.1% |
| Danish | 306 | 1.8% |
| Dominican | 5 | 0.0% |
| Dutch | 82 | 0.5% |
| English | 2,092 | 12.6% |
| European | 38 | 0.2% |
| French | 217 | 1.3% |
| French American Indian | 19 | 0.1% |
| French Canadian | 22 | 0.1% |
| German | 1,614 | 9.7% |
| Greek | 138 | 0.8% |
| Guamanian / Chamorro | 46 | 0.3% |
| Guatemalan | 9 | 0.1% |
| Haitian | 16 | 0.1% |
| Hungarian | 25 | 0.2% |
| Indian (Asian) | 26 | 0.2% |
| Iranian | 10 | 0.1% |
| Irish | 2,149 | 13.0% |
| Italian | 880 | 5.3% |
| Korean | 252 | 1.5% |
| Lithuanian | 39 | 0.2% |
| Mexican | 268 | 1.6% |
| Moroccan | 7 | 0.0% |
| Native Hawaiian | 50 | 0.3% |
| Nigerian | 10 | 0.1% |
| Northern European | 23 | 0.1% |
| Norwegian | 286 | 1.7% |
| Panamanian | 7 | 0.0% |
| Polish | 390 | 2.4% |
| Portuguese | 70 | 0.4% |
| Puerto Rican | 492 | 3.0% |
| Russian | 36 | 0.2% |
| Scandinavian | 224 | 1.3% |
| Scotch-Irish | 186 | 1.1% |
| Scottish | 677 | 4.1% |
| Slavic | 10 | 0.1% |
| Slovak | 31 | 0.2% |
| South American | 12 | 0.1% |
| Spanish | 58 | 0.4% |
| Sri Lankan | 87 | 0.5% |
| Subsaharan African | 10 | 0.1% |
| Swedish | 77 | 0.5% |
| Swiss | 24 | 0.1% |
| Syrian | 11 | 0.1% |
| Thai | 12 | 0.1% |
| U.S. Virgin Islander | 12 | 0.1% |
| Welsh | 242 | 1.5% | View All 61 Rows |
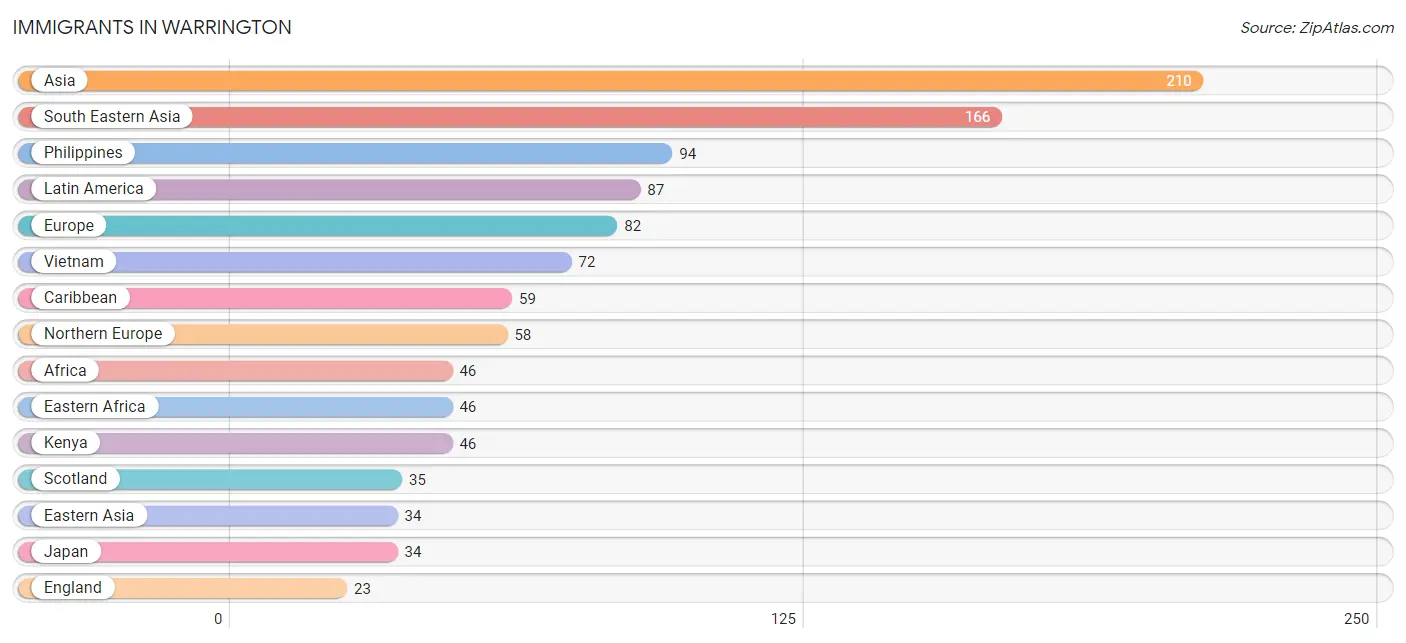
Immigrants in Warrington
The most numerous immigrant groups reported in Warrington came from Asia (210 | 1.3%), South Eastern Asia (166 | 1.0%), Philippines (94 | 0.6%), Latin America (87 | 0.5%), and Europe (82 | 0.5%), together accounting for 3.9% of all Warrington residents.
| Immigration Origin | # Population | % Population |
| Africa | 46 | 0.3% |
| Argentina | 12 | 0.1% |
| Asia | 210 | 1.3% |
| Bahamas | 13 | 0.1% |
| Caribbean | 59 | 0.4% |
| Central America | 16 | 0.1% |
| Eastern Africa | 46 | 0.3% |
| Eastern Asia | 34 | 0.2% |
| Eastern Europe | 14 | 0.1% |
| England | 23 | 0.1% |
| Europe | 82 | 0.5% |
| Germany | 10 | 0.1% |
| Guatemala | 9 | 0.1% |
| Haiti | 16 | 0.1% |
| Jamaica | 19 | 0.1% |
| Japan | 34 | 0.2% |
| Kenya | 46 | 0.3% |
| Latin America | 87 | 0.5% |
| Northern Europe | 58 | 0.4% |
| Panama | 7 | 0.0% |
| Philippines | 94 | 0.6% |
| Russia | 14 | 0.1% |
| Scotland | 35 | 0.2% |
| South America | 12 | 0.1% |
| South Eastern Asia | 166 | 1.0% |
| Vietnam | 72 | 0.4% |
| Western Asia | 10 | 0.1% |
| Western Europe | 10 | 0.1% | View All 28 Rows |
Sex and Age in Warrington
Sex and Age in Warrington
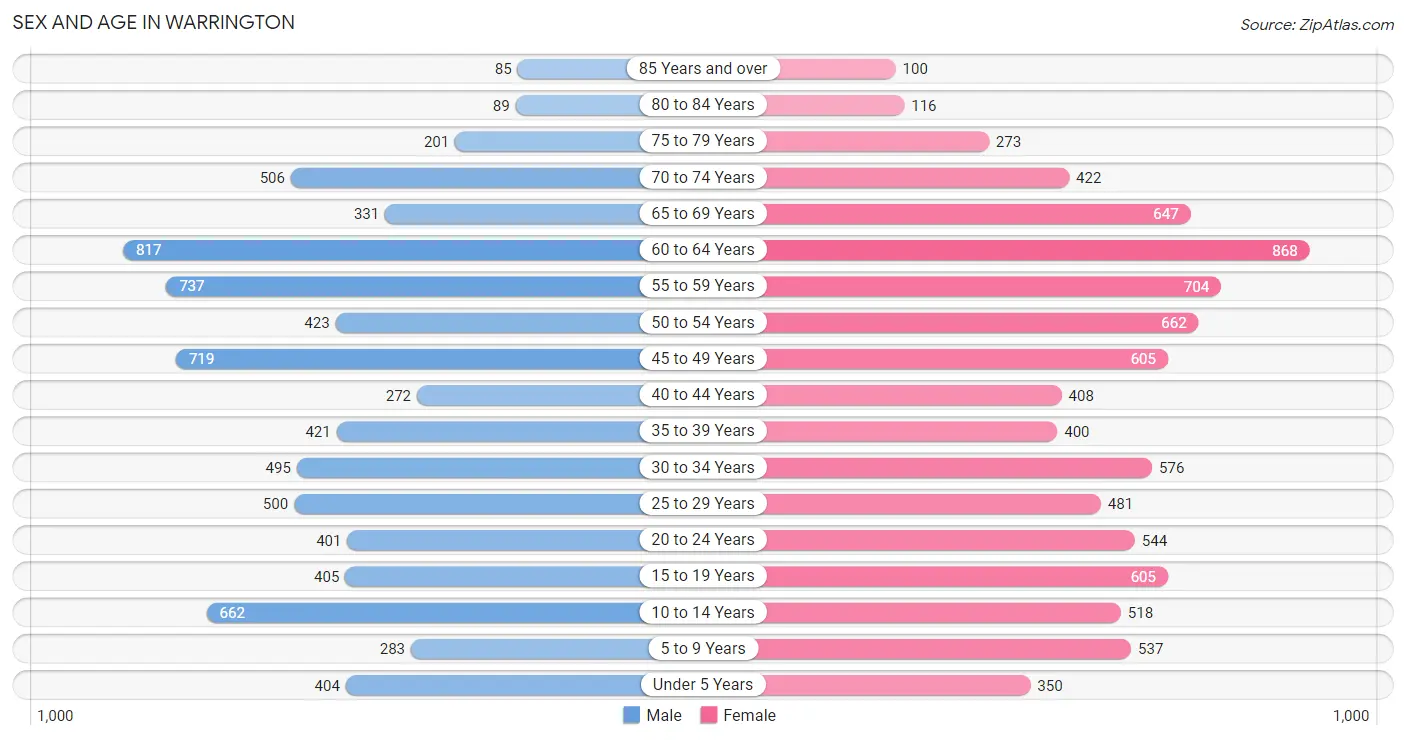
The most populous age groups in Warrington are 60 to 64 Years (817 | 10.5%) for men and 60 to 64 Years (868 | 9.9%) for women.
| Age Bracket | Male | Female |
| Under 5 Years | 404 (5.2%) | 350 (4.0%) |
| 5 to 9 Years | 283 (3.6%) | 537 (6.1%) |
| 10 to 14 Years | 662 (8.5%) | 518 (5.9%) |
| 15 to 19 Years | 405 (5.2%) | 605 (6.9%) |
| 20 to 24 Years | 401 (5.2%) | 544 (6.2%) |
| 25 to 29 Years | 500 (6.5%) | 481 (5.5%) |
| 30 to 34 Years | 495 (6.4%) | 576 (6.5%) |
| 35 to 39 Years | 421 (5.4%) | 400 (4.5%) |
| 40 to 44 Years | 272 (3.5%) | 408 (4.6%) |
| 45 to 49 Years | 719 (9.3%) | 605 (6.9%) |
| 50 to 54 Years | 423 (5.5%) | 662 (7.5%) |
| 55 to 59 Years | 737 (9.5%) | 704 (8.0%) |
| 60 to 64 Years | 817 (10.5%) | 868 (9.9%) |
| 65 to 69 Years | 331 (4.3%) | 647 (7.3%) |
| 70 to 74 Years | 506 (6.5%) | 422 (4.8%) |
| 75 to 79 Years | 201 (2.6%) | 273 (3.1%) |
| 80 to 84 Years | 89 (1.1%) | 116 (1.3%) |
| 85 Years and over | 85 (1.1%) | 100 (1.1%) |
| Total | 7,751 (100.0%) | 8,816 (100.0%) |
Families and Households in Warrington
Median Family Size in Warrington
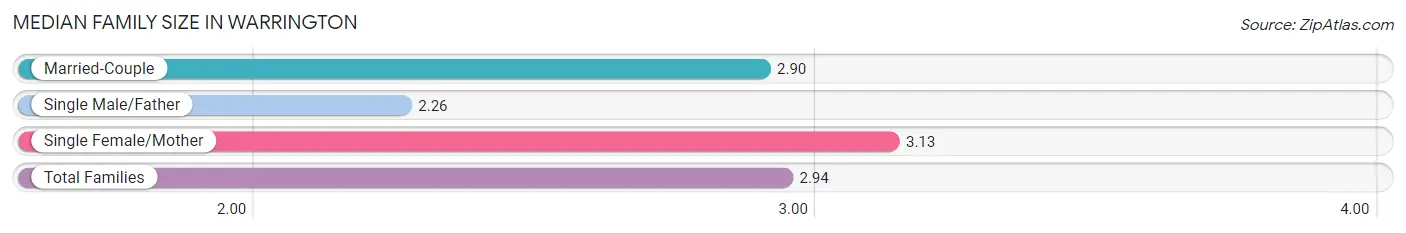
The median family size in Warrington is 2.94 persons per family, with single female/mother families (1,472 | 35.0%) accounting for the largest median family size of 3.13 persons per family. On the other hand, single male/father families (268 | 6.4%) represent the smallest median family size with 2.26 persons per family.
| Family Type | # Families | Family Size |
| Married-Couple | 2,463 (58.6%) | 2.90 |
| Single Male/Father | 268 (6.4%) | 2.26 |
| Single Female/Mother | 1,472 (35.0%) | 3.13 |
| Total Families | 4,203 (100.0%) | 2.94 |
Median Household Size in Warrington
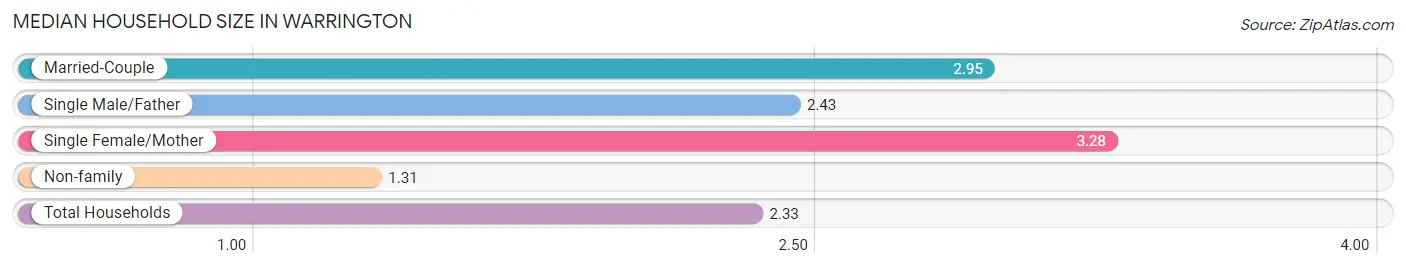
The median household size in Warrington is 2.33 persons per household, with single female/mother households (1,472 | 20.7%) accounting for the largest median household size of 3.28 persons per household. non-family households (2,907 | 40.9%) represent the smallest median household size with 1.31 persons per household.
| Household Type | # Households | Household Size |
| Married-Couple | 2,463 (34.6%) | 2.95 |
| Single Male/Father | 268 (3.8%) | 2.43 |
| Single Female/Mother | 1,472 (20.7%) | 3.28 |
| Non-family | 2,907 (40.9%) | 1.31 |
| Total Households | 7,110 (100.0%) | 2.33 |
Household Size by Marriage Status in Warrington
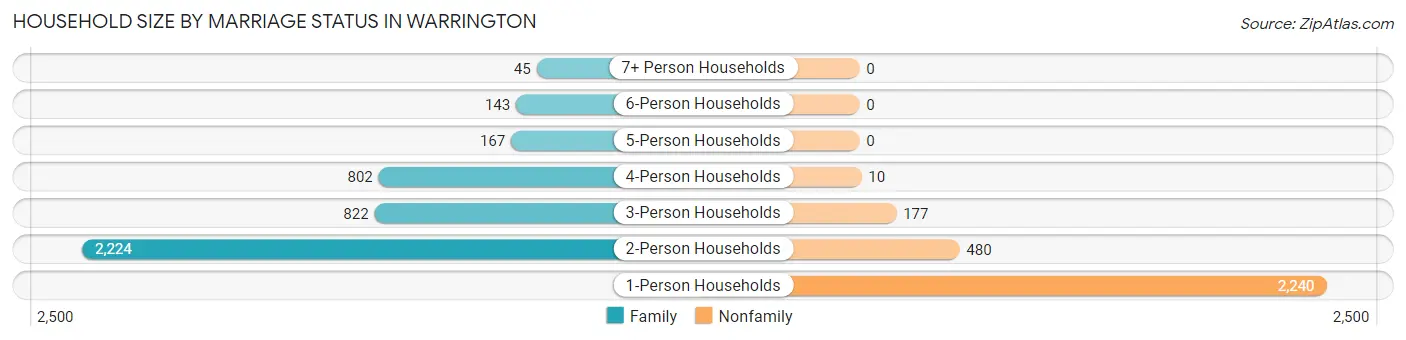
Out of a total of 7,110 households in Warrington, 4,203 (59.1%) are family households, while 2,907 (40.9%) are nonfamily households. The most numerous type of family households are 2-person households, comprising 2,224, and the most common type of nonfamily households are 1-person households, comprising 2,240.
| Household Size | Family Households | Nonfamily Households |
| 1-Person Households | - | 2,240 (31.5%) |
| 2-Person Households | 2,224 (31.3%) | 480 (6.8%) |
| 3-Person Households | 822 (11.6%) | 177 (2.5%) |
| 4-Person Households | 802 (11.3%) | 10 (0.1%) |
| 5-Person Households | 167 (2.4%) | 0 (0.0%) |
| 6-Person Households | 143 (2.0%) | 0 (0.0%) |
| 7+ Person Households | 45 (0.6%) | 0 (0.0%) |
| Total | 4,203 (59.1%) | 2,907 (40.9%) |
Female Fertility in Warrington
Fertility by Age in Warrington
Average fertility rate in Warrington is 23.0 births per 1,000 women. Women in the age bracket of 20 to 34 years have the highest fertility rate with 39.0 births per 1,000 women. Women in the age bracket of 20 to 34 years acount for 73.3% of all women with births.
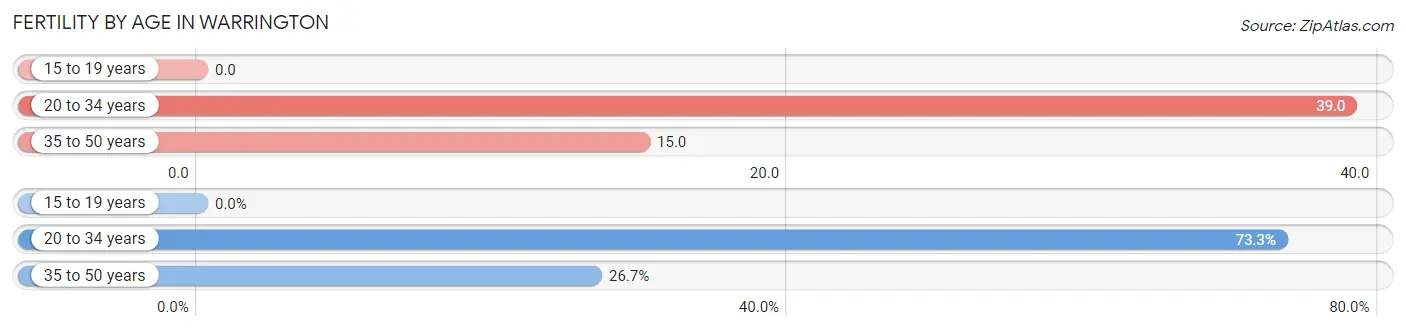
| Age Bracket | Women with Births | Births / 1,000 Women |
| 15 to 19 years | 0 (0.0%) | 0.0 |
| 20 to 34 years | 63 (73.3%) | 39.0 |
| 35 to 50 years | 23 (26.7%) | 15.0 |
| Total | 86 (100.0%) | 23.0 |
Fertility by Age by Marriage Status in Warrington
10.5% of women with births (86) in Warrington are married. The highest percentage of unmarried women with births falls into 35 to 50 years age bracket with 100.0% of them unmarried at the time of birth, while the lowest percentage of unmarried women with births belong to 20 to 34 years age bracket with 85.7% of them unmarried.
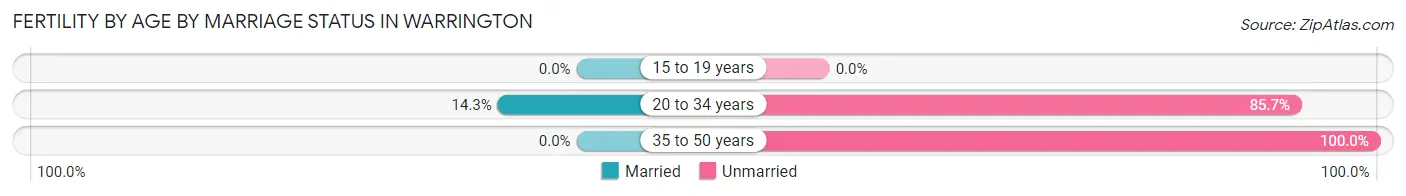
| Age Bracket | Married | Unmarried |
| 15 to 19 years | 0 (0.0%) | 0 (0.0%) |
| 20 to 34 years | 9 (14.3%) | 54 (85.7%) |
| 35 to 50 years | 0 (0.0%) | 23 (100.0%) |
| Total | 9 (10.5%) | 77 (89.5%) |
Fertility by Education in Warrington
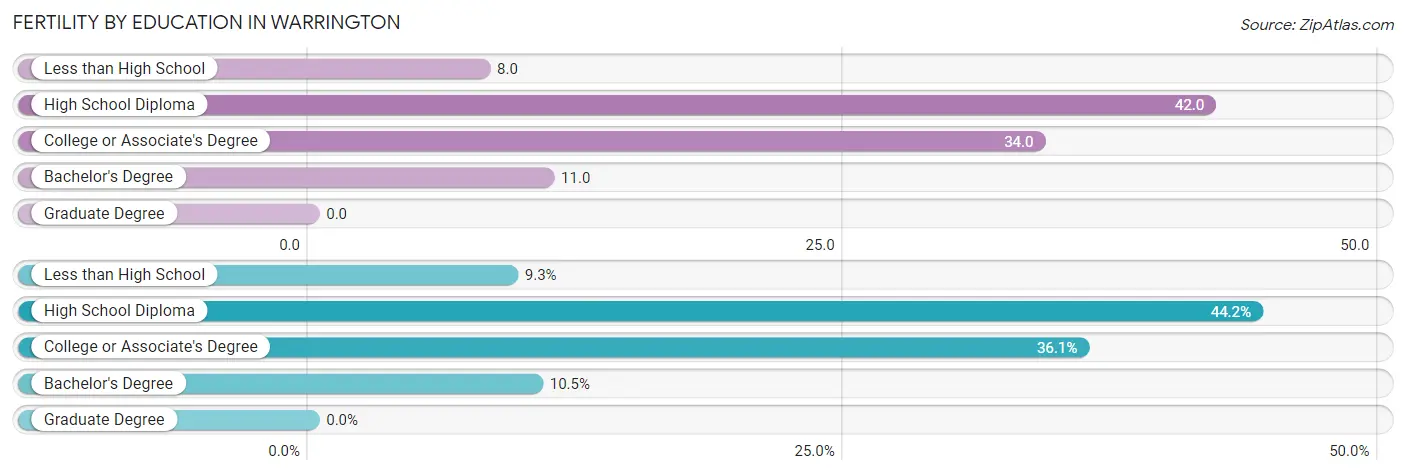
| Educational Attainment | Women with Births | Births / 1,000 Women |
| Less than High School | 8 (9.3%) | 8.0 |
| High School Diploma | 38 (44.2%) | 42.0 |
| College or Associate's Degree | 31 (36.0%) | 34.0 |
| Bachelor's Degree | 9 (10.5%) | 11.0 |
| Graduate Degree | 0 (0.0%) | 0.0 |
| Total | 86 (100.0%) | 23.0 |
Fertility by Education by Marriage Status in Warrington
89.5% of women with births in Warrington are unmarried. Women with the educational attainment of bachelor's degree are most likely to be married with 100.0% of them married at childbirth, while women with the educational attainment of less than high school are least likely to be married with 100.0% of them unmarried at childbirth.
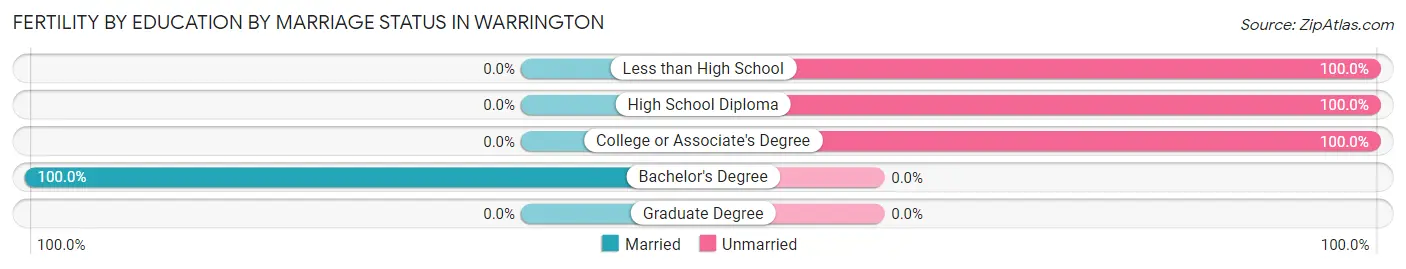
| Educational Attainment | Married | Unmarried |
| Less than High School | 0 (0.0%) | 8 (100.0%) |
| High School Diploma | 0 (0.0%) | 38 (100.0%) |
| College or Associate's Degree | 0 (0.0%) | 31 (100.0%) |
| Bachelor's Degree | 9 (100.0%) | 0 (0.0%) |
| Graduate Degree | 0 (0.0%) | 0 (0.0%) |
| Total | 9 (10.5%) | 77 (89.5%) |
Income in Warrington
Income Overview in Warrington
Per Capita Income in Warrington is $34,658, while median incomes of families and households are $56,055 and $51,016 respectively.
| Characteristic | Number | Measure |
| Per Capita Income | 16,567 | $34,658 |
| Median Family Income | 4,203 | $56,055 |
| Mean Family Income | 4,203 | $90,576 |
| Median Household Income | 7,110 | $51,016 |
| Mean Household Income | 7,110 | $80,106 |
| Income Deficit | 4,203 | $11,466 |
| Wage / Income Gap (%) | 16,567 | 29.54% |
| Wage / Income Gap ($) | 16,567 | 70.46¢ per $1 |
| Gini / Inequality Index | 16,567 | 0.51 |
Earnings by Sex in Warrington
Average Earnings in Warrington are $30,017, $34,073 for men and $24,007 for women, a difference of 29.5%.
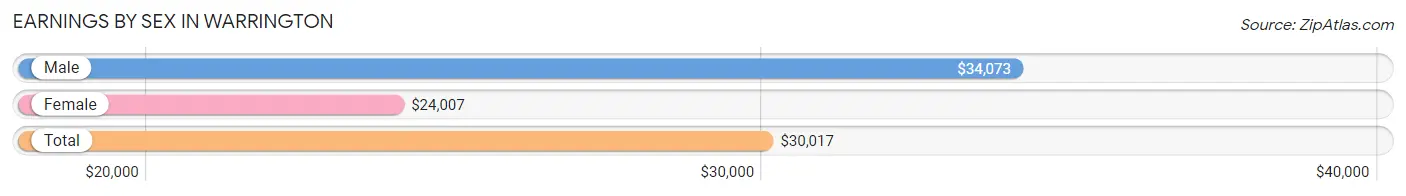
| Sex | Number | Average Earnings |
| Male | 4,556 (53.1%) | $34,073 |
| Female | 4,022 (46.9%) | $24,007 |
| Total | 8,578 (100.0%) | $30,017 |
Earnings by Sex by Income Bracket in Warrington
The most common earnings brackets in Warrington are $10,000 to $12,499 for men (480 | 10.5%) and $2,499 or less for women (393 | 9.8%).
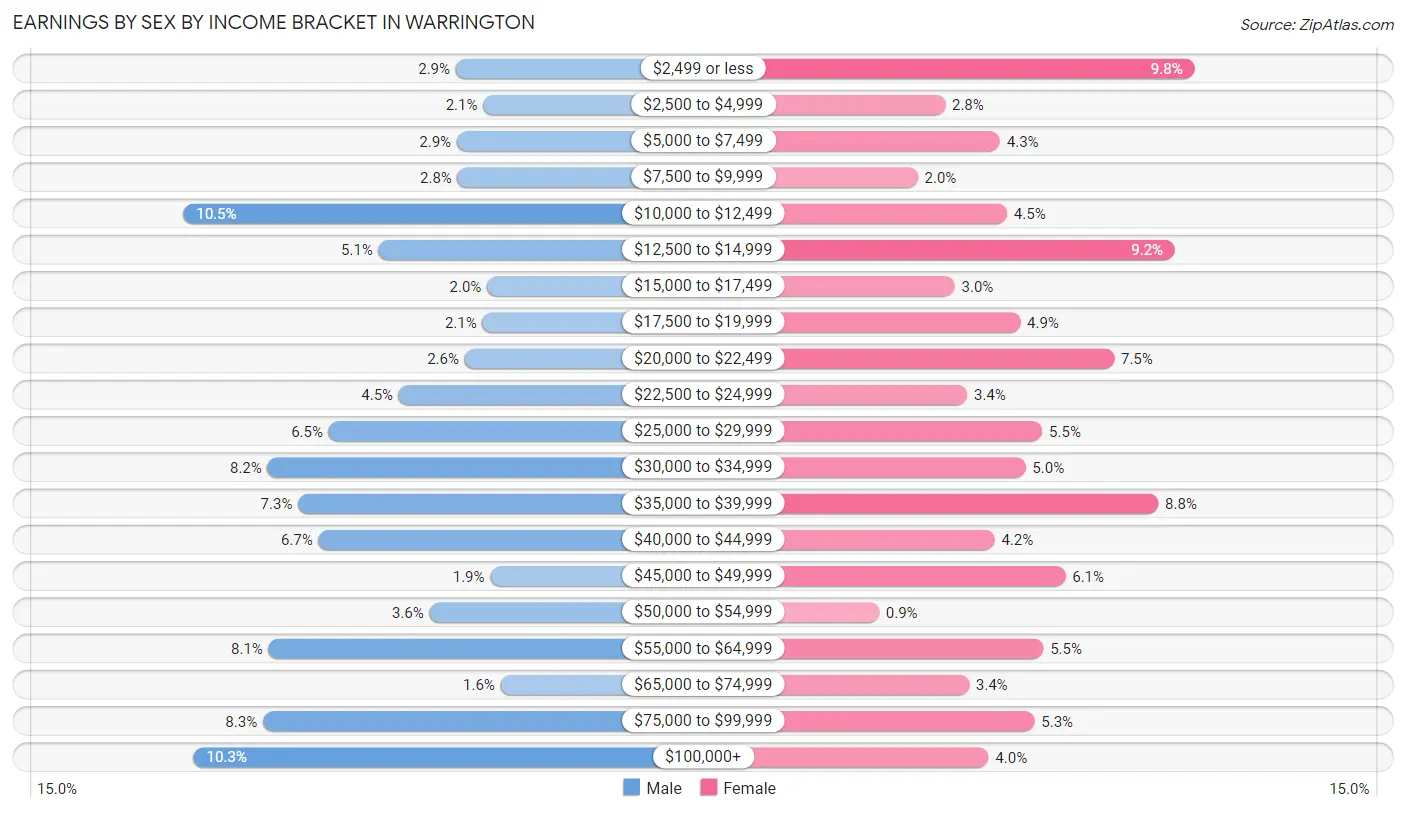
| Income | Male | Female |
| $2,499 or less | 131 (2.9%) | 393 (9.8%) |
| $2,500 to $4,999 | 96 (2.1%) | 111 (2.8%) |
| $5,000 to $7,499 | 130 (2.9%) | 173 (4.3%) |
| $7,500 to $9,999 | 129 (2.8%) | 80 (2.0%) |
| $10,000 to $12,499 | 480 (10.5%) | 181 (4.5%) |
| $12,500 to $14,999 | 230 (5.1%) | 371 (9.2%) |
| $15,000 to $17,499 | 91 (2.0%) | 122 (3.0%) |
| $17,500 to $19,999 | 97 (2.1%) | 196 (4.9%) |
| $20,000 to $22,499 | 120 (2.6%) | 302 (7.5%) |
| $22,500 to $24,999 | 204 (4.5%) | 136 (3.4%) |
| $25,000 to $29,999 | 294 (6.5%) | 221 (5.5%) |
| $30,000 to $34,999 | 372 (8.2%) | 202 (5.0%) |
| $35,000 to $39,999 | 333 (7.3%) | 352 (8.7%) |
| $40,000 to $44,999 | 307 (6.7%) | 167 (4.2%) |
| $45,000 to $49,999 | 87 (1.9%) | 247 (6.1%) |
| $50,000 to $54,999 | 165 (3.6%) | 36 (0.9%) |
| $55,000 to $64,999 | 371 (8.1%) | 222 (5.5%) |
| $65,000 to $74,999 | 74 (1.6%) | 138 (3.4%) |
| $75,000 to $99,999 | 378 (8.3%) | 212 (5.3%) |
| $100,000+ | 467 (10.2%) | 160 (4.0%) |
| Total | 4,556 (100.0%) | 4,022 (100.0%) |
Earnings by Sex by Educational Attainment in Warrington
Average earnings in Warrington are $35,593 for men and $28,264 for women, a difference of 20.6%. Men with an educational attainment of graduate degree enjoy the highest average annual earnings of $153,828, while those with high school diploma education earn the least with $27,443. Women with an educational attainment of bachelor's degree earn the most with the average annual earnings of $46,159, while those with high school diploma education have the smallest earnings of $14,928.
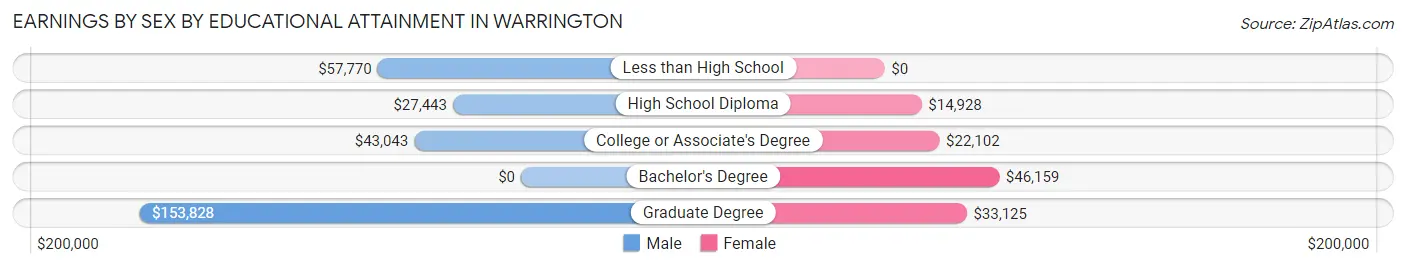
| Educational Attainment | Male Income | Female Income |
| Less than High School | $57,770 | $0 |
| High School Diploma | $27,443 | $14,928 |
| College or Associate's Degree | $43,043 | $22,102 |
| Bachelor's Degree | - | - |
| Graduate Degree | $153,828 | $33,125 |
| Total | $35,593 | $28,264 |
Family Income in Warrington
Family Income Brackets in Warrington
According to the Warrington family income data, there are 643 families falling into the $35,000 to $49,999 income range, which is the most common income bracket and makes up 15.3% of all families. Conversely, the $10,000 to $14,999 income bracket is the least frequent group with only 240 families (5.7%) belonging to this category.
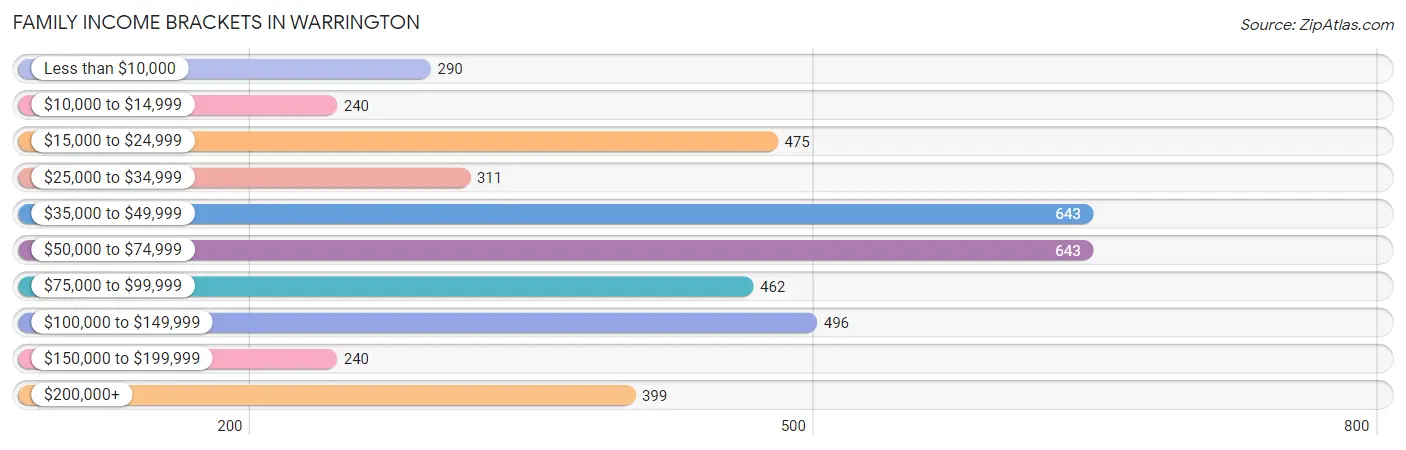
| Income Bracket | # Families | % Families |
| Less than $10,000 | 290 | 6.9% |
| $10,000 to $14,999 | 240 | 5.7% |
| $15,000 to $24,999 | 475 | 11.3% |
| $25,000 to $34,999 | 311 | 7.4% |
| $35,000 to $49,999 | 643 | 15.3% |
| $50,000 to $74,999 | 643 | 15.3% |
| $75,000 to $99,999 | 462 | 11.0% |
| $100,000 to $149,999 | 496 | 11.8% |
| $150,000 to $199,999 | 240 | 5.7% |
| $200,000+ | 399 | 9.5% |
Family Income by Famaliy Size in Warrington
5-person families (145 | 3.5%) account for the highest median family income in Warrington with $73,657 per family, while 2-person families (2,320 | 55.2%) have the highest median income of $28,798 per family member.
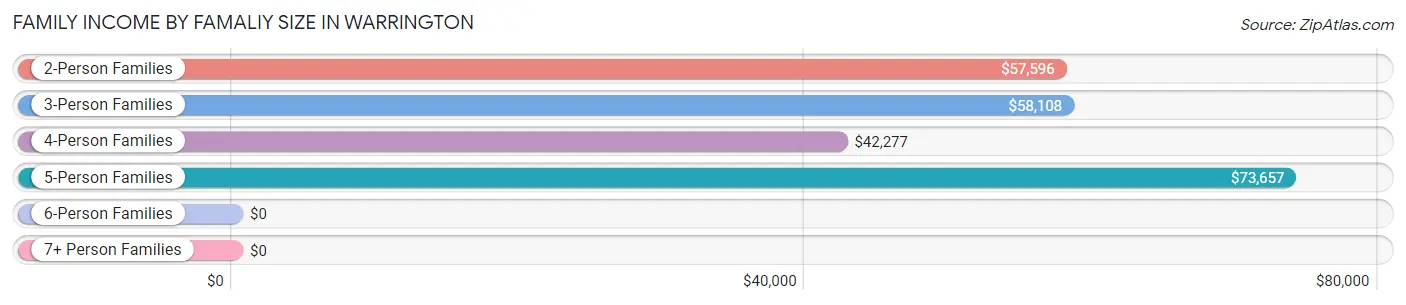
| Income Bracket | # Families | Median Income |
| 2-Person Families | 2,320 (55.2%) | $57,596 |
| 3-Person Families | 968 (23.0%) | $58,108 |
| 4-Person Families | 609 (14.5%) | $42,277 |
| 5-Person Families | 145 (3.5%) | $73,657 |
| 6-Person Families | 119 (2.8%) | $0 |
| 7+ Person Families | 42 (1.0%) | $0 |
| Total | 4,203 (100.0%) | $56,055 |
Family Income by Number of Earners in Warrington
The median family income in Warrington is $56,055, with families comprising 3+ earners (274) having the highest median family income of $126,080, while families with no earners (789) have the lowest median family income of $24,952, accounting for 6.5% and 18.8% of families, respectively.
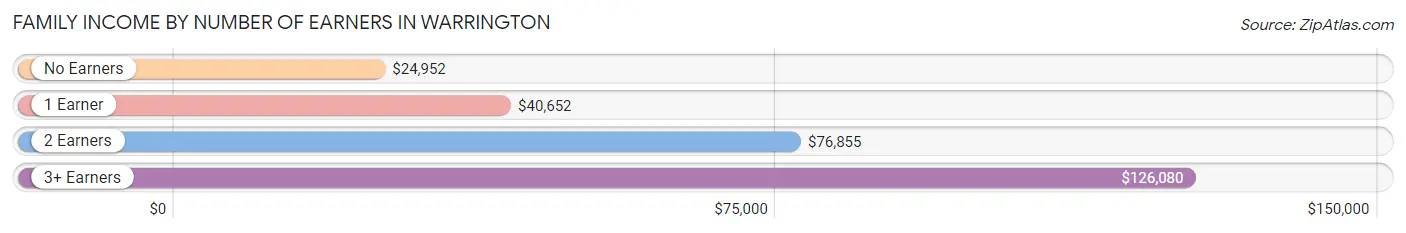
| Number of Earners | # Families | Median Income |
| No Earners | 789 (18.8%) | $24,952 |
| 1 Earner | 1,721 (40.9%) | $40,652 |
| 2 Earners | 1,419 (33.8%) | $76,855 |
| 3+ Earners | 274 (6.5%) | $126,080 |
| Total | 4,203 (100.0%) | $56,055 |
Household Income in Warrington
Household Income Brackets in Warrington
With 1,322 households falling in the category, the $35,000 to $49,999 income range is the most frequent in Warrington, accounting for 18.6% of all households. In contrast, only 327 households (4.6%) fall into the $150,000 to $199,999 income bracket, making it the least populous group.
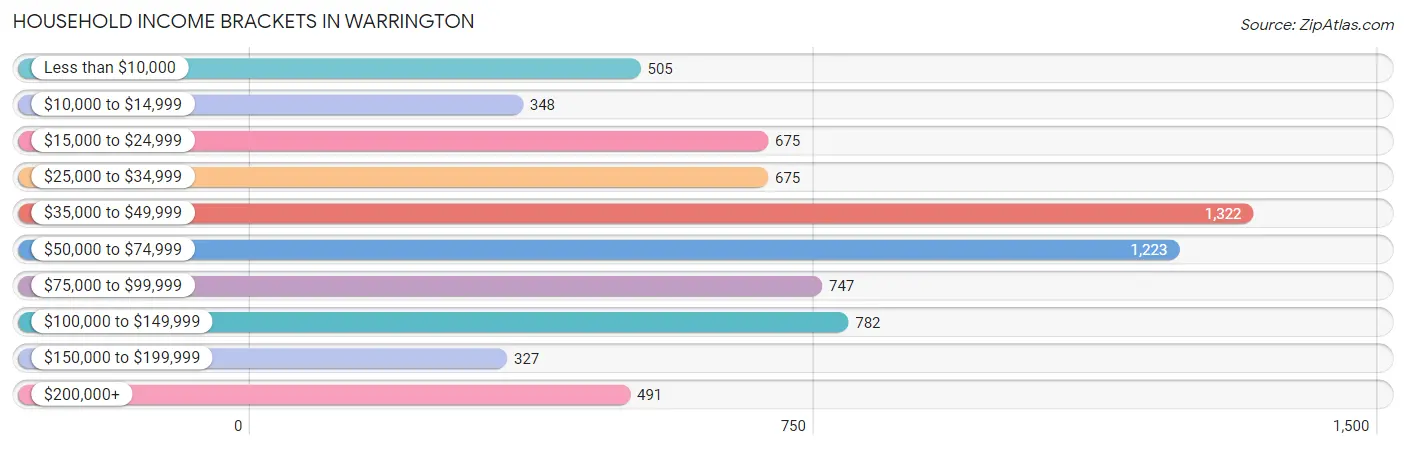
| Income Bracket | # Households | % Households |
| Less than $10,000 | 505 | 7.1% |
| $10,000 to $14,999 | 348 | 4.9% |
| $15,000 to $24,999 | 675 | 9.5% |
| $25,000 to $34,999 | 675 | 9.5% |
| $35,000 to $49,999 | 1,322 | 18.6% |
| $50,000 to $74,999 | 1,223 | 17.2% |
| $75,000 to $99,999 | 747 | 10.5% |
| $100,000 to $149,999 | 782 | 11.0% |
| $150,000 to $199,999 | 327 | 4.6% |
| $200,000+ | 491 | 6.9% |
Household Income by Householder Age in Warrington
The median household income in Warrington is $51,016, with the highest median household income of $55,469 found in the 65+ years age bracket for the primary householder. A total of 1,794 households (25.2%) fall into this category. Meanwhile, the 15 to 24 years age bracket for the primary householder has the lowest median household income of $36,282, with 214 households (3.0%) in this group.
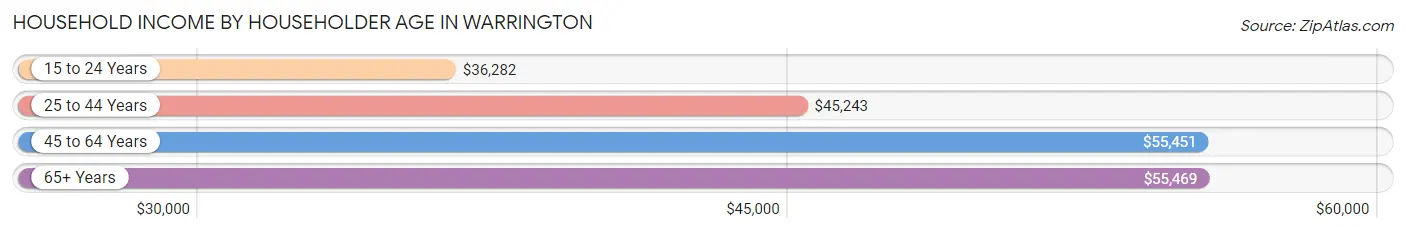
| Income Bracket | # Households | Median Income |
| 15 to 24 Years | 214 (3.0%) | $36,282 |
| 25 to 44 Years | 1,872 (26.3%) | $45,243 |
| 45 to 64 Years | 3,230 (45.4%) | $55,451 |
| 65+ Years | 1,794 (25.2%) | $55,469 |
| Total | 7,110 (100.0%) | $51,016 |
Poverty in Warrington
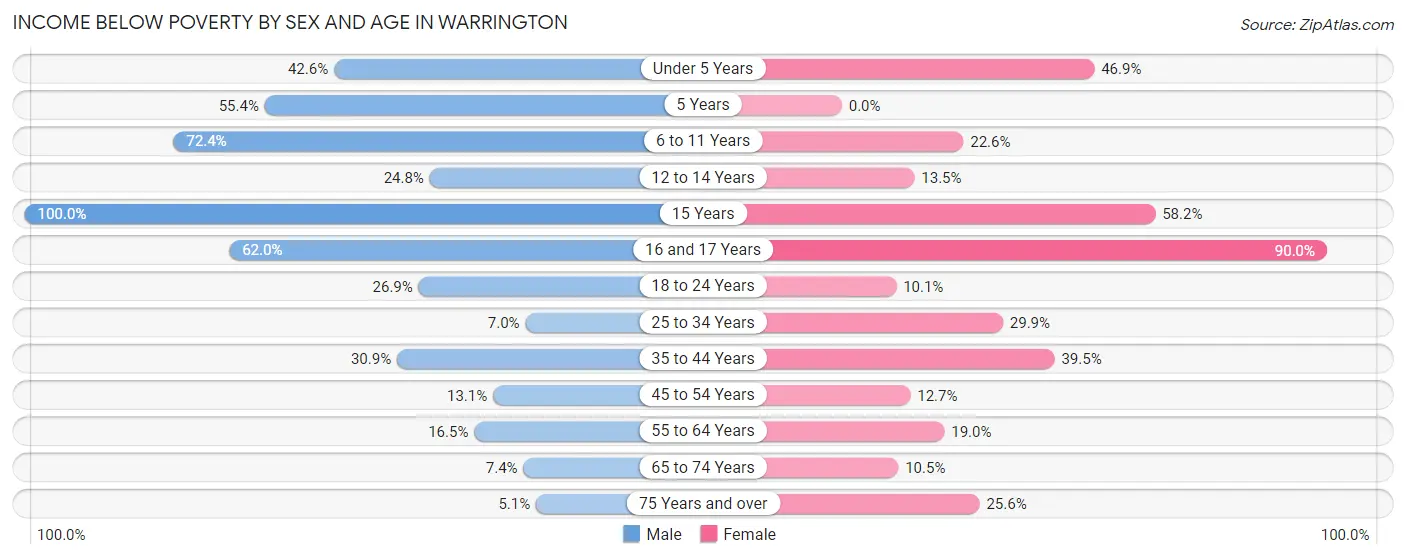
Income Below Poverty by Sex and Age in Warrington
With 22.4% poverty level for males and 24.2% for females among the residents of Warrington, 15 year old males and 16 and 17 year old females are the most vulnerable to poverty, with 152 males (100.0%) and 271 females (90.0%) in their respective age groups living below the poverty level.
| Age Bracket | Male | Female |
| Under 5 Years | 172 (42.6%) | 164 (46.9%) |
| 5 Years | 51 (55.4%) | 0 (0.0%) |
| 6 to 11 Years | 241 (72.4%) | 132 (22.6%) |
| 12 to 14 Years | 129 (24.8%) | 54 (13.5%) |
| 15 Years | 152 (100.0%) | 96 (58.2%) |
| 16 and 17 Years | 80 (62.0%) | 271 (90.0%) |
| 18 to 24 Years | 141 (26.9%) | 69 (10.1%) |
| 25 to 34 Years | 70 (7.0%) | 316 (29.9%) |
| 35 to 44 Years | 214 (30.9%) | 319 (39.5%) |
| 45 to 54 Years | 149 (13.1%) | 161 (12.7%) |
| 55 to 64 Years | 257 (16.5%) | 299 (19.0%) |
| 65 to 74 Years | 62 (7.4%) | 112 (10.5%) |
| 75 Years and over | 19 (5.1%) | 125 (25.6%) |
| Total | 1,737 (22.4%) | 2,118 (24.2%) |
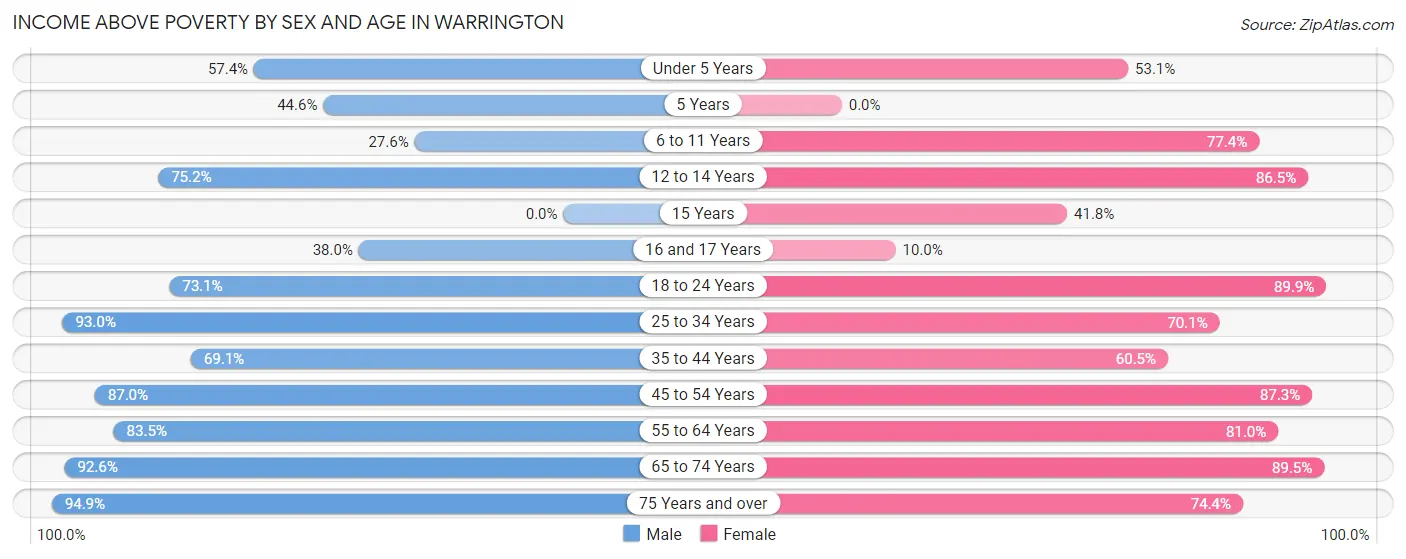
Income Above Poverty by Sex and Age in Warrington
According to the poverty statistics in Warrington, males aged 75 years and over and females aged 18 to 24 years are the age groups that are most secure financially, with 94.9% of males and 89.9% of females in these age groups living above the poverty line.
| Age Bracket | Male | Female |
| Under 5 Years | 232 (57.4%) | 186 (53.1%) |
| 5 Years | 41 (44.6%) | 0 (0.0%) |
| 6 to 11 Years | 92 (27.6%) | 453 (77.4%) |
| 12 to 14 Years | 391 (75.2%) | 347 (86.5%) |
| 15 Years | 0 (0.0%) | 69 (41.8%) |
| 16 and 17 Years | 49 (38.0%) | 30 (10.0%) |
| 18 to 24 Years | 384 (73.1%) | 614 (89.9%) |
| 25 to 34 Years | 925 (93.0%) | 741 (70.1%) |
| 35 to 44 Years | 479 (69.1%) | 489 (60.5%) |
| 45 to 54 Years | 993 (87.0%) | 1,106 (87.3%) |
| 55 to 64 Years | 1,297 (83.5%) | 1,273 (81.0%) |
| 65 to 74 Years | 775 (92.6%) | 957 (89.5%) |
| 75 Years and over | 356 (94.9%) | 364 (74.4%) |
| Total | 6,014 (77.6%) | 6,629 (75.8%) |
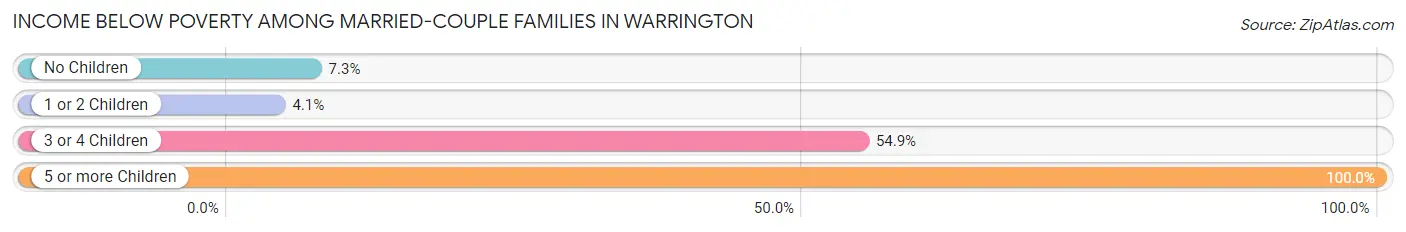
Income Below Poverty Among Married-Couple Families in Warrington
The poverty statistics for married-couple families in Warrington show that 9.7% or 239 of the total 2,463 families live below the poverty line. Families with 5 or more children have the highest poverty rate of 100.0%, comprising of 19 families. On the other hand, families with 1 or 2 children have the lowest poverty rate of 4.1%, which includes 21 families.
| Children | Above Poverty | Below Poverty |
| No Children | 1,681 (92.7%) | 132 (7.3%) |
| 1 or 2 Children | 488 (95.9%) | 21 (4.1%) |
| 3 or 4 Children | 55 (45.1%) | 67 (54.9%) |
| 5 or more Children | 0 (0.0%) | 19 (100.0%) |
| Total | 2,224 (90.3%) | 239 (9.7%) |
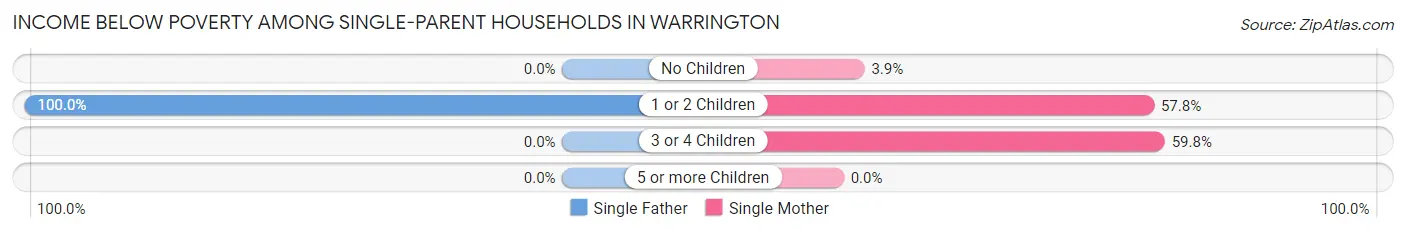
Income Below Poverty Among Single-Parent Households in Warrington
According to the poverty data in Warrington, 25.4% or 68 single-father households and 38.0% or 560 single-mother households are living below the poverty line. Among single-father households, those with 1 or 2 children have the highest poverty rate, with 68 households (100.0%) experiencing poverty. Likewise, among single-mother households, those with 3 or 4 children have the highest poverty rate, with 61 households (59.8%) falling below the poverty line.
| Children | Single Father | Single Mother |
| No Children | 0 (0.0%) | 21 (3.9%) |
| 1 or 2 Children | 68 (100.0%) | 478 (57.8%) |
| 3 or 4 Children | 0 (0.0%) | 61 (59.8%) |
| 5 or more Children | 0 (0.0%) | 0 (0.0%) |
| Total | 68 (25.4%) | 560 (38.0%) |
Income Below Poverty Among Married-Couple vs Single-Parent Households in Warrington
The poverty data for Warrington shows that 239 of the married-couple family households (9.7%) and 628 of the single-parent households (36.1%) are living below the poverty level. Within the married-couple family households, those with 5 or more children have the highest poverty rate, with 19 households (100.0%) falling below the poverty line. Among the single-parent households, those with 1 or 2 children have the highest poverty rate, with 546 household (61.0%) living below poverty.
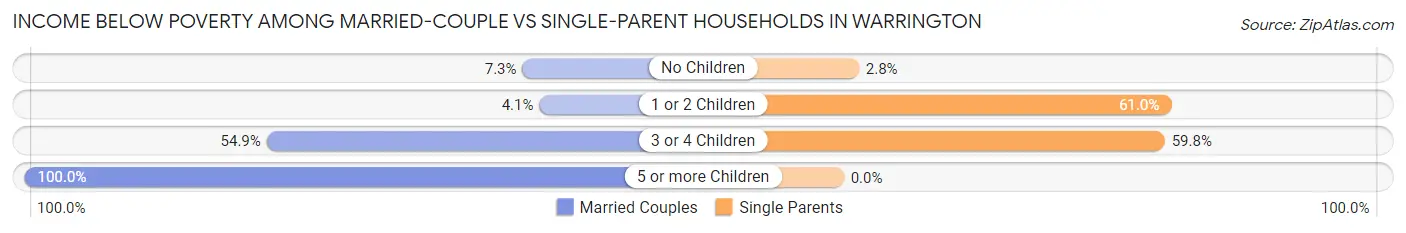
| Children | Married-Couple Families | Single-Parent Households |
| No Children | 132 (7.3%) | 21 (2.8%) |
| 1 or 2 Children | 21 (4.1%) | 546 (61.0%) |
| 3 or 4 Children | 67 (54.9%) | 61 (59.8%) |
| 5 or more Children | 19 (100.0%) | 0 (0.0%) |
| Total | 239 (9.7%) | 628 (36.1%) |
Employment Characteristics in Warrington
Employment by Class of Employer in Warrington
Among the 7,461 employed individuals in Warrington, private company employees (4,554 | 61.0%), not-for-profit organizations (820 | 11.0%), and federal government employees (683 | 9.1%) make up the most common classes of employment.
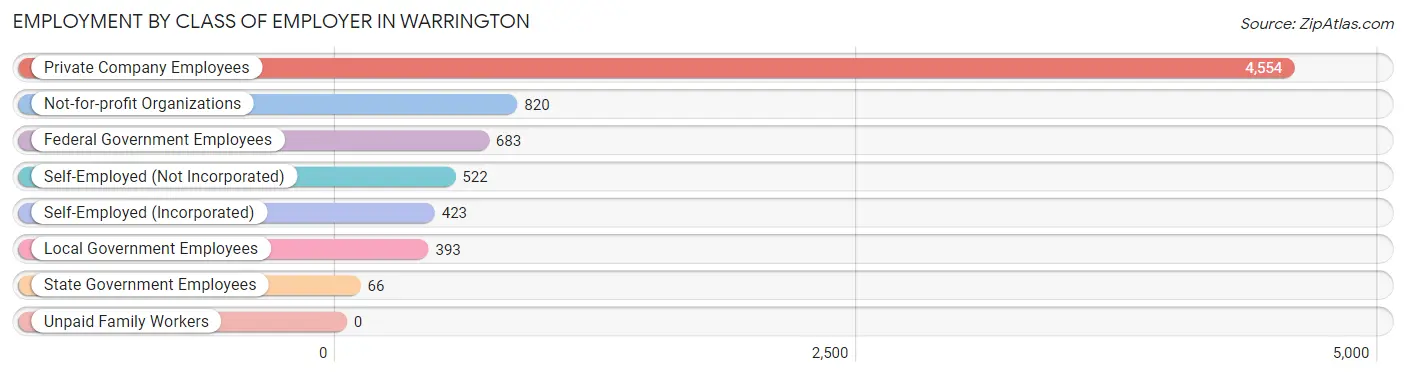
| Employer Class | # Employees | % Employees |
| Private Company Employees | 4,554 | 61.0% |
| Self-Employed (Incorporated) | 423 | 5.7% |
| Self-Employed (Not Incorporated) | 522 | 7.0% |
| Not-for-profit Organizations | 820 | 11.0% |
| Local Government Employees | 393 | 5.3% |
| State Government Employees | 66 | 0.9% |
| Federal Government Employees | 683 | 9.1% |
| Unpaid Family Workers | 0 | 0.0% |
| Total | 7,461 | 100.0% |
Employment Status by Age in Warrington
According to the labor force statistics for Warrington, out of the total population over 16 years of age (13,496), 60.8% or 8,206 individuals are in the labor force, with 7.7% or 632 of them unemployed. The age group with the highest labor force participation rate is 25 to 29 years, with 87.2% or 855 individuals in the labor force. Within the labor force, the 20 to 24 years age range has the highest percentage of unemployed individuals, with 21.7% or 164 of them being unemployed.
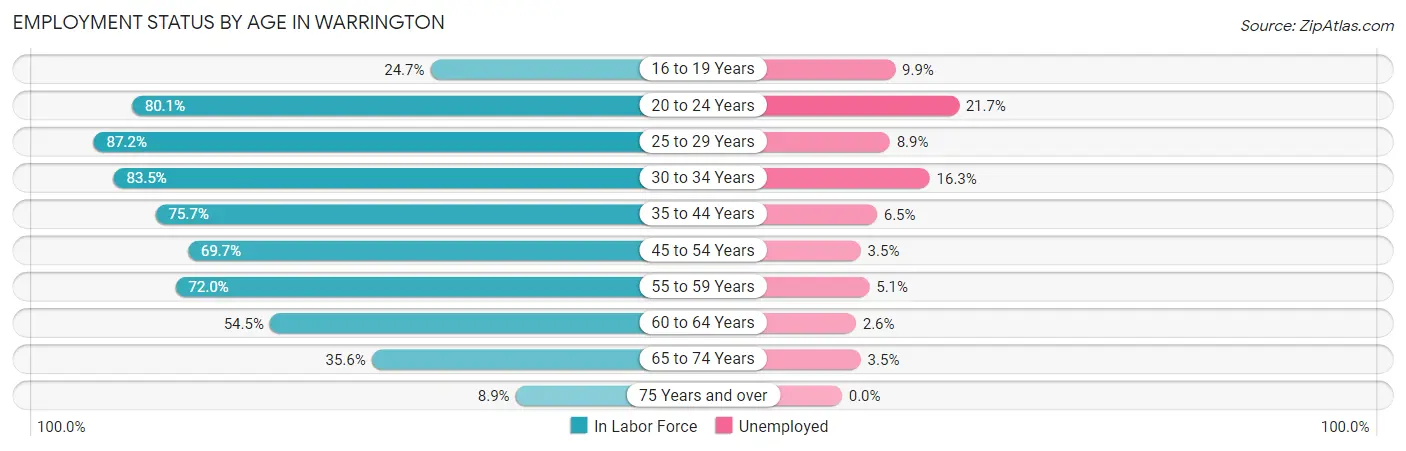
| Age Bracket | In Labor Force | Unemployed |
| 16 to 19 Years | 171 (24.7%) | 17 (9.9%) |
| 20 to 24 Years | 757 (80.1%) | 164 (21.7%) |
| 25 to 29 Years | 855 (87.2%) | 76 (8.9%) |
| 30 to 34 Years | 894 (83.5%) | 146 (16.3%) |
| 35 to 44 Years | 1,136 (75.7%) | 74 (6.5%) |
| 45 to 54 Years | 1,679 (69.7%) | 59 (3.5%) |
| 55 to 59 Years | 1,038 (72.0%) | 53 (5.1%) |
| 60 to 64 Years | 918 (54.5%) | 24 (2.6%) |
| 65 to 74 Years | 679 (35.6%) | 24 (3.5%) |
| 75 Years and over | 77 (8.9%) | 0 (0.0%) |
| Total | 8,206 (60.8%) | 632 (7.7%) |
Employment Status by Educational Attainment in Warrington
According to labor force statistics for Warrington, 71.7% of individuals (6,516) out of the total population between 25 and 64 years of age (9,088) are in the labor force, with 6.5% or 424 of them being unemployed. The group with the highest labor force participation rate are those with the educational attainment of bachelor's degree or higher, with 85.5% or 1,651 individuals in the labor force. Within the labor force, individuals with less than high school education have the highest percentage of unemployment, with 16.9% or 96 of them being unemployed.
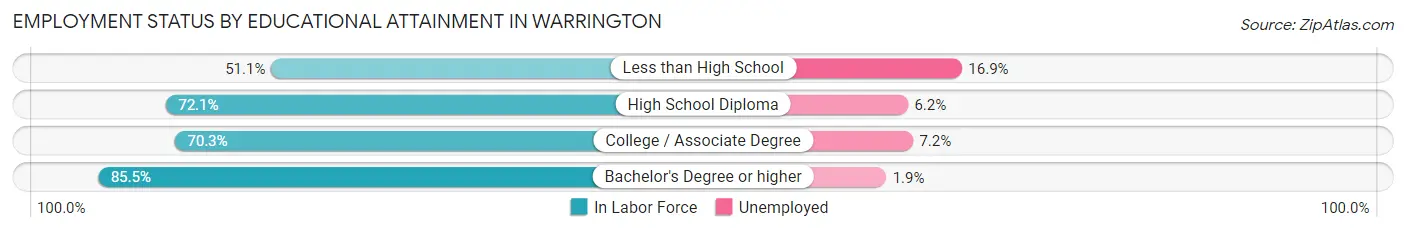
| Educational Attainment | In Labor Force | Unemployed |
| Less than High School | 567 (51.1%) | 188 (16.9%) |
| High School Diploma | 2,038 (72.1%) | 175 (6.2%) |
| College / Associate Degree | 2,264 (70.3%) | 232 (7.2%) |
| Bachelor's Degree or higher | 1,651 (85.5%) | 37 (1.9%) |
| Total | 6,516 (71.7%) | 591 (6.5%) |
Employment Occupations by Sex in Warrington
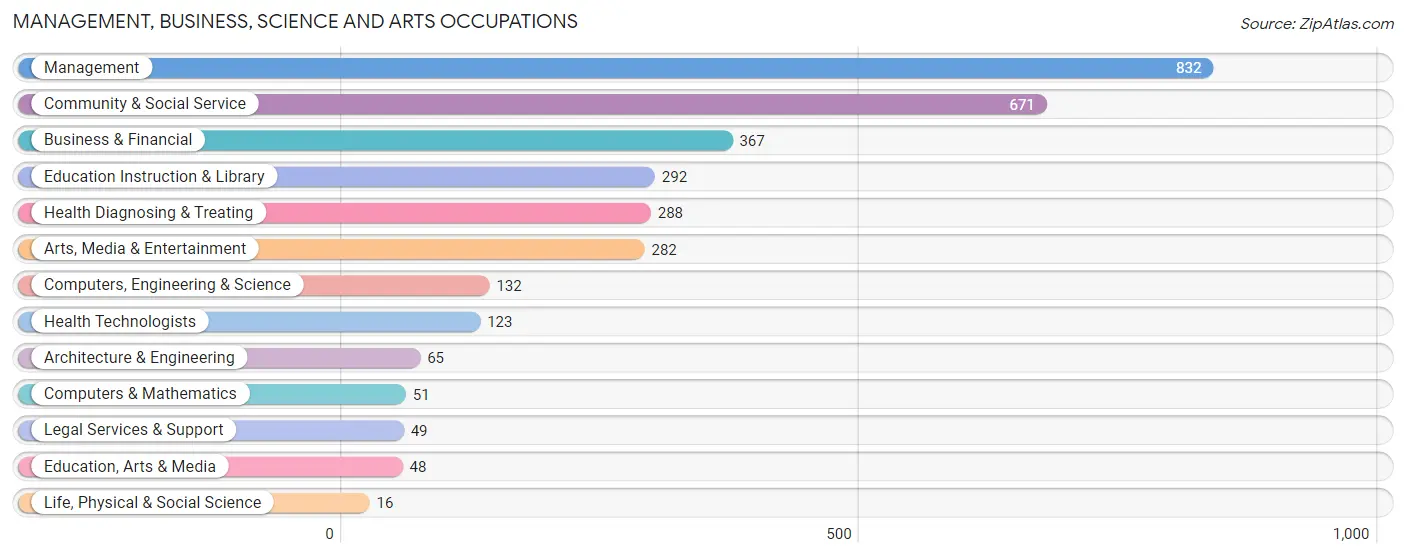
Management, Business, Science and Arts Occupations
The most common Management, Business, Science and Arts occupations in Warrington are Management (832 | 11.3%), Community & Social Service (671 | 9.1%), Business & Financial (367 | 5.0%), Education Instruction & Library (292 | 4.0%), and Health Diagnosing & Treating (288 | 3.9%).
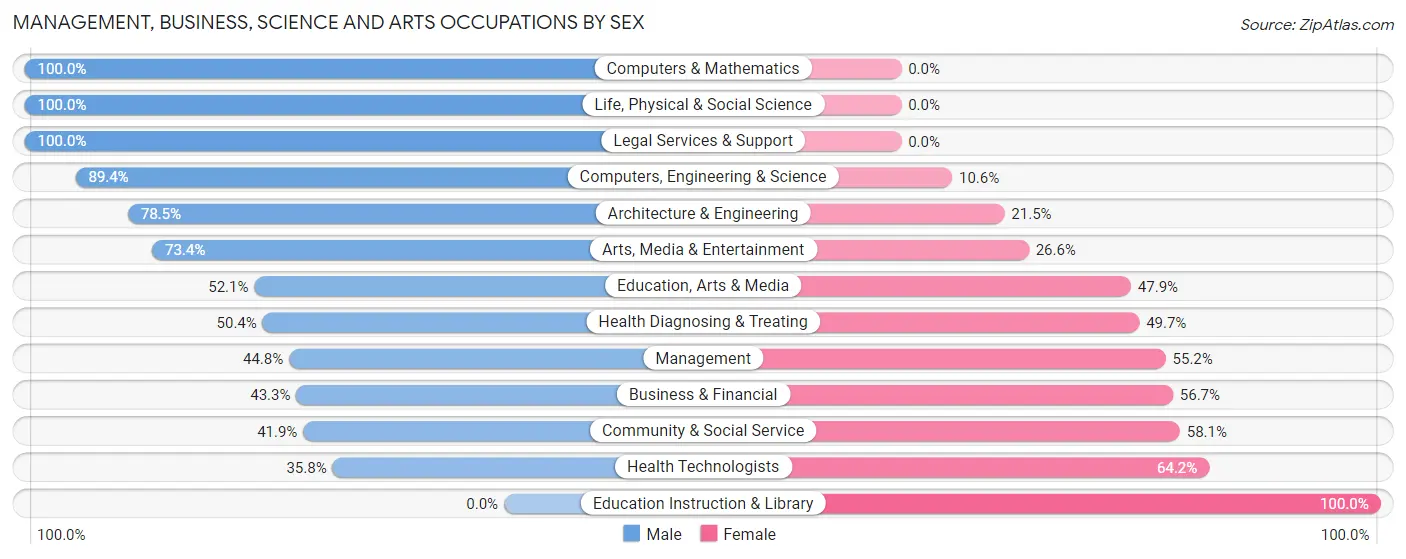
Management, Business, Science and Arts Occupations by Sex
Within the Management, Business, Science and Arts occupations in Warrington, the most male-oriented occupations are Computers & Mathematics (100.0%), Life, Physical & Social Science (100.0%), and Legal Services & Support (100.0%), while the most female-oriented occupations are Education Instruction & Library (100.0%), Health Technologists (64.2%), and Community & Social Service (58.1%).
| Occupation | Male | Female |
| Management | 373 (44.8%) | 459 (55.2%) |
| Business & Financial | 159 (43.3%) | 208 (56.7%) |
| Computers, Engineering & Science | 118 (89.4%) | 14 (10.6%) |
| Computers & Mathematics | 51 (100.0%) | 0 (0.0%) |
| Architecture & Engineering | 51 (78.5%) | 14 (21.5%) |
| Life, Physical & Social Science | 16 (100.0%) | 0 (0.0%) |
| Community & Social Service | 281 (41.9%) | 390 (58.1%) |
| Education, Arts & Media | 25 (52.1%) | 23 (47.9%) |
| Legal Services & Support | 49 (100.0%) | 0 (0.0%) |
| Education Instruction & Library | 0 (0.0%) | 292 (100.0%) |
| Arts, Media & Entertainment | 207 (73.4%) | 75 (26.6%) |
| Health Diagnosing & Treating | 145 (50.3%) | 143 (49.6%) |
| Health Technologists | 44 (35.8%) | 79 (64.2%) |
| Total (Category) | 1,076 (47.0%) | 1,214 (53.0%) |
| Total (Overall) | 4,055 (55.1%) | 3,308 (44.9%) |
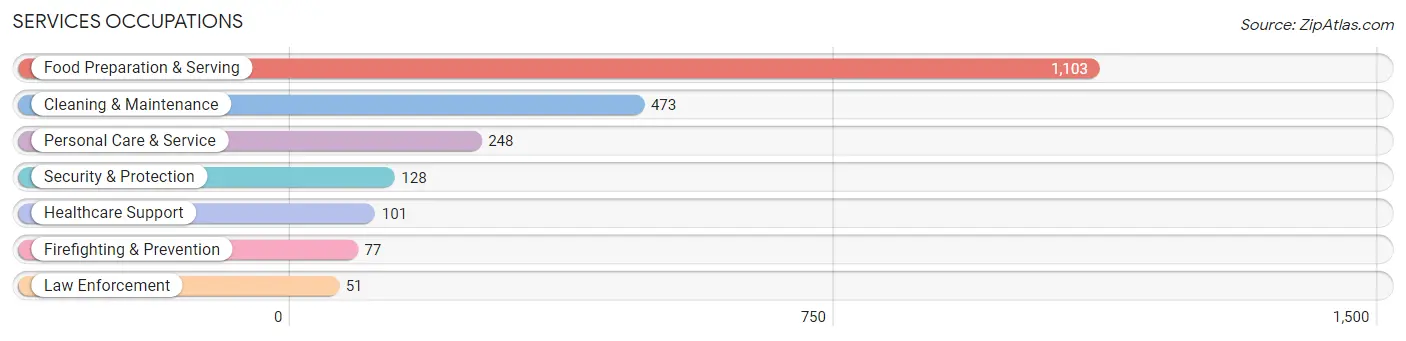
Services Occupations
The most common Services occupations in Warrington are Food Preparation & Serving (1,103 | 15.0%), Cleaning & Maintenance (473 | 6.4%), Personal Care & Service (248 | 3.4%), Security & Protection (128 | 1.7%), and Healthcare Support (101 | 1.4%).
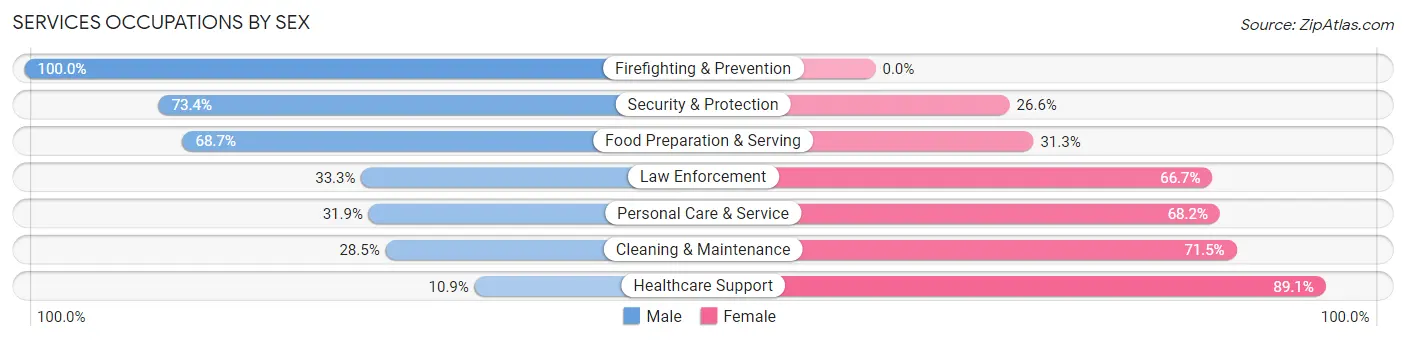
Services Occupations by Sex
Within the Services occupations in Warrington, the most male-oriented occupations are Firefighting & Prevention (100.0%), Security & Protection (73.4%), and Food Preparation & Serving (68.7%), while the most female-oriented occupations are Healthcare Support (89.1%), Cleaning & Maintenance (71.5%), and Personal Care & Service (68.1%).
| Occupation | Male | Female |
| Healthcare Support | 11 (10.9%) | 90 (89.1%) |
| Security & Protection | 94 (73.4%) | 34 (26.6%) |
| Firefighting & Prevention | 77 (100.0%) | 0 (0.0%) |
| Law Enforcement | 17 (33.3%) | 34 (66.7%) |
| Food Preparation & Serving | 758 (68.7%) | 345 (31.3%) |
| Cleaning & Maintenance | 135 (28.5%) | 338 (71.5%) |
| Personal Care & Service | 79 (31.9%) | 169 (68.1%) |
| Total (Category) | 1,077 (52.5%) | 976 (47.5%) |
| Total (Overall) | 4,055 (55.1%) | 3,308 (44.9%) |
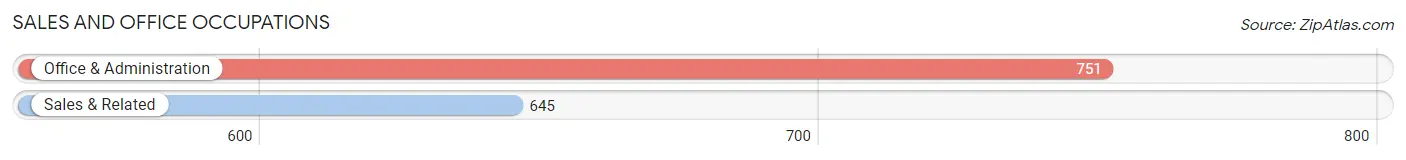
Sales and Office Occupations
The most common Sales and Office occupations in Warrington are Office & Administration (751 | 10.2%), and Sales & Related (645 | 8.8%).
Sales and Office Occupations by Sex
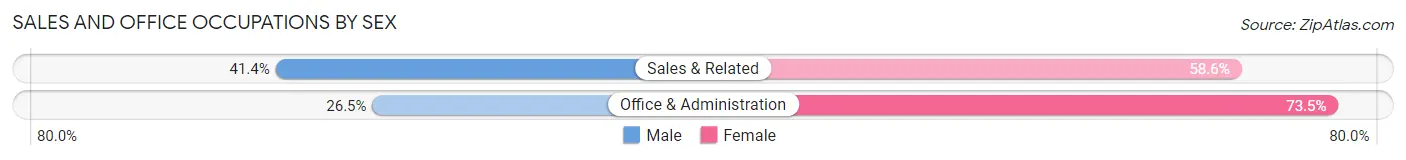
| Occupation | Male | Female |
| Sales & Related | 267 (41.4%) | 378 (58.6%) |
| Office & Administration | 199 (26.5%) | 552 (73.5%) |
| Total (Category) | 466 (33.4%) | 930 (66.6%) |
| Total (Overall) | 4,055 (55.1%) | 3,308 (44.9%) |
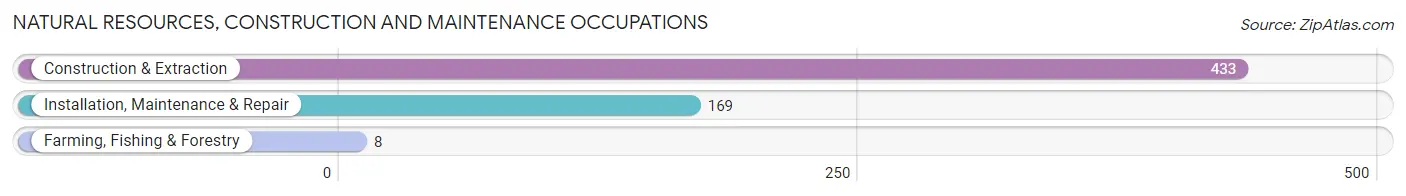
Natural Resources, Construction and Maintenance Occupations
The most common Natural Resources, Construction and Maintenance occupations in Warrington are Construction & Extraction (433 | 5.9%), Installation, Maintenance & Repair (169 | 2.3%), and Farming, Fishing & Forestry (8 | 0.1%).
Natural Resources, Construction and Maintenance Occupations by Sex
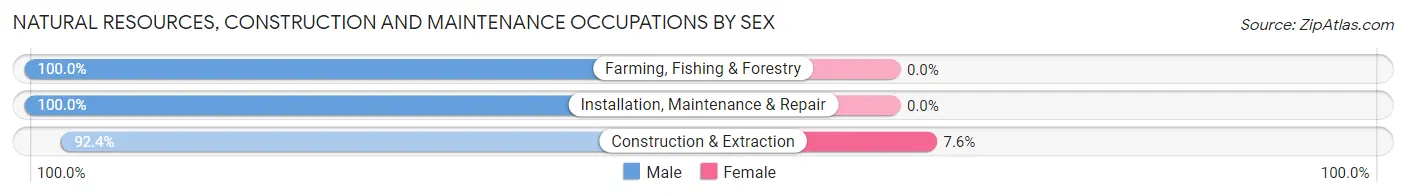
| Occupation | Male | Female |
| Farming, Fishing & Forestry | 8 (100.0%) | 0 (0.0%) |
| Construction & Extraction | 400 (92.4%) | 33 (7.6%) |
| Installation, Maintenance & Repair | 169 (100.0%) | 0 (0.0%) |
| Total (Category) | 577 (94.6%) | 33 (5.4%) |
| Total (Overall) | 4,055 (55.1%) | 3,308 (44.9%) |
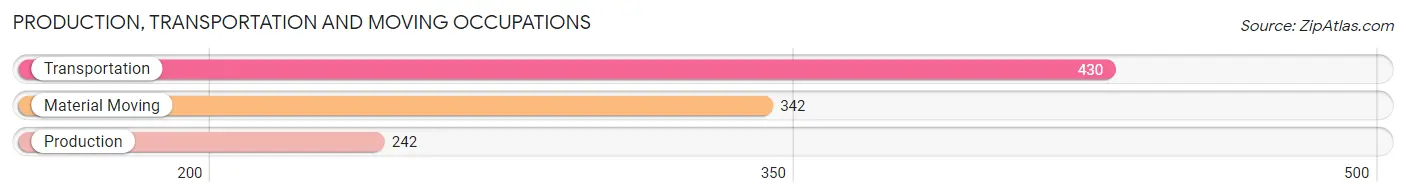
Production, Transportation and Moving Occupations
The most common Production, Transportation and Moving occupations in Warrington are Transportation (430 | 5.8%), Material Moving (342 | 4.6%), and Production (242 | 3.3%).
Production, Transportation and Moving Occupations by Sex
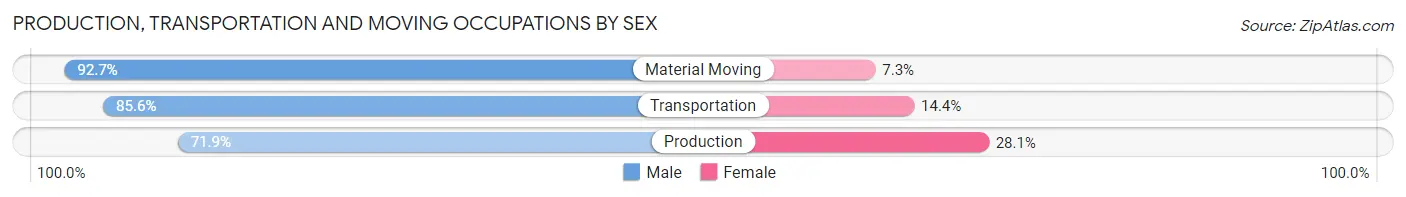
| Occupation | Male | Female |
| Production | 174 (71.9%) | 68 (28.1%) |
| Transportation | 368 (85.6%) | 62 (14.4%) |
| Material Moving | 317 (92.7%) | 25 (7.3%) |
| Total (Category) | 859 (84.7%) | 155 (15.3%) |
| Total (Overall) | 4,055 (55.1%) | 3,308 (44.9%) |
Employment Industries by Sex in Warrington
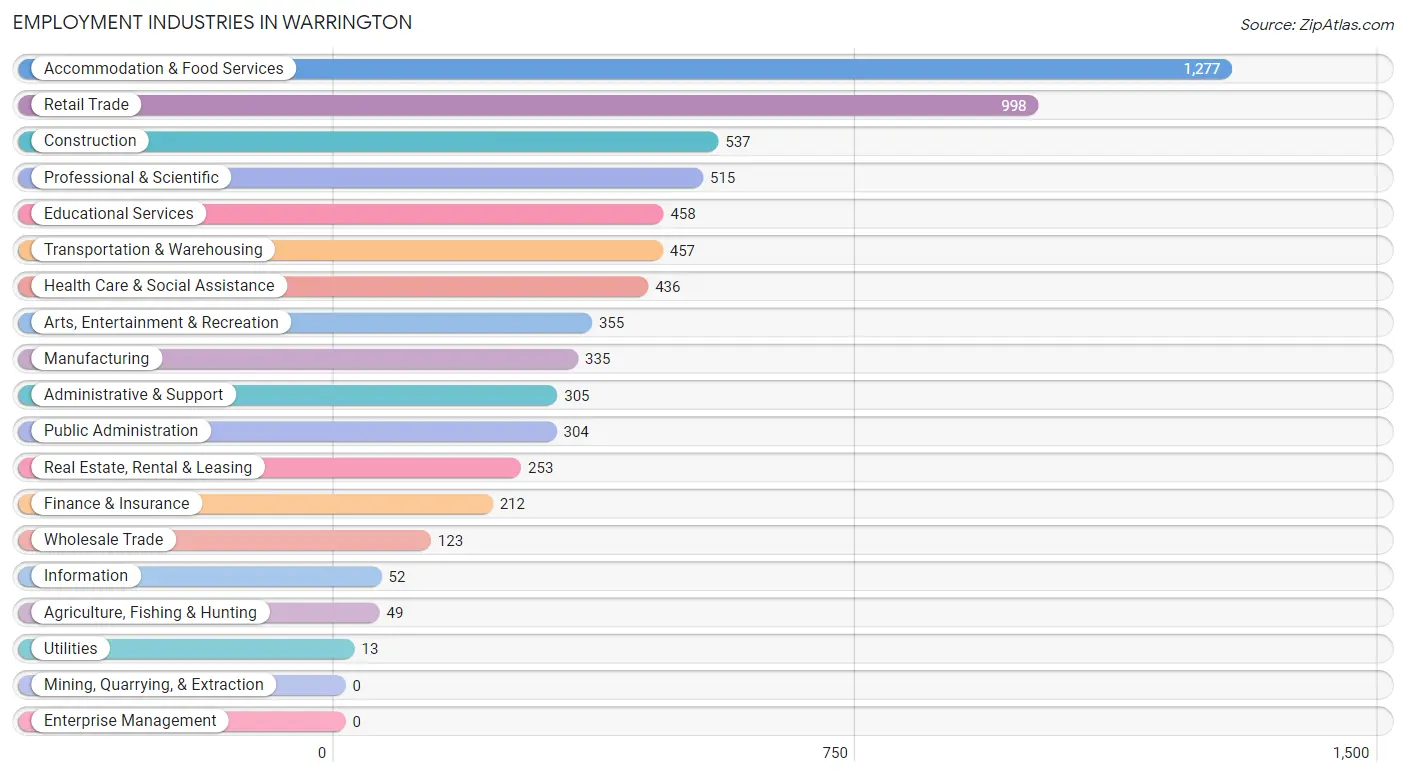
Employment Industries in Warrington
The major employment industries in Warrington include Accommodation & Food Services (1,277 | 17.3%), Retail Trade (998 | 13.6%), Construction (537 | 7.3%), Professional & Scientific (515 | 7.0%), and Educational Services (458 | 6.2%).
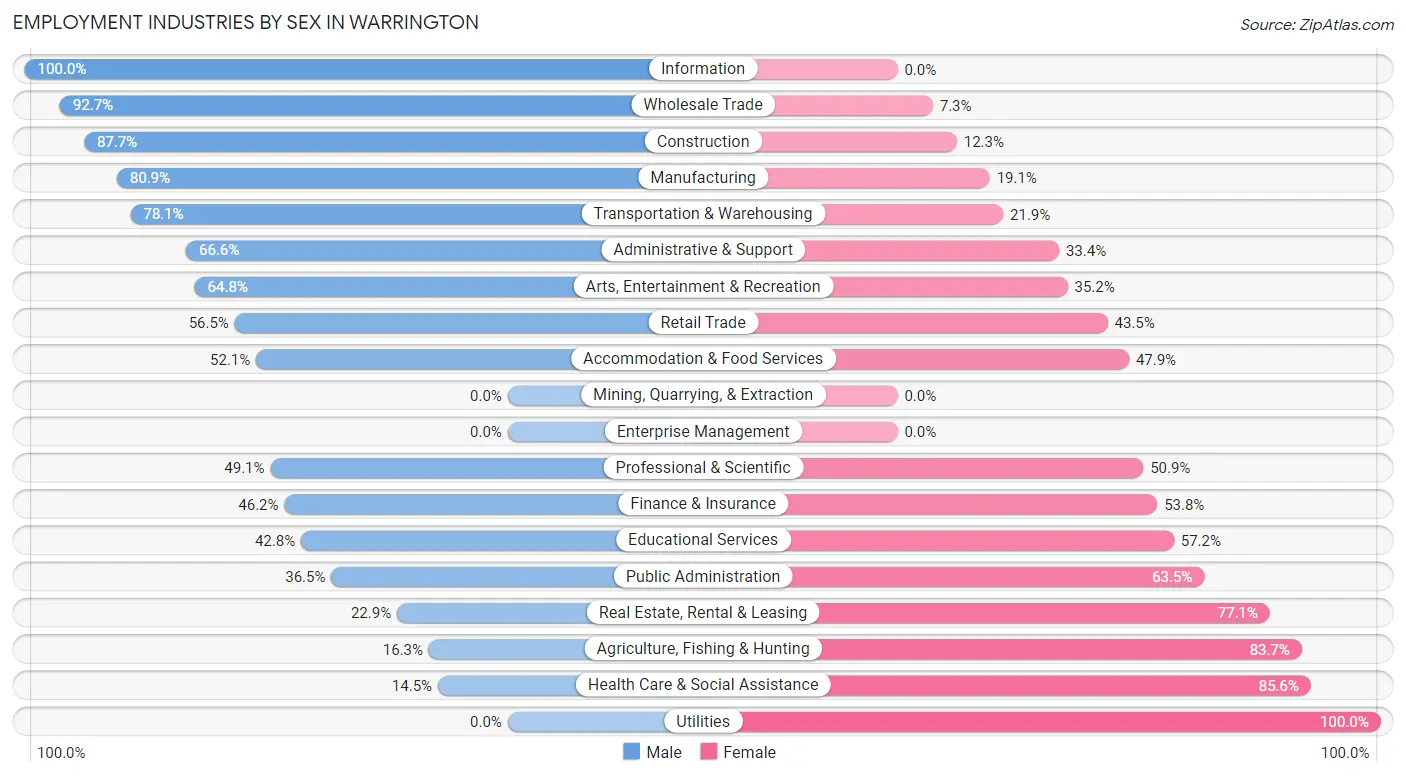
Employment Industries by Sex in Warrington
The Warrington industries that see more men than women are Information (100.0%), Wholesale Trade (92.7%), and Construction (87.7%), whereas the industries that tend to have a higher number of women are Utilities (100.0%), Health Care & Social Assistance (85.6%), and Agriculture, Fishing & Hunting (83.7%).
| Industry | Male | Female |
| Agriculture, Fishing & Hunting | 8 (16.3%) | 41 (83.7%) |
| Mining, Quarrying, & Extraction | 0 (0.0%) | 0 (0.0%) |
| Construction | 471 (87.7%) | 66 (12.3%) |
| Manufacturing | 271 (80.9%) | 64 (19.1%) |
| Wholesale Trade | 114 (92.7%) | 9 (7.3%) |
| Retail Trade | 564 (56.5%) | 434 (43.5%) |
| Transportation & Warehousing | 357 (78.1%) | 100 (21.9%) |
| Utilities | 0 (0.0%) | 13 (100.0%) |
| Information | 52 (100.0%) | 0 (0.0%) |
| Finance & Insurance | 98 (46.2%) | 114 (53.8%) |
| Real Estate, Rental & Leasing | 58 (22.9%) | 195 (77.1%) |
| Professional & Scientific | 253 (49.1%) | 262 (50.9%) |
| Enterprise Management | 0 (0.0%) | 0 (0.0%) |
| Administrative & Support | 203 (66.6%) | 102 (33.4%) |
| Educational Services | 196 (42.8%) | 262 (57.2%) |
| Health Care & Social Assistance | 63 (14.4%) | 373 (85.6%) |
| Arts, Entertainment & Recreation | 230 (64.8%) | 125 (35.2%) |
| Accommodation & Food Services | 665 (52.1%) | 612 (47.9%) |
| Public Administration | 111 (36.5%) | 193 (63.5%) |
| Total | 4,055 (55.1%) | 3,308 (44.9%) |
Education in Warrington
School Enrollment in Warrington
The most common levels of schooling among the 3,568 students in Warrington are middle school (1,232 | 34.5%), elementary school (750 | 21.0%), and high school (714 | 20.0%).
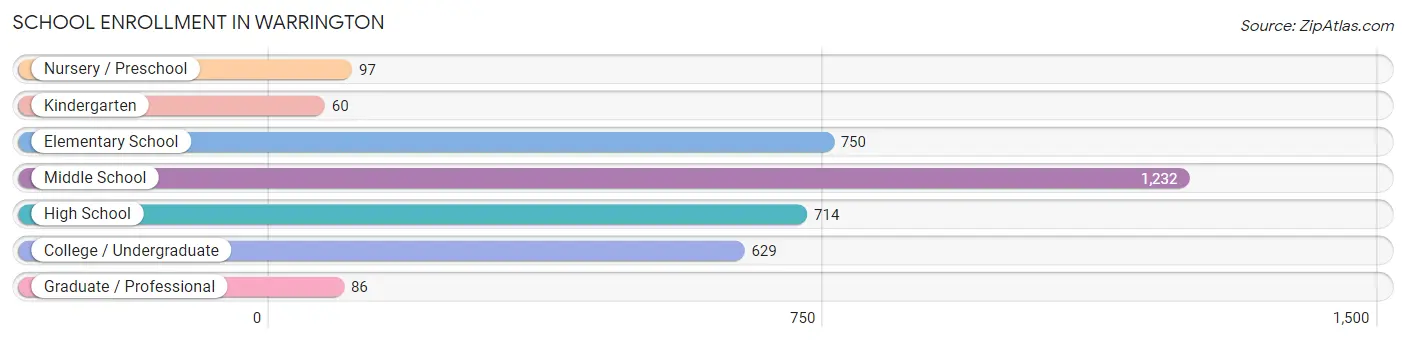
| School Level | # Students | % Students |
| Nursery / Preschool | 97 | 2.7% |
| Kindergarten | 60 | 1.7% |
| Elementary School | 750 | 21.0% |
| Middle School | 1,232 | 34.5% |
| High School | 714 | 20.0% |
| College / Undergraduate | 629 | 17.6% |
| Graduate / Professional | 86 | 2.4% |
| Total | 3,568 | 100.0% |
School Enrollment by Age by Funding Source in Warrington
Out of a total of 3,568 students who are enrolled in schools in Warrington, 642 (18.0%) attend a private institution, while the remaining 2,926 (82.0%) are enrolled in public schools. The age group of 25 to 34 year olds has the highest likelihood of being enrolled in private schools, with 84 (44.4% in the age bracket) enrolled. Conversely, the age group of 20 to 24 year olds has the lowest likelihood of being enrolled in a private school, with 276 (97.5% in the age bracket) attending a public institution.
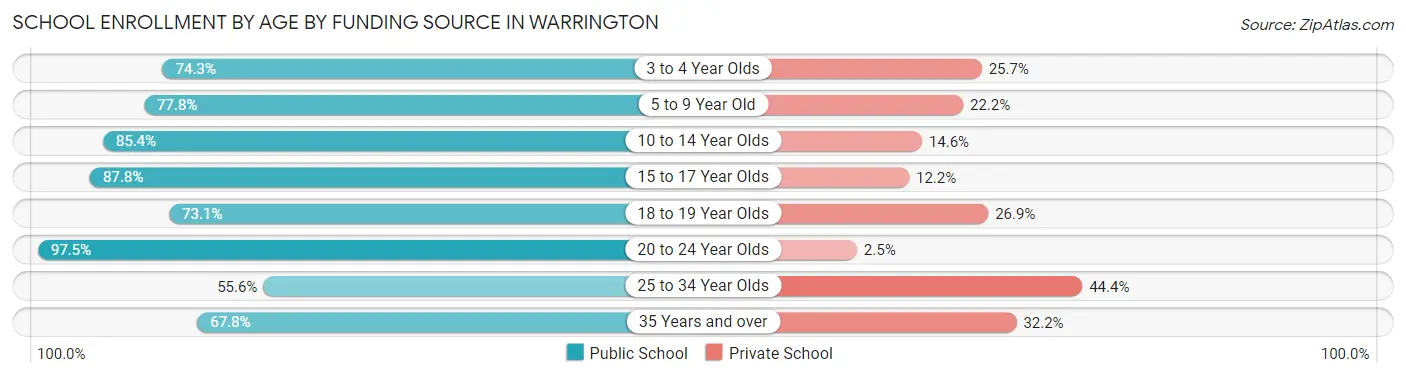
| Age Bracket | Public School | Private School |
| 3 to 4 Year Olds | 26 (74.3%) | 9 (25.7%) |
| 5 to 9 Year Old | 605 (77.8%) | 173 (22.2%) |
| 10 to 14 Year Olds | 1,008 (85.4%) | 172 (14.6%) |
| 15 to 17 Year Olds | 656 (87.8%) | 91 (12.2%) |
| 18 to 19 Year Olds | 133 (73.1%) | 49 (26.9%) |
| 20 to 24 Year Olds | 276 (97.5%) | 7 (2.5%) |
| 25 to 34 Year Olds | 105 (55.6%) | 84 (44.4%) |
| 35 Years and over | 118 (67.8%) | 56 (32.2%) |
| Total | 2,926 (82.0%) | 642 (18.0%) |
Educational Attainment by Field of Study in Warrington
Business (778 | 25.4%), education (445 | 14.5%), arts & humanities (326 | 10.6%), liberal arts & history (281 | 9.2%), and bio, nature & agricultural (204 | 6.7%) are the most common fields of study among 3,063 individuals in Warrington who have obtained a bachelor's degree or higher.
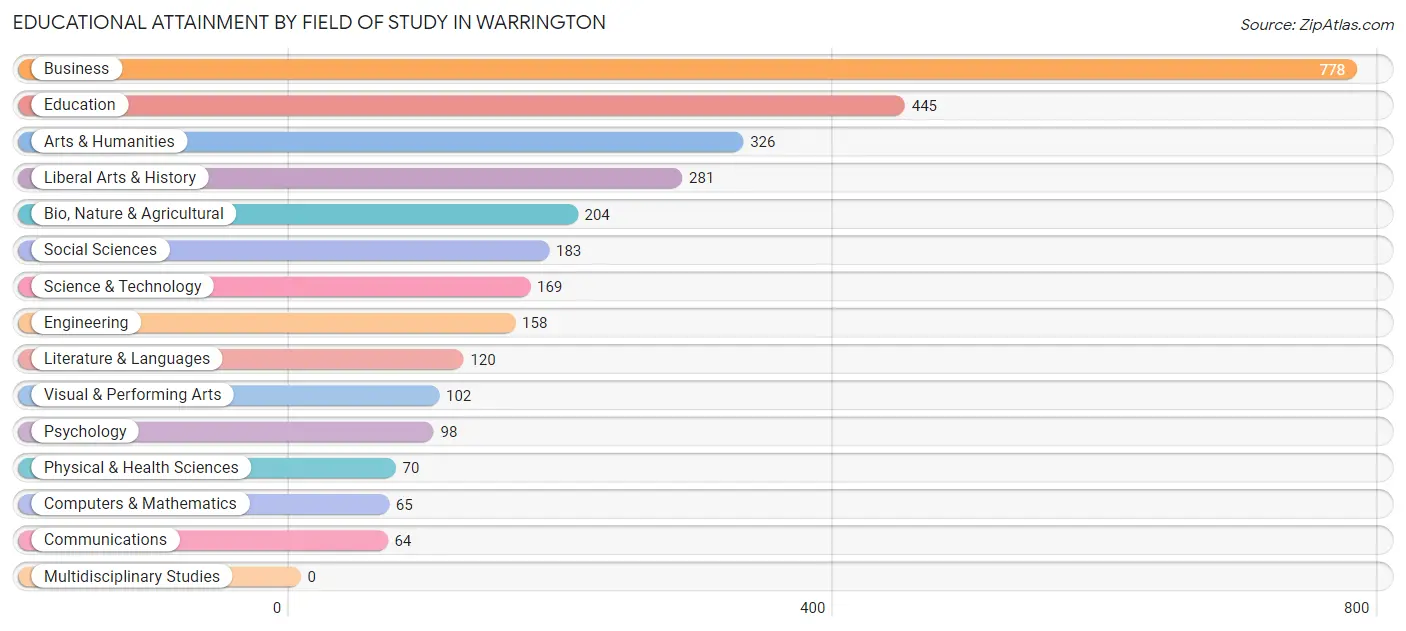
| Field of Study | # Graduates | % Graduates |
| Computers & Mathematics | 65 | 2.1% |
| Bio, Nature & Agricultural | 204 | 6.7% |
| Physical & Health Sciences | 70 | 2.3% |
| Psychology | 98 | 3.2% |
| Social Sciences | 183 | 6.0% |
| Engineering | 158 | 5.2% |
| Multidisciplinary Studies | 0 | 0.0% |
| Science & Technology | 169 | 5.5% |
| Business | 778 | 25.4% |
| Education | 445 | 14.5% |
| Literature & Languages | 120 | 3.9% |
| Liberal Arts & History | 281 | 9.2% |
| Visual & Performing Arts | 102 | 3.3% |
| Communications | 64 | 2.1% |
| Arts & Humanities | 326 | 10.6% |
| Total | 3,063 | 100.0% |
Transportation & Commute in Warrington
Vehicle Availability by Sex in Warrington
The most prevalent vehicle ownership categories in Warrington are males with 2 vehicles (2,157, accounting for 53.1%) and females with 2 vehicles (1,194, making up 63.5%).
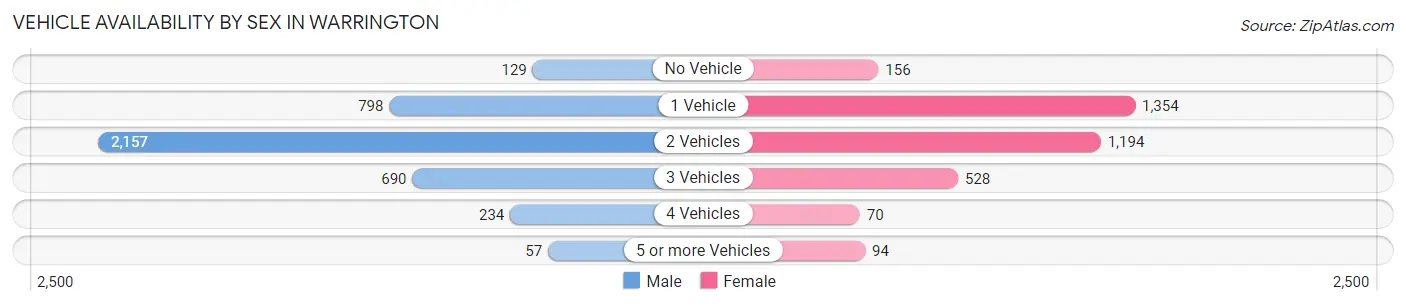
| Vehicles Available | Male | Female |
| No Vehicle | 129 (3.2%) | 156 (4.6%) |
| 1 Vehicle | 798 (19.6%) | 1,354 (39.9%) |
| 2 Vehicles | 2,157 (53.1%) | 1,194 (35.2%) |
| 3 Vehicles | 690 (17.0%) | 528 (15.5%) |
| 4 Vehicles | 234 (5.8%) | 70 (2.1%) |
| 5 or more Vehicles | 57 (1.4%) | 94 (2.8%) |
| Total | 4,065 (100.0%) | 3,396 (100.0%) |
Commute Time in Warrington
The most frequently occuring commute durations in Warrington are 15 to 19 minutes (1,480 commuters, 21.7%), 20 to 24 minutes (1,225 commuters, 18.0%), and 10 to 14 minutes (1,020 commuters, 15.0%).
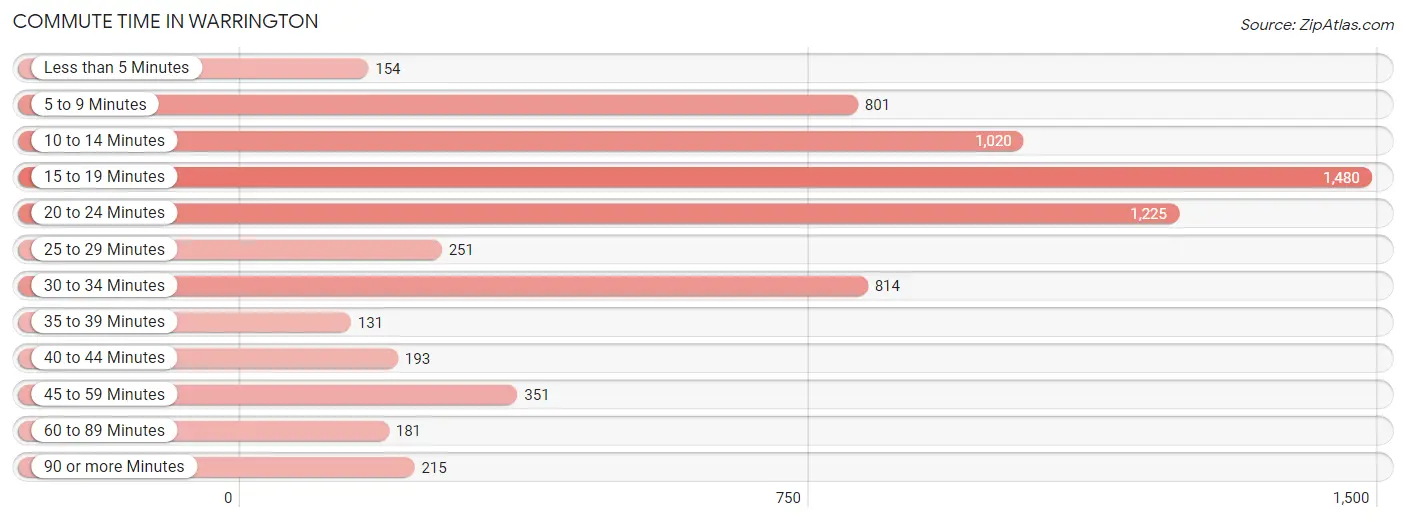
| Commute Time | # Commuters | % Commuters |
| Less than 5 Minutes | 154 | 2.3% |
| 5 to 9 Minutes | 801 | 11.7% |
| 10 to 14 Minutes | 1,020 | 15.0% |
| 15 to 19 Minutes | 1,480 | 21.7% |
| 20 to 24 Minutes | 1,225 | 18.0% |
| 25 to 29 Minutes | 251 | 3.7% |
| 30 to 34 Minutes | 814 | 11.9% |
| 35 to 39 Minutes | 131 | 1.9% |
| 40 to 44 Minutes | 193 | 2.8% |
| 45 to 59 Minutes | 351 | 5.1% |
| 60 to 89 Minutes | 181 | 2.7% |
| 90 or more Minutes | 215 | 3.2% |
Commute Time by Sex in Warrington
The most common commute times in Warrington are 15 to 19 minutes (1,039 commuters, 27.0%) for males and 20 to 24 minutes (538 commuters, 18.1%) for females.
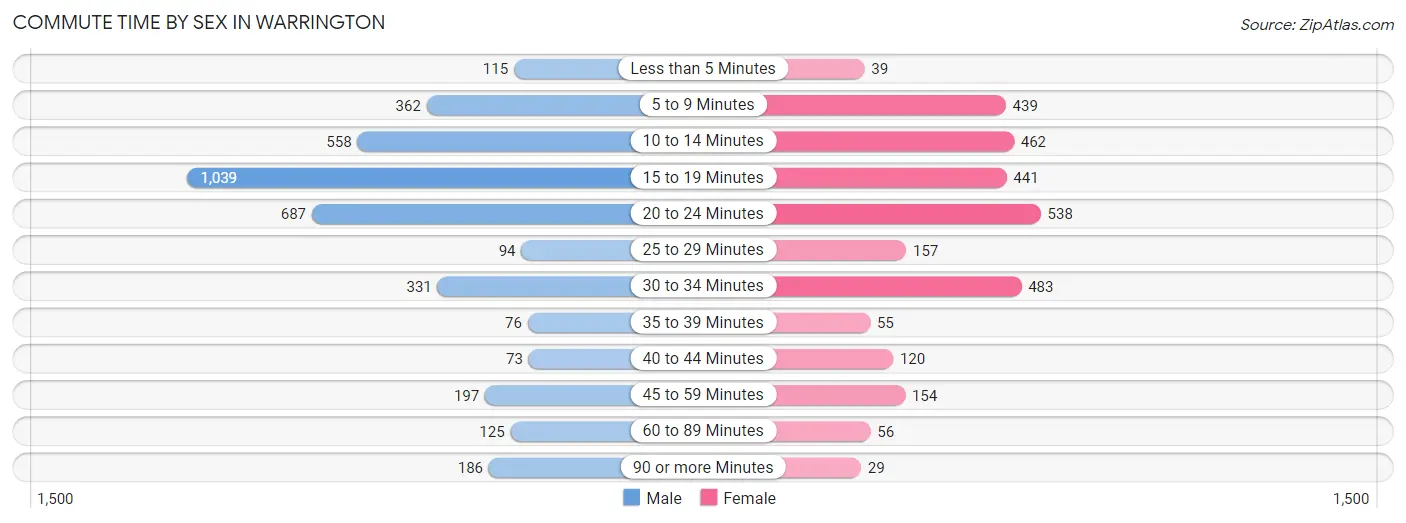
| Commute Time | Male | Female |
| Less than 5 Minutes | 115 (3.0%) | 39 (1.3%) |
| 5 to 9 Minutes | 362 (9.4%) | 439 (14.8%) |
| 10 to 14 Minutes | 558 (14.5%) | 462 (15.5%) |
| 15 to 19 Minutes | 1,039 (27.0%) | 441 (14.8%) |
| 20 to 24 Minutes | 687 (17.9%) | 538 (18.1%) |
| 25 to 29 Minutes | 94 (2.5%) | 157 (5.3%) |
| 30 to 34 Minutes | 331 (8.6%) | 483 (16.3%) |
| 35 to 39 Minutes | 76 (2.0%) | 55 (1.8%) |
| 40 to 44 Minutes | 73 (1.9%) | 120 (4.0%) |
| 45 to 59 Minutes | 197 (5.1%) | 154 (5.2%) |
| 60 to 89 Minutes | 125 (3.3%) | 56 (1.9%) |
| 90 or more Minutes | 186 (4.8%) | 29 (1.0%) |
Time of Departure to Work by Sex in Warrington
The most frequent times of departure to work in Warrington are 12:00 PM to 3:59 PM (689, 17.9%) for males and 7:30 AM to 7:59 AM (583, 19.6%) for females.
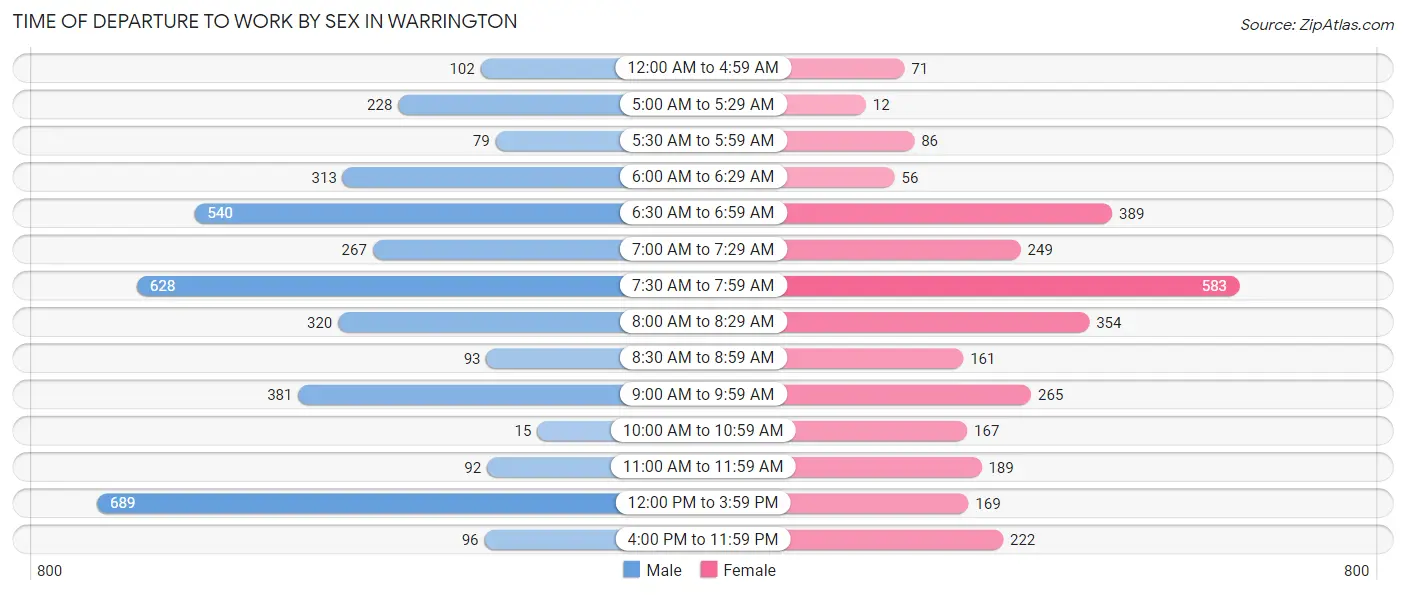
| Time of Departure | Male | Female |
| 12:00 AM to 4:59 AM | 102 (2.6%) | 71 (2.4%) |
| 5:00 AM to 5:29 AM | 228 (5.9%) | 12 (0.4%) |
| 5:30 AM to 5:59 AM | 79 (2.1%) | 86 (2.9%) |
| 6:00 AM to 6:29 AM | 313 (8.1%) | 56 (1.9%) |
| 6:30 AM to 6:59 AM | 540 (14.1%) | 389 (13.1%) |
| 7:00 AM to 7:29 AM | 267 (7.0%) | 249 (8.4%) |
| 7:30 AM to 7:59 AM | 628 (16.3%) | 583 (19.6%) |
| 8:00 AM to 8:29 AM | 320 (8.3%) | 354 (11.9%) |
| 8:30 AM to 8:59 AM | 93 (2.4%) | 161 (5.4%) |
| 9:00 AM to 9:59 AM | 381 (9.9%) | 265 (8.9%) |
| 10:00 AM to 10:59 AM | 15 (0.4%) | 167 (5.6%) |
| 11:00 AM to 11:59 AM | 92 (2.4%) | 189 (6.4%) |
| 12:00 PM to 3:59 PM | 689 (17.9%) | 169 (5.7%) |
| 4:00 PM to 11:59 PM | 96 (2.5%) | 222 (7.5%) |
| Total | 3,843 (100.0%) | 2,973 (100.0%) |
Housing Occupancy in Warrington
Occupancy by Ownership in Warrington
Of the total 7,110 dwellings in Warrington, owner-occupied units account for 4,335 (61.0%), while renter-occupied units make up 2,775 (39.0%).
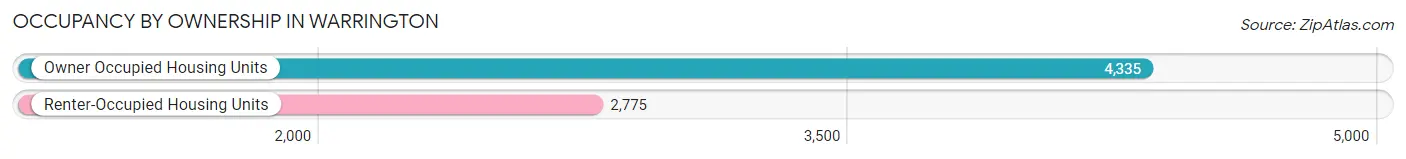
| Occupancy | # Housing Units | % Housing Units |
| Owner Occupied Housing Units | 4,335 | 61.0% |
| Renter-Occupied Housing Units | 2,775 | 39.0% |
| Total Occupied Housing Units | 7,110 | 100.0% |
Occupancy by Household Size in Warrington
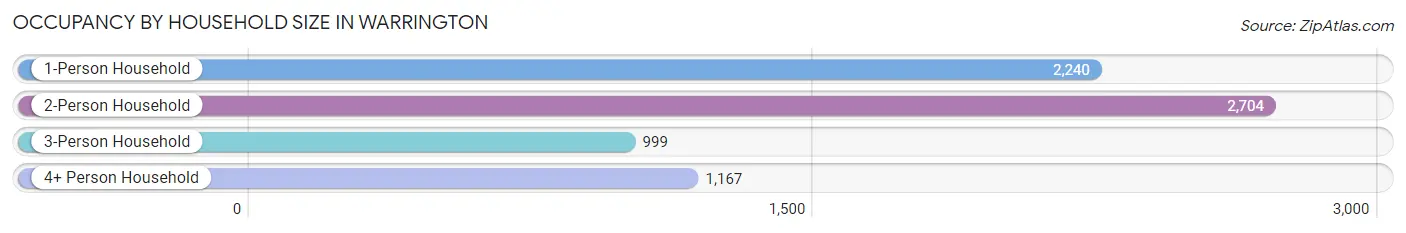
| Household Size | # Housing Units | % Housing Units |
| 1-Person Household | 2,240 | 31.5% |
| 2-Person Household | 2,704 | 38.0% |
| 3-Person Household | 999 | 14.1% |
| 4+ Person Household | 1,167 | 16.4% |
| Total Housing Units | 7,110 | 100.0% |
Occupancy by Ownership by Household Size in Warrington
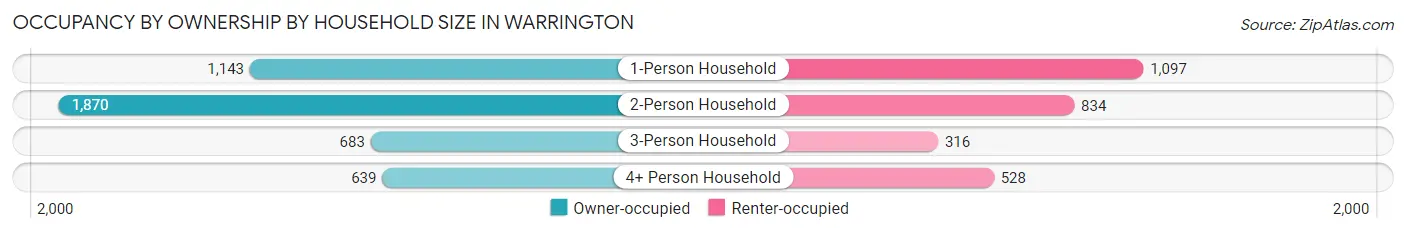
| Household Size | Owner-occupied | Renter-occupied |
| 1-Person Household | 1,143 (51.0%) | 1,097 (49.0%) |
| 2-Person Household | 1,870 (69.2%) | 834 (30.8%) |
| 3-Person Household | 683 (68.4%) | 316 (31.6%) |
| 4+ Person Household | 639 (54.8%) | 528 (45.2%) |
| Total Housing Units | 4,335 (61.0%) | 2,775 (39.0%) |
Occupancy by Educational Attainment in Warrington
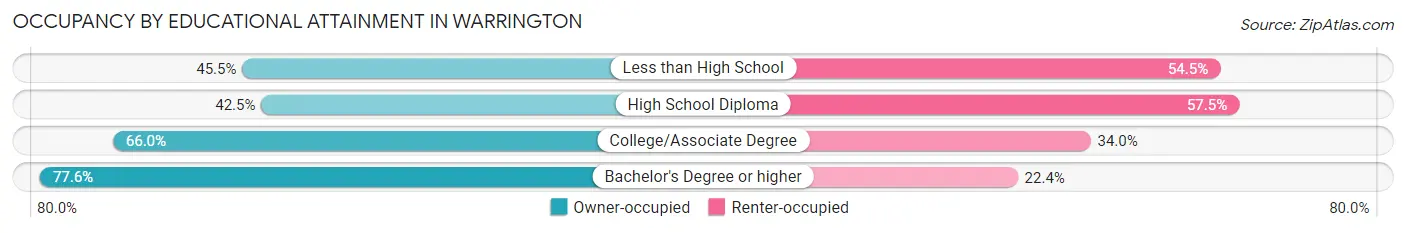
| Household Size | Owner-occupied | Renter-occupied |
| Less than High School | 341 (45.5%) | 409 (54.5%) |
| High School Diploma | 766 (42.5%) | 1,038 (57.5%) |
| College/Associate Degree | 1,745 (66.0%) | 899 (34.0%) |
| Bachelor's Degree or higher | 1,483 (77.6%) | 429 (22.4%) |
Occupancy by Age of Householder in Warrington
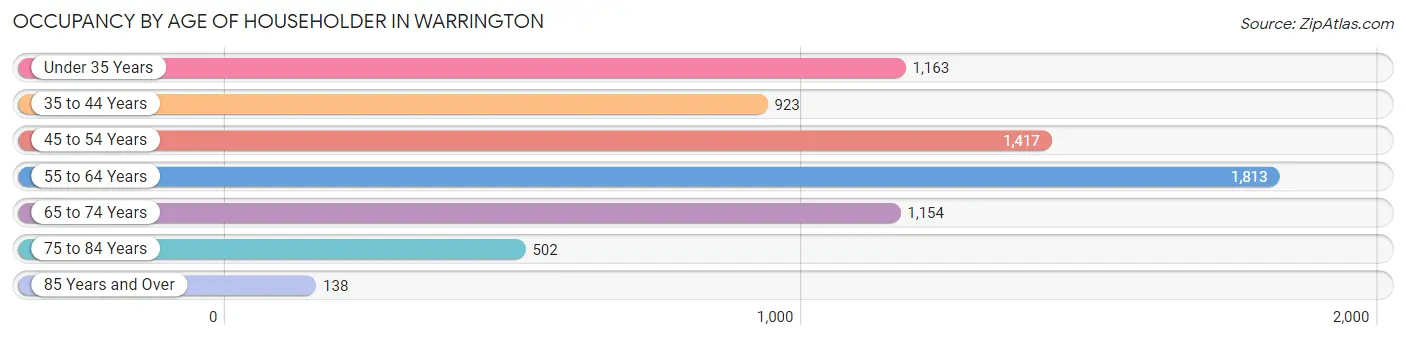
| Age Bracket | # Households | % Households |
| Under 35 Years | 1,163 | 16.4% |
| 35 to 44 Years | 923 | 13.0% |
| 45 to 54 Years | 1,417 | 19.9% |
| 55 to 64 Years | 1,813 | 25.5% |
| 65 to 74 Years | 1,154 | 16.2% |
| 75 to 84 Years | 502 | 7.1% |
| 85 Years and Over | 138 | 1.9% |
| Total | 7,110 | 100.0% |
Housing Finances in Warrington
Median Income by Occupancy in Warrington
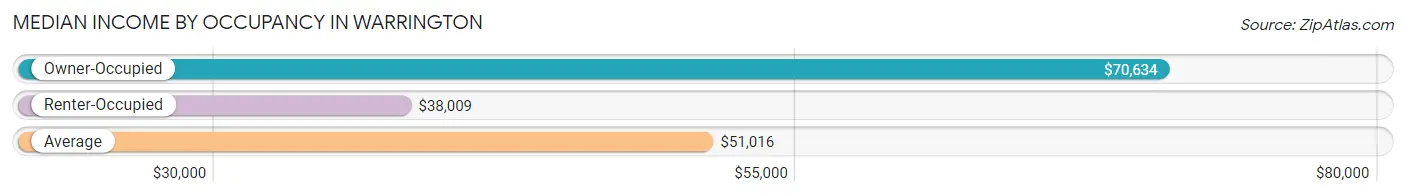
| Occupancy Type | # Households | Median Income |
| Owner-Occupied | 4,335 (61.0%) | $70,634 |
| Renter-Occupied | 2,775 (39.0%) | $38,009 |
| Average | 7,110 (100.0%) | $51,016 |
Occupancy by Householder Income Bracket in Warrington
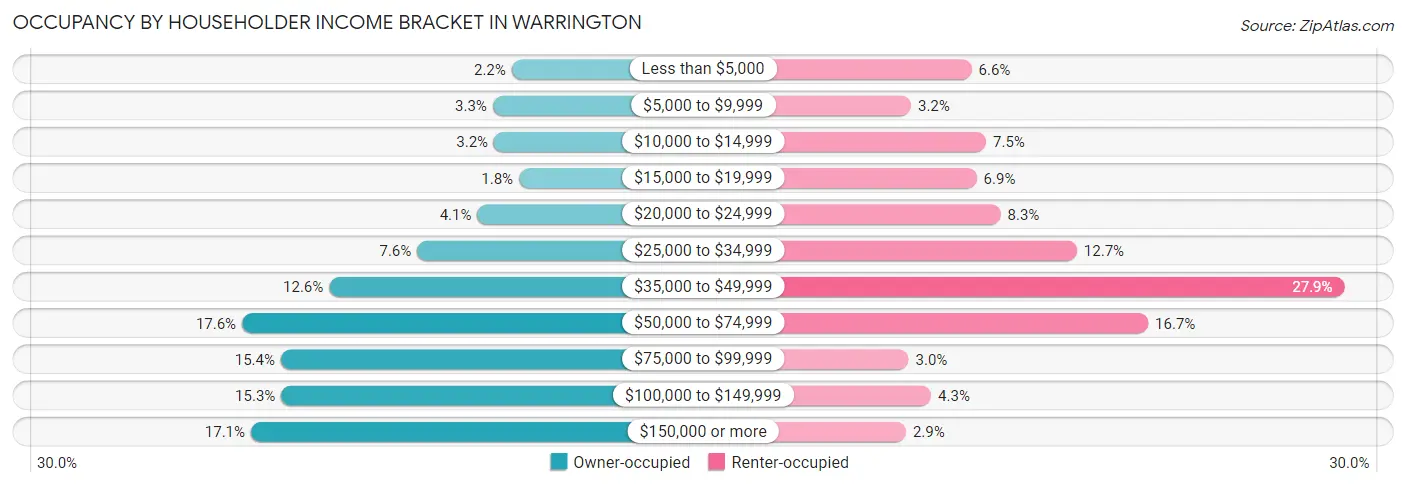
| Income Bracket | Owner-occupied | Renter-occupied |
| Less than $5,000 | 94 (2.2%) | 184 (6.6%) |
| $5,000 to $9,999 | 141 (3.3%) | 88 (3.2%) |
| $10,000 to $14,999 | 138 (3.2%) | 207 (7.5%) |
| $15,000 to $19,999 | 76 (1.8%) | 192 (6.9%) |
| $20,000 to $24,999 | 179 (4.1%) | 230 (8.3%) |
| $25,000 to $34,999 | 328 (7.6%) | 351 (12.7%) |
| $35,000 to $49,999 | 546 (12.6%) | 775 (27.9%) |
| $50,000 to $74,999 | 762 (17.6%) | 464 (16.7%) |
| $75,000 to $99,999 | 666 (15.4%) | 84 (3.0%) |
| $100,000 to $149,999 | 665 (15.3%) | 120 (4.3%) |
| $150,000 or more | 740 (17.1%) | 80 (2.9%) |
| Total | 4,335 (100.0%) | 2,775 (100.0%) |
Monthly Housing Cost Tiers in Warrington
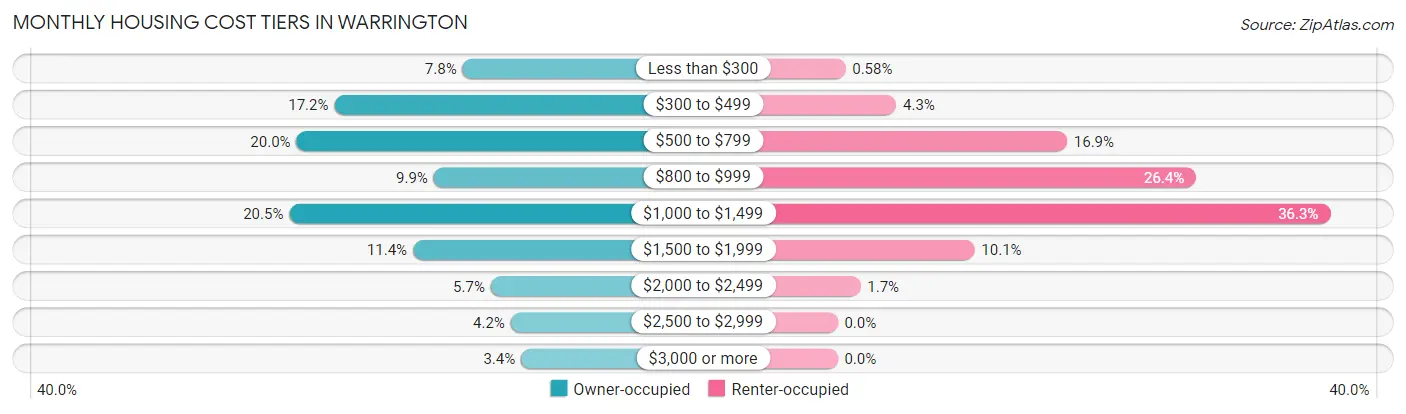
| Monthly Cost | Owner-occupied | Renter-occupied |
| Less than $300 | 336 (7.7%) | 16 (0.6%) |
| $300 to $499 | 745 (17.2%) | 120 (4.3%) |
| $500 to $799 | 866 (20.0%) | 469 (16.9%) |
| $800 to $999 | 428 (9.9%) | 733 (26.4%) |
| $1,000 to $1,499 | 889 (20.5%) | 1,007 (36.3%) |
| $1,500 to $1,999 | 494 (11.4%) | 280 (10.1%) |
| $2,000 to $2,499 | 246 (5.7%) | 47 (1.7%) |
| $2,500 to $2,999 | 182 (4.2%) | 0 (0.0%) |
| $3,000 or more | 149 (3.4%) | 0 (0.0%) |
| Total | 4,335 (100.0%) | 2,775 (100.0%) |
Physical Housing Characteristics in Warrington
Housing Structures in Warrington
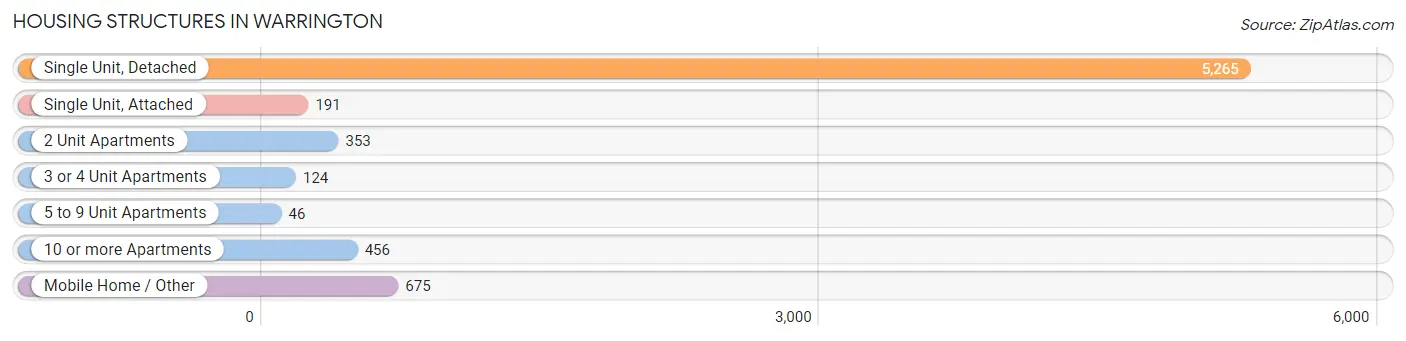
| Structure Type | # Housing Units | % Housing Units |
| Single Unit, Detached | 5,265 | 74.1% |
| Single Unit, Attached | 191 | 2.7% |
| 2 Unit Apartments | 353 | 5.0% |
| 3 or 4 Unit Apartments | 124 | 1.7% |
| 5 to 9 Unit Apartments | 46 | 0.6% |
| 10 or more Apartments | 456 | 6.4% |
| Mobile Home / Other | 675 | 9.5% |
| Total | 7,110 | 100.0% |
Housing Structures by Occupancy in Warrington
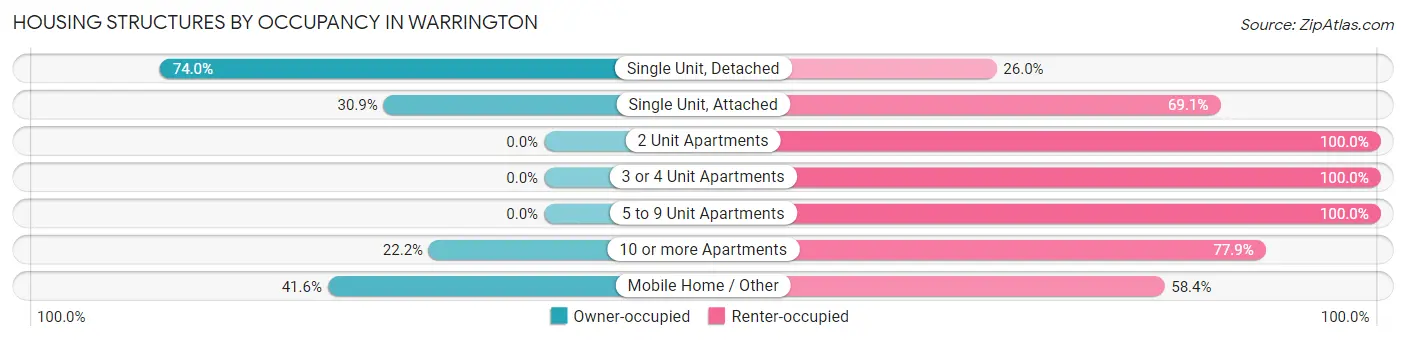
| Structure Type | Owner-occupied | Renter-occupied |
| Single Unit, Detached | 3,894 (74.0%) | 1,371 (26.0%) |
| Single Unit, Attached | 59 (30.9%) | 132 (69.1%) |
| 2 Unit Apartments | 0 (0.0%) | 353 (100.0%) |
| 3 or 4 Unit Apartments | 0 (0.0%) | 124 (100.0%) |
| 5 to 9 Unit Apartments | 0 (0.0%) | 46 (100.0%) |
| 10 or more Apartments | 101 (22.2%) | 355 (77.8%) |
| Mobile Home / Other | 281 (41.6%) | 394 (58.4%) |
| Total | 4,335 (61.0%) | 2,775 (39.0%) |
Housing Structures by Number of Rooms in Warrington
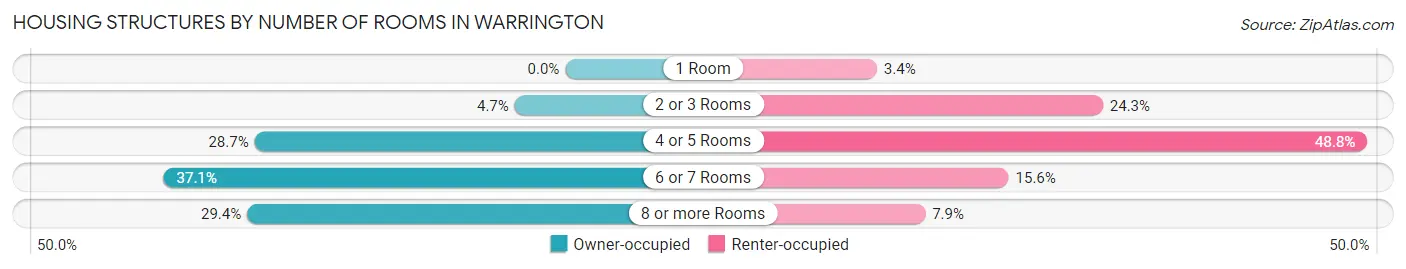
| Number of Rooms | Owner-occupied | Renter-occupied |
| 1 Room | 0 (0.0%) | 95 (3.4%) |
| 2 or 3 Rooms | 203 (4.7%) | 675 (24.3%) |
| 4 or 5 Rooms | 1,246 (28.7%) | 1,353 (48.8%) |
| 6 or 7 Rooms | 1,610 (37.1%) | 433 (15.6%) |
| 8 or more Rooms | 1,276 (29.4%) | 219 (7.9%) |
| Total | 4,335 (100.0%) | 2,775 (100.0%) |
Housing Structure by Heating Type in Warrington
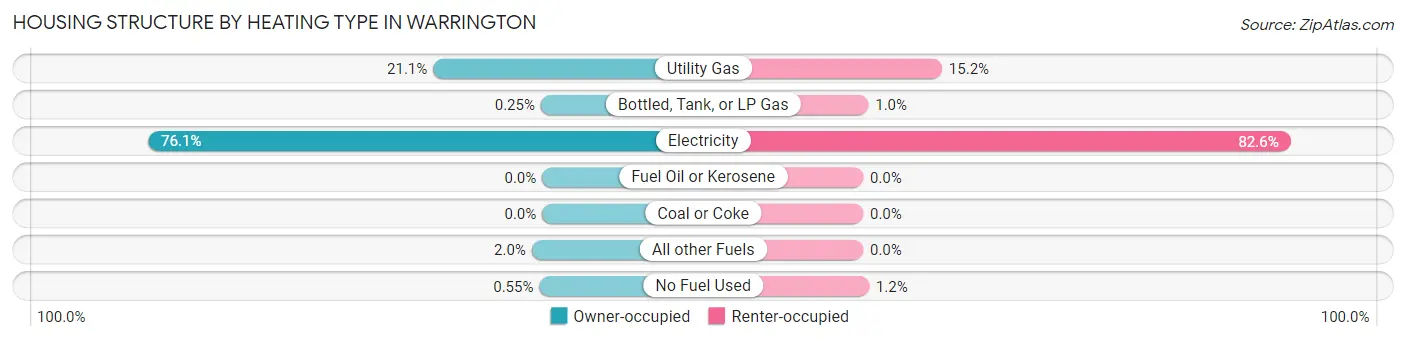
| Heating Type | Owner-occupied | Renter-occupied |
| Utility Gas | 913 (21.1%) | 423 (15.2%) |
| Bottled, Tank, or LP Gas | 11 (0.3%) | 28 (1.0%) |
| Electricity | 3,300 (76.1%) | 2,292 (82.6%) |
| Fuel Oil or Kerosene | 0 (0.0%) | 0 (0.0%) |
| Coal or Coke | 0 (0.0%) | 0 (0.0%) |
| All other Fuels | 87 (2.0%) | 0 (0.0%) |
| No Fuel Used | 24 (0.5%) | 32 (1.1%) |
| Total | 4,335 (100.0%) | 2,775 (100.0%) |
Household Vehicle Usage in Warrington
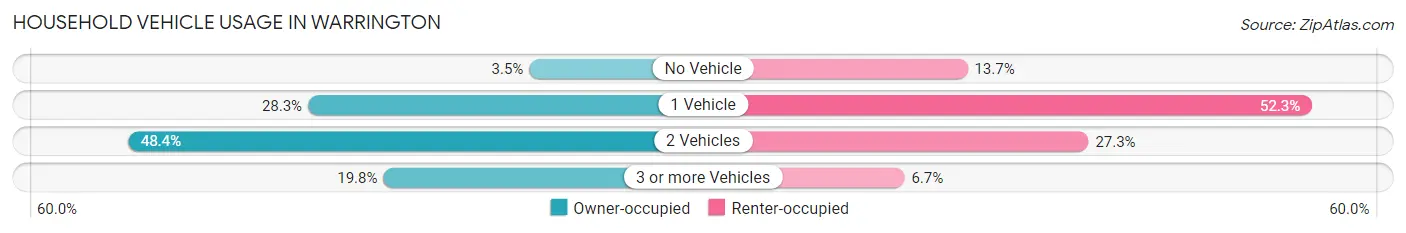
| Vehicles per Household | Owner-occupied | Renter-occupied |
| No Vehicle | 151 (3.5%) | 381 (13.7%) |
| 1 Vehicle | 1,225 (28.3%) | 1,452 (52.3%) |
| 2 Vehicles | 2,100 (48.4%) | 757 (27.3%) |
| 3 or more Vehicles | 859 (19.8%) | 185 (6.7%) |
| Total | 4,335 (100.0%) | 2,775 (100.0%) |
Real Estate & Mortgages in Warrington
Real Estate and Mortgage Overview in Warrington
| Characteristic | Without Mortgage | With Mortgage |
| Housing Units | 1,843 | 2,492 |
| Median Property Value | $137,600 | $178,100 |
| Median Household Income | $53,665 | $506 |
| Monthly Housing Costs | $444 | $149 |
| Real Estate Taxes | $637 | $233 |
Property Value by Mortgage Status in Warrington
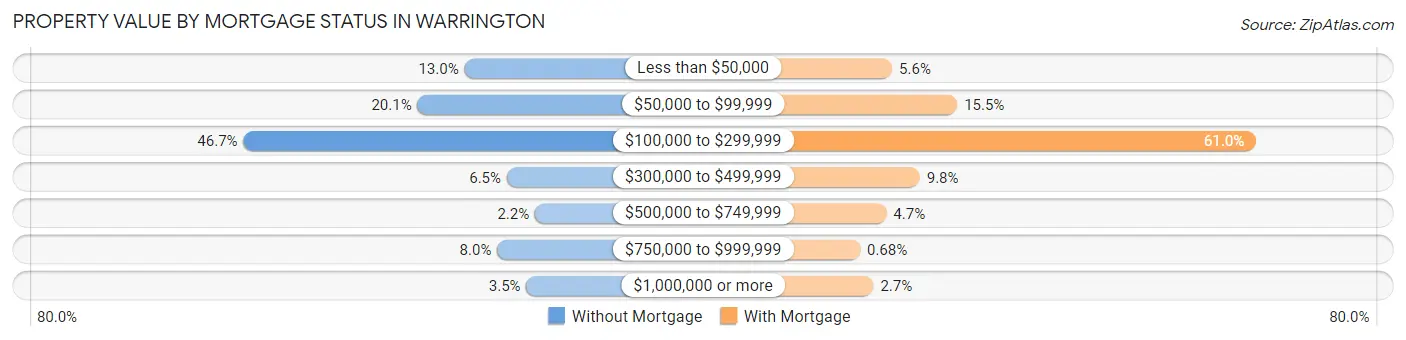
| Property Value | Without Mortgage | With Mortgage |
| Less than $50,000 | 239 (13.0%) | 139 (5.6%) |
| $50,000 to $99,999 | 371 (20.1%) | 386 (15.5%) |
| $100,000 to $299,999 | 860 (46.7%) | 1,521 (61.0%) |
| $300,000 to $499,999 | 120 (6.5%) | 244 (9.8%) |
| $500,000 to $749,999 | 41 (2.2%) | 117 (4.7%) |
| $750,000 to $999,999 | 147 (8.0%) | 17 (0.7%) |
| $1,000,000 or more | 65 (3.5%) | 68 (2.7%) |
| Total | 1,843 (100.0%) | 2,492 (100.0%) |
Household Income by Mortgage Status in Warrington
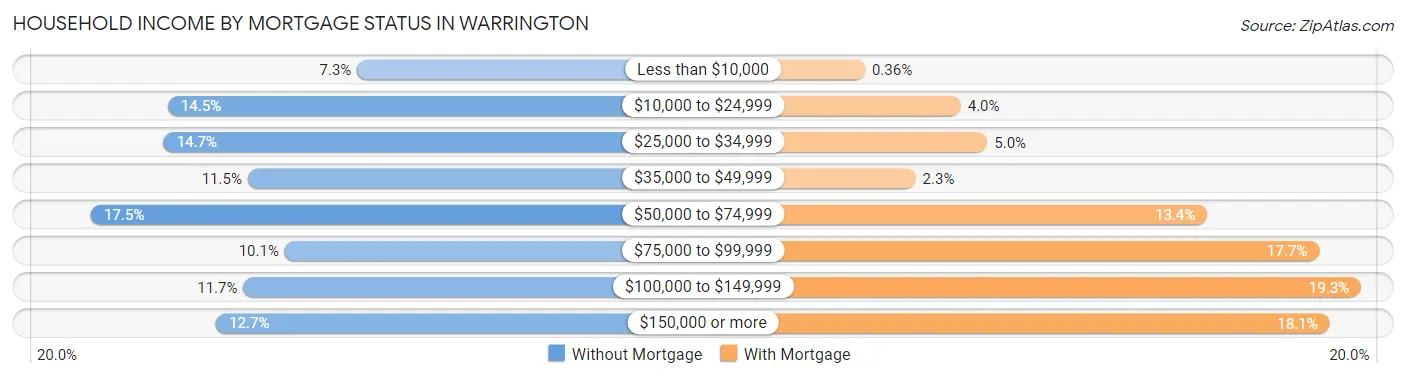
| Household Income | Without Mortgage | With Mortgage |
| Less than $10,000 | 135 (7.3%) | 9 (0.4%) |
| $10,000 to $24,999 | 268 (14.5%) | 100 (4.0%) |
| $25,000 to $34,999 | 271 (14.7%) | 125 (5.0%) |
| $35,000 to $49,999 | 212 (11.5%) | 57 (2.3%) |
| $50,000 to $74,999 | 322 (17.5%) | 334 (13.4%) |
| $75,000 to $99,999 | 186 (10.1%) | 440 (17.7%) |
| $100,000 to $149,999 | 215 (11.7%) | 480 (19.3%) |
| $150,000 or more | 234 (12.7%) | 450 (18.1%) |
| Total | 1,843 (100.0%) | 2,492 (100.0%) |
Property Value to Household Income Ratio in Warrington
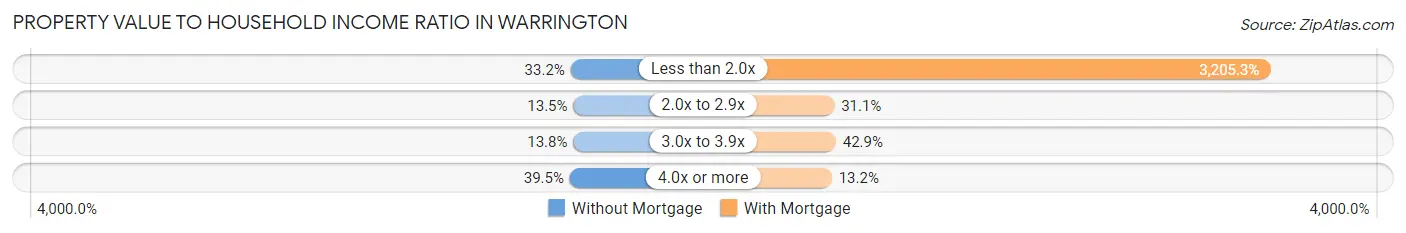
| Value-to-Income Ratio | Without Mortgage | With Mortgage |
| Less than 2.0x | 612 (33.2%) | 79,877 (3,205.3%) |
| 2.0x to 2.9x | 249 (13.5%) | 774 (31.1%) |
| 3.0x to 3.9x | 254 (13.8%) | 1,070 (42.9%) |
| 4.0x or more | 728 (39.5%) | 330 (13.2%) |
| Total | 1,843 (100.0%) | 2,492 (100.0%) |
Real Estate Taxes by Mortgage Status in Warrington
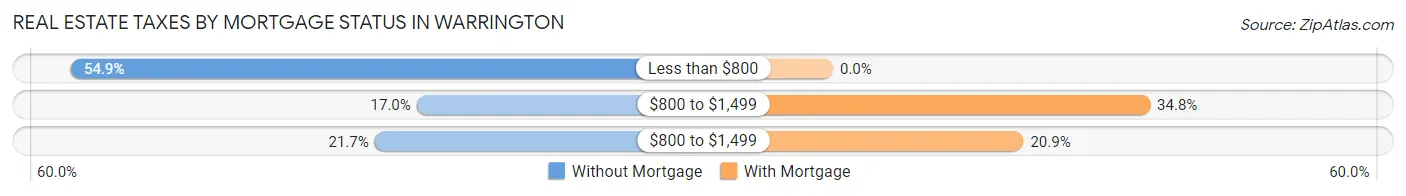
| Property Taxes | Without Mortgage | With Mortgage |
| Less than $800 | 1,012 (54.9%) | 0 (0.0%) |
| $800 to $1,499 | 314 (17.0%) | 866 (34.7%) |
| $800 to $1,499 | 399 (21.6%) | 520 (20.9%) |
| Total | 1,843 (100.0%) | 2,492 (100.0%) |
Health & Disability in Warrington
Health Insurance Coverage by Age in Warrington
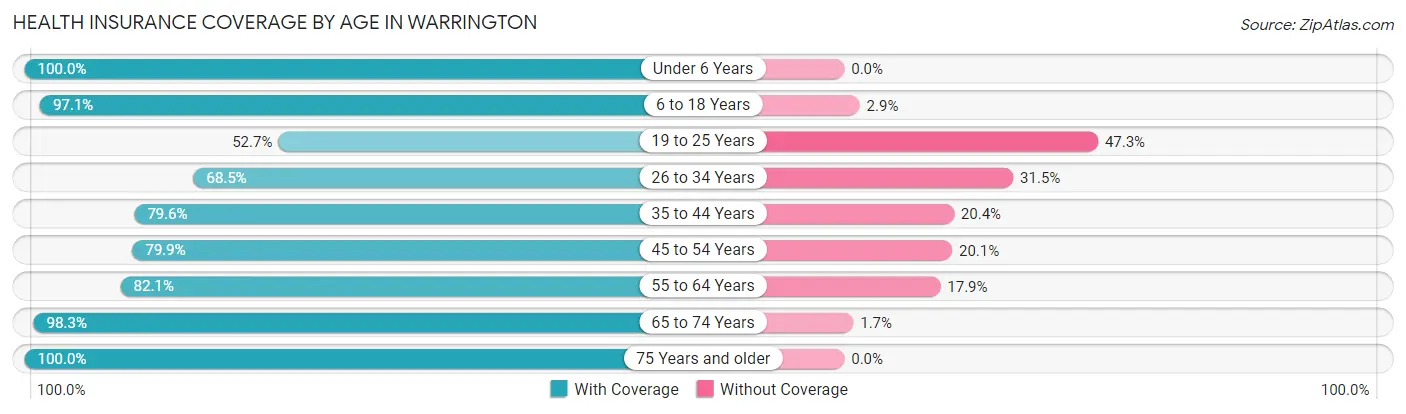
| Age Bracket | With Coverage | Without Coverage |
| Under 6 Years | 846 (100.0%) | 0 (0.0%) |
| 6 to 18 Years | 2,812 (97.1%) | 83 (2.9%) |
| 19 to 25 Years | 673 (52.7%) | 604 (47.3%) |
| 26 to 34 Years | 1,042 (68.5%) | 479 (31.5%) |
| 35 to 44 Years | 1,187 (79.6%) | 305 (20.4%) |
| 45 to 54 Years | 1,925 (79.9%) | 484 (20.1%) |
| 55 to 64 Years | 2,566 (82.1%) | 560 (17.9%) |
| 65 to 74 Years | 1,874 (98.3%) | 32 (1.7%) |
| 75 Years and older | 864 (100.0%) | 0 (0.0%) |
| Total | 13,789 (84.4%) | 2,547 (15.6%) |
Health Insurance Coverage by Citizenship Status in Warrington
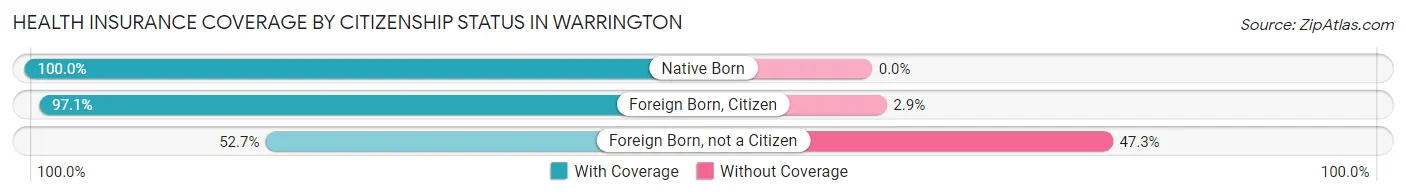
| Citizenship Status | With Coverage | Without Coverage |
| Native Born | 846 (100.0%) | 0 (0.0%) |
| Foreign Born, Citizen | 2,812 (97.1%) | 83 (2.9%) |
| Foreign Born, not a Citizen | 673 (52.7%) | 604 (47.3%) |
Health Insurance Coverage by Household Income in Warrington
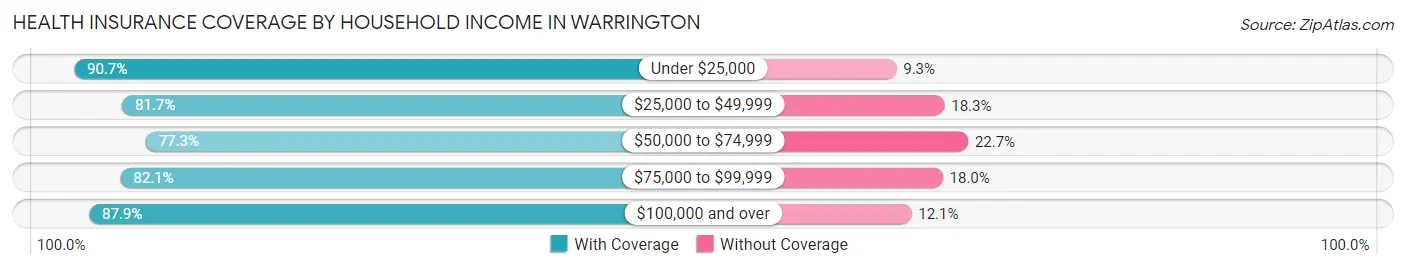
| Household Income | With Coverage | Without Coverage |
| Under $25,000 | 2,889 (90.7%) | 295 (9.3%) |
| $25,000 to $49,999 | 3,757 (81.7%) | 839 (18.3%) |
| $50,000 to $74,999 | 2,043 (77.3%) | 600 (22.7%) |
| $75,000 to $99,999 | 1,417 (82.1%) | 310 (17.9%) |
| $100,000 and over | 3,658 (87.9%) | 503 (12.1%) |
Public vs Private Health Insurance Coverage by Age in Warrington
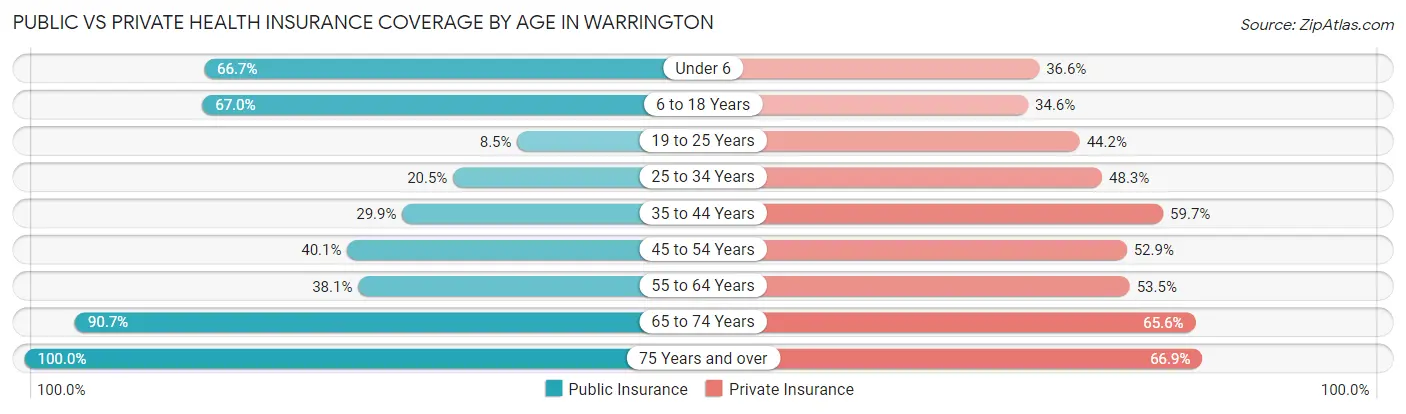
| Age Bracket | Public Insurance | Private Insurance |
| Under 6 | 564 (66.7%) | 310 (36.6%) |
| 6 to 18 Years | 1,940 (67.0%) | 1,001 (34.6%) |
| 19 to 25 Years | 109 (8.5%) | 564 (44.2%) |
| 25 to 34 Years | 311 (20.4%) | 735 (48.3%) |
| 35 to 44 Years | 446 (29.9%) | 890 (59.7%) |
| 45 to 54 Years | 966 (40.1%) | 1,274 (52.9%) |
| 55 to 64 Years | 1,190 (38.1%) | 1,671 (53.4%) |
| 65 to 74 Years | 1,728 (90.7%) | 1,251 (65.6%) |
| 75 Years and over | 864 (100.0%) | 578 (66.9%) |
| Total | 8,118 (49.7%) | 8,274 (50.6%) |
Disability Status by Sex by Age in Warrington
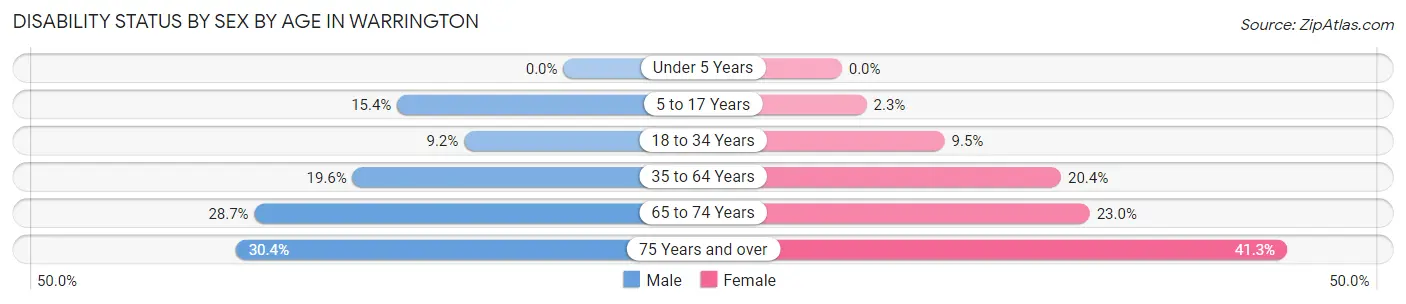
| Age Bracket | Male | Female |
| Under 5 Years | 0 (0.0%) | 0 (0.0%) |
| 5 to 17 Years | 189 (15.4%) | 35 (2.3%) |
| 18 to 34 Years | 135 (9.2%) | 150 (9.5%) |
| 35 to 64 Years | 661 (19.6%) | 742 (20.3%) |
| 65 to 74 Years | 240 (28.7%) | 246 (23.0%) |
| 75 Years and over | 114 (30.4%) | 202 (41.3%) |
Disability Class by Sex by Age in Warrington
Disability Class: Hearing Difficulty
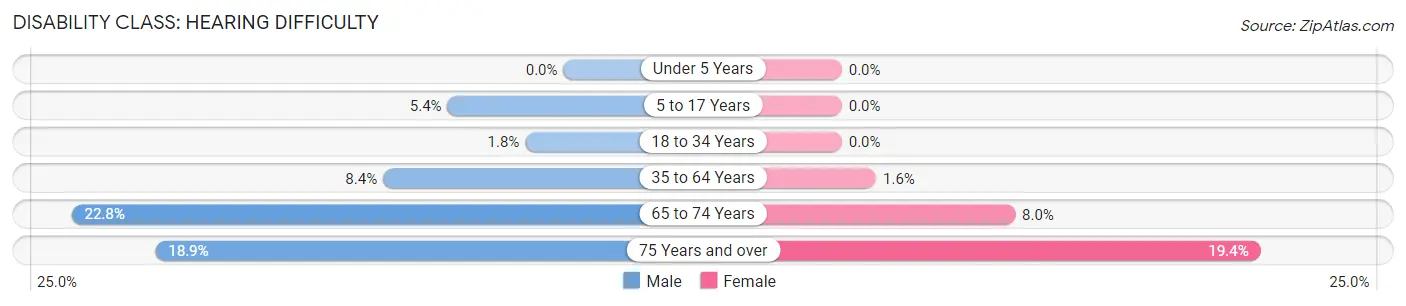
| Age Bracket | Male | Female |
| Under 5 Years | 0 (0.0%) | 0 (0.0%) |
| 5 to 17 Years | 66 (5.4%) | 0 (0.0%) |
| 18 to 34 Years | 26 (1.8%) | 0 (0.0%) |
| 35 to 64 Years | 283 (8.4%) | 58 (1.6%) |
| 65 to 74 Years | 191 (22.8%) | 86 (8.0%) |
| 75 Years and over | 71 (18.9%) | 95 (19.4%) |
Disability Class: Vision Difficulty
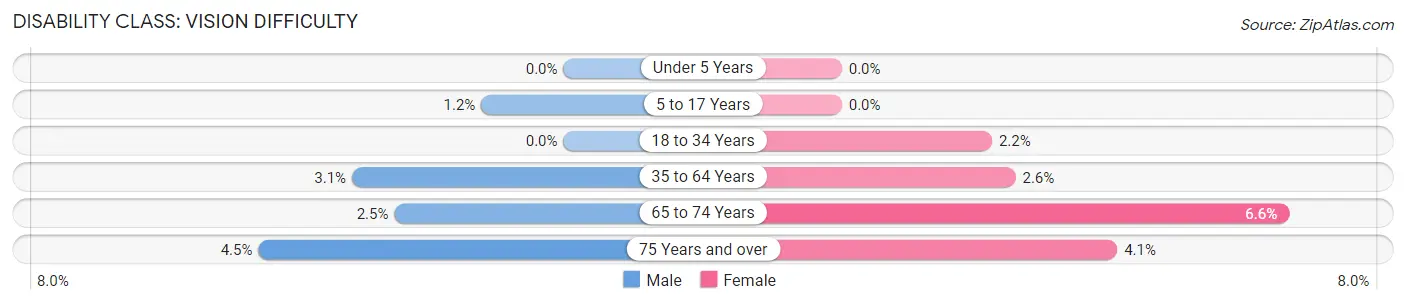
| Age Bracket | Male | Female |
| Under 5 Years | 0 (0.0%) | 0 (0.0%) |
| 5 to 17 Years | 15 (1.2%) | 0 (0.0%) |
| 18 to 34 Years | 0 (0.0%) | 35 (2.2%) |
| 35 to 64 Years | 106 (3.1%) | 94 (2.6%) |
| 65 to 74 Years | 21 (2.5%) | 71 (6.6%) |
| 75 Years and over | 17 (4.5%) | 20 (4.1%) |
Disability Class: Cognitive Difficulty
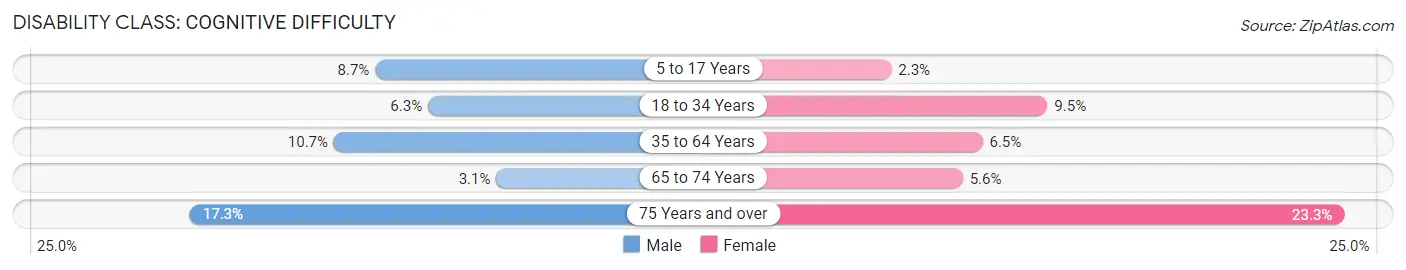
| Age Bracket | Male | Female |
| 5 to 17 Years | 107 (8.7%) | 35 (2.3%) |
| 18 to 34 Years | 92 (6.3%) | 150 (9.5%) |
| 35 to 64 Years | 360 (10.6%) | 238 (6.5%) |
| 65 to 74 Years | 26 (3.1%) | 60 (5.6%) |
| 75 Years and over | 65 (17.3%) | 114 (23.3%) |
Disability Class: Ambulatory Difficulty
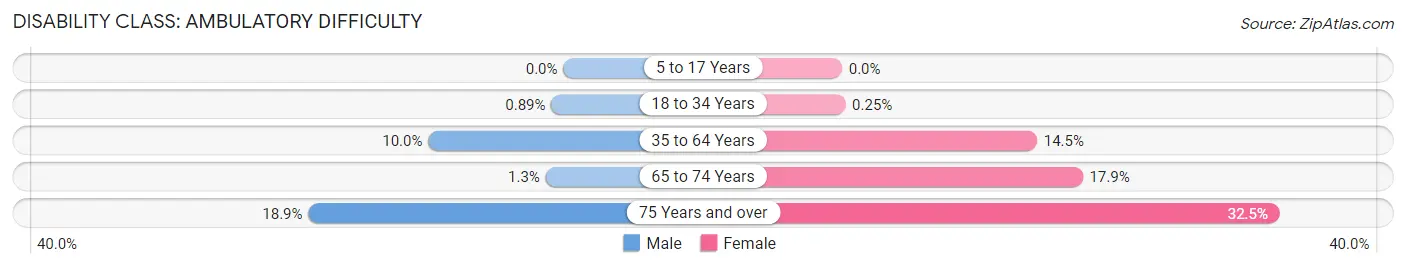
| Age Bracket | Male | Female |
| 5 to 17 Years | 0 (0.0%) | 0 (0.0%) |
| 18 to 34 Years | 13 (0.9%) | 4 (0.3%) |
| 35 to 64 Years | 339 (10.0%) | 528 (14.5%) |
| 65 to 74 Years | 11 (1.3%) | 191 (17.9%) |
| 75 Years and over | 71 (18.9%) | 159 (32.5%) |
Disability Class: Self-Care Difficulty
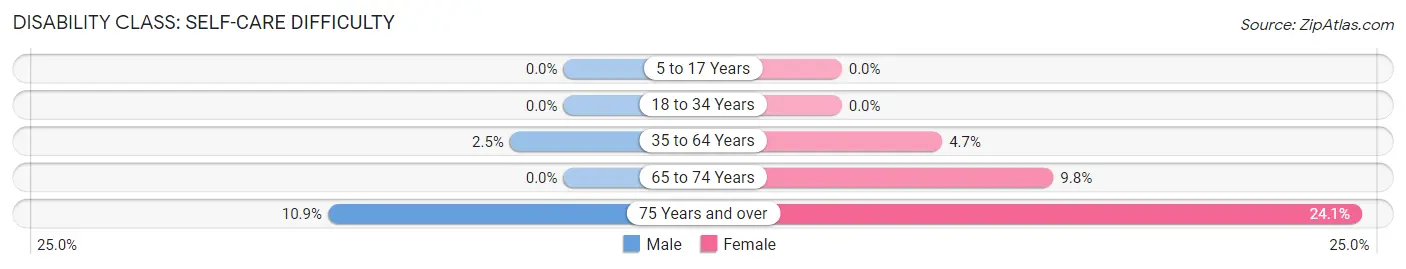
| Age Bracket | Male | Female |
| 5 to 17 Years | 0 (0.0%) | 0 (0.0%) |
| 18 to 34 Years | 0 (0.0%) | 0 (0.0%) |
| 35 to 64 Years | 84 (2.5%) | 170 (4.7%) |
| 65 to 74 Years | 0 (0.0%) | 105 (9.8%) |
| 75 Years and over | 41 (10.9%) | 118 (24.1%) |
Technology Access in Warrington
Computing Device Access in Warrington
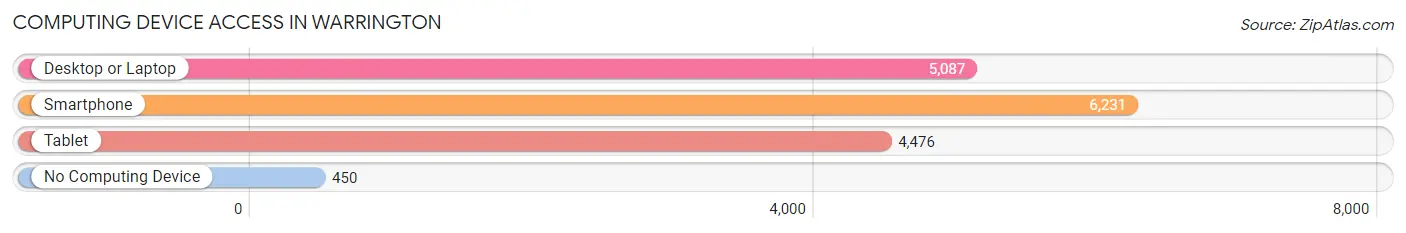
| Device Type | # Households | % Households |
| Desktop or Laptop | 5,087 | 71.6% |
| Smartphone | 6,231 | 87.6% |
| Tablet | 4,476 | 62.9% |
| No Computing Device | 450 | 6.3% |
| Total | 7,110 | 100.0% |
Internet Access in Warrington
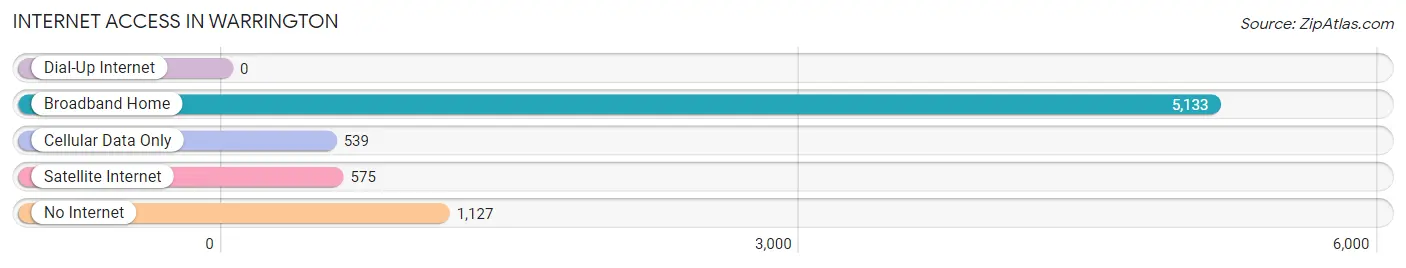
| Internet Type | # Households | % Households |
| Dial-Up Internet | 0 | 0.0% |
| Broadband Home | 5,133 | 72.2% |
| Cellular Data Only | 539 | 7.6% |
| Satellite Internet | 575 | 8.1% |
| No Internet | 1,127 | 15.9% |
| Total | 7,110 | 100.0% |
Warrington Summary
Warrington is a census-designated place (CDP) located in Escambia County, Florida, United States. It is part of the Pensacola–Ferry Pass–Brent Metropolitan Statistical Area. The population was 8,541 at the 2010 census.
Geography
Warrington is located at 30°25'17" North, 87°14'45" West (30.421445, -87.245945). According to the United States Census Bureau, the CDP has a total area of 4.2 square miles (10.8 km2), of which 4.1 square miles (10.6 km2) is land and 0.1 square miles (0.2 km2) (2.44%) is water.
History
The area now known as Warrington was originally inhabited by Native Americans. The first European settlers arrived in the area in the early 1800s. The area was originally known as "Warrington's Settlement" and was named after the Warrington family, who were among the first settlers.
In 1821, the area became part of the newly formed Escambia County. In 1822, the Warrington Post Office was established. In 1845, the area was officially incorporated as the Town of Warrington.
In the late 1800s, Warrington was a thriving port town, with a population of over 1,000. The town was home to several businesses, including a sawmill, a grist mill, a cotton gin, and a brickyard.
In the early 1900s, Warrington began to decline as the port industry moved to larger cities. By the mid-1900s, the population had dropped to just over 500.
Economy
Warrington is home to several businesses, including a grocery store, a hardware store, a pharmacy, and a variety of restaurants. The town is also home to a number of small businesses, including a barber shop, a beauty salon, and a florist.
The town is also home to a number of industrial businesses, including a paper mill, a chemical plant, and a metal fabrication plant.
Demographics
As of the census of 2010, there were 8,541 people, 3,541 households, and 2,092 families residing in the CDP. The population density was 2,072.2 people per square mile (800.2/km2). There were 3,945 housing units at an average density of 962.2/sq mi (371.2/km2). The racial makeup of the CDP was 68.2% White, 24.2% African American, 0.7% Native American, 1.3% Asian, 0.1% Pacific Islander, 3.2% from other races, and 2.3% from two or more races. Hispanic or Latino of any race were 8.2% of the population.
There were 3,541 households, out of which 28.2% had children under the age of 18 living with them, 37.2% were married couples living together, 17.7% had a female householder with no husband present, and 38.7% were non-families. 32.2% of all households were made up of individuals, and 11.2% had someone living alone who was 65 years of age or older. The average household size was 2.41 and the average family size was 3.04.
In the CDP, the population was spread out, with 25.2% under the age of 18, 9.2% from 18 to 24, 28.2% from 25 to 44, 22.7% from 45 to 64, and 14.7% who were 65 years of age or older. The median age was 36 years. For every 100 females, there were 93.2 males. For every 100 females age 18 and over, there were 89.3 males.
The median income for a household in the CDP was $30,945, and the median income for a family was $36,944. Males had a median income of $30,945 versus $21,912 for females. The per capita income for the CDP was $15,945. About 14.2% of families and 17.2% of the population were below the poverty line, including 24.2% of those under age 18 and 11.2% of those age 65 or over.
Common Questions
What is the Total Population of Warrington?
Total Population of Warrington is 16,567.
What is the Total Male Population of Warrington?
Total Male Population of Warrington is 7,751.
What is the Total Female Population of Warrington?
Total Female Population of Warrington is 8,816.
What is the Ratio of Males per 100 Females in Warrington?
There are 87.92 Males per 100 Females in Warrington.
What is the Ratio of Females per 100 Males in Warrington?
There are 113.74 Females per 100 Males in Warrington.
What is the Median Population Age in Warrington?
Median Population Age in Warrington is 45.1 Years.
What is the Average Family Size in Warrington
Average Family Size in Warrington is 2.9 People.
What is the Average Household Size in Warrington
Average Household Size in Warrington is 2.3 People.
What is Per Capita Income in Warrington?
Per Capita income in Warrington is $34,658.
What is the Median Family Income in Warrington?
Median Family Income in Warrington is $56,055.
What is the Median Household income in Warrington?
Median Household Income in Warrington is $51,016.
What is Income or Wage Gap in Warrington?
Income or Wage Gap in Warrington is 29.5%.
Women in Warrington earn 70.5 cents for every dollar earned by a man.
What is Family Income Deficit in Warrington?
Family Income Deficit in Warrington is $11,466.
Families that are below poverty line in Warrington earn $11,466 less on average than the poverty threshold level.
What is Inequality or Gini Index in Warrington?
Inequality or Gini Index in Warrington is 0.51.
How Large is the Labor Force in Warrington?
There are 8,206 People in the Labor Forcein in Warrington.
What is the Percentage of People in the Labor Force in Warrington?
60.8% of People are in the Labor Force in Warrington.
What is the Unemployment Rate in Warrington?
Unemployment Rate in Warrington is 7.7%.