Scotch-Irish vs Cree Single Mother Households

COMPARE

Scotch-Irish
Race
Ancestry
AfghanAfricanAlaska NativeAlaskan AthabascanAlbanianAleutAlsatianAmericanApacheArabArapahoArgentineanArmenianAssyrian/Chaldean/SyriacAustralianAustrianBahamianBangladeshiBarbadianBasqueBelgianBelizeanBermudanBhutaneseBlackfeetBolivianBrazilianBritishBritish West IndianBulgarianBurmeseCajunCambodianCanadianCape VerdeanCarpatho RusynCelticCentral AmericanCentral American IndianCherokeeCheyenneChickasawChileanChineseChippewaChoctawColombianColvilleComancheCosta RicanCreekCroatianCrowCubanCypriotCzechCzechoslovakianDanishDelawareDominicanDutchDutch West IndianEastern EuropeanEcuadorianEgyptianEnglishEstonianEthiopianEuropeanFijianFilipinoFinnishFrenchFrench American IndianFrench CanadianGermanGerman RussianGhanaianGreekGuamanian/ChamorroGuatemalanGuyaneseHaitianHmongHonduranHopiHoumaHungarianIcelanderIndian (Asian)IndonesianInupiatIranianIraqiIrishIroquoisIsraeliItalianJamaicanJapaneseJordanianKenyanKiowaKoreanLaotianLatvianLebaneseLiberianLithuanianLumbeeLuxembourgerMacedonianMalaysianMalteseMarshalleseMenomineeMexicanMexican American IndianMongolianMoroccanNative HawaiianNavajoNepaleseNew ZealanderNicaraguanNigerianNorthern EuropeanNorwegianOkinawanOsageOttawaPaiutePakistaniPalestinianPanamanianParaguayanPennsylvania GermanPeruvianPimaPolishPortuguesePotawatomiPuebloPuerto RicanPuget Sound SalishRomanianRussianSalvadoranSamoanScandinavianScotch-IrishScottishSeminoleSenegaleseSerbianShoshoneSierra LeoneanSiouxSlavicSlovakSloveneSomaliSouth AfricanSouth AmericanSouth American IndianSoviet UnionSpaniardSpanishSpanish AmericanSpanish American IndianSri LankanSubsaharan AfricanSudaneseSwedishSwissSyrianTaiwaneseThaiTlingit-HaidaTohono O'OdhamTonganTrinidadian and TobagonianTsimshianTurkishU.S. Virgin IslanderUgandanUkrainianUruguayanUteVenezuelanVietnameseWelshWest IndianYakamaYaquiYugoslavianYumanYup'ikZimbabwean
Immigration
NonimmigrantsImmigrantsAfghanistanAfricaAlbaniaArgentinaArmeniaAsiaAustraliaAustriaBahamasBangladeshBarbadosBelarusBelgiumBelizeBoliviaBosnia and HerzegovinaBrazilBulgariaBurma/MyanmarCabo VerdeCambodiaCameroonCanadaCaribbeanCentral AmericaChileChinaColombiaCongoCosta RicaCroatiaCubaCzechoslovakiaDenmarkDominicaDominican RepublicEastern AfricaEastern AsiaEastern EuropeEcuadorEgyptEl SalvadorEnglandEritreaEthiopiaEuropeFijiFranceGermanyGhanaGreeceGrenadaGuatemalaGuyanaHaitiHondurasHong KongHungaryIndiaIndonesiaIranIraqIrelandIsraelItalyJamaicaJapanJordanKazakhstanKenyaKoreaKuwaitLaosLatin AmericaLatviaLebanonLiberiaLithuaniaMalaysiaMexicoMicronesiaMiddle AfricaMoldovaMoroccoNepalNetherlandsNicaraguaNigeriaNorth AmericaNorth MacedoniaNorthern AfricaNorthern EuropeNorwayOceaniaPakistanPanamaPeruPhilippinesPolandPortugalRomaniaRussiaSaudi ArabiaScotlandSenegalSerbiaSierra LeoneSingaporeSomaliaSouth AfricaSouth AmericaSouth Central AsiaSouth Eastern AsiaSouthern EuropeSpainSri LankaSt. Vincent and the GrenadinesSudanSwedenSwitzerlandSyriaTaiwanThailandTrinidad and TobagoTurkeyUgandaUkraineUruguayUzbekistanVenezuelaVietnamWest IndiesWestern AfricaWestern AsiaWestern EuropeYemenZaireZimbabweAzores
Cree
Race
Ancestry
AfghanAfricanAlaska NativeAlaskan AthabascanAlbanianAleutAlsatianAmericanApacheArabArapahoArgentineanArmenianAssyrian/Chaldean/SyriacAustralianAustrianBahamianBangladeshiBarbadianBasqueBelgianBelizeanBermudanBhutaneseBlackfeetBolivianBrazilianBritishBritish West IndianBulgarianBurmeseCajunCambodianCanadianCape VerdeanCarpatho RusynCelticCentral AmericanCentral American IndianCherokeeCheyenneChickasawChileanChineseChippewaChoctawColombianColvilleComancheCosta RicanCreeCreekCroatianCrowCubanCypriotCzechCzechoslovakianDanishDelawareDominicanDutchDutch West IndianEastern EuropeanEcuadorianEgyptianEnglishEstonianEthiopianEuropeanFijianFilipinoFinnishFrenchFrench American IndianFrench CanadianGermanGerman RussianGhanaianGreekGuamanian/ChamorroGuatemalanGuyaneseHaitianHmongHonduranHopiHoumaHungarianIcelanderIndian (Asian)IndonesianInupiatIranianIraqiIrishIroquoisIsraeliItalianJamaicanJapaneseJordanianKenyanKiowaKoreanLaotianLatvianLebaneseLiberianLithuanianLumbeeLuxembourgerMacedonianMalaysianMalteseMarshalleseMenomineeMexicanMexican American IndianMongolianMoroccanNative HawaiianNavajoNepaleseNew ZealanderNicaraguanNigerianNorthern EuropeanNorwegianOkinawanOsageOttawaPaiutePakistaniPalestinianPanamanianParaguayanPennsylvania GermanPeruvianPimaPolishPortuguesePotawatomiPuebloPuerto RicanPuget Sound SalishRomanianRussianSalvadoranSamoanScandinavianScottishSeminoleSenegaleseSerbianShoshoneSierra LeoneanSiouxSlavicSlovakSloveneSomaliSouth AfricanSouth AmericanSouth American IndianSoviet UnionSpaniardSpanishSpanish AmericanSpanish American IndianSri LankanSubsaharan AfricanSudaneseSwedishSwissSyrianTaiwaneseThaiTlingit-HaidaTohono O'OdhamTonganTrinidadian and TobagonianTsimshianTurkishU.S. Virgin IslanderUgandanUkrainianUruguayanUteVenezuelanVietnameseWelshWest IndianYakamaYaquiYugoslavianYumanYup'ikZimbabwean
Immigration
NonimmigrantsImmigrantsAfghanistanAfricaAlbaniaArgentinaArmeniaAsiaAustraliaAustriaBahamasBangladeshBarbadosBelarusBelgiumBelizeBoliviaBosnia and HerzegovinaBrazilBulgariaBurma/MyanmarCabo VerdeCambodiaCameroonCanadaCaribbeanCentral AmericaChileChinaColombiaCongoCosta RicaCroatiaCubaCzechoslovakiaDenmarkDominicaDominican RepublicEastern AfricaEastern AsiaEastern EuropeEcuadorEgyptEl SalvadorEnglandEritreaEthiopiaEuropeFijiFranceGermanyGhanaGreeceGrenadaGuatemalaGuyanaHaitiHondurasHong KongHungaryIndiaIndonesiaIranIraqIrelandIsraelItalyJamaicaJapanJordanKazakhstanKenyaKoreaKuwaitLaosLatin AmericaLatviaLebanonLiberiaLithuaniaMalaysiaMexicoMicronesiaMiddle AfricaMoldovaMoroccoNepalNetherlandsNicaraguaNigeriaNorth AmericaNorth MacedoniaNorthern AfricaNorthern EuropeNorwayOceaniaPakistanPanamaPeruPhilippinesPolandPortugalRomaniaRussiaSaudi ArabiaScotlandSenegalSerbiaSierra LeoneSingaporeSomaliaSouth AfricaSouth AmericaSouth Central AsiaSouth Eastern AsiaSouthern EuropeSpainSri LankaSt. Vincent and the GrenadinesSudanSwedenSwitzerlandSyriaTaiwanThailandTrinidad and TobagoTurkeyUgandaUkraineUruguayUzbekistanVenezuelaVietnamWest IndiesWestern AfricaWestern AsiaWestern EuropeYemenZaireZimbabweAzores
Single Mother Households
Income
Poverty
Unemployment
Labor Participation
Family Structure
Vehicle Availability
Education Level
Disability

Single Mother Households Comparison

Scotch-Irish

Cree

Excellent
Poor
6.0%
SINGLE MOTHER HOUSEHOLDS
82.0/ 100
METRIC RATING
148th/ 347
METRIC RANK
6.7%
SINGLE MOTHER HOUSEHOLDS
11.9/ 100
METRIC RATING
205th/ 347
METRIC RANK

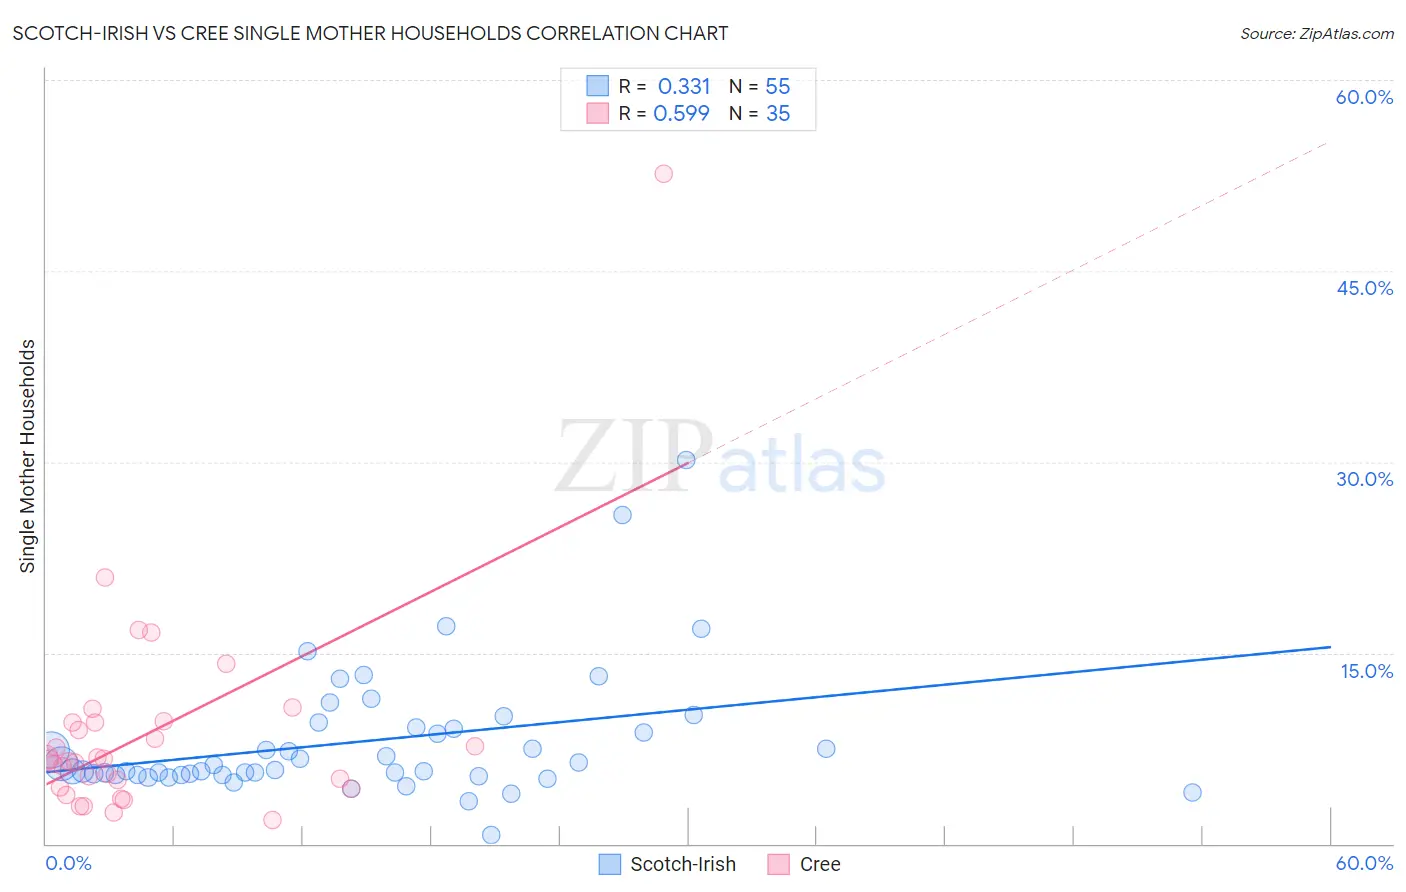
Scotch-Irish vs Cree Single Mother Households Correlation Chart

The statistical analysis conducted on geographies consisting of 544,486,743 people shows a mild positive correlation between the proportion of Scotch-Irish and percentage of single mother households in the United States with a correlation coefficient (R) of 0.331 and weighted average of 6.0%. Similarly, the statistical analysis conducted on geographies consisting of 76,173,088 people shows a substantial positive correlation between the proportion of Cree and percentage of single mother households in the United States with a correlation coefficient (R) of 0.599 and weighted average of 6.7%, a difference of 10.1%.
Scotch-Irish vs Cree Single Mother Households

Single Mother Households Correlation Summary

MeasurementScotch-IrishCree
Minimum0.72%1.9%
Maximum30.1%52.6%
Range29.4%50.8%
Mean8.1%8.7%
Median5.8%6.6%
Interquartile 25% (IQ1)5.4%4.4%
Interquartile 75% (IQ3)9.1%9.5%
Interquartile Range (IQR)3.7%5.1%
Standard Deviation (Sample)5.1%8.7%
Standard Deviation (Population)5.1%8.6%

Similar Demographics by Single Mother Households

Demographics Similar to Scotch-Irish by Single Mother Households

In terms of single mother households, the demographic groups most similar to Scotch-Irish are Immigrants from Jordan (6.0%, a difference of 0.050%), Immigrants from Albania (6.1%, a difference of 0.10%), French Canadian (6.0%, a difference of 0.11%), Zimbabwean (6.1%, a difference of 0.24%), and Immigrants from Southern Europe (6.1%, a difference of 0.30%).
DemographicsRating | RankSingle Mother Households
Tsimshian
85.2
/100
|
#141
Excellent
6.0%
Immigrants | Egypt
85.0
/100
|
#142
Excellent
6.0%
Immigrants | Iraq
84.8
/100
|
#143
Excellent
6.0%
Koreans
84.4
/100
|
#144
Excellent
6.0%
Arabs
84.0
/100
|
#145
Excellent
6.0%
French Canadians
82.6
/100
|
#146
Excellent
6.0%
Immigrants | Jordan
82.3
/100
|
#147
Excellent
6.0%
Scotch-Irish
82.0
/100
|
#148
Excellent
6.0%
Immigrants | Albania
81.5
/100
|
#149
Excellent
6.1%
Zimbabweans
80.7
/100
|
#150
Excellent
6.1%
Immigrants | Southern Europe
80.5
/100
|
#151
Excellent
6.1%
Pakistanis
79.2
/100
|
#152
Good
6.1%
Immigrants | Brazil
78.9
/100
|
#153
Good
6.1%
Immigrants | Philippines
78.5
/100
|
#154
Good
6.1%
Whites/Caucasians
76.5
/100
|
#155
Good
6.1%

Demographics Similar to Cree by Single Mother Households

In terms of single mother households, the demographic groups most similar to Cree are Immigrants from Fiji (6.7%, a difference of 0.020%), Immigrants from Peru (6.7%, a difference of 0.030%), German Russian (6.7%, a difference of 0.080%), Immigrants from South America (6.7%, a difference of 0.080%), and Guamanian/Chamorro (6.6%, a difference of 0.13%).
DemographicsRating | RankSingle Mother Households
Hawaiians
16.1
/100
|
#198
Poor
6.6%
Potawatomi
15.5
/100
|
#199
Poor
6.6%
Immigrants | Ethiopia
14.7
/100
|
#200
Poor
6.6%
Venezuelans
12.9
/100
|
#201
Poor
6.6%
Guamanians/Chamorros
12.4
/100
|
#202
Poor
6.6%
Immigrants | Peru
12.0
/100
|
#203
Poor
6.7%
Immigrants | Fiji
11.9
/100
|
#204
Poor
6.7%
Cree
11.9
/100
|
#205
Poor
6.7%
German Russians
11.5
/100
|
#206
Poor
6.7%
Immigrants | South America
11.5
/100
|
#207
Poor
6.7%
Vietnamese
11.3
/100
|
#208
Poor
6.7%
Immigrants | Colombia
10.5
/100
|
#209
Poor
6.7%
Immigrants | Nonimmigrants
10.4
/100
|
#210
Poor
6.7%
Immigrants | Venezuela
8.5
/100
|
#211
Tragic
6.7%
Immigrants | Eritrea
8.4
/100
|
#212
Tragic
6.7%