Spaniard vs Potawatomi Female Disability
COMPARE
Spaniard
Potawatomi
Female Disability
Female Disability Comparison
Spaniards
Potawatomi
12.8%
FEMALE DISABILITY
0.7/ 100
METRIC RATING
263rd/ 347
METRIC RANK
14.1%
FEMALE DISABILITY
0.0/ 100
METRIC RATING
321st/ 347
METRIC RANK
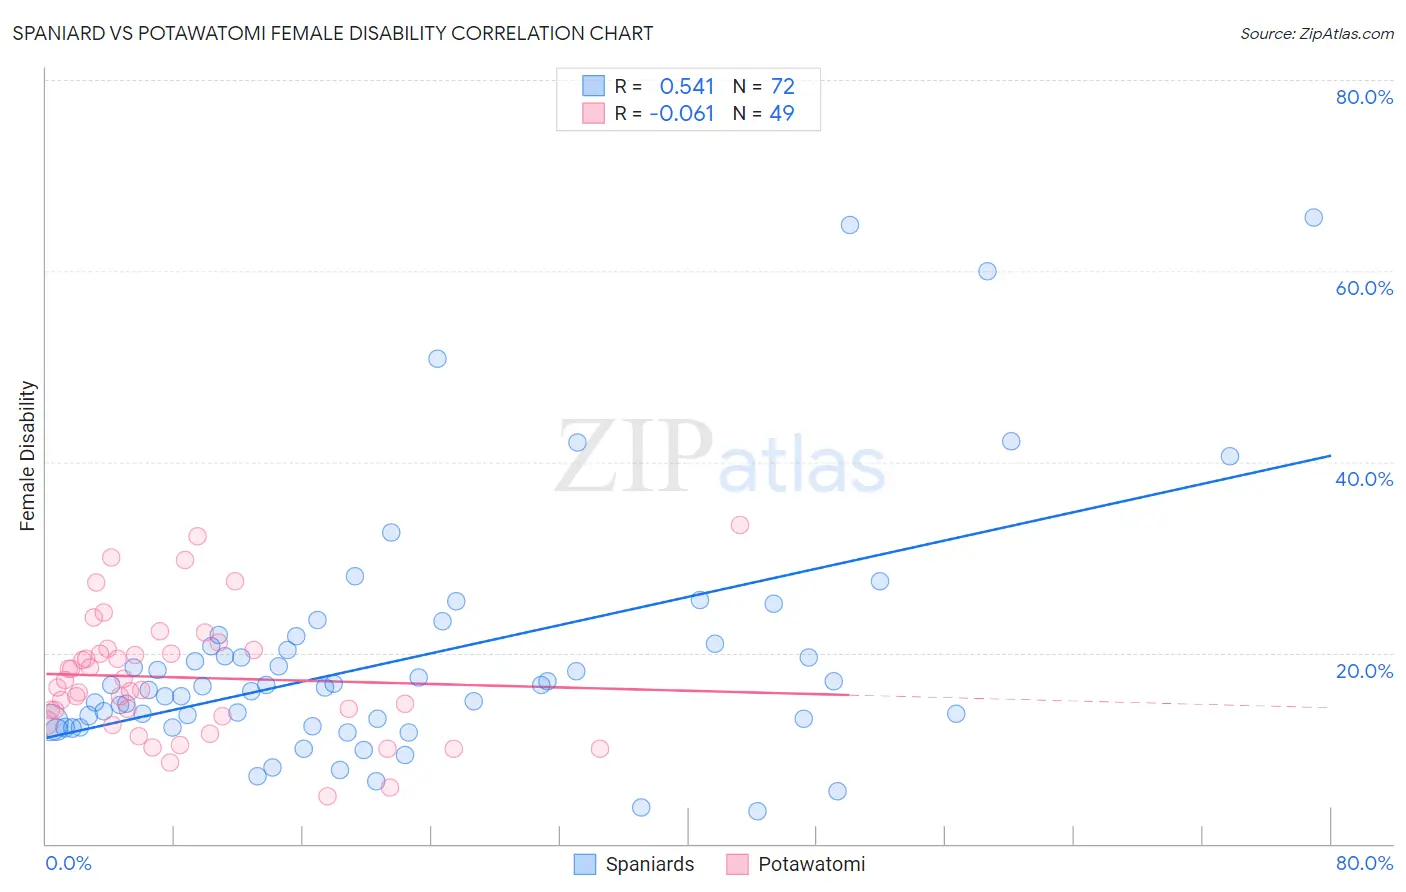
Spaniard vs Potawatomi Female Disability Correlation Chart
The statistical analysis conducted on geographies consisting of 443,418,073 people shows a substantial positive correlation between the proportion of Spaniards and percentage of females with a disability in the United States with a correlation coefficient (R) of 0.541 and weighted average of 12.8%. Similarly, the statistical analysis conducted on geographies consisting of 117,767,381 people shows a slight negative correlation between the proportion of Potawatomi and percentage of females with a disability in the United States with a correlation coefficient (R) of -0.061 and weighted average of 14.1%, a difference of 10.6%.
Female Disability Correlation Summary
| Measurement | Spaniard | Potawatomi |
| Minimum | 3.4% | 5.0% |
| Maximum | 65.6% | 33.3% |
| Range | 62.2% | 28.3% |
| Mean | 19.4% | 17.4% |
| Median | 16.4% | 16.3% |
| Interquartile 25% (IQ1) | 12.5% | 13.0% |
| Interquartile 75% (IQ3) | 20.8% | 20.3% |
| Interquartile Range (IQR) | 8.3% | 7.3% |
| Standard Deviation (Sample) | 12.6% | 6.5% |
| Standard Deviation (Population) | 12.5% | 6.4% |
Similar Demographics by Female Disability
Demographics Similar to Spaniards by Female Disability
In terms of female disability, the demographic groups most similar to Spaniards are Alaska Native (12.8%, a difference of 0.12%), Czechoslovakian (12.7%, a difference of 0.23%), Bermudan (12.7%, a difference of 0.30%), West Indian (12.8%, a difference of 0.31%), and Subsaharan African (12.7%, a difference of 0.34%).
| Demographics | Rating | Rank | Female Disability |
| British West Indians | 1.2 /100 | #256 | Tragic 12.7% |
| Liberians | 1.1 /100 | #257 | Tragic 12.7% |
| Aleuts | 1.1 /100 | #258 | Tragic 12.7% |
| Immigrants | Armenia | 1.0 /100 | #259 | Tragic 12.7% |
| Sub-Saharan Africans | 1.0 /100 | #260 | Tragic 12.7% |
| Bermudans | 1.0 /100 | #261 | Tragic 12.7% |
| Czechoslovakians | 0.9 /100 | #262 | Tragic 12.7% |
| Spaniards | 0.7 /100 | #263 | Tragic 12.8% |
| Alaska Natives | 0.6 /100 | #264 | Tragic 12.8% |
| West Indians | 0.5 /100 | #265 | Tragic 12.8% |
| Finns | 0.4 /100 | #266 | Tragic 12.8% |
| Senegalese | 0.4 /100 | #267 | Tragic 12.8% |
| Immigrants | Laos | 0.4 /100 | #268 | Tragic 12.8% |
| Indonesians | 0.4 /100 | #269 | Tragic 12.8% |
| Immigrants | Liberia | 0.3 /100 | #270 | Tragic 12.9% |
Demographics Similar to Potawatomi by Female Disability
In terms of female disability, the demographic groups most similar to Potawatomi are Pueblo (14.1%, a difference of 0.010%), American (14.1%, a difference of 0.14%), Black/African American (14.1%, a difference of 0.18%), Native/Alaskan (14.1%, a difference of 0.20%), and Navajo (14.2%, a difference of 0.33%).
| Demographics | Rating | Rank | Female Disability |
| Puget Sound Salish | 0.0 /100 | #314 | Tragic 13.8% |
| Alaskan Athabascans | 0.0 /100 | #315 | Tragic 13.9% |
| Spanish Americans | 0.0 /100 | #316 | Tragic 14.0% |
| Chippewa | 0.0 /100 | #317 | Tragic 14.0% |
| Paiute | 0.0 /100 | #318 | Tragic 14.0% |
| Iroquois | 0.0 /100 | #319 | Tragic 14.0% |
| Americans | 0.0 /100 | #320 | Tragic 14.1% |
| Potawatomi | 0.0 /100 | #321 | Tragic 14.1% |
| Pueblo | 0.0 /100 | #322 | Tragic 14.1% |
| Blacks/African Americans | 0.0 /100 | #323 | Tragic 14.1% |
| Natives/Alaskans | 0.0 /100 | #324 | Tragic 14.1% |
| Navajo | 0.0 /100 | #325 | Tragic 14.2% |
| Comanche | 0.0 /100 | #326 | Tragic 14.2% |
| Ottawa | 0.0 /100 | #327 | Tragic 14.2% |
| Cape Verdeans | 0.0 /100 | #328 | Tragic 14.2% |