Cities with the Largest Northern European Community in Washington
RELATED REPORTS & OPTIONS
Northern European
Washington
Compare Cities
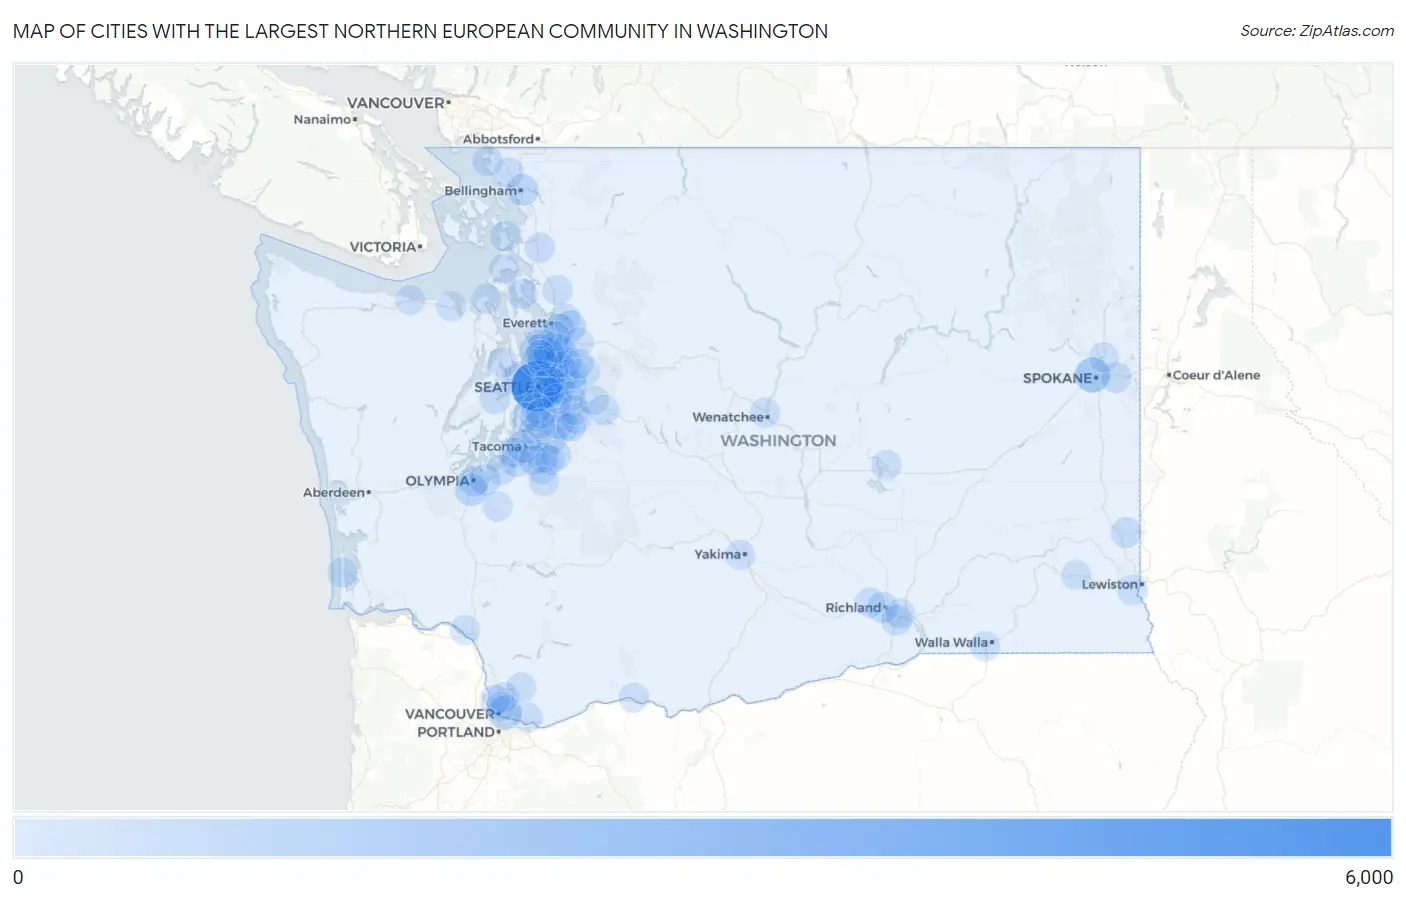
Map of Cities with the Largest Northern European Community in Washington
0
6,000
Cities with the Largest Northern European Community in Washington
| City | Northern European | vs State | vs National | |
| 1. | Seattle | 5,590 | 36,418(15.35%)#1 | 487,800(1.15%)#1 |
| 2. | Spokane | 1,420 | 36,418(3.90%)#2 | 487,800(0.29%)#19 |
| 3. | Vancouver | 1,052 | 36,418(2.89%)#3 | 487,800(0.22%)#25 |
| 4. | Tacoma | 937 | 36,418(2.57%)#4 | 487,800(0.19%)#31 |
| 5. | Kirkland | 676 | 36,418(1.86%)#5 | 487,800(0.14%)#56 |
| 6. | Tumwater | 614 | 36,418(1.69%)#6 | 487,800(0.13%)#65 |
| 7. | Bellingham | 550 | 36,418(1.51%)#7 | 487,800(0.11%)#71 |
| 8. | Everett | 511 | 36,418(1.40%)#8 | 487,800(0.10%)#79 |
| 9. | Bellevue | 508 | 36,418(1.39%)#9 | 487,800(0.10%)#81 |
| 10. | Renton | 471 | 36,418(1.29%)#10 | 487,800(0.10%)#91 |
| 11. | Sammamish | 424 | 36,418(1.16%)#11 | 487,800(0.09%)#116 |
| 12. | Kent | 393 | 36,418(1.08%)#12 | 487,800(0.08%)#133 |
| 13. | Kenmore | 392 | 36,418(1.08%)#13 | 487,800(0.08%)#134 |
| 14. | Bothell | 369 | 36,418(1.01%)#14 | 487,800(0.08%)#145 |
| 15. | Lakewood | 342 | 36,418(0.94%)#15 | 487,800(0.07%)#164 |
| 16. | Lacey | 337 | 36,418(0.93%)#16 | 487,800(0.07%)#169 |
| 17. | Bainbridge Island | 320 | 36,418(0.88%)#17 | 487,800(0.07%)#179 |
| 18. | Richland | 312 | 36,418(0.86%)#18 | 487,800(0.06%)#189 |
| 19. | Redmond | 301 | 36,418(0.83%)#19 | 487,800(0.06%)#198 |
| 20. | Shoreline | 293 | 36,418(0.80%)#20 | 487,800(0.06%)#211 |
| 21. | Olympia | 289 | 36,418(0.79%)#21 | 487,800(0.06%)#216 |
| 22. | Edmonds | 288 | 36,418(0.79%)#22 | 487,800(0.06%)#219 |
| 23. | Auburn | 272 | 36,418(0.75%)#23 | 487,800(0.06%)#238 |
| 24. | Kennewick | 269 | 36,418(0.74%)#24 | 487,800(0.06%)#243 |
| 25. | Spokane Valley | 264 | 36,418(0.72%)#25 | 487,800(0.05%)#249 |
| 26. | Pullman | 254 | 36,418(0.70%)#26 | 487,800(0.05%)#263 |
| 27. | Lake Stevens | 236 | 36,418(0.65%)#27 | 487,800(0.05%)#287 |
| 28. | Bremerton | 222 | 36,418(0.61%)#28 | 487,800(0.05%)#306 |
| 29. | Fobes Hill | 210 | 36,418(0.58%)#29 | 487,800(0.04%)#332 |
| 30. | Federal Way | 206 | 36,418(0.57%)#30 | 487,800(0.04%)#339 |
| 31. | Covington | 204 | 36,418(0.56%)#31 | 487,800(0.04%)#344 |
| 32. | Hobart | 197 | 36,418(0.54%)#32 | 487,800(0.04%)#361 |
| 33. | Union Hill Novelty Hill | 195 | 36,418(0.54%)#33 | 487,800(0.04%)#365 |
| 34. | Anacortes | 191 | 36,418(0.52%)#34 | 487,800(0.04%)#374 |
| 35. | University Place | 188 | 36,418(0.52%)#35 | 487,800(0.04%)#384 |
| 36. | North Lynnwood | 180 | 36,418(0.49%)#36 | 487,800(0.04%)#399 |
| 37. | Mount Vista | 177 | 36,418(0.49%)#37 | 487,800(0.04%)#407 |
| 38. | Camano | 173 | 36,418(0.48%)#38 | 487,800(0.04%)#421 |
| 39. | Issaquah | 167 | 36,418(0.46%)#39 | 487,800(0.03%)#441 |
| 40. | Maltby | 166 | 36,418(0.46%)#40 | 487,800(0.03%)#449 |
| 41. | Normandy Park | 166 | 36,418(0.46%)#41 | 487,800(0.03%)#450 |
| 42. | Clarkston Heights Vineland | 163 | 36,418(0.45%)#42 | 487,800(0.03%)#460 |
| 43. | Birch Bay | 154 | 36,418(0.42%)#43 | 487,800(0.03%)#491 |
| 44. | South Hill | 150 | 36,418(0.41%)#44 | 487,800(0.03%)#508 |
| 45. | Burien | 149 | 36,418(0.41%)#45 | 487,800(0.03%)#514 |
| 46. | Cottage Lake | 148 | 36,418(0.41%)#46 | 487,800(0.03%)#520 |
| 47. | Mercer Island | 147 | 36,418(0.40%)#47 | 487,800(0.03%)#526 |
| 48. | Bothell West | 137 | 36,418(0.38%)#48 | 487,800(0.03%)#578 |
| 49. | Puyallup | 131 | 36,418(0.36%)#49 | 487,800(0.03%)#597 |
| 50. | Arlington | 130 | 36,418(0.36%)#50 | 487,800(0.03%)#608 |
| 51. | Ferndale | 129 | 36,418(0.35%)#51 | 487,800(0.03%)#615 |
| 52. | Riverbend | 129 | 36,418(0.35%)#52 | 487,800(0.03%)#618 |
| 53. | Ocean Park | 128 | 36,418(0.35%)#53 | 487,800(0.03%)#625 |
| 54. | Woodinville | 123 | 36,418(0.34%)#54 | 487,800(0.03%)#657 |
| 55. | Bonney Lake | 122 | 36,418(0.33%)#55 | 487,800(0.03%)#664 |
| 56. | Poulsbo | 117 | 36,418(0.32%)#56 | 487,800(0.02%)#697 |
| 57. | Felida | 116 | 36,418(0.32%)#57 | 487,800(0.02%)#709 |
| 58. | Mill Creek East | 115 | 36,418(0.32%)#58 | 487,800(0.02%)#713 |
| 59. | Dupont | 113 | 36,418(0.31%)#59 | 487,800(0.02%)#723 |
| 60. | Mount Vernon | 111 | 36,418(0.30%)#60 | 487,800(0.02%)#738 |
| 61. | Vashon | 109 | 36,418(0.30%)#61 | 487,800(0.02%)#751 |
| 62. | Lynnwood | 107 | 36,418(0.29%)#62 | 487,800(0.02%)#764 |
| 63. | Clearview | 105 | 36,418(0.29%)#63 | 487,800(0.02%)#787 |
| 64. | Longview | 104 | 36,418(0.29%)#64 | 487,800(0.02%)#791 |
| 65. | Moses Lake | 101 | 36,418(0.28%)#65 | 487,800(0.02%)#817 |
| 66. | Maple Valley | 100 | 36,418(0.27%)#66 | 487,800(0.02%)#828 |
| 67. | Wenatchee | 98 | 36,418(0.27%)#67 | 487,800(0.02%)#840 |
| 68. | Fairwood Cdp King County | 97 | 36,418(0.27%)#68 | 487,800(0.02%)#850 |
| 69. | Eastmont | 96 | 36,418(0.26%)#69 | 487,800(0.02%)#855 |
| 70. | Summit | 96 | 36,418(0.26%)#70 | 487,800(0.02%)#858 |
| 71. | Camas | 94 | 36,418(0.26%)#71 | 487,800(0.02%)#878 |
| 72. | Lake Marcel Stillwater | 94 | 36,418(0.26%)#72 | 487,800(0.02%)#885 |
| 73. | Seatac | 93 | 36,418(0.26%)#73 | 487,800(0.02%)#889 |
| 74. | Des Moines | 84 | 36,418(0.23%)#74 | 487,800(0.02%)#997 |
| 75. | Lake Forest Park | 84 | 36,418(0.23%)#75 | 487,800(0.02%)#1,001 |
| 76. | Newcastle | 80 | 36,418(0.22%)#76 | 487,800(0.02%)#1,056 |
| 77. | Alderton | 80 | 36,418(0.22%)#77 | 487,800(0.02%)#1,059 |
| 78. | West Richland | 79 | 36,418(0.22%)#78 | 487,800(0.02%)#1,068 |
| 79. | Sequim | 78 | 36,418(0.21%)#79 | 487,800(0.02%)#1,086 |
| 80. | Snoqualmie | 77 | 36,418(0.21%)#80 | 487,800(0.02%)#1,101 |
| 81. | Yakima | 74 | 36,418(0.20%)#81 | 487,800(0.02%)#1,133 |
| 82. | Port Townsend | 73 | 36,418(0.20%)#82 | 487,800(0.01%)#1,152 |
| 83. | College Place | 73 | 36,418(0.20%)#83 | 487,800(0.01%)#1,153 |
| 84. | Pomeroy | 72 | 36,418(0.20%)#84 | 487,800(0.01%)#1,167 |
| 85. | Monroe | 69 | 36,418(0.19%)#85 | 487,800(0.01%)#1,205 |
| 86. | Tehaleh | 69 | 36,418(0.19%)#86 | 487,800(0.01%)#1,212 |
| 87. | Rainier | 69 | 36,418(0.19%)#87 | 487,800(0.01%)#1,215 |
| 88. | Mukilteo | 68 | 36,418(0.19%)#88 | 487,800(0.01%)#1,224 |
| 89. | Venersborg | 68 | 36,418(0.19%)#89 | 487,800(0.01%)#1,229 |
| 90. | Mirrormont | 68 | 36,418(0.19%)#90 | 487,800(0.01%)#1,230 |
| 91. | Oak Harbor | 67 | 36,418(0.18%)#91 | 487,800(0.01%)#1,240 |
| 92. | Hazel Dell | 67 | 36,418(0.18%)#92 | 487,800(0.01%)#1,241 |
| 93. | Port Angeles | 67 | 36,418(0.18%)#93 | 487,800(0.01%)#1,242 |
| 94. | Graham | 61 | 36,418(0.17%)#94 | 487,800(0.01%)#1,344 |
| 95. | Mead | 61 | 36,418(0.17%)#95 | 487,800(0.01%)#1,353 |
| 96. | Clyde Hill | 60 | 36,418(0.16%)#96 | 487,800(0.01%)#1,383 |
| 97. | Mountlake Terrace | 59 | 36,418(0.16%)#97 | 487,800(0.01%)#1,392 |
| 98. | Duvall | 59 | 36,418(0.16%)#98 | 487,800(0.01%)#1,398 |
| 99. | White Salmon | 59 | 36,418(0.16%)#99 | 487,800(0.01%)#1,402 |
| 100. | Pasco | 58 | 36,418(0.16%)#100 | 487,800(0.01%)#1,405 |
Common Questions
What are the Top 10 Cities with the Largest Northern European Community in Washington?
Top 10 Cities with the Largest Northern European Community in Washington are:
What city has the Largest Northern European Community in Washington?
Seattle has the Largest Northern European Community in Washington with 5,590.
What is the Total Northern European Population in the State of Washington?
Total Northern European Population in Washington is 36,418.
What is the Total Northern European Population in the United States?
Total Northern European Population in the United States is 487,800.