Burien, WA
Burien Map
Burien Overview
51,505
TOTAL POPULATION
26,601
MALE POPULATION
24,904
FEMALE POPULATION
106.81
MALES / 100 FEMALES
93.62
FEMALES / 100 MALES
39.5
MEDIAN AGE
3.2
AVG FAMILY SIZE
2.6
AVG HOUSEHOLD SIZE
$46,834
PER CAPITA INCOME
$99,734
AVG FAMILY INCOME
$84,583
AVG HOUSEHOLD INCOME
19.0%
WAGE / INCOME GAP [ % ]
81.0¢/ $1
WAGE / INCOME GAP [ $ ]
$10,962
FAMILY INCOME DEFICIT
0.46
INEQUALITY / GINI INDEX
28,666
LABOR FORCE [ PEOPLE ]
67.9%
PERCENT IN LABOR FORCE
4.8%
UNEMPLOYMENT RATE
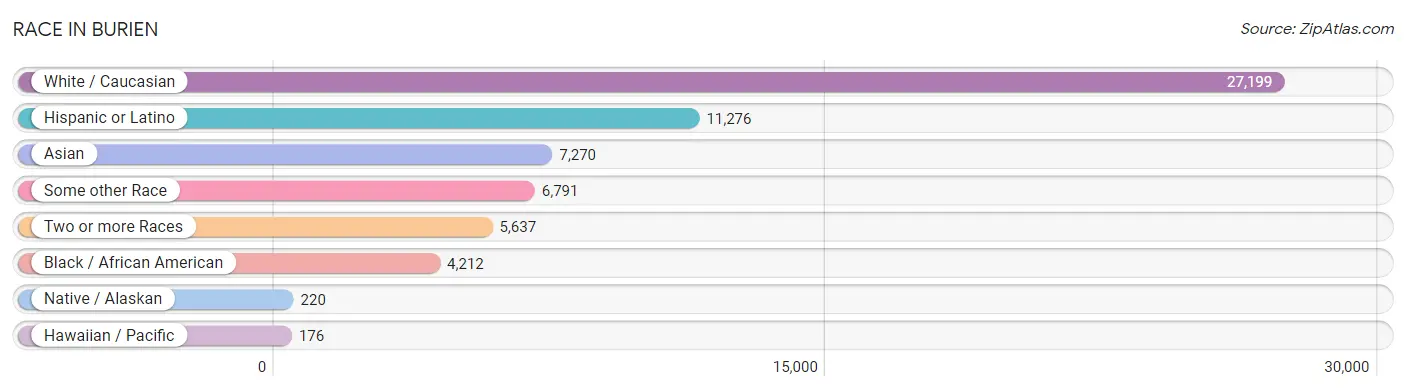
Race in Burien
The most populous races in Burien are White / Caucasian (27,199 | 52.8%), Hispanic or Latino (11,276 | 21.9%), and Asian (7,270 | 14.1%).
| Race | # Population | % Population |
| Asian | 7,270 | 14.1% |
| Black / African American | 4,212 | 8.2% |
| Hawaiian / Pacific | 176 | 0.3% |
| Hispanic or Latino | 11,276 | 21.9% |
| Native / Alaskan | 220 | 0.4% |
| White / Caucasian | 27,199 | 52.8% |
| Two or more Races | 5,637 | 10.9% |
| Some other Race | 6,791 | 13.2% |
| Total | 51,505 | 100.0% |
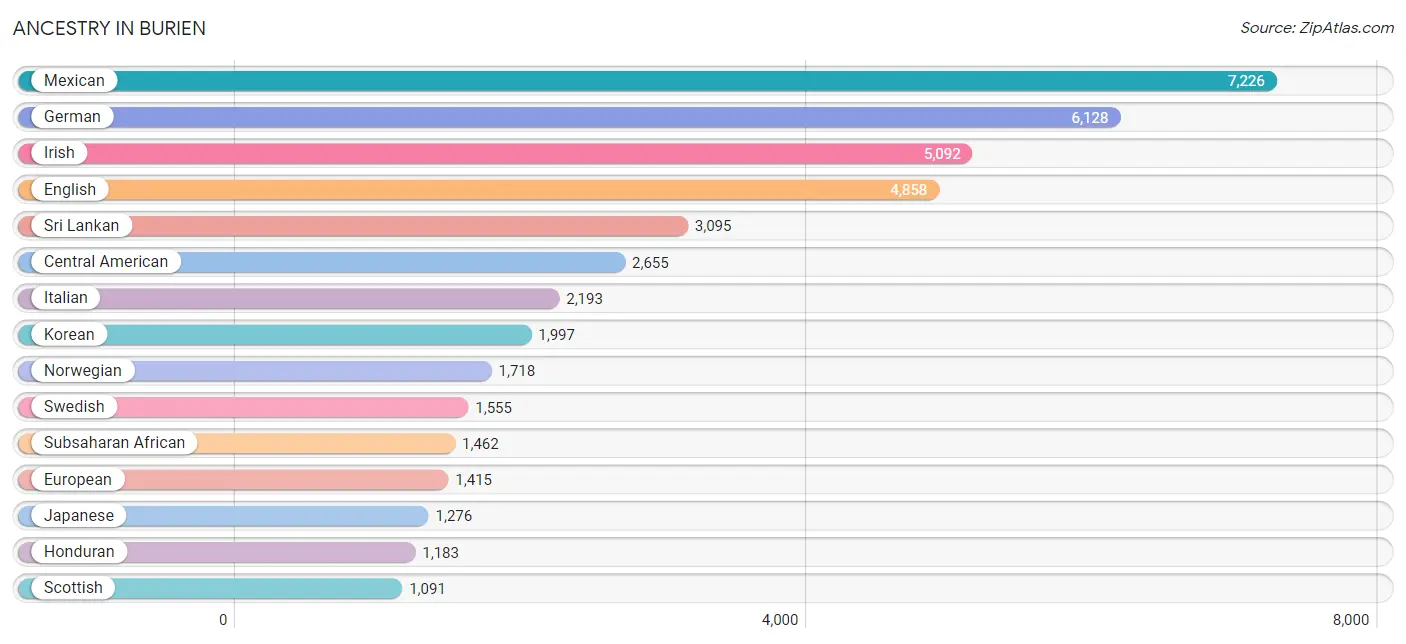
Ancestry in Burien
The most populous ancestries reported in Burien are Mexican (7,226 | 14.0%), German (6,128 | 11.9%), Irish (5,092 | 9.9%), English (4,858 | 9.4%), and Sri Lankan (3,095 | 6.0%), together accounting for 51.3% of all Burien residents.
| Ancestry | # Population | % Population |
| Afghan | 103 | 0.2% |
| African | 206 | 0.4% |
| Alaskan Athabascan | 11 | 0.0% |
| American | 1,027 | 2.0% |
| Arab | 593 | 1.1% |
| Armenian | 88 | 0.2% |
| Australian | 20 | 0.0% |
| Austrian | 119 | 0.2% |
| Bangladeshi | 78 | 0.2% |
| Belgian | 86 | 0.2% |
| Belizean | 22 | 0.0% |
| Bhutanese | 532 | 1.0% |
| Blackfeet | 140 | 0.3% |
| Bolivian | 140 | 0.3% |
| British | 418 | 0.8% |
| Bulgarian | 42 | 0.1% |
| Burmese | 505 | 1.0% |
| Canadian | 33 | 0.1% |
| Central American | 2,655 | 5.1% |
| Central American Indian | 56 | 0.1% |
| Cherokee | 240 | 0.5% |
| Chippewa | 84 | 0.2% |
| Choctaw | 19 | 0.0% |
| Colombian | 87 | 0.2% |
| Comanche | 13 | 0.0% |
| Cree | 14 | 0.0% |
| Croatian | 89 | 0.2% |
| Cuban | 21 | 0.0% |
| Czech | 140 | 0.3% |
| Czechoslovakian | 19 | 0.0% |
| Danish | 277 | 0.5% |
| Delaware | 18 | 0.0% |
| Dominican | 9 | 0.0% |
| Dutch | 712 | 1.4% |
| Eastern European | 207 | 0.4% |
| Ecuadorian | 21 | 0.0% |
| English | 4,858 | 9.4% |
| Ethiopian | 828 | 1.6% |
| European | 1,415 | 2.8% |
| Fijian | 7 | 0.0% |
| Filipino | 63 | 0.1% |
| Finnish | 164 | 0.3% |
| French | 966 | 1.9% |
| French American Indian | 40 | 0.1% |
| French Canadian | 243 | 0.5% |
| German | 6,128 | 11.9% |
| Greek | 109 | 0.2% |
| Guamanian / Chamorro | 232 | 0.4% |
| Guatemalan | 551 | 1.1% |
| Haitian | 9 | 0.0% |
| Honduran | 1,183 | 2.3% |
| Hungarian | 63 | 0.1% |
| Icelander | 66 | 0.1% |
| Indian (Asian) | 799 | 1.5% |
| Indonesian | 12 | 0.0% |
| Inupiat | 5 | 0.0% |
| Iranian | 116 | 0.2% |
| Iraqi | 22 | 0.0% |
| Irish | 5,092 | 9.9% |
| Iroquois | 9 | 0.0% |
| Italian | 2,193 | 4.3% |
| Jamaican | 2 | 0.0% |
| Japanese | 1,276 | 2.5% |
| Kenyan | 21 | 0.0% |
| Korean | 1,997 | 3.9% |
| Laotian | 47 | 0.1% |
| Lebanese | 27 | 0.1% |
| Lithuanian | 90 | 0.2% |
| Malaysian | 59 | 0.1% |
| Marshallese | 8 | 0.0% |
| Mexican | 7,226 | 14.0% |
| Mexican American Indian | 84 | 0.2% |
| Mongolian | 29 | 0.1% |
| Moroccan | 445 | 0.9% |
| Native Hawaiian | 79 | 0.2% |
| Nepalese | 93 | 0.2% |
| Nicaraguan | 80 | 0.2% |
| Nigerian | 61 | 0.1% |
| Northern European | 149 | 0.3% |
| Norwegian | 1,718 | 3.3% |
| Pakistani | 131 | 0.3% |
| Palestinian | 13 | 0.0% |
| Pennsylvania German | 9 | 0.0% |
| Peruvian | 52 | 0.1% |
| Polish | 667 | 1.3% |
| Portuguese | 189 | 0.4% |
| Puerto Rican | 386 | 0.7% |
| Puget Sound Salish | 91 | 0.2% |
| Romanian | 108 | 0.2% |
| Russian | 361 | 0.7% |
| Salvadoran | 841 | 1.6% |
| Samoan | 201 | 0.4% |
| Scandinavian | 595 | 1.2% |
| Scotch-Irish | 563 | 1.1% |
| Scottish | 1,091 | 2.1% |
| Sioux | 60 | 0.1% |
| Slovak | 19 | 0.0% |
| Slovene | 28 | 0.1% |
| Somali | 354 | 0.7% |
| South American | 353 | 0.7% |
| Spaniard | 190 | 0.4% |
| Spanish | 264 | 0.5% |
| Sri Lankan | 3,095 | 6.0% |
| Subsaharan African | 1,462 | 2.8% |
| Swedish | 1,555 | 3.0% |
| Swiss | 97 | 0.2% |
| Syrian | 7 | 0.0% |
| Thai | 495 | 1.0% |
| Tlingit-Haida | 197 | 0.4% |
| Ukrainian | 135 | 0.3% |
| Venezuelan | 53 | 0.1% |
| Welsh | 471 | 0.9% |
| Yakama | 39 | 0.1% |
| Yugoslavian | 160 | 0.3% | View All 114 Rows |
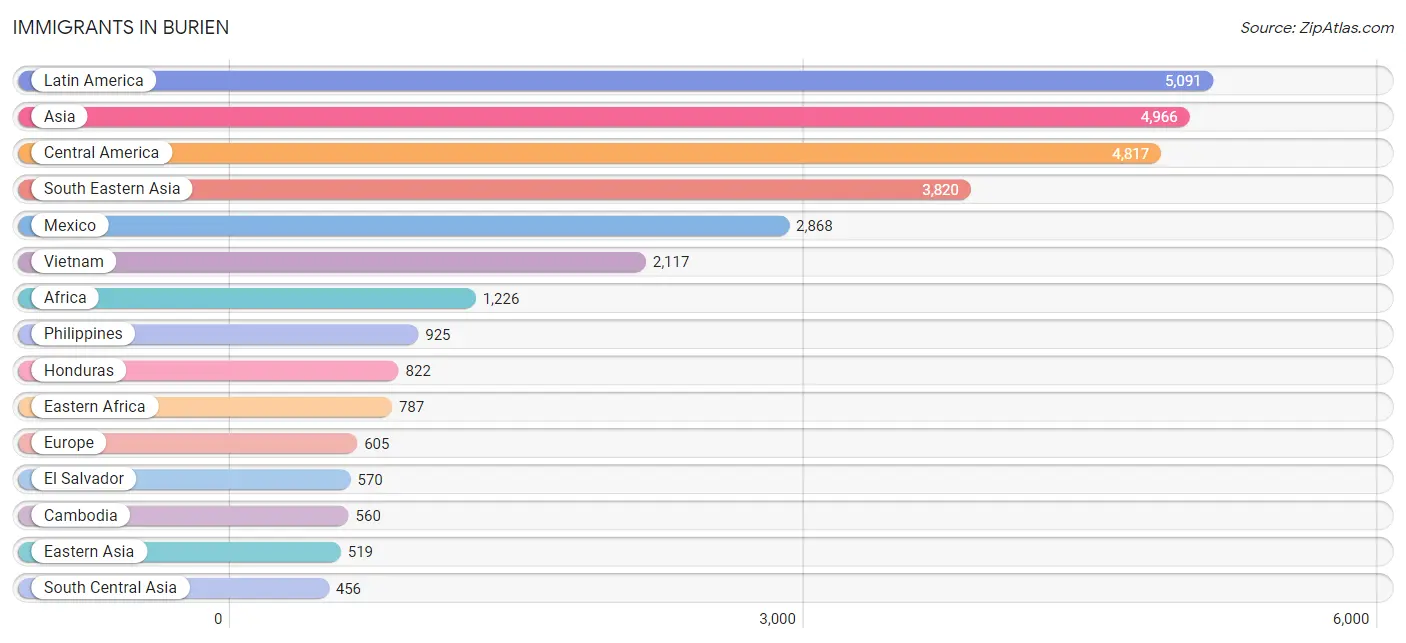
Immigrants in Burien
The most numerous immigrant groups reported in Burien came from Latin America (5,091 | 9.9%), Asia (4,966 | 9.6%), Central America (4,817 | 9.3%), South Eastern Asia (3,820 | 7.4%), and Mexico (2,868 | 5.6%), together accounting for 41.9% of all Burien residents.
| Immigration Origin | # Population | % Population |
| Afghanistan | 34 | 0.1% |
| Africa | 1,226 | 2.4% |
| Argentina | 23 | 0.0% |
| Asia | 4,966 | 9.6% |
| Austria | 11 | 0.0% |
| Belgium | 9 | 0.0% |
| Belize | 22 | 0.0% |
| Bolivia | 54 | 0.1% |
| Bosnia and Herzegovina | 104 | 0.2% |
| Bulgaria | 42 | 0.1% |
| Cambodia | 560 | 1.1% |
| Canada | 117 | 0.2% |
| Caribbean | 21 | 0.0% |
| Central America | 4,817 | 9.3% |
| China | 202 | 0.4% |
| Colombia | 60 | 0.1% |
| Congo | 7 | 0.0% |
| Cuba | 12 | 0.0% |
| Czechoslovakia | 23 | 0.0% |
| Eastern Africa | 787 | 1.5% |
| Eastern Asia | 519 | 1.0% |
| Eastern Europe | 332 | 0.6% |
| El Salvador | 570 | 1.1% |
| England | 23 | 0.0% |
| Eritrea | 57 | 0.1% |
| Ethiopia | 426 | 0.8% |
| Europe | 605 | 1.2% |
| Fiji | 76 | 0.2% |
| Germany | 96 | 0.2% |
| Guatemala | 455 | 0.9% |
| Haiti | 9 | 0.0% |
| Honduras | 822 | 1.6% |
| Hungary | 19 | 0.0% |
| India | 247 | 0.5% |
| Indonesia | 63 | 0.1% |
| Iran | 113 | 0.2% |
| Iraq | 43 | 0.1% |
| Ireland | 59 | 0.1% |
| Israel | 12 | 0.0% |
| Italy | 10 | 0.0% |
| Japan | 108 | 0.2% |
| Kenya | 101 | 0.2% |
| Korea | 209 | 0.4% |
| Kuwait | 27 | 0.1% |
| Laos | 88 | 0.2% |
| Latin America | 5,091 | 9.9% |
| Malaysia | 4 | 0.0% |
| Mexico | 2,868 | 5.6% |
| Micronesia | 8 | 0.0% |
| Middle Africa | 7 | 0.0% |
| Morocco | 350 | 0.7% |
| Nepal | 29 | 0.1% |
| Netherlands | 15 | 0.0% |
| Nicaragua | 80 | 0.2% |
| Nigeria | 74 | 0.1% |
| Northern Africa | 350 | 0.7% |
| Northern Europe | 122 | 0.2% |
| Oceania | 144 | 0.3% |
| Pakistan | 33 | 0.1% |
| Peru | 63 | 0.1% |
| Philippines | 925 | 1.8% |
| Poland | 7 | 0.0% |
| Romania | 10 | 0.0% |
| Russia | 60 | 0.1% |
| Somalia | 203 | 0.4% |
| South America | 253 | 0.5% |
| South Central Asia | 456 | 0.9% |
| South Eastern Asia | 3,820 | 7.4% |
| Southern Europe | 20 | 0.0% |
| Spain | 10 | 0.0% |
| Sweden | 11 | 0.0% |
| Taiwan | 25 | 0.1% |
| Thailand | 51 | 0.1% |
| Ukraine | 61 | 0.1% |
| Venezuela | 53 | 0.1% |
| Vietnam | 2,117 | 4.1% |
| Western Africa | 74 | 0.1% |
| Western Asia | 144 | 0.3% |
| Western Europe | 131 | 0.3% | View All 79 Rows |
Sex and Age in Burien
Sex and Age in Burien
The most populous age groups in Burien are 35 to 39 Years (2,573 | 9.7%) for men and 40 to 44 Years (1,952 | 7.8%) for women.
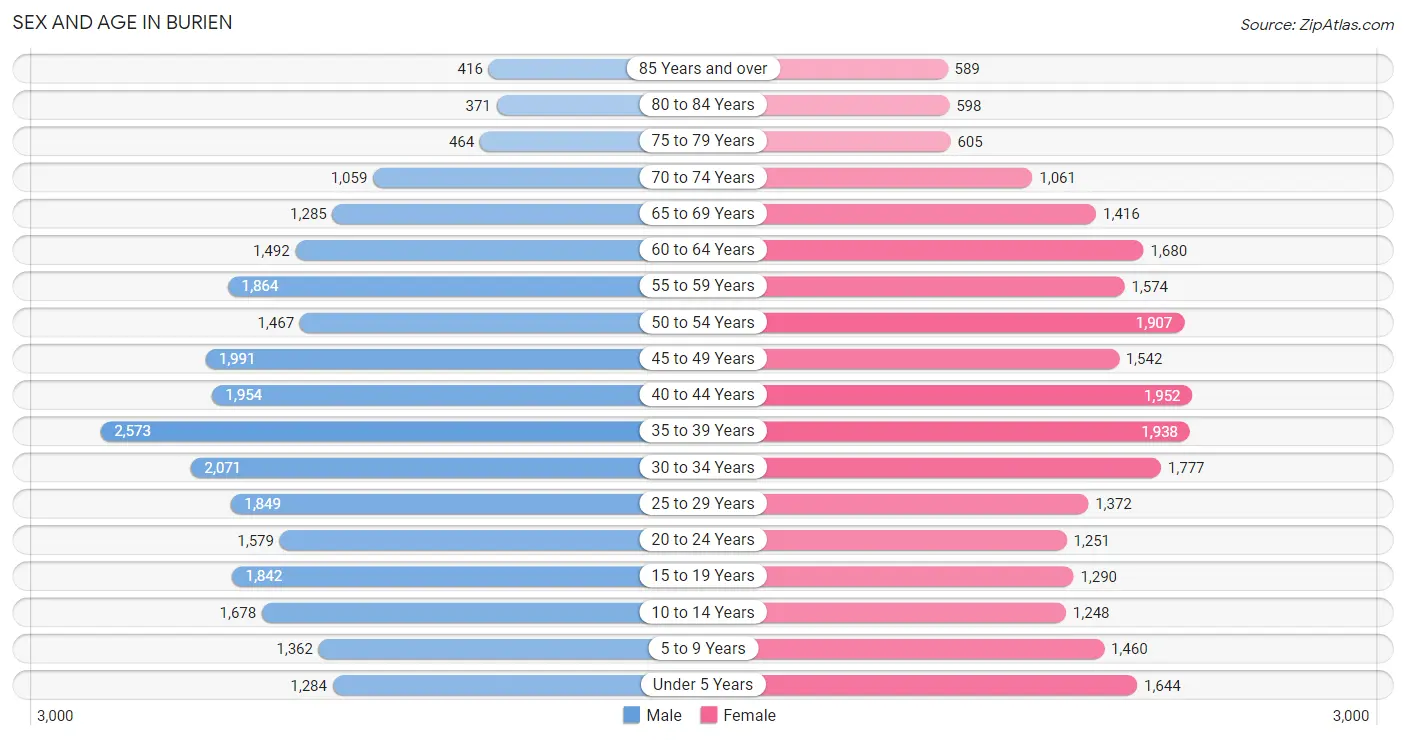
| Age Bracket | Male | Female |
| Under 5 Years | 1,284 (4.8%) | 1,644 (6.6%) |
| 5 to 9 Years | 1,362 (5.1%) | 1,460 (5.9%) |
| 10 to 14 Years | 1,678 (6.3%) | 1,248 (5.0%) |
| 15 to 19 Years | 1,842 (6.9%) | 1,290 (5.2%) |
| 20 to 24 Years | 1,579 (5.9%) | 1,251 (5.0%) |
| 25 to 29 Years | 1,849 (7.0%) | 1,372 (5.5%) |
| 30 to 34 Years | 2,071 (7.8%) | 1,777 (7.1%) |
| 35 to 39 Years | 2,573 (9.7%) | 1,938 (7.8%) |
| 40 to 44 Years | 1,954 (7.3%) | 1,952 (7.8%) |
| 45 to 49 Years | 1,991 (7.5%) | 1,542 (6.2%) |
| 50 to 54 Years | 1,467 (5.5%) | 1,907 (7.7%) |
| 55 to 59 Years | 1,864 (7.0%) | 1,574 (6.3%) |
| 60 to 64 Years | 1,492 (5.6%) | 1,680 (6.8%) |
| 65 to 69 Years | 1,285 (4.8%) | 1,416 (5.7%) |
| 70 to 74 Years | 1,059 (4.0%) | 1,061 (4.3%) |
| 75 to 79 Years | 464 (1.7%) | 605 (2.4%) |
| 80 to 84 Years | 371 (1.4%) | 598 (2.4%) |
| 85 Years and over | 416 (1.6%) | 589 (2.4%) |
| Total | 26,601 (100.0%) | 24,904 (100.0%) |
Families and Households in Burien
Median Family Size in Burien
The median family size in Burien is 3.20 persons per family, with married-couple families (8,130 | 67.8%) accounting for the largest median family size of 3.24 persons per family. On the other hand, single male/father families (1,286 | 10.7%) represent the smallest median family size with 3.02 persons per family.
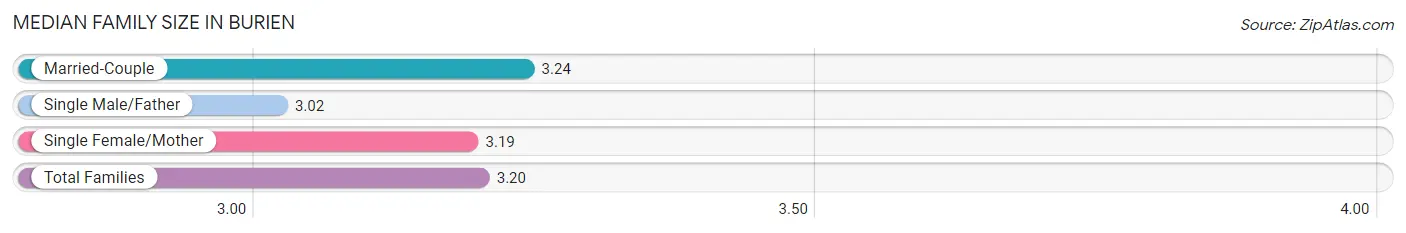
| Family Type | # Families | Family Size |
| Married-Couple | 8,130 (67.8%) | 3.24 |
| Single Male/Father | 1,286 (10.7%) | 3.02 |
| Single Female/Mother | 2,580 (21.5%) | 3.19 |
| Total Families | 11,996 (100.0%) | 3.20 |
Median Household Size in Burien
The median household size in Burien is 2.56 persons per household, with single male/father households (1,286 | 6.5%) accounting for the largest median household size of 3.63 persons per household. non-family households (7,907 | 39.7%) represent the smallest median household size with 1.32 persons per household.
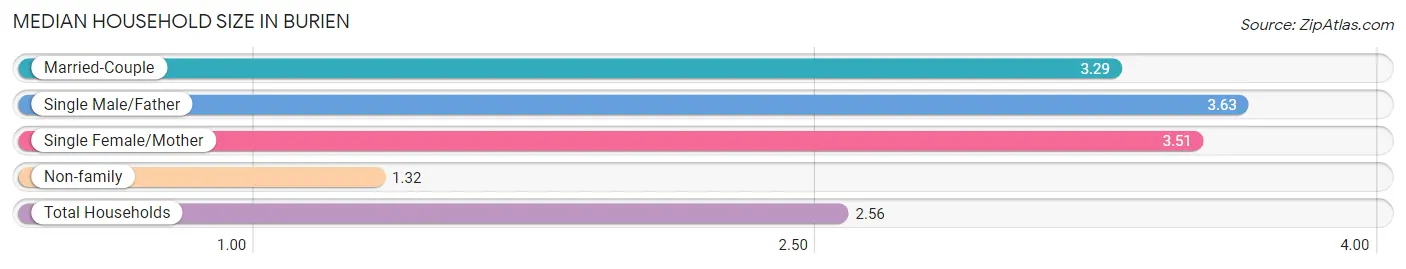
| Household Type | # Households | Household Size |
| Married-Couple | 8,130 (40.8%) | 3.29 |
| Single Male/Father | 1,286 (6.5%) | 3.63 |
| Single Female/Mother | 2,580 (13.0%) | 3.51 |
| Non-family | 7,907 (39.7%) | 1.32 |
| Total Households | 19,903 (100.0%) | 2.56 |
Household Size by Marriage Status in Burien
Out of a total of 19,903 households in Burien, 11,996 (60.3%) are family households, while 7,907 (39.7%) are nonfamily households. The most numerous type of family households are 2-person households, comprising 4,696, and the most common type of nonfamily households are 1-person households, comprising 6,041.
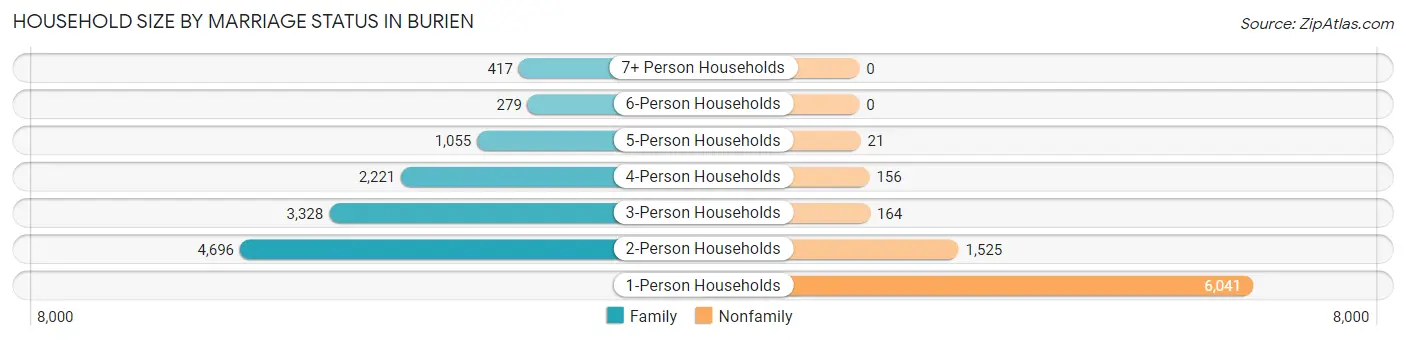
| Household Size | Family Households | Nonfamily Households |
| 1-Person Households | - | 6,041 (30.3%) |
| 2-Person Households | 4,696 (23.6%) | 1,525 (7.7%) |
| 3-Person Households | 3,328 (16.7%) | 164 (0.8%) |
| 4-Person Households | 2,221 (11.2%) | 156 (0.8%) |
| 5-Person Households | 1,055 (5.3%) | 21 (0.1%) |
| 6-Person Households | 279 (1.4%) | 0 (0.0%) |
| 7+ Person Households | 417 (2.1%) | 0 (0.0%) |
| Total | 11,996 (60.3%) | 7,907 (39.7%) |
Female Fertility in Burien
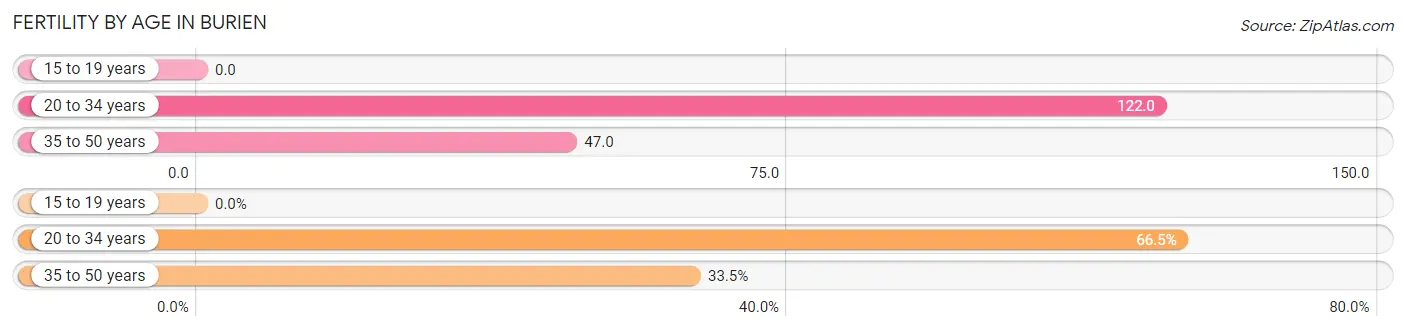
Fertility by Age in Burien
Average fertility rate in Burien is 70.0 births per 1,000 women. Women in the age bracket of 20 to 34 years have the highest fertility rate with 122.0 births per 1,000 women. Women in the age bracket of 20 to 34 years acount for 66.5% of all women with births.
| Age Bracket | Women with Births | Births / 1,000 Women |
| 15 to 19 years | 0 (0.0%) | 0.0 |
| 20 to 34 years | 535 (66.5%) | 122.0 |
| 35 to 50 years | 269 (33.5%) | 47.0 |
| Total | 804 (100.0%) | 70.0 |
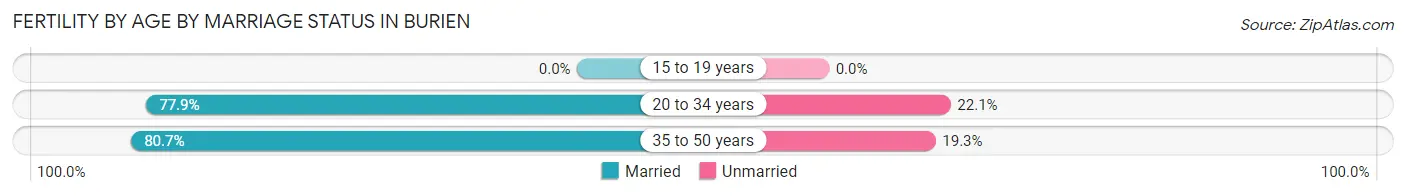
Fertility by Age by Marriage Status in Burien
78.9% of women with births (804) in Burien are married. The highest percentage of unmarried women with births falls into 20 to 34 years age bracket with 22.1% of them unmarried at the time of birth, while the lowest percentage of unmarried women with births belong to 35 to 50 years age bracket with 19.3% of them unmarried.
| Age Bracket | Married | Unmarried |
| 15 to 19 years | 0 (0.0%) | 0 (0.0%) |
| 20 to 34 years | 417 (77.9%) | 118 (22.1%) |
| 35 to 50 years | 217 (80.7%) | 52 (19.3%) |
| Total | 634 (78.9%) | 170 (21.1%) |
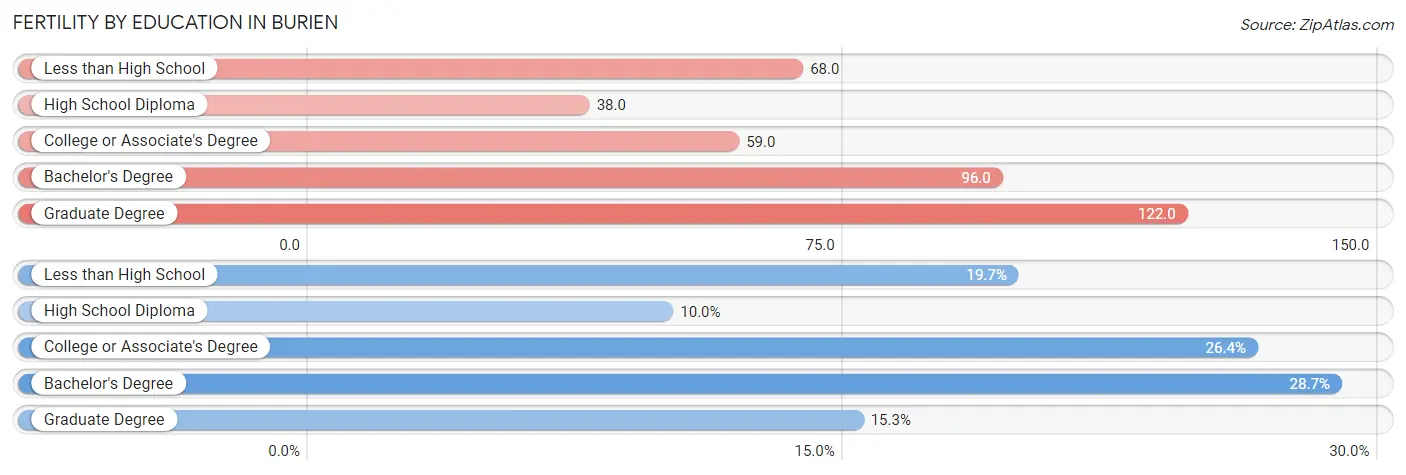
Fertility by Education in Burien
Average fertility rate in Burien is 70.0 births per 1,000 women. Women with the education attainment of graduate degree have the highest fertility rate of 122.0 births per 1,000 women, while women with the education attainment of high school diploma have the lowest fertility at 38.0 births per 1,000 women. Women with the education attainment of bachelor's degree represent 28.7% of all women with births.
| Educational Attainment | Women with Births | Births / 1,000 Women |
| Less than High School | 158 (19.7%) | 68.0 |
| High School Diploma | 80 (10.0%) | 38.0 |
| College or Associate's Degree | 212 (26.4%) | 59.0 |
| Bachelor's Degree | 231 (28.7%) | 96.0 |
| Graduate Degree | 123 (15.3%) | 122.0 |
| Total | 804 (100.0%) | 70.0 |
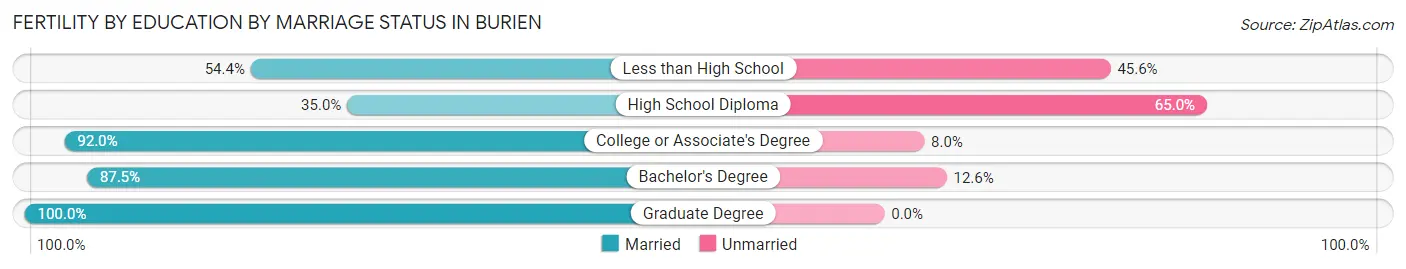
Fertility by Education by Marriage Status in Burien
21.1% of women with births in Burien are unmarried. Women with the educational attainment of graduate degree are most likely to be married with 100.0% of them married at childbirth, while women with the educational attainment of high school diploma are least likely to be married with 65.0% of them unmarried at childbirth.
| Educational Attainment | Married | Unmarried |
| Less than High School | 86 (54.4%) | 72 (45.6%) |
| High School Diploma | 28 (35.0%) | 52 (65.0%) |
| College or Associate's Degree | 195 (92.0%) | 17 (8.0%) |
| Bachelor's Degree | 202 (87.5%) | 29 (12.6%) |
| Graduate Degree | 123 (100.0%) | 0 (0.0%) |
| Total | 634 (78.9%) | 170 (21.1%) |
Income in Burien
Income Overview in Burien
Per Capita Income in Burien is $46,834, while median incomes of families and households are $99,734 and $84,583 respectively.
| Characteristic | Number | Measure |
| Per Capita Income | 51,505 | $46,834 |
| Median Family Income | 11,996 | $99,734 |
| Mean Family Income | 11,996 | $131,249 |
| Median Household Income | 19,903 | $84,583 |
| Mean Household Income | 19,903 | $116,997 |
| Income Deficit | 11,996 | $10,962 |
| Wage / Income Gap (%) | 51,505 | 18.96% |
| Wage / Income Gap ($) | 51,505 | 81.04¢ per $1 |
| Gini / Inequality Index | 51,505 | 0.46 |
Earnings by Sex in Burien
Average Earnings in Burien are $47,069, $51,812 for men and $41,990 for women, a difference of 19.0%.
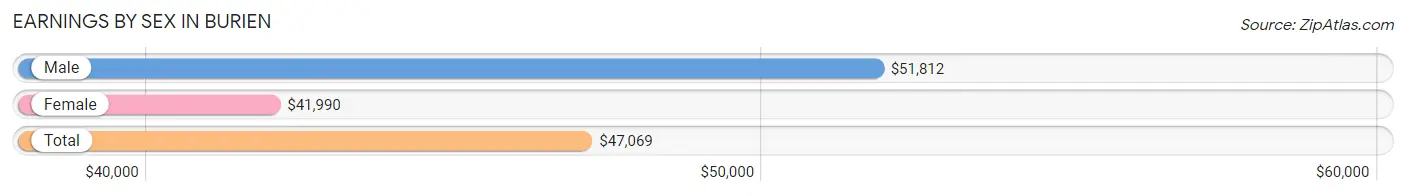
| Sex | Number | Average Earnings |
| Male | 16,419 (54.4%) | $51,812 |
| Female | 13,758 (45.6%) | $41,990 |
| Total | 30,177 (100.0%) | $47,069 |
Earnings by Sex by Income Bracket in Burien
The most common earnings brackets in Burien are $100,000+ for men (3,227 | 19.7%) and $100,000+ for women (1,879 | 13.7%).
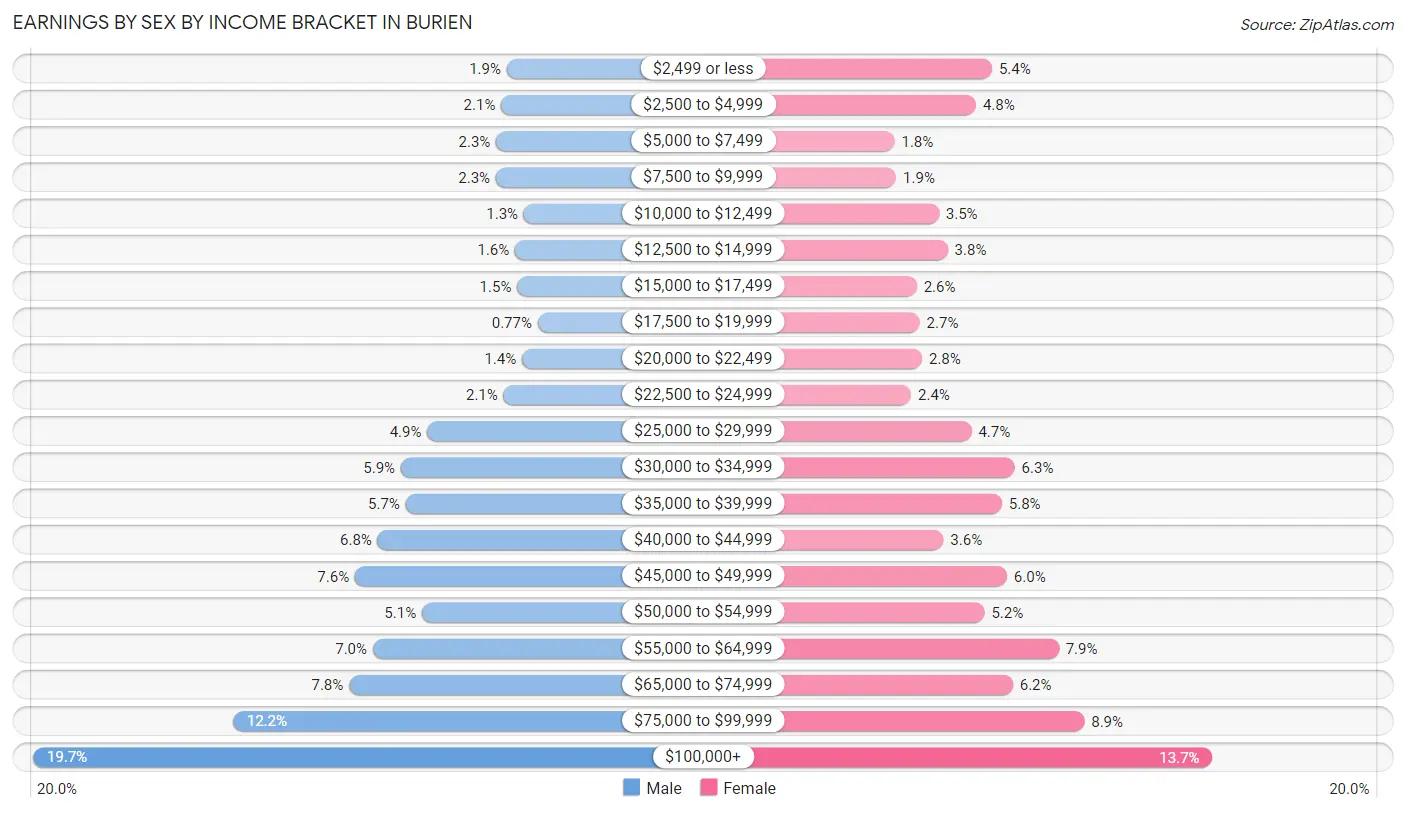
| Income | Male | Female |
| $2,499 or less | 317 (1.9%) | 748 (5.4%) |
| $2,500 to $4,999 | 352 (2.1%) | 666 (4.8%) |
| $5,000 to $7,499 | 383 (2.3%) | 246 (1.8%) |
| $7,500 to $9,999 | 384 (2.3%) | 255 (1.8%) |
| $10,000 to $12,499 | 212 (1.3%) | 475 (3.5%) |
| $12,500 to $14,999 | 266 (1.6%) | 520 (3.8%) |
| $15,000 to $17,499 | 253 (1.5%) | 360 (2.6%) |
| $17,500 to $19,999 | 127 (0.8%) | 376 (2.7%) |
| $20,000 to $22,499 | 223 (1.4%) | 388 (2.8%) |
| $22,500 to $24,999 | 336 (2.1%) | 332 (2.4%) |
| $25,000 to $29,999 | 806 (4.9%) | 642 (4.7%) |
| $30,000 to $34,999 | 969 (5.9%) | 865 (6.3%) |
| $35,000 to $39,999 | 939 (5.7%) | 799 (5.8%) |
| $40,000 to $44,999 | 1,111 (6.8%) | 498 (3.6%) |
| $45,000 to $49,999 | 1,251 (7.6%) | 826 (6.0%) |
| $50,000 to $54,999 | 839 (5.1%) | 710 (5.2%) |
| $55,000 to $64,999 | 1,141 (7.0%) | 1,092 (7.9%) |
| $65,000 to $74,999 | 1,287 (7.8%) | 856 (6.2%) |
| $75,000 to $99,999 | 1,996 (12.2%) | 1,225 (8.9%) |
| $100,000+ | 3,227 (19.7%) | 1,879 (13.7%) |
| Total | 16,419 (100.0%) | 13,758 (100.0%) |
Earnings by Sex by Educational Attainment in Burien
Average earnings in Burien are $56,167 for men and $46,736 for women, a difference of 16.8%. Men with an educational attainment of graduate degree enjoy the highest average annual earnings of $108,167, while those with less than high school education earn the least with $37,371. Women with an educational attainment of graduate degree earn the most with the average annual earnings of $81,213, while those with less than high school education have the smallest earnings of $30,142.
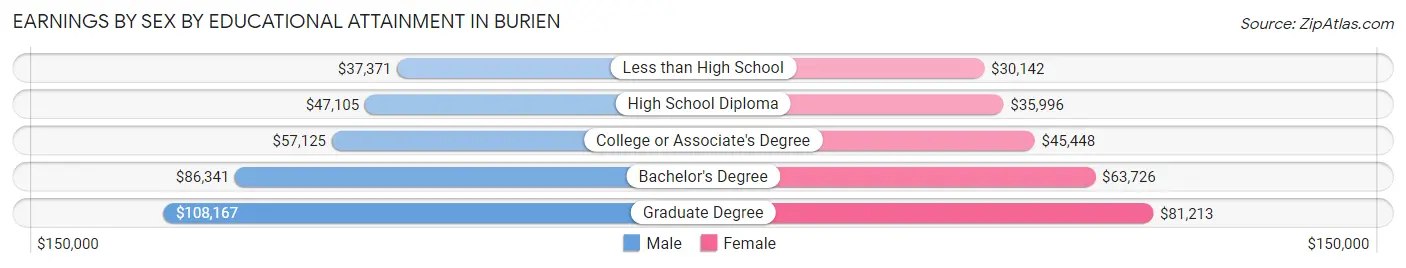
| Educational Attainment | Male Income | Female Income |
| Less than High School | $37,371 | $30,142 |
| High School Diploma | $47,105 | $35,996 |
| College or Associate's Degree | $57,125 | $45,448 |
| Bachelor's Degree | $86,341 | $63,726 |
| Graduate Degree | $108,167 | $81,213 |
| Total | $56,167 | $46,736 |
Family Income in Burien
Family Income Brackets in Burien
According to the Burien family income data, there are 2,483 families falling into the $100,000 to $149,999 income range, which is the most common income bracket and makes up 20.7% of all families. Conversely, the $10,000 to $14,999 income bracket is the least frequent group with only 144 families (1.2%) belonging to this category.
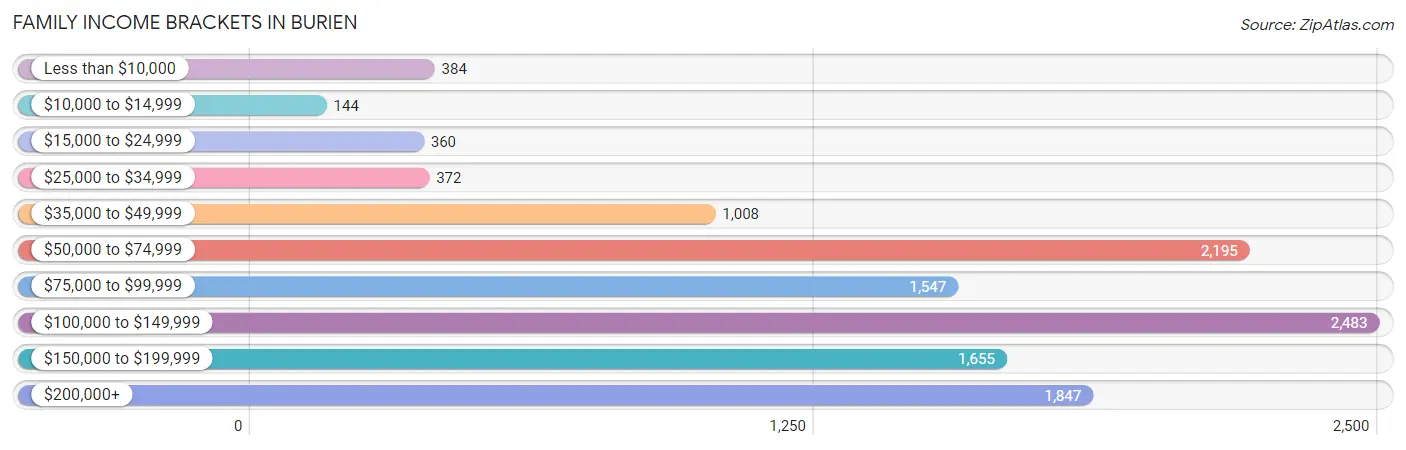
| Income Bracket | # Families | % Families |
| Less than $10,000 | 384 | 3.2% |
| $10,000 to $14,999 | 144 | 1.2% |
| $15,000 to $24,999 | 360 | 3.0% |
| $25,000 to $34,999 | 372 | 3.1% |
| $35,000 to $49,999 | 1,008 | 8.4% |
| $50,000 to $74,999 | 2,195 | 18.3% |
| $75,000 to $99,999 | 1,547 | 12.9% |
| $100,000 to $149,999 | 2,483 | 20.7% |
| $150,000 to $199,999 | 1,655 | 13.8% |
| $200,000+ | 1,847 | 15.4% |
Family Income by Famaliy Size in Burien
6-person families (208 | 1.7%) account for the highest median family income in Burien with $140,441 per family, while 2-person families (5,419 | 45.2%) have the highest median income of $43,329 per family member.
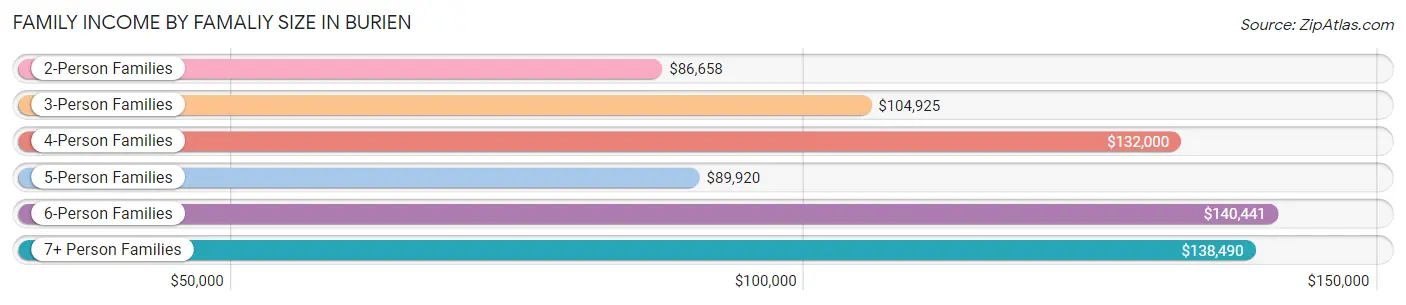
| Income Bracket | # Families | Median Income |
| 2-Person Families | 5,419 (45.2%) | $86,658 |
| 3-Person Families | 3,205 (26.7%) | $104,925 |
| 4-Person Families | 1,920 (16.0%) | $132,000 |
| 5-Person Families | 875 (7.3%) | $89,920 |
| 6-Person Families | 208 (1.7%) | $140,441 |
| 7+ Person Families | 369 (3.1%) | $138,490 |
| Total | 11,996 (100.0%) | $99,734 |
Family Income by Number of Earners in Burien
The median family income in Burien is $99,734, with families comprising 3+ earners (1,507) having the highest median family income of $143,782, while families with no earners (1,270) have the lowest median family income of $71,393, accounting for 12.6% and 10.6% of families, respectively.
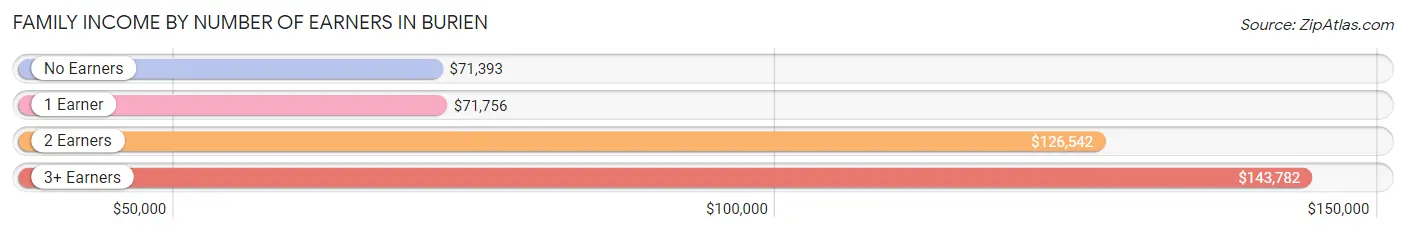
| Number of Earners | # Families | Median Income |
| No Earners | 1,270 (10.6%) | $71,393 |
| 1 Earner | 3,614 (30.1%) | $71,756 |
| 2 Earners | 5,605 (46.7%) | $126,542 |
| 3+ Earners | 1,507 (12.6%) | $143,782 |
| Total | 11,996 (100.0%) | $99,734 |
Household Income in Burien
Household Income Brackets in Burien
With 3,702 households falling in the category, the $100,000 to $149,999 income range is the most frequent in Burien, accounting for 18.6% of all households. In contrast, only 637 households (3.2%) fall into the $10,000 to $14,999 income bracket, making it the least populous group.
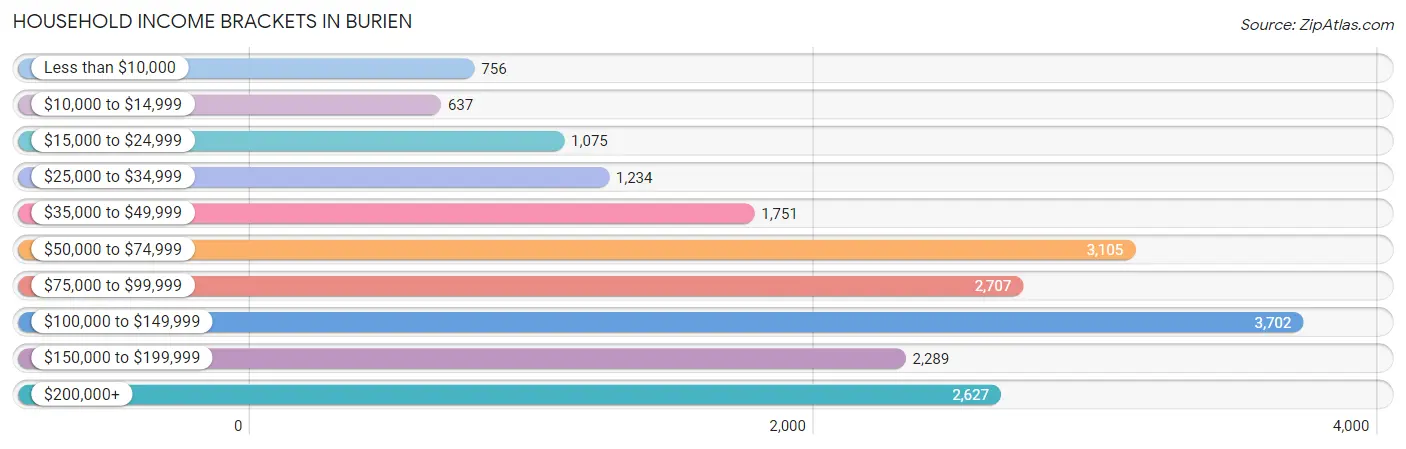
| Income Bracket | # Households | % Households |
| Less than $10,000 | 756 | 3.8% |
| $10,000 to $14,999 | 637 | 3.2% |
| $15,000 to $24,999 | 1,075 | 5.4% |
| $25,000 to $34,999 | 1,234 | 6.2% |
| $35,000 to $49,999 | 1,751 | 8.8% |
| $50,000 to $74,999 | 3,105 | 15.6% |
| $75,000 to $99,999 | 2,707 | 13.6% |
| $100,000 to $149,999 | 3,702 | 18.6% |
| $150,000 to $199,999 | 2,289 | 11.5% |
| $200,000+ | 2,627 | 13.2% |
Household Income by Householder Age in Burien
The median household income in Burien is $84,583, with the highest median household income of $111,587 found in the 45 to 64 years age bracket for the primary householder. A total of 7,695 households (38.7%) fall into this category. Meanwhile, the 65+ years age bracket for the primary householder has the lowest median household income of $61,343, with 4,786 households (24.0%) in this group.
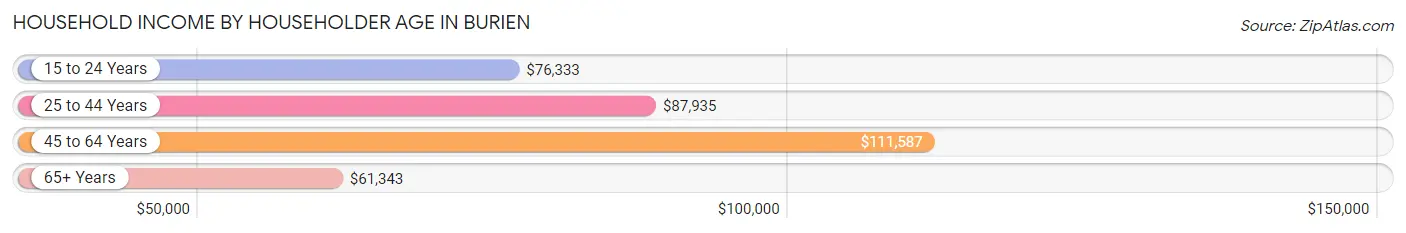
| Income Bracket | # Households | Median Income |
| 15 to 24 Years | 720 (3.6%) | $76,333 |
| 25 to 44 Years | 6,702 (33.7%) | $87,935 |
| 45 to 64 Years | 7,695 (38.7%) | $111,587 |
| 65+ Years | 4,786 (24.0%) | $61,343 |
| Total | 19,903 (100.0%) | $84,583 |
Poverty in Burien
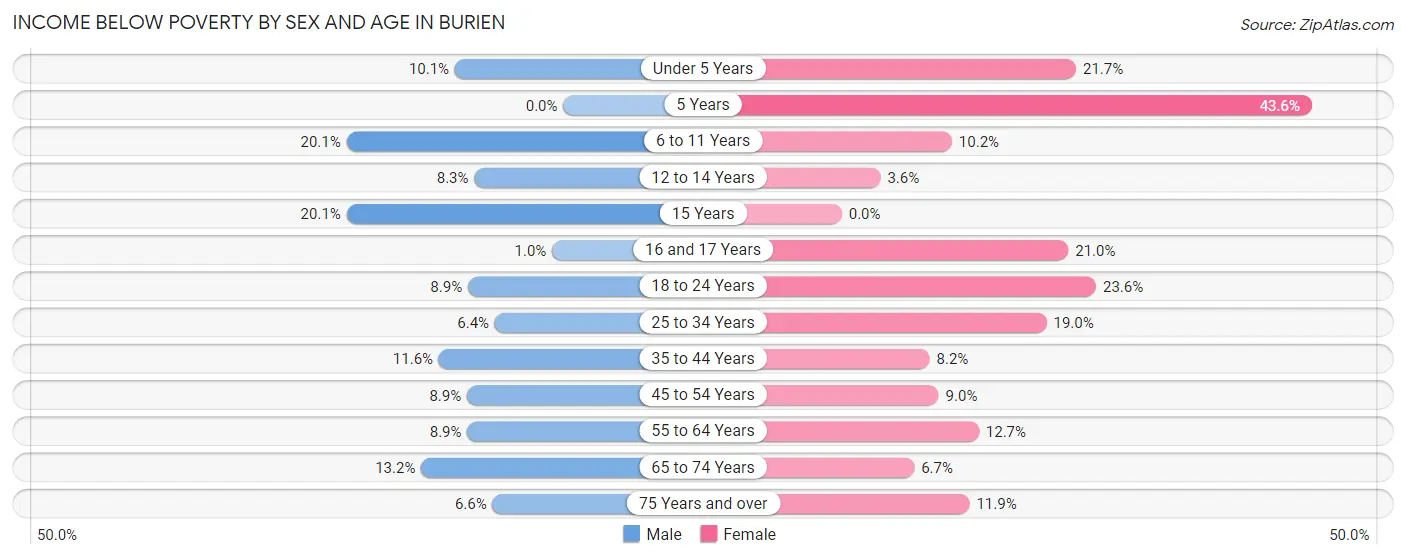
Income Below Poverty by Sex and Age in Burien
With 10.0% poverty level for males and 12.9% for females among the residents of Burien, 6 to 11 year old males and 5 year old females are the most vulnerable to poverty, with 401 males (20.1%) and 99 females (43.6%) in their respective age groups living below the poverty level.
| Age Bracket | Male | Female |
| Under 5 Years | 125 (10.1%) | 354 (21.7%) |
| 5 Years | 0 (0.0%) | 99 (43.6%) |
| 6 to 11 Years | 401 (20.1%) | 169 (10.2%) |
| 12 to 14 Years | 66 (8.3%) | 25 (3.6%) |
| 15 Years | 71 (20.1%) | 0 (0.0%) |
| 16 and 17 Years | 8 (1.0%) | 136 (21.0%) |
| 18 to 24 Years | 203 (8.8%) | 378 (23.6%) |
| 25 to 34 Years | 249 (6.4%) | 598 (19.0%) |
| 35 to 44 Years | 522 (11.6%) | 317 (8.2%) |
| 45 to 54 Years | 309 (8.9%) | 310 (9.0%) |
| 55 to 64 Years | 299 (8.9%) | 413 (12.7%) |
| 65 to 74 Years | 305 (13.2%) | 165 (6.7%) |
| 75 Years and over | 79 (6.6%) | 205 (11.8%) |
| Total | 2,637 (10.0%) | 3,169 (12.9%) |
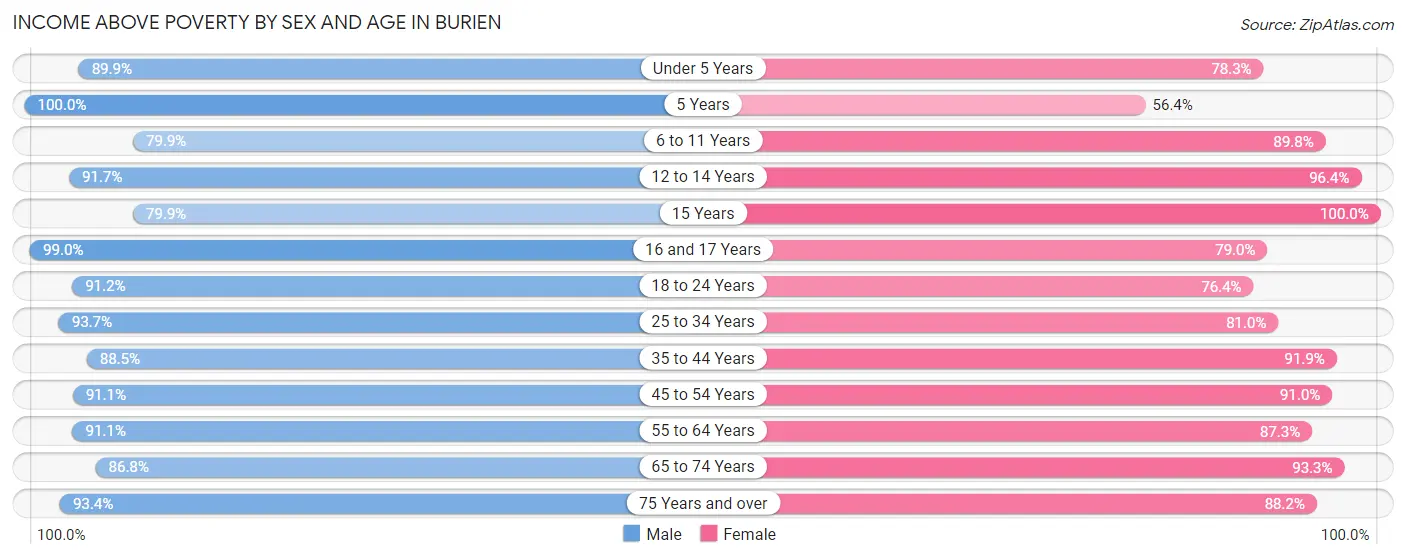
Income Above Poverty by Sex and Age in Burien
According to the poverty statistics in Burien, males aged 5 years and females aged 15 years are the age groups that are most secure financially, with 100.0% of males and 100.0% of females in these age groups living above the poverty line.
| Age Bracket | Male | Female |
| Under 5 Years | 1,117 (89.9%) | 1,274 (78.3%) |
| 5 Years | 221 (100.0%) | 128 (56.4%) |
| 6 to 11 Years | 1,592 (79.9%) | 1,485 (89.8%) |
| 12 to 14 Years | 733 (91.7%) | 671 (96.4%) |
| 15 Years | 282 (79.9%) | 258 (100.0%) |
| 16 and 17 Years | 758 (99.0%) | 511 (79.0%) |
| 18 to 24 Years | 2,090 (91.1%) | 1,224 (76.4%) |
| 25 to 34 Years | 3,671 (93.6%) | 2,550 (81.0%) |
| 35 to 44 Years | 3,998 (88.4%) | 3,573 (91.8%) |
| 45 to 54 Years | 3,148 (91.1%) | 3,139 (91.0%) |
| 55 to 64 Years | 3,057 (91.1%) | 2,834 (87.3%) |
| 65 to 74 Years | 2,008 (86.8%) | 2,291 (93.3%) |
| 75 Years and over | 1,123 (93.4%) | 1,525 (88.1%) |
| Total | 23,798 (90.0%) | 21,463 (87.1%) |
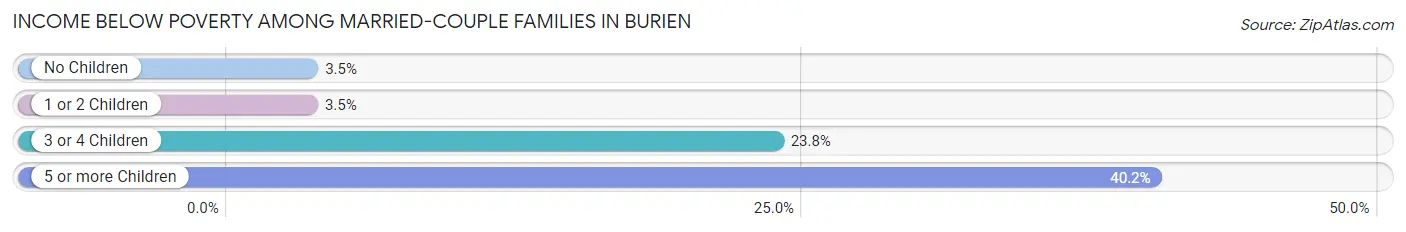
Income Below Poverty Among Married-Couple Families in Burien
The poverty statistics for married-couple families in Burien show that 5.4% or 441 of the total 8,130 families live below the poverty line. Families with 5 or more children have the highest poverty rate of 40.2%, comprising of 35 families. On the other hand, families with 1 or 2 children have the lowest poverty rate of 3.5%, which includes 98 families.
| Children | Above Poverty | Below Poverty |
| No Children | 4,449 (96.5%) | 161 (3.5%) |
| 1 or 2 Children | 2,716 (96.5%) | 98 (3.5%) |
| 3 or 4 Children | 472 (76.2%) | 147 (23.7%) |
| 5 or more Children | 52 (59.8%) | 35 (40.2%) |
| Total | 7,689 (94.6%) | 441 (5.4%) |
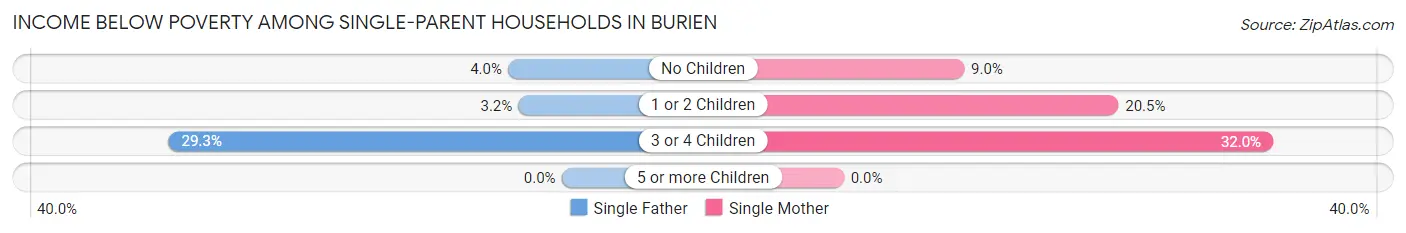
Income Below Poverty Among Single-Parent Households in Burien
According to the poverty data in Burien, 4.4% or 57 single-father households and 17.2% or 443 single-mother households are living below the poverty line. Among single-father households, those with 3 or 4 children have the highest poverty rate, with 12 households (29.3%) experiencing poverty. Likewise, among single-mother households, those with 3 or 4 children have the highest poverty rate, with 63 households (32.0%) falling below the poverty line.
| Children | Single Father | Single Mother |
| No Children | 25 (4.0%) | 84 (9.0%) |
| 1 or 2 Children | 20 (3.2%) | 296 (20.5%) |
| 3 or 4 Children | 12 (29.3%) | 63 (32.0%) |
| 5 or more Children | 0 (0.0%) | 0 (0.0%) |
| Total | 57 (4.4%) | 443 (17.2%) |
Income Below Poverty Among Married-Couple vs Single-Parent Households in Burien
The poverty data for Burien shows that 441 of the married-couple family households (5.4%) and 500 of the single-parent households (12.9%) are living below the poverty level. Within the married-couple family households, those with 5 or more children have the highest poverty rate, with 35 households (40.2%) falling below the poverty line. Among the single-parent households, those with 3 or 4 children have the highest poverty rate, with 75 household (31.5%) living below poverty.
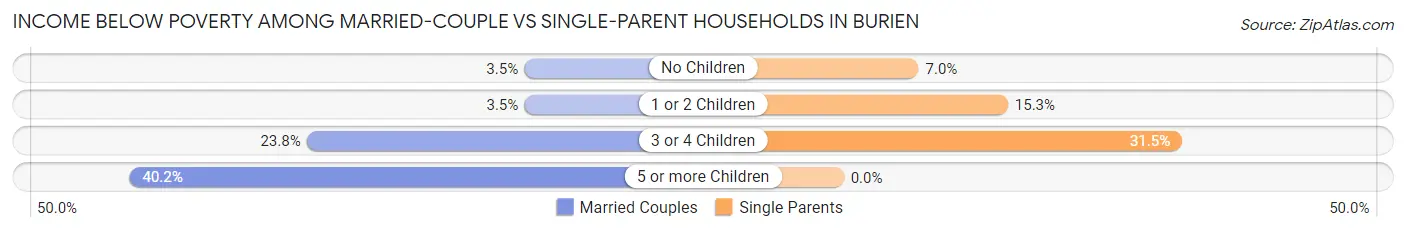
| Children | Married-Couple Families | Single-Parent Households |
| No Children | 161 (3.5%) | 109 (7.0%) |
| 1 or 2 Children | 98 (3.5%) | 316 (15.3%) |
| 3 or 4 Children | 147 (23.7%) | 75 (31.5%) |
| 5 or more Children | 35 (40.2%) | 0 (0.0%) |
| Total | 441 (5.4%) | 500 (12.9%) |
Employment Characteristics in Burien
Employment by Class of Employer in Burien
Among the 26,519 employed individuals in Burien, private company employees (17,868 | 67.4%), not-for-profit organizations (2,666 | 10.1%), and local government employees (1,866 | 7.0%) make up the most common classes of employment.
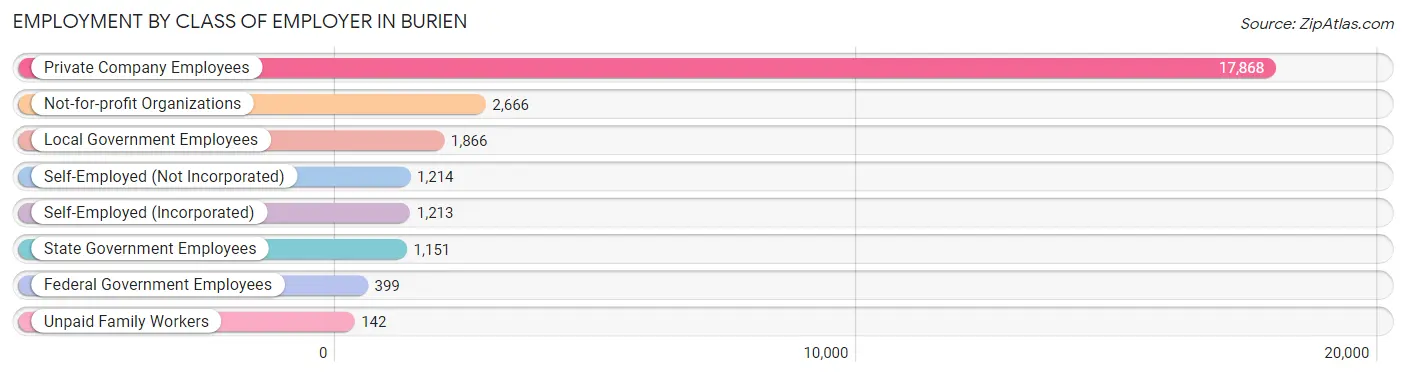
| Employer Class | # Employees | % Employees |
| Private Company Employees | 17,868 | 67.4% |
| Self-Employed (Incorporated) | 1,213 | 4.6% |
| Self-Employed (Not Incorporated) | 1,214 | 4.6% |
| Not-for-profit Organizations | 2,666 | 10.1% |
| Local Government Employees | 1,866 | 7.0% |
| State Government Employees | 1,151 | 4.3% |
| Federal Government Employees | 399 | 1.5% |
| Unpaid Family Workers | 142 | 0.5% |
| Total | 26,519 | 100.0% |
Employment Status by Age in Burien
According to the labor force statistics for Burien, out of the total population over 16 years of age (42,218), 67.9% or 28,666 individuals are in the labor force, with 4.8% or 1,376 of them unemployed. The age group with the highest labor force participation rate is 35 to 44 years, with 87.3% or 7,348 individuals in the labor force. Within the labor force, the 75 years and over age range has the highest percentage of unemployed individuals, with 10.3% or 17 of them being unemployed.
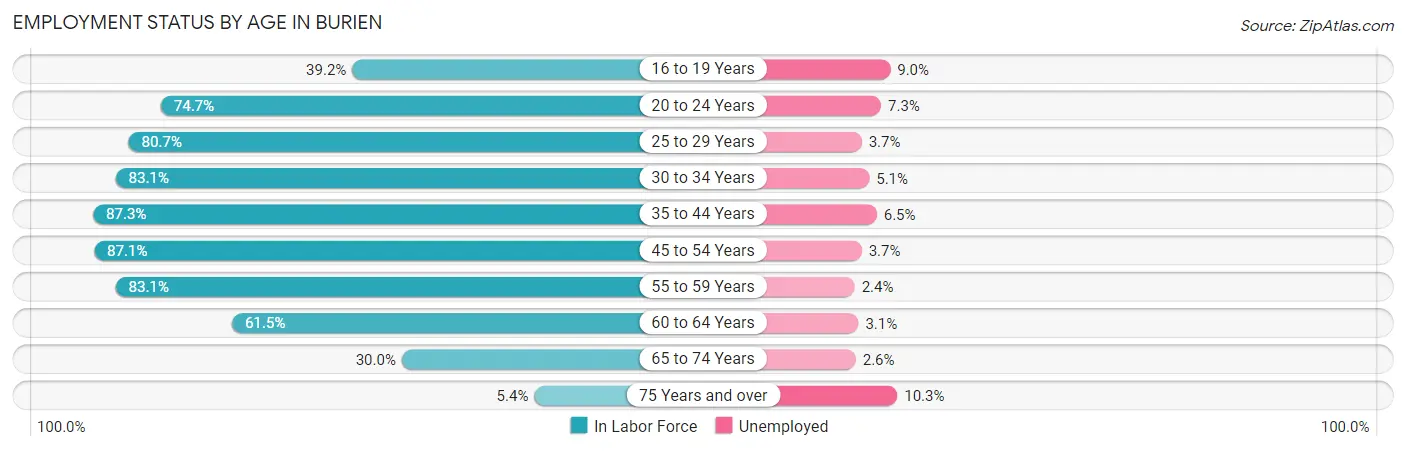
| Age Bracket | In Labor Force | Unemployed |
| 16 to 19 Years | 988 (39.2%) | 89 (9.0%) |
| 20 to 24 Years | 2,114 (74.7%) | 154 (7.3%) |
| 25 to 29 Years | 2,599 (80.7%) | 96 (3.7%) |
| 30 to 34 Years | 3,198 (83.1%) | 163 (5.1%) |
| 35 to 44 Years | 7,348 (87.3%) | 478 (6.5%) |
| 45 to 54 Years | 6,016 (87.1%) | 223 (3.7%) |
| 55 to 59 Years | 2,857 (83.1%) | 69 (2.4%) |
| 60 to 64 Years | 1,951 (61.5%) | 60 (3.1%) |
| 65 to 74 Years | 1,446 (30.0%) | 38 (2.6%) |
| 75 Years and over | 164 (5.4%) | 17 (10.3%) |
| Total | 28,666 (67.9%) | 1,376 (4.8%) |
Employment Status by Educational Attainment in Burien
According to labor force statistics for Burien, 82.6% of individuals (23,956) out of the total population between 25 and 64 years of age (29,003) are in the labor force, with 4.5% or 1,078 of them being unemployed. The group with the highest labor force participation rate are those with the educational attainment of bachelor's degree or higher, with 89.8% or 7,779 individuals in the labor force. Within the labor force, individuals with college / associate degree education have the highest percentage of unemployment, with 6.4% or 492 of them being unemployed.
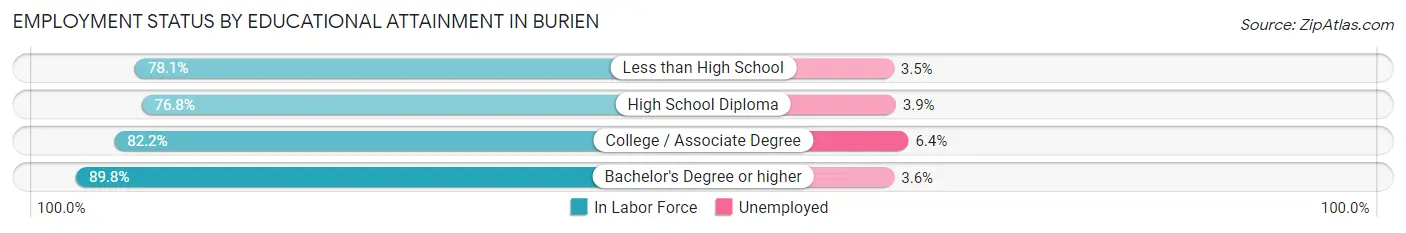
| Educational Attainment | In Labor Force | Unemployed |
| Less than High School | 3,614 (78.1%) | 162 (3.5%) |
| High School Diploma | 4,892 (76.8%) | 248 (3.9%) |
| College / Associate Degree | 7,680 (82.2%) | 598 (6.4%) |
| Bachelor's Degree or higher | 7,779 (89.8%) | 312 (3.6%) |
| Total | 23,956 (82.6%) | 1,305 (4.5%) |
Employment Occupations by Sex in Burien
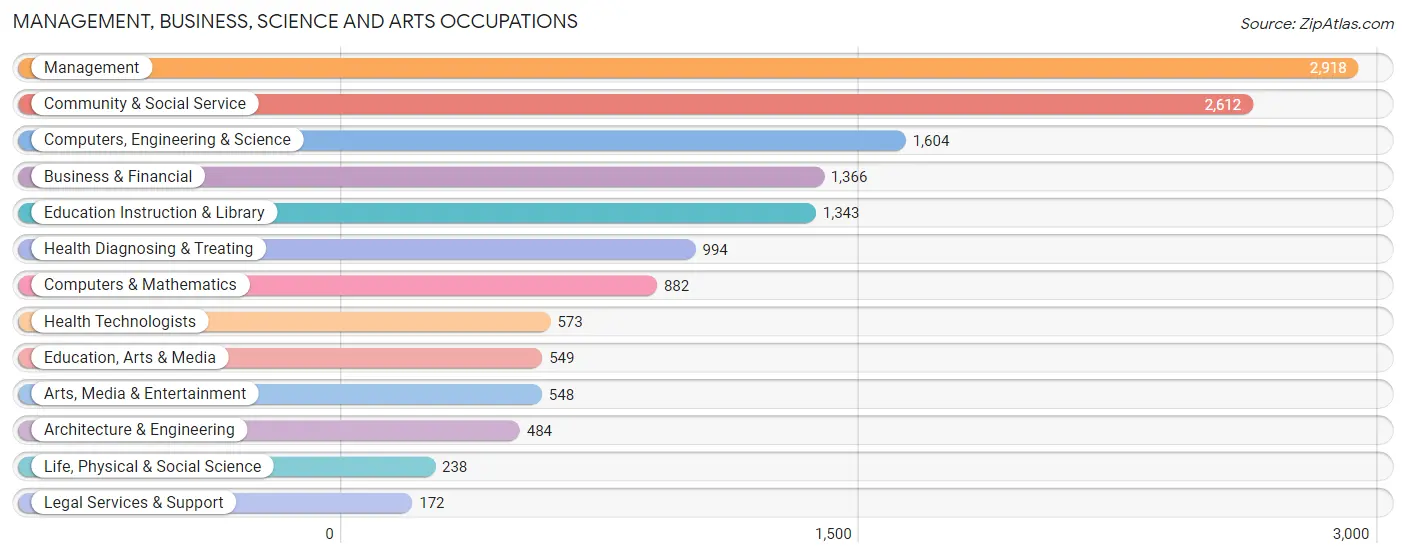
Management, Business, Science and Arts Occupations
The most common Management, Business, Science and Arts occupations in Burien are Management (2,918 | 10.7%), Community & Social Service (2,612 | 9.6%), Computers, Engineering & Science (1,604 | 5.9%), Business & Financial (1,366 | 5.0%), and Education Instruction & Library (1,343 | 4.9%).
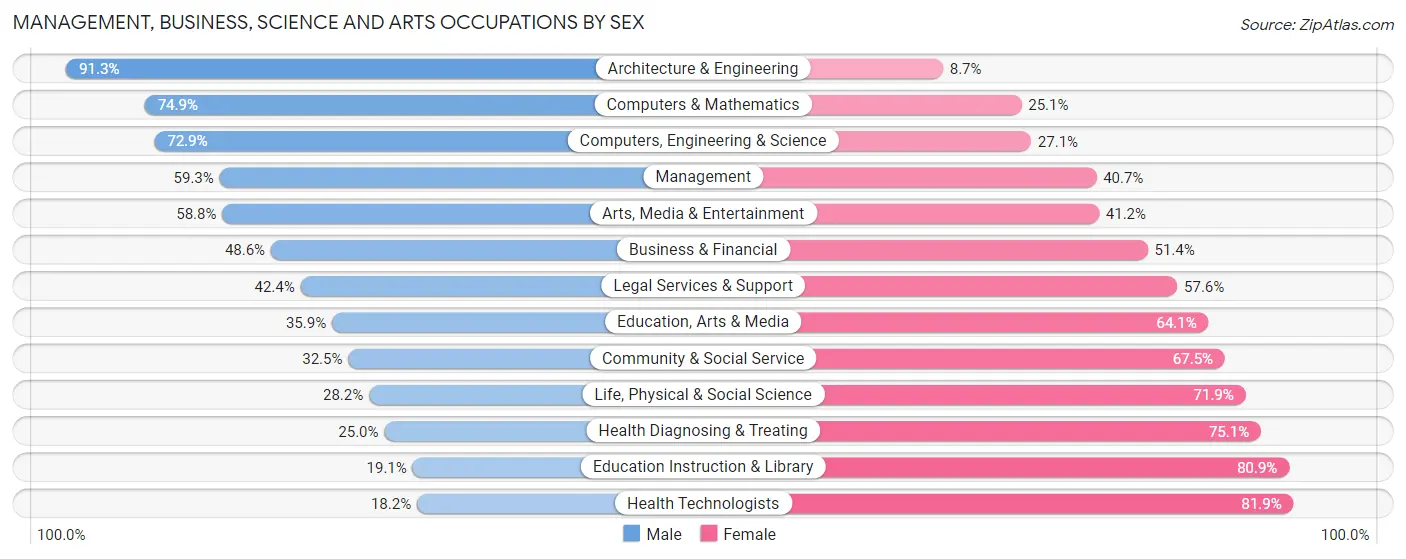
Management, Business, Science and Arts Occupations by Sex
Within the Management, Business, Science and Arts occupations in Burien, the most male-oriented occupations are Architecture & Engineering (91.3%), Computers & Mathematics (74.9%), and Computers, Engineering & Science (72.9%), while the most female-oriented occupations are Health Technologists (81.9%), Education Instruction & Library (80.9%), and Health Diagnosing & Treating (75.0%).
| Occupation | Male | Female |
| Management | 1,731 (59.3%) | 1,187 (40.7%) |
| Business & Financial | 664 (48.6%) | 702 (51.4%) |
| Computers, Engineering & Science | 1,170 (72.9%) | 434 (27.1%) |
| Computers & Mathematics | 661 (74.9%) | 221 (25.1%) |
| Architecture & Engineering | 442 (91.3%) | 42 (8.7%) |
| Life, Physical & Social Science | 67 (28.1%) | 171 (71.9%) |
| Community & Social Service | 848 (32.5%) | 1,764 (67.5%) |
| Education, Arts & Media | 197 (35.9%) | 352 (64.1%) |
| Legal Services & Support | 73 (42.4%) | 99 (57.6%) |
| Education Instruction & Library | 256 (19.1%) | 1,087 (80.9%) |
| Arts, Media & Entertainment | 322 (58.8%) | 226 (41.2%) |
| Health Diagnosing & Treating | 248 (24.9%) | 746 (75.0%) |
| Health Technologists | 104 (18.1%) | 469 (81.9%) |
| Total (Category) | 4,661 (49.1%) | 4,833 (50.9%) |
| Total (Overall) | 15,073 (55.3%) | 12,204 (44.7%) |
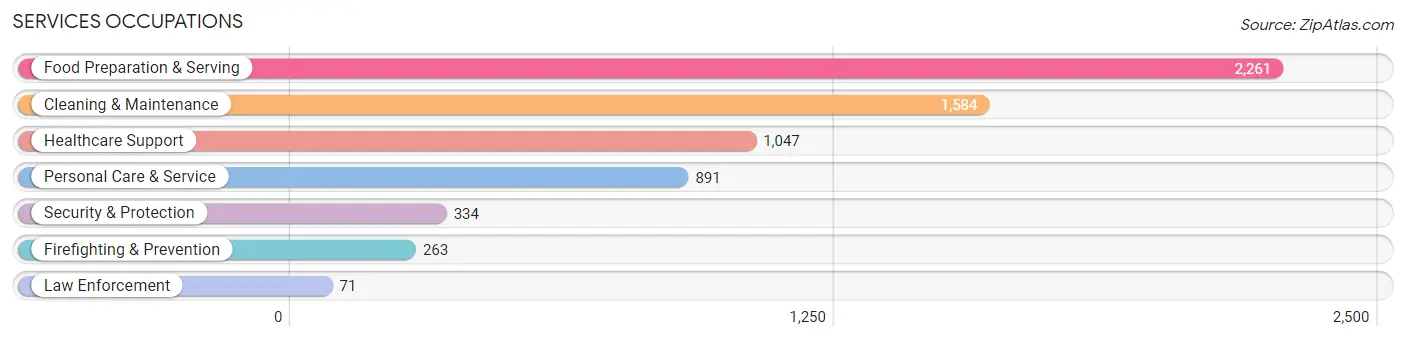
Services Occupations
The most common Services occupations in Burien are Food Preparation & Serving (2,261 | 8.3%), Cleaning & Maintenance (1,584 | 5.8%), Healthcare Support (1,047 | 3.8%), Personal Care & Service (891 | 3.3%), and Security & Protection (334 | 1.2%).
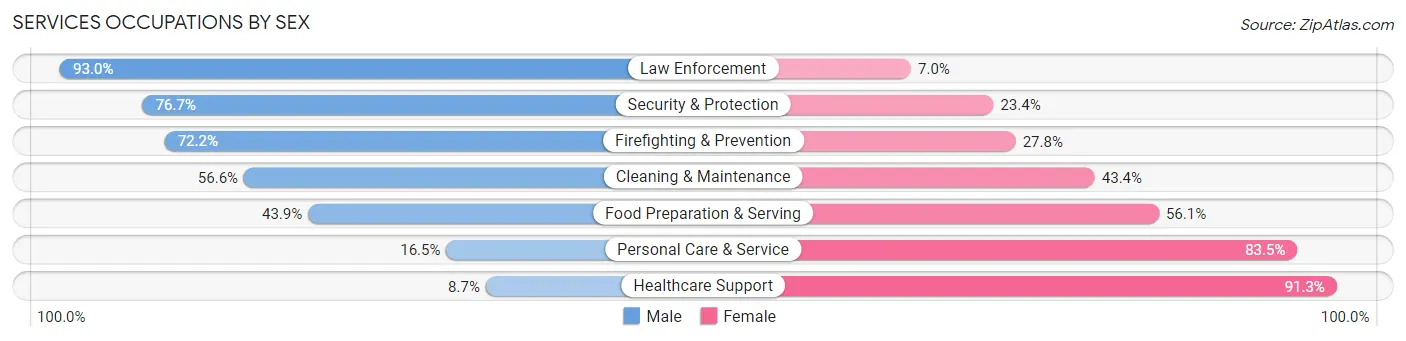
Services Occupations by Sex
Within the Services occupations in Burien, the most male-oriented occupations are Law Enforcement (93.0%), Security & Protection (76.6%), and Firefighting & Prevention (72.2%), while the most female-oriented occupations are Healthcare Support (91.3%), Personal Care & Service (83.5%), and Food Preparation & Serving (56.1%).
| Occupation | Male | Female |
| Healthcare Support | 91 (8.7%) | 956 (91.3%) |
| Security & Protection | 256 (76.6%) | 78 (23.4%) |
| Firefighting & Prevention | 190 (72.2%) | 73 (27.8%) |
| Law Enforcement | 66 (93.0%) | 5 (7.0%) |
| Food Preparation & Serving | 992 (43.9%) | 1,269 (56.1%) |
| Cleaning & Maintenance | 896 (56.6%) | 688 (43.4%) |
| Personal Care & Service | 147 (16.5%) | 744 (83.5%) |
| Total (Category) | 2,382 (38.9%) | 3,735 (61.1%) |
| Total (Overall) | 15,073 (55.3%) | 12,204 (44.7%) |
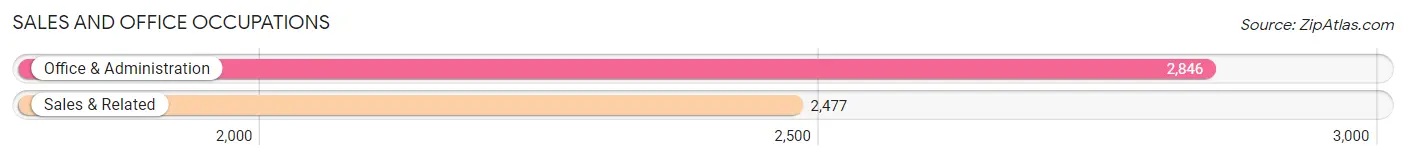
Sales and Office Occupations
The most common Sales and Office occupations in Burien are Office & Administration (2,846 | 10.4%), and Sales & Related (2,477 | 9.1%).
Sales and Office Occupations by Sex
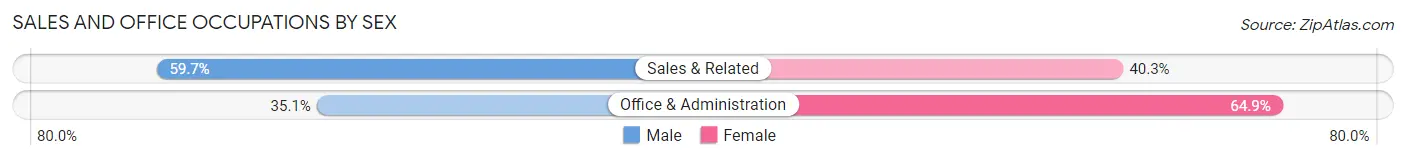
| Occupation | Male | Female |
| Sales & Related | 1,479 (59.7%) | 998 (40.3%) |
| Office & Administration | 998 (35.1%) | 1,848 (64.9%) |
| Total (Category) | 2,477 (46.5%) | 2,846 (53.5%) |
| Total (Overall) | 15,073 (55.3%) | 12,204 (44.7%) |
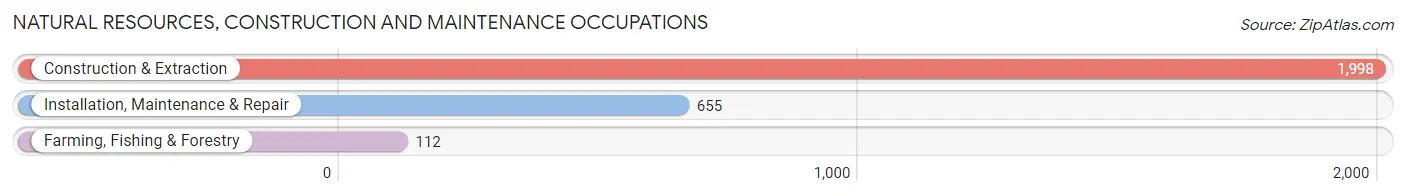
Natural Resources, Construction and Maintenance Occupations
The most common Natural Resources, Construction and Maintenance occupations in Burien are Construction & Extraction (1,998 | 7.3%), Installation, Maintenance & Repair (655 | 2.4%), and Farming, Fishing & Forestry (112 | 0.4%).
Natural Resources, Construction and Maintenance Occupations by Sex
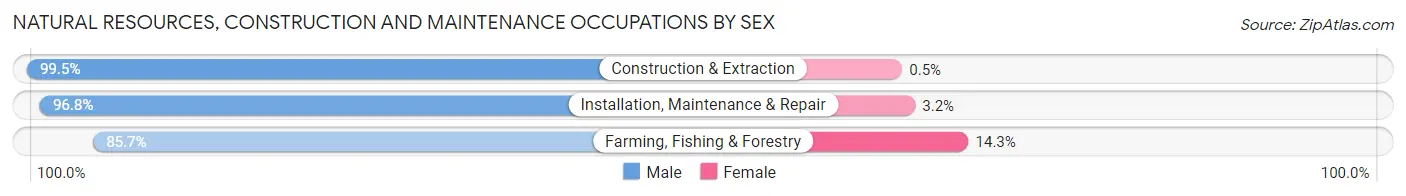
| Occupation | Male | Female |
| Farming, Fishing & Forestry | 96 (85.7%) | 16 (14.3%) |
| Construction & Extraction | 1,988 (99.5%) | 10 (0.5%) |
| Installation, Maintenance & Repair | 634 (96.8%) | 21 (3.2%) |
| Total (Category) | 2,718 (98.3%) | 47 (1.7%) |
| Total (Overall) | 15,073 (55.3%) | 12,204 (44.7%) |
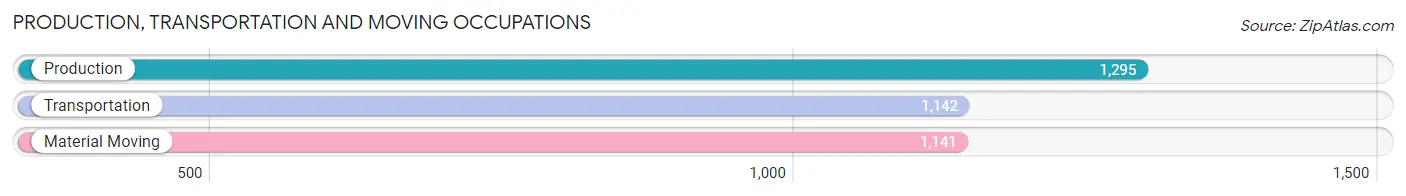
Production, Transportation and Moving Occupations
The most common Production, Transportation and Moving occupations in Burien are Production (1,295 | 4.8%), Transportation (1,142 | 4.2%), and Material Moving (1,141 | 4.2%).
Production, Transportation and Moving Occupations by Sex
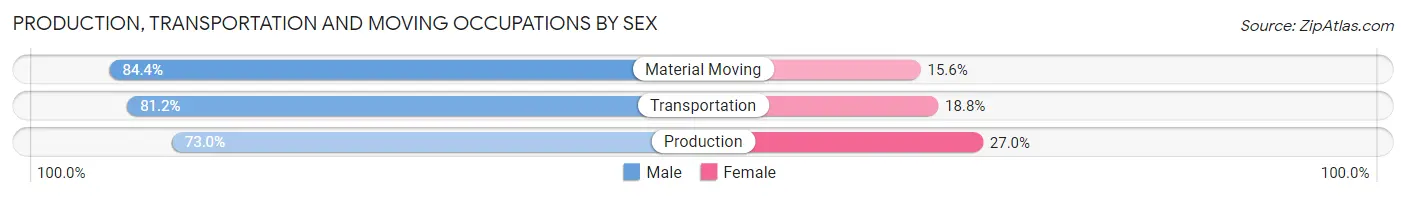
| Occupation | Male | Female |
| Production | 945 (73.0%) | 350 (27.0%) |
| Transportation | 927 (81.2%) | 215 (18.8%) |
| Material Moving | 963 (84.4%) | 178 (15.6%) |
| Total (Category) | 2,835 (79.2%) | 743 (20.8%) |
| Total (Overall) | 15,073 (55.3%) | 12,204 (44.7%) |
Employment Industries by Sex in Burien
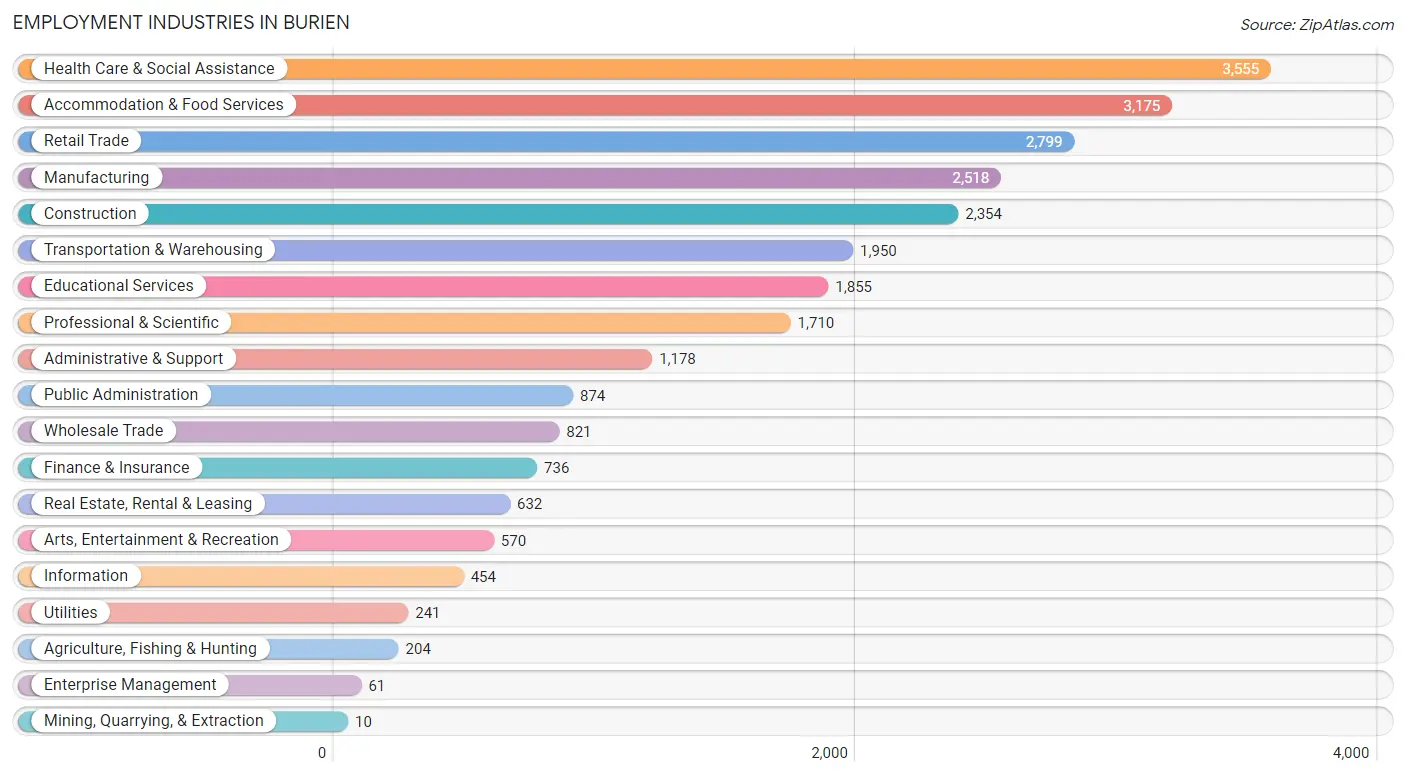
Employment Industries in Burien
The major employment industries in Burien include Health Care & Social Assistance (3,555 | 13.0%), Accommodation & Food Services (3,175 | 11.6%), Retail Trade (2,799 | 10.3%), Manufacturing (2,518 | 9.2%), and Construction (2,354 | 8.6%).
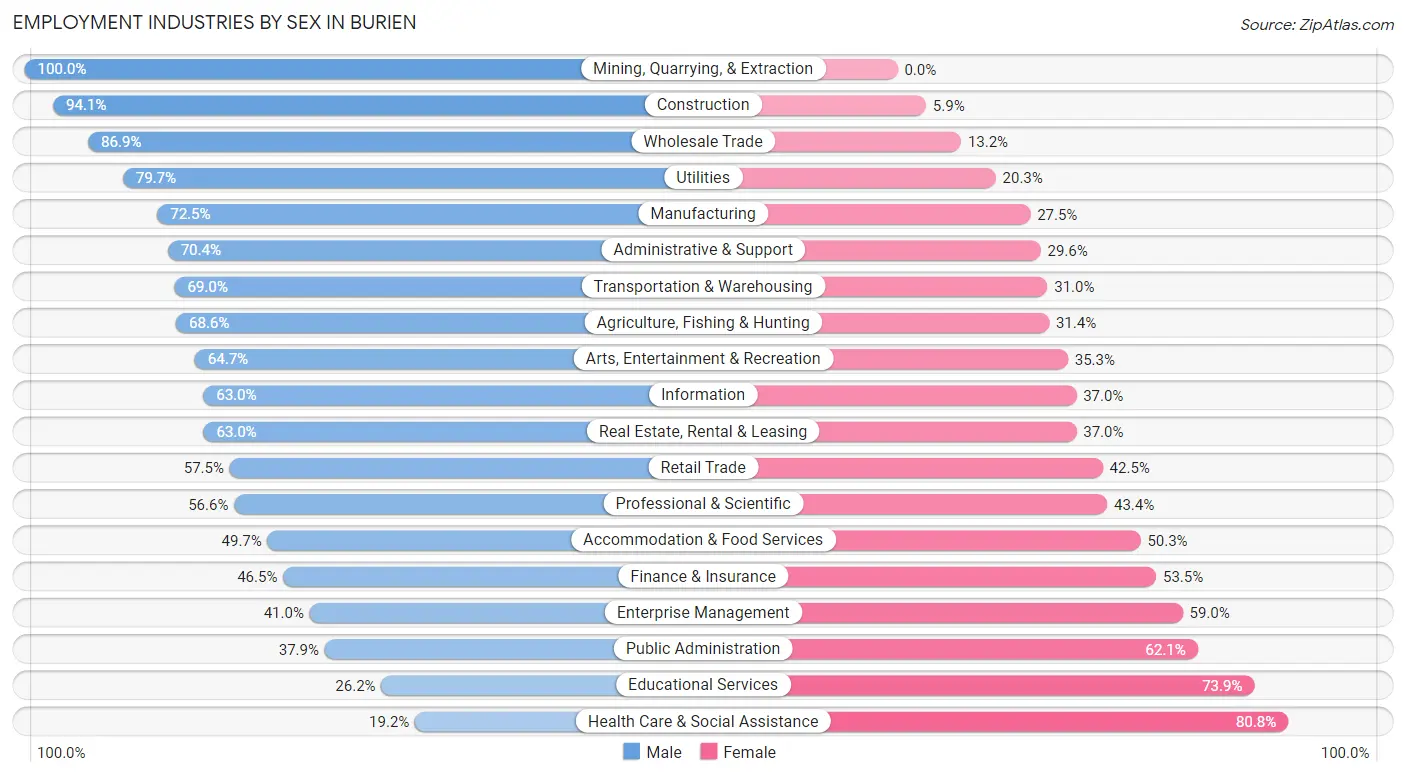
Employment Industries by Sex in Burien
The Burien industries that see more men than women are Mining, Quarrying, & Extraction (100.0%), Construction (94.1%), and Wholesale Trade (86.9%), whereas the industries that tend to have a higher number of women are Health Care & Social Assistance (80.8%), Educational Services (73.9%), and Public Administration (62.1%).
| Industry | Male | Female |
| Agriculture, Fishing & Hunting | 140 (68.6%) | 64 (31.4%) |
| Mining, Quarrying, & Extraction | 10 (100.0%) | 0 (0.0%) |
| Construction | 2,215 (94.1%) | 139 (5.9%) |
| Manufacturing | 1,826 (72.5%) | 692 (27.5%) |
| Wholesale Trade | 713 (86.9%) | 108 (13.2%) |
| Retail Trade | 1,610 (57.5%) | 1,189 (42.5%) |
| Transportation & Warehousing | 1,345 (69.0%) | 605 (31.0%) |
| Utilities | 192 (79.7%) | 49 (20.3%) |
| Information | 286 (63.0%) | 168 (37.0%) |
| Finance & Insurance | 342 (46.5%) | 394 (53.5%) |
| Real Estate, Rental & Leasing | 398 (63.0%) | 234 (37.0%) |
| Professional & Scientific | 968 (56.6%) | 742 (43.4%) |
| Enterprise Management | 25 (41.0%) | 36 (59.0%) |
| Administrative & Support | 829 (70.4%) | 349 (29.6%) |
| Educational Services | 485 (26.2%) | 1,370 (73.9%) |
| Health Care & Social Assistance | 681 (19.2%) | 2,874 (80.8%) |
| Arts, Entertainment & Recreation | 369 (64.7%) | 201 (35.3%) |
| Accommodation & Food Services | 1,578 (49.7%) | 1,597 (50.3%) |
| Public Administration | 331 (37.9%) | 543 (62.1%) |
| Total | 15,073 (55.3%) | 12,204 (44.7%) |
Education in Burien
School Enrollment in Burien
The most common levels of schooling among the 10,442 students in Burien are high school (2,788 | 26.7%), elementary school (2,276 | 21.8%), and middle school (2,236 | 21.4%).
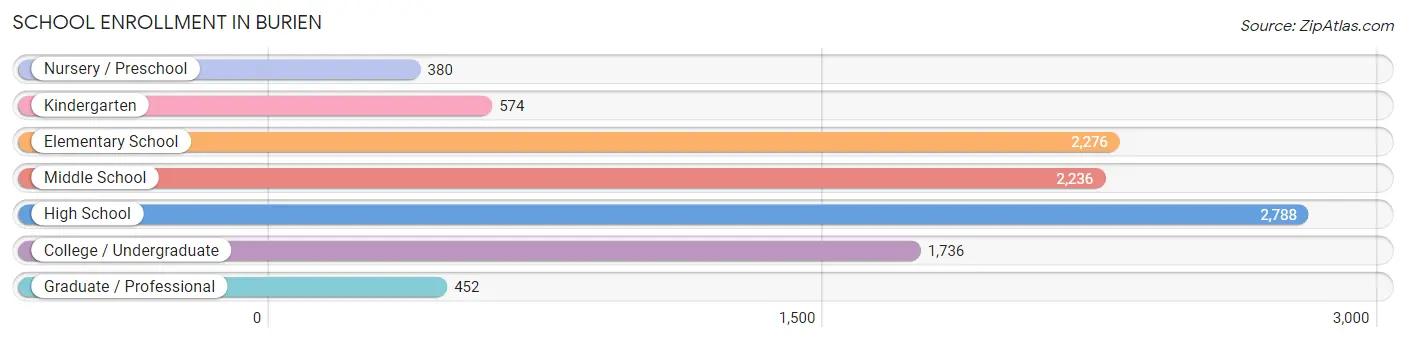
| School Level | # Students | % Students |
| Nursery / Preschool | 380 | 3.6% |
| Kindergarten | 574 | 5.5% |
| Elementary School | 2,276 | 21.8% |
| Middle School | 2,236 | 21.4% |
| High School | 2,788 | 26.7% |
| College / Undergraduate | 1,736 | 16.6% |
| Graduate / Professional | 452 | 4.3% |
| Total | 10,442 | 100.0% |
School Enrollment by Age by Funding Source in Burien
Out of a total of 10,442 students who are enrolled in schools in Burien, 1,180 (11.3%) attend a private institution, while the remaining 9,262 (88.7%) are enrolled in public schools. The age group of 3 to 4 year olds has the highest likelihood of being enrolled in private schools, with 148 (40.0% in the age bracket) enrolled. Conversely, the age group of 15 to 17 year olds has the lowest likelihood of being enrolled in a private school, with 1,875 (94.4% in the age bracket) attending a public institution.
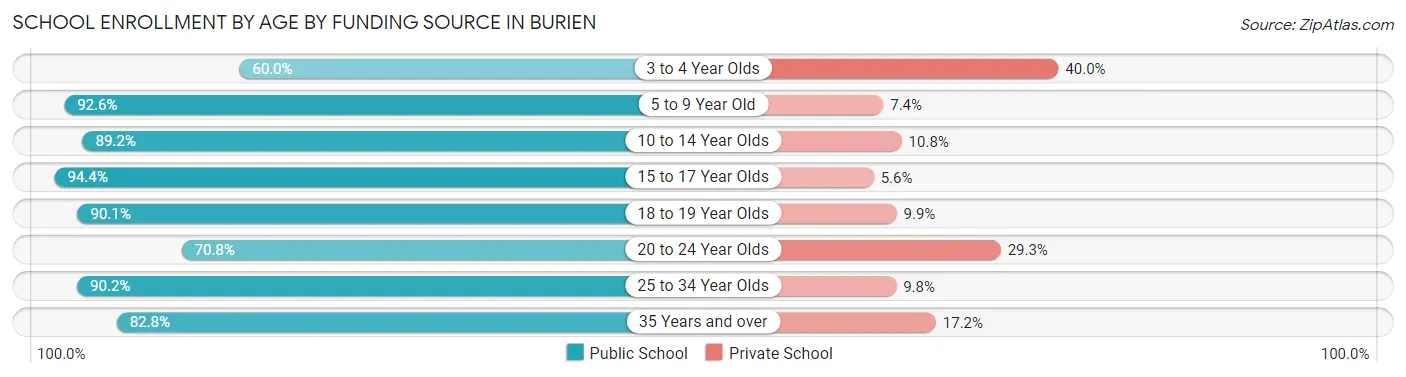
| Age Bracket | Public School | Private School |
| 3 to 4 Year Olds | 222 (60.0%) | 148 (40.0%) |
| 5 to 9 Year Old | 2,421 (92.6%) | 193 (7.4%) |
| 10 to 14 Year Olds | 2,577 (89.2%) | 312 (10.8%) |
| 15 to 17 Year Olds | 1,875 (94.4%) | 111 (5.6%) |
| 18 to 19 Year Olds | 594 (90.1%) | 65 (9.9%) |
| 20 to 24 Year Olds | 404 (70.8%) | 167 (29.2%) |
| 25 to 34 Year Olds | 590 (90.2%) | 64 (9.8%) |
| 35 Years and over | 579 (82.8%) | 120 (17.2%) |
| Total | 9,262 (88.7%) | 1,180 (11.3%) |
Educational Attainment by Field of Study in Burien
Business (1,746 | 14.2%), social sciences (1,456 | 11.8%), science & technology (1,012 | 8.2%), education (933 | 7.6%), and engineering (926 | 7.5%) are the most common fields of study among 12,317 individuals in Burien who have obtained a bachelor's degree or higher.
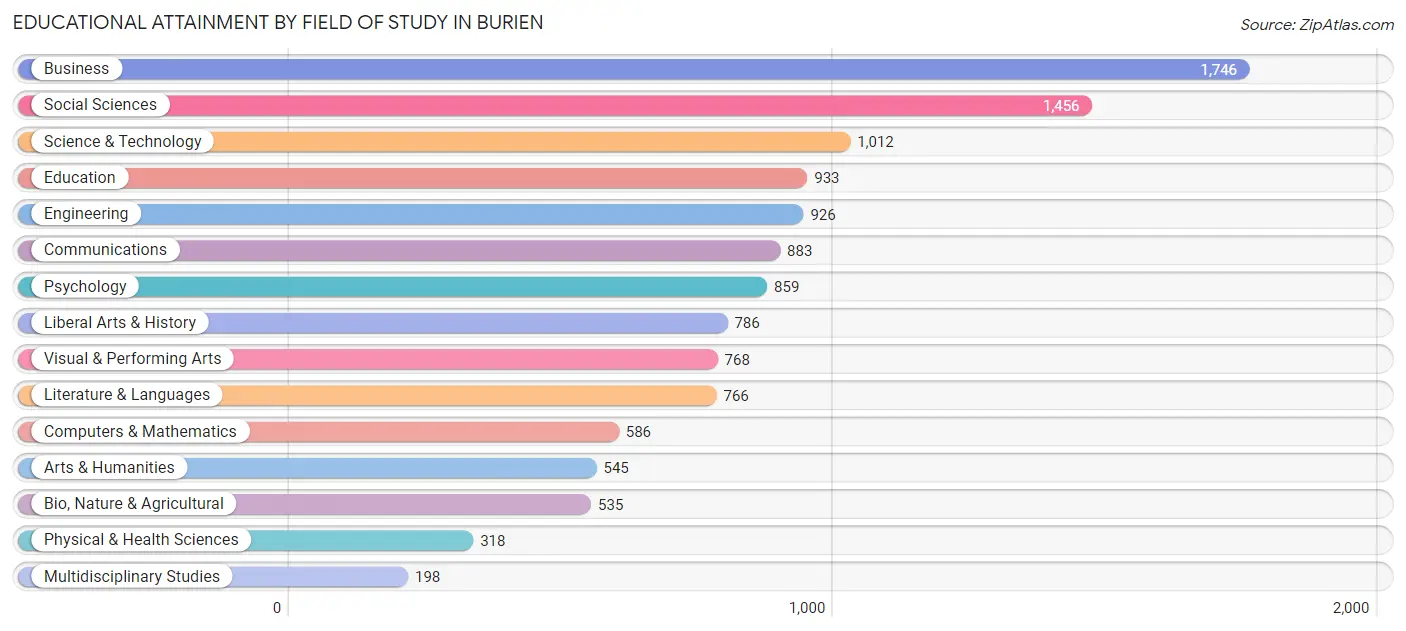
| Field of Study | # Graduates | % Graduates |
| Computers & Mathematics | 586 | 4.8% |
| Bio, Nature & Agricultural | 535 | 4.3% |
| Physical & Health Sciences | 318 | 2.6% |
| Psychology | 859 | 7.0% |
| Social Sciences | 1,456 | 11.8% |
| Engineering | 926 | 7.5% |
| Multidisciplinary Studies | 198 | 1.6% |
| Science & Technology | 1,012 | 8.2% |
| Business | 1,746 | 14.2% |
| Education | 933 | 7.6% |
| Literature & Languages | 766 | 6.2% |
| Liberal Arts & History | 786 | 6.4% |
| Visual & Performing Arts | 768 | 6.2% |
| Communications | 883 | 7.2% |
| Arts & Humanities | 545 | 4.4% |
| Total | 12,317 | 100.0% |
Transportation & Commute in Burien
Vehicle Availability by Sex in Burien
The most prevalent vehicle ownership categories in Burien are males with 2 vehicles (5,626, accounting for 38.1%) and females with 2 vehicles (4,549, making up 48.1%).
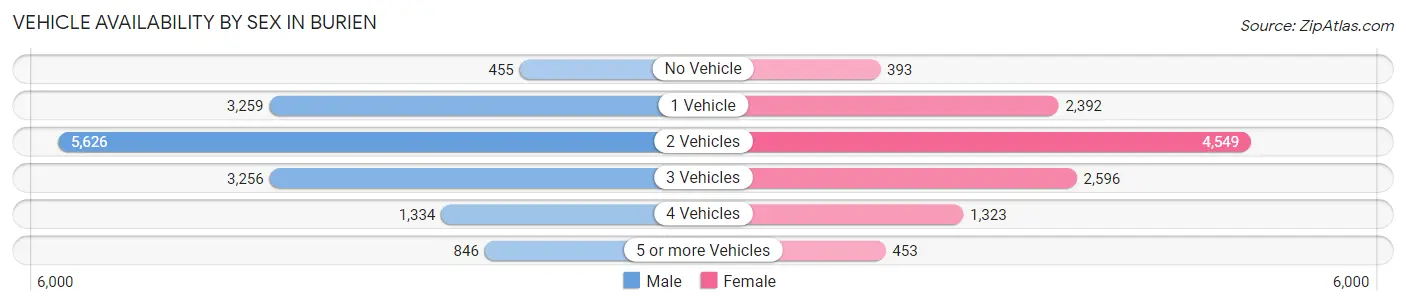
| Vehicles Available | Male | Female |
| No Vehicle | 455 (3.1%) | 393 (3.4%) |
| 1 Vehicle | 3,259 (22.1%) | 2,392 (20.4%) |
| 2 Vehicles | 5,626 (38.1%) | 4,549 (38.9%) |
| 3 Vehicles | 3,256 (22.0%) | 2,596 (22.2%) |
| 4 Vehicles | 1,334 (9.0%) | 1,323 (11.3%) |
| 5 or more Vehicles | 846 (5.7%) | 453 (3.9%) |
| Total | 14,776 (100.0%) | 11,706 (100.0%) |
Commute Time in Burien
The most frequently occuring commute durations in Burien are 20 to 24 minutes (3,627 commuters, 15.9%), 30 to 34 minutes (3,562 commuters, 15.6%), and 15 to 19 minutes (3,188 commuters, 13.9%).
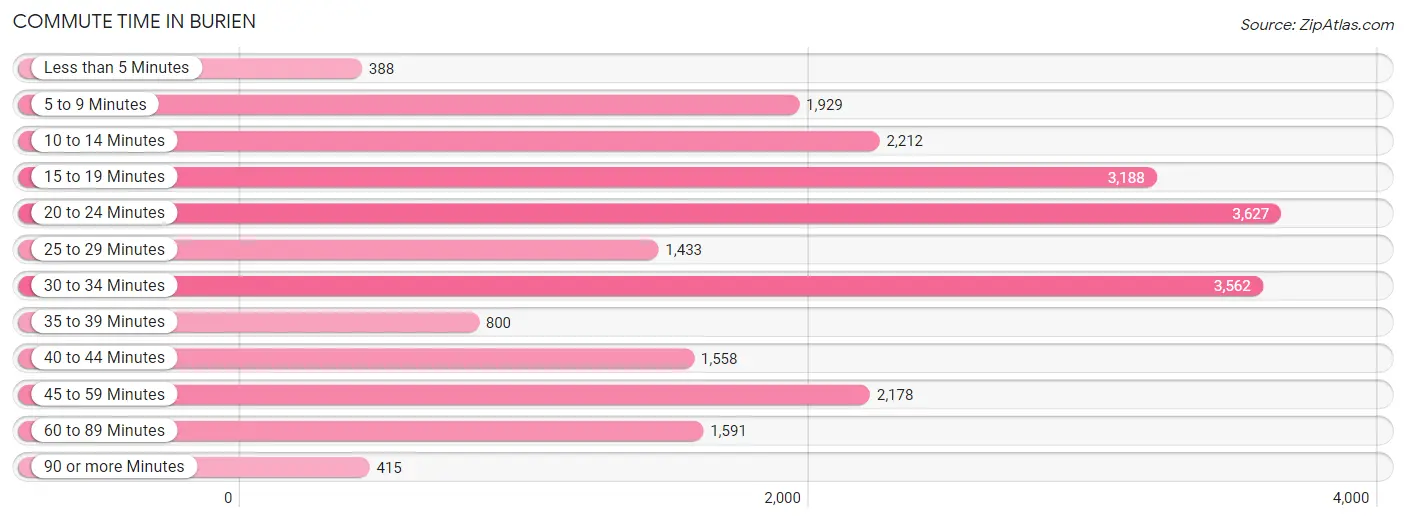
| Commute Time | # Commuters | % Commuters |
| Less than 5 Minutes | 388 | 1.7% |
| 5 to 9 Minutes | 1,929 | 8.4% |
| 10 to 14 Minutes | 2,212 | 9.7% |
| 15 to 19 Minutes | 3,188 | 13.9% |
| 20 to 24 Minutes | 3,627 | 15.9% |
| 25 to 29 Minutes | 1,433 | 6.3% |
| 30 to 34 Minutes | 3,562 | 15.6% |
| 35 to 39 Minutes | 800 | 3.5% |
| 40 to 44 Minutes | 1,558 | 6.8% |
| 45 to 59 Minutes | 2,178 | 9.5% |
| 60 to 89 Minutes | 1,591 | 7.0% |
| 90 or more Minutes | 415 | 1.8% |
Commute Time by Sex in Burien
The most common commute times in Burien are 20 to 24 minutes (2,360 commuters, 18.2%) for males and 30 to 34 minutes (1,714 commuters, 17.3%) for females.
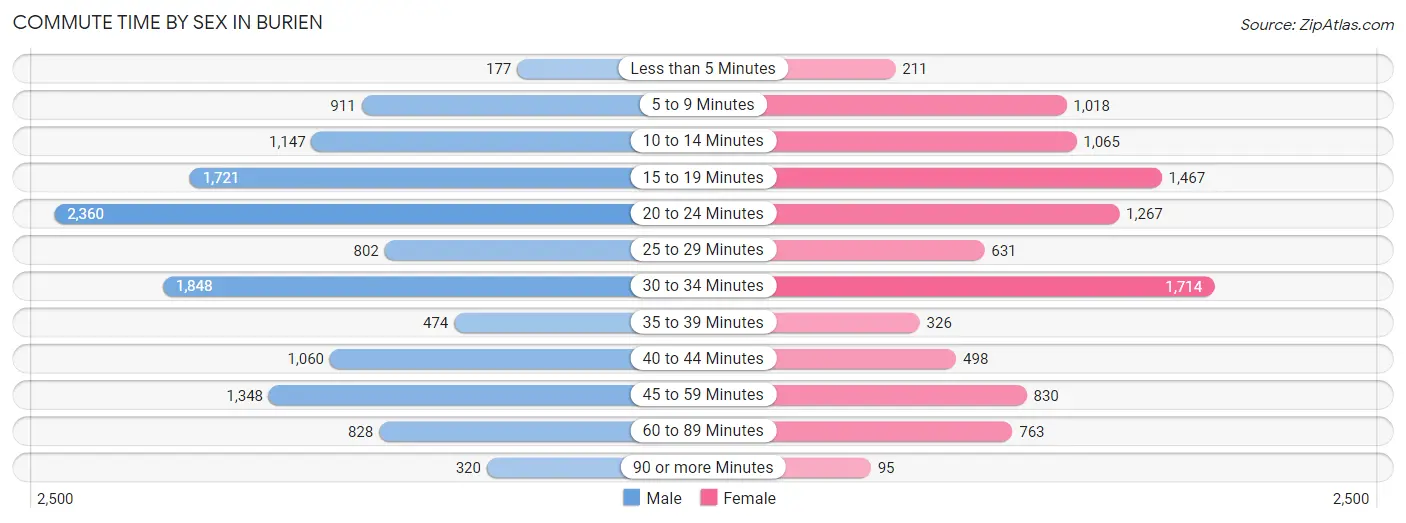
| Commute Time | Male | Female |
| Less than 5 Minutes | 177 (1.4%) | 211 (2.1%) |
| 5 to 9 Minutes | 911 (7.0%) | 1,018 (10.3%) |
| 10 to 14 Minutes | 1,147 (8.8%) | 1,065 (10.8%) |
| 15 to 19 Minutes | 1,721 (13.2%) | 1,467 (14.8%) |
| 20 to 24 Minutes | 2,360 (18.2%) | 1,267 (12.8%) |
| 25 to 29 Minutes | 802 (6.2%) | 631 (6.4%) |
| 30 to 34 Minutes | 1,848 (14.2%) | 1,714 (17.3%) |
| 35 to 39 Minutes | 474 (3.6%) | 326 (3.3%) |
| 40 to 44 Minutes | 1,060 (8.2%) | 498 (5.0%) |
| 45 to 59 Minutes | 1,348 (10.4%) | 830 (8.4%) |
| 60 to 89 Minutes | 828 (6.4%) | 763 (7.7%) |
| 90 or more Minutes | 320 (2.5%) | 95 (1.0%) |
Time of Departure to Work by Sex in Burien
The most frequent times of departure to work in Burien are 7:00 AM to 7:29 AM (1,804, 13.9%) for males and 7:00 AM to 7:29 AM (1,447, 14.6%) for females.
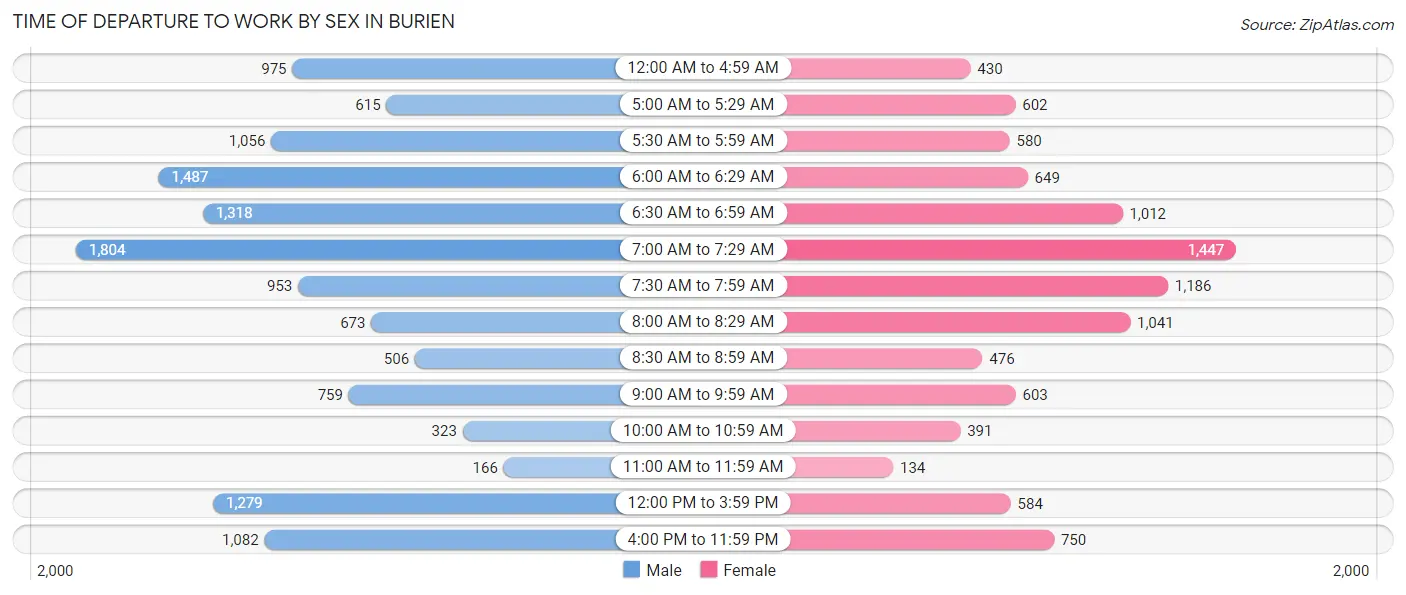
| Time of Departure | Male | Female |
| 12:00 AM to 4:59 AM | 975 (7.5%) | 430 (4.3%) |
| 5:00 AM to 5:29 AM | 615 (4.7%) | 602 (6.1%) |
| 5:30 AM to 5:59 AM | 1,056 (8.1%) | 580 (5.9%) |
| 6:00 AM to 6:29 AM | 1,487 (11.4%) | 649 (6.6%) |
| 6:30 AM to 6:59 AM | 1,318 (10.1%) | 1,012 (10.2%) |
| 7:00 AM to 7:29 AM | 1,804 (13.9%) | 1,447 (14.6%) |
| 7:30 AM to 7:59 AM | 953 (7.3%) | 1,186 (12.0%) |
| 8:00 AM to 8:29 AM | 673 (5.2%) | 1,041 (10.5%) |
| 8:30 AM to 8:59 AM | 506 (3.9%) | 476 (4.8%) |
| 9:00 AM to 9:59 AM | 759 (5.8%) | 603 (6.1%) |
| 10:00 AM to 10:59 AM | 323 (2.5%) | 391 (4.0%) |
| 11:00 AM to 11:59 AM | 166 (1.3%) | 134 (1.4%) |
| 12:00 PM to 3:59 PM | 1,279 (9.8%) | 584 (5.9%) |
| 4:00 PM to 11:59 PM | 1,082 (8.3%) | 750 (7.6%) |
| Total | 12,996 (100.0%) | 9,885 (100.0%) |
Housing Occupancy in Burien
Occupancy by Ownership in Burien
Of the total 19,903 dwellings in Burien, owner-occupied units account for 11,280 (56.7%), while renter-occupied units make up 8,623 (43.3%).
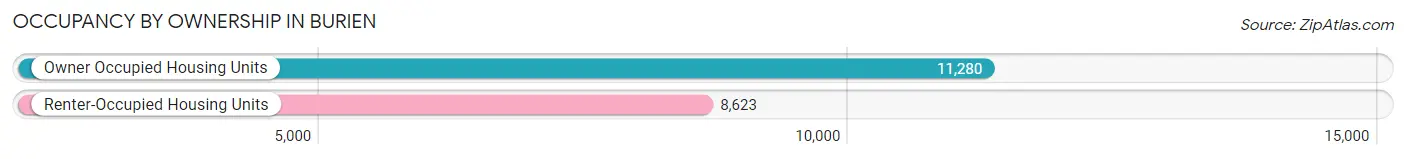
| Occupancy | # Housing Units | % Housing Units |
| Owner Occupied Housing Units | 11,280 | 56.7% |
| Renter-Occupied Housing Units | 8,623 | 43.3% |
| Total Occupied Housing Units | 19,903 | 100.0% |
Occupancy by Household Size in Burien
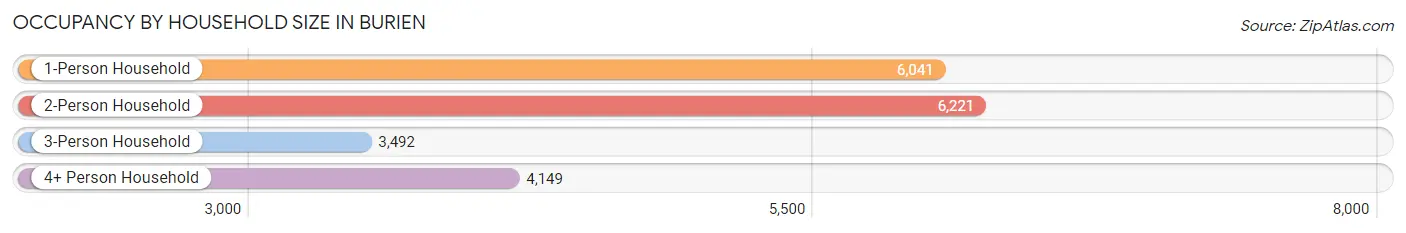
| Household Size | # Housing Units | % Housing Units |
| 1-Person Household | 6,041 | 30.3% |
| 2-Person Household | 6,221 | 31.3% |
| 3-Person Household | 3,492 | 17.5% |
| 4+ Person Household | 4,149 | 20.8% |
| Total Housing Units | 19,903 | 100.0% |
Occupancy by Ownership by Household Size in Burien
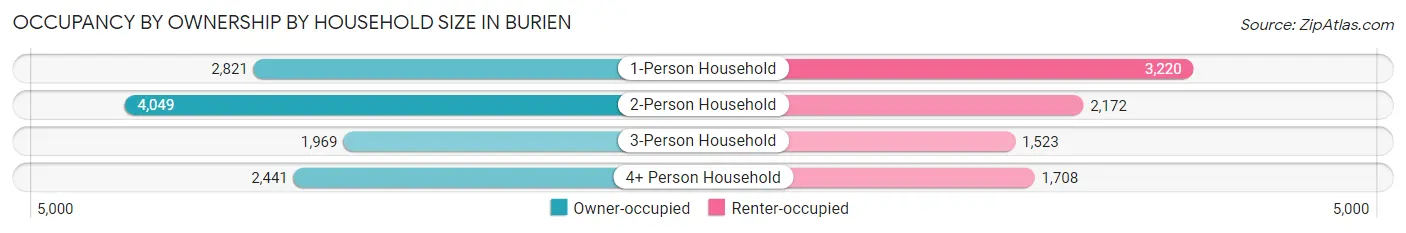
| Household Size | Owner-occupied | Renter-occupied |
| 1-Person Household | 2,821 (46.7%) | 3,220 (53.3%) |
| 2-Person Household | 4,049 (65.1%) | 2,172 (34.9%) |
| 3-Person Household | 1,969 (56.4%) | 1,523 (43.6%) |
| 4+ Person Household | 2,441 (58.8%) | 1,708 (41.2%) |
| Total Housing Units | 11,280 (56.7%) | 8,623 (43.3%) |
Occupancy by Educational Attainment in Burien
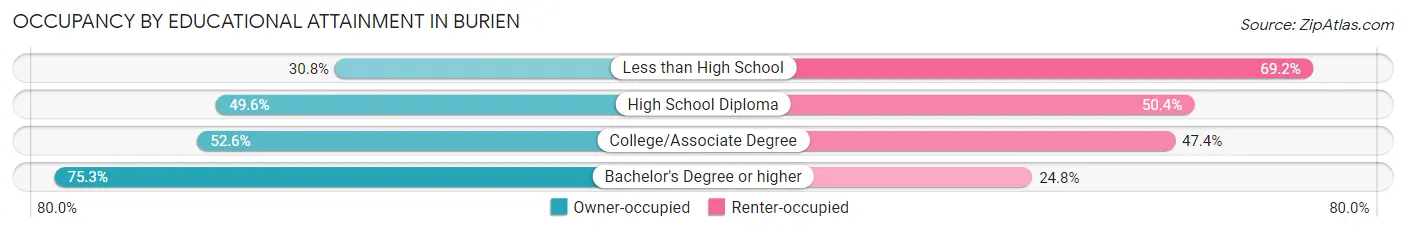
| Household Size | Owner-occupied | Renter-occupied |
| Less than High School | 711 (30.8%) | 1,599 (69.2%) |
| High School Diploma | 1,990 (49.6%) | 2,024 (50.4%) |
| College/Associate Degree | 3,805 (52.6%) | 3,430 (47.4%) |
| Bachelor's Degree or higher | 4,774 (75.2%) | 1,570 (24.7%) |
Occupancy by Age of Householder in Burien
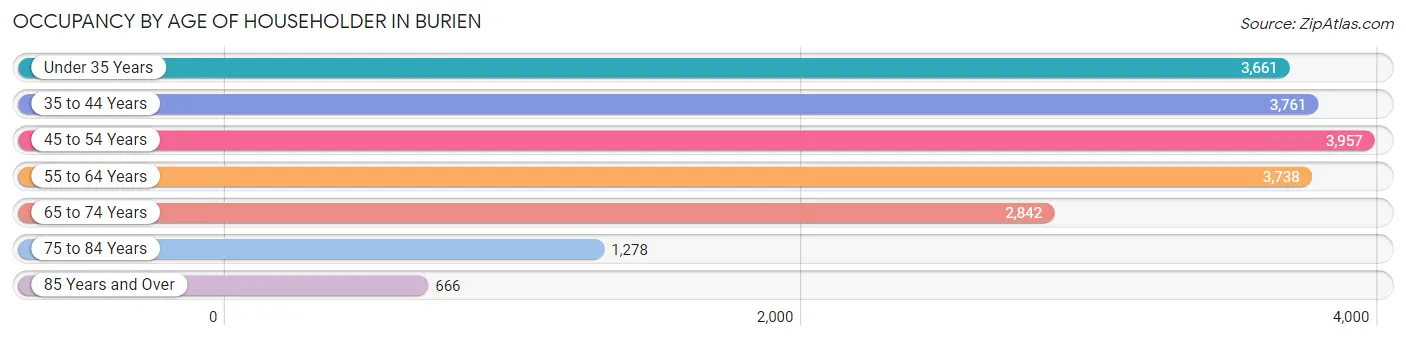
| Age Bracket | # Households | % Households |
| Under 35 Years | 3,661 | 18.4% |
| 35 to 44 Years | 3,761 | 18.9% |
| 45 to 54 Years | 3,957 | 19.9% |
| 55 to 64 Years | 3,738 | 18.8% |
| 65 to 74 Years | 2,842 | 14.3% |
| 75 to 84 Years | 1,278 | 6.4% |
| 85 Years and Over | 666 | 3.4% |
| Total | 19,903 | 100.0% |
Housing Finances in Burien
Median Income by Occupancy in Burien
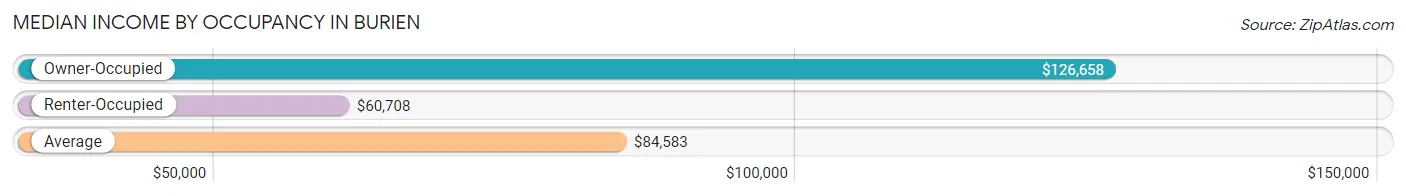
| Occupancy Type | # Households | Median Income |
| Owner-Occupied | 11,280 (56.7%) | $126,658 |
| Renter-Occupied | 8,623 (43.3%) | $60,708 |
| Average | 19,903 (100.0%) | $84,583 |
Occupancy by Householder Income Bracket in Burien
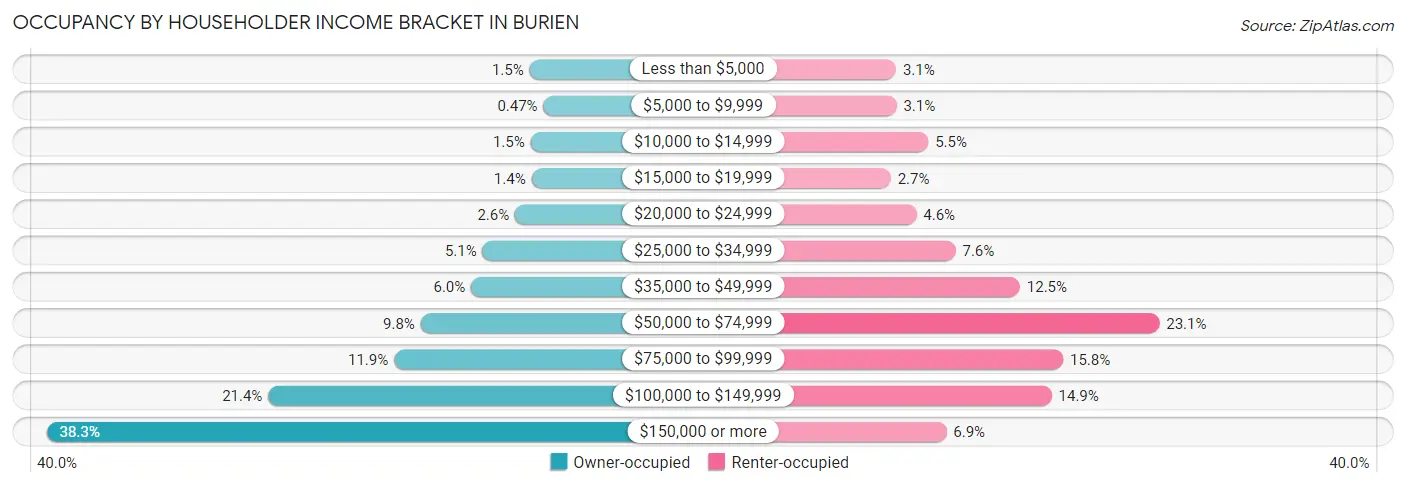
| Income Bracket | Owner-occupied | Renter-occupied |
| Less than $5,000 | 173 (1.5%) | 266 (3.1%) |
| $5,000 to $9,999 | 53 (0.5%) | 269 (3.1%) |
| $10,000 to $14,999 | 163 (1.5%) | 478 (5.5%) |
| $15,000 to $19,999 | 156 (1.4%) | 231 (2.7%) |
| $20,000 to $24,999 | 297 (2.6%) | 399 (4.6%) |
| $25,000 to $34,999 | 576 (5.1%) | 657 (7.6%) |
| $35,000 to $49,999 | 675 (6.0%) | 1,080 (12.5%) |
| $50,000 to $74,999 | 1,108 (9.8%) | 1,995 (23.1%) |
| $75,000 to $99,999 | 1,337 (11.8%) | 1,363 (15.8%) |
| $100,000 to $149,999 | 2,418 (21.4%) | 1,288 (14.9%) |
| $150,000 or more | 4,324 (38.3%) | 597 (6.9%) |
| Total | 11,280 (100.0%) | 8,623 (100.0%) |
Monthly Housing Cost Tiers in Burien
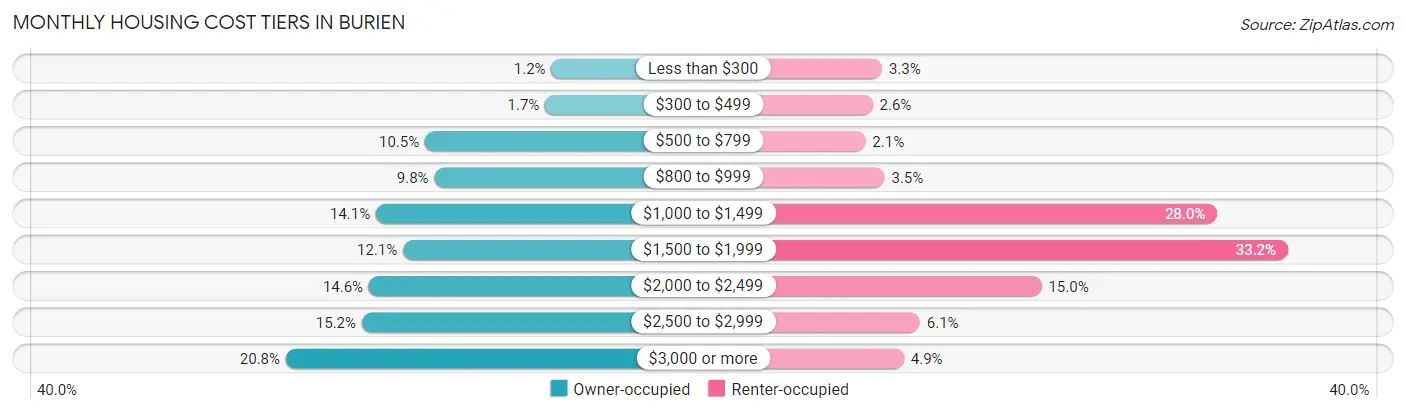
| Monthly Cost | Owner-occupied | Renter-occupied |
| Less than $300 | 135 (1.2%) | 283 (3.3%) |
| $300 to $499 | 187 (1.7%) | 223 (2.6%) |
| $500 to $799 | 1,186 (10.5%) | 178 (2.1%) |
| $800 to $999 | 1,108 (9.8%) | 299 (3.5%) |
| $1,000 to $1,499 | 1,593 (14.1%) | 2,412 (28.0%) |
| $1,500 to $1,999 | 1,368 (12.1%) | 2,860 (33.2%) |
| $2,000 to $2,499 | 1,651 (14.6%) | 1,296 (15.0%) |
| $2,500 to $2,999 | 1,710 (15.2%) | 523 (6.1%) |
| $3,000 or more | 2,342 (20.8%) | 422 (4.9%) |
| Total | 11,280 (100.0%) | 8,623 (100.0%) |
Physical Housing Characteristics in Burien
Housing Structures in Burien
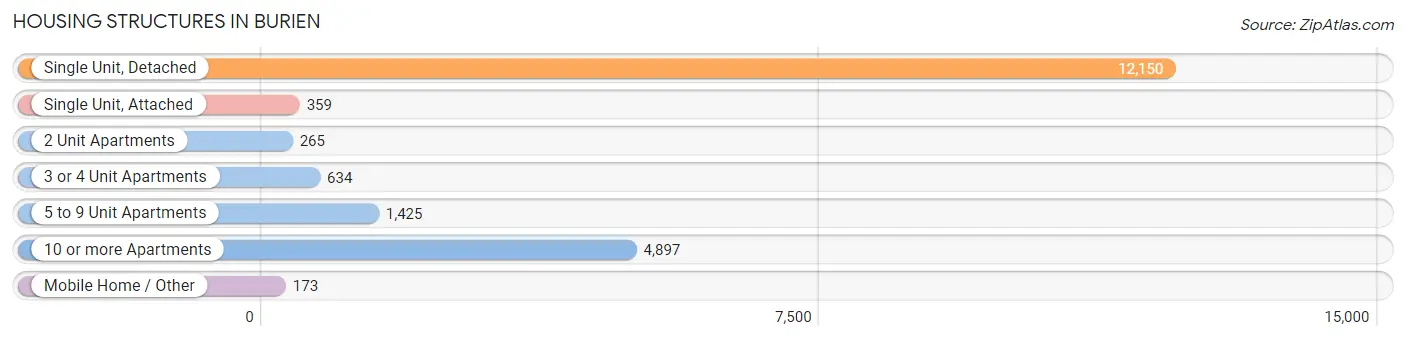
| Structure Type | # Housing Units | % Housing Units |
| Single Unit, Detached | 12,150 | 61.1% |
| Single Unit, Attached | 359 | 1.8% |
| 2 Unit Apartments | 265 | 1.3% |
| 3 or 4 Unit Apartments | 634 | 3.2% |
| 5 to 9 Unit Apartments | 1,425 | 7.2% |
| 10 or more Apartments | 4,897 | 24.6% |
| Mobile Home / Other | 173 | 0.9% |
| Total | 19,903 | 100.0% |
Housing Structures by Occupancy in Burien
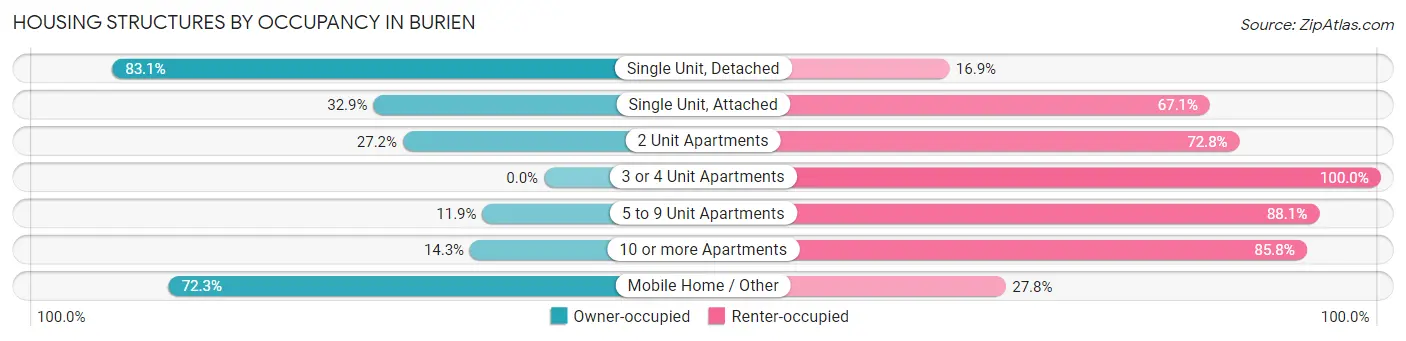
| Structure Type | Owner-occupied | Renter-occupied |
| Single Unit, Detached | 10,098 (83.1%) | 2,052 (16.9%) |
| Single Unit, Attached | 118 (32.9%) | 241 (67.1%) |
| 2 Unit Apartments | 72 (27.2%) | 193 (72.8%) |
| 3 or 4 Unit Apartments | 0 (0.0%) | 634 (100.0%) |
| 5 to 9 Unit Apartments | 169 (11.9%) | 1,256 (88.1%) |
| 10 or more Apartments | 698 (14.2%) | 4,199 (85.8%) |
| Mobile Home / Other | 125 (72.3%) | 48 (27.8%) |
| Total | 11,280 (56.7%) | 8,623 (43.3%) |
Housing Structures by Number of Rooms in Burien
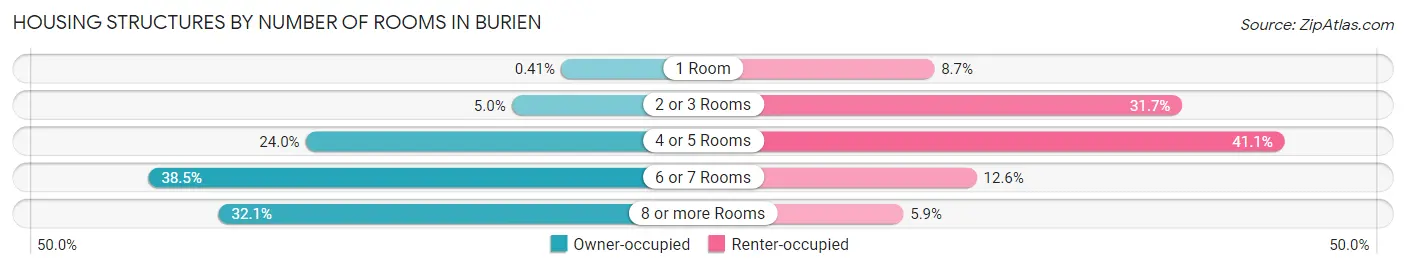
| Number of Rooms | Owner-occupied | Renter-occupied |
| 1 Room | 46 (0.4%) | 752 (8.7%) |
| 2 or 3 Rooms | 561 (5.0%) | 2,729 (31.7%) |
| 4 or 5 Rooms | 2,711 (24.0%) | 3,547 (41.1%) |
| 6 or 7 Rooms | 4,347 (38.5%) | 1,090 (12.6%) |
| 8 or more Rooms | 3,615 (32.1%) | 505 (5.9%) |
| Total | 11,280 (100.0%) | 8,623 (100.0%) |
Housing Structure by Heating Type in Burien
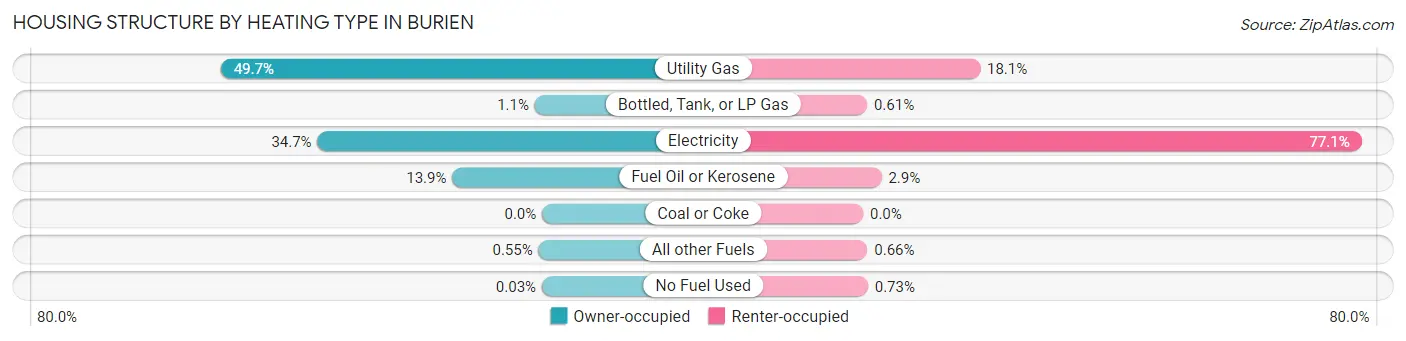
| Heating Type | Owner-occupied | Renter-occupied |
| Utility Gas | 5,604 (49.7%) | 1,559 (18.1%) |
| Bottled, Tank, or LP Gas | 128 (1.1%) | 53 (0.6%) |
| Electricity | 3,917 (34.7%) | 6,645 (77.1%) |
| Fuel Oil or Kerosene | 1,566 (13.9%) | 246 (2.9%) |
| Coal or Coke | 0 (0.0%) | 0 (0.0%) |
| All other Fuels | 62 (0.5%) | 57 (0.7%) |
| No Fuel Used | 3 (0.0%) | 63 (0.7%) |
| Total | 11,280 (100.0%) | 8,623 (100.0%) |
Household Vehicle Usage in Burien
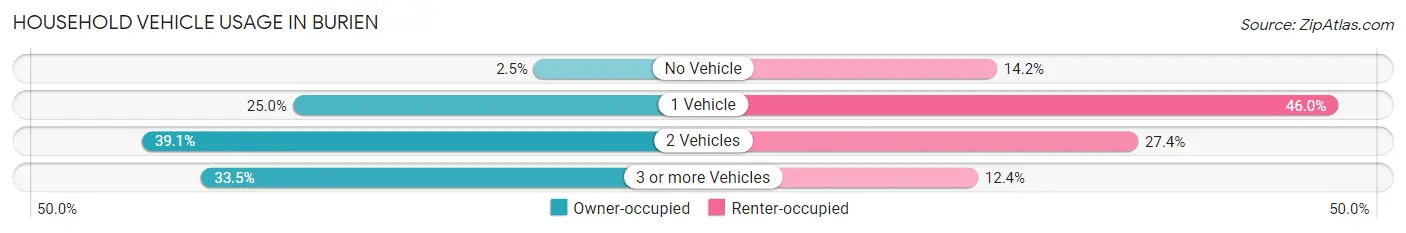
| Vehicles per Household | Owner-occupied | Renter-occupied |
| No Vehicle | 279 (2.5%) | 1,224 (14.2%) |
| 1 Vehicle | 2,816 (25.0%) | 3,969 (46.0%) |
| 2 Vehicles | 4,406 (39.1%) | 2,360 (27.4%) |
| 3 or more Vehicles | 3,779 (33.5%) | 1,070 (12.4%) |
| Total | 11,280 (100.0%) | 8,623 (100.0%) |
Real Estate & Mortgages in Burien
Real Estate and Mortgage Overview in Burien
| Characteristic | Without Mortgage | With Mortgage |
| Housing Units | 3,595 | 7,685 |
| Median Property Value | $570,900 | $564,300 |
| Median Household Income | $80,958 | $3,458 |
| Monthly Housing Costs | $860 | $2,342 |
| Real Estate Taxes | $5,357 | $133 |
Property Value by Mortgage Status in Burien
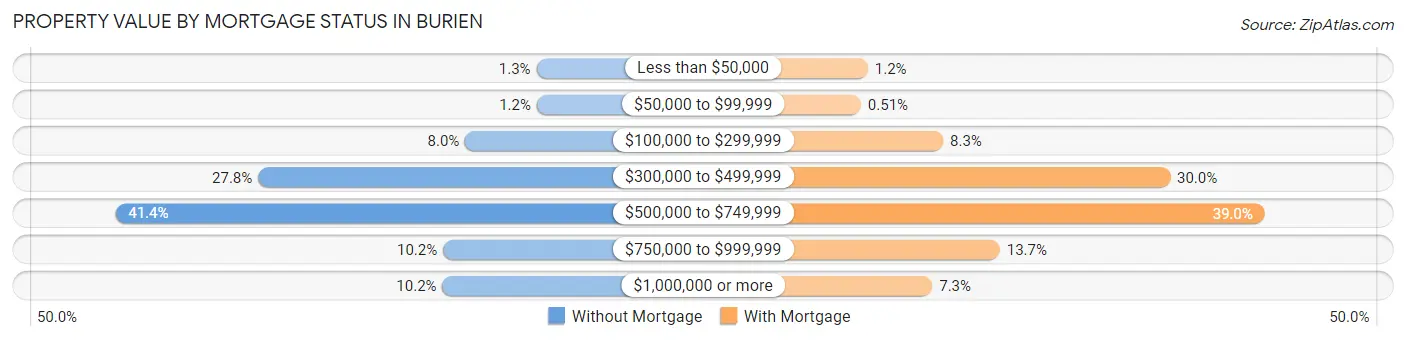
| Property Value | Without Mortgage | With Mortgage |
| Less than $50,000 | 45 (1.3%) | 90 (1.2%) |
| $50,000 to $99,999 | 44 (1.2%) | 39 (0.5%) |
| $100,000 to $299,999 | 289 (8.0%) | 641 (8.3%) |
| $300,000 to $499,999 | 998 (27.8%) | 2,302 (29.9%) |
| $500,000 to $749,999 | 1,487 (41.4%) | 2,995 (39.0%) |
| $750,000 to $999,999 | 365 (10.2%) | 1,056 (13.7%) |
| $1,000,000 or more | 367 (10.2%) | 562 (7.3%) |
| Total | 3,595 (100.0%) | 7,685 (100.0%) |
Household Income by Mortgage Status in Burien
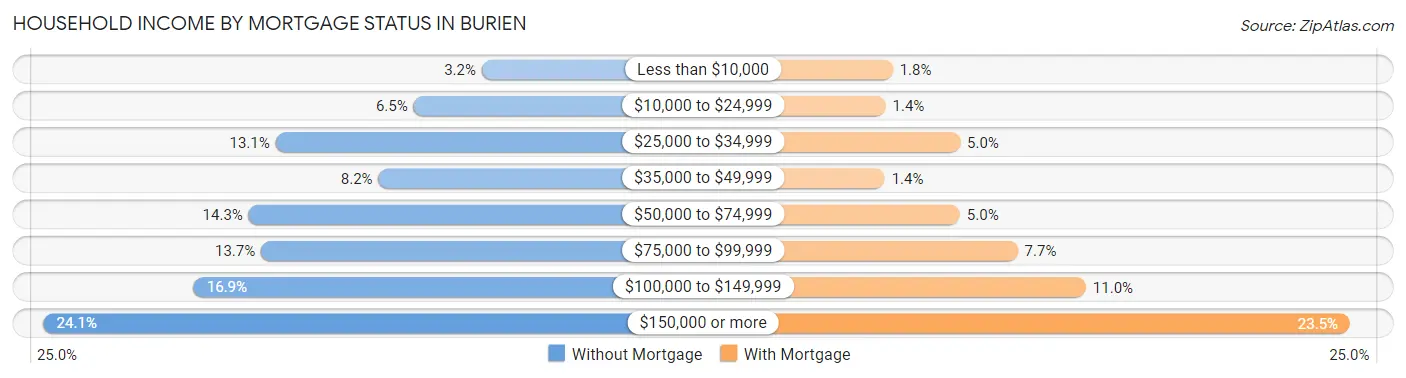
| Household Income | Without Mortgage | With Mortgage |
| Less than $10,000 | 116 (3.2%) | 136 (1.8%) |
| $10,000 to $24,999 | 233 (6.5%) | 110 (1.4%) |
| $25,000 to $34,999 | 469 (13.1%) | 383 (5.0%) |
| $35,000 to $49,999 | 293 (8.2%) | 107 (1.4%) |
| $50,000 to $74,999 | 515 (14.3%) | 382 (5.0%) |
| $75,000 to $99,999 | 494 (13.7%) | 593 (7.7%) |
| $100,000 to $149,999 | 609 (16.9%) | 843 (11.0%) |
| $150,000 or more | 866 (24.1%) | 1,809 (23.5%) |
| Total | 3,595 (100.0%) | 7,685 (100.0%) |
Property Value to Household Income Ratio in Burien
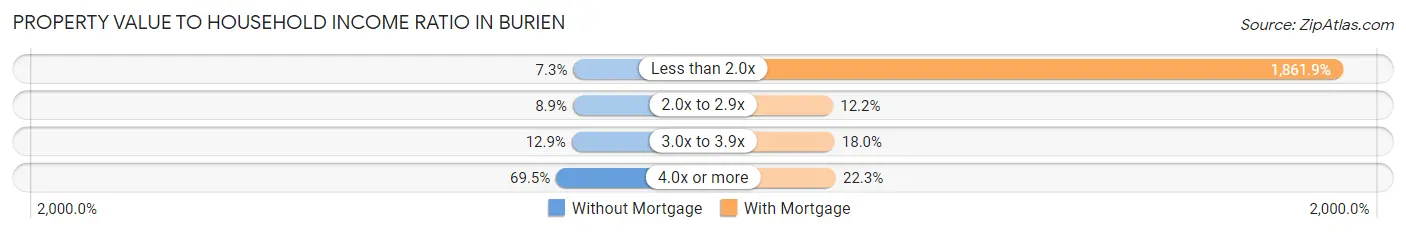
| Value-to-Income Ratio | Without Mortgage | With Mortgage |
| Less than 2.0x | 261 (7.3%) | 143,086 (1,861.9%) |
| 2.0x to 2.9x | 320 (8.9%) | 940 (12.2%) |
| 3.0x to 3.9x | 463 (12.9%) | 1,382 (18.0%) |
| 4.0x or more | 2,497 (69.5%) | 1,714 (22.3%) |
| Total | 3,595 (100.0%) | 7,685 (100.0%) |
Real Estate Taxes by Mortgage Status in Burien
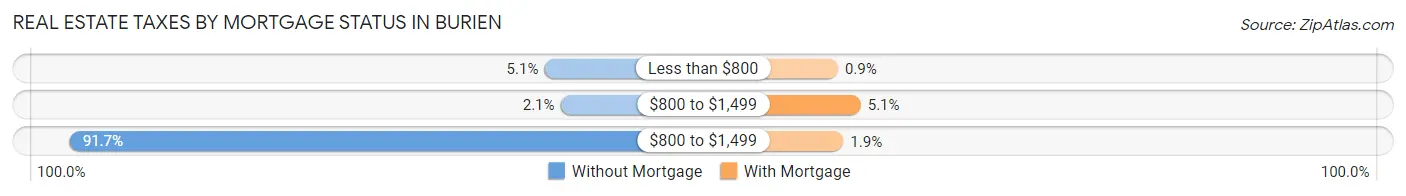
| Property Taxes | Without Mortgage | With Mortgage |
| Less than $800 | 183 (5.1%) | 69 (0.9%) |
| $800 to $1,499 | 77 (2.1%) | 390 (5.1%) |
| $800 to $1,499 | 3,298 (91.7%) | 145 (1.9%) |
| Total | 3,595 (100.0%) | 7,685 (100.0%) |
Health & Disability in Burien
Health Insurance Coverage by Age in Burien
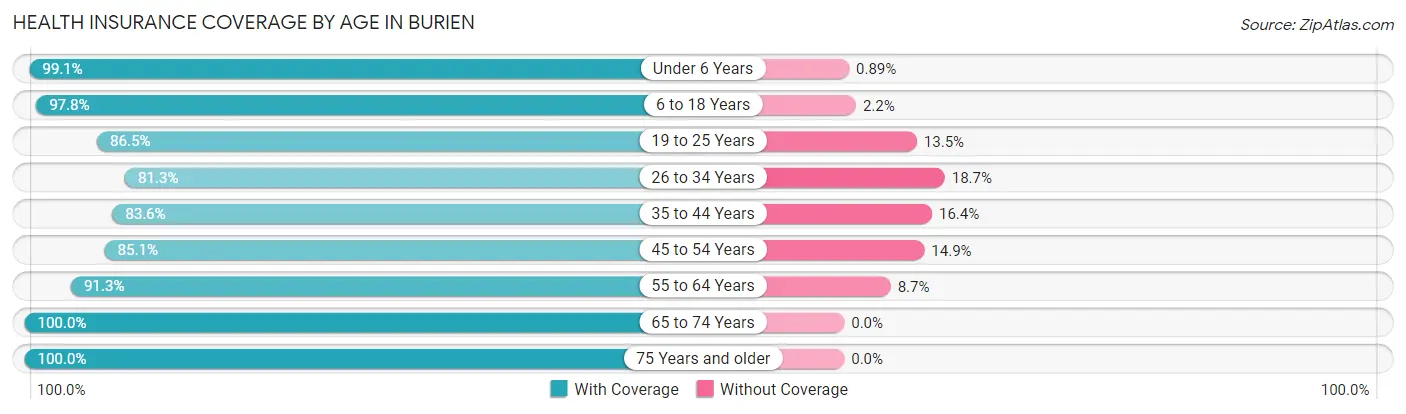
| Age Bracket | With Coverage | Without Coverage |
| Under 6 Years | 3,337 (99.1%) | 30 (0.9%) |
| 6 to 18 Years | 7,679 (97.8%) | 171 (2.2%) |
| 19 to 25 Years | 3,281 (86.5%) | 514 (13.5%) |
| 26 to 34 Years | 5,368 (81.3%) | 1,238 (18.7%) |
| 35 to 44 Years | 7,033 (83.6%) | 1,377 (16.4%) |
| 45 to 54 Years | 5,874 (85.1%) | 1,032 (14.9%) |
| 55 to 64 Years | 6,031 (91.3%) | 572 (8.7%) |
| 65 to 74 Years | 4,769 (100.0%) | 0 (0.0%) |
| 75 Years and older | 2,932 (100.0%) | 0 (0.0%) |
| Total | 46,304 (90.4%) | 4,934 (9.6%) |
Health Insurance Coverage by Citizenship Status in Burien
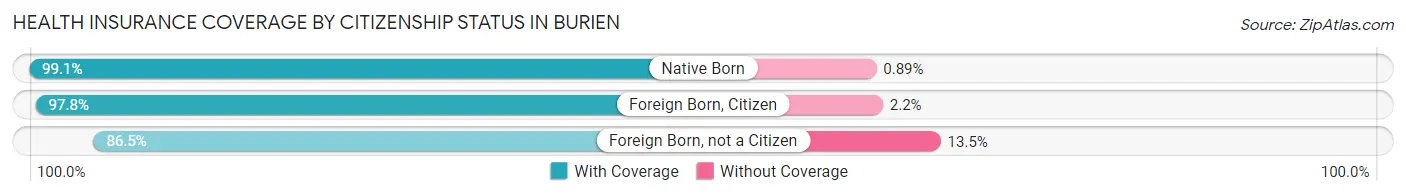
| Citizenship Status | With Coverage | Without Coverage |
| Native Born | 3,337 (99.1%) | 30 (0.9%) |
| Foreign Born, Citizen | 7,679 (97.8%) | 171 (2.2%) |
| Foreign Born, not a Citizen | 3,281 (86.5%) | 514 (13.5%) |
Health Insurance Coverage by Household Income in Burien
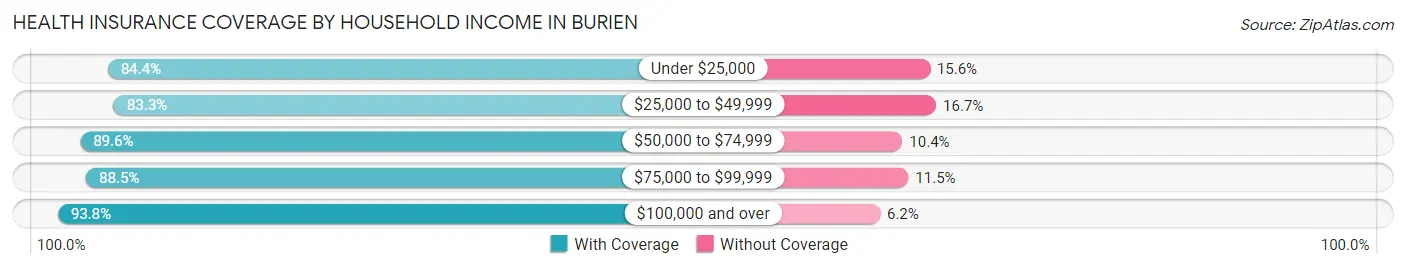
| Household Income | With Coverage | Without Coverage |
| Under $25,000 | 3,539 (84.4%) | 653 (15.6%) |
| $25,000 to $49,999 | 5,470 (83.3%) | 1,100 (16.7%) |
| $50,000 to $74,999 | 6,669 (89.6%) | 776 (10.4%) |
| $75,000 to $99,999 | 5,946 (88.5%) | 776 (11.5%) |
| $100,000 and over | 24,372 (93.8%) | 1,618 (6.2%) |
Public vs Private Health Insurance Coverage by Age in Burien
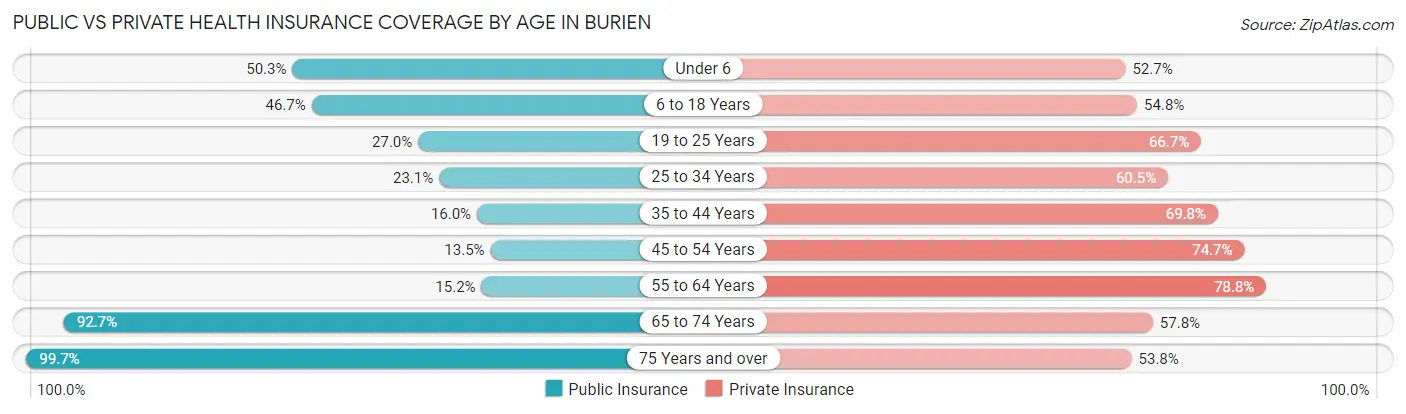
| Age Bracket | Public Insurance | Private Insurance |
| Under 6 | 1,694 (50.3%) | 1,773 (52.7%) |
| 6 to 18 Years | 3,669 (46.7%) | 4,303 (54.8%) |
| 19 to 25 Years | 1,023 (27.0%) | 2,530 (66.7%) |
| 25 to 34 Years | 1,524 (23.1%) | 3,999 (60.5%) |
| 35 to 44 Years | 1,349 (16.0%) | 5,870 (69.8%) |
| 45 to 54 Years | 935 (13.5%) | 5,159 (74.7%) |
| 55 to 64 Years | 1,004 (15.2%) | 5,201 (78.8%) |
| 65 to 74 Years | 4,422 (92.7%) | 2,754 (57.8%) |
| 75 Years and over | 2,922 (99.7%) | 1,577 (53.8%) |
| Total | 18,542 (36.2%) | 33,166 (64.7%) |
Disability Status by Sex by Age in Burien
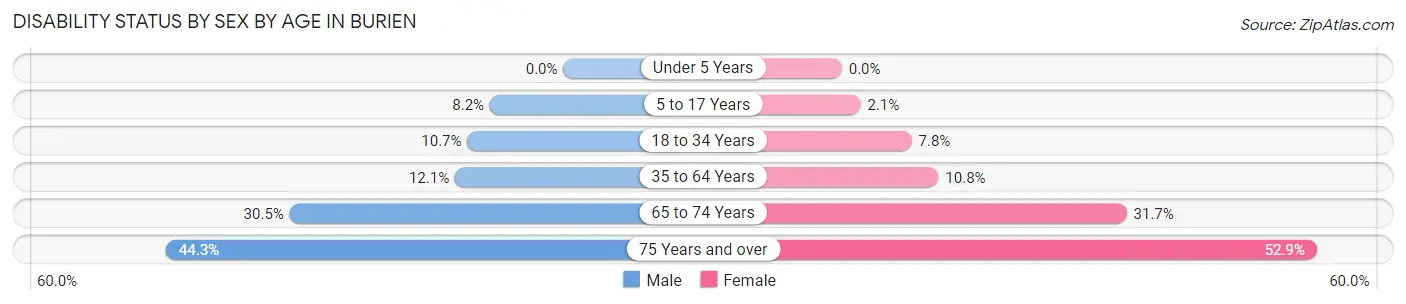
| Age Bracket | Male | Female |
| Under 5 Years | 0 (0.0%) | 0 (0.0%) |
| 5 to 17 Years | 339 (8.2%) | 75 (2.1%) |
| 18 to 34 Years | 663 (10.7%) | 369 (7.8%) |
| 35 to 64 Years | 1,368 (12.1%) | 1,139 (10.8%) |
| 65 to 74 Years | 705 (30.5%) | 779 (31.7%) |
| 75 Years and over | 532 (44.3%) | 915 (52.9%) |
Disability Class by Sex by Age in Burien
Disability Class: Hearing Difficulty
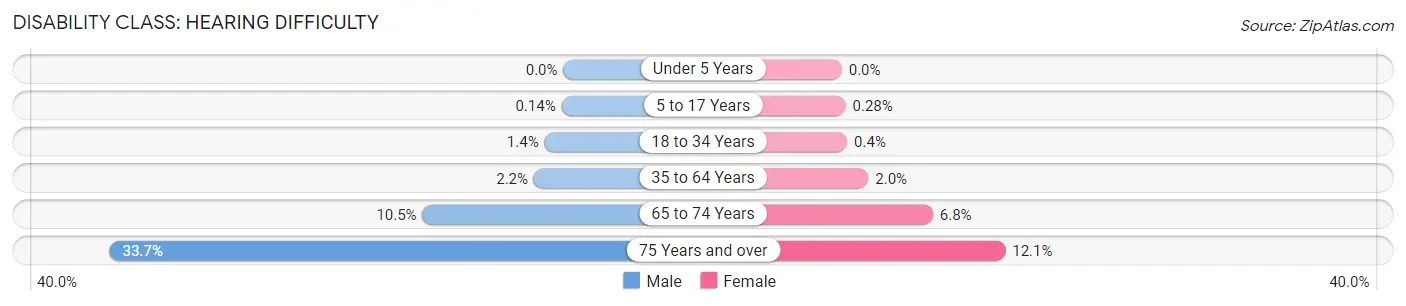
| Age Bracket | Male | Female |
| Under 5 Years | 0 (0.0%) | 0 (0.0%) |
| 5 to 17 Years | 6 (0.1%) | 10 (0.3%) |
| 18 to 34 Years | 87 (1.4%) | 19 (0.4%) |
| 35 to 64 Years | 248 (2.2%) | 209 (2.0%) |
| 65 to 74 Years | 242 (10.5%) | 166 (6.8%) |
| 75 Years and over | 405 (33.7%) | 210 (12.1%) |
Disability Class: Vision Difficulty
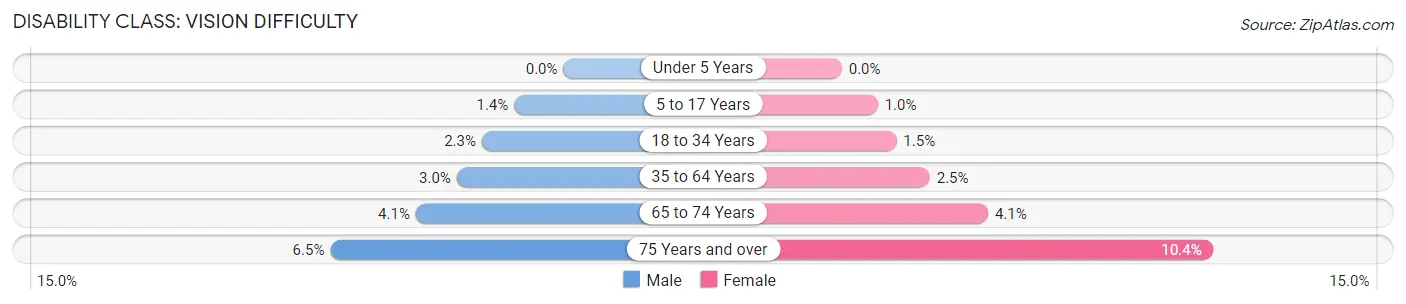
| Age Bracket | Male | Female |
| Under 5 Years | 0 (0.0%) | 0 (0.0%) |
| 5 to 17 Years | 57 (1.4%) | 36 (1.0%) |
| 18 to 34 Years | 141 (2.3%) | 72 (1.5%) |
| 35 to 64 Years | 337 (3.0%) | 259 (2.5%) |
| 65 to 74 Years | 95 (4.1%) | 100 (4.1%) |
| 75 Years and over | 78 (6.5%) | 179 (10.3%) |
Disability Class: Cognitive Difficulty
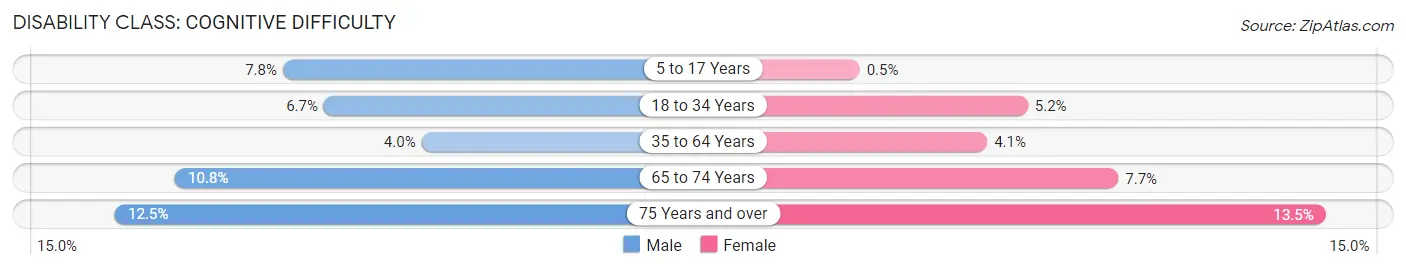
| Age Bracket | Male | Female |
| 5 to 17 Years | 324 (7.8%) | 18 (0.5%) |
| 18 to 34 Years | 414 (6.7%) | 246 (5.2%) |
| 35 to 64 Years | 448 (4.0%) | 429 (4.1%) |
| 65 to 74 Years | 250 (10.8%) | 189 (7.7%) |
| 75 Years and over | 150 (12.5%) | 233 (13.5%) |
Disability Class: Ambulatory Difficulty
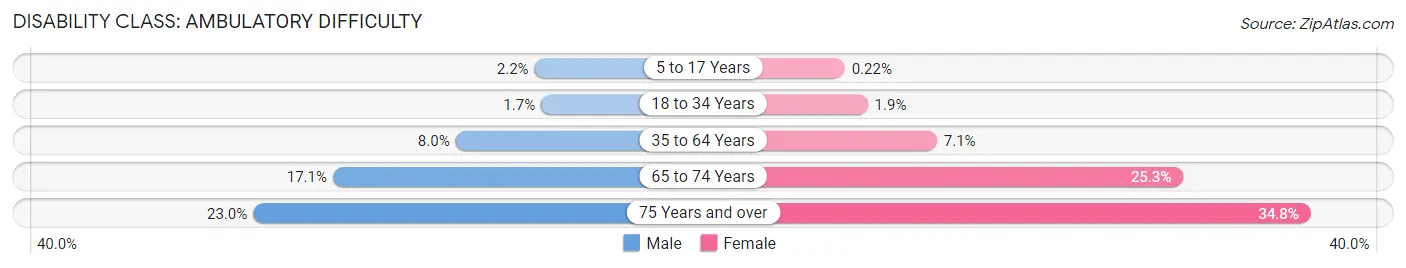
| Age Bracket | Male | Female |
| 5 to 17 Years | 89 (2.1%) | 8 (0.2%) |
| 18 to 34 Years | 103 (1.7%) | 91 (1.9%) |
| 35 to 64 Years | 908 (8.0%) | 747 (7.1%) |
| 65 to 74 Years | 396 (17.1%) | 622 (25.3%) |
| 75 Years and over | 277 (23.0%) | 602 (34.8%) |
Disability Class: Self-Care Difficulty
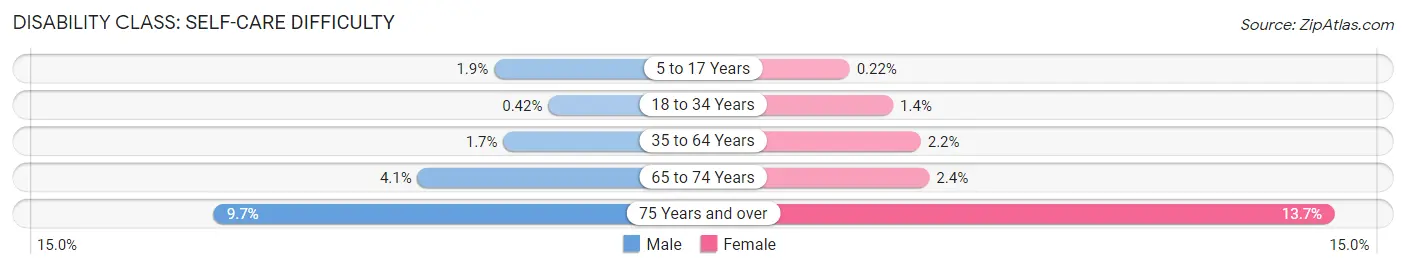
| Age Bracket | Male | Female |
| 5 to 17 Years | 80 (1.9%) | 8 (0.2%) |
| 18 to 34 Years | 26 (0.4%) | 68 (1.4%) |
| 35 to 64 Years | 189 (1.7%) | 233 (2.2%) |
| 65 to 74 Years | 94 (4.1%) | 60 (2.4%) |
| 75 Years and over | 117 (9.7%) | 237 (13.7%) |
Technology Access in Burien
Computing Device Access in Burien
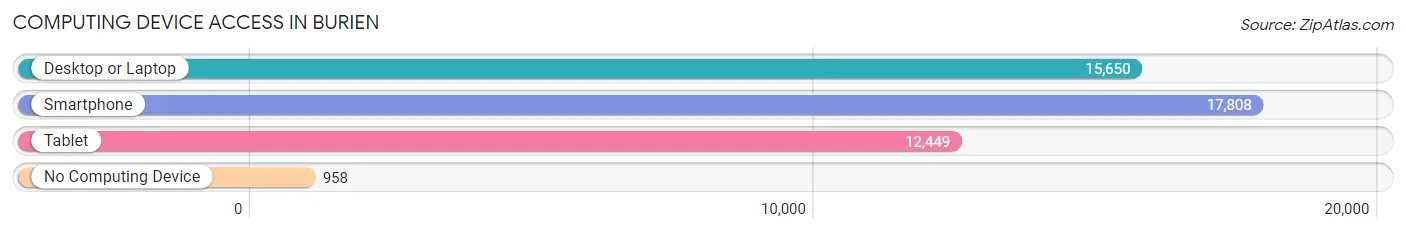
| Device Type | # Households | % Households |
| Desktop or Laptop | 15,650 | 78.6% |
| Smartphone | 17,808 | 89.5% |
| Tablet | 12,449 | 62.5% |
| No Computing Device | 958 | 4.8% |
| Total | 19,903 | 100.0% |
Internet Access in Burien
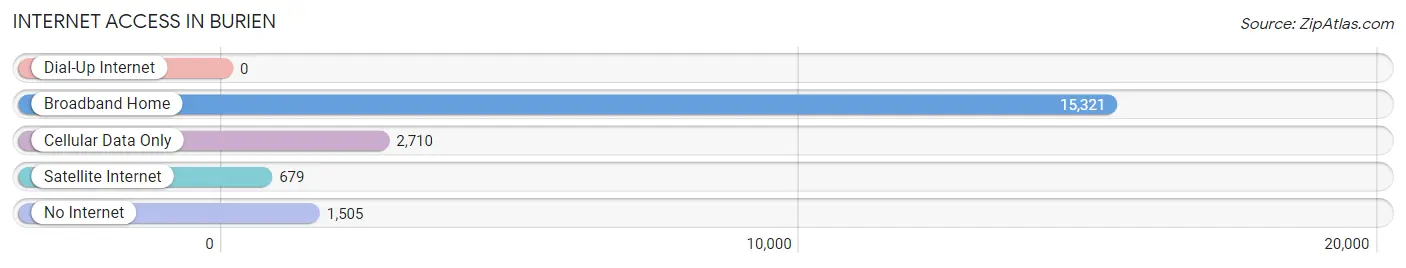
| Internet Type | # Households | % Households |
| Dial-Up Internet | 0 | 0.0% |
| Broadband Home | 15,321 | 77.0% |
| Cellular Data Only | 2,710 | 13.6% |
| Satellite Internet | 679 | 3.4% |
| No Internet | 1,505 | 7.6% |
| Total | 19,903 | 100.0% |
Burien Summary
Burien, Washington is a city located in King County, Washington, United States. It is located just south of Seattle and is part of the Seattle metropolitan area. The population was 48,074 at the 2010 census.
History
Burien was first settled in 1876 by William and Mary Jane Watson, who homesteaded 160 acres of land near the Duwamish River. The area was originally known as Sunnydale, but was later renamed Burien, after the nearby Burien Hotel. The hotel was built in 1891 by John Burien, who had emigrated from Norway in 1883.
The area was primarily agricultural until the 1950s, when it began to experience rapid growth due to the influx of people moving to the Seattle area. The city was officially incorporated in 1993.
Geography
Burien is located at 47°30′N 122°20′W (47.50, -122.33). According to the United States Census Bureau, the city has a total area of 10.6 square miles (27.5 km2), of which, 10.5 square miles (27.2 km2) is land and 0.1 square miles (0.3 km2) is water.
The city is bordered by the cities of Seattle to the north, Normandy Park to the south, SeaTac to the east, and Des Moines to the west. It is located on the shores of Puget Sound, with views of the Olympic Mountains to the west and the Cascade Mountains to the east.
Economy
Burien is home to a variety of businesses, including retail stores, restaurants, and professional services. The city is also home to several major employers, including Boeing, Amazon, and Starbucks.
The city is also home to several major shopping centers, including the Burien Town Square, the Burien Plaza, and the Burien Landing.
Demographics
As of the 2010 census, there were 48,074 people, 19,845 households, and 11,945 families residing in the city. The population density was 4,567.2 people per square mile (1,764.2/km2). There were 21,093 housing units at an average density of 2,001.2 per square mile (772.2/km2). The racial makeup of the city was 68.2% White, 8.3% African American, 0.7% Native American, 13.2% Asian, 0.7% Pacific Islander, 4.7% from other races, and 4.1% from two or more races. Hispanic or Latino of any race were 11.2% of the population.
There were 19,845 households, out of which 28.2% had children under the age of 18 living with them, 41.2% were married couples living together, 12.7% had a female householder with no husband present, and 41.2% were non-families. 32.2% of all households were made up of individuals, and 8.2% had someone living alone who was 65 years of age or older. The average household size was 2.39 and the average family size was 3.04.
In the city, the population was spread out, with 22.7% under the age of 18, 10.2% from 18 to 24, 33.2% from 25 to 44, 22.7% from 45 to 64, and 11.2% who were 65 years of age or older. The median age was 34 years. For every 100 females, there were 95.2 males. For every 100 females age 18 and over, there were 92.7 males.
The median income for a household in the city was $50,945, and the median income for a family was $60,945. Males had a median income of $41,945 versus $35,945 for females. The per capita income for the city was $25,945. About 6.7% of families and 9.2% of the population were below the poverty line, including 11.2% of those under age 18 and 8.2% of those age 65 or over.
Common Questions
What is the Total Population of Burien?
Total Population of Burien is 51,505.
What is the Total Male Population of Burien?
Total Male Population of Burien is 26,601.
What is the Total Female Population of Burien?
Total Female Population of Burien is 24,904.
What is the Ratio of Males per 100 Females in Burien?
There are 106.81 Males per 100 Females in Burien.
What is the Ratio of Females per 100 Males in Burien?
There are 93.62 Females per 100 Males in Burien.
What is the Median Population Age in Burien?
Median Population Age in Burien is 39.5 Years.
What is the Average Family Size in Burien
Average Family Size in Burien is 3.2 People.
What is the Average Household Size in Burien
Average Household Size in Burien is 2.6 People.
What is Per Capita Income in Burien?
Per Capita income in Burien is $46,834.
What is the Median Family Income in Burien?
Median Family Income in Burien is $99,734.
What is the Median Household income in Burien?
Median Household Income in Burien is $84,583.
What is Income or Wage Gap in Burien?
Income or Wage Gap in Burien is 19.0%.
Women in Burien earn 81.0 cents for every dollar earned by a man.
What is Family Income Deficit in Burien?
Family Income Deficit in Burien is $10,962.
Families that are below poverty line in Burien earn $10,962 less on average than the poverty threshold level.
What is Inequality or Gini Index in Burien?
Inequality or Gini Index in Burien is 0.46.
How Large is the Labor Force in Burien?
There are 28,666 People in the Labor Forcein in Burien.
What is the Percentage of People in the Labor Force in Burien?
67.9% of People are in the Labor Force in Burien.
What is the Unemployment Rate in Burien?
Unemployment Rate in Burien is 4.8%.